Intrusion of Kuroshio Helps to Diminish Coastal Hypoxia in the Coast of Northern South China Sea
 Hon-Kit Lui1*
  Chen-Tung Arthur Chen1,2*
  Wei-Ping Hou3 Jian-Ming Liau4
  Wen-Chen Chou5,6
  You-Lin Wang7 Chau-Ron Wu7 Jay Lee1,3 Yi-Chia Hsin8 Yan-Yu Choi9
- 1Department of Oceanography, National Sun Yat-sen University, Kaohsiung, Taiwan
- 2Institute of Marine Environment and Chemistry, Zhejiang University, Zhoushan, China
- 3Taiwan Ocean Research Institute, National Applied Research Laboratories, Kaohsiung, Taiwan
- 4National Academy of Marine Research, Kaohsiung, Taiwan
- 5Institute of Marine Environmental and Ecology, National Taiwan Ocean University, Keelung, Taiwan
- 6 Center of Excellence for the Oceans, National Taiwan Ocean University, Keelung, Taiwan
- 7Department of Earth Sciences, National Taiwan Normal University, Taipei, Taiwan
- 8Research Center for Environmental Changes, Academia Sinica, Taipei, Taiwan
- 9Department of Mathematics, The University of Hong Kong, Pokfulam, Hong Kong
Since half a century ago, the number and area of dead zones (dissolved oxygen (DO) < 2 mg L–1 or 30% saturation) in the coastal oceans has increased dramatically. As widely recognized, the increased terrestrial nutrient and organic matter inputs are the two main factors causing the eutrophication of many coastal oceans. Here we show with decadal observed time series data from stations off the Pearl River Estuary and in the northern South China Sea (nSCS) that a strong intrusion into the nSCS of the West Philippine Sea (WPS) seawater in the form of Kuroshio branch occurred during the warm phase of the Pacific Decadal Oscillation (PDO) around 2003–2004 and 2015–2016 (also a strong El Niño event). Consequently, the DO concentration increased but NO3– and PO43– concentrations decreased in the subsurface layers of the nSCS. The WPS seawater was observed to reach the hypoxic area off the Pearl River Estuary in 2003–2004. Likely, due to the oxygen supply carried by the Kuroshio, little hypoxia developed. Yet, anoxic condition developed in the cold phase of PDO or strong La Niña years with weak Kuroshio intrusions.
Introduction
Coastal oceans are important habitats and spawning grounds for many marine organisms, which need dissolved oxygen (DO) to live. However, the number and size of hypoxic regions (DO < 2 mg L–1), the so-called dead zone, has risen significantly in recent decades, adversely impacting the sustainability of the coastal ecosystems (Diaz and Rosenberg, 2008; Howarth et al., 2011; Rabalais et al., 2014; Breitburg et al., 2018). Eutrophication due to the increasing terrestrial nutrient flux is one of the main factors that causes hypoxia, although hypoxia can also form naturally, for instance by the intrusion of upwelled low DO water into coastal oceans (Feely et al., 2008; Rabalais et al., 2010; Howarth et al., 2011; Breitburg et al., 2018). Dead zones mostly exist off river mouths. This is because the excess nutrients from riverine inputs enhance biological productivity in the surface ocean. Yet, dead phytoplankton sink to the bottom of the coastal zone, where they decompose and consume oxygen. The stratification of seawater in coastal oceans in summer reduces bottom water ventilation. The incoming, subsurface, offshore seawater thus becomes the dominant source of DO for the bottom water. If the oxygen consumption rate due to organic matter decomposition exceeds the supply rate due to the inflow of offshore seawater, then hypoxia or even anoxia may develop, leading to so-called dead zones. Global warming makes the situation worse by increasing stratification and reducing DO solubility in seawater (Schmidtko et al., 2017; Breitburg et al., 2018).
River delivered organic matter and the inorganic nutrients are two of the main factors causing hypoxia in many estuaries (Diaz and Rosenberg, 2008; Conley et al., 2009; Lui and Chen, 2012; Rabalais et al., 2014; Breitburg et al., 2018). In the East China Sea off the Changjiang Estuary for instance, the δ13C of the remineralized organic carbon in the hypoxic zone was −18.5 ± 1.0%, matching well with the δ13C of the in situ produced marine particulate organic carbon (−18.5 ± 0.3%), while the terrestrial source was about −24.4 ± 0.2% (Wang et al., 2016). Such a result indicates that the riverine nutrient-induced productivity, and not the river-delivered terrestrial organic matter, was the dominant oxygen consumer in the hypoxic zone off the Changjiang Estuary. Pearl River, also known as Zhujiang by its Chinses name, is the second largest in terms of outflow among the rivers in China and discharges directly into the northern South China Sea (nSCS). Largely due to the riverine inputs of both nutrients and organic matter, hypoxic conditions have appeared in and off the Pearl River estuary in summer (Cai et al., 2004; Lu et al., 2018; Qian et al., 2018). In the hypoxic area off the Pearl River Estuary, the δ13C of the remineralized organic carbon was −23.2 ± 1.1%, resulting from the combination of organic matter decomposition from mainly the marine source (produced locally, 65 ± 16%) and partly the terrestrial source (35 ± 16%) (Su et al., 2017). Such a result reveals that both river-delivered nutrients and terrestrial organic matter played important roles in consuming the DO of the bottom water of the hypoxic zone in the Pearl River Estuary.
Another fact is that, the nSCS is influenced frequently by the intrusion of the West Philippine Sea (WPS) seawater in the form of Kuroshio branch through the Luzon Strait (Figure 1). The WPS and South China Sea (SCS) seawaters have distinctive vertical salinity, DO, and nutrient distributions (Chen et al., 2001). The intruded Kuroshio exerts inter-annual influences on the biogeochemical cycles in the nSCS (Lui et al., 2018), and possibly the hypoxic condition in the coastal regions therein. A related incidence occurred in the almost enclosed Baltic Sea, where the strong inflow of the DO-rich North Sea seawater in 2014 turned the Baltic deep water from anoxic to oxic conditions (Mohrholz et al., 2015). Namely, in addition to eutrophication, the amount of offshore water intrusion could play a significant role in coastal hypoxia. Moreover, the intrusion patterns in some marginal seas follow that of natural climatic oscillations, such as Pacific Decadal Oscillation (PDO) or El Niño/Southern Oscillation (ENSO) (Wu et al., 2014, 2017; Chen et al., 2016). Generally speaking, the PDO and ENSO refer to periodic variations in the sea surface temperature (SST) of the Pacific Ocean north of 20°N and in tropical region, respectively (Mantua et al., 1997). The PDO index or Oceanic Nino Index (ONI) is commonly used to quantify the strength of the PDO or ENSO, respectively. A PDO warm (cold) phase, positive (negative) PDO index, corresponds with positive (negative) SST anomalies in the eastern North Pacific Ocean north 20°N (Mantua et al., 1997). An ENSO warm (cold) phase, positive (negative) ONI, corresponds with positive (negative) SST anomalies in the eastern tropical Pacific Ocean (Banholzer and Donner, 2014). An El Niño or La Niña event occurs when the 3-month-running-average SST anomalies in the Nino 3.4 region (about 5°S–5°N, 120–170°W) reaches 0.5 or −0.5°C, respectively, for at least five consecutive overlapping months (Banholzer and Donner, 2014). Therefore, an ENSO warm (cold) phase usually is known as El Niño (La Niña) event.
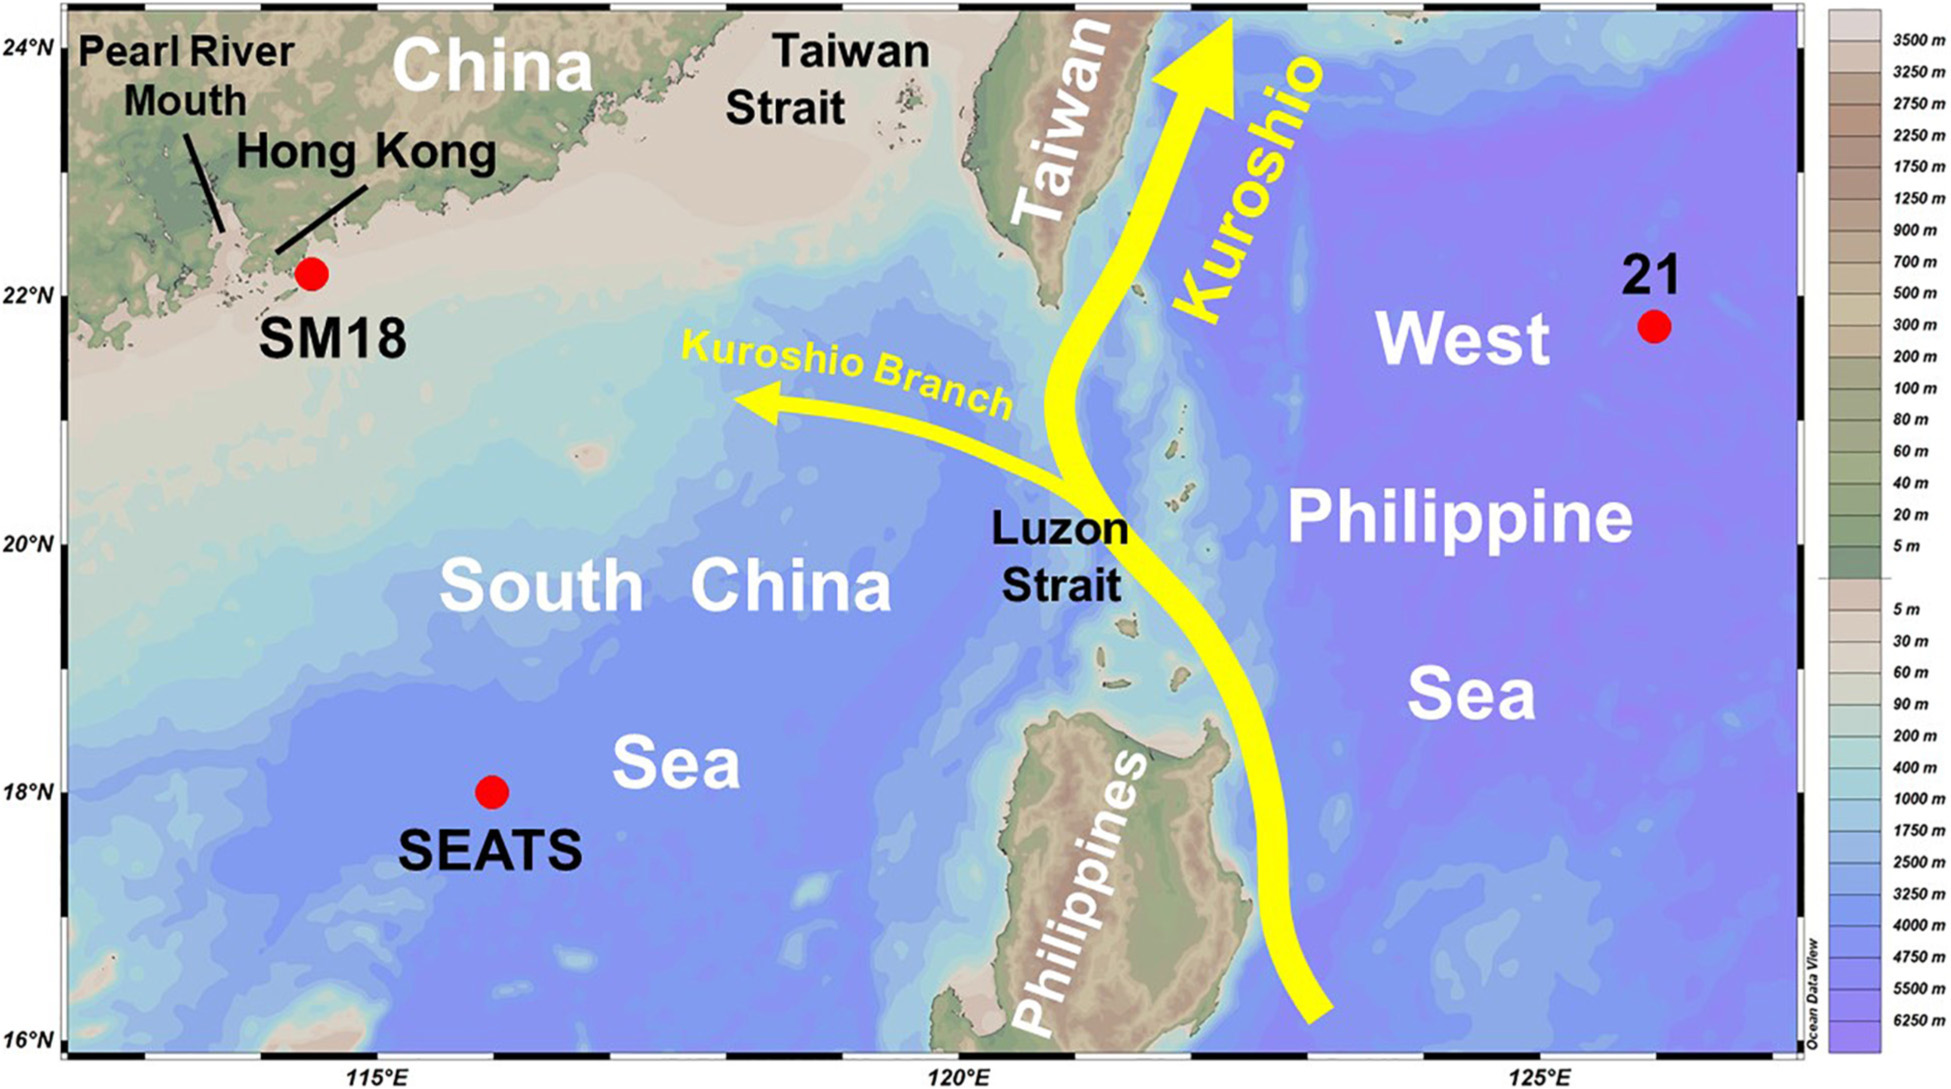
Figure 1. Study areas and basic hydrology. Red solid circles indicate the station locations. The yellow curves and arrows show the typical Kuroshio current, as well as its branch. The map was generated using Ocean Data View 5.0.0. Schlitzer, R., Ocean Data View, https://odv.awi.de, 2018.
To examine the influence of offshore water intrusion on coastal hypoxic condition, we start by looking at the lower Pearl River Estuary near Hong Kong. Located at the southeastern Pearl River Estuary in the nSCS, Hong Kong has a coastal area of 1,651 km2 which supports a variety of marine lives and ecosystems (Hong Kong Environmental Protection Department, 2015). Since 1986, the Hong Kong Environmental Protection Department (HKEPD) has a water quality monitoring program. The bottom water data of the station SM18 (22.15°N, 114.08°E, 21 m depth) used here are located off the southern coast of Hong Kong, where seawater is stratified well in summer (Lui and Chen, 2012). Meanwhile, we also look at the data from the South East Asia Time-Series Study (SEATS, 18°N, 116°E, with bottom depth > 3700 m) station located in the nSCS and from the station 21 located in the WPS (Figure 1). Generally speaking, SEATS was initially established as a part of the Joint Global Ocean Flux Study (JGOFS, 1987–2003), whereas station 21 was one of the stations of the World Ocean Circulation Experiment (WOCE, 1990–2002) Pacific Repeated Line 20 (PR20) across 21°45′ N from the southern tip of Taiwan eastward to about 130°E.
Materials and Methods
Data at SM18 were taken from the HKEPD. Samples were taken bimonthly between 1990 and 1998, and monthly after 1999. The surface and bottom water samples were taken from 1 m below the surface and 1 m above the seabed, respectively. The reporting limits are 0.1 for salinity, 0.1 mg/L for DO, 0.01 mg N/L (equivalent to 0.7 μM) for dissolved inorganic nitrogen (DIN = NO3 + NO2 + NH4), and 0.2 μg/L for chlorophyll-a concentrations (Hong Kong Environmental Protection Department, 2015). Detailed sampling methods and measurements were presented in the 2015 Annual Marine Water Quality Report, published by the HKEPD (Hong Kong Environmental Protection Department, 2015). One DO datum in 1992/12 was not considered in our analysis due to its abnormally low value of only 1% saturation. The Pearl River has three major tributaries which are the West River, North River, and the East River (Chen et al., 2008). The annual water discharge and sediment loading data, estimated by summing up the water discharges and sediment loadings at the Gaoyao gauging station on the West River, Shijiao gauging station on the North River, and the Boluo gauging station on the East River, were taken from the China River Sediment Bulletin 2002–2018 (Ministry of Water Resources of the People’s Republic of China, (2002–2018)).
At the SEATS station, data from 73 cruises were provided by the Ocean Data Bank of Taiwan (ODB)1. Sampling dates and the cruise information are listed in the website of the OBD. This study collected data from another seven cruises on 1997/11/18, 1999/4/10, 2013/9/14, 2014/5/25, 2018/7/7, 2019/8/18, and 2019/11/3. Data since 2013/9/14 can be applied through the Taiwan Ocean Research Institute, National Applied Research Laboratories. The salinity data used were measured by the conductivity, temperature, and pressure unit (the so-called CTD unit). Salinity of discrete seawaters were sampled and measured by the AUTOSAL salinometer which was calibrated according to the seawater standard produced by the International Association for the Physical Sciences of the Oceans with a precision of 0.003. The CTD-measured salinity agrees well with those from the salinometer (Figure 2) with an average difference (salinometer-measured salinity minus CTD-measured salinity) of just 0.012 ± 0.024 (n = 14), confirming the validity of the CTD-measured salinity. At station 21, and to our best information for most of the data at SEATS, DO was measured by spectrophotometry with a detection limit and precision of about 0.5 μM and 0.3%, respectively (Pai et al., 1993). Nitrate concentration was determined using the pink azo dye method by a flow injection analyzer with a detection limit and precision of about 0.01 μM and 1–3%, respectively (Strickland and Parsons, 1972). Phosphate was measured using the molybdenum blue method by a flow injection analyzer with a detection limit and precision of about 0.03 μM and 0.5%, respectively (Murphy and Riley, 1962; Pai et al., 1990). Further details including the precisions of the measurements can be found in Chen and Wang (2006).
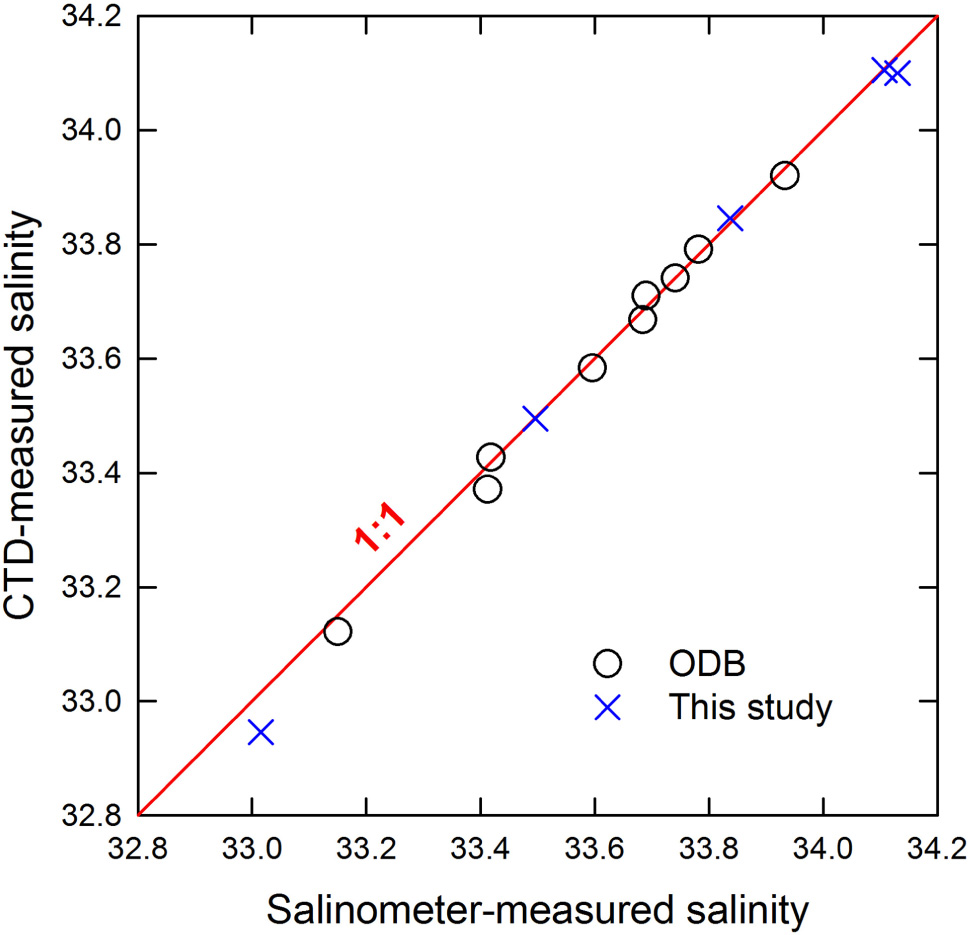
Figure 2. AUTOSAL salinometer-measured salinity vs. CTD-measured salinity plot at SEATS. The solid line in red shows the 1:1 ratio.
The Princeton Ocean Model2 was applied to model the water flux along 120.75°E in the Luzon Strait. The computational domain covered an area from 117° to 124.5°E and 18° to 26.5°N in latitude with a 0.02° horizontal resolution and 41 vertical layers. The initial values for salinity and temperature were based on the World Ocean Atlas 2013 climatology fields3. The sea surface conditions used, including 10 m wind field, sea level pressure, 2 m air temperature, 2 m specific humidity, longwave radiation flux, shortwave radiation flux, latent heat flux, and surface sensible heat flux and precipitation rate were driven by the 6-hourly sea surface flux of the National Centers for Environmental Prediction (NCEP)/National Center for Atmospheric Research reanalysis dataset (Kalnay et al., 1996) from 1980 to 2009, and the NCEP Global Data Assimilation System/Final dataset from 2010 to 2017. The simulation runs were spun up from 1980. The data assimilation was also implemented in this simulation starting from 1993 by using the Ssalto/Duacs sea level anomalies dataset (AVISO)4. The monthly mean of the Luzon Strait transport was integrated from the surface down to 300 m along 120.75°E from the model results. No observable difference was detected when integration was performed down to 500 m depth. The anomaly value was calculated as the monthly data minus the average.
PDO index was taken from the Joint Institute for the Study of the Atmosphere and Ocean5. The ONI data were taken from the Climate Prediction Center of the National Oceanic and Atmospheric Administration (NOAA). Twelve-month smoothing was applied to remove the seasonal signals of the PDO index and the ONI and used in this study. The average currents at 15 m depth from 1993 to 2019 were determined using two datasets, which were the Global Drifter Program (GDP) database of the NOAA6, and the reanalysis using the 1/12° global Hybrid Coordinate Ocean Model (HYCOM) and the Navy Coupled Ocean Data Assimilation (NCODA) scheme7. The 15 m depth was chosen due to the fact that the drogue of the drifter was centered at a depth of 15 m.
Results
Figure 3 shows the salinity and chlorophyll-a and DO concentration time series for both surface and bottom waters at SM18. The salinity and chlorophyll-a of the surface water and the DO of the surface and bottom waters had strong seasonal variations. In summer, the Pearl River discharge reaches SM18 and enhances productivity, resulting in low salinity but high concentrations of chlorophyll-a and DO of the surface water. Meanwhile, the bottom water with high salinity had low DO concentrations, reflecting the summer stratification and decomposition of organic matter settled from the surface water. To simplify, the lowest monthly DO concentrations of the bottom water in each year (DOmin) at SM18 were selected (indicated by the solid black line in Figures 3, 4A) and examined herein.
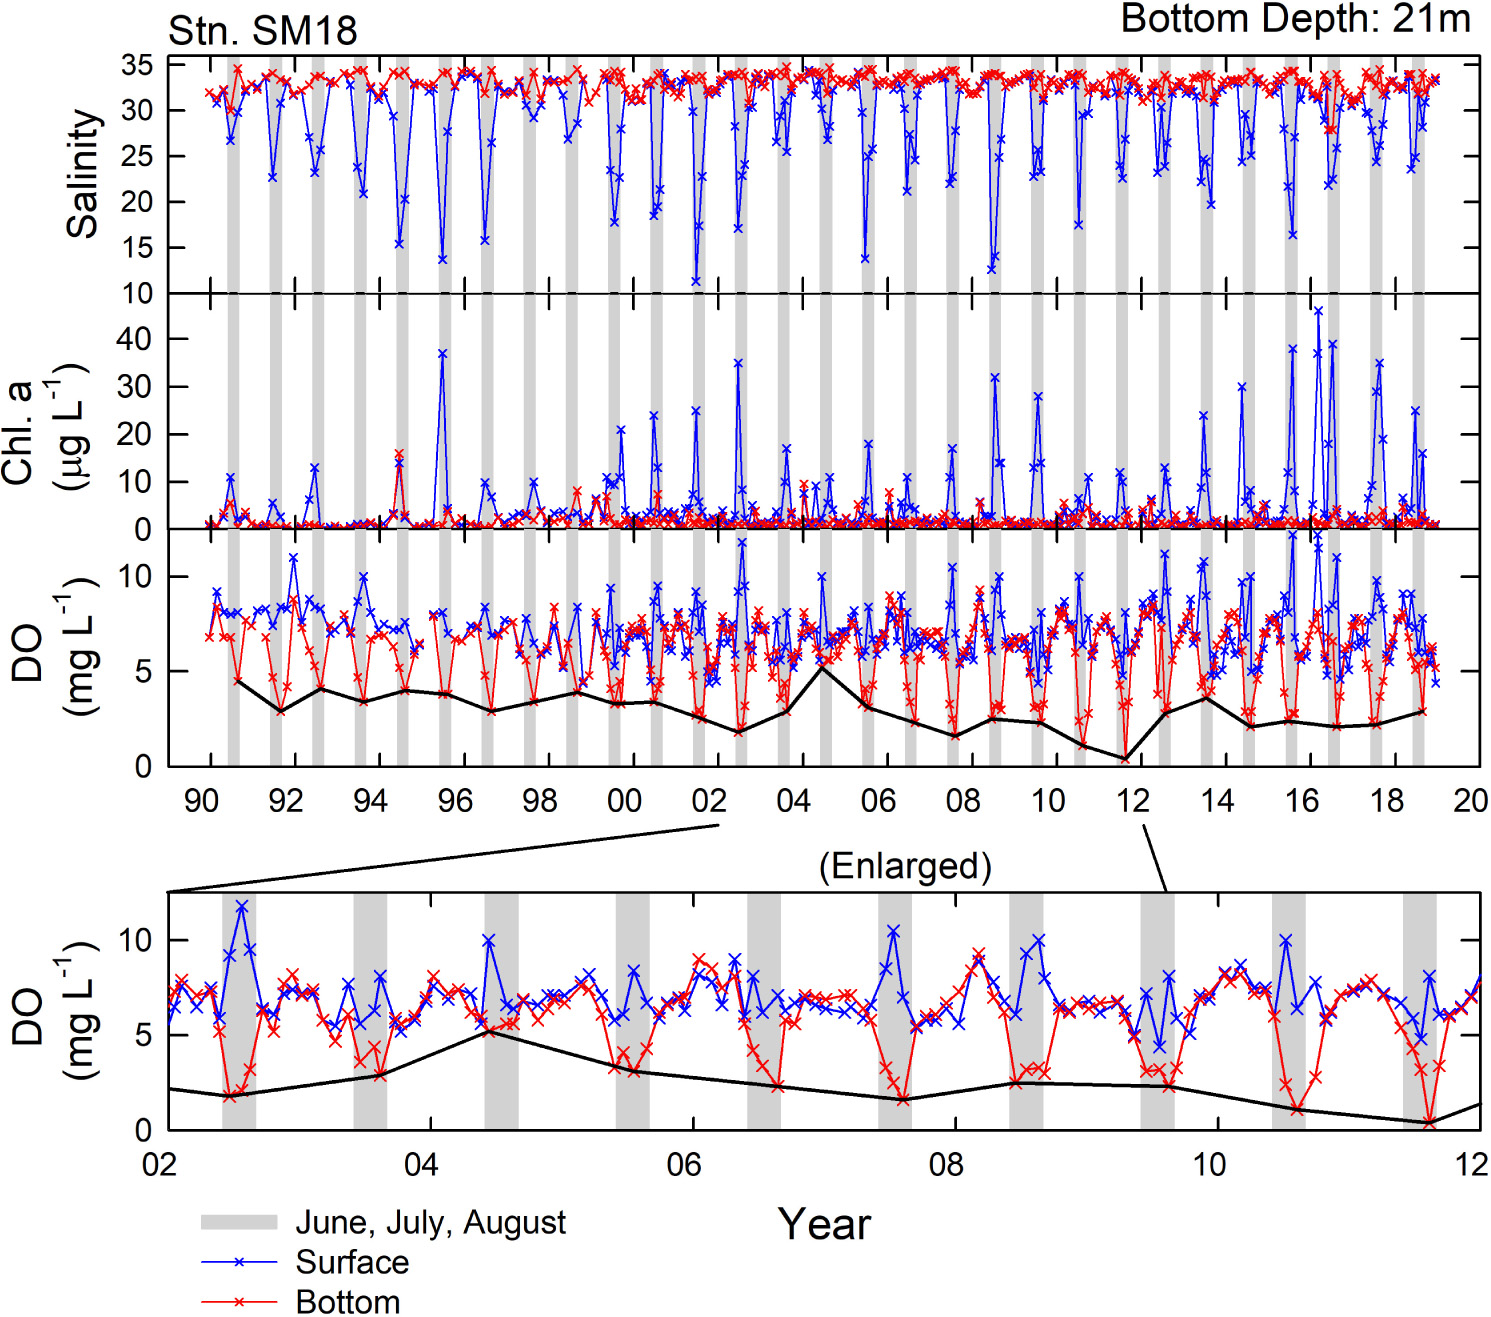
Figure 3. Time series of salinity and chlorophyll-a and DO concentrations in surface and bottom waters at SM18 between 1989 and 2018. The solid black line shows the DOmin. Gray bars indicate the periods of June to August.
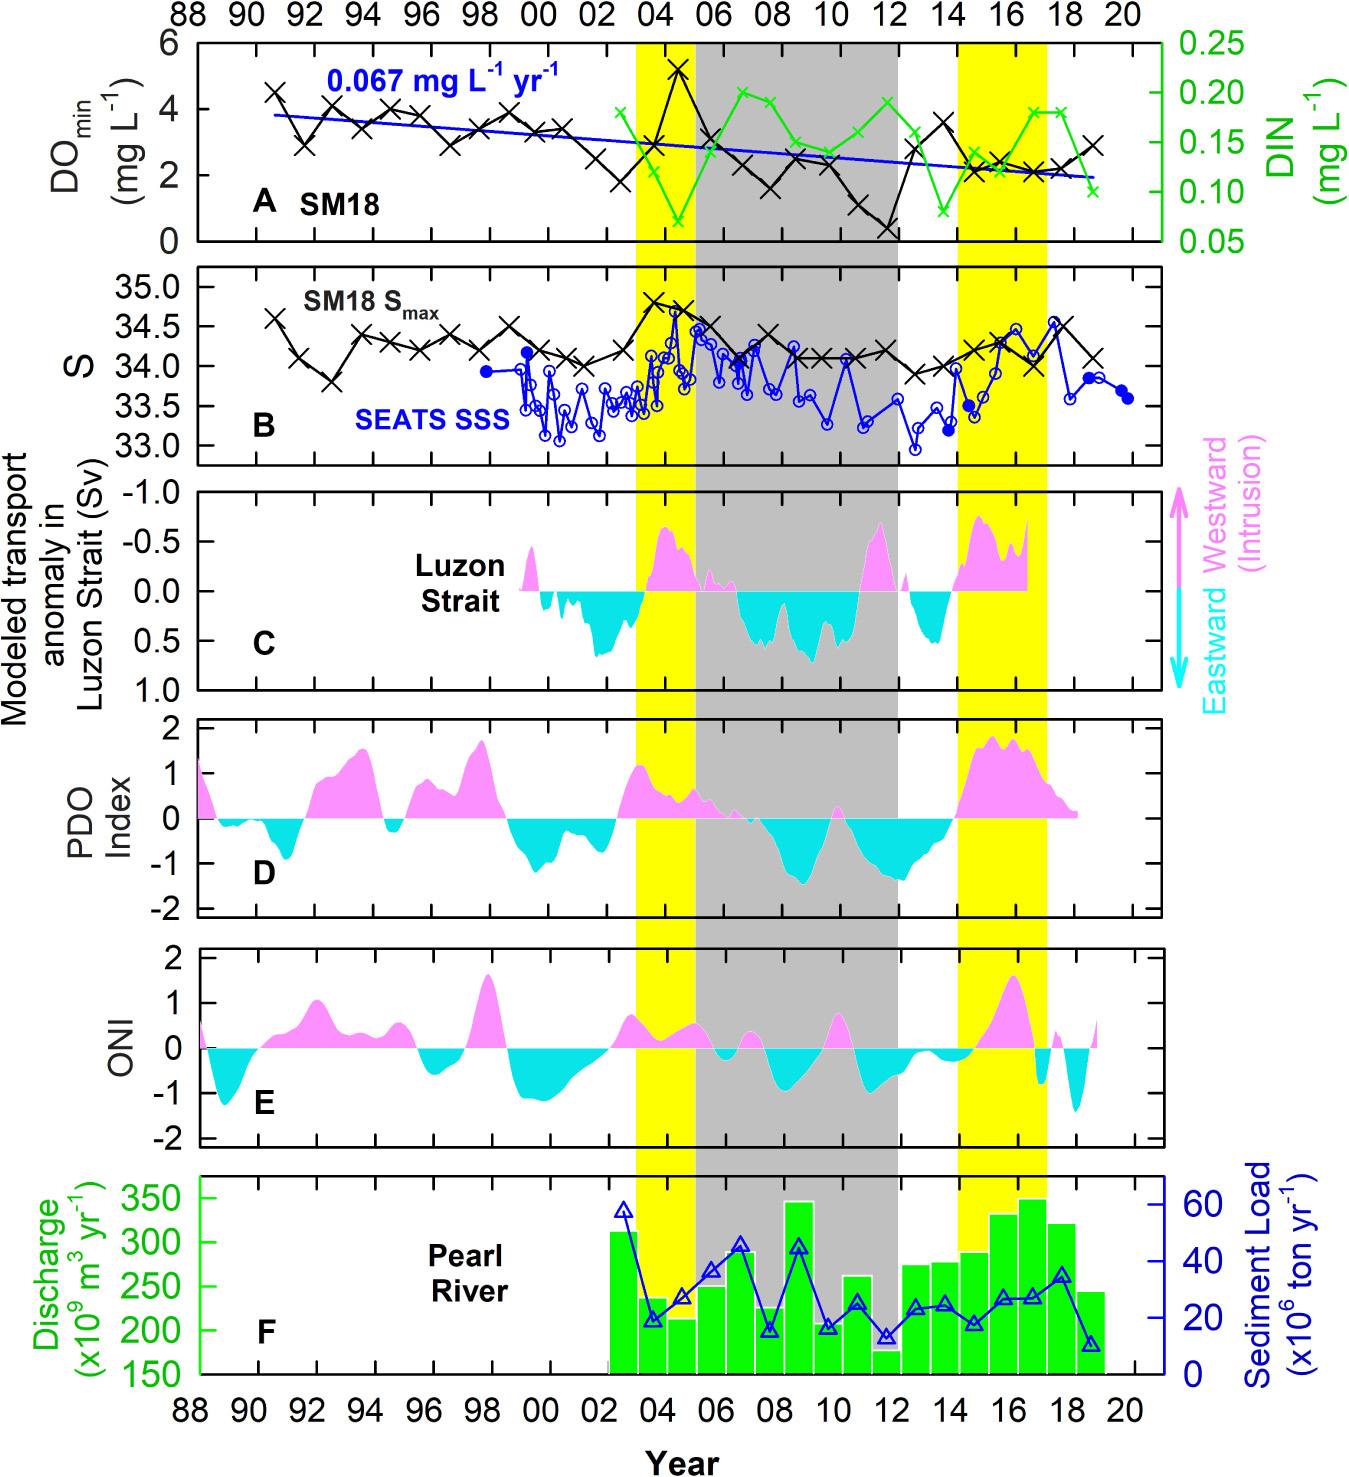
Figure 4. Time series of (A) bottom water DOmin (black cross) and DIN (green cross) at SM18, (B) bottom water Smax at SM18 (black cross) and SSS at SEATS (taken from ODB: blue open circles, from this study: blue solid circles), (C) anomaly of water flux (0–300 m) through the Luzon Strait (vertical red and blue bands refer to positive and negative values, respectively), (D,E) deseasoned PDO index and ONI (vertical red and blue bands refer to positive and negative values, respectively), and (F) the annual average water discharge (green bar) and sediment load (blue open triangle) of the Pearl River.
On the whole, the DOmin at SM18 all occurred in summer [18 years (62%) in August, 6 years (21%) in July, and 5 years (17%) in June] and had a rate of change of −0.067 ± 0.019 mg L–1 yr–1 (equivalent to about -1% of DO saturation yr–1) between 1990 and 2018 (Figure 4A). Notably, the hypoxic condition diminished between 2003 and 2004 (highlighted in yellow), reaching a maximum DOmin 5.2 mg L–1 in 2004. In addition, 2002 was an El Niño year (Santoso et al., 2017) and the ONI was positive between 2002 and 2004 (Figure 4E). The DOmin then fell rapidly to 1.6 mg L–1 in 2007 (a strong La Niña year), and reached the lowest of just 0.4 mg L–1 in 2011 which was a weak La Niña year. Worth mentioning, 2007 and 2010 were strong La Niña years, whereas 2005 and 2008 were weak La Niña years (Santoso et al., 2017).
Correspondingly, the DIN mirrored that of the DOmin, reflecting the rise in DIN but fall in DO due to the organic matter decomposition (Figure 4A). The linearity between DO and DIN had a slope −20.9 (by mass, unitless) (Figure 5). Such a value matched well the classic Redfield ratio −19.7, assuming that O2:DIN molar ratio is equal to −138:16 (Chen et al., 2017). Notably, unlike the other years when the DO concentration of the bottom water remained low for about 3–4 months in summer, the monthly DO concentrations of the bottom water in the summer months of 2004 all remained high (Figure 3), indicating that the highest DOmin 5.2 mg L–1 in 2004 was not a bias of measurement. The factor at play to keep the bottom DO high in the summer in 2004 is discussed as follows.
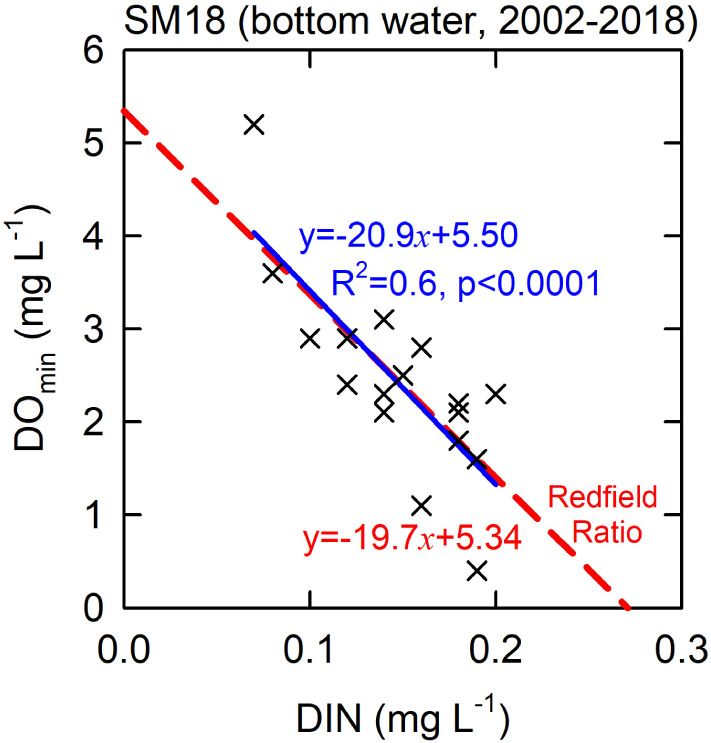
Figure 5. DOmin vs. DIN plot at SM18 with linear regression line and equation in blue. The dash line and equation in red show the classic Redfield DO vs. DIN correlation by passing the center of the regression line.
Discussion
Intrusion of Offshore Water Raises DO of Subsurface Water in nSCS and Its Coastal Region
In 2004, the Pearl River water discharge of 214×109 m3 yr–1 was just slightly lower than the average of 271 ± 51×109 m3 yr–1 between 2002 and 2018 (Figure 4F). The sediment loading of 27×106 ton yr–1 was the same as the average of 27 ± 13 × 106 ton yr–1 (Figure 4F), suggesting no significant difference in water discharge and sediment loading in 2014. Unexpectedly, the DOmin was the highest in SM18 in that year (Figure 4A). Notably, the Pearl River discharge (177×109 m3 yr–1) and sediment loading (13×106 ton yr–1) were the lowest in 2011 since as early as 2002 (Figure 4F). Reducing terrestrial inputs were expected to reduce the hypoxic condition. Yet, the DOmin reached its lowest level in that year, showing that besides the influence from the terrestrial inputs, other factors were also affecting the DO level of the bottom water.
Interestingly, at SM18, the highest monthly salinity of the bottom water in each year (Smax, referring to the condition that the bottom seawater is influenced the least by the Pearl River water) showed similar patterns of changes as that of DOmin between 2002 and 2011 (Figure 4B). Additionally, all Smax were found in summer, having 16 years in August (55%), 11 years in July (38%), and 2 years in June (7%). Changing atmospheric forcing could be a critical factor for changing the DO and salinity of the bottom water at SM18. For instance, increasing atmospheric forcing (e.g., typhoon events) could increase the DO of bottom water through enhanced vertical mixing. Changes in the distribution of the Pearl River plume could change the hypoxic condition at SM18 as well. Figure 6 plots the Smax and the corresponding salinity of the surface water, as well as the seawater temperature and density of the surface and bottom waters. Obviously, these parameters have distinguishable differences between the surface and bottom waters, suggesting good stratification of the water column. Implications are that the influence of enhanced atmospheric forcing on the bottom water DO at SM18 during the sampling period likely was either insignificant or not lasting.
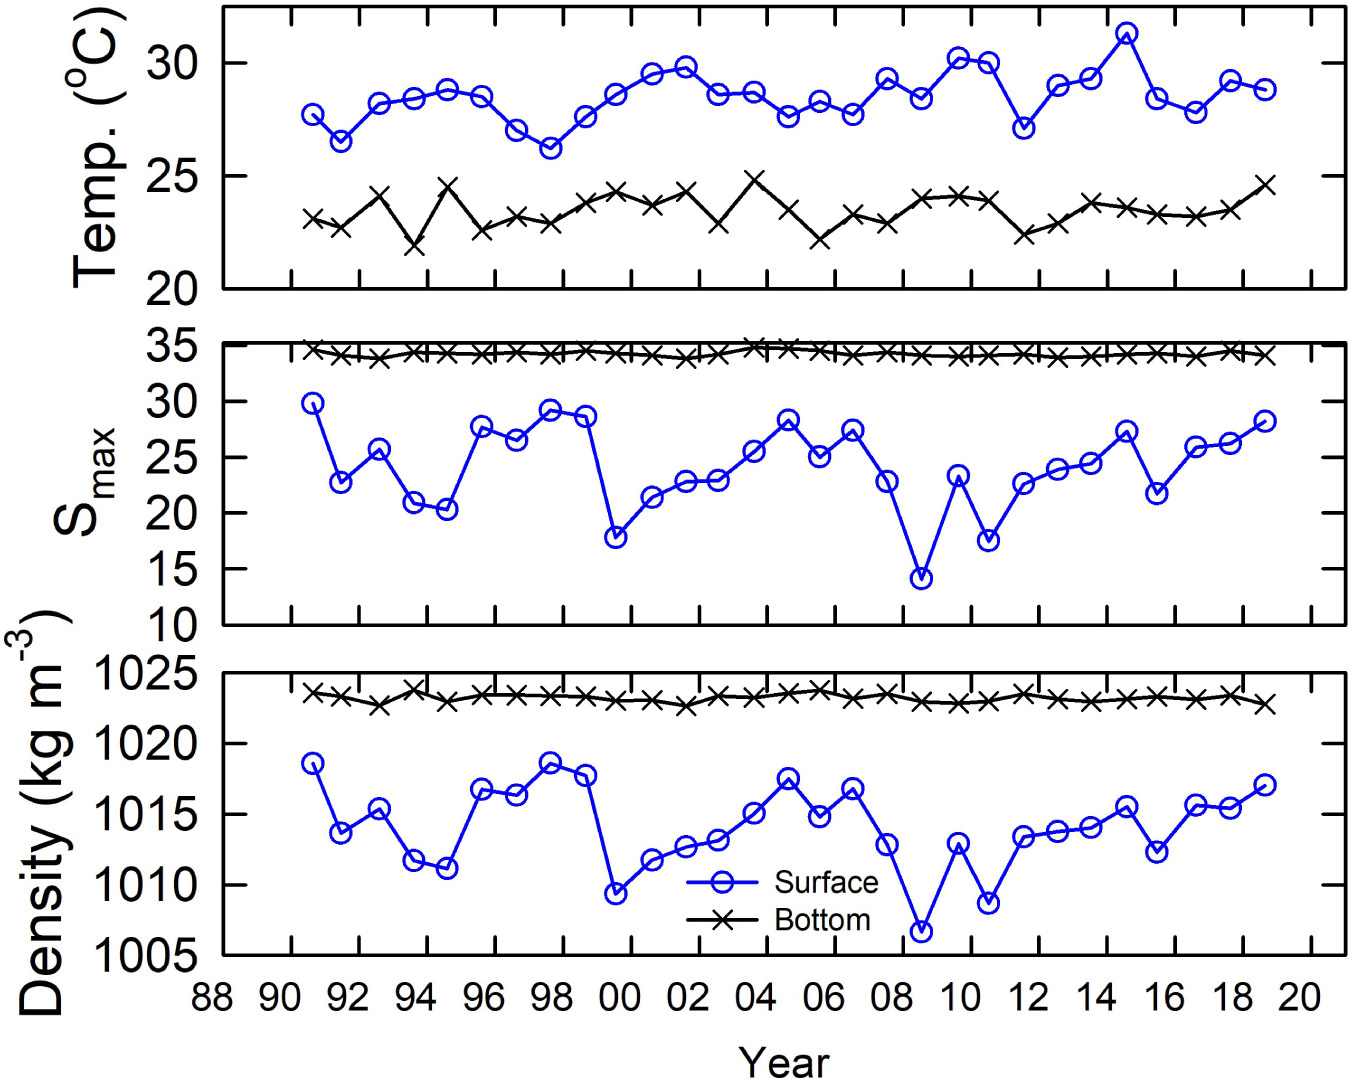
Figure 6. The corresponding temperature, salinity, and density of surface and bottom seawaters when the bottom water S reaches its highest value each year (Smax).
Notably, about 500 km away from the SM18, the measured surface seawater salinity (SSS) at the SEATS station had similar patterns of changes as well (Figure 4B), suggesting that the changes in Smax at SM18 and SSS at SEATS were due to large scale changes in seawater chemistry rather than local fluctuations. Having a minimum Smax of 34.0 in 2001/3 at SM18, the Smax increased to the highest of 34.8 in 2003/8 and to the second highest, 34.7, in 2004/8. The Smax then gradually decreased to the second lowest of 33.9 in 2012/7 (the lowest value was 33.8 in 1992/8). Similarly, at SEATS, the second lowest salinity of 33.05 was found in 2000/5. Afterward, the salinity increased rapidly to the highest of 34.69 in 2004/5, and then gradually decreased to the lowest of 32.95 in 2012/8. Such large changes in salinity at SM18 and at SEATS were unlikely due to evaporation or precipitation. Indeed, evaporation or precipitation may only contribute a several percentage to the interannual changes in salinity in the nSCS (Nan et al., 2016). In fact, the surface and subsurface WPS seawaters have salinities significantly higher than that of the SCS (Chen et al., 2016). Any intrusion of the WPS seawater would then increase the salinity in the SCS.
Offshore Seawater Intrusion Increases DO but Reduces Nutrients Inventories and Eutrophication
Using the GDP and 1/12° global reanalysis databases, the average surface currents (15 m depth) in winter and summer of our study area were determined (Figure 7). Our result agrees with previous studies that the northward-flowing Kuroshio intrudes into the SCS through the Luzon Strait mainly in winter (Nan et al., 2011, 2013, 2015; Wu and Hsin, 2012; Wu et al., 2017). Besides the main branch of the intrusion that centers along 20°N east of 115°E, two intrusion paths, indicated by the dashed blue lines in Figure 7, show that part of the Kuroshio intrusion could reach directly the coastal regions of the nSCS, such as the SM18 station. To examine whether the changes in salinity were due to the changes in the mixing proportion between the SCS and the WPS seawaters, we firstly modeled the amount of Kuroshio intrusion using the Princeton Ocean Model along 120.75°E in the Luzon Strait, which connects the nSCS and the WPS (Figure 4C). Our result showed that the 12-month smoothed model flux anomaly agreed with the observations (e.g., SSS at SEATS, and Smax and DOmin at SM18), suggesting that the fluctuation in DOmin at SM18 was due to enhanced and then diminished the amounts of intrusions of the WPS seawater into the SCS through the Luzon Strait in the form of the Kuroshio branch (Figure 4C).
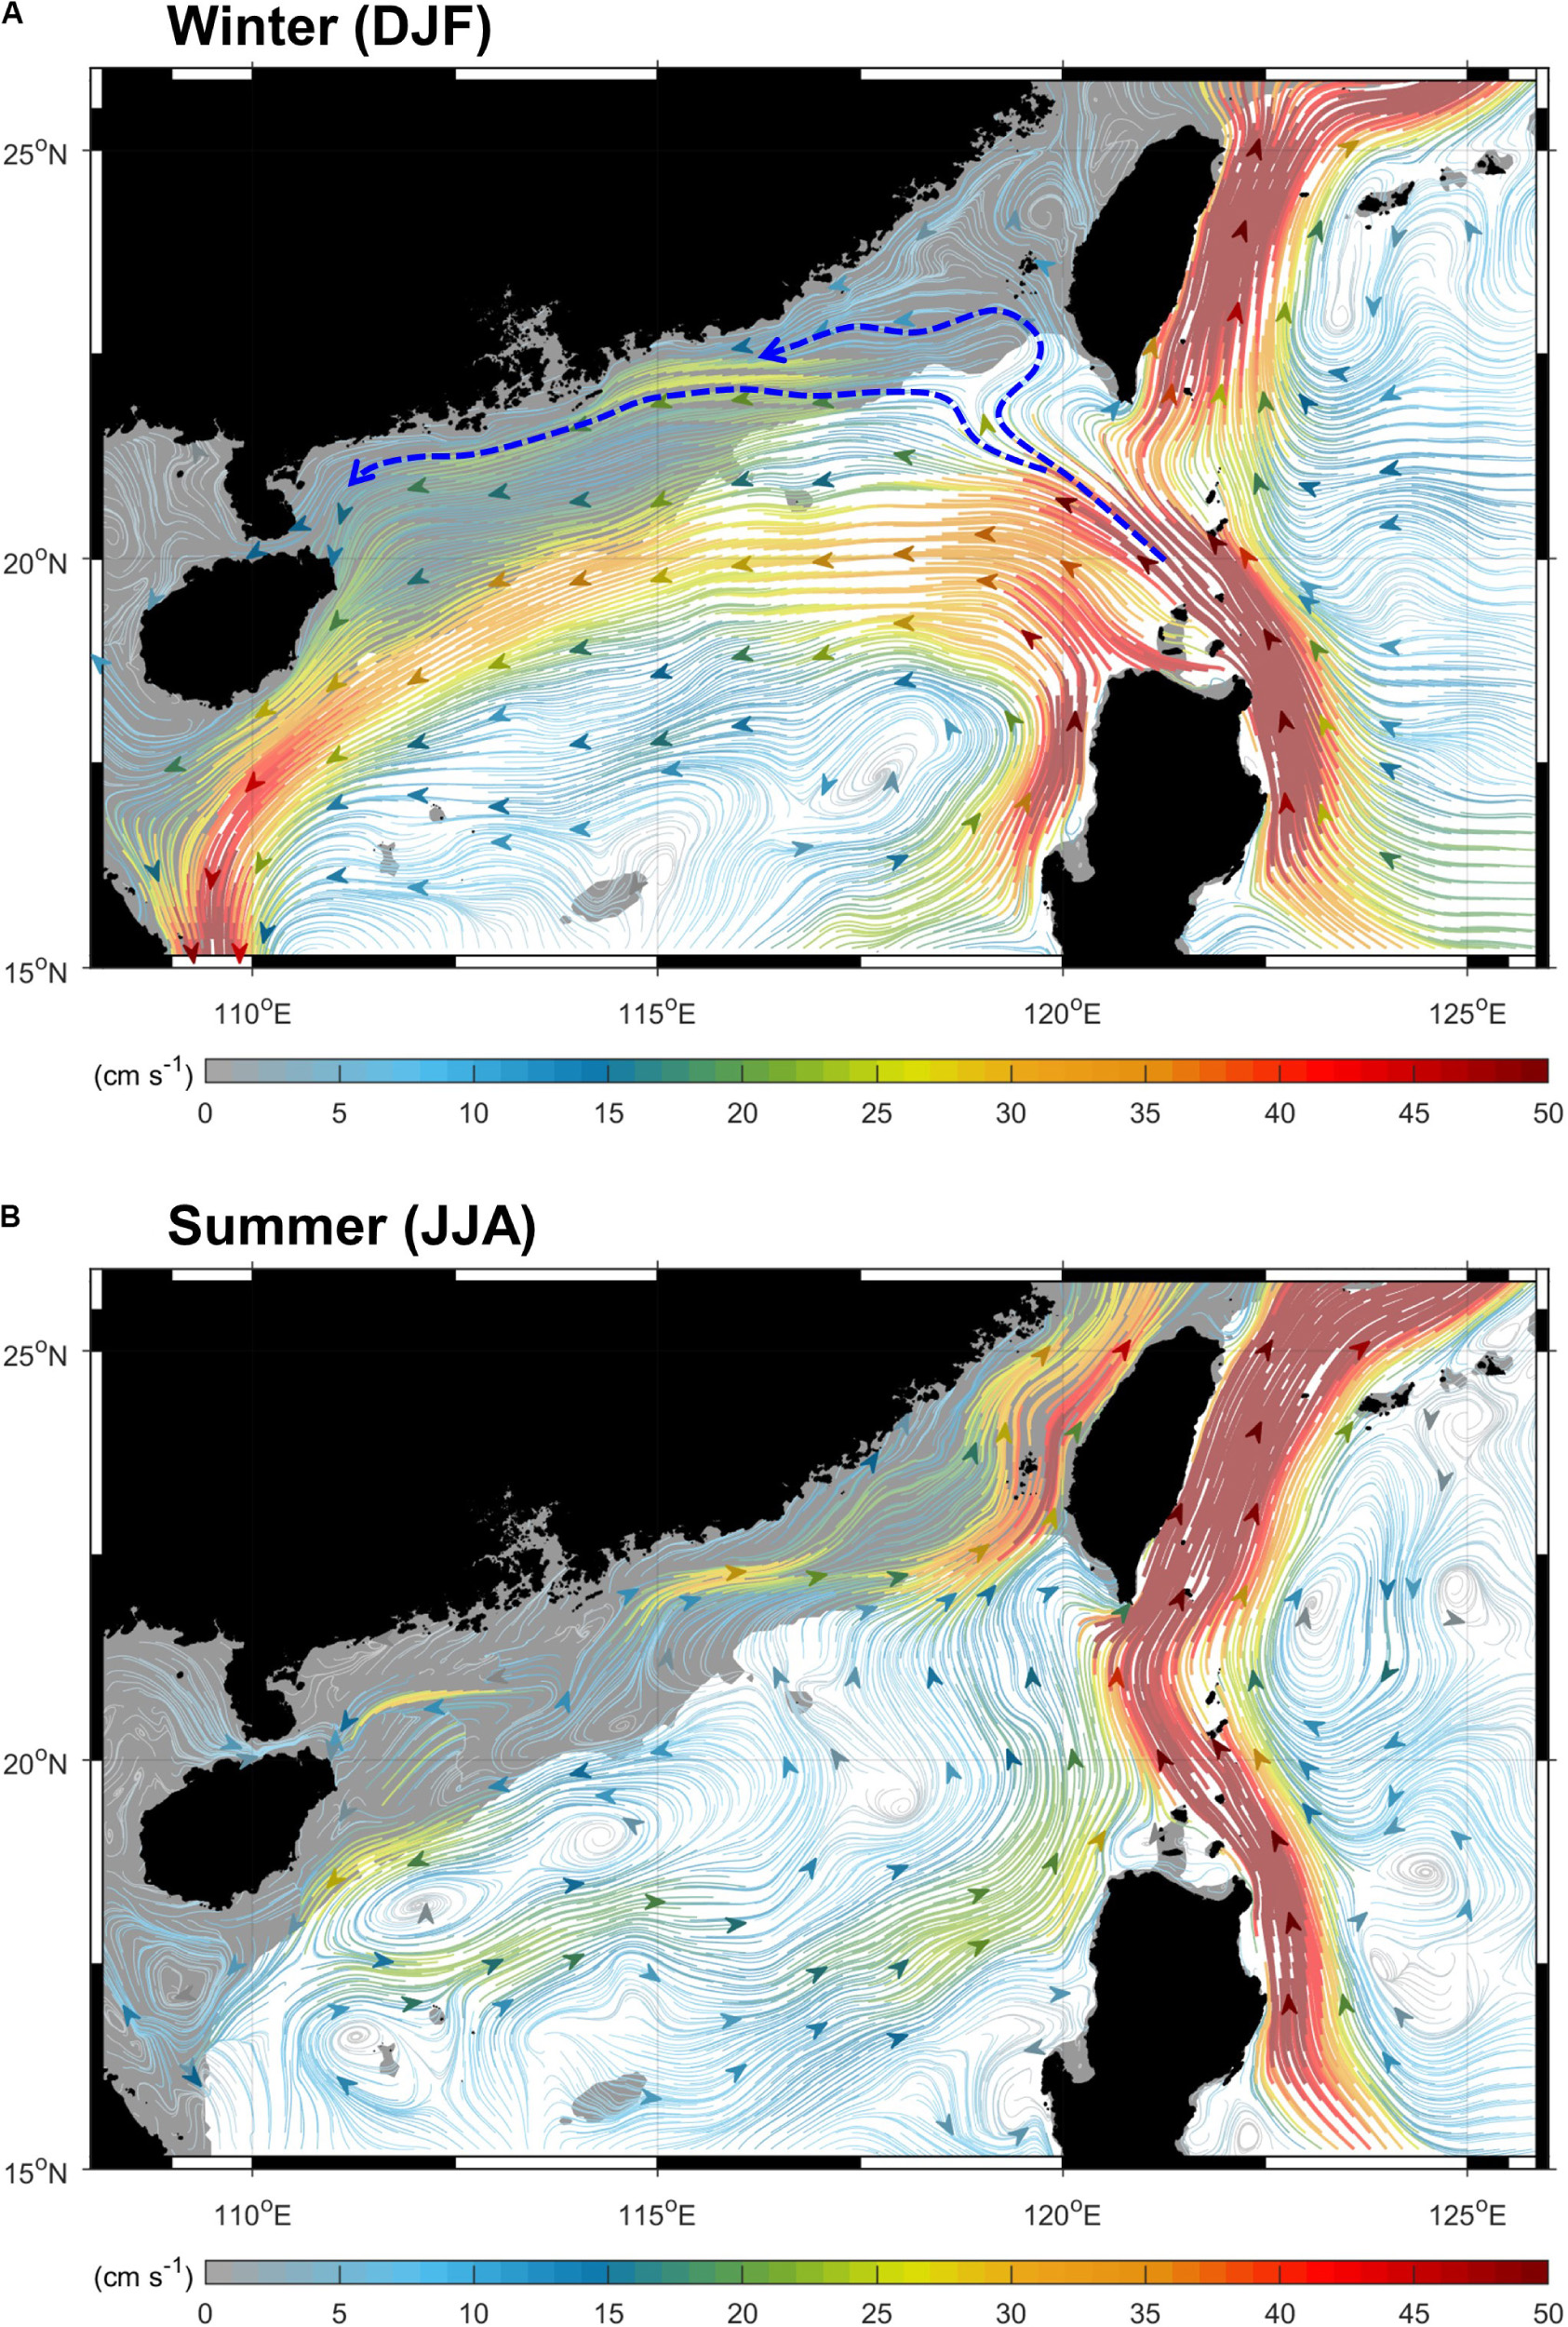
Figure 7. Mean surface currents (15 m depth) of (A) winter and (B) summer in the study area over 1993–2019, obtained from the GDP and 1/12° global reanalysis databases. The color shows the speed, and the shaded areas refer to the regions of continental shelves (depth < 200 m). Two dashed lines and arrows indicate two pathways that the intruded Kuroshio could directly reach the nSCS and SM18.
Integrating the water flux anomaly between 2013/5 and 2015/3 (enhanced westward intrusion indicated by the first yellow bar shown in Figure 4) gives an enhanced westward water flux of 22.3 × 10³ km3. The SCS has an area of about 3.5 × 10⁶ km2. Wong et al. (2015) estimated that the area and volume of the nSCS shelves are 514.4 × 10³ km2 and 16.15 × 10³ km3. We assume that the nSCS off the shelves influenced by the intruded Kuroshio has the same area as that of the shelves (in total about 30% of the total SCS area). Based on that, we estimate that the volume of the nSCS from the surface down to 200 m depth is about (16.15 × 10³ km3 + 514.4 × 10³ km2 × 0.2 km) = 119.03 × 10³ km3. The amount of the westward flux between 2013/5 and 2015/3 is considerable, at about 19% of the volume of the nSCS. But, the intruded Kuroshio is not distributed evenly in the nSCS, as shown in Figure 7. The regions close to the main streams of the intruded Kuroshio, such as at SEATS or at SM18, must have higher proportions of the intruded Kuroshio. Indeed, the potential temperature (θ) vs. salinity plot provides information on such proportions.
We differentiated the WPS and SCS seawaters using θ and salinity, as the WPS and SCS seawaters have distinctive θ and salinity distributions from the surface to the bottom (Chen et al., 2016; Lui et al., 2018). Generally speaking, the surface and subsurface waters of the WPS are notably saltier than that of the SCS. The measured θ and salinity at the SEATS site clearly indicated a gradual increase in the WPS proportion above about 200 m (θ at ∼17°C) between 2003 and 2004, suggesting enhanced amounts of intrusions of the WPS water to the SCS (Figure 8A). At SM18, the Smax and its corresponding temperature showed the same result, where a gradual increase in DOmin corresponded to a gradual increase in the WPS seawater proportions in 2003–2004, and vice versa in 2005–2011 (Figure 8B).
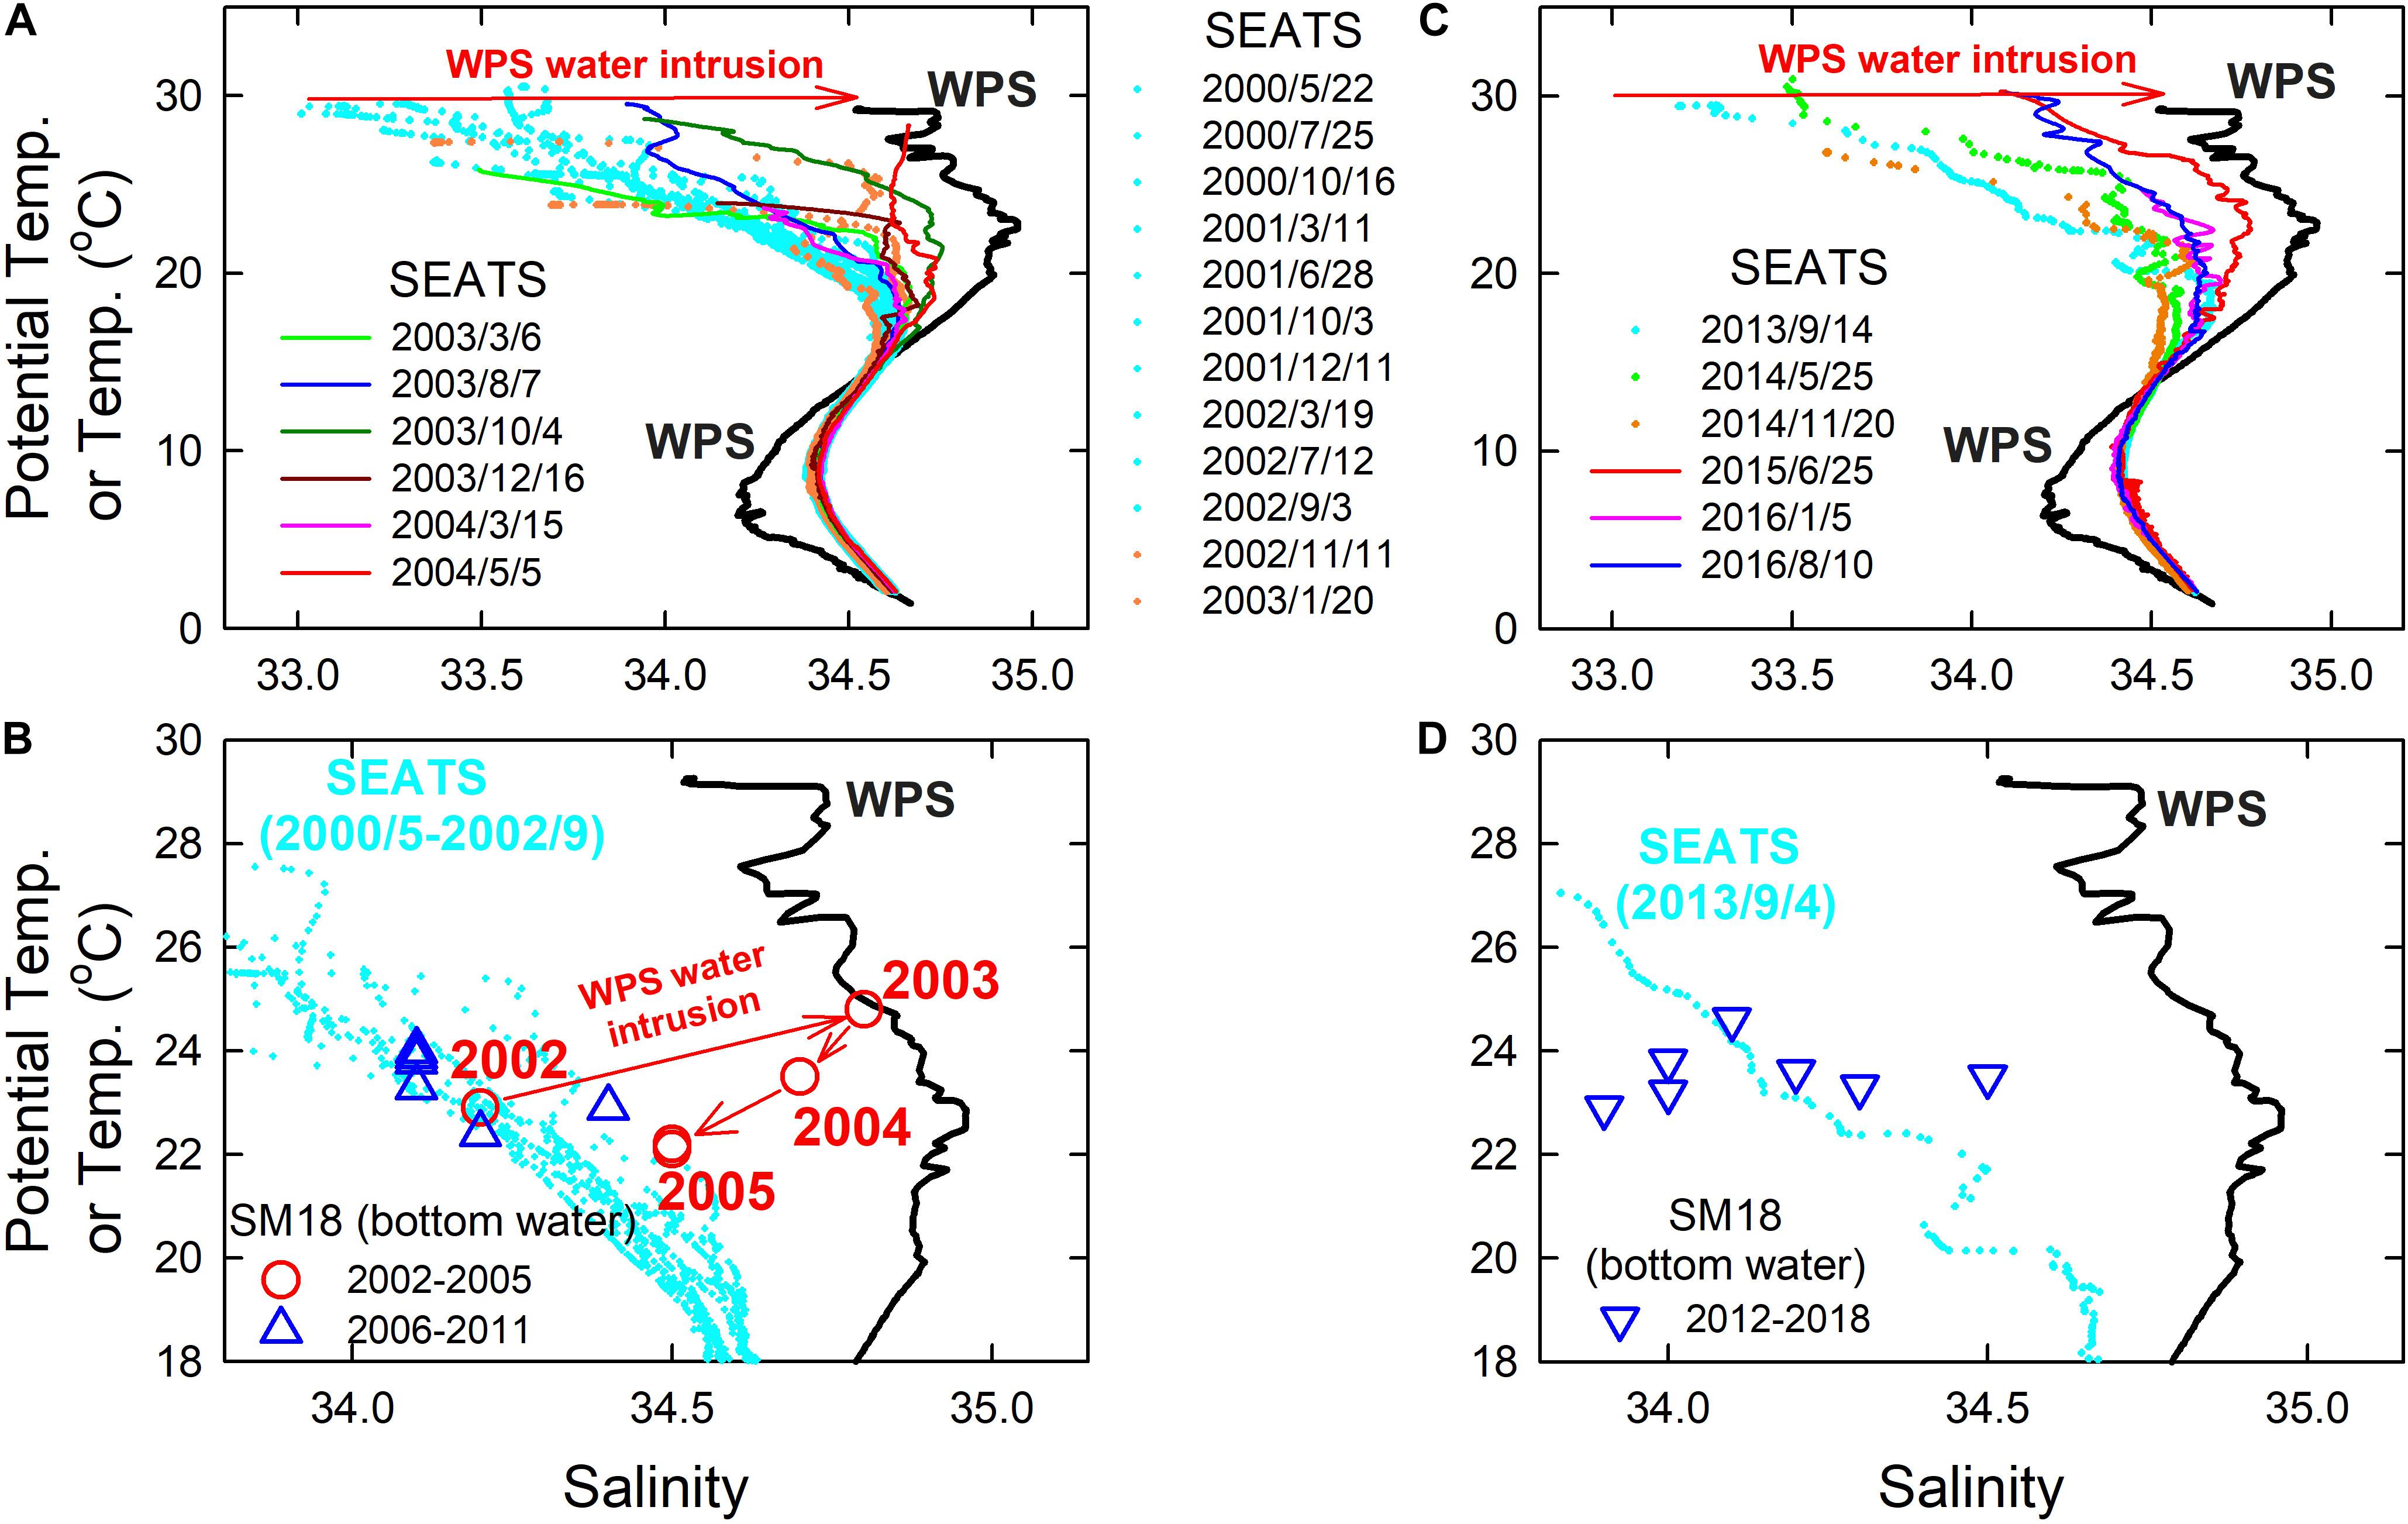
Figure 8. θ-salinity diagram of the water column at SEATS in (A) 2000–2004 and (C) 2013–2016. Temperature—Smax of the bottom water at SM18 in (B) 2002–2011 and (D) 2012–2018. The typical plot for WPS water collected at station 21 in the WPS in 1991/6 (black solid line), as well as the θ and salinity values at SEATS between 2000/5/22 and 2002/9/3 [cyan dot in (A)] and 2013/9/4 [cyan dot in (C)] are shown in (B,D), respectively, for reference. The numbers in (B) show the years of the data at SM18.
Lui et al. (2018) showed that, similar to that in 2003–2004, there was a strong interannual WPS seawater intrusion between 2014 and 2016 (Figure 8C). Consequently, the SSS at SEATS gradually increased from 33.19 in 2013/9 to the third highest of 34.46 in 2016/1 (Figure 4B). Unexpectedly, the DOmin at SM18 did not follow the trend of SEATS SSS. This is because, as shown in Figure 8D, the intruded WPS did not reach the SM18 site in 2016. The temperature vs. Smax correlation of SM18 shows with no observable signal of WPS intrusion between 2012 and 2018 (Figure 8D). Such a result revealed a fact that a large scale intrusion of WPS into the SCS does not mean to increase the DO concentration of the coastal bottom water until the intruded offshore seawater reaches and replenishes the low-DO coastal bottom water. Worth mentioning, the SM18 bottom water had the highest WPS seawater proportion in 2003 (Figure 8B), but it had the highest DOmin in 2014 (Figure 4A). Our modeled intrusion anomaly suggested that the intrusion was the strongest between the end of 2013 and the beginning of 2014 (Figure 4C). Such results implied that not only the proportion, but also the amount of offshore water intrusion plays an important role in controlling the summer hypoxic condition.
Additionally, the DO concentration in the WPS is significantly higher than that of the SCS from the mixed layer to several hundred meters in depth. For instance, at a depth of about 100 m, the DO concentration in the WPS is 1 mg L–1 higher than that of the SCS (Chen et al., 2001). Notably, the WPS seawater kept its original chemical properties after moving 800 km from the western boundary of the WPS to SM18 in 2003 (Figure 8B), when the Pearl River influence was minimal. Thus, simply replacing the SCS seawater by the WPS seawater by keeping everything else (e.g., terrestrial inputs, strength of stratification, productivity, amount of DO consumption, etc.) unchanged would increase the DO by 1 mg L–1. The enhanced lateral transport of the bottom water would have a large influence on the bottom water DO. For instance, replacing a low-DO bottom water, such as 0 mg L–1, by an offshore seawater with DO concentration 6 mg L–1 would lead the bottom water DO to have a 6 mg L–1 increment. That is, the amount and the pattern of offshore seawater intrusion are two critical factors governing the DO of the bottom water in the hypoxic zone.
Indeed, the WPS seawater intrusion increases the DO inventory but reduces the nutrients inventories and productivity in the nSCS, as the DO and nutrients are significantly higher and lower, respectively, than that of the nSCS in the subsurface layer. For instance, at depths between 125 and 150 m, the WPS (Stn. 21) and SCS (2000–2002 at SEATS) seawaters have distinct differences in DO of about 6.72 mg L–1 (or 210 μmol L–1) and 4.51 mg L–1 (or 141 μmol L–1), respectively (Figures 9A,B). The difference in NO3– are about 2 and 13 μmol L–1 (Figures 9C,D), respectively, and for PO43– they are about 0.1 and 0.9 μmol L–1 (Figures 9E,F), respectively. Influenced by the WPS seawater under a large scale Kuroshio intrusion, the DO, NO3–, and PO43– concentrations at SEATS in 2003–2004 were between those of the WPS and SCS, depending on the mixing proportions. Taking DO as an example, the DO concentration could be as low as 4.03 mg L–1 (or 126 μmol L–1) at 150 m depth between 2000 and 2002 when the intrusion was weak. In 2004/5/5 while the intrusion was strong, DO increased to as high as 5.66–6.30 mg L–1 (or 177–197 μmol L–1) at 150 m, having a 1.63–2.27 mg L–1 (or 51–71 μmol L–1) increment. The θ vs. salinity plot shows that the SCS:WPS seawater mixing ratio is about 0.6:0.4 at 150 m depth. The DO concentration based on this mixing ratio is about 5.11 mg L–1 (160 μmol L–1), agreeing with the observations. The NO3– and PO43– have similar but opposite changes as that of the DO concentration. That is, the degree of intrusion of the surface layer of the WPS seawater as a Kuroshio branch is one of the main factors governing the changes in nutrient inventories and, hence, productivity in the euphotic zone of the SCS (Du et al., 2013; Lui et al., 2018). Lui et al. (2018) showed that the increase in the WPS seawater proportions at the SEATS station between 2014 and 2016 reflects the Kuroshio intrusion into the SCS. Consequently, the satellite-derived Chl.-a concentration and the fluxes of sinking particles collected at 2000 and 3500 m depths decreased significantly. Expectably, the intrusion of offshore water to the coastal regions reduces the degree of eutrophication as well as the bottom hypoxic condition.
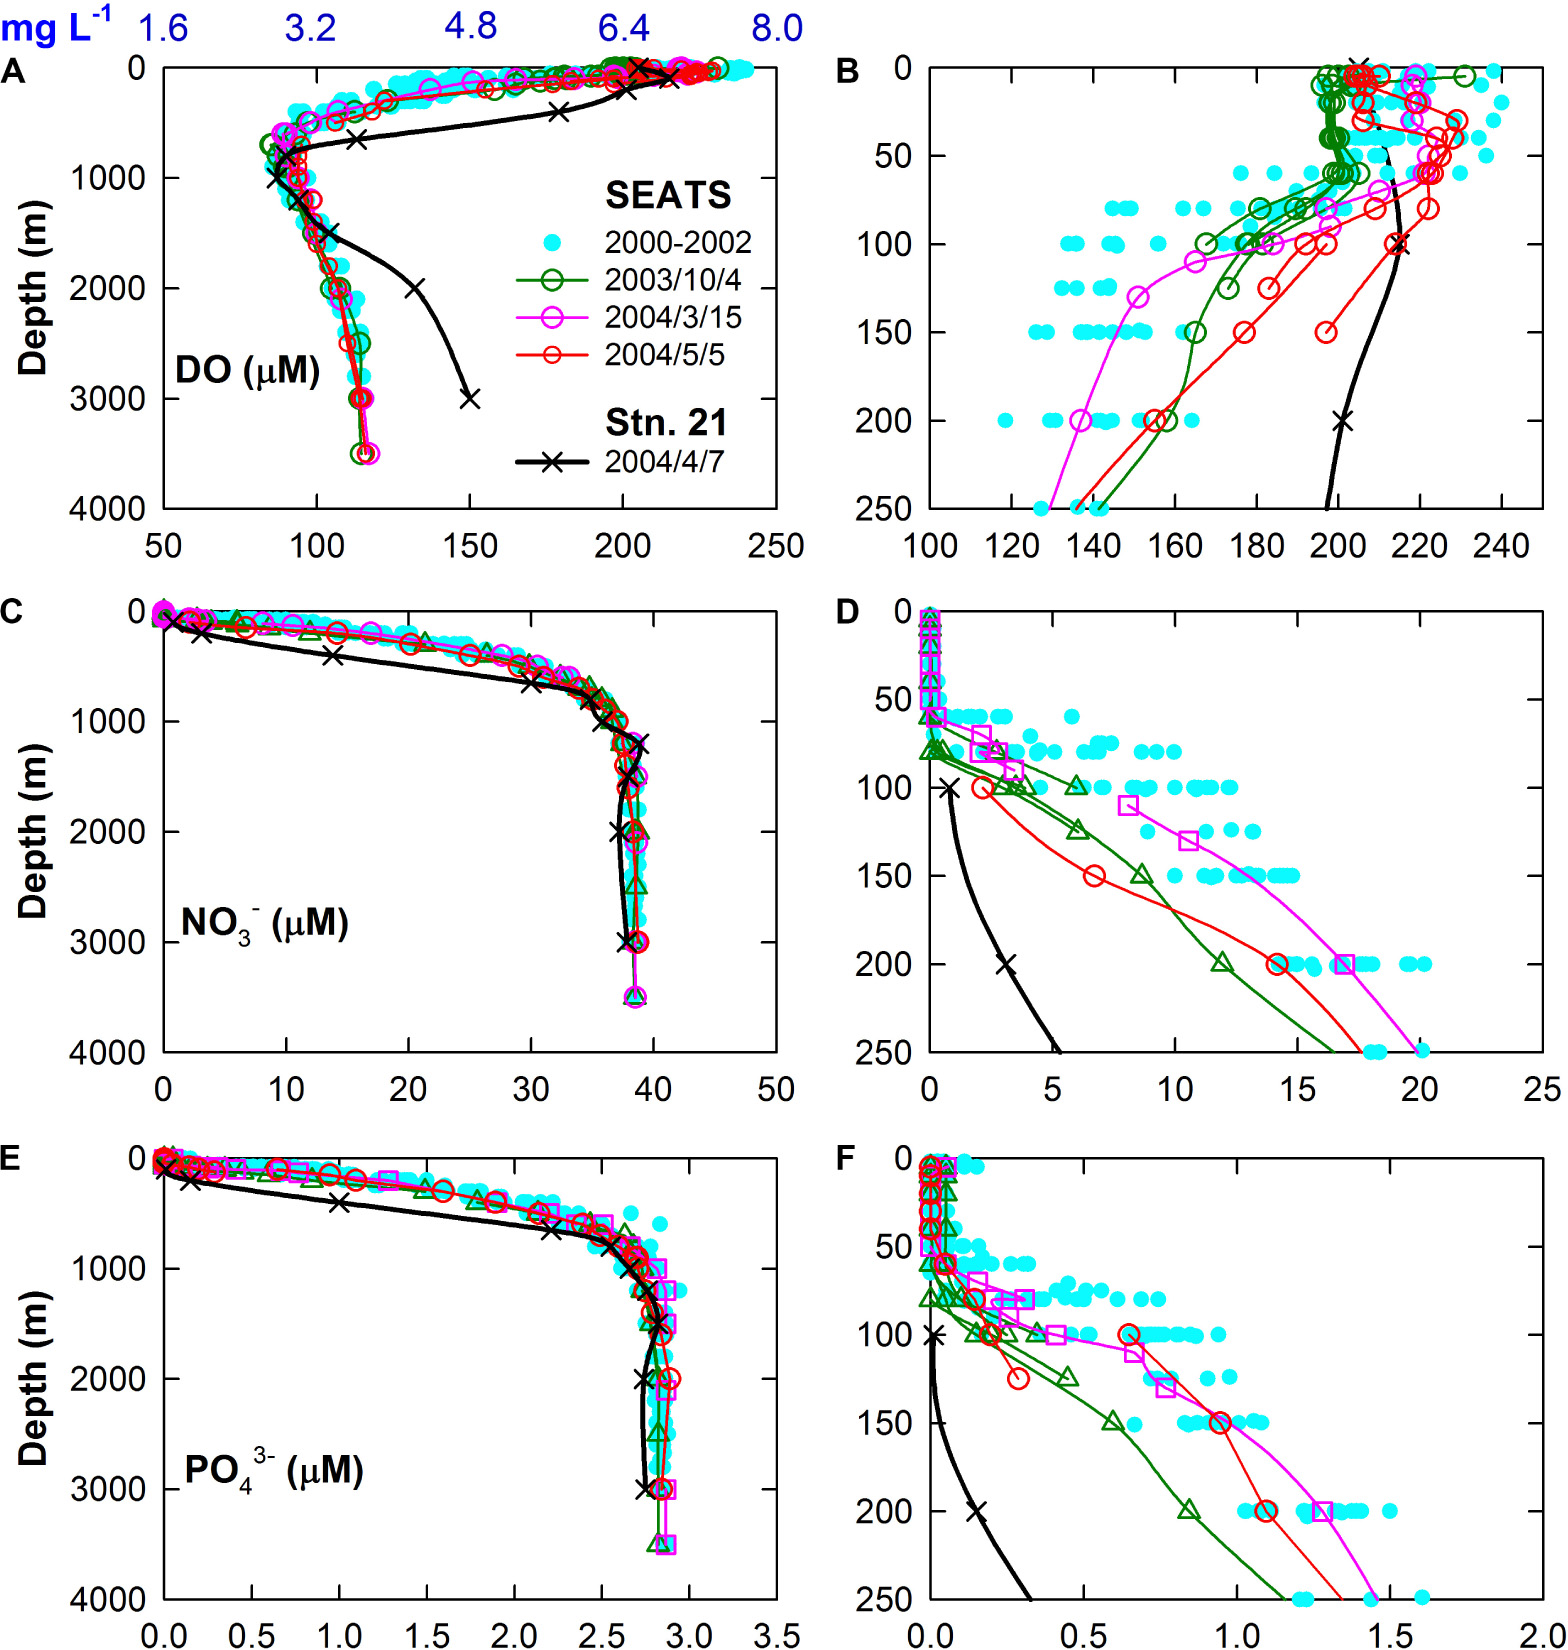
Figure 9. Plots of (A) DO, (C) NO3–, (E) PO43– vs. depths at SEATS in 2000–2004 (taken from the ODB) and at station 21 in 2004/7/27 (from this study). The (B,D,F) panels show the enlarged plots. The numbers show the sampling dates.
Climatic Oscillation of Intrusion Patterns and Its Implications
The intrusion patterns of the WPS water into the nSCS were reported to be driven by natural climate oscillations, namely, the ENSO and the PDO, which also influence the weather and hydrology worldwide (Jungclaus et al., 2006; Wu and Hsin, 2012; Wu, 2013; Wu et al., 2016, 2017). Largely due to changes in the wind stress curl, the Kuroshio intrudes more readily into the SCS during El Niño years or PDO warm phases, and the least during the La Niña or PDO cold phase years (Wu, 2013). The modeled fluxes at the Luzon Strait and the observed seawater chemistry parameters matched well with the patterns of changes of the ONI and PDO index (Figures 4A–E). For instance, the two large scale intrusions of the WPS seawater to the nSCS occurred in 2003–2004 and 2014–2016, when the PDO was in the warm phases (Figure 4, highlighted in yellow). Additionally, 2002 (weak) and 2015 (very strong) are El Niño years (Santoso et al., 2017). The gradually decreased DOmin at SM18 between 2005 and 2011 happened while PDO was in its cold phases. Meanwhile, 2005 (weak), 2007 (strong), 2008 (weak), 2010 (strong), and 2011 (weak) were La Niña years (Santoso et al., 2017). The Smax at SM18 and the SSS at SEATS show positive correlations with the PDO Index, and the transport anomaly in the Luzon Strait shows a negative correlation with the PDO Index (Figures 10A,C,E). Such results agree with the previous studies that the Kuroshio intrudes more into the SCS when the PDO is in a warm phase, and less in a cold phase (Wu, 2013; Wu et al., 2017). Interestingly, the correlation coefficient (R) reaches the highest when the time series of Smax at SM18, SSS at SEATS, and the transport anomaly in Luzon Strait are ahead by 14, 12, and 11 months, respectively (Figures 10B,D,F). These values reflect the lag of the changes in these parameters behind the PDO. The numbers are in line with those of Huang et al. (2015) in that the signals of seawater chemistry change in the Taiwan Strait was 7 months behind the Nino 3.4 Index.
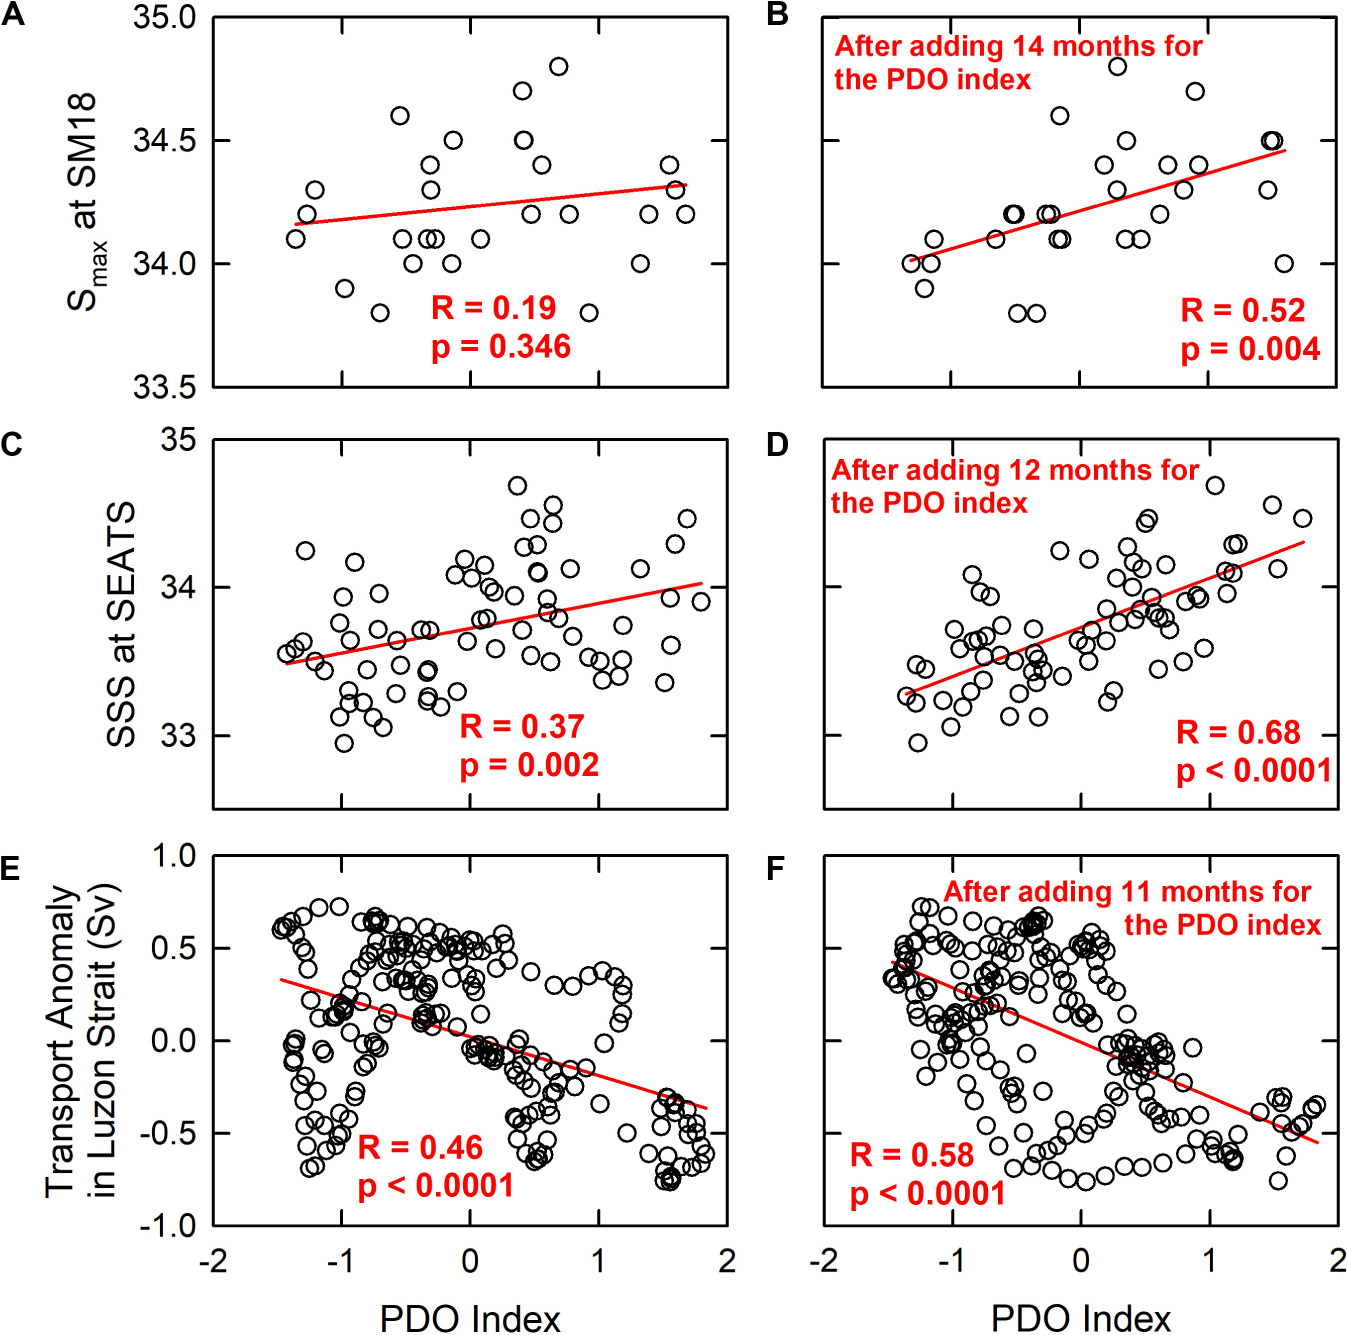
Figure 10. (A,C,E) The Smax at SM18, the SSS at SEATS and the transport anomaly in the Luzon Strait vs. the PDO index. (B,D,F) The best fitted correlations (the correlation coefficient, R, reaches the highest value) when the time series of Smax at SM18, the SSS at SEATS, and the transport anomaly in the Luzon Strait are ahead by 14, 12, and 11 months, respectively. The red lines show the linear regression, and the numbers refer to the R- and p-values of the regression.
Importantly, the influence of intruded Kuroshio on the seawater chemistry in the nSCS can sustain for years. Liu and Gan (2017) indicated that the intruded Kuroshio in the upper layer had a residence time of about 3 years before subducting into deeper layers or flowing out of the SCS. Restated, the intruded Kuroshio could have inter-annual influences on the biogeochemical cycles in the SCS. Indeed, the Kuroshio intrusion into the SCS was reported to be weakened between 1993 and 2010 (Nan et al., 2013), while the salinity decreased (Nan et al., 2016). However, how decadal decrease in Kuroshio intrusion affects the long-term decrease in DOmin is unclear and requires further investigation. Previous studies indicated that the natural climatic oscillations may enhance under global warming (Wang et al., 2017), possibly adjusting the intrusion pattern of offshore seawaters in many coastal areas. To conclude, most hypoxic zones are located in regions linked directly to the open oceans. With reference to the decadal records from SM18 and SEATS stations, this study illustrates the importance of increasing offshore water intrusion in diminishing the coastal hypoxic condition. Changing the amount of offshore water intrusion under changing climate needs to be considered to increase the accuracy of forecasting hypoxic conditions in many coastal regions.
Conclusion
Using decadal time series data off the Pearl River Estuary (SM18) and in the deep basin of the SCS (SEATS), this study shows that two strong Kuroshio intrusions occurred in the SCS around 2003–2004 and 2015–2016. Consequently, the nutrient concentrations at the SEATS site decreased about 200 m in depth. Likely, due to the oxygen supply carried by the enhanced Kuroshio intrusion, little hypoxia developed at SM18 in 2004. This provides a possible mechanism that enhanced amount of offshore water intrusion to the coastal region could diminish its degree of hypoxia.
Data Availability Statement
Publicly available datasets were analyzed in this study. This data can be found here: https://cd.epic.epd.gov.hk/EPICRIVER/marine.
Author Contributions
HKL designed the manuscript. HKL and CTC wrote the manuscript. WCC and WPH provided the information and participated in discussions on the SEATS data. JML provided the modeled data of the water flux. WPH and JL participated in part in the data analysis. YLW and CRW provided the surface current data. YLW, CRW, YCH, and YYC examined the mechanisms of the open ocean intrusions into the marginal seas. All authors read and commented on the final version of the manuscript.
Funding
This research was funded by the Ministry of Science and Technology of Taiwan (MOST 107-2611-M-110-026-, MOST 108-2611-M-110-025, MOST 108-2611-M-110-016, and MOST 109-2611-M-110-010).
Conflict of Interest
The authors declare that the research was conducted in the absence of any commercial or financial relationships that could be construed as a potential conflict of interest.
Acknowledgments
We would like to thank the Hong Kong Environmental Protection Department, the Taiwan Ocean Data Bank, and the principal investigators of the studied time series for providing the invaluable data. We also thank the captain and crew of R/V Ocean Researchers I, II, III, and Legend. Two reviewers provided detailed and constructive comments which helped strengthen the manuscript.
Footnotes
- ^ http://www.odb.ntu.edu.tw/
- ^ http://www.ccpo.odu.edu/POMWEB/
- ^ https://www.nodc.noaa.gov/OC5/woa13/
- ^ https://www.aviso.altimetry.fr/
- ^ http://research.jisao.washington.edu/pdo/PDO.latest.txt
- ^ https://www.aoml.noaa.gov/phod/gdp/
- ^ https://www.hycom.org/dataserver/gofs-3pt0/reanalysis
References
Banholzer, S., and Donner, S. (2014). The influence of different El Niño types on global average temperature. Geophys. Res. Lett. 41, 2093–2099. doi: 10.1002/2014gl059520
Breitburg, D., Levin, L. A., Oschlies, A., Grégoire, M., Chavez, F. P., Conley, D. J., et al. (2018). Declining oxygen in the global ocean and coastal waters. Science 359:eaam7240.
Cai, W. J., Dai, M. H., Wang, Y. C., Zhai, W. D., Huang, T., Chen, S. T., et al. (2004). The biogeochemistry of inorganic carbon and nutrients in the Pearl River estuary and the adjacent Northern South China Sea. Continent. Shelf Res. 24, 1301–1319. doi: 10.1016/j.csr.2004.04.005
Chen, C. T. A., Lui, H. K., Hsieh, C. H., Yanagi, T., Kosugi, N., Ishii, M., et al. (2017). Deep oceans may acidify faster than anticipated due to global warming. Nat. Clim. Change 7, 890–899. doi: 10.1038/s41558-017-0003-y
Chen, C. T. A., and Wang, S. L. (2006). A salinity front in the southern East China Sea separating the Chinese coastal and Taiwan Strait waters from Kuroshio waters. Continent. Shelf Res. 26, 1636–1653. doi: 10.1016/j.csr.2006.05.003
Chen, C. T. A., Wang, S. L., Lu, X. X., Zhang, S. R., Lui, H. K., Tseng, H. C., et al. (2008). Hydrogeochemistry and greenhouse gases of the Pearl River, its estuary and beyond. Quatern. Int. 186, 79–90. doi: 10.1016/j.quaint.2007.08.024
Chen, C. T. A., Wang, S. L., Wang, B. J., and Pai, S. C. (2001). Nutrient budgets for the South China Sea basin. Mar. Chem. 75, 281–300. doi: 10.1016/s0304-4203(01)00041-x
Chen, C. T. A., Yeh, Y. T., Yanagi, T., Bai, Y., He, X., and Huang, T. H. (2016). The tug-of-war between the West Philippine Sea and South China Sea tropical waters and intermediate waters in the Okinawa trough. J. Geophys. Res. 121, 1736–1754. doi: 10.1002/2015jc011274
Conley, D. J., Paerl, H. W., Howarth, R. W., Boesch, D. F., Seitzinger, S. P., Havens, K. E., et al. (2009). Controlling eutrophication: nitrogen and phosphorus. Science 323, 1014–1015. doi: 10.1126/science.1167755
Diaz, R. J., and Rosenberg, R. (2008). Spreading dead zones and consequences for marine ecosystems. Science 321, 926–929. doi: 10.1126/science.1156401
Du, C., Liu, Z., Dai, M., Kao, S. J., Cao, Z., Zhang, Y., et al. (2013). Impact of the Kuroshio intrusion on the nutrient inventory in the upper northern South China Sea: insights from an isopycnal mixing model. Biogeosciences 10, 6419–6432. doi: 10.5194/bg-10-6419-2013
Feely, R. A., Sabine, C. L., Hernandez-Ayon, J. M., Ianson, D., and Hales, B. (2008). Evidence for upwelling of corrosive “acidified” water onto the continental shelf. Science 320, 1490–1492. doi: 10.1126/science.1155676
Hong Kong Environmental Protection Department (2015). Marine Water Quality in Hong Kong. Hong Kong: Hong Hong Kong Environmental Protection Department.
Howarth, R., Chan, F., Conley, D. J., Garnier, J., Doney, S. C., Marino, R., et al. (2011). Coupled biogeochemical cycles: eutrophication and hypoxia in temperate estuaries and coastal marine ecosystems. Front. Ecol. Environ. 9, 18–26. doi: 10.1890/100008
Huang, T. H., Chen, C. T. A., Zhang, W. Z., and Zhuang, X. F. (2015). Varying intensity of Kuroshio intrusion into Southeast Taiwan Strait during ENSO events. Continent. Shelf Res. 103, 79–87. doi: 10.1016/j.csr.2015.04.021
Jungclaus, J. H., Keenlyside, N., Botzet, M., Haak, H., Luo, J. J., Latif, M., et al. (2006). Ocean circulation and tropical variability in the coupled model ECHAM5/MPI-OM. J. Clim. 19, 3952–3972. doi: 10.1175/jcli3827.1
Kalnay, E., Kanamitsu, M., Kistler, R., Collins, W., Deaven, D., Gandin, L., et al. (1996). The NCEP/NCAR 40-year reanalysis project. Bull. Am. Meteorol. Soc. 77, 437–472.
Liu, Z., and Gan, J. (2017). Three-dimensional pathways of water masses in the South China Sea: a modeling study. J. Geophys. Res. Oceans 122, 6039–6054. doi: 10.1002/2016jc012511
Lu, Z. M., Gan, J. P., Dai, M. H., Liu, H. B., and Zhao, X. Z. (2018). Joint effects of extrinsic biophysical fluxes and intrinsic hydrodynamics on the formation of hypoxia west off the Pearl River Estuary. J. Geophys. Res. Oceans 123, 6241–6259. doi: 10.1029/2018jc014199
Lui, H. K., and Chen, C. T. A. (2012). The nonlinear relationship between nutrient ratios and salinity in estuarine ecosystems: implications for management. Curr. Opin. Environ. Sustainabil. 4, 227–232. doi: 10.1016/j.cosust.2012.03.002
Lui, H. K., Chen, K. Y., Chen, C. T., Wang, B. S., Lin, H. L., Ho, S. H., et al. (2018). Physical forcing-driven productivity and sediment flux to the deep basin of northern South China Sea: a decadal time series study. Sustainability 10:971. doi: 10.3390/su10040971
Mantua, N. J., Hare, S. R., Zhang, Y., Wallace, J. M., and Francis, R. C. (1997). A Pacific interdecadal climate oscillation with impacts on salmon production. Bull. Am. Meteorol. Soc. 78, 1069–1080. doi: 10.1175/1520-0477(1997)078<1069:apicow>2.0.co;2
Ministry of Water Resources of the People’s Republic of China (2002–2018). China River Sediment Bulletin, China Water and Power Press. Ministry of Water Resources, China.
Mohrholz, V., Naumann, M., Nausch, G., Krüger, S., and Gräwe, U. (2015). Fresh oxygen for the Baltic Sea — An exceptional saline inflow after a decade of stagnation. J. Mar. Syst. 148, 152–166. doi: 10.1016/j.jmarsys.2015.03.005
Murphy, J., and Riley, J. P. (1962). A modified single solution method for the determination of phosphate in natural waters. Anal. Chim. Acta 27, 31–36. doi: 10.1016/S0003-2670(00)88444-5
Nan, F., Xue, H., Chai, F., Wang, D., Yu, F., Shi, M., et al. (2013). Weakening of the Kuroshio intrusion into the South China Sea over the past two decades. J. Clim. 26, 8097–8110. doi: 10.1175/jcli-d-12-00315.1
Nan, F., Xue, H., and Yu, F. (2015). Kuroshio intrusion into the South China Sea: a review. Prog. Oceanogr. 137, 314–333. doi: 10.1016/j.pocean.2014.05.012
Nan, F., Xue, H. J., Chai, F., Shi, L., Shi, M. C., and Guo, P. F. (2011). Identification of different types of Kuroshio intrusion into the South China Sea. Ocean Dyn. 61, 1291–1304. doi: 10.1007/s10236-011-0426-3
Nan, F., Yu, F., Xue, H., Zeng, L., Wang, D., Yang, S., et al. (2016). Freshening of the upper ocean in the South China Sea since the early 1990s. Deep Sea Res. I Oceanogr. Res. Pap. 118, 20–29. doi: 10.1016/j.dsr.2016.10.010
Pai, S.-C., Gong, G.-C., and Liu, K.-K. (1993). Determination of dissolved oxygen in seawater by direct spectrophotometry of total iodine. Mar. Chem. 41, 343–351. doi: 10.1016/0304-4203(93)90266-Q
Pai, S.-C., Yang, C.-C., and Riley, J. P. (1990). Effects of acidity and molybdate concentration on the kinetics of the formation of the phosphoantimonylmolybdenum blue complex. Anal. Chim. Acta 229, 115–120. doi: 10.1016/S0003-2670(00)85116-8
Qian, W., Gan, J., Liu, J., He, B., Lu, Z., Guo, X., et al. (2018). Current status of emerging hypoxia in a eutrophic estuary: the lower reach of the Pearl River Estuary, China. Estuar. Coast. Shelf Sci. 205, 58–67. doi: 10.1016/j.ecss.2018.03.004
Rabalais, N., Cai, W.-J., Carstensen, J., Conley, D., Fry, B., Hu, X., et al. (2014). Eutrophication-driven deoxygenation in the coastal ocean. Oceanography 27, 172–183. doi: 10.5670/oceanog.2014.21
Rabalais, N. N., Diaz, R. J., Levin, L. A., Turner, R. E., Gilbert, D., and Zhang, J. (2010). Dynamics and distribution of natural and human-caused hypoxia. Biogeosciences 7, 585–619. doi: 10.5194/bg-7-585-2010
Santoso, A., McPhaden, M. J., and Cai, W. J. (2017). The defining characteristics of ENSO extremes and the strong 2015/2016 El Niño. Rev. Geophys. 55, 1079–1129. doi: 10.1002/2017rg000560
Schmidtko, S., Stramma, L., and Visbeck, M. (2017). Decline in global oceanic oxygen content during the past five decades. Nature 542, 335–339. doi: 10.1038/nature21399
Strickland, J. D. H., and Parsons, T. R. (1972). A Practical Handbook of Seawater Analysis. Ottawa: Fisheries Research Board of Canada.
Su, J., Dai, M., He, B., Wang, L., Gan, J., Guo, X., et al. (2017). Tracing the origin of the oxygen-consuming organic matter in the hypoxic zone in a large eutrophic estuary: the lower reach of the Pearl River Estuary, China. Biogeosciences 14, 4085–4099. doi: 10.5194/bg-14-4085-2017
Wang, G., Cai, W., Gan, B., Wu, L., Santoso, A., Lin, X., et al. (2017). Continued increase of extreme El Niño frequency long after 1.5 °C warming stabilization. Nat. Clim. Change 7, 568–572. doi: 10.1038/nclimate3351
Wang, H., Dai, M., Liu, J., Kao, S.-J., Zhang, C., Cai, W.-J., et al. (2016). Eutrophication-driven hypoxia in the East China Sea off the Changjiang Estuary. Environ. Sci. Technol. 50, 2255–2263. doi: 10.1021/acs.est.5b06211
Wong, G. T. F., Pan, X., Li, K.-Y., Shiah, F.-K., Ho, T.-Y., and Guo, X. (2015). Hydrography and nutrient dynamics in the Northern South China Sea Shelf-sea (NoSoCS). Deep Sea Res. II Top. Stud. Oceanogr. 117, 23–40. doi: 10.1016/j.dsr2.2015.02.023
Wu, C. R. (2013). Interannual modulation of the Pacific Decadal Oscillation (PDO) on the low-latitude western North Pacific. Prog. Oceanogr. 110, 49–58. doi: 10.1016/j.pocean.2012.12.001
Wu, C. R., and Hsin, Y. C. (2012). The forcing mechanism leading to the Kuroshio intrusion into the South China Sea. J. Geophys. Res. Oceans 117:7015. doi: 10.1029/2012jc007968
Wu, C. R., Hsin, Y. C., Chiang, T. L., and Lin, Y. F. (2014). Seasonal and interannual changes of the Kuroshio intrusion onto the East China Sea Shelf. J. Geophys. Res. 119, 5039–5051. doi: 10.1002/2013jc009748
Wu, C. R., Wang, Y. L., Lin, Y. F., and Chao, S. Y. (2017). Intrusion of the Kuroshio into the South and East China Seas. Sci. Rep. 7:7895. doi: 10.1038/s41598-017-08206-4
Keywords: hypoxia, Kuroshio, intrusion, Pearl River Estuary, South China Sea, El Niño, PDO
Citation: Lui HK, Chen CTA, Hou WP, Liau JM, Chou WC, Wang YL, Wu CR, Lee J, Hsin YC and Choi YY (2020) Intrusion of Kuroshio Helps to Diminish Coastal Hypoxia in the Coast of Northern South China Sea. Front. Mar. Sci. 7:565952. doi: 10.3389/fmars.2020.565952
Received: 26 May 2020; Accepted: 28 August 2020;
Published: 08 October 2020.
Edited by:
Xianghui Guo, Xiamen University, ChinaReviewed by:
Zhiqiang Liu, Southern University of Science and Technology, ChinaSabine Schmidt, Centre National de la Recherche Scientifique (CNRS), France
Copyright © 2020 Lui, Chen, Hou, Liau, Chou, Wang, Wu, Lee, Hsin and Choi. This is an open-access article distributed under the terms of the Creative Commons Attribution License (CC BY). The use, distribution or reproduction in other forums is permitted, provided the original author(s) and the copyright owner(s) are credited and that the original publication in this journal is cited, in accordance with accepted academic practice. No use, distribution or reproduction is permitted which does not comply with these terms.
*Correspondence: Hon-Kit Lui, hklui@mail.nsysu.edu.tw; Chen-Tung Arthur Chen, ctchen@mail.nsysu.edu.tw