Modeling the Bioaccumulation and Biomagnification Potential of Microplastics in a Cetacean Foodweb of the Northeastern Pacific: A Prospective Tool to Assess the Risk Exposure to Plastic Particles
 Juan José Alava1,2*
- 1Ocean Pollution Research Unit, Institute for the Oceans and Fisheries, University of British Columbia, Vancouver, BC, Canada
- 2Nippon Foundation-Ocean Litter Project, Institute for the Oceans and Fisheries, University of British Columbia, Vancouver, BC, Canada
Microplastics (MPs) can readily be ingested by marine organisms. Direct ingestion and trophic transfer are likely to be the main pathway for microplastics to bioaccumulate in upper trophic level organisms. Bioaccumulation potential of MPs in marine mammalian foodwebs is scarcely known. To understand whether microplastics bioaccumulate in marine mammals, a bioaccumulation model for MPs was developed for the filter-feeding humpback whale and fish-eating resident killer whale foodwebs of the Northeastern Pacific. Applying three concentration scenarios for MPs by entering observed water and sediment concentrations as input data (low, high, and moderate scenarios), and tested under two different elimination rates (kE) for zooplankton, the model predicted species-specific and foodweb-specific bioaccumulation potential. The predator-prey biomagnification factor (BMFTL, used to assess the ratio of the MP concentration in predator to that in prey adjusted to the difference of trophic levels), involving cetaceans, appeared to be not only lower than one or equal to one (BMFTL ≤ 1 as in resident killer whale/Chinook salmon), but also BMFTL > 1 in some predator-prey relationships (humpback whale/zooplankton). Depending on the magnitude of abiotic concentrations used in the modeling, the trophic magnification factor (TMF) regression analyses over time showed lack of evidence for trophic magnification as the magnification was independent of the trophic level, indicating no changes (TMF = 1; p > 0.05), and trophic dilution (TMF < 1; p < 0.05) due to the decrease in MP concentrations as the trophic level increased. Projected biomagnification in simplified foodwebs revealed no significant increase in concentrations as the trophic level increased (TMF = 1; p > 0.05), following 100–365 days. Compared to the high biomagnification behavior of persistent organic pollutants in marine foodwebs, scarce biomagnification capacity of microplastic was predicted in the cetacean foodwebs. Notwithstanding, the moderate to high microplastic bioaccumulation predicted in some lower trophic level marine organisms highlights the health risks of toxic exposure to marine fauna strongly relying on fish and coastal communities highly dependent on seafood. This modeling work provides a tool to assess the bioaccumulation potential and impact of microplastics in the marine environment to support risk assessment and inform plastic waste management.
Introduction
Ocean plastics are perversely impacting ecosystems and many marine organisms. Particularly, the marine fauna is threatened by macroplastics and microplastics causing direct lethal injuries (i.e., structural and physical damage due to entanglements, suffocation and intestinal obstruction) and sublethal health impacts, i.e., toxic chemical effects because of the leaching of associated and absorbed contaminants to which organism are exposed (GESAMP, 2010; Bergmann et al., 2015; Rochman, 2015; Rochman et al., 2019). Every ocean is polluted by marine litter, from which about 73% is plastic; and, more than 1,300 species are affected through entanglement and ingestion (Bergmann et al., 2017). The volume of plastic that entered the oceans in 2010 from 192 coastal countries (93% of the global population) ranged from 4.8 to 12.7 million metric tons (Jambeck et al., 2015). The entanglement with and ingestion of ocean macroplastics, including fishing line, plastic bags, and other plastic items, have been reported in about 30–81 species of marine mammals (Moore, 2008; Gall and Thompson, 2015; Kühn et al., 2015). In addition to deleterious entanglements and ingestion, marine debris and plastics serve as vectors for organic pollutants, including polycyclic aromatic hydrocarbons (PAHs), phthalates, nonylphenols, and persistent organic pollutants (POPs) such as polychlorinated biphenyls (PCBs), polybrominated diphenyl ethers (PBDEs), and dichloro-diphenyldichloro-ethylene (DDE), which is a byproduct of DDT (Moore, 2008; Gregory, 2009; GESAMP, 2010; Sigler, 2014). One study estimated that a minimum of 5.25 trillion particles weighing 268,940 tons is floating in the world’s ocean (Eriksen et al., 2014).
Of particular concern are microplastics (MPs, hereafter), which are defined as particles < 5 mm and categorized as (i) primary MPs, which are deliberately manufactured (e.g., microbeads in cosmetics, industrial cleaners, or virgin resin pellets for manufacturing and nurdles); and, (ii) secondary MPs, which are break-down products of plastic that exceed 5 mm (e.g., clothing, ropes, bags, and bottles) (Browne et al., 2007; Moore, 2008; GESAMP, 2010; Andrady, 2011; Duis and Coors, 2016). Most MPs likely originate from land-based sources (e.g., household and industrial waste and wastewater), although these pollutants can also be released from sea-based sources (e.g., fishing, shipping). Microplastics are now considered global pollutants and are part of a much bigger ocean pollution problem because of their persistence, hazardous and ubiquitous nature (Browne et al., 2007; Andrady, 2011; Rochman et al., 2013a, b; Ross and Morales-Caselles, 2015; Bergmann et al., 2017; Rochman et al., 2019).
Because of their small size, MPs are ingested by organisms of several different taxa including zooplankton, marine invertebrates, fish, seabirds, and marine mammals (Cole et al., 2013; Farrell and Nelson, 2013; Lusher et al., 2013, 2015, 2018; Romeo et al., 2015; Amélineau et al., 2016; Nelms et al., 2018, 2019; Moore et al., 2020). Of great concern is the potential for trophic-transfer of MPs and associated contaminants leached from MPs within lower-trophic, keystone organisms, including zooplankton, which is the essential functional group and primary consumer as the fundamental entrance link at the bottom of the food web for the uptake of microplastics. This trophic process is likely to transfer these contaminants up the food-chain, with the potential for bioaccumulation and thus adverse health effects in higher trophic level organisms (Cole et al., 2013; Lusher, 2015). As it stands, trophic transfer of MPs represents an indirect, but potentially major, pathway of exposure for any species whose feeding ecology involves the consumption of whole prey, including humans (Galloway, 2015; Nelms et al., 2018; Cox et al., 2019; WHO, 2019).
Specifically, within the foraging behavior of marine mammal species, marine debris and MPs may be ingested directly through incidental consumption, including feeding by pelagic and deep diving cetaceans and indiscriminate filter-feeding of small particles from large volumes of water by baleen (mysticete) whales (Simmonds, 2012; Besseling et al., 2015; Lusher et al., 2015, 2018; Germanov et al., 2018; Moore et al., 2020; Nelms et al., 2019). MPs with a size of 1mm, for example, were found in the gastrointestinal tract of a stranded humpback whale (Megaptera novaeangliae), as an indication of unselective ingestion by this baleen whale species (Besseling et al., 2015). MPs can also be indirectly ingested through trophic transfer, in which predators consume MP–contaminated prey items (Lusher, 2015). For example, during raptorial foraging behavior performed by most pinnipeds and dolphins (Hocking et al., 2017), or via bottom feeding and suction feeding on benthic organisms and sediments contaminated with MPs (e.g., walruses, belugas and gray whales). The ingestion of plastic debris and possibly MPs as a result of stranding event processes in cetaceans cannot be ruled out (Simmonds, 2012). Inhalation of air-borne particles, fibers or aerosols at the water-air interface in the oceanic atmosphere is also a potential route of exposure for air-breathing organisms such as marine mammals (Lusher, 2015).
While some empirical studies (experimental and field work) have investigated the trophic transfer of MPs between low trophic levels via exposure and ingestion (Cole et al., 2013; Farrell and Nelson, 2013; Setälä et al., 2014; Watts et al., 2014; Taylor et al., 2016; Santana et al., 2017), there is currently little research investigating the exposure and bioaccumulation of MPs per se in complex marine foodwebs and top predators (Besseling et al., 2015; Romeo et al., 2015; Fossi et al., 2016; Lusher et al., 2018; Nelms et al., 2018; Provencher et al., 2019). Foodweb bioaccumulation models of MPs for top predators are also scarce (Koelmans, 2015). Most bioaccumulation models have focused on the capacity of MPs to transfer organic contaminants [e.g., POPs such as PCBs and PBDEs, PAHs, nonylphenol (NP), bisphenol A (BPA) and phthalates] to biota and their role in bioaccumulation through the foodweb (Koelmans, 2015; Bakir et al., 2016; Diepens and Koelmans, 2018). More research to investigate ingestion rate, egestion rate, gut retention time and ingested volume of MPs is also urgently needed to understand the transfer between trophic levels and bioaccumulation of these particles, especially in marine mammals and their foodwebs (Lusher, 2015; Botterell et al., 2019; Provencher et al., 2019).
In the face of logistic challenges, permit limitations and ethical implications to work with and sample marine mammals, models provide a tool to explore the bioaccumulation of MPs in these species. A call to address the large research gap on bioaccumulation and biomagnification of MPs aimed at understanding how plastics move through marine food webs, and how trophic interactions mediate the transfer of plastics between prey and predators has recently been made (see review by Provencher et al., 2019). Foodweb bioaccumulation models for cetaceans for MPs have not yet been developed. Therefore, the aim of this study was to investigate the bioaccumulation potential of MPs and to what extent MPs biomagnify in the marine food webs. The MP bioaccumulation model was developed using a marine mammalian food web of the Northeastern Pacific (Canada’s Pacific marine region) to assess and predict the bioaccumulation potential and biomagnification capacity of MPs in the gastrointestinal tract (GI) as a function of uptake or ingestion and elimination in organisms. The conceptual model framework of the modeling components and mechanism are illustrated in Supplementary Figure S1.
Materials and Methods
Theory
Primary producers (e.g., phytoplankton) can adsorb MPs which may be ingested along with phytoplankton by zooplankton, providing a potential pathway into the food web (Lusher, 2015). Conversely, MPs can also be ingested directly from water by zooplankton, as the key initial trophic link for the dietary uptake of MPs. Under this rationale, zooplankton was stated as the fundamental food source for many secondary consumers, representing the main exposure pathway for MPs to entering into the foodweb (Cole et al., 2013; Lusher, 2015; Botterell et al., 2019). Within this premise, the basic principle of the foodweb bioaccumulation model for MPs is based on the notion that the uptake of MPs in primary consumers such as zooplankton is predominantly a filter feeding process that can be described by a bioconcentration factor, BCF:
where CB is the concentrations of MP (particles/organism or in units of mass as g/kg) in zooplankton and CW is the MP concentration (in particle/L or in g/L) in seawater. If CW is known from empirical field data, and BCF is a function of the differential balance from the first order rate constants (i.e., BCF = k1/k2, where k1 is the uptake rate of MP from the water (i.e., equivalent to the uptake rate of MP from water: kW), and k2 is the overall elimination rate of MP through egestion); then, CB can be calculated for zooplankton by solving equation (1):
For secondary and tertiary consumers, the bioaccumulation process is more complex as MPs can be absorbed directly from the water via respiration (i.e., water respiring or gill ventilating organisms), and ingested via the diet and eliminated from marine organisms into fecal matter (see Koelmans et al., 2013a, b, 2014a, b; Koelmans, 2015; Diepens and Koelmans, 2018). These former models have been basically developed to assess the accumulation of plastic-associated chemicals, i.e., additives and absorbed toxic chemicals such as hydrophobic organic chemicals in food webs (Koelmans, 2015; Bakir et al., 2016; Diepens and Koelmans, 2018).
Here, on the other hand, the extent of the bioaccumulation model developed in this study differ from those published models as it is focused in the accumulation of the microplastic particles (i.e., MPs) as the toxic micropollutant of interest per se as a function of ingestion by the organisms and uptake and egestion by the GI track only; and, not by the systematic uptake and accumulation of MPs and hydrophobic organic substances (e.g., POPs) in the organism tissues. Henceforth, this novel concept is explicitly considered in the design and formulation of this model. Based on this rationale, these processes can be combined in a basic kinetic model for the bioaccumulation of MP in aquatic or marine biota, using a mass balance of uptake and loss rates, expressed by the following differential equation for water respiring organisms:
For air respiring organisms, the differential equation is:
where CB is the MP concentration in the organism (in particles/organisms or in g/kg); kW is the rate constant for MP uptake from water (particles/organism/d or g/kg/d); CW is the MP concentration (particles/L or g/L) in the water; kA is the rate constant for MP uptake from air (particles/organism/d or g/kg/d); CA is the MP concentration in the air (particles/L or g/L); CD is MP concentration in the diet of the organism (particle/organism or g/kg), which can also include sediment concentrations (CS) of MP (in particle/kg dry weight [dw] or g/kg dw) for detritophages; kD is the dietary uptake rate (kg/kg/d); kG is the growth dilution rate constant, and kE is the elimination rate constant (in units of d–1 = 1/d) of MP in organisms.
Contaminated sediments and diet are expected to be the major sources for trophic transfer of MP to the marine food-web with predominant transfer of MP both from sediments to benthic marine species to fish and other aquatic organisms and eventually to marine mammals and from zooplankton to upper trophic levels (predatory fish, marine mammals). For certain marine invertebrate species such as zooplankton, polychaetes, bivalves and benthic crustaceans, as well as for planktivorous fish, empirical values for retention times (residence time) based on egestion of particle of MPs following dietary exposure have been observed (Besseling et al., 2013; Cole et al., 2013; Farrell and Nelson, 2013; Setälä et al., 2014; Watts et al., 2014; Batel et al., 2016; Critchell and Hoogenboom, 2018; Dimitrijevic, 2018; see Supplementary Table S1), allowing the calculation of kE to be used in the model.
However, the uptake rate of MP from water (kW) and the rate of elimination through fecal excretion (kE) for most marine fish, as well as the air rate constant for MP uptake (kA) and concentration in the air (CA) for air breathing organisms (marine mammals) have been scarcely documented or unavailable (see reviews by Koelmans, 2015; Lusher, 2015). For marine mammals (i.e., humpback whales and resident killer whales), the data from a single study on dietary exposure and digestion rates in gray seals (Grellier and Hammond, 2006) was used to calculate kE (Supplementary Table S1). Although there is no data on the effects of the growth dilution rate (kG) on MP concentration in aquatic organisms, it was also included in the modeling work (for squid, kG was used as a proxy for kE due the absence of kE values for cephalopods). Thus, for the purpose of this modeling work, kW, kA, and CA were considered negligible.
Microplastic Retention Time (Residence Time) and kE Estimation
The residence time or lifetime (τ), based on studies of dietary exposure and egestion or defecation of MPs in some aquatic organisms (Supplementary Table S1), was used to directly estimate the half-life (t1/2) as t1/2 is approximately 70% of τ, as shown by the equations below:
Then, the half-life is inversely related to τ (i.e., t1/2 = ln 2/kE = 0.6932 x [1/kE]), where kE represents the total elimination rate of MP (i.e., sum of all first order (or pseudo-first order) rate constants). Thus, solving for t1/2:
Elimination of MPs through the passage of the GI tract or guts has been documented for some invertebrates. Cole et al. (2013) found that zooplankton can eliminate MPs within hours (e.g., ≤1 day) in the presence of phytoplankton or in 7 days in the absence of food. For zooplankton, a retention time of 1 day (i.e., kE = 1/d) was used in modeling as a conservative estimate, and 7 days (i.e., kE = 0.143/d), as a least conservative residence time, based on that experimental study. For marine benthic invertebrates, data from exposure experimental studies (i.e., microplastic egestion at a given time or/and residence time in the gut) were used to derive kE. While residential time of MPs in the GI tract of fish has been considered to be low (Güven et al., 2017), experimental studies have shown that the retention time can range from 6 h or 0.25 day in zebra fish (Danio rerio) (Batel et al., 2016) to 42 days in planktivorous fish (Acanthochromis polyacanthus) (Critchell and Hoogenboom, 2018), following the ingestion of MPs in feeding experiments. Based on the latter study, a kE of 0.024/d was assigned for planktivorus fish (anchovy, Pacific herring and Walleye pollock). For other fish species (e.g., shiner surfperch, dove sole, lingcod, halibut, sablefish, Pacific salmon), a plausible average retention time from these studies (Batel et al., 2016; Critchell and Hoogenboom, 2018) was used to derive kE (i.e., 0.047/d; Supplementary Table S1) given the lack of data on retention time for predatory and carnivorous fish.
For marine mammals, an elimination rate (kE) of 0.167/d (i.e., residence time ≈6 days) was derived from an exposure experimental study, in which the recovery of microbeads < 5 mm was observed in feces of captive gray seals (Halichoerus gryphus) at about 6 days following ingestion (Grellier and Hammond, 2006). This value was used as kE for the humpback and resident killer whales because gray seal are opportunistic feeders and mainly eat an extremely wide variety of fish (e.g., salmonids, pelagic fish, flatfish), crustaceans and cephalopods with regional and seasonal variations (Nilssen et al., 2019; Wilson and Hammond, 2019). In this context, it was uses as a proxy species with feeding habitats resembling those of humpback whale, which feed on zooplankton (krill) and pelagic forage fish (herring), and for fish-eating resident killer whale, which strongly rely on marine fish such as several species of Pacific salmon, halibut, sablefish, as well as squid, among other species.
The rationale to adopt this elimination rate is also postulated on the fact that MP abundance and retention is a function of the retention time in the monogastric stomach of pinnipeds or multi-chambered stomach of cetaceans, in both baleen whales (mysticetes) and toothed whales (odontocetes) rather than that in intestines. The cetacean multi-chambered stomach consisting of four compartments (i.e., a muscular forestomach or esophageal stomach, a main stomach or fundic chamber, the connecting channel and pyloric chamber or pylorous; see Horstmann, 2018) can serve as an entrapment compartment within the digestive tract, partially retaining the MPs, and explaining the delay in passage time and fecal elimination of MPs. In fact, the narrow opening of the connecting channel in close conjunction with the anatomical arrangement of the main stomach (resembling the omasum of ruminants to some degree) can function in food retention (Horstmann, 2018), making whales more susceptible to retain and accumulate MPs; and, thus vulnerable to plastic pollution in the oceans, particularly filter feeding mysticetes (Simmonds, 2012). In addition to fecal elimination, cetaceans, particularly odontocetes, are able to regurgitate foreign objects from the esophageal stomach (Mintzer et al., 2008; Levine et al., 2014).
In the light of this rationale to infer a plausible MP elimination rate value in these marine mammal species, based on the multiple-chamber anatomical configuration driving the passage/retention times of MPs throughout the GI tract in cetaceans, the application of a kE = 0.167/d is reasonable as a conservative value for the purpose of the modeling work.
MP Abiotic Data and Concentration Units
Microplastic data for abiotic compartments were available from empirical concentrations observed in water and sediments of Canada’s Pacific marine ecosystem, including offshore (west coast of Vancouver Island) and nearshore (Strait of Georgia in the Salish Sea) waters of British Columbia. Seawater concentrations of MPs (in particles/L) were available from Desforges et al. (2014) and Collicutt et al. (2019), while MP sediment concentration (in particles/kg dw) were obtained from Kazmiruk et al. (2018) and Collicutt et al. (2019) (see Supplementary Table S2). Information on the type and size of MP (e.g., microbeads, microfibers, and microfragments) found in those field studies is also reported in Supplementary Table S2.
As final units to quantify and for reporting the MP accumulation in marine organisms and projected concentrations from the foodweb bioaccumulation modeling, the MP concentration data (both predicted and observed) are mainly presented here as the mass (in g) of MP per mass of biota in kg (i.e., g/kg). Converting to units of mass is more appropriate than particles per individual (organism) as this conversion allows for comparisons among differently sized organisms and from different trophic levels.
The mass conversion for MPs was based on the three size classes of MPs (i.e., MP diameters in μm) observed in the Northeastern Pacific by Desforges et al. (2014) to estimate the volume of MP particles (as shown in Supplementary Table S3). Using this data, the mass was calculated as the product of the MP particle volume (VolumeMP) times the mean density (DensityMP) of 0.925 g/cm3, reported for most commonly found free-floating MPs, i.e., polypropylene (PP) and polyethylene (PE) (Van Cauwenberghe, 2015; Everaert et al., 2018), applying the calculation used by Everaert et al. (2018): MassMP = [DensityMP] × [VolumeMP]. Then, the calculated mean mass of MPs was used to convert the particle concentration units observed in sediment (particles/kg dw) and seawater (particles/L) to concentrations in mass units of g/kg dw and g/L, respectively (see Supplementary Table S3). Concentrations are also reported as (particles/kg) in biota, for comparison purposes.
Marine Foodweb Structure
The marine mammalian foodweb for the modeled ecosystem contains 24 species, including phytoplankton as a primary producer group, invertebrate species, including zooplankton, eight invertebrate species (i.e., two polychaete species, amphipod, Mysis shrimp, Crangon shrimp, Dungeness crab, blue mussel, Pacific oyster, squid), eleven fish species, and two marine mammal species (Supplementary Table S4). The diet composition matrix for these species basically represents the foodwebs of a filter feeding marine mammal (i.e., humpback whale) and an apex marine predators, the fish-eating or piscivorous resident killer whale (e.g., southern resident killer whale, SRKW). Sediment as a food source for some species groups is also included as basic input in the diet matrix (Supplementary Table S4). While several species are included in the foodweb bioaccumulation model, the modeling work is mainly focused on the foodwebs of the humpback whale (i.e., a short, filter feeding cetacean food web) and Chinook salmon-fish-eating resident killer whale (i.e., a larger, piscivorous-cetacean food web). The foodwebs for these marine mammal species were used as demonstrative foodwebs for the modeling work as data for representative species are available (Alava et al., 2012, 2018; Alava and Gobas, 2016).
The piscivorous-marine mammalian foodweb model is based on detailed studies that confirm that resident killer whales (O. orca) are fish-eating marine mammals with a strong preference for Chinook salmon (Oncorhynchus tshawytscha), the largest species of Pacific salmon (i.e., ≈50 kg) in the Pacific Northwest, accounting for >70% of the resident killer whales’ diet (Ford and Ellis, 2006; Ford et al., 2009b, 2010). Other fish species in the resident killer whales’ diet are halibut (H. stenolepis), sablefish (A. fimbria), lingcod (Ophiodon elongates) and several other species of Pacific salmon, including pink (Oncorhynchus gorbuscha), coho (O. kisutch), and chum (O. keta) salmon (Ford and Ellis, 2006; Ford et al., 2010). Chinook salmon spend the majority of their life in the open ocean (i.e., 5 years as oceanic adult stage), where they feed on forage fish such as Pacific herrings (Clupea pallasii) and squid (Gonatius) (Alava and Gobas, 2016).
The feeding preferences, diet and dietary uptake rates (kD) for the foodweb organisms were retrieved from previous modeling work (Alava et al., 2012, 2018; Alava and Gobas, 2016). For the humpback whale, the kD was calculated using data for diet composition (e.g., zooplankton and Pacific herring), feeding rate and population abundance in the Canadian Pacific, as reported elsewhere (Sigurjónsson and Víkingsson, 1997; Ford et al., 2009a; Fisheries and Oceans Canada, 2013). Briefly, based on the average weight of an adult humpback whale (i.e., ∼30,408 kg = 30,4 tons), the Canadian Pacific humpback whale population (2,145 animals; 95% CI: 1970–2331 individuals), and the annual consumption rate for the population (from 684,932 to 986,301 kg/day) inhabiting and foraging in the region, a plausible estimated average uptake rate of 0.013 (kg of prey/kg of individual humpback whale/day), ranging 0.011–0.014 (kg/kg/day), was yielded.
Foodweb Bioaccumulation Modeling Scenarios
To explore the bioaccumulation capacity of organisms and biomagnification in the foodweb, the model was run with the three scenarios using different MP concentration measured in abiotic compartments (seawater and sediments), as shown in Supplementary Table S2. Therefore, based on the documented data for the study region, three scenarios were modeled: (i) scenario 1: a low concentration scenario (i.e., water concentration = 0.66 particles/L; and sediment concentration = 60 particles/kg dw, which in units of mass are equivalent to 0.003 g/L and 0.266 g/kg dw, respectively); (ii) scenario 2: a moderate concentration scenario (i.e., water concentration = 2.08 particles/L; and sediment concentration = 200 particles/kg dw, equivalent to 0.010 g/L and 0.886 g/kg dw); and (iii) scenario 3: a high concentration scenario, i.e., water concentration = 9.18 particles/L; and sediment concentration = 25000 particles/kg dw, equivalent to 0.040 g/L and 111 g/kg dw (see Supplementary Table S2). The simulation time for the foodweb bioaccumulation model was run for different times series (e.g., 1–100 year) starting at 0 day with 5 days intervals (dt = 5).
Predator-Prey Biomagnification Factor (BMFTL)
To quantify biomagnification in predators (i.e., humpback whale, resident killer whale) relative to prey items (e.g., zooplankton, Pacific herring, Chinook salmon) and to investigate the effect of the magnitude of trophic level differences on the biomagnification index, the predator-prey biomagnification factor (BMF TL) was used for data interpretation in this modeling work. The criterion applied to indicate the capacity of MPs to biomagnify was a BMF TL > 1, while a BMFTL < 1 is an indication of lack of biomagnification capacity. If the BMF is statistically greater than 1, then it indicates that the MP is a probable bioaccumulative contaminant (Gobas et al., 2009). Following this approach, the concentration of MPs projected in selected predators was divided by predicted concentration in the prey. Thus, the model-based predator-prey biomagnification factor normalized to trophic position (i.e., BMFTROPHIC LEVEL: BMFTL) is calculated using the following equation (Borgå et al., 2004):
Where CPREDATOR and CPREY are the MP concentrations in the predator and prey, expressed in units of mass (g per kg of predator) and the concentration in prey (g per kg of prey); and, TL PREDATOR and TLPREY are the trophic levels of the predator and prey. The BMFTL values were used to measure biomagnification in the cetaceans’ food chain between two adjacent trophic levels (i.e., the difference in TL between predator and prey is small), assuming steady state in MP concentrations between predator and prey.
Trophic Magnification Factor
To further assess the MP biomagnification potential in an entire foodweb, the trophic magnification factor (TMF), a biomagnification metric that is often used to express the biomagnification of pollutants in an entire food-web (Borgå et al., 2012; Conder et al., 2012; Walters et al., 2016), was determined for each foodweb model simulations (i.e., scenarios 1, 2, and 3 with kE = 0.143/d for zooplankton). The TMF was calculated as the antilog of the regression slope (i.e., TMF = 10b, where b is the slope) of the linear regression between the log transformed concentrations of MPs predicted in organisms of the foodweb and their trophic level (TL) (i.e., Log [MP] = a + bTL).
The TMF (slope, b) was statistically evaluated using a significance level (α) of 0.05. A TMF > 1 (b > 0) indicates that the contaminant biomagnifies in the foodweb. A TMF < 1 (b < 0) indicates trophic dilution of the contaminants, while a TMF = 1 (b = 0) indicates no change in contaminant concentrations among organisms of a food web (Borgå et al., 2012).
Sensitivity Analysis
The sensitivity analysis was framed by comparing the changes of the different outcomes of MP concentrations projected in the food web organisms resulting from the experimentation with abiotic concentration scenarios (Supplementary Table S2): (i) changes from low (scenario 1) to moderate (scenario 2) abiotic concentrations; and, (ii) changes from low (scenario 1) to high (scenario 3) concentrations abiotic concentrations.
To further assess the sensitivity of the bioaccumulation capacity, the model was tested by changing values in a key parameter, the elimination rate (kE), in zooplankton as the fundamental trophic level for bottom–up uptake of microplastics in the foodweb by using two values of kE, based on the study by Cole et al. (2013), in combination with two abiotic concentration scenarios in water and sediment (scenarios 1 and 2): (i) from kE = 1/d to kE = 0.143/d at low concentrations in water and sediment, as a conservative scenario (scenario 1); and, (ii) from kE = 1/d to kE = 0.143/d at moderate abiotic concentrations in water and sediment, as a least conservative scenario (scenario 2). These scenarios were run each one at 1 and 100 years.
The sensitivity analysis is aimed to assess the impact of variability and/or error in the model’s parameters (e.g., elimination rate constant, kE) on the model outcome (i.e., prediction or projections). The sensitivity analysis is useful in determining the effect that errors in model state parameters may have on the model outcome (Alava et al., 2012; Alava and Gobas, 2016; Alava et al., 2018). Sensitive parameters are parameters that have a relatively large impact on the model outcome, i.e., a small change in the value of the parameters (kE) produces a relatively large change in the model outcome. A less sensitive parameters is a parameter that causes a relatively small change in model outcome given the same change in the value of the parameters. The sensitivity analysis can therefore provide valuable insights into the selection of the parameters that need to be included in the analysis and the relative importance of important parameters of the model (Alava et al., 2012; Alava and Gobas, 2016; Alava et al., 2018). This is useful in the analysis of the internal mechanics of the model. It can be used to characterize potential errors in the model and to develop a better understanding of the model.
Model Bias Analysis
A model bias (MB) approach was applied to assess the performance of the foodweb model and corroborate the projections of MPs under the three abiotic concentrations’ scenarios. Despite the limited empirical data of MP concentrations in most of the organisms composing the food web, the performance of the model was analyzed in terms of the model bias ratio: MB = CBP,i MP/CBO, iMP; where CBP,i MP and CBO,i MP are the model calculated and observed MP concentrations in species I, respectively. This analysis was done by comparing the projected MP concentrations in wild juvenile Chinook salmon to the observed MP data reported for this species in coastal BC.
Thus, the MP mean concentration (i.e., mean ± SD: 1.2 ± 1.4 microplastics/individual) for wild Chinook salmon from the east coast of Vancouver Island reported by Collicutt et al. (2019) was used as empirical data. This concentration reported in MP/organism is equivalent to ∼0.890 g/kg (∼1.0 g/kg), using a MP mean mass of 0.00443 g (Supplementary Table S3), and a mean wet weight for juvenile Chinook salmon of 6.01 g (∼0.006 kg) documented in Collicutt et al. (2019). The MB ratio can indicate the model’s systematic over-prediction (MB > 1) or under-prediction (MB < 1) of the concentrations of a chemical contaminant in biota (Alava et al., 2012, 2018).
Microplastic data observed in zooplankton of the Northeastern Pacific exist and have been reported as encounter rates from ingestion, ranging 1 particle/34 copepods (i.e., 0.03 particle/copepod) to 1 particle/17 euphausiids, i.e., 0.06 particle/euphausiid (Desforges et al., 2015). While the conversion of particles (MPs) to unit of mass (g) is possible (i.e., 1.3 × 10–04 g/copepod; and 2.7 × 10–04 g/euphausiid) as aforementioned earlier, the uncertainty and variability in the mass or fresh body weight within copepod and euphausiid species challenge and preclude the application of the MB (in units of g/kg) to corroborate the outcomes of the model for zooplankton.
Results and Discussion
Microplastic Bioaccumulation
The model projections for MP concentrations in marine organisms (g/kg) of the marine mammalian foodweb are shown as a function of exposure time for low, moderate and high MP concentration scenarios in Figure 1. The gradual and, subsequent rapid bioaccumulation in zooplankton, as the entry point for microplastics in the foodweb, was directly predicted from the uptake of MP concentration from the water as a function of BCF, where BCF = k1/k2, until reaching steady state at either relatively low (i.e., accumulation of 0.01 g/kg or 1.8 particles/kg), or moderate (i.e., 0.025 g/kg or ∼6.0 particles/kg), and high (i.e., up to 0.11 g/kg or 25 particles/kg) abiotic concentration scenarios (Figures 1A–C).
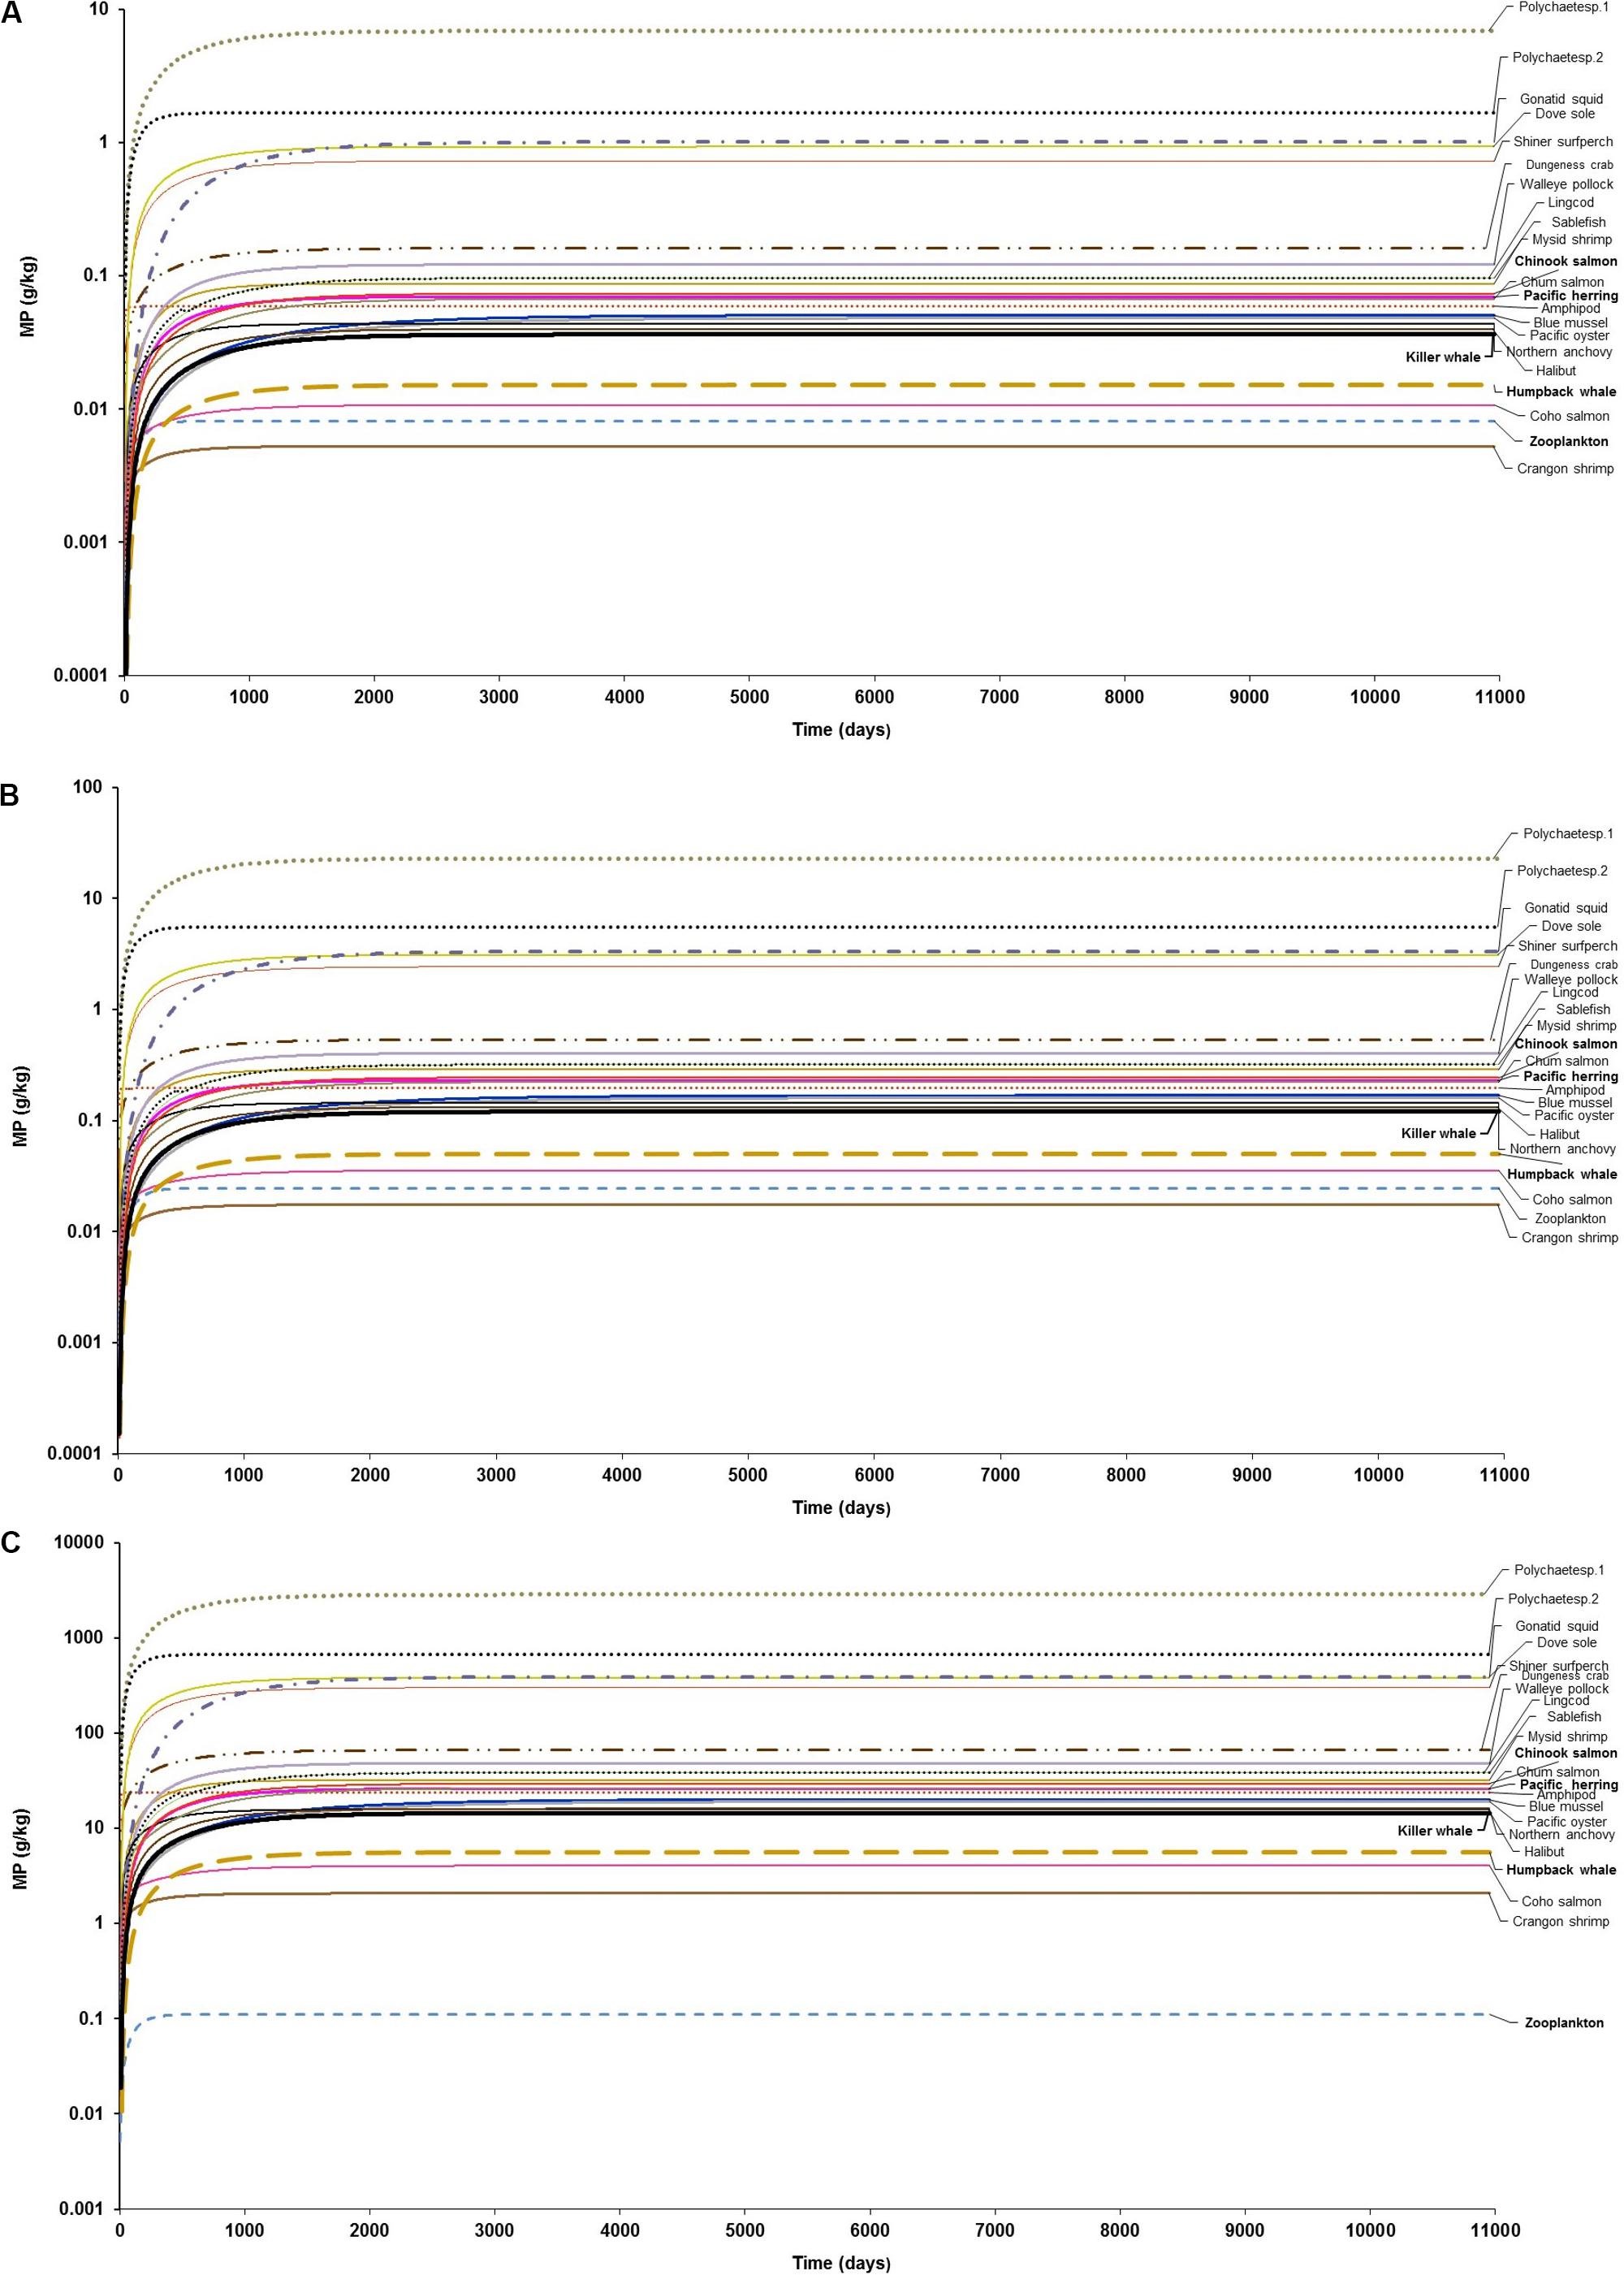
Figure 1. Foodweb model simulations showing the projections of microplastics (MPs) bioaccumulation in organisms of the marine mammalian food web for the three abiotic concentration scenarios: (A) low concentration (scenario 1): seawater = [0.003 g/L] and sediment = [0.266 g/kg dw], based on the empirical data by Collicutt et al. (2019); (B) moderate concentration (scenario 2): seawater = [0.010 g/L]; and, sediment = [0.886 g/kg dw], based on the empirical data by Desforges et al. (2014) and Kazmiruk et al. (2018); and (C) high concentration (scenario 3): seawater = [0.04 g/L]; an, sediment = [111 g/kg dw], based on the empirical data by Desforges et al. (2014) and Kazmiruk et al. (2018). The simulations for the bioaccumulation include the elimination rates, and growth dilution for most organisms based on the literature reported elsewhere (see Supplementary Table S1). For zooplankton, as the key trophic level for the initial uptake of microplastics a kE = 0.143/d (i.e., retention time = 7 days) was used as a least conservative scenario, based on the study by Cole et al. (2013).
Bivalves exhibited MP concentrations of 0.05 g/kg (11 particles/kg) and 0.20 g/kg (36–38 particles/kg) under low (scenario 1) and moderate (scenario 2) abiotic concentrations at steady state, respectively (Figures 1A,B and Supplementary Figures S2A,B). While concentrations of MPs are lower in both blue mussels and Pacific oysters (>0.04g/kg or ∼1.0 particle/kg) under scenario 1 at 100 d, MP concentrations in these bivalves are the lowest at 5 days, i.e., 0.0002 g/kg or 0.2 mg/kg (0.05–0.1 particles/kg). For scenario 3 (high abiotic concentrations), the MP concentration in these bivalve species are much higher, reaching ∼20 g/kg (>4300 particles/kg) in the long-term (Figure 1C and Supplementary Figure S1C). In general, bivalves have been considered to be among the most susceptible invertebrate taxa to ingest significantly more MPs than any other suspension and filter feeders (Setälä et al., 2016). Conversely, the uptake and ingestion of MPs through filter-feeding in bivalves such as blue mussels is counterbalanced by rejection and elimination via pseudofaeces and feces, respectively (Dimitrijevic, 2018; Woods et al., 2018).
The projected bioaccumulation of MPs in other invertebrates, including detritivore polychaetes and squid is remarkably high in comparison to other benthic invertebrates such as filter and suspension feeders (bivalves: blue mussel, Pacific oyster; and crustaceans: amphipods, shrimps, and crabs), mid-trophic level planktivorous fish (Pacific herring, Northern anchovy, walleye Pollock) and even upper trophic level organisms such as predatory fish (e.g., lingcod, sablefish, halibut, Pacific salmon) and cetaceans (Figure 1 and Supplementary Figures S2, S3). Projected concentrations in benthic polychaetes at steady state ranged from >2 to 7 g/kg (377 to >1500 particles/kg) for scenario 1 and from 670 to 2860 g/kg for scenario 3 (Supplementary Figure S2). Within the initial simulation time (>5–10 days) in scenario 1, the concentrations in polychaetes, however, are the lowest ones, i.e., >0.1 g/kg (>16–30 particles/kg).
The predicted concentrations in polychaetes are a plausible outcome as these suspension and/or deposit feeders predominantly rely on sediments or detritus as a food source, being exposed to MP-contaminated sediment and accumulating considerable amounts of MPs (Besseling et al., 2013; Setälä et al., 2014; Lusher, 2015). In some cases, polychaetes can even function as sinks of MPs (Nel and Froneman, 2018). Likewise, some squid species (i.e., Humboldt squid, Dosidicus gigas) have been found to contain plastic pellets ingested either from the water column (sunken particles) or contaminated diet (Braid et al., 2012; Lusher, 2015), indicating the susceptibility to ingest MPs. It is still unclear the magnitude of MP accumulation and elimination in cephalopod species.
The projections for the bioaccumulation of MP at steady state in fish revealed that predicted concentrations ranged from 0.01 g/kg (2 particles/kg) in coho salmon (O. kisutch) to ∼1.0 g/kg (210 particles/kg) in dove sole (Microstomus pacificus) under scenario 1, while the concentrations in the same species under scenario 3 were of 4.0 g/kg (900 particles/kg) and 385 g/kg (86800 particles/kg), respectively (Figures 1A–C and Supplementary Figure S3). In demersal fish, for example, the MP concentration predicted in halibut (H. stenolepis) were of 0.04 g/kg (9 particles/kg) and 16 g/kg (∼3600 particles/kg), and in sablefish (A. fimbria) of 0.10 g/kg (22 particles/kg) and 39g/kg (∼8700 particles/kg) at scenarios 1 and 3, respectively. In zooplanktivorous fish such Pacific herring (C. pallasi) and Walleye Pollock (Theragra chalcogramma), the corresponding predicted MP concentration were of 0.07 g/kg (16 particles/kg) and 0.12 g/kg (27 particles/kg) at scenario 1; and of 26 g/kg (>5890 particles/kg) and 48 g/kg (>10900) under scenario 3 (Figures 1A–C and Supplementary Figure S3). These outcomes highlights varying dietary exposure and accumulation of MPs in fish as a function of species-specific uptake and elimination rates in the GI tract, as well as feeding habits (i.e., pelagic, zooplanktivorous fish versus demersal, bottom feeders and carnivorous fish).
Amongst predators, the model shows that cetaceans can potentially accumulate MPs through trophic transfer from prey. However, the level of bioaccumulation in the fish-eating killer whale is in general of comparable magnitude or, in a few cases, one order of magnitude lower compared to its main prey (Pacific salmon, mainly Chinook salmon) within 365 days of simulation in each scenario (Figures 2A–C). In the long-term, the magnitude of the accumulation appears to be consistently similar in both predator and prey until reaching steady state on every abiotic concentration scenario (Figures 1A–C). For instance, the killer whale can apparently accumulate 0.02 and 0.05 g/kg (4–12 particles/kg) from diet’s trophic transfer (0.035 and 0.11 g/kg equivalent to 8 and 26 particles/kg in Chinook salmon) at 365 days, assuming scenarios 1 and 2, respectively (Figures 2A,B). The maximum MP concentration in killer whales at 365 days is projected to be 6.0 g/kg (>1400 particles/kg) in scenario 3 (Figure 2C), but reaching up to 14.5 g/kg (>3200 particles/kg) at steady state (Figure 1C) due to the continued exposure to highly contaminated Chinook salmon, i.e., 14 g/kg (∼3000 particles/kg) to 30 g/kg (>6600 particles/kg), respectively.
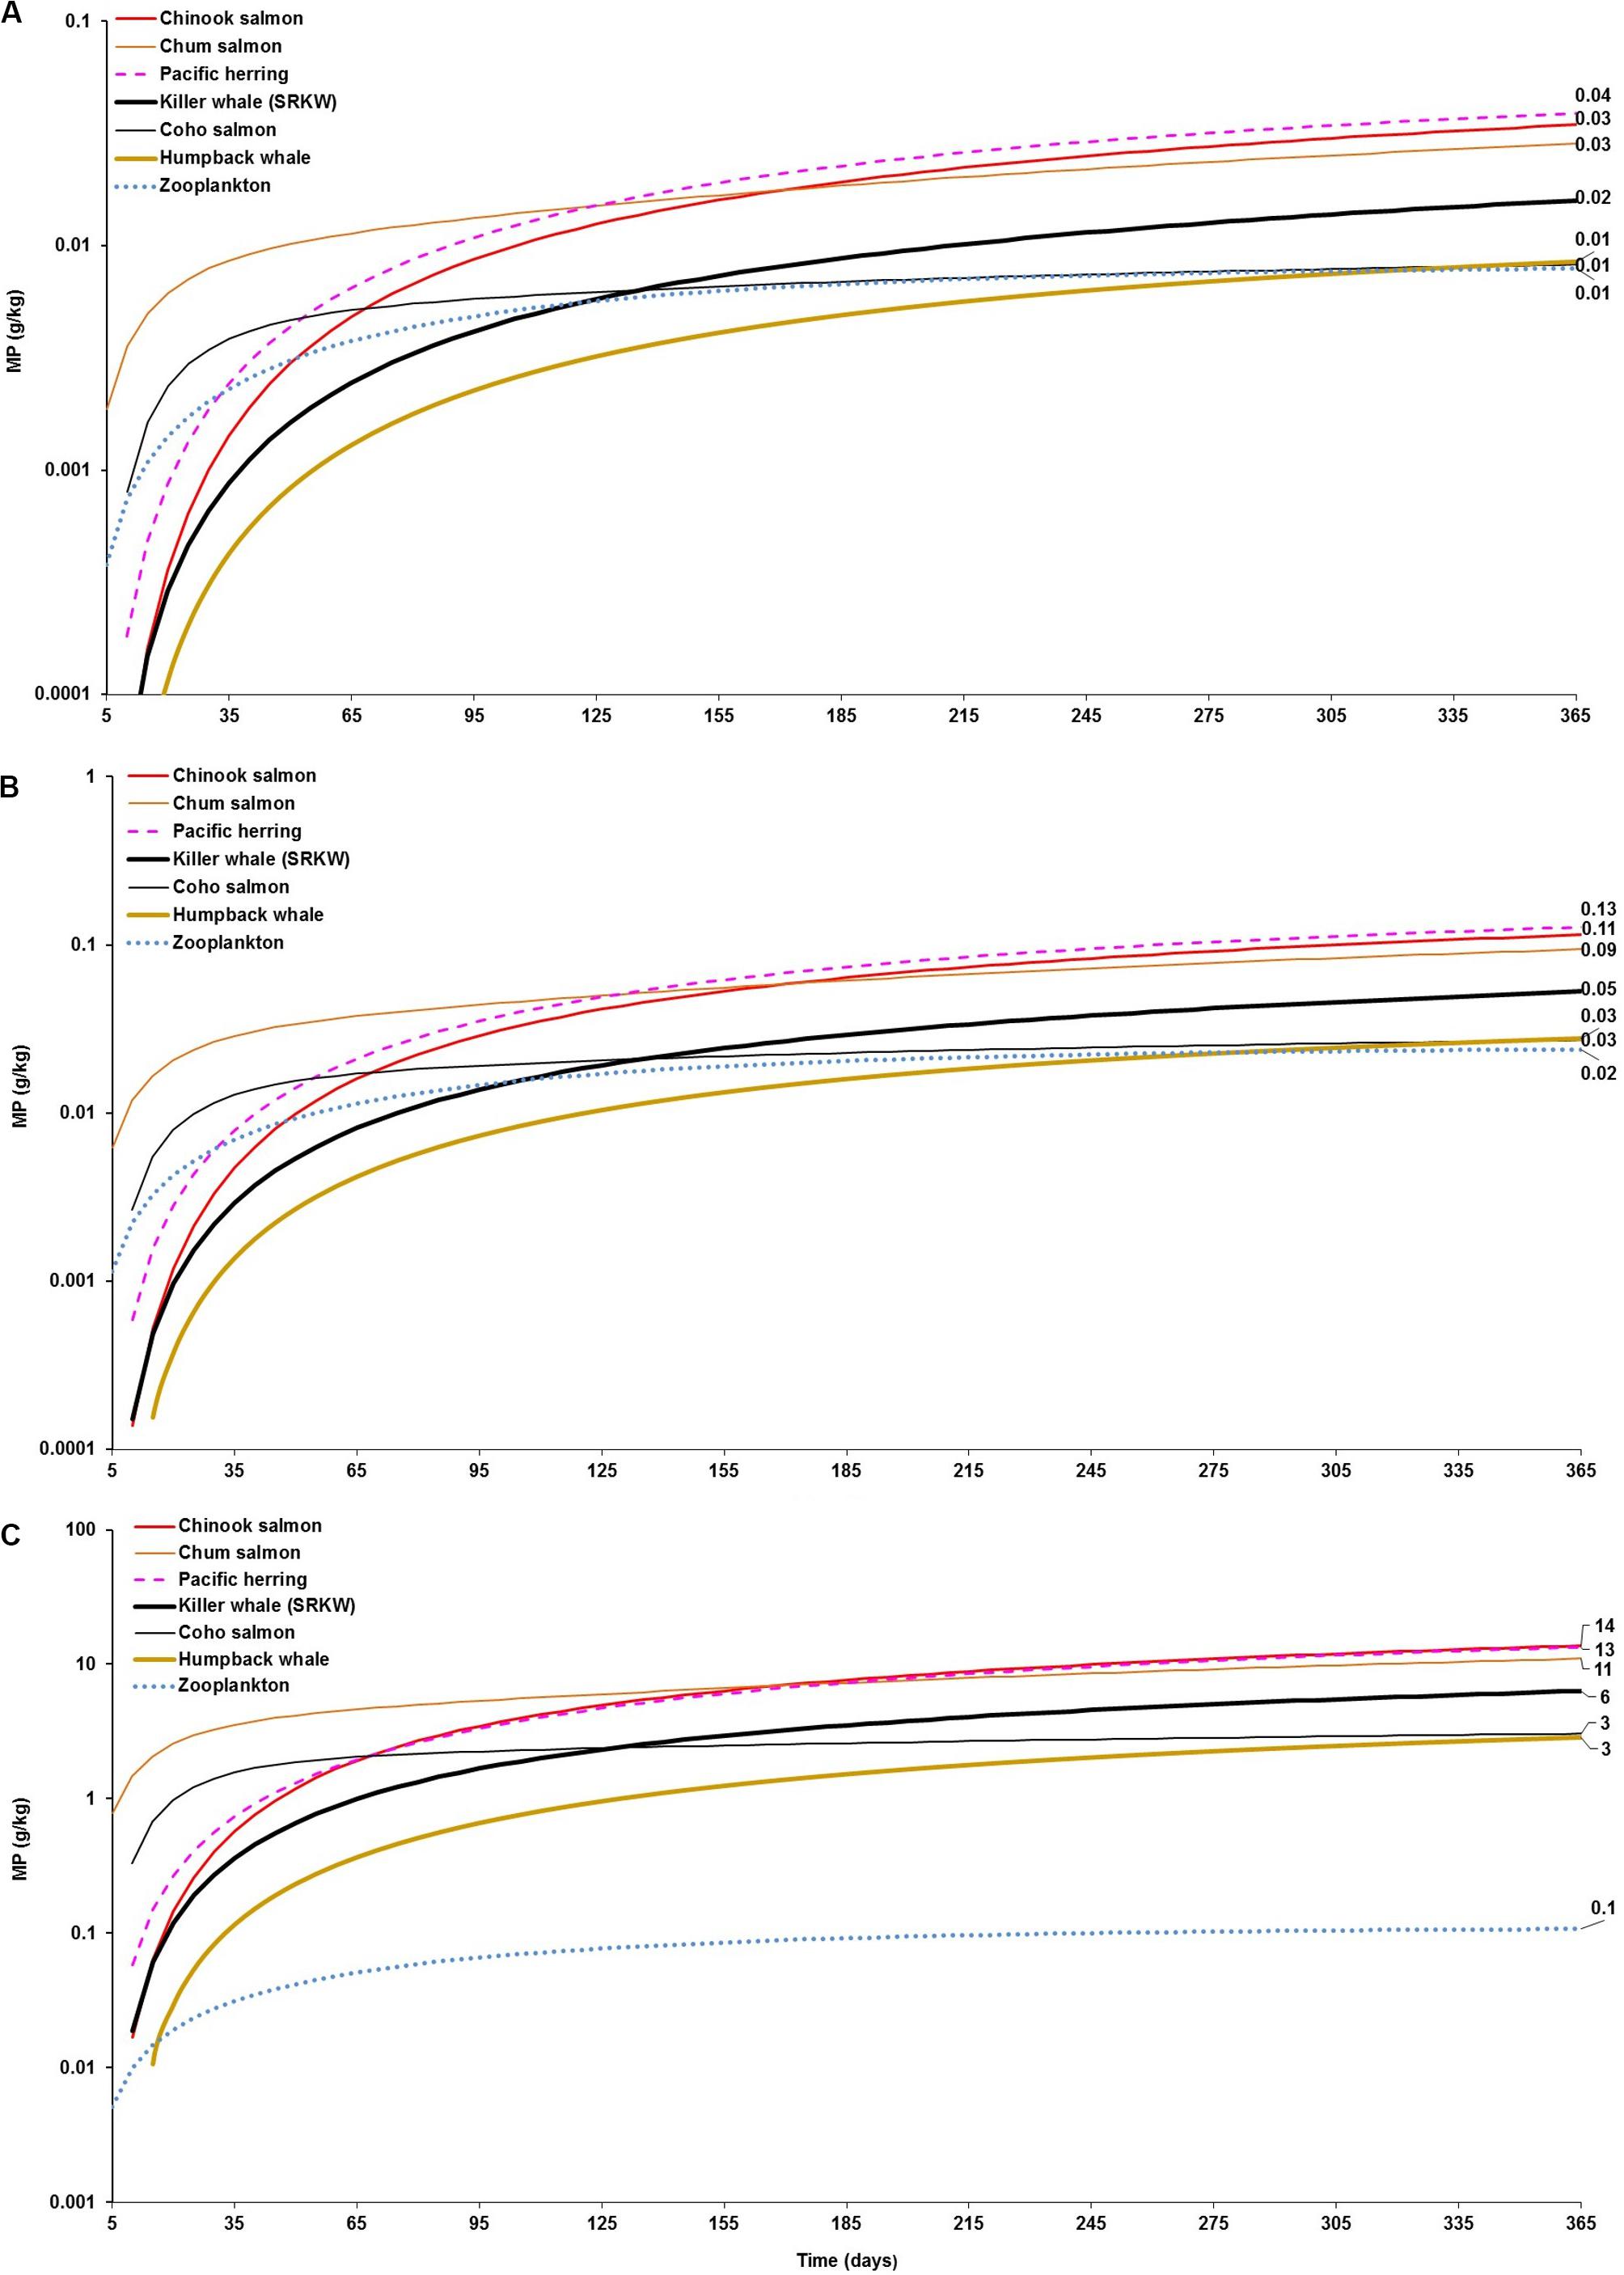
Figure 2. Foodweb model simulations showing the projections of microplastics (MPs) bioaccumulation in the cetaceans’ food webs (filter feeding humpback whale and fish-eating killer whale food webs) for the three abiotic concentration scenarios: (A) low concentration (scenario 1): seawater = [0.003 g/L]; and, sediment = [0.266 g/kg dw]; (B) moderate concentration (scenario 2): seawater = [0.010 g/L]; and, sediment = [0.886 g/kg dw]; and (C) high concentration (scenario 3): seawater = [0.04 g/L]; and, sediment = [111 g/kg dw]. The simulations for the bioaccumulation include the elimination rates, and growth dilution for most organisms based on the literature reported elsewhere (see Supplementary Table S1). For zooplankton, as the key trophic level for the initial uptake of microplastics a kE = 0.143/d (i.e., retention time = 7 days) was used as a least conservative scenario, based on the study by Cole et al. (2013).
Comparably, while the bioaccumulation potential of MPs in the humpback whale is similar or slightly over (0.01–0.03 g/kg or ∼2–6 particles/kg) to that projected in zooplankton (0.01–0.02 g/kg or ∼2–5 particles/kg), it is lower than the bioaccumulation predicted in Pacific herring (0.04–0.13 g/kg or 9 to ∼30 particle/kg) near to 1 year of simulation under scenario 1 and scenario 2, respectively (Figures 2A,B). In scenario 3, the bioaccumulation of MPs in humpback whale is one order of magnitude higher than that of zooplankton (i.e., 3 g/kg or 646 particles/kg versus 0.11g/kg or 24 particles/kg, respectively), but still one order of magnitude lower than the bioaccumulation projected in herring, i.e., 13 g/kg (∼3000 particles/kg) (Figure 2C). This scenario outcome can be explained to the high exposure to MP seawater concentration for zooplankton in tandem with the high dietary uptake and a slow elimination rate in the baleen whale relative to herring.
The foodweb model outcomes indicate that the accumulation of MPs is also fundamentally driven by the empirical concentration of MPs measured in seawater and sediments (input data) in the studied region (see also sensitivity analysis subsection). Thus, in the model, changes in concentrations were tested as a preliminary sensitivity analysis in these abiotic compartments, from low (scenario 1) to moderate (scenario 2) abiotic concentrations of MPs. The changes showed an increase in average concentration of 70% in all organisms of the food web, ranging from 67% in zooplankton to 70% in killer what either 1 or 100 years of simulation (Supplementary Figures S4A, S5A). Considering the plausible changes from low (scenario 1) to high (scenario 3) MP concentrations, the increase in concentration in marine biota is close to 100%, except for zooplankton, showing an average increase of 93% (Supplementary Figures S3B, S4B). These scenarios demonstrate that the response of the exposed organisms of the foodweb model is very sensitive to MP concentration changes in abiotic matrices, highlighting the role of water and sediment as sources for MP uptake and trophic transfer to the food web.
Foodweb bioaccumulation models for bioaccumulative pollutants such as polychlorinated biphenyls (PCBs) and radiocesium (137δCs) have also demonstrated the influence of and sensitivity to abiotic concentrations in seawater and sediments, as environmental compartments (e.g., sources and sinks) driving critical changes in the bioaccumulation behavior of these contaminants in cetaceans’ foodwebs (Alava et al., 2012; Alava and Gobas, 2016).
Microplastic Biomagnification Factors in Top Predators
The model projected various levels of biomagnification factors for MPs in the food web, with variable sensitivities among predator-prey relationships. While the projected biomagnification potential for the top predator (e.g., BMFTL = fish-eating resident killer whale/Chinook salmon) appears to be lacking (BMFTL < 1) over time regardless of the concentration scenarios and zooplankton elimination rates tested, minor magnification (BMFTL, ranging 1.10–1.12) does occur at one time step, i.e., at 10 days (Figure 3). Comparably, the BMFTL for the humpback whale/Pacific herring relationship, basically remains unaffected (BMFTL < 1) at scenarios 1 and 3 with either low or high elimination rates in zooplankton (Figures 3A–D). In contrast, important changes are predicted for the BMFTL of the Humpback whale/zooplankton and herring/zooplankton relationships, both with BMFTL > 1 in scenarios 1 and 3. For these predator-prey relationships, scenario 3 exhibited BMFTL one to two orders of magnitude higher (Figures 3B,C) compared to the scenario 1, respectively (Figure 3A). A fast elimination rate in zooplankton (kE = 1.0/d) augmented the BMFTL in scenario 3 (Figure 3C) by three orders of magnitude in the Pacific herring/zooplankton relationship relative to the scenario 1 with a slow kE (0.143/d). The projections of the BMFTL in adjacent trophic levels from the short filter-feeding foodweb (i.e., zooplankton –Pacific herring; and, zooplankton –humpback whale) indicates the rapid response and sensitivity by these predator-prey relationships to high changes in water concentration.
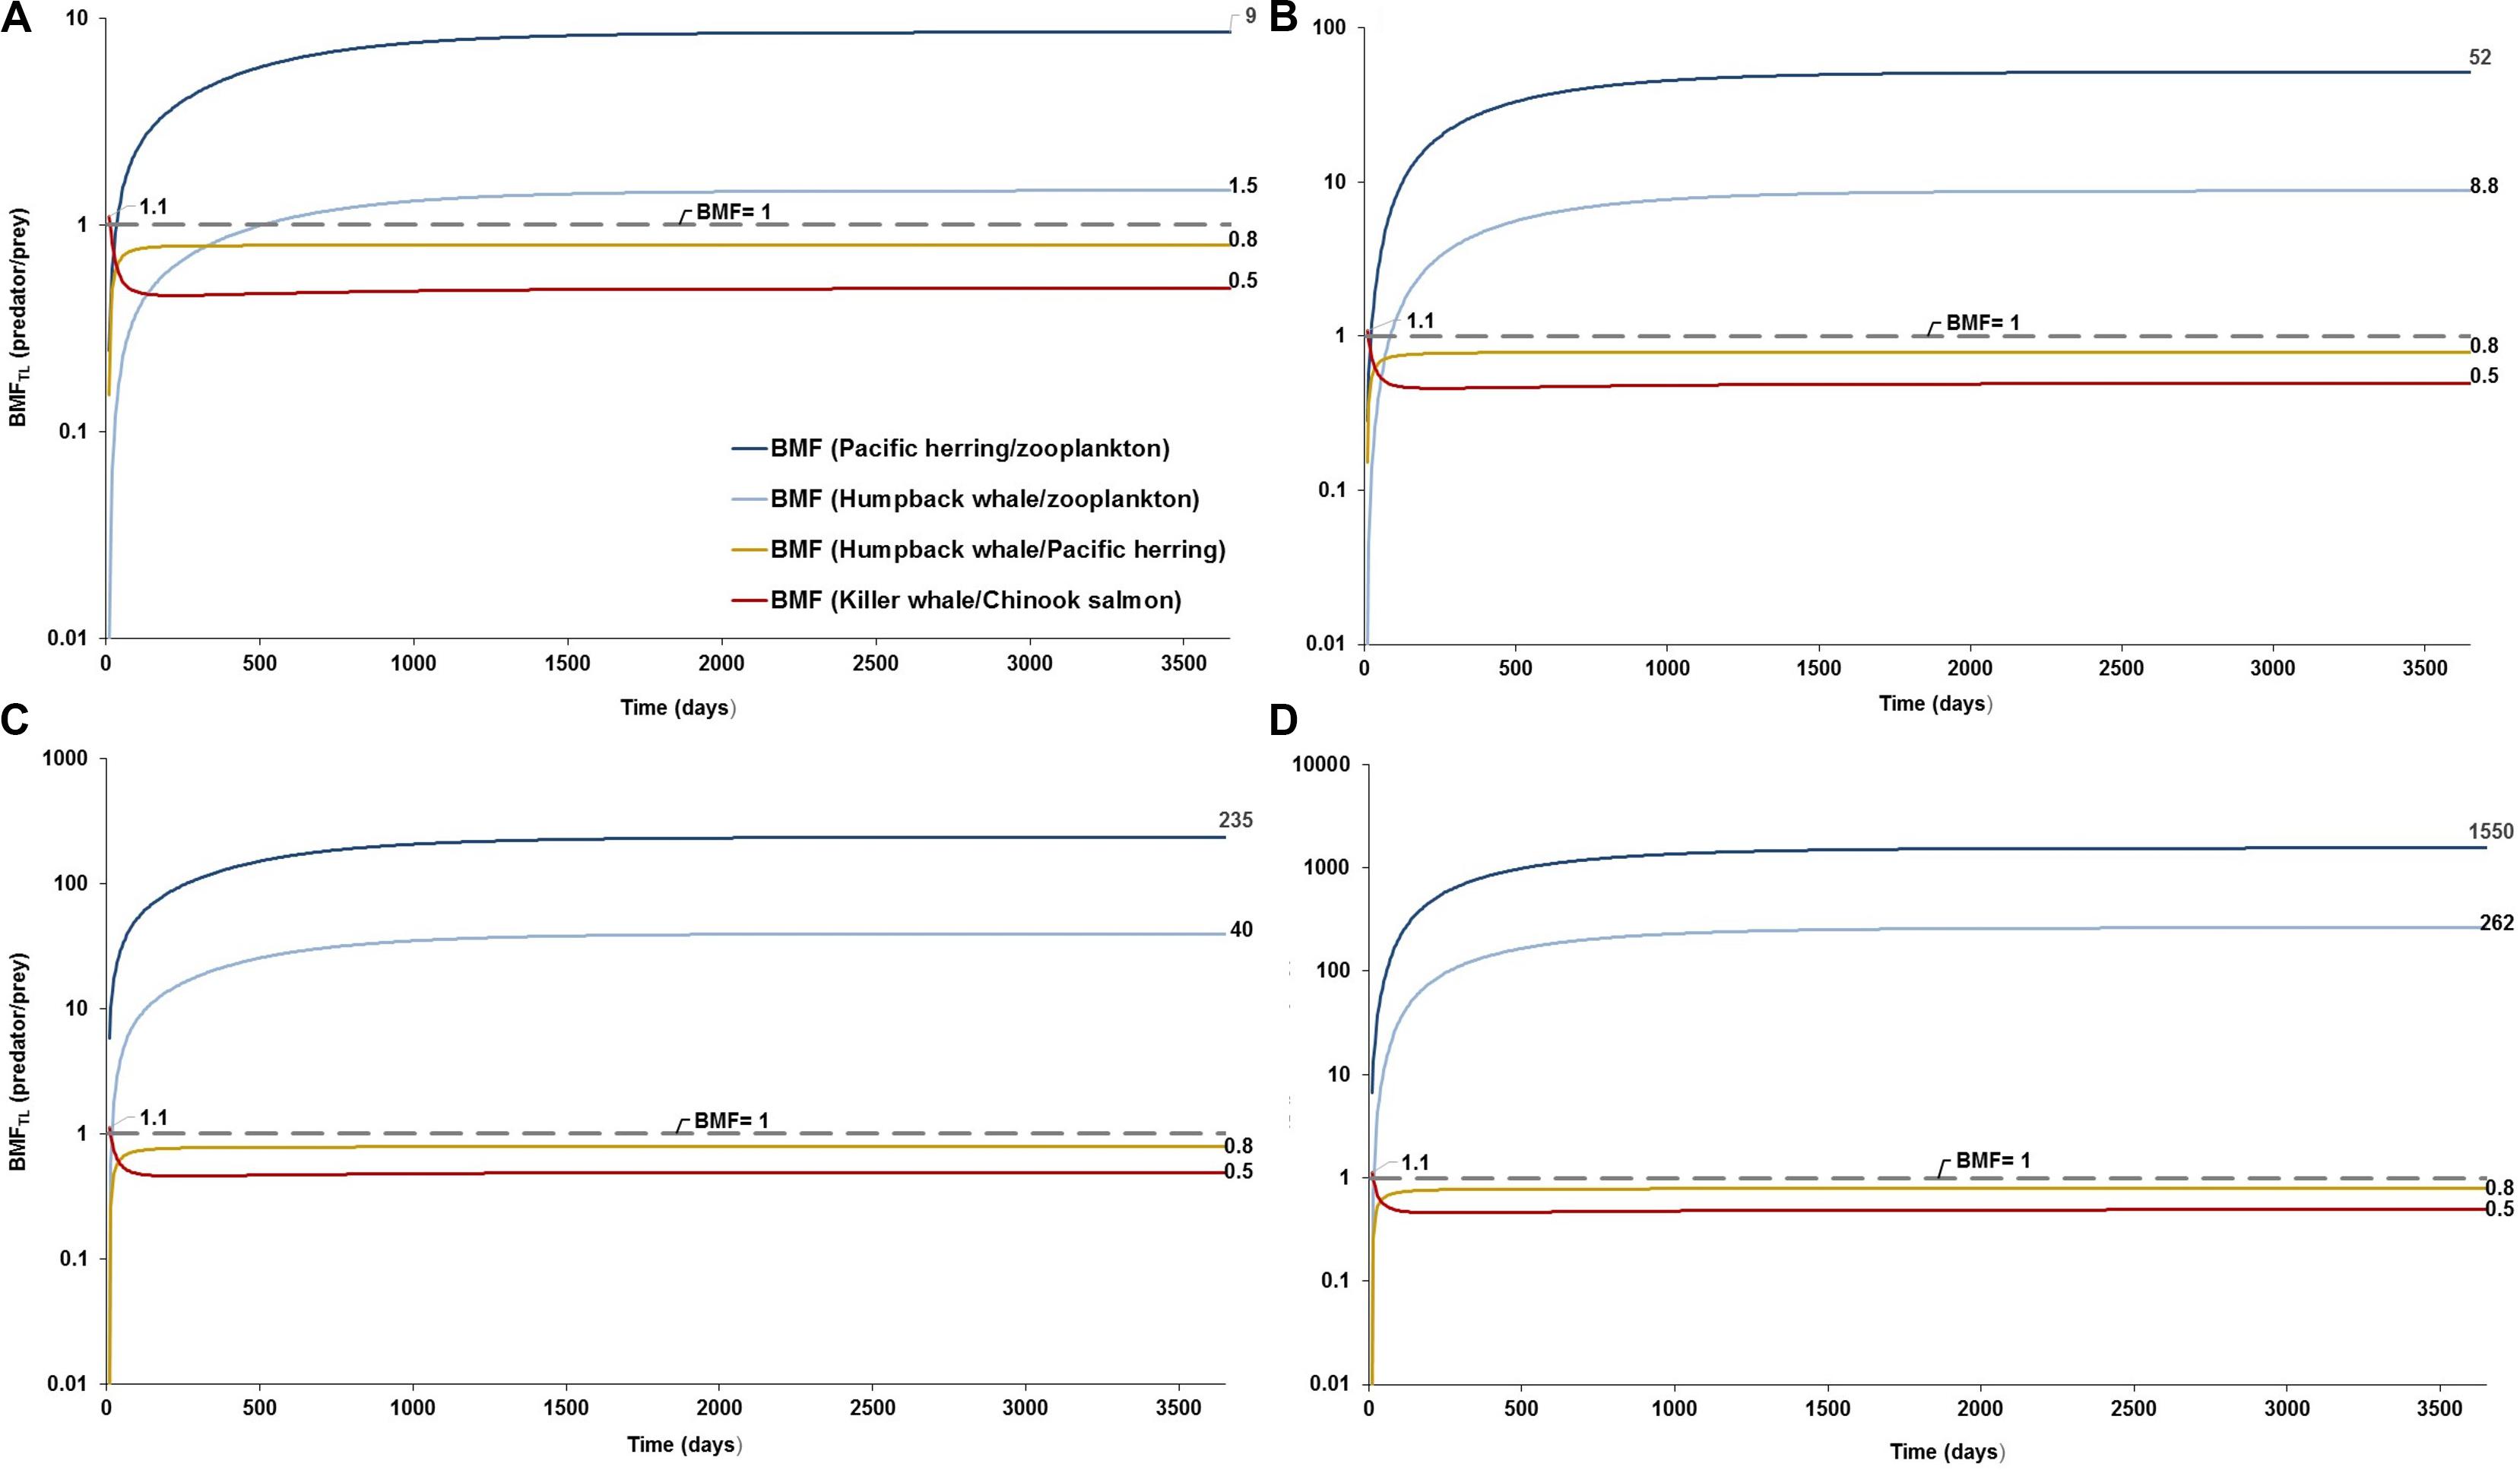
Figure 3. Predator-prey biomagnification factor adjusted to the difference of trophic levels (BMFTL) and testing elimination rates based on the study by Cole et al. (2013): (A) BMFTL simulation with a low elimination rate of kE = 0.143/d at low concentrations in seawater and sediment (scenario 1: 0.003 g/L; and 0.266 g/kg dw, respectively) as a conservative scenario; (B) BMFTL simulation with a high elimination rate of kE = 1/d at low scenario 1 as a least conservative scenario; (C) BMFTL simulation with a kE = 0.143/d at high concentrations in water and sediment (scenario 3: 0.04 g/L; and 111 g/kg dw, respectively) as a conservative scenario; and (D) BMFTL simulation with a kE = 1/d at scenario 3, as a least conservative scenario (scenario 2). Dashed line represents equal partitioning or distribution of MP concentrations (BMFTL = 1) between predator and prey.
The ambiguity on BMF values in the model projection is likely to be driven by the relative bioaccumulation of MPs in the top predator as a function of the gradual net accumulation, resulting from the intake rate of contaminated prey and low elimination rates (i.e., high retention/residence time of MPs in GI tract). This accumulation process is followed by constant elimination of MPs (i.e., low retention time) from the predator against the high bioaccumulation in the prey, exhibiting simultaneous slow elimination (see BMFTL for humpback whale/Pacific herring and resident killer whale/Chinook salmon relationships in Figures 3A–C).
Trophic Magnification Factor Assessment
The projected changes in concentrations of MP in the marine mammalian foodweb as a function of trophic level (TL) are illustrated in Figures 4, 5 under low and high abiotic concentrations (i.e., scenarios 1 and 3), respectively. Projections under scenario 2 (moderate abiotic concentrations) are shown in Supplementary Figure S5. Trophic magnification factors (TMFs) and regression data for selected simulation time periods for each scenario are shown in Tables 1, 2. Both lack of apparent trophic biomagnification (TMF = 1) and trophic dilution (TMF < 1) are predicted during the simulation time from 5 to 36500 days (Figures 4, 5, Supplementary Figure S6, and Tables 1, 2). Negative significant relationships (i.e., trophic dilution) are predicted from 10 to 60 days under scenarios 1 and 2 (TMF < 1, p < 0.05; Figures 4B–D, Supplementary Figure S6, and Table 1). Trophic dilution (TMF < 1, p < 0.05) is also predicted under scenario 3 at 10 and 15 days (Figure 5B and Table 1). The TMF projections at scenario 2 (Supplementary Figure S6) exhibited similar linear regression trends to those predicted under scenario 1 (Tables 1, 2).
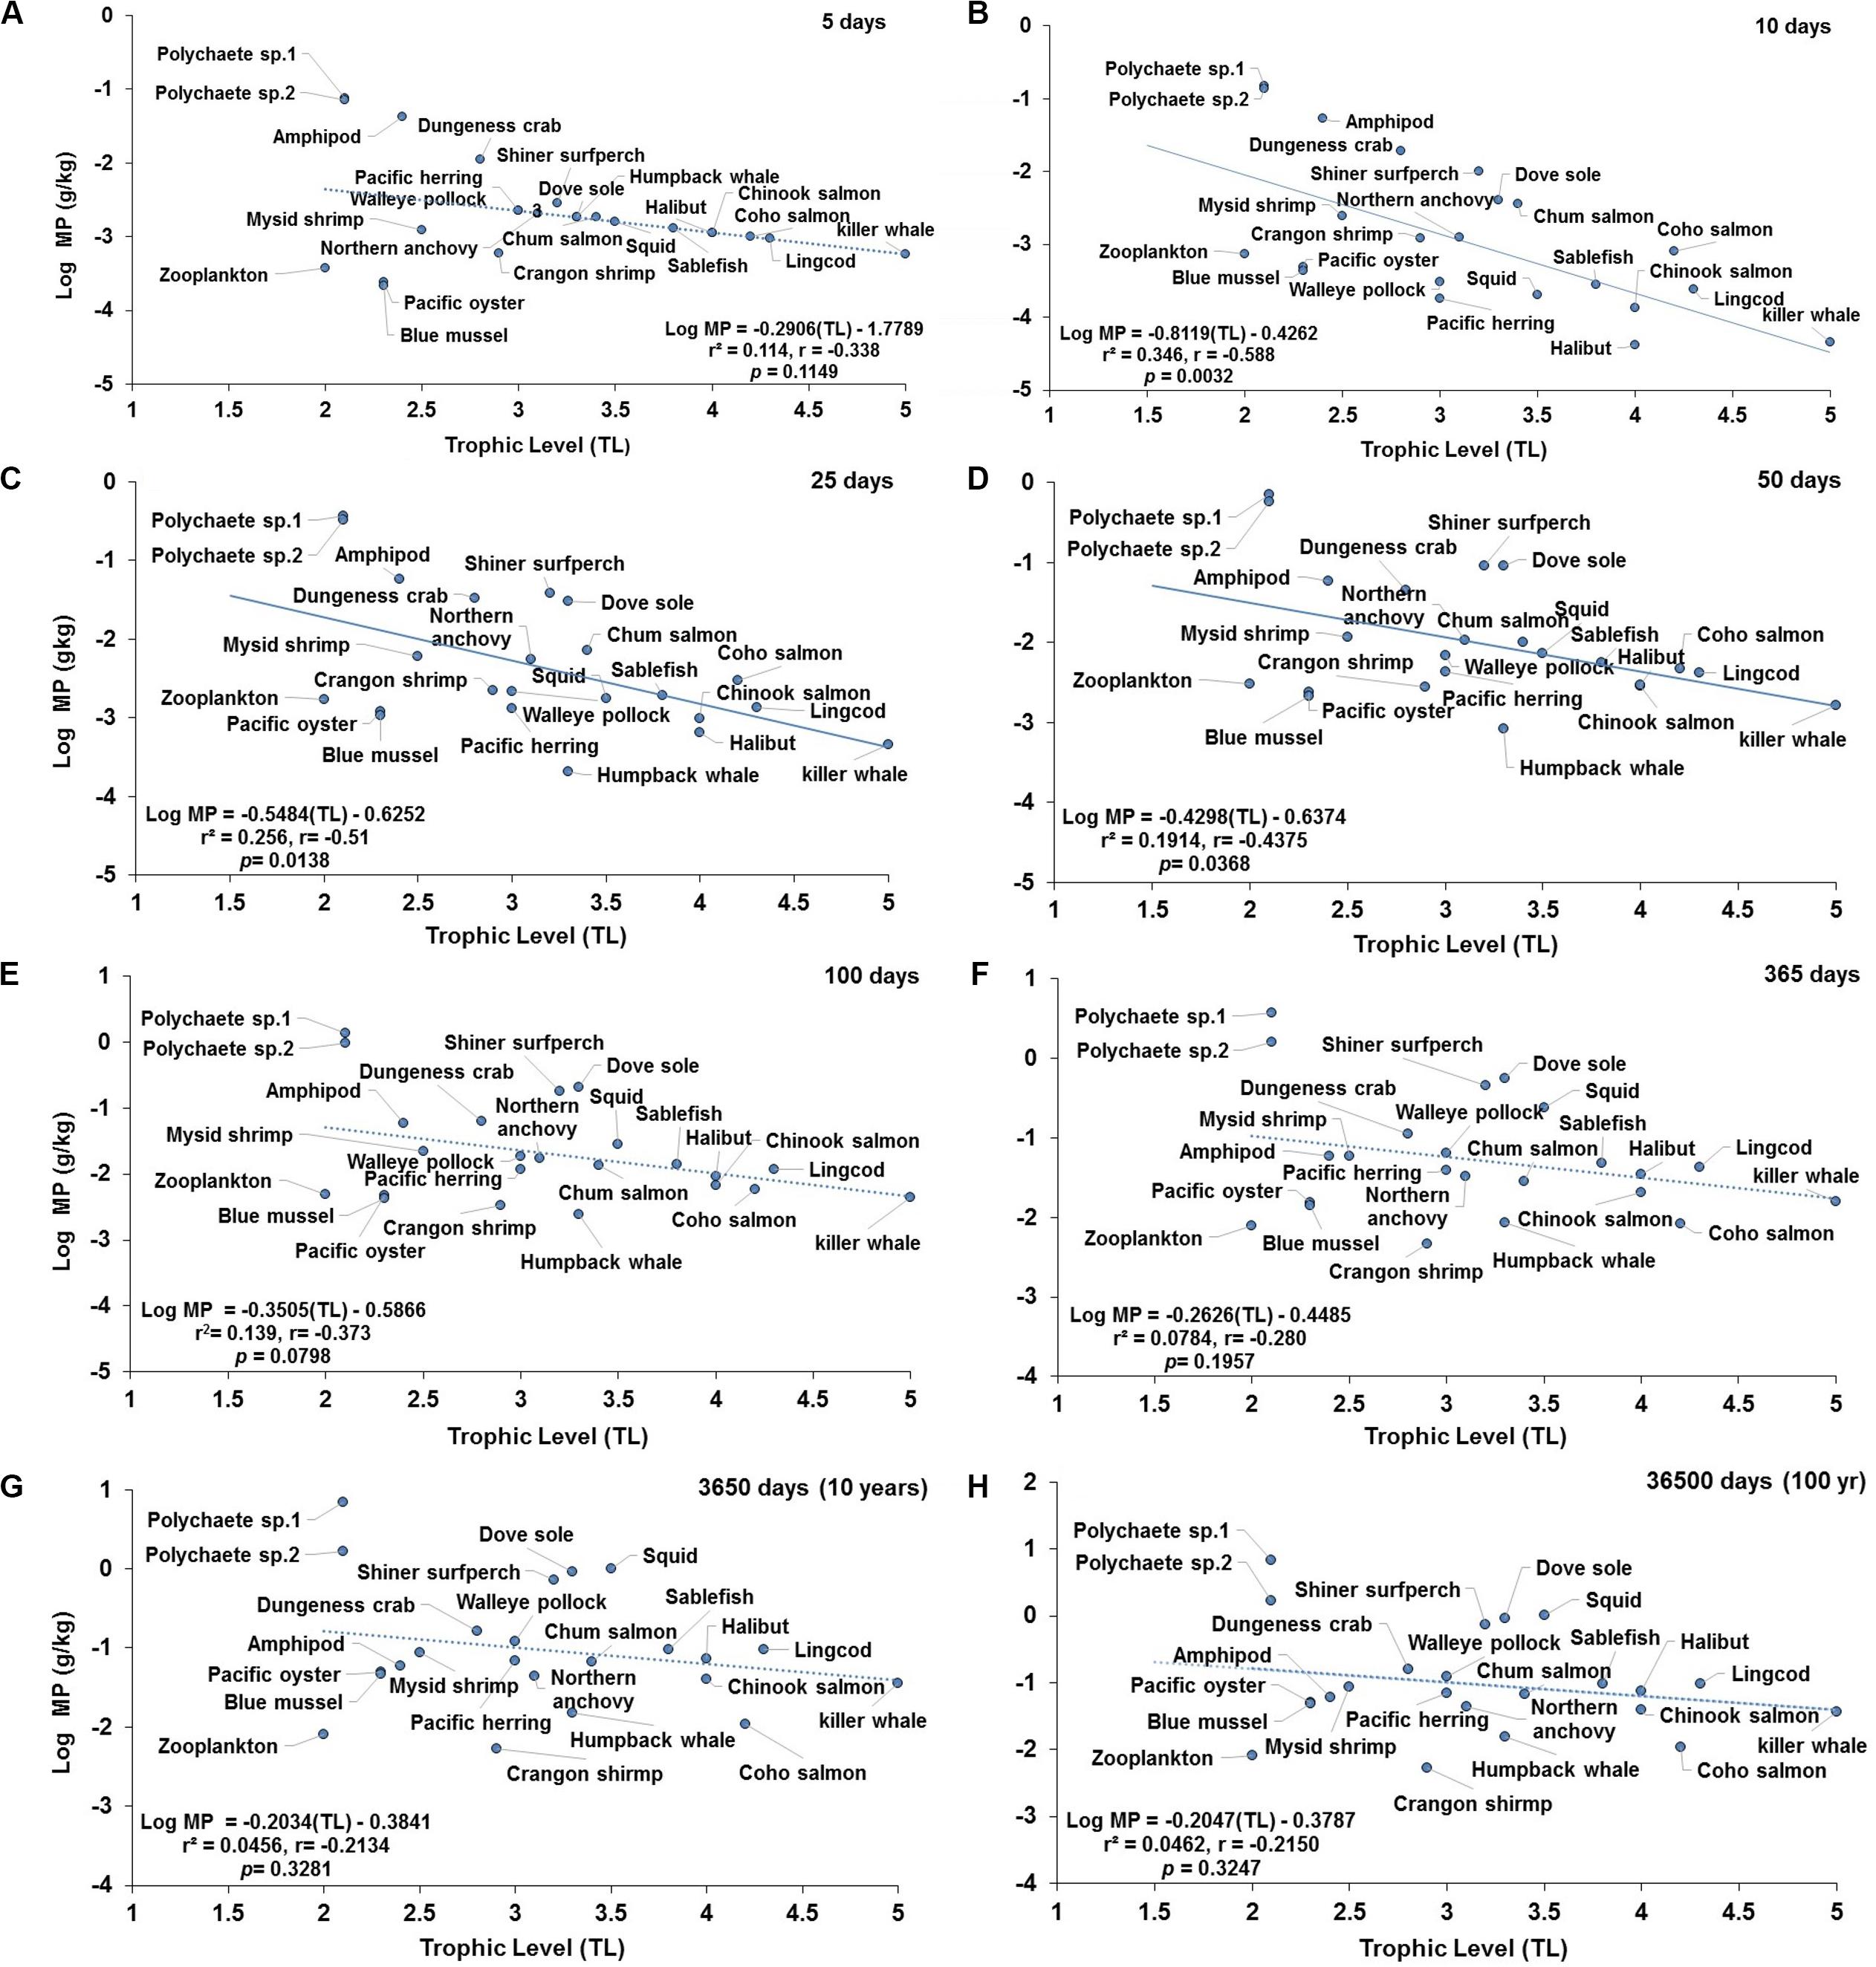
Figure 4. Projections of the apparent trophic magnification factor (TMF) as a function of predicted concentration of microplastics (MPs) versus trophic level (TL) in the cetaceans’ food web of the Northeastern Pacific for simulations under a scenario of low abiotic concentrations (scenario 1: seawater = [0.003 particles/L]; and sediment = [0.266 g/kg dw] at: (A) 5 days (lack of significant relationship); (B) 10 days (regression line indicates a strong negative, significant relationship); (C) 25 days (regression line indicates a moderate and negative, significant relationship); (D) 50 days (regression line indicates a weak and negative, significant relationship); (E) 100 days (lack of significant relationship); (F) 365 days or 1 year (lack of significant relationship); (G) 3650 days or 10 year (lack of significant relationship); and (H) 36500 days or 100 year (the dotted line indicates the slope direction and a negative positive trend, but lack of a significant relationship). For zooplankton, as the key trophic level for the initial uptake of MPs, a kE = 0.143/d (i.e., retention time = 7 days) was used.
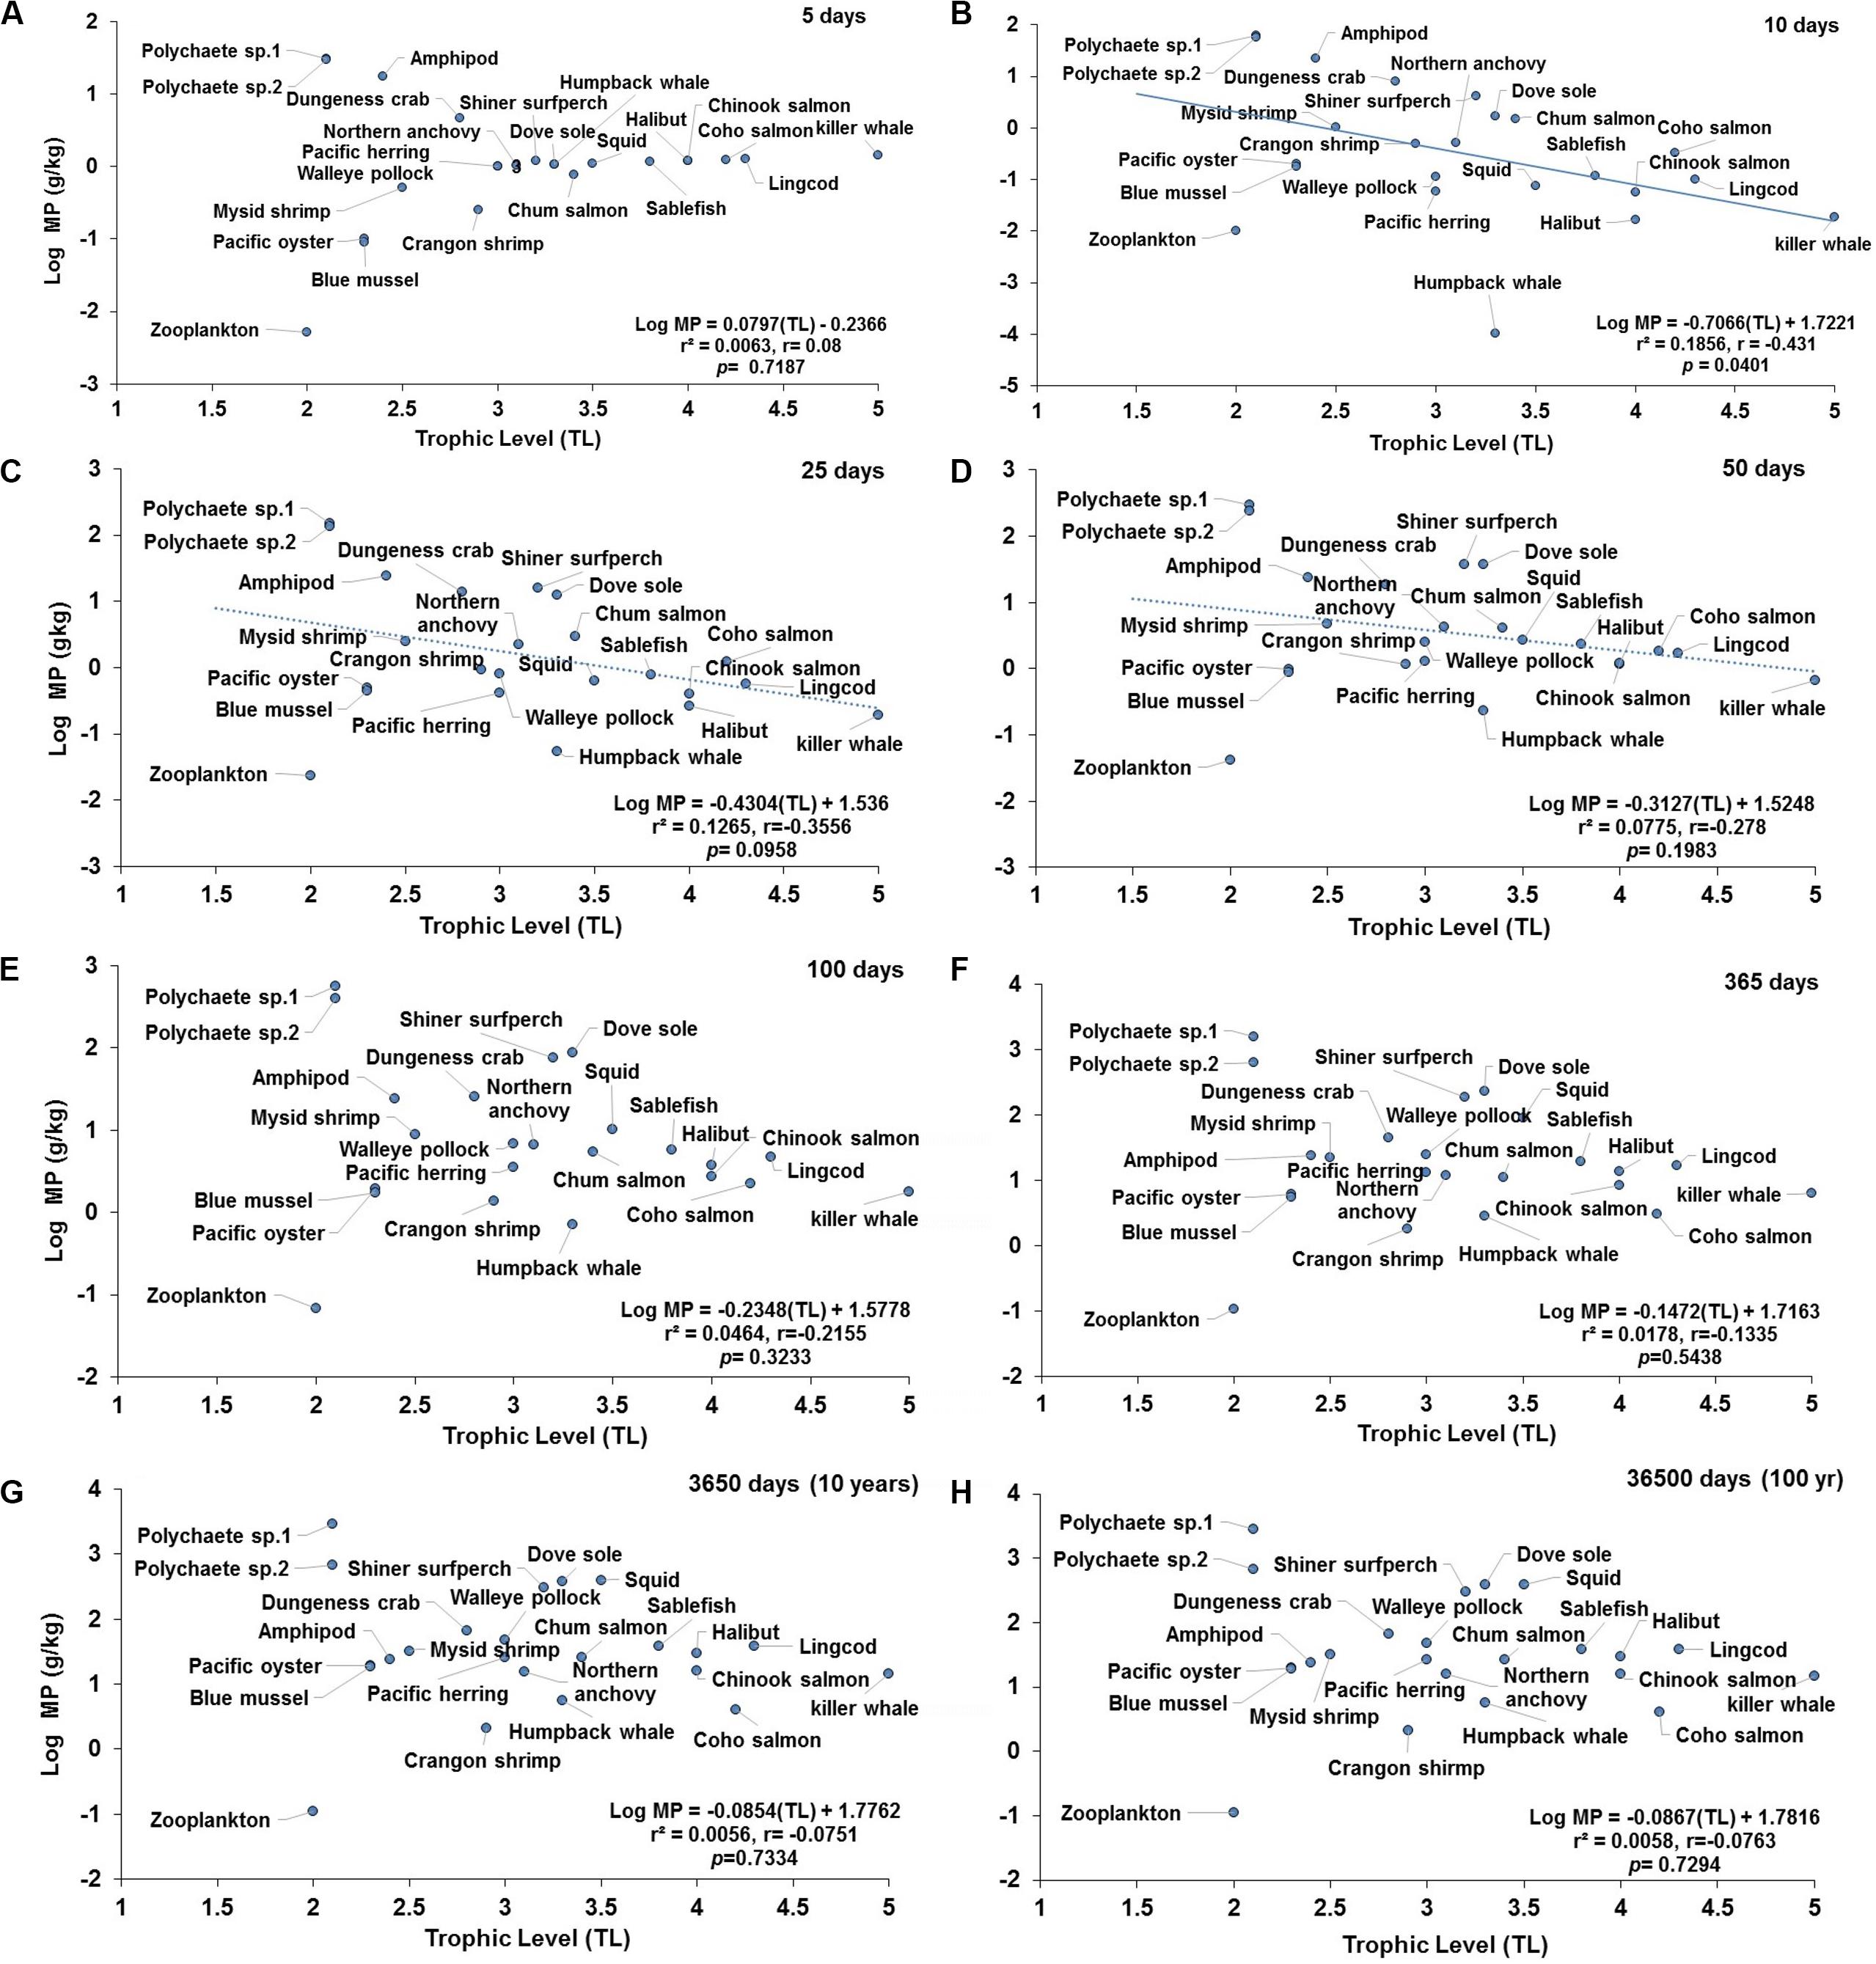
Figure 5. Projections of the apparent trophic magnification factor (TMF) as a function of predicted concentration of microplastics (MPs) versus trophic levels (TL) in the cetaceans’ food web of the Northeastern Pacific for simulations under a scenario of high abiotic concentrations (scenario 3: seawater = [0.04 g/L]; and, sediment = [111 g/kg dw] at: (A) 5 days (the regression shows lack of significant relationship); (B) 10 days (regression line indicates a negative, significant relationship); (C) 25 days (dotted line indicates a negative trend but not a significant relationship; (D) 50 days (dotted line indicates a negative trend, but lack of significant relationship); (E) 100 days (dotted line indicates a negative trend, but lack of significant relationship); (F) 365 days or 1 year (lack of significant relationship); (G) 3650 days or 10 years (lack of significant relationship); and (H) 36500 days or 100 year (lack of significant relationship). For zooplankton, as the key trophic level for the initial uptake of MPs, a kE = 0.143/d (i.e., retention time = 7 days) was used.
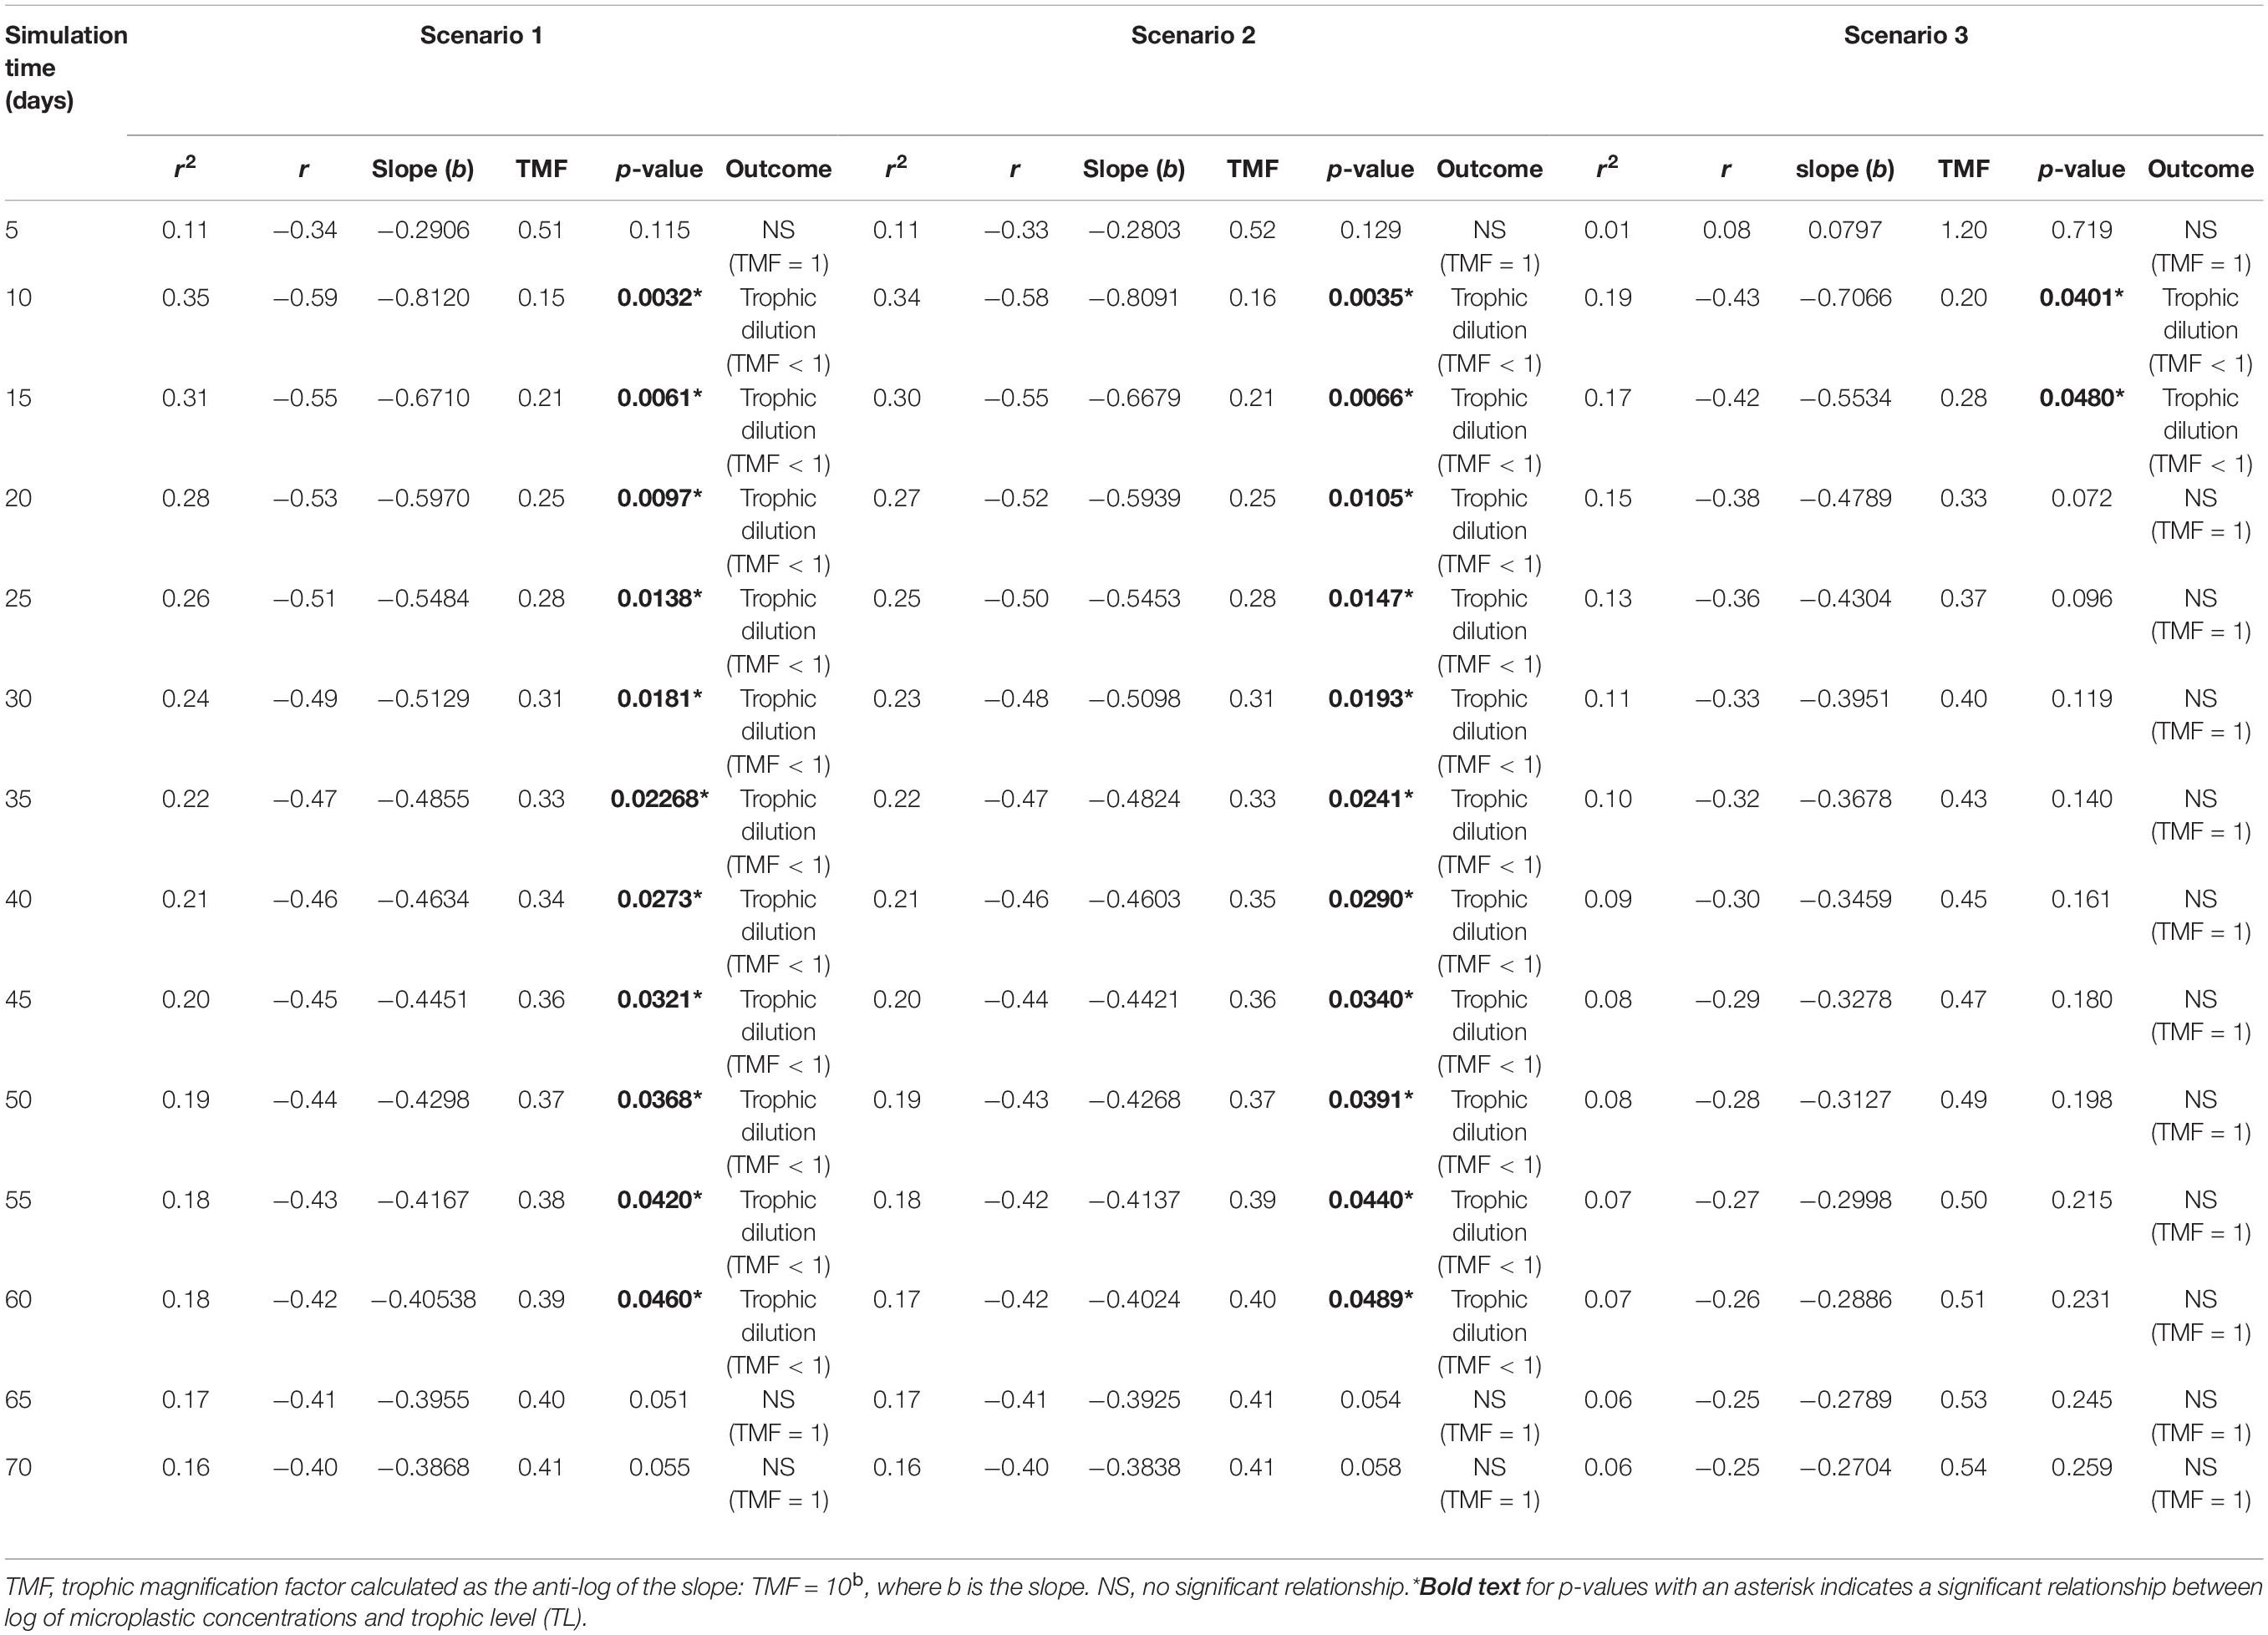
Table 1. Apparent trophic magnification factors (TMF) and regression statistics for the linear regression models of the log of microplastic (MP) concentrations versus trophic level, representing the conditions under low (scenario 1: seawater [0.003 g/L] and sediment [0.266 g/kg dw]), moderate (scenario 2: seawater [0.010 g/L], and sediment [0.886 g/kg dw]) and high (scenario 3: seawater [0.040 g/L] and sediment [111 g/kg dw]) concentrations scenarios (see Supplementary Table S2) from 5 to 70 days of simulation time, with a zooplankton elimination rate (kE) of 0.143/d.
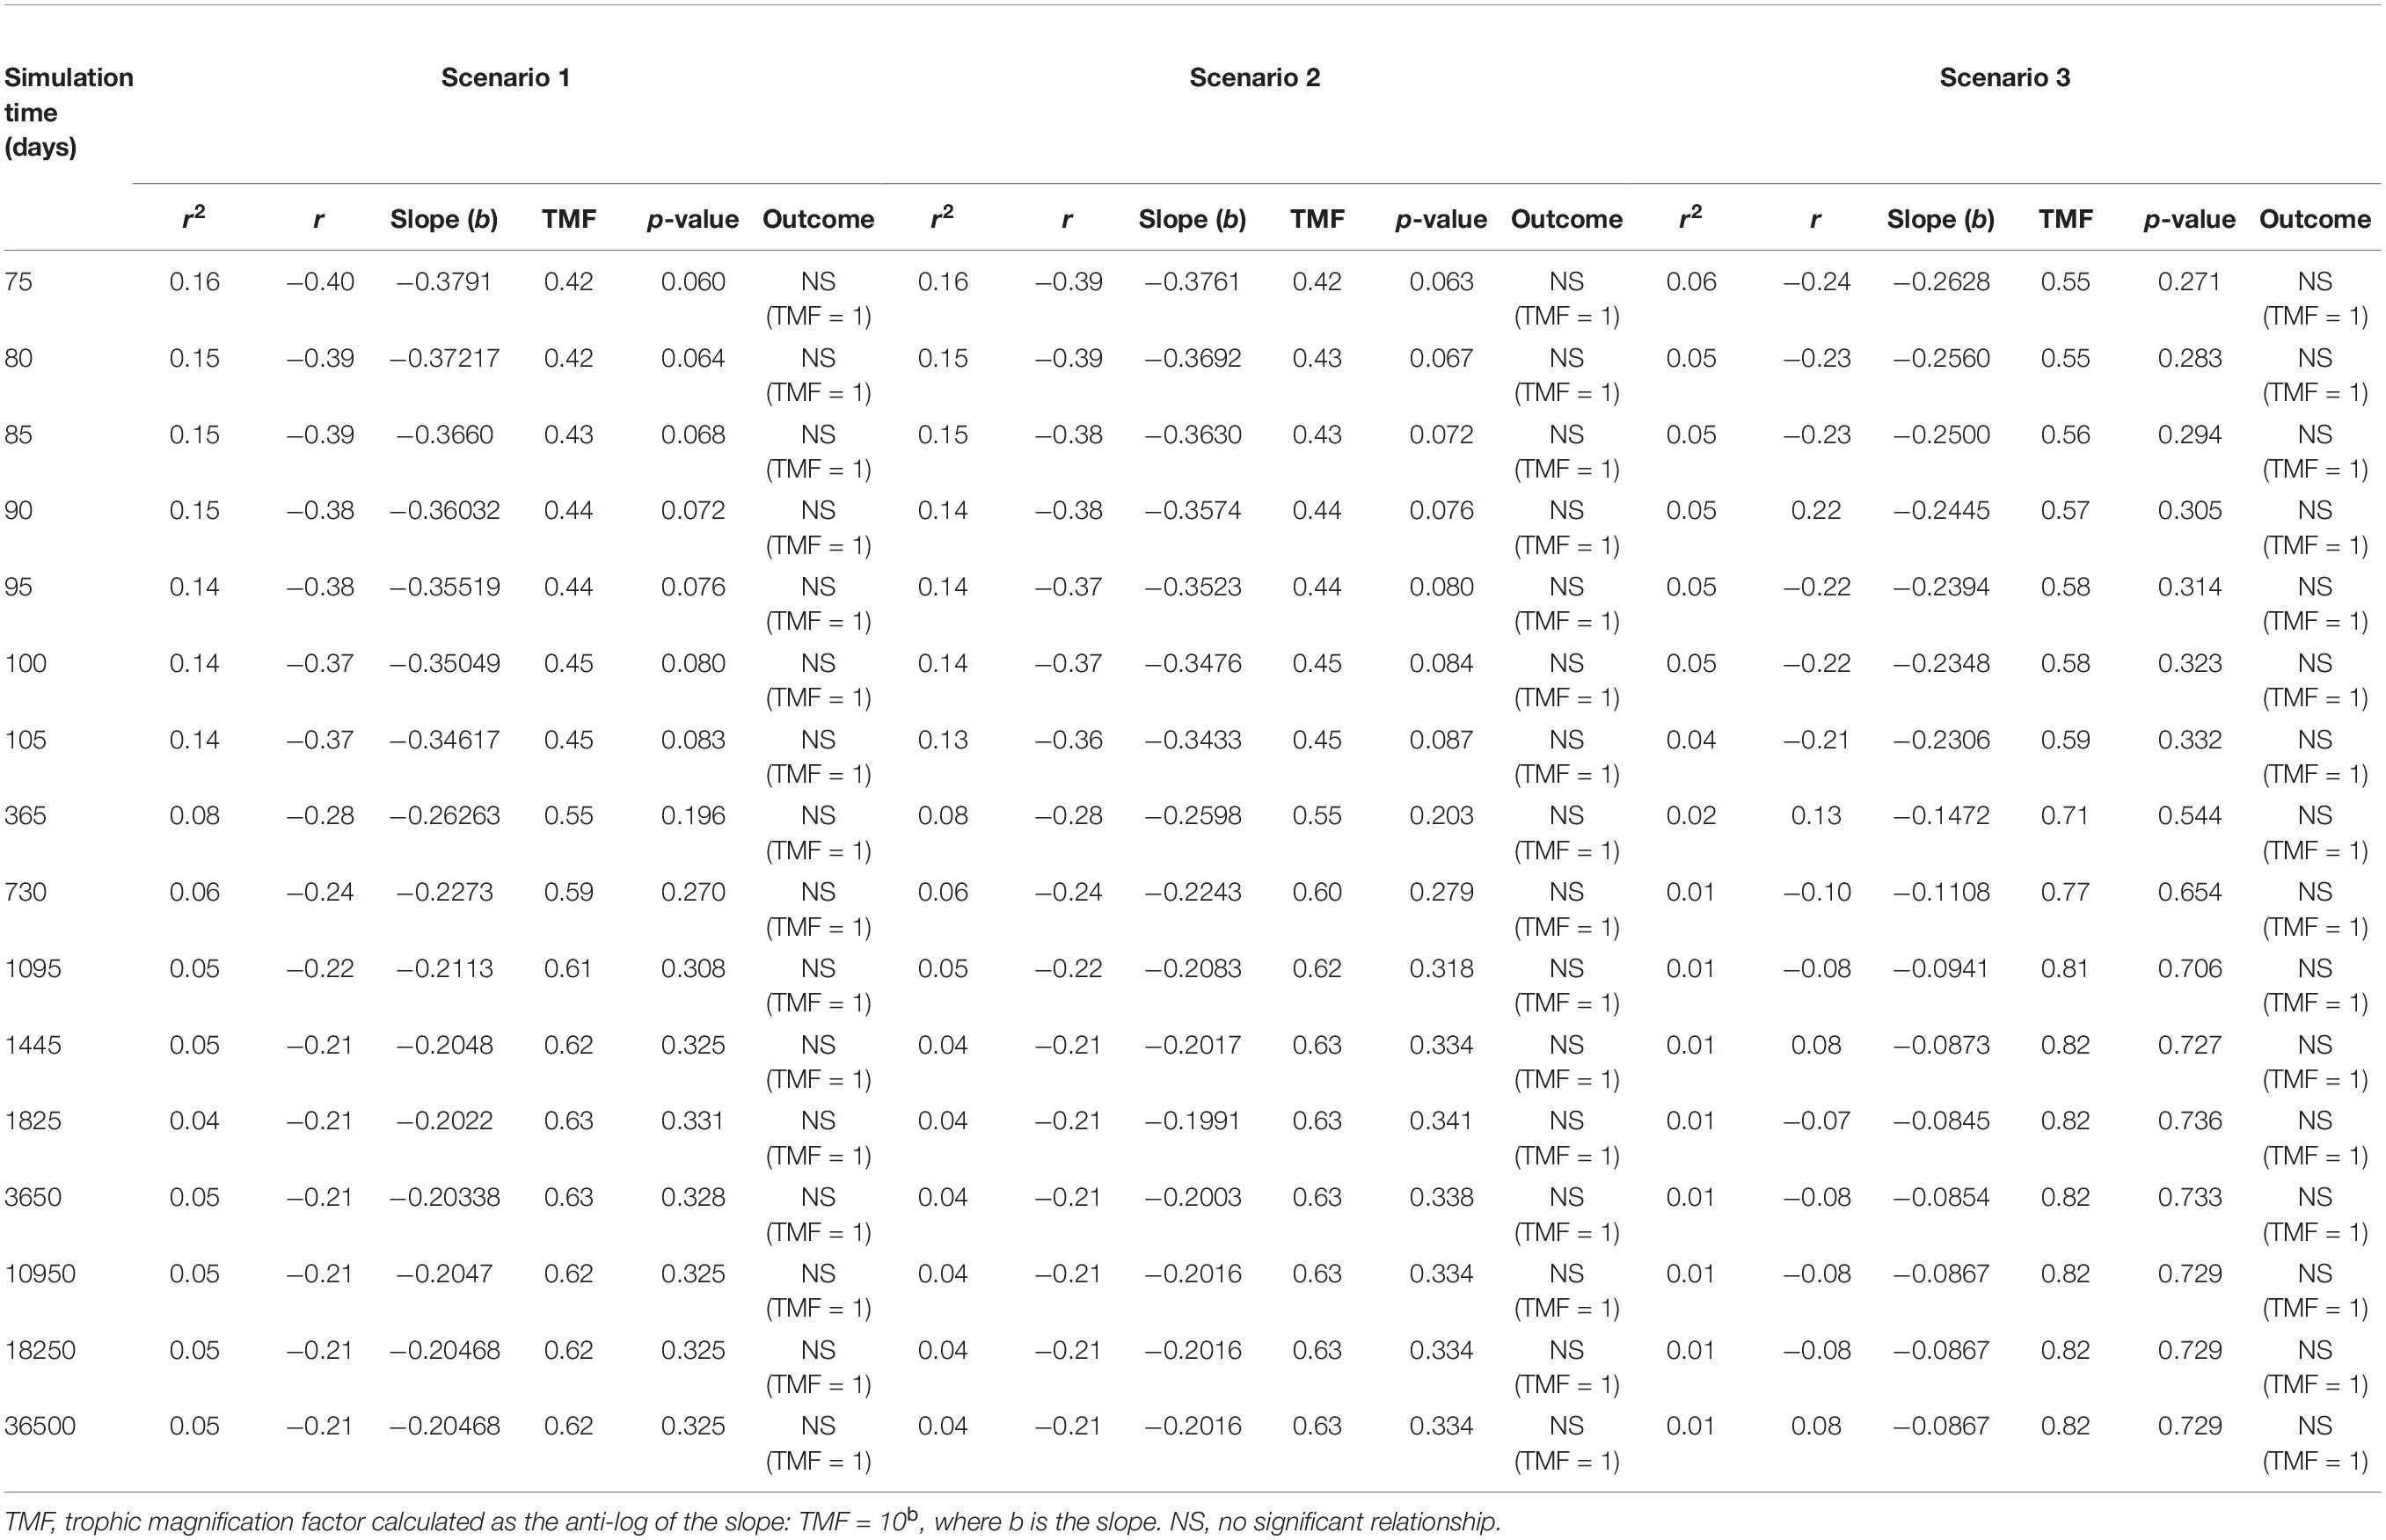
Table 2. Apparent trophic magnification factors (TMF) and regression statistics for the linear regression models of the log of microplastic (MP) concentrations versus trophic level, representing the conditions under low (scenario 1: seawater [0.003 g/L] and sediment [0.266 g/kg dw]), moderate (scenario 2: seawater [0.010 g/L], and sediment [0.886 g/kg dw]) and high (scenario 3: seawater [0.040 g/L] and sediment [111 g/kg dw]) concentrations scenarios (see Supplementary Table S2) from 75 to 36500 days of simulation time, with a zooplankton elimination rate (kE) of 0.143/d.
When investigating the prediction of TMF in a short or simplified cetacean foodweb influenced with low or high abiotic concentrations, no significant negative relationship (Figure 6A) or lack of relationship are projected at 100 days (Figure 6B) and 10 days (Figure 6E) at scenarios 1 and 3, respectively. In contrast, no significant positive relationships (TMF = 1, p > 0.05), as an indication of hypothetical capacity of trophic magnification, are predicted around 365 or 3650 days (Figures 6C,D) at scenario 1, and at 100, 365, 3650 days under scenario 3 (Figures 6F–H), respectively. Although the slope (b) appear to be greater than zero (i.e., b > 0) in some of these relationships, the small set of selected paired data points in the regression biased the relationship resulting in lack of statistical significance (TMF = 1).
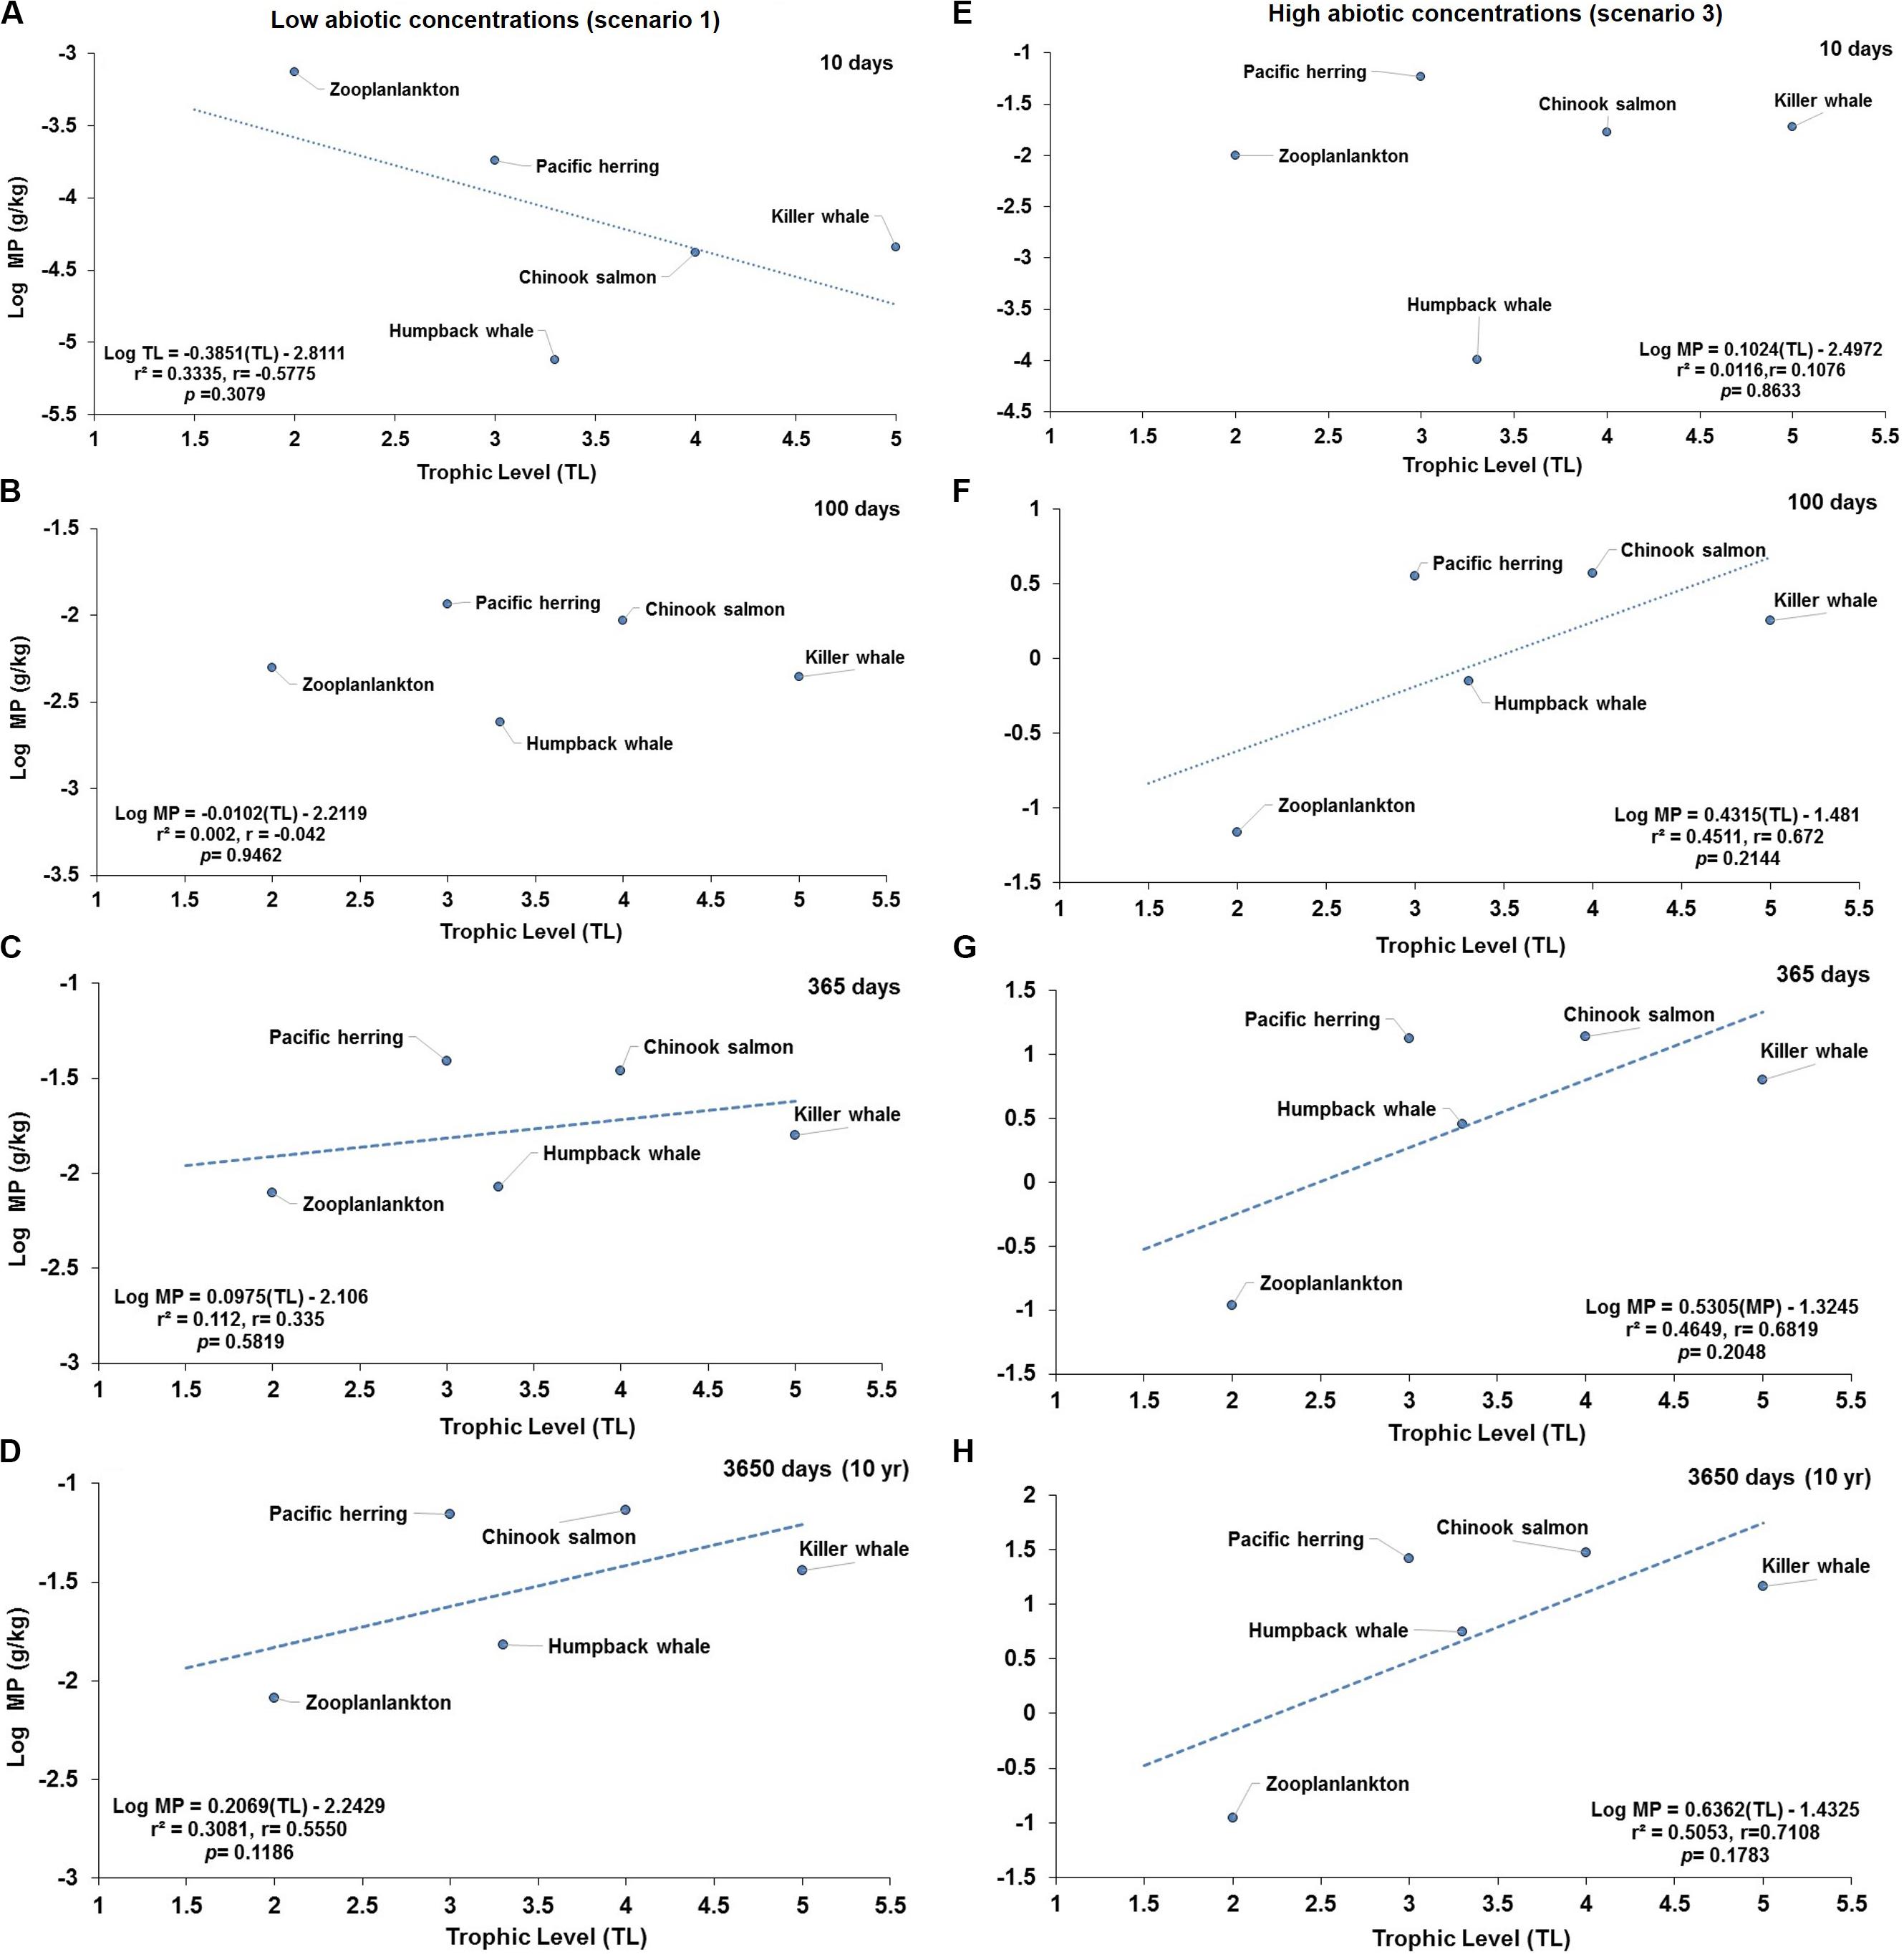
Figure 6. Projections of predicted concentration of microplastics (MPs) versus trophic levels (TL) in a simplified cetacean food web of the Northeastern Pacific for simulations under low (scenario 1) and higher (scenario 3) abiotic concentrations. Scenario 1 (i.e., seawater = [0.003 g/L]; and, sediment = [0.266 g/kg dw]) at (A) 10 d (no significant, negative relationship); (B) 100 d (lack of relationship); (C) 365 days (no significant, positive trend), and (D) 3650 days (no significant, positive trend). Scenario 3 (i.e., water = [0.040 g/L]; and, sediment = [111 g/kg dw]) at (E) 10 days (lack of relationship); (F) 100 days (no significant, positive relationship); (G) 365 days (no significant, positive relationship); and (H) 3650 days (no significant, positive relationship). The dotted lines indicate the direction of the slope showing the negative (A) and positive (C,D, and from F–H) trends.
While the TMF simulations illustrate in general lack of trophic magnification in the food web, plausible evidence of minor magnification of MP is likely to be expected to occur in specific food-webs over longer time periods for top predator (e.g., cetaceans) with long life spans that are constantly or recurrently exposed to contaminated prey (Moore et al., 2020).
Although the MP bioaccumulation over time is species-specific within the food wed (Figures 1, 2), the apparent biomagnification also appears to be specific for a given predator-prey relationship (Figure 3). The potential magnification process also seems to be foodweb-specific when comparing a short foodweb (filter feeding humpback whale foodweb; Figure 6) versus a more complex food web (fish-eating killer whale foodweb); and, in some cases, it is independent of the trophic level (Figures 4A,E–H, 5D–H).
The capacity of organic contaminants and micropollutants to biomagnify is recognized as a significant risk criterion in the eco-toxicological risk and health impact assessments of persistent, bioaccumulative and toxic substances (UNEP, 2001). The food-web magnification of MPs contests against the trophic dilution process and elimination rate (residence time) that occurs when MPs enter the foodweb. The intermixed effect of MP trophic dilution and ecological magnification determines the risks that MPs poses to marine fauna and humans.
The application of the TMF is becoming a new practical approach for simulations involving food web bioaccumulation modeling (Alava and Gobas, 2016; Alava et al., 2018). In light of the results, the TMF patterns predicted here for MPs serve as an additional bioaccumulation metric to investigate the magnitude of biomagnification potential and its impact in food webs. The highest TMFs are generally found for organic contaminants that are slowly metabolized or eliminated by animals, i.e., metabolic rate (kM) < 0.01/d (Walters et al., 2016). TMFs of organic contaminants are more variable in marine food webs in comparison to those from freshwaters, with the highest values found in long food webs, including endotherms and containing multiple predators (Borgå et al., 2012; Walters et al., 2016; Alava et al., 2018).
Sensitivity Analysis
The sensitivity of the model was mainly assessed by testing changes in the elimination rate in zooplankton, as the fundamental entry point for uptake and bioaccumulation of MPs at the bottom of the food wed. This was conducted by comparing the outcomes of the model at a high elimination rate in zooplankton (kE = 1/d) versus a low elimination rate (kE = 0.143/d) and running the model with empirical abiotic concentrations of MP observed in water and sediment (i.e., scenario 1: low concentration as conservative scenario; and, scenario 2: moderate concentration as the least conservative scenario; Supplementary Tables S4, S5). Under scenario 1 or scenario 2, the average ± SD percentage of MP concentration in zooplankton increased by 75% ± 17% over a simulation time of 1 year (Figure 7A). The equivalent average increase (85 ± 2.0%) in MP concentration in zooplankton subject to changes in the elimination rates is also predicted under either scenario 1 or scenario 2 at 100 year (Figure 7B).
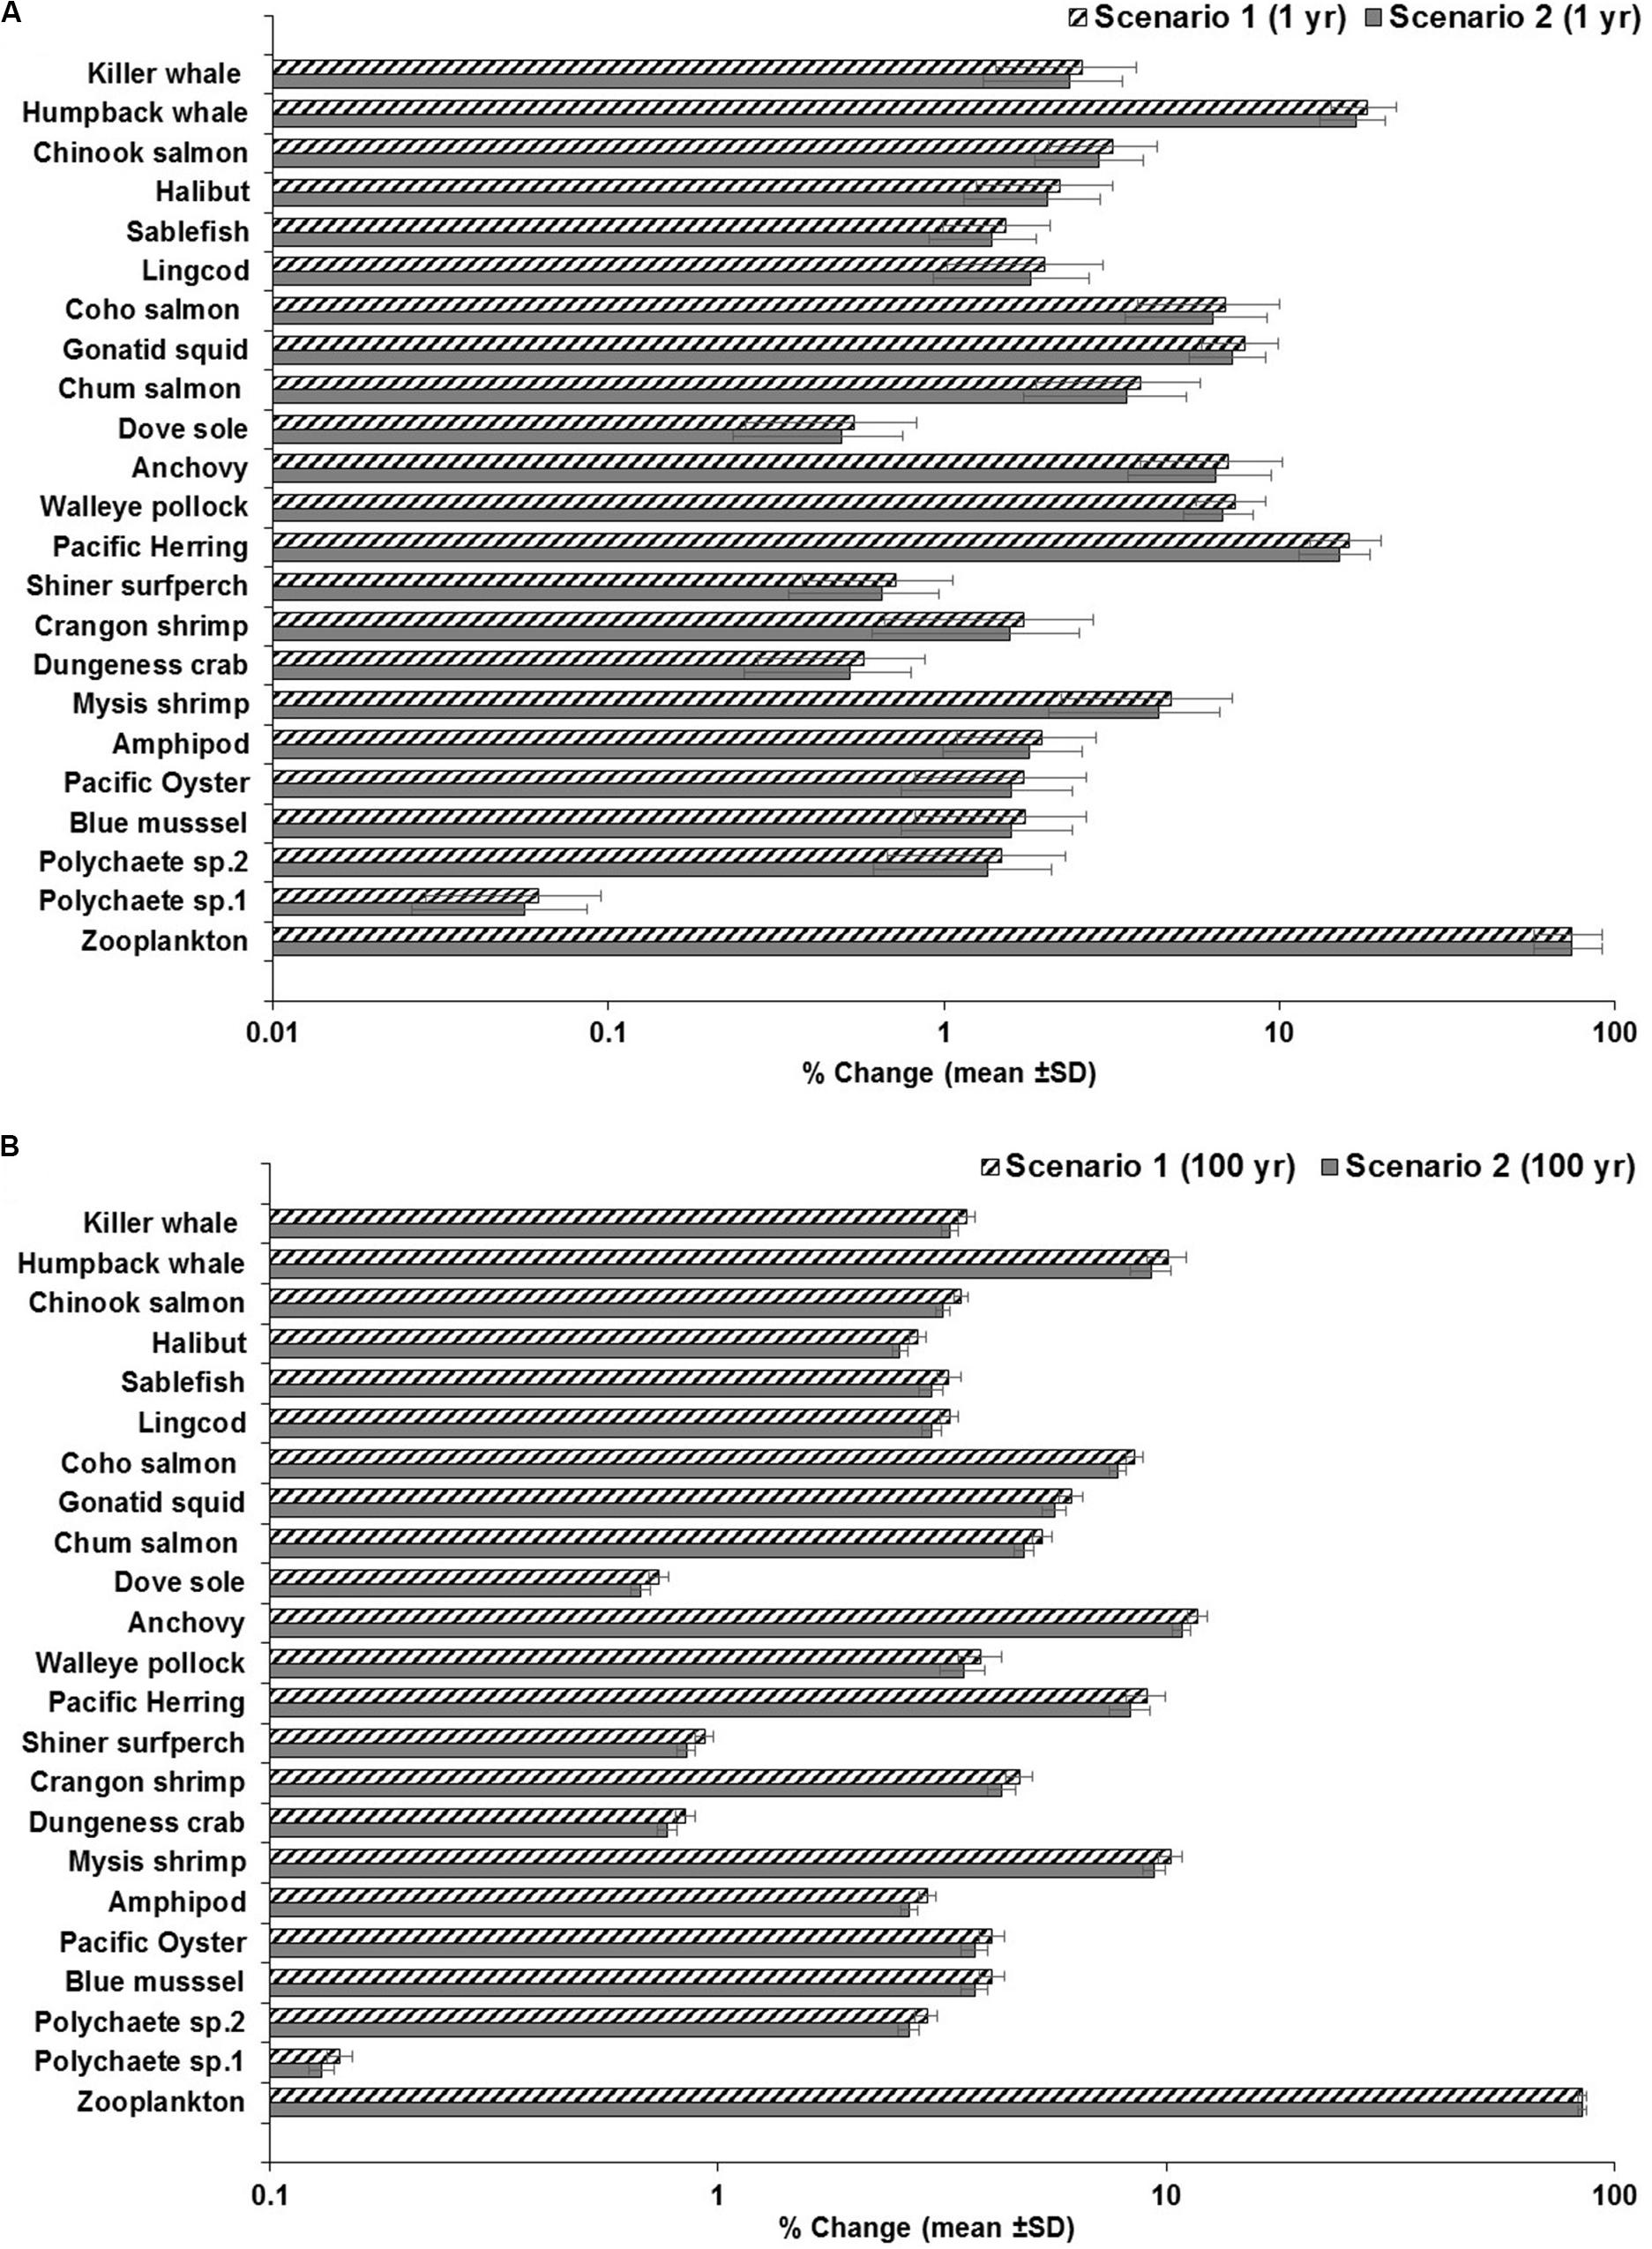
Figure 7. Outcomes of the sensitivity analysis showing the response of the food web to changes in the elimination rate of zooplankton at 1 and 100 years. (A) scenario 1: from kE = 1/d to kE = 0.143/d with low concentrations in water and sediment (0.003 g/L and 0.266 g/kg dw, respectively) at 1 year, as a conservative scenario; scenario 2: from kE = 1/d to kE = 0.143/d with moderate concentrations in water and sediment (0.010 g/L and 0.886 g/kg dw) at 1 year, as a least conservative scenario (scenario 1); and (B) scenario 1: from kE = 1/d– to kE = 0.143/d at low concentrations in water and sediment (same as above) at 100 years, as a conservative scenario; scenario 2: from kE = 1/d to kE = 0.143/d with moderate concentrations in water and sediment (same as above) at 100 years, as a least conservative scenario.
Other proportional changes of lesser or intermediate extent are also projected in low trophic level marine invertebrates (i.e., polychaetes; bivalves such as blue mussel and Pacific oyster; crustaceans such as Dungeness crab, shrimps and amphipods) and planktivorous fish (i.e., Pacific herring, anchovy and walleye pollock) in response to shifts in the elimination rates of zooplankton. The average change of MP concentrations in biota under scenarios 1 or 2 ranged from 0.1 or ∼1.5% in polychaetes to >4.0% in Mysis shrimp, and from 7.0% in pollock and up to 15–16% in herring at 1 year (Figure 7A and Supplementary Tables S4, S5). The changes at 100 years ranged from 0.13 to 3% in polychaetes, and 10% in Mysis shrimp; and from 8–9% in herring to 11–12% in anchovy (Figure 7B), exhibiting relatively higher changes in MP concentrations in these organisms when compared to the simulations at 1 year, except for herring.
While the changes in concentrations in other low and mid-trophic levels are in general lower (e.g., 0.5% to >2%), chum and coho salmon, and squid exhibited increases of ∼4%, >6, and >7%, respectively (at scenarios 1 and 2 at 1 year; Figure 7A and Supplementary Tables S4, S5). Relative lower concentration changes are also projected in these organisms at 100 year of simulation, as seen in Supplementary Figure S5B. The incremental changes in the humpback whale were of 16 or 17% at 1 year and ∼9–10% by 100 year, indicating that herring feeding on zooplankton with low or high elimination rate is a biological driver in the MP concentration in humpback whale. As for Chinook salmon and killer whale, the changes in MP concentrations were basically minor, i.e., of ∼3% and >2–3.6% for all scenarios, respectively (Figures 7A,B).
Further sensitivity analysis and experimentation on the BMFTL shows, for example, that under scenario 1, the BMFTL in the humpback whale/Pacific herring relationship slightly increases from 0.8 to ∼1.0 as the proportion of herring in the diet of the humpback whale also increases (i.e., from 90 to 100%). On the contrary, an important decrease in the BMFTL (from 0.8 to 0.1) was predicted if the proportion of herring changes in the humpback whale’s diet from 90 to 0.0%, i.e., only comprising of 100% zooplankton (Supplementary Figures S7A–C). At high abiotic concentrations (scenario 3), the BMFTL also increased to ∼1, if herring increases in the diet to 100%, but decreasing to 0.004 when the proportion of herring in the humpback whale’s diet is 0% (Supplementary Figures S7D,E). The BMFTL of upper trophic level organisms (fish-eating killer whale/Chinook salmon relationship) was unaffected (i.e., BMFTL = 0.5) by changes in the humpback whale’s diet (see Supplementary Figures S7A–F).
Overall, the sensitivity analysis illustrates that the changes in the elimination rate (i.e., retention time from 1 to 7 days) in zooplankton are mainly propagated from filter and suspension feeding invertebrates through zooplanktivorous fish up to humpback whale, directly up taking or ingesting herring and zooplankton, but with little impact in high trophic level organisms such as predatory Chinook salmon and fish-eating killer whale.
Although little is known about the extent to which trophic transfer and elimination of microplastics occurs in free-ranging marine mammals in natural conditions, the presence of microplastics along with fish bones, otoliths and squid beaks has been observed in seal scats and the intestines of both cetaceans and seals (Eriksson and Burton, 2003; Lusher et al., 2015; Nelms et al., 2018). For instance, microplastics observed in scats of captive gray seals (H. grypus) has been attributed to trophic transfer from the wild-caught mackerel (Scomber scombrus) they were fed upon (Nelms et al., 2018). Feeding experiments examining the passage time of prey in gray seals found the majority of fish otoliths were passed within 4 days (88 h) of consumption and all polystyrene balls (3 mm) fed to the animals were recovered within 5–6 days after consumption during exposure experiments (Grellier and Hammond, 2006). This experiment demonstrated that, although microplastics have a slower and long passage time (i.e., high retention time), they are eliminated in the feces (Grellier and Hammond, 2006). Moreover, the stomachs of stranded cetaceans from the British coast were found to contain a higher number of MP particles relative to that observed in the intestines, highlighting the role of the stomach as a potential entrapment chamber for temporary retention of these micropollutants (Nelms et al., 2019), which is likely to predominantly occur in the digestive segment linking the main stomach and the connecting channels, where MPs can be trapped (e.g., moderate to high retention time).
In this context, retention time and elimination rates in these trophic levels play a crucial role in the accumulation of microplastics and more research should be invested to elucidate this parameter to improve future modeling work.
Model Bias
Comparing the projected concentration of MPs in Chinook salmon to observed data in wild juvenile Chinook salmon (i.e., 0.89 ± 1.0 g/kg, derived from 1.2 ± 1.4 particles/individual; Collicutt et al., 2019), the outcomes of the MB ratio analysis reveal systematic under prediction (MB < 1), with a MB ranging 0.0–0.1 and 0.0–0.3 at low (scenario 1) and moderate (scenario 2) abiotic concentrations throughout the simulation, respectively (Figure 8). In scenario 3 (high concentrations), the MB ranged from 0.0 to 33.3 over the simulation time, with MB = 1.0 at 35–50 days of simulation, indicating that observed concentrations in Chinook salmon are reproduced fairly well by model’s predicted data in this predatory fish at those time steps (Figure 8). Systematic overprediction with on order of magnitude higher (MB > 10) is generated beyond 200 days because of the continued exposure of prey to high abiotic concentrations of MPs (Figure 8).
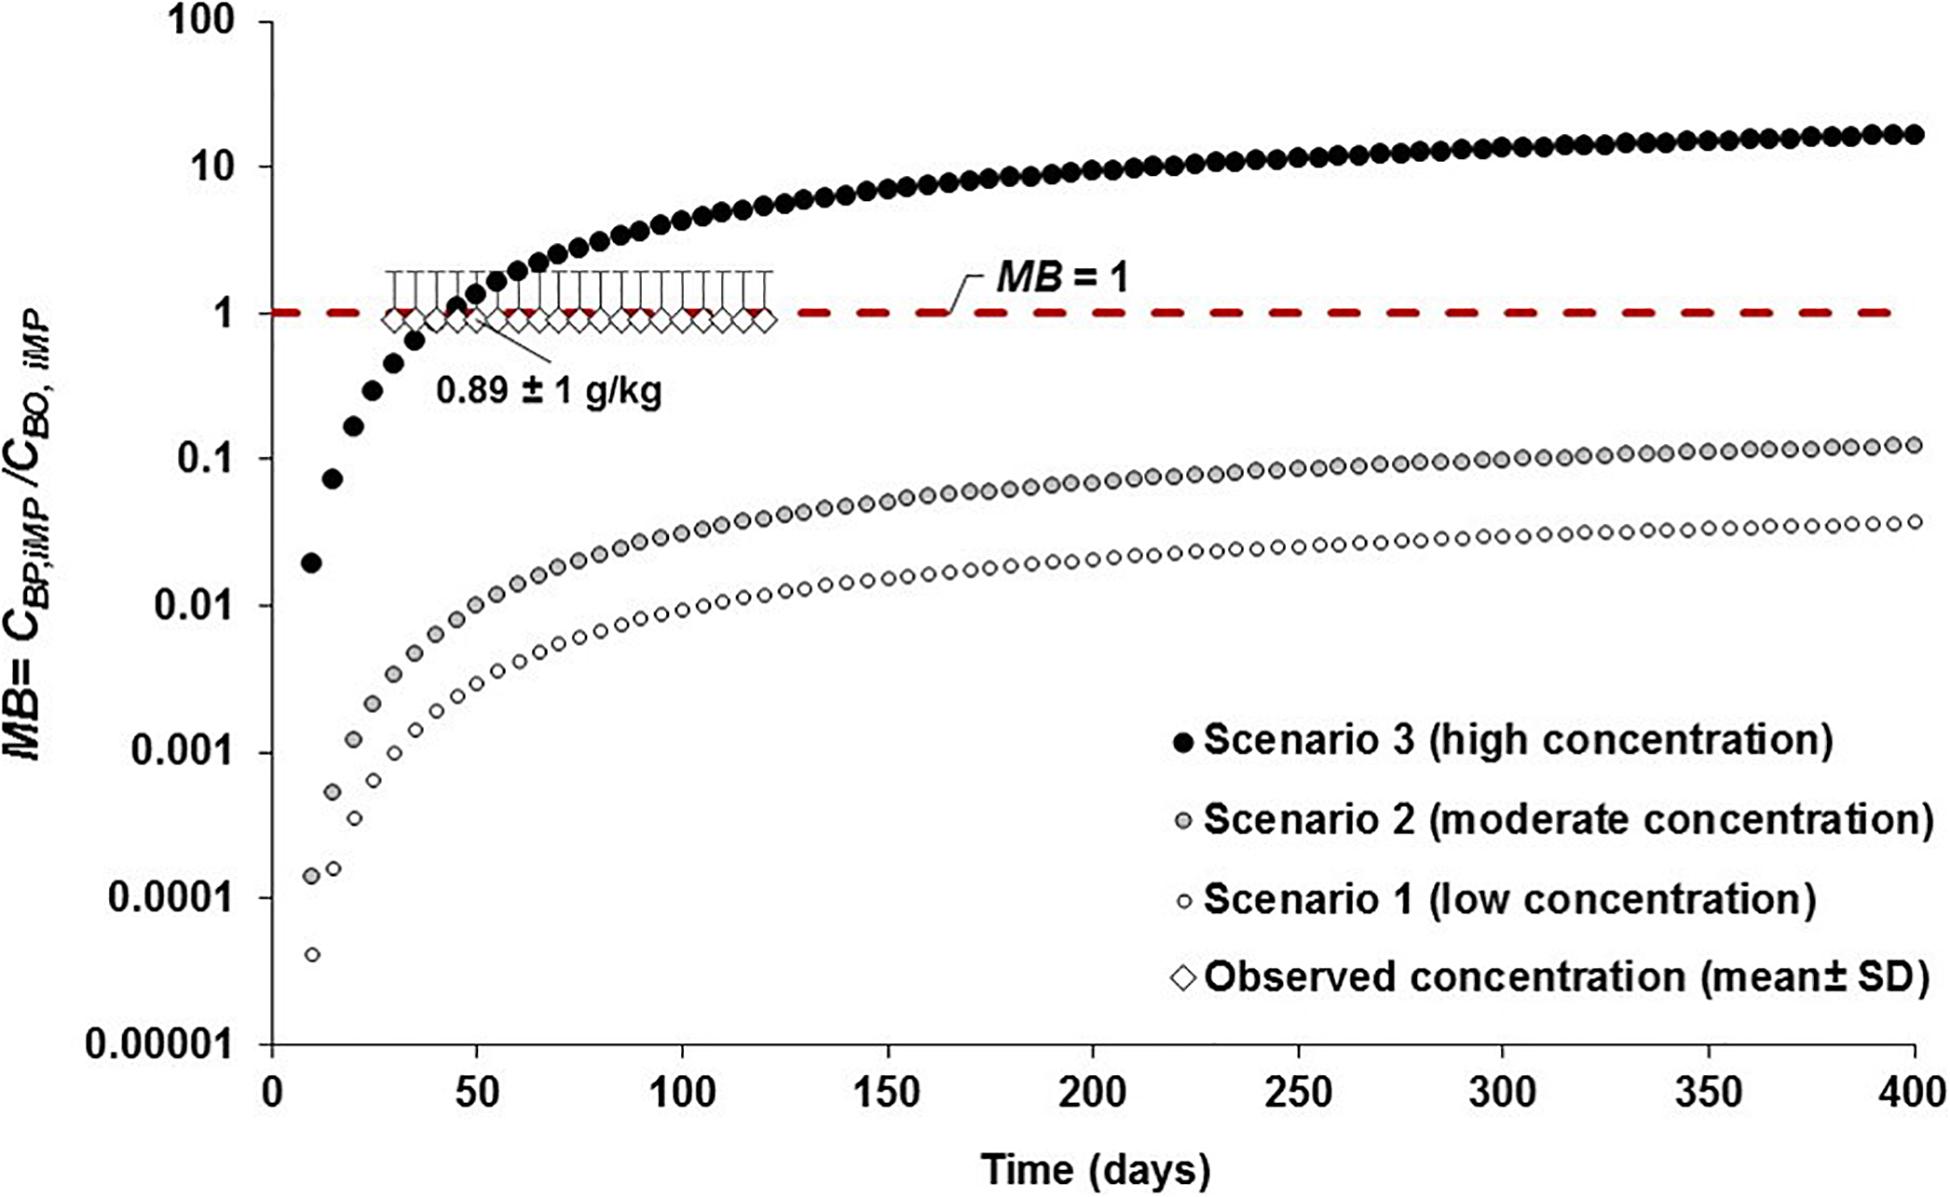
Figure 8. Assessment of the model bias (MB = CBP,i MP/CBO, iMP; where CBP,i MP and CBO,i MP are the model predicted and observed MP concentrations in Chinook salmon, respectively) and performance of the model by comparing the simulations of MP concentrations projected in Chinook salmon from 0 to >365 days under three abiotic concentrations scenarios (i.e., scenario 1: low concentration; scenario 2: moderate concentration; and, scenario 3: high concentration; see Supplementary Table S1) to the empirical field data (mean ± SD = 1.2 ± 1.4 particles/individual or 0.89 ± 1.0 g/kg) of MP concentration observed in wild juvenile Chinook salmon (Collicutt et al., 2019). The red dashed line represents equal concentration of MPs (MB = 1) between predicted and observed concentration data.
If the estimated age of the juvenile Chinook salmon reported in Collicutt et al. (2019) is about 90–120 days (average: 105 days), with an average growth rate of 0.55 mm/d (based on life history data for Chinook salmon from eastern Vancouver Island, as reported in Healey, 1991; J. Rosenfeld, Conservation Science Section, Province of British Columbia, Canada, personl communication); then, the predicted data from 90 to 120 days under scenarios 1 (MB ∼ 0.01) and 2 (MB = 0.03 to 0.04) are below the observed data (MB < 1), while in scenario 3 the projections are fairly above the empirical data with a MB of 3.6 (MB = 3.2 g/kg/0.89 g/kg) at 90 days and MB of 5.3 (MB = 4.7 g/kg/0.89 g/kg) at 120 days, respectively. Predicted MP concentrations are relatively similar (MB ≈ 1) or equal (MB = 1) to the observed data at 30 to 60 days of simulations. This indicates small to moderate underprediction and overprediction assuming that the putative ages estimated here are within the observed ranges of juvenile Chinook salmon.
Moreover, an estimated ingestion of 2–7 microplastic particles/d (equivalent to 0.01–0.03 g/d) by individual juvenile salmon in coastal British Columbia was reported by Desforges et al. (2015). This daily consumption rate roughly indicates a cumulative ingestion of MPs ranging from ∼1 to 2.7 g at 90 days and from 1.2 to 3.6 g at 120 days. For a juvenile Chinook salmon with a mean weight of 6 g (i.e., 0.006 kg), the estimated MP concentration, based on the daily ingestion of MPs (0.01–0.03 g/d), is in the order of 1.7–5 g/kg, fairly matching the predicted concentrations projected from 55 to 125 days under scenario 3, i.e., MB of 1.6–5.6 (Figure 8).
Implications for Microplastic Exposure, Biomagnification and Toxicity
Microplastics are highly bioavailable to marine filter-feeding megafauna and top predators either through direct ingestion, or indirectly by trophic transfer from contaminated prey (Fossi et al., 2012; Besseling et al., 2015; Lusher, 2015; Fossi et al., 2016; Germanov et al., 2018; Lusher et al., 2018; Nelms et al., 2018). At this level, one of the limitations and uncertainties on MP biomagnification, which is not directly captured by this modeling work, is as to whether MPs (i.e., depending on the size and shape) are absorbed at all through the GI tract into the body of the organism, potentially influencing their bioaccumulation and biomagnification in organisms.
However, it has been suggested that MPs have a low potential for biomagnification in fish (Jovanović, 2017) because no relationship between ingested microplastics quantity and trophic level of the fish species has been found; thus, the trophic level of the species may have little influence on the ingested quantity of MPs (Güven et al., 2017; Jovanović, 2017).
A study shows that the occurrence of MPs in the gastrointestinal tract of fish is ephemeral, with low accumulation potential in the gastrointestinal tract, although translocation to the liver may occur (Güven et al., 2017).
Likewise, the trophic transfer of MPs under a low exposure scenario and less extreme conditions along a short marine food chain, including a prey (brown mussel Perna perna) and two predators (i.e., ornate blue crab, Callinectes ornatus, and the puffer fish, Sphoeroides greeleyi), showed that the transferring of MPs occurred from prey to predators but without evidences of particle persistence in their tissues after 10 days of exposure (Santana et al., 2017). This experimental assessment suggested a reduced likelihood of trophic cascading of particles and a reduced risk of direct impacts of microplastics on higher trophic levels (Santana et al., 2017). Contrasting to this finding, there has been postulated that the total load of micro- and nanoplastics that has been found and will pass through the gastrointestinal tract of a fish in its lifetime is likely high and will keep increasing in the future (Lusher, 2015; Jovanović, 2017).
The foodweb bioaccumulation model projected that microplastics can readily accumulate in planktivorous, demersal and pelagic predatory fish as a function of the uptake and elimination rate. The model bias (MB) exercise applied to the case of Chinook salmon corroborates in part these findings.
Foodweb modeling work and field studies documenting the presence of MPs in cetaceans are very scarce. Lusher et al. (2018) reported that the digestive tracts of 21 specimens of cetaceans were found to contain a total of 598 small debris items. As it stands, the recent discovery of MPs in the digestive tracts of cetaceans is relatively low with 8 species examined from Ireland and the Netherlands (Besseling et al., 2015; Lusher et al., 2015, 2018) and 10 species from the United Kingdom coast, where the number of particles per individual was low, averaging 5.5 MPs/animal, and suggesting that these particles were transitory in the digestive tract (Nelms et al., 2019). MPs have also recently been observed in the GI tract (i.e., 88 particles) of a deep diving, oceanic cetacean species (True’s beaked whale, Mesoplodon mirus) stranded on the coast of Ireland (Lusher et al., 2015), as well as in East Asian finless porpoises (Neophocaena asiaeorientalis sunameri) from China, i.e., mean ± SD = 19 ± 7.2 MPs/individual (Xiong et al., 2018), in common dolphins (Delphinus delphis) from Spain, i.e., 12 ± 8.0 MPs/individual (Hernandez-Gonzalez et al., 2018) and in belugas (Delphinapterus leucas) from the eastern Beaufort Sea (Arctic), exhibiting 11.6 particles/animal (Moore et al., 2020).
Recent research revealed that fin whales (Balaenoptera physalus) from the Mediterranean Sea are exposed to microplastics due to direct ingestion and consumption of contaminated prey (Fossi et al., 2016). Field studies and foodweb modeling to further investigate the bioaccumulation and biomagnification capacity of microplastics through direct and indirect ingestion of contaminated sediments and benthic macroinvertebrates by particular marine mammal species with suction feeding and bottom foraging strategies (e.g., walruses, Odobenus rosmarus, and gray whales, Eschrichtius robustus) are urgently needed.
While this modeling work did not account for transferring of hydrophobic organic contaminants in the food web, as a limitation of the model, it is unclear as to what extent MPs serve as physical vectors for transporting organic contaminants from the marine or aquatic environment into the tissues of marine biota (Koelmans, 2015). Additional foodweb bioaccumulation modeling work should take into consideration the transfer of organic contaminants as potential tracers of microplastic, but this research has already been developed and published in great details (see Koelmans et al., 2013a, b, 2014a, b; Koelmans, 2015; Bakir et al., 2016; Diepens and Koelmans, 2018), demonstrating the low capacity of microplastics to transfer high concentrations of organic contaminants in biota relative to that mainly ingested and absorbed via dietary exposure. The transfer of organic contaminants from MP to aquatic biota appears to be low or less relevant (Koelmans et al., 2014a; Koelmans, 2015; Bakir et al., 2016; Lohmann, 2017), which is driven by the contaminant concentration gradients found in the organisms versus that in the ingested microplastics (Teuten et al., 2009; Gouin et al., 2011; Koelmans et al., 2013a, b; Koelmans et al., 2014a). However, it has been inferred that phthalates could act as a tracer for MP ingestion by fin whales (B. physalus) because high concentrations of these plasticizers were detected in areas that corresponded with the spatial distribution of the whales in the Mediterranean Sea (Fossi et al., 2012; Fossi et al., 2016). Moreover, a zooplankton species (the euphausiid, Meganyctiphanes norvegica), which is the predominant diet item of Mediterranean fin whales, has been found to exhibit high levels of a phthalate metabolite, i.e., mono-(2-ethylhexyl) phthalate (MEPH), resulting from the biotransformation of the ubiquitous Di-(2-ethylhexyl) phthalate (DEHP), with concentrations ranging from 8.87 ng/g to 21.79 ng/g. This finding highlighted the presence of plastic additives in the main prey species of fin whales and dietary route of exposure for this cetacean (Fossi et al., 2016). The detection of MEPH in M. norvegica was most likely linked to the exposure to phthalate-contaminated water and food (phytoplankton), and direct consumption of microplastics (Fossi et al., 2016).
Regardless of whether these micropollutants can significantly transfer organic contaminants to biota, MP ingestion, depending on the size and shapes (e.g., spheres, pellets, fragments, and fibers), can cause physical stress, injury, adverse physiological and biological effects, reduced feeding activity, and weight loss caused by blockage of the GIT or decreased overall food quality (Lusher, 2015; Jemec et al., 2016; Chen et al., 2018; Green et al., 2019; Qiao et al., 2019). Although the size and shape of MPs were not realistically captured in this foodweb bioaccumulation modeling, the size and types (i.e., microbeads, fragments, fibers, filaments) of the MP particles entered as input data in the model, based on the observed data and concentrations in abiotic matrices (water and sediments) from the assessed region of the marine food web (i.e., Northeastern Pacific), are explicitly described in the Supplementary Table S2 (i.e., ranging from < 0.63 μm in sediments to 65–5000 μm in length and 10–20 μm in diameter in water and sediments). Thus, these particle dimensions and types (as a proxy of shape) were plausible assumed to be the class of MPs used in the abiotic exposure for the current foodweb modeling work and deemed to be bioaccumulated. However, concerted knowledge on the shape of the particle prone to be bioaccumulated or biomagnified is still unknown and due to the uncertainty on the MP shape absorbed through the GI tract in fish and marine mammals, the real particle shape as a modeling gap was not explicitly addressed here.
In conclusion, the response of the foodweb organisms to the abiotic exposure to MPs was in general projected by a plausible bioaccumulation potential of these micropollutants. Conversely, contrasting to the high biomagnification capacity of POPs in marine foodwebs, mainly in top predators, the trophic magnification of MPs in the foodweb of filter-feeding and fish-eating cetaceans is lacking or appears to be very low. The findings of the model developed here can be applied under the precautionary approach to predict microplastic bioaccumulation. As a practical tool, the application of the model can provide baseline information and scenarios to support risk management, and control strategies by authorities and municipalities to reduce and mitigate sources of MP pollution in the ocean. Since food safety is of paramount for public health, the application of this model can also help to assess and address possible negative impacts and health risks in marine biota and coastal communities relying heavily on lower trophic level marine species part of their traditional seafoods.
Data Availability Statement
All datasets generated for this study are included in the article/Supplementary Material.
Author Contributions
JA: conceptualization of original idea, study design, development of foodweb model, overall writing – original draft, statistical, and data analysis, review, and editing.
Funding
Funding for the modeling work was provided by the Nippon Foundation-Ocean Litter Project.
Conflict of Interest
The author declares that the research was conducted in the absence of any commercial or financial relationships that could be construed as a potential conflict of interest.
Acknowledgments
The author thanks the Nippon Foundation for providing research funding through the Ocean Litter Project at University of British Columbia. Special thanks to Dr. Yoshitaka Ota, and Dr. Elaine Faustman, and the Marine Litter Team at University of Washington for providing advice to undertake this contribution. The author is indebted to Dr. Leslie J. Saunders and Dr. Victoria Otton for their insights and edits to improve this article.
Supplementary Material
The Supplementary Material for this article can be found online at: https://www.frontiersin.org/articles/10.3389/fmars.2020.566101/full#supplementary-material
References
Alava, J. J., Cisneros-Montemayor, A. M., Sumaila, U. R., and Cheung, W. W. (2018). Projected amplification of food web bioaccumulation of MeHg and PCBs under climate change in the Northeastern Pacific. Sci. Rep. 8:13460.
Alava, J. J., and Gobas, F. A. (2016). Modeling 137Cs bioaccumulation in the salmon–resident killer whale food web of the Northeastern Pacific following the Fukushima Nuclear accident. Sci. Total Environ. 544, 56–67. doi: 10.1016/j.scitotenv.2015.11.097
Alava, J. J., Ross, P. S., Lachmuth, C. L., Ford, J. K. B., Hickie, B., and Gobas, F. A. P. C. (2012). Habitat based PCB environmental quality criteria for the protection of endangered killer whales (Orcinus orca). Environ. Sci. Technol. 46, 12655–12663. doi: 10.1021/es303062q
Amélineau, F., Bonnet, D., Heitz, O., Mortreux, V., Harding, A. M. A., Karnovsky, N., et al. (2016). Microplastic pollution in the Greenland Sea: background levels and selective contamination of planktivorous diving seabirds. Environ. Pollut. 219, 1131–1139. doi: 10.1016/j.envpol.2016.09.017
Andrady, A. L. (2011). Microplastics in the marine environment. Mar. Pollut. Bull. 62, 1596–1605. doi: 10.1016/j.marpolbul.2011.05.030
Bakir, A., O’Connor, I. A., Rowland, S. J., Hendriks, A. J., and Thompson, R. C. (2016). Relative importance of microplastics as a pathway for the transfer of hydrophobic organic chemicals to marine life. Environ. Pollut. 219, 56–65. doi: 10.1016/j.envpol.2016.09.046
Batel, A., Linti, F., Scherer, M., Erdinger, L., and Braunbeck, T. (2016). Transfer of benzo[a] pyrene from microplastics to Artemia nauplii and further to zebrafish via a trophic food web experiment: CYP1A induction and visual tracking of persistent organic pollutants. Environ. Toxicol. Chem. 35, 1656–1666. doi: 10.1002/etc.3361
Bergmann, M. Gutow, L., and Klages, M. (eds.) (2015). ‘Marine Anthropogenic Litter’. Cham: Springer.
Bergmann, M., Tekman, M. B., and Gutow, L. (2017). Marine litter: sea change for plastic pollution. Nature 544:297.
Besseling, E., Foekema, E. M., Van Franeker, J. A., Leopold, M. F., Kühn, S., Rebolledo, E. B., et al. (2015). Microplastic in a macro filter feeder: humpback whale Megaptera novaeangliae. Mar. Pollut. Bull. 95, 248–252. doi: 10.1016/j.marpolbul.2015.04.007
Besseling, E., Wegner, A., Foekema, E. M., Van Den Heuvel-Greve, M. J., and Koelmans, A. A. (2013). Effects of microplastic on fitness and PCB bioaccumulation by the lugworm Arenicola marina (L.). Environ. Sci. Technol. 47, 593–600. doi: 10.1021/es302763x
Borgå, K., Fisk, A. T., Hoekstra, P. F., and Muir, D. C. G. (2004). Biological and chemical factors of importance in the bioaccumulation and trophic transfer of persistent organochlorine contaminants in Arctic marine food webs. Environ. Toxicol. Chem. 23, 2367–2385. doi: 10.1897/03-518
Borgå, K., Kidd, K. A., Muir, D. C. G., Berglund, O., Conder, J. M., and Gobas, F. A. P. C. (2012). Trophic magnification factors: considerations of ecology, ecosystems, and study design.Integr. Environ. Assess. Manag. 8, 64–84. doi: 10.1002/ieam.244
Botterell, Z. L., Beaumont, N., Dorrington, T., Steinke, M., Thompson, R. C., and Lindeque, P. K. (2019). Bioavailability and effects of microplastics on marine zooplankton: a review. Environ. Pollut. 245, 98–110. doi: 10.1016/j.envpol.2018.10.065
Braid, H. E., Deeds, J., DeGrasse, S. L., Wilson, J. J., Osborne, J., and Hanner, R. H. (2012). Preying on commercial fisheries and accumulating paralytic shellfish toxins: a dietary analysis of invasive Dosidicus gigas (Cephalopoda Ommastrephidae) stranded in Pacific Canada. Mar. Biol. 159, 25–31. doi: 10.1007/s00227-011-1786-4
Browne, M. A., Galloway, T., and Thompson, R. (2007). Microplastic–an emerging contaminant of potential concern? Integr. Environ. Assess. Manag. 3, 559–566. doi: 10.1002/ieam.5630030215
Chen, H. Q., Zhao, R. F., Wang, B., Zheng, L. N., Ouyang, H., Wang, H. L., et al. (2018). Acute oral administration of single-walled carbon nanotubes increases intestinal permeability and inflammatory responses: association with the changes in gut microbiota in mice. Adv. Healthcare Mater. 7:1701313. doi: 10.1002/adhm.201701313
Cole, M., Lindeque, P., Fileman, E., Halsband, C., Goodhead, R., Moger, J., et al. (2013). Microplastic ingestion by zooplankton. Environ. Sci. Technol. 47, 6646–6655. doi: 10.1021/es400663f
Collicutt, B., Juanes, F., and Dudas, S. E. (2019). Microplastics in juvenile Chinook salmon and their nearshore environments on the east coast of Vancouver Island. Environ. Pollut. 244, 135–142. doi: 10.1016/j.envpol.2018.09.137
Conder, J. M., Gobas, F. A., Borgå, K., Muir, D. C., and Powell, D. E. (2012). Use of trophic magnification factors and related measures to characterize bioaccumulation potential of chemicals. Integr. Environ. Assess. Manag. 8, 85–97. doi: 10.1002/ieam.216
Cox, K. D., Covernton, G. A., Davies, H. L., Dower, J. F., Juanes, F., and Dudas, S. E. (2019). Human consumption of microplastics. Environ. Sci. Technol. 53, 7068–7074. doi: 10.1021/acs.est.9b01517
Critchell, K., and Hoogenboom, M. O. (2018). Effects of microplastic exposure on the body condition and behaviour of planktivorous reef fish (Acanthochromis polyacanthus). PLoS One 13:e0193308. doi: 10.1371/journal.pone.0193308
Desforges, J. P. W., Galbraith, M., Dangerfield, N., and Ross, P. S. (2014). Widespread distribution of microplastics in subsurface seawater in the NE Pacific Ocean. Mar. Pollut. Bull. 79, 94–99. doi: 10.1016/j.marpolbul.2013.12.035
Desforges, J. P. W., Galbraith, M., and Ross, P. S. (2015). Ingestion of microplastics by zooplankton in the Northeast Pacific Ocean. Arch. Environ. Contam. Toxicol. 69, 320–330. doi: 10.1007/s00244-015-0172-5
Diepens, N. J., and Koelmans, A. A. (2018). Accumulation of plastic debris and associated contaminants in aquatic food webs. Environ. Sci. Technol. 52, 8510–8520. doi: 10.1021/acs.est.8b02515
Dimitrijevic, J. (2018). Application of the Blue Mussel (Mytilus edulis) as an Indicator of Microplastic Pollution within the Salish Sea. Master thesis, Simon Fraser University, Burnaby, BC.
Duis, K., and Coors, A. (2016). Microplastics in the aquatic and terrestrial environment: sources (with a specific focus on personal care products), fate and effects. Environ. Sci. Europe 28, 1–25. doi: 10.1186/s12302-015-0069-y
Eriksen, M., Lebreton, L. C., Carson, H. S., Thiel, M., Moore, C. J., Borerro, J. C., et al. (2014). Plastic pollution in the world’s oceans: more than 5 trillion plastic pieces weighing over 250,000 tons afloat at sea. PLoS One 9:e111913. doi: 10.1371/journal.pone.0111913
Eriksson, C., and Burton, H. (2003). Origins and biological accumulation of small plastic particles in fur seals from Macquarie Island. Ambio 32, 380–384. doi: 10.1579/0044-7447-32.6.380
Everaert, G., Van Cauwenberghe, L., De Rijcke, M., Koelmans, A. A., Mees, J., Vandegehuchte, M., et al. (2018). Risk assessment of microplastics in the ocean: modelling approach and first conclusions. Environ. Pollut. 242, 1930–1938. doi: 10.1016/j.envpol.2018.07.069
Farrell, P., and Nelson, K. (2013). Trophic level transfer of microplastic: Mytilus edulis (L.) to Carcinus maenas (L.). Environ. Pollut. 177, 1–3. doi: 10.1016/j.envpol.2013.01.046
Fisheries and Oceans Canada (2013). Recovery Strategy for the North Pacific Humpback Whale (Megaptera novaeangliae) in Canada. Species at Risk Act Recovery Strategy Series. Ottawa, ON: Fisheries and Oceans Canada (DFO), 67.
Ford, J. K. B., and Ellis, G. M. (2006). Selective foraging by fish-eating killer whales Orcinus orca in British Columbia. Mar. Ecol. Prog. Ser. 316, 185–199. doi: 10.3354/meps316185
Ford, J. K. B., Ellis, G. M., Olesiuk, P. F., and Balcomb, K. C. (2010). Linking killer whale survival and prey abundance: food limitation in the oceans’ apex predator? Biol. Lett. 6, 139–142. doi: 10.1098/rsbl.2009.0468
Ford, J. K. B., Rambeau, A. L., Abernethy, R. M., Boogaards, M. D., Nichol, L. M., and Spaven, L. D. (2009a). An Assessment of the Potential for Recovery of Humpback Whales off the Pacific Coast of Canada: Canadian Science Advisory. Secretariat. Research. Document. 2009/015. Ottawa, ON: Fisheries and Oceans Canada, DFO, 33.
Ford, J. K. B., Wright, B. M., Ellis, G. M., and Candy, J. R. (2009b). Chinook Salmon Predation by Resident Killer Whales: Seasonal and Regional Selectivity, Stock Identity of Prey, and Consumption Rates. Canadian Science Advisory Secretariat. Research. Document. 101. Ottawa, ON: Fisheries and Oceans Canada, DFO, 1–43.
Fossi, M. C., Marsili, L., Baini, M., Giannetti, M., Coppola, D., Guerranti, C., et al. (2016). Fin whales and microplastics: the Mediterranean Sea and the Sea of Cortez scenarios. Environ. Pollut. 209, 68–78. doi: 10.1016/j.envpol.2015.11.022
Fossi, M. C., Panti, C., Guerranti, C., Coppola, D., Giannetti, M., Marsili, L., et al. (2012). Are baleen whales exposed to the threat of microplastics? A case study of the Mediterranean fin whale (Balaenoptera physalus). Mar. Pollut. Bull. 64, 2374–2379. doi: 10.1016/j.marpolbul.2012.08.013
Gall, S. C., and Thompson, R. C. (2015). The impact of debris on marine life. Mar. Pollut. Bull. 92, 170–179. doi: 10.1016/j.marpolbul.2014.12.041
Galloway, T. (2015). “Micro- and nano-plastics and human health,” in Marine Anthropogenic Litter, eds M. Bergmann, L. Gutow, and M. Klages (Cham: Springer), 343–366. doi: 10.1007/978-3-319-16510-3_13
Germanov, E. S., Marshall, A. D., Bejder, L., Fossi, M. C., and Loneragan, N. R. (2018). Microplastics: no small problem for filter-feeding megafauna. Trends Ecol. Evol. 33, 227–232. doi: 10.1016/j.tree.2018.01.005
GESAMP (2010). “IMO/FAO/UNESCO-IOC/UNIDO/WMO/IAEA/UN/UNEP Joint group of experts on the scientific aspects of marine environmental protection,” in Proceedings of the GESAMP International Workshop on Plastic Particles as a Vector in Transporting Persistent, Bio-Accumulating and Toxic Substances in the Oceans June 28-30 2010. Rep. Stud. No. 82, eds T. Bowmer and P. J. Kershaw (Paris: UNESCO-IOC), 68.
Gobas, F. A. P. C., de Wolf, W., Verbruggen, E., Plotzke, K., and Burkhard, L. (2009). Revisiting bioaccumulation criteria for POPs and PBT assessments. Integr. Environ. Assess. Manag. 5, 624–637. doi: 10.1897/ieam_2008-089.1
Gouin, T., Roche, N., Lohmann, R., and Hodges, G. (2011). A thermodynamic approach for assessing the environmental exposure of chemicals absorbed to microplastic. Environ. Sci. Technol. 45, 1466–1472. doi: 10.1021/es1032025
Green, D. S., Colgan, T. J., Thompson, R. C., and Carolan, J. C. (2019). Exposure to microplastics reduces attachment strength and alters the haemolymph proteome of blue mussels (Mytilus edulis). Environ. Pollut. 246, 423–434. doi: 10.1016/j.envpol.2018.12.017
Gregory, M. R. (2009). Environmental implications of plastic debris in marine settings–entanglement, ingestion, smothering, hangers-on, hitch-hiking and alien invasions. Philos. Trans. R. Soc. B Biol. Sci. 364, 2013–2025. doi: 10.1098/rstb.2008.0265
Grellier, K., and Hammond, P. S. (2006). Robust digestion and passage rate estimates for hard parts of grey seal (Halichoerus grypus) prey. Can. J. Fish. Aquat. Sci. 63, 1982–1998. doi: 10.1139/f06-092
Güven, O., Gökdag, K., Jovanoviæ, B., and Kideyş, A. E. (2017). Microplastic litter composition of the Turkish territorial waters of the Mediterranean Sea, and its occurrence in the gastrointestinal tract of fish. Environ. Pollut. 223, 286–294. doi: 10.1016/j.envpol.2017.01.025
Healey, M. C. (1991). “Life history of Chinook salmon (Oncorhynchus tshawytscha),” in Pacific Salmon Life Histories, eds C. Groot and L. Margolis (Vancouver, BC: University of British Columbia Press), 313–393.
Hernandez-Gonzalez, A., Saavedra, C., Gago, J., Covelo, P., Santos, M. B., and Pierce, G. J. (2018). Microplastics in the stomach contents of common dolphin (Delphinus delphis) stranded on the Galician coasts (NW Spain, 2005–2010). Mar. Pollut. Bull. 137, 526–532. doi: 10.1016/j.marpolbul.2018.10.026
Hocking, D. P., Marx, F. G., Park, T., Fitzgerald, E. M. G., and Evans, A. R. (2017). A behavioural framework for the evolution of feeding in predatory aquatic mammals. Proc. R. Soc. B 284:20162750. doi: 10.1098/rspb.2016.2750
Horstmann, L. (2018). “Gastrointestinal Tract,” in Encyclopedia of Marine Mammals, 3rd Edn, eds B. Würsig, J. G. M. Thewissen, and K. M. Kovacs (San Diego, CA: Elsevier), 397–400. doi: 10.1016/B978-0-12-804327-1.00007-8
Jambeck, J. R., Geyer, R., Wilcox, C., Siegler, T. R., Perryman, M., Andrady, A., et al. (2015). Plastic waste inputs from land into the ocean. Science 347, 768–771. doi: 10.1126/science.1260352
Jemec, A., Horvat, P., Kunej, U., Bele, M., and Krzan, A. (2016). Uptake and effects of microplastic textile fibers on freshwater crustacean Daphnia magna. Environ. Pollut. 219, 201–209. doi: 10.1016/j.envpol.2016.10.037
Jovanović, B. (2017). Ingestion of microplastics by fish and its potential consequences from a physical perspective. Integr. Environ. Assess. Manag. 3, 510–515. doi: 10.1002/ieam.1913
Kazmiruk, T. N., Kazmiruk, V. D., and Bendell, L. I. (2018). Abundance and distribution of microplastics within surface sediments of a key shellfish growing region of Canada. PLoS One 13:e0196005. doi: 10.1371/journal.pone.0196005
Koelmans, A. A. (2015). “Modeling the role of microplastics in bioaccumulation of organic chemicals to marine aquatic organisms. A critical review,” in Marine Anthropogenic Litter, eds M. Bergmann, L. Gutow, and M. Klages (Cham: Springer), 309–324. doi: 10.1007/978-3-319-16510-3_11
Koelmans, A. A., Besseling, E., and Foekema, E. M. (2014a). Leaching of plastic additives to marine organisms. Environ. Pollut. 187, 49–54. doi: 10.1016/j.envpol.2013.12.013
Koelmans, A. A., Besseling, E., Wegner, A., and Foekema, E. M. (2013a). Correction to plastic as a carrier of POPs to aquatic organisms: a model analysis. Environ. Sci. Technol. 47, 8992–8993.
Koelmans, A. A., Besseling, E., Wegner, A., and Foekema, E. M. (2013b). Plastic as a carrier of POPs to aquatic organisms: a model analysis. Environ. Sci. Technol. 47, 7812–7820. doi: 10.1021/es401169n
Koelmans, A. A., Gouin, T., Thompson, R., Wallace, N., and Arthur, C. (2014b). Plastics in the marine environment. Environ. Toxicol. Chem. 33, 5–10.
Kühn, S., Bravo Rebolledo, E. L., and van Franeker, J. A. (2015). “Deleterious effects of litter on marine life,” in Marine Anthropogenic Litter, eds M. Bergmann, L. Gutow, and M. Klages (Cham: Springer), 75–116. doi: 10.1007/978-3-319-16510-3_4
Levine, G. A., Selberg, K. T., Sweeney, J. C., Stone, L. R., Campbell, M., Yanovitch, C., et al. (2014). “Gastric foreign bodies in small odontocetes: a clinical approach,” in Proceedings of the 45th Conference of the International Association for Aquatic Animal Medicine (IAAAM), May 17-21, 2014 (Gold Coast, Qld: Sea World), 1–5.
Lohmann, R. (2017). Microplastics are not important for the cycling and bioaccumulation of organic pollutants in the oceans–but should microplastics be considered POPs themselves? Integr. Environ. Assess. Manag. 13, 460–465. doi: 10.1002/ieam.1914
Lusher, A. (2015). “Microplastics in the marine environment: distribution, interactions and effects,” in Marine Anthropogenic Litter, eds M. Bergmann, L. Gutow, and M. Klages (Cham: Springer), 245–307. doi: 10.1007/978-3-319-16510-3_10
Lusher, A. L., Hernandez-milian, G., Berrow, S., Rogan, E., and Connor, I. O. (2018). Incidence of marine debris in cetaceans stranded and bycaught in Ireland: recent findings and a review of historical knowledge. Environ. Pollut. 232, 467–476. doi: 10.1016/j.envpol.2017.09.070
Lusher, A. L., Hernandez-Milian, G., O’Brien, J., Berrow, S., O’Connor, I., and Officer, R. (2015). Microplastic and macroplastic ingestion by a deep diving, oceanic cetacean: the true’s beaked whale Mesoplodon mirus. Environ. Pollut. 199, 185–191. doi: 10.1016/j.envpol.2015.01.023
Lusher, A. L., McHugh, M., and Thompson, R. C. (2013). Occurrence of microplastics in the gastrointestinal tract of pelagic and demersal fish from the English channel. Mar. Pollut. Bull. 67, 94–99. doi: 10.1016/j.marpolbul.2012.11.028
Mintzer, V. J., Gannon, D. P., Barros, N. B., and Read, A. J. (2008). Stomach contents of mass stranded short-finned pilot whales (Globicephala macrorhynchus) from North Carolina. Mar. Mammal Sci. 24, 290–302. doi: 10.1111/j.1748-7692.2008.00189.x
Moore, C. J. (2008). Synthetic polymers in the marine environment: a rapidly increasing, long-term threat. Environ. Res. 108, 131–139. doi: 10.1016/j.envres.2008.07.025
Moore, R. C., Loseto, L., Noel, M., Etemadifar, A., Brewster, J. D., MacPhee, S., et al. (2020). Microplastics in beluga whales (Delphinapterus leucas) from the Eastern Beaufort Sea. Mar. Pollut. Bull. 150:110723. doi: 10.1016/j.marpolbul.2019.110723
Nel, H., and Froneman, P. (2018). Presence of microplastics in the tube structure of the reef- building polychaetes Gunnarea gaimardi (Quatrefages 1848). Afr. J. Mar. Sci. 40, 87–89. doi: 10.2989/1814232x.2018.1443835
Nelms, S. E., Barnett, J., Brownlow, A., Davison, N. J., Deaville, R., Galloway, T. S., et al. (2019). Microplastics in marine mammals stranded around the British coast: ubiquitous but transitory? Sci. Rep. 9:1075.
Nelms, S. E., Galloway, T. S., Godley, B. J., Jarvis, D. S., and Lindeque, P. K. (2018). Investigating microplastic trophic transfer in marine top predators. Environ. Pollut. 238, 999–1007. doi: 10.1016/j.envpol.2018.02.016
Nilssen, K. T., Lindstrøm, U., Westgaard, J. I., Lindblom, L., Blencke, T. R., and Haug, T. (2019). Diet and prey consumption of grey seals (Halichoerus grypus) in Norway. Mar. Biol. Res. 15, 137–149. doi: 10.1080/17451000.2019.1605182
Provencher, J. F., Ammendolia, J., Rochman, C. M., and Mallory, M. L. (2019). Assessing plastic debris in aquatic food webs: what we know and don’t know about uptake and trophic transfer. Environ. Rev 27, 304–317. doi: 10.1139/er-2018-0079
Qiao, R., Deng, Y., Zhang, S., Wolosker, M. B., Zhu, Q., Ren, H., et al. (2019). Accumulation of different shapes of microplastics initiates intestinal injury and gut microbiota dysbiosis in the gut of zebrafish. Chemosphere 236:124334. doi: 10.1016/j.chemosphere.2019.07.065
Rochman, C. M. (2015). “The complex mixture, fate and toxicity of chemicals associated with plastic debris in the marine environment,” in Marine Anthropogenic Litter, eds M. Bergmann, L. Gutow, and M. Klages (Cham: Springer), 117–140. doi: 10.1007/978-3-319-16510-3_5
Rochman, C. M., Brookson, C., Bikker, J., Djuric, N., Earn, A., Bucci, K., et al. (2019). Rethinking microplastics as a diverse contaminant suite. Environ. Toxicol. Chem. 38, 703–711. doi: 10.1002/etc.4371
Rochman, C. M., Browne, M. A., Halpern, B. S., Hentschel, B. T., Hoh, E., Karapanagioti, H. K., et al. (2013a). Classify plastic waste as hazardous. Nature 494, 169–171.
Rochman, C. M., Hoh, E., Kurobe, T., and Teh, S. J. (2013b). Ingested plastic transfers hazardous chemicals to fish and induces hepatic stress. Sci. Rep. 3:3263.
Romeo, T., Pietro, B., Pedà, C., Consoli, P., Andaloro, F., and Fossi, M. C. (2015). First evidence of presence of plastic debris in stomach of large pelagic fish in the Mediterranean Sea. Mar. Pollut. Bull. 95, 358–361. doi: 10.1016/j.marpolbul.2015.04.048
Ross, P. S., and Morales-Caselles, C. (2015). Out of sight, but no longer out of mind: microplastics as a global pollutant. Integr. Environ. Assess. Manag. 11, 721–722. doi: 10.1002/ieam.1681
Santana, M. F. M., Moreira, F. T., and Turra, A. (2017). Trophic transference of microplastics under a low exposure scenario: insights on the likelihood of particle cascading along marine food-webs. Mar. Pollut. Bull. 121, 154–159. doi: 10.1016/j.marpolbul.2017.05.061
Setälä, O., Fleming-Lehtinen, V., and Lehtiniemi, M. (2014). Ingestion and transfer of microplastics in the planktonic food web. Environ. Pollut. 185, 77–83. doi: 10.1016/j.envpol.2013.10.013
Setälä, O., Norkko, J., and Lehtiniemi, M. (2016). Feeding type affects microplastic ingestion in a coastal invertebrate community. Mar. Pollut. Bull. 102, 95–101. doi: 10.1016/j.marpolbul.2015.11.053
Sigler, M. (2014). The effects of plastic pollution on aquatic wildlife: current situations and future solutions. Water Air Soil Pollut. 225:2184. doi: 10.1007/s11270-014-2184-6
Sigurjónsson, J., and Víkingsson, G. A. (1997). Seasonal abundance of and estimated food consumption by cetaceans in Icelandic and adjacent waters. J. Northwest Atl. Fish. Sci. 22, 271–287. doi: 10.2960/j.v22.a20
Simmonds, M. P. (2012). Cetaceans and marine debris: the great unknown. J. Mar. Biol. 2012, 1–8. doi: 10.1155/2012/684279
Taylor, M. L., Gwinnett, C., Robinson, L. F., and Woodall, L. C. (2016). Plastic microfibre ingestion by deep-sea organisms. Sci. Rep. 6:33997. doi: 10.1038/srep33997
Teuten, E. L., Saquing, J. M., Knappe, D. R. U., Barlaz, M. A., Jonsson, S., Björn, A., et al. (2009). Transport and release of chemicals from plastics to the environment and to wildlife.Philos. Trans. R. Soc. B Biol. Sci. 364, 2027–2045.
UNEP (2001). “The stockholm convention on persistent organic pollutants,” in In Proceedings of the Final Act of the Conference of Plenipotentiaries on United Nations Environment Program. Stockholm, Sweden, May 22–23, 2001 (Geneva: UNEP).
Van Cauwenberghe, L. (2015). Occurrence, Effects and Risks of Marine Microplastics. 213. Ph.D. thesis Applied Biological Sciences, Ghent University, Ghent.
Walters, D. M., Jardine, T. D., Cade, B. S., Kidd, K. A., Derek, C. G. M., and Leipzig-Scott, P. (2016). Trophic magnification of organic chemicals: a global synthesis. Environ. Sci. Technol. 50, 4650–4658. doi: 10.1021/acs.est.6b00201
Watts, A. J., Lewis, C., Goodhead, R. M., Beckett, S. J., Moger, J., Tyler, C. R., et al. (2014). Uptake and retention of microplastics by the shore crab Carcinus maenas. Environ. Sci. Technol. 48, 8823–8830.
WHO (2019). Microplastics in Drinking-Water. Licence: CC BY-NC-SA 3.0 IGO. Geneva: World Health Organization.
Wilson, L. J., and Hammond, P. S. (2019). The diet of harbour and grey seals around Britain: examining the role of prey as a potential cause of harbour seal declines. Aquat. Conserv. Mar. Freshwater Ecosyst. 29, 71–85. doi: 10.1002/aqc.3131
Woods, M., Stack, M., Fields, D., Shaw, S., and Matrai, P. (2018). Microplastic fiber uptake, ingestion, and egestion rates in the blue mussel (Mytilus edulis). Mar. Pollut. Bull. 137, 638–645. doi: 10.1016/j.marpolbul.2018.10.061
Keywords: microplastics, exposure, elimination rate, bioaccumulation, trophic magnification, southern resident killer whale, humpback whale, marine mammals
Citation: Alava JJ (2020) Modeling the Bioaccumulation and Biomagnification Potential of Microplastics in a Cetacean Foodweb of the Northeastern Pacific: A Prospective Tool to Assess the Risk Exposure to Plastic Particles. Front. Mar. Sci. 7:566101. doi: 10.3389/fmars.2020.566101
Received: 27 May 2020; Accepted: 31 August 2020;
Published: 22 September 2020.
Edited by:
Haibo Zhang, Zhejiang Agriculture and Forestry University, ChinaReviewed by:
Chenxi Wu, Institute of Hydrobiology (CAS), ChinaHuang Wei, Ministry of Natural Resources, China
Copyright © 2020 Alava. This is an open-access article distributed under the terms of the Creative Commons Attribution License (CC BY). The use, distribution or reproduction in other forums is permitted, provided the original author(s) and the copyright owner(s) are credited and that the original publication in this journal is cited, in accordance with accepted academic practice. No use, distribution or reproduction is permitted which does not comply with these terms.
*Correspondence: Juan José Alava, j.alava@oceans.ubc.ca