Unconventional Sea Surface Temperature Regime Around Japan in the 2000s–2010s: Potential Influences on Major Fisheries Resources
 Hiroshi Kuroda1*
  Toshihiko Saito2 Toshiki Kaga3
  Akinori Takasuka4 Yasuhiro Kamimura3
  Sho Furuichi3
  Takuya Nakanowatari1
- 1Fisheries Resources Institute, Japan Fisheries Research and Education Agency, Kushiro, Japan
- 2Fisheries Resources Institute, Japan Fisheries Research and Education Agency, Sapporo, Japan
- 3Fisheries Resources Institute, Japan Fisheries Research and Education Agency, Yokohama, Japan
- 4Graduate School of Agricultural and Life Sciences, The University of Tokyo, Tokyo, Japan
Climate-change associated changes in oceanographic conditions, particularly sea surface temperatures (SSTs), have systematically affected many marine fisheries resources around Japan. The Pacific Decadal Oscillation (PDO) index is considered one of the most important climate indices for describing basin-scale SST variations in the North Pacific, which are closely related to decadal variations in fisheries resources. Time series of the PDO index has been used to conventionally classify decadal conditions of ocean and fisheries resources around Japan as either warming or cooling regimes. It is now clear that for the 2000s to the mid-2010s, mostly during the “global surface warming slowdown,” the SST regime around Japan was unconventional; despite the PDO index being in a negative phase, which normally corresponds to a warming regime around Japan, SSTs exhibited decadal cooling in some waters and seasons. SSTs in the western part of the North Pacific subtropical gyre gradually decreased, particularly in autumn–spring, whereas SSTs in the western subarctic gyre and the Sea of Okhotsk increased. Moreover, SSTs between the subtropical and subarctic waters around northern Japan exhibited seasonal contrasts that were decadally intensified through the combined effects of cooling in winter–spring and warming in summer–autumn. Some major marine fisheries resources around Japan showed decadal increases or decreases beginning in the mid-2000s, and appeared to respond to the unconventional SST changes in their early life stages. In this paper, we review atmosphere and ocean conditions around Japan in the 2000s–2010s in terms of global climate, present an overview of potential impacts of decadal SST trends on five major commercial fisheries resources (walleye pollock, chum salmon, Japanese sardine, Japanese anchovy, and Japanese flying squid), and raise awareness that an unconventional regime can appear transiently during a state of global warming.
Introduction
The Japanese archipelago is located along the Kuroshio–Oyashio western boundary current region in the North Pacific Ocean and surrounded by the eighth largest exclusive economic zone (EEZ) in the world, including parts of the North Pacific, East China Sea, Sea of Japan, and Sea of Okhotsk (Figure 1A). These oceanographic features have allowed the development of many kinds of marine fisheries, and fisheries have traditionally played an important role in food security in Japan (Makino, 2011; Kamoey, 2015). Nevertheless, most marine fisheries resources around Japan have not been stable over time but have changed through natural variations on interannual, decadal, and/or interdecadal time scales, concurrently with climate changes (e.g., Sugisaki and Murakami, 2017). One of the most important climate modes, the Pacific Decadal Oscillation (PDO) (Mantua and Hare, 2002), is closely related to variations in stocks and recruitment of many marine fisheries resources around Japan, e.g., Japanese sardine (Sardinops melanostictus), Japanese anchovy (Engraulis japonicus), Japanese flying squid (Todarodes pacificus), Pacific saury (Cololabis saira), and chum salmon (Oncorhynchus keta) (Chavez et al., 2003; Sakurai, 2007; Takasuka et al., 2008a; Kaeriyama et al., 2014; Oozeki et al., 2019).
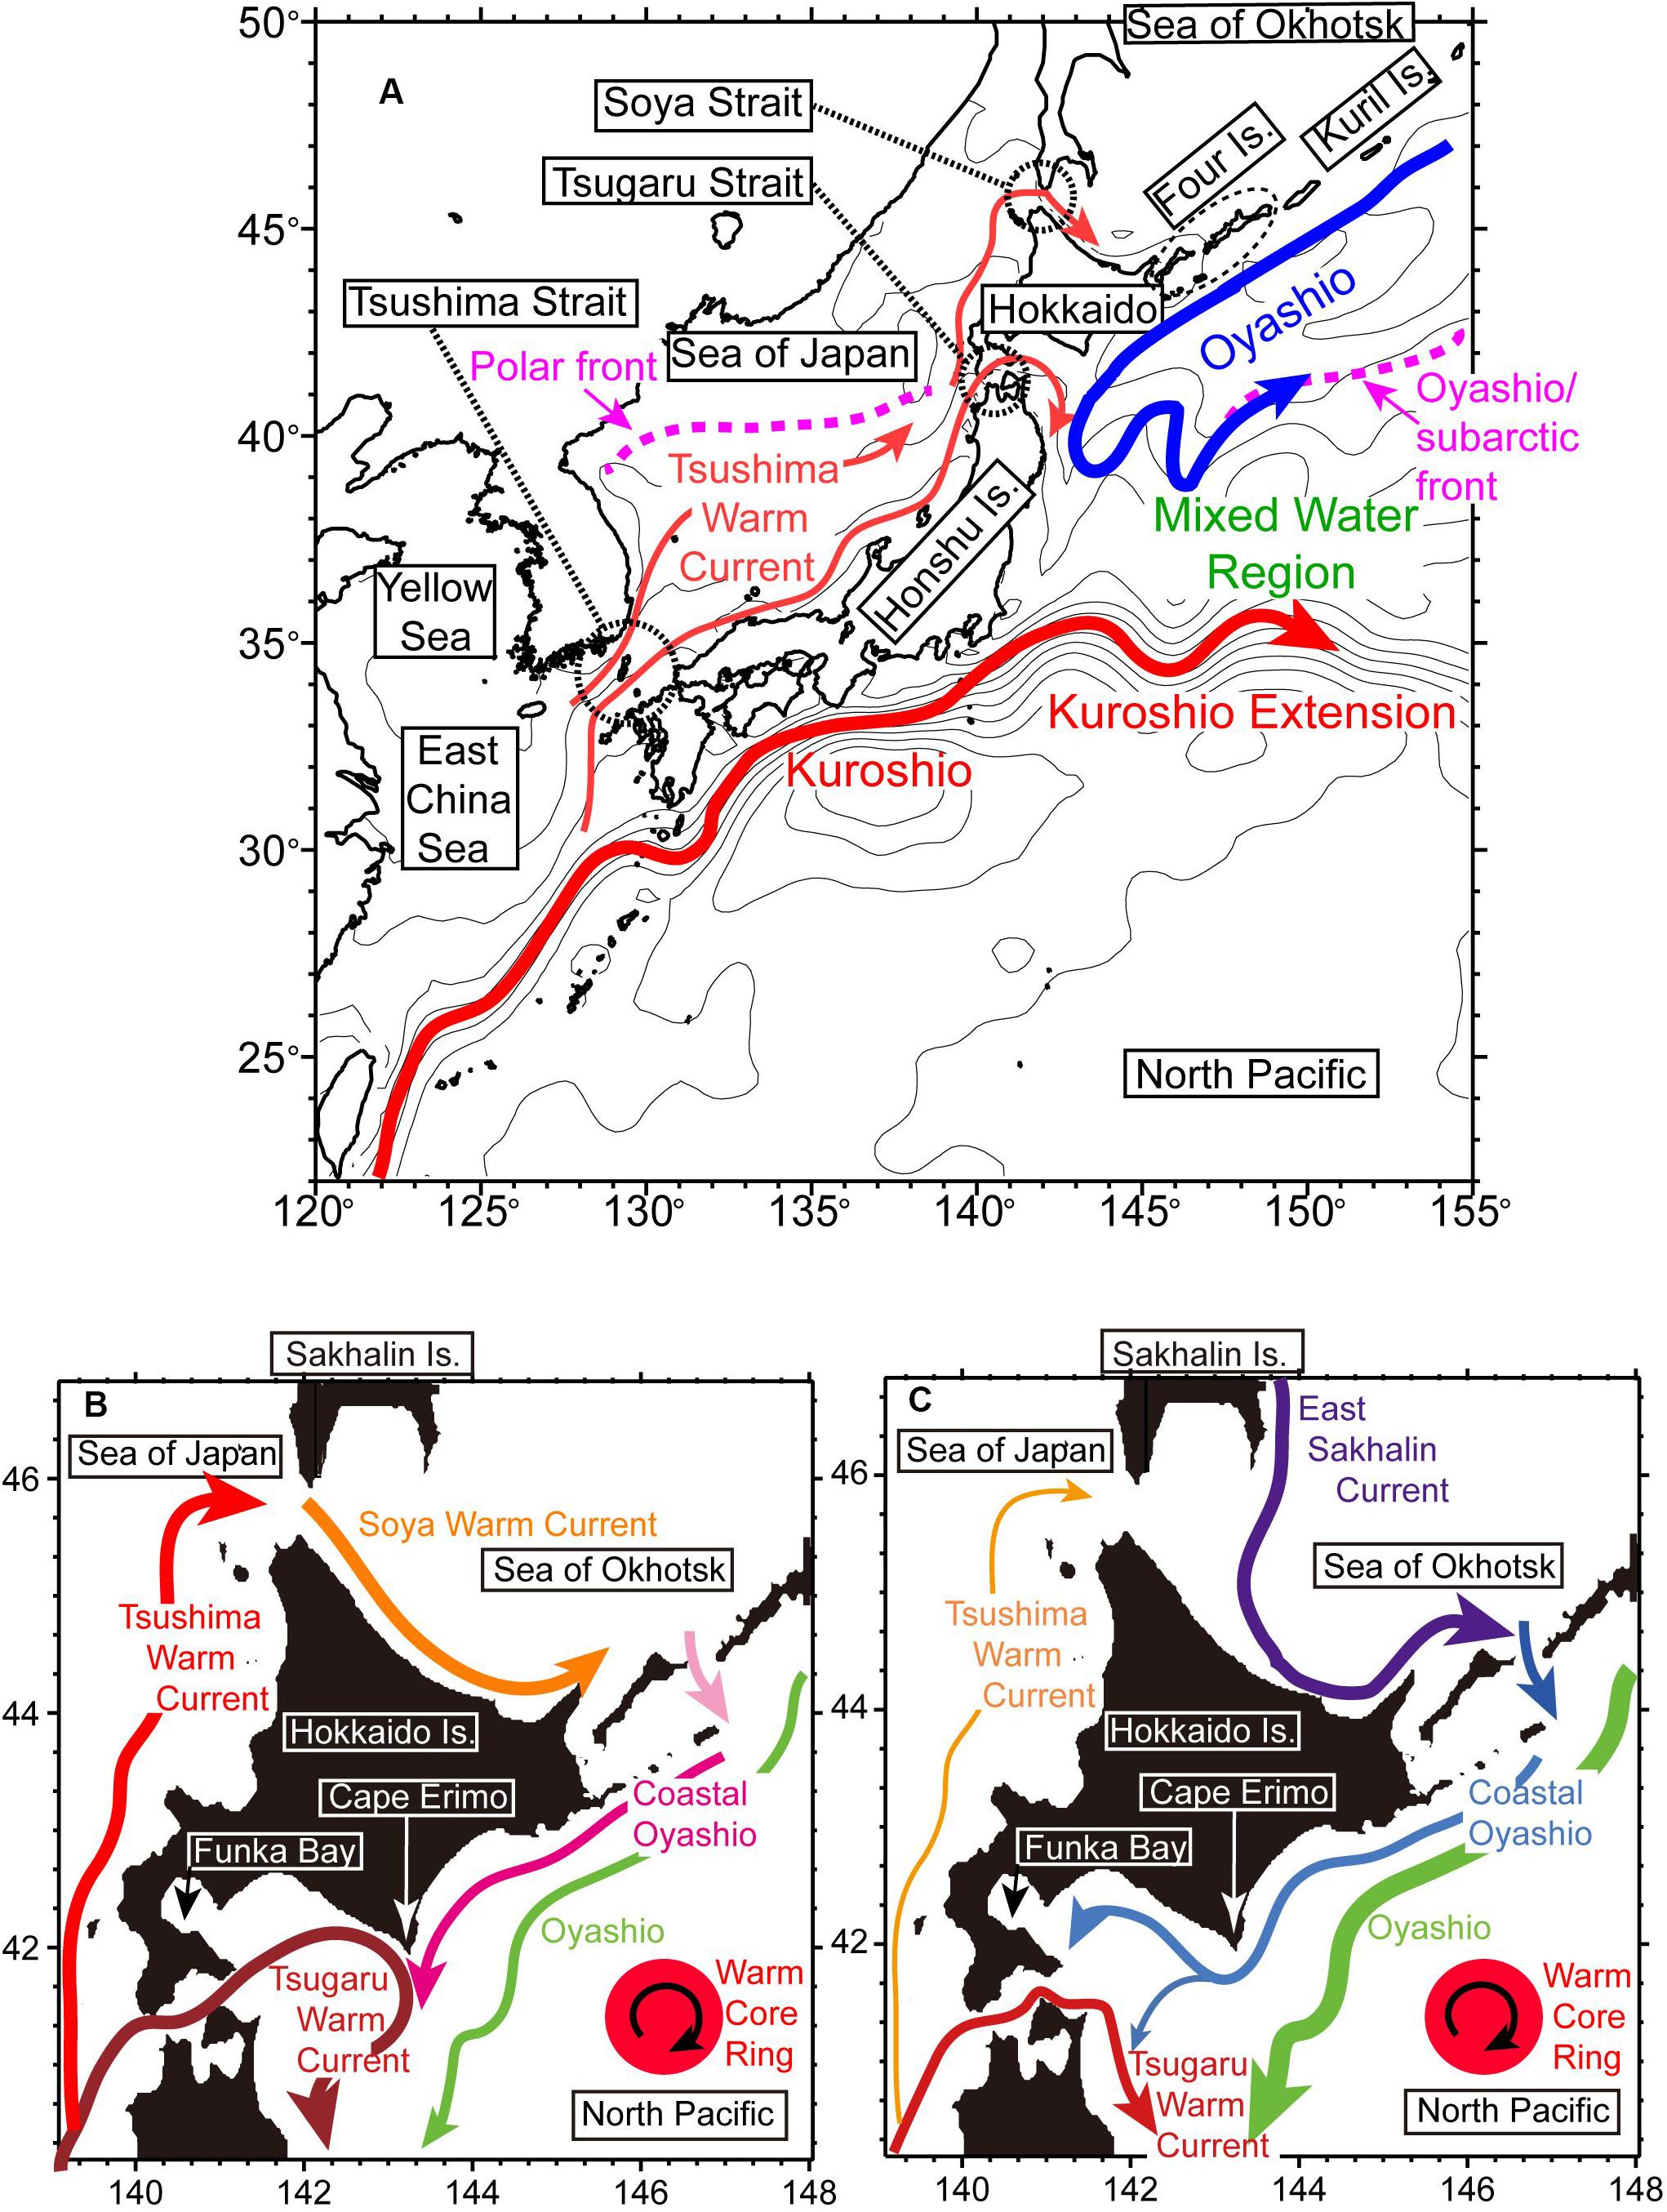
Figure 1. (A) Schematic view of sea-surface currents around Japan. The Polar front in the Sea of Japan and the Oyashio/subarctic front in the North Pacific are indicated by pink bold dashed lines. Warm (cold) colors roughly represent warm (cold) water masses that are mainly transported by the currents. (B,C) Schematic views of seasonal sea-surface currents around Hokkaido during (B) summer–autumn and (C) winter–spring.
The PDO index is defined as the leading principal component of monthly sea surface temperature (SST) anomalies, typically north of 20°N, in the North Pacific. The spatial pattern of the PDO represents the seesaw-like basin-scale oscillations of SST anomalies between the eastern and central/western parts of the North Pacific. The PDO is also accompanied by decadal variations in the Aleutian low: the positive (negative) phase tends to appear when the Aleutian low strengthens (weakens). During positive (negative) phases, SSTs in the western/central North Pacific, including the vicinity of Japan, tend to be cool (warm). In addition, the step-like phase shifts of the PDO index are frequently interpreted as reflecting climate-regime shifts. Since the 1970s, regime shifts in the North Pacific have occurred in 1970/1971, 1976/1977, 1988/1989, and 1998/1999 (Minobe, 2002; Yasunaka and Hanawa, 2002; Jo et al., 2013); these shifts appear to have systematically affected some major fishery resources around Japan (Kawasaki, 1983; Tian et al., 2004; Kidokoro et al., 2010; Yatsu, 2019). The importance of fisheries management based on regime-shift theory was proposed by Kawasaki (2004).
SSTs around Japan in the 2000s to mid-2010s, mostly during the “global surface warming slowdown” (Figure 2A), provide evidence of an unconventional regime. During this period, the PDO index tended to be negative (Figure 2B). The negative phase generally presages a warming regime; SSTs in the western/central part of the North Pacific are warmer than the climatological mean. Nonetheless, during this period around Japan, SSTs in some waters and seasons decreased linearly. As described later in this study, basin-scale SSTs in the western part of the subtropical gyre gradually decreased, except for in summer. Meanwhile, basin-scale SSTs in the western subarctic gyre and in the Sea of Okhotsk tended to increase. Local SSTs off northern Japan between the subtropical and subarctic waters also exhibited seasonal contrasts that were decadally intensified because of the combined effects of cooling in winter–spring and warming in summer–autumn. Moreover, around the mid-2010s, when the PDO index shifted to positive, the decadal cooling trends of SSTs around Japan disappeared immediately, and instead the SSTs showed step-like increases. In short, the decadal cooling trends of SSTs around Japan in the 2000s to mid-2010s had both seasonality and regionality, which could never be predicted by basin-scale variability of the PDO. Hence, the present study refers to such SST conditions around Japan during these decades as an “unconventional regime”.
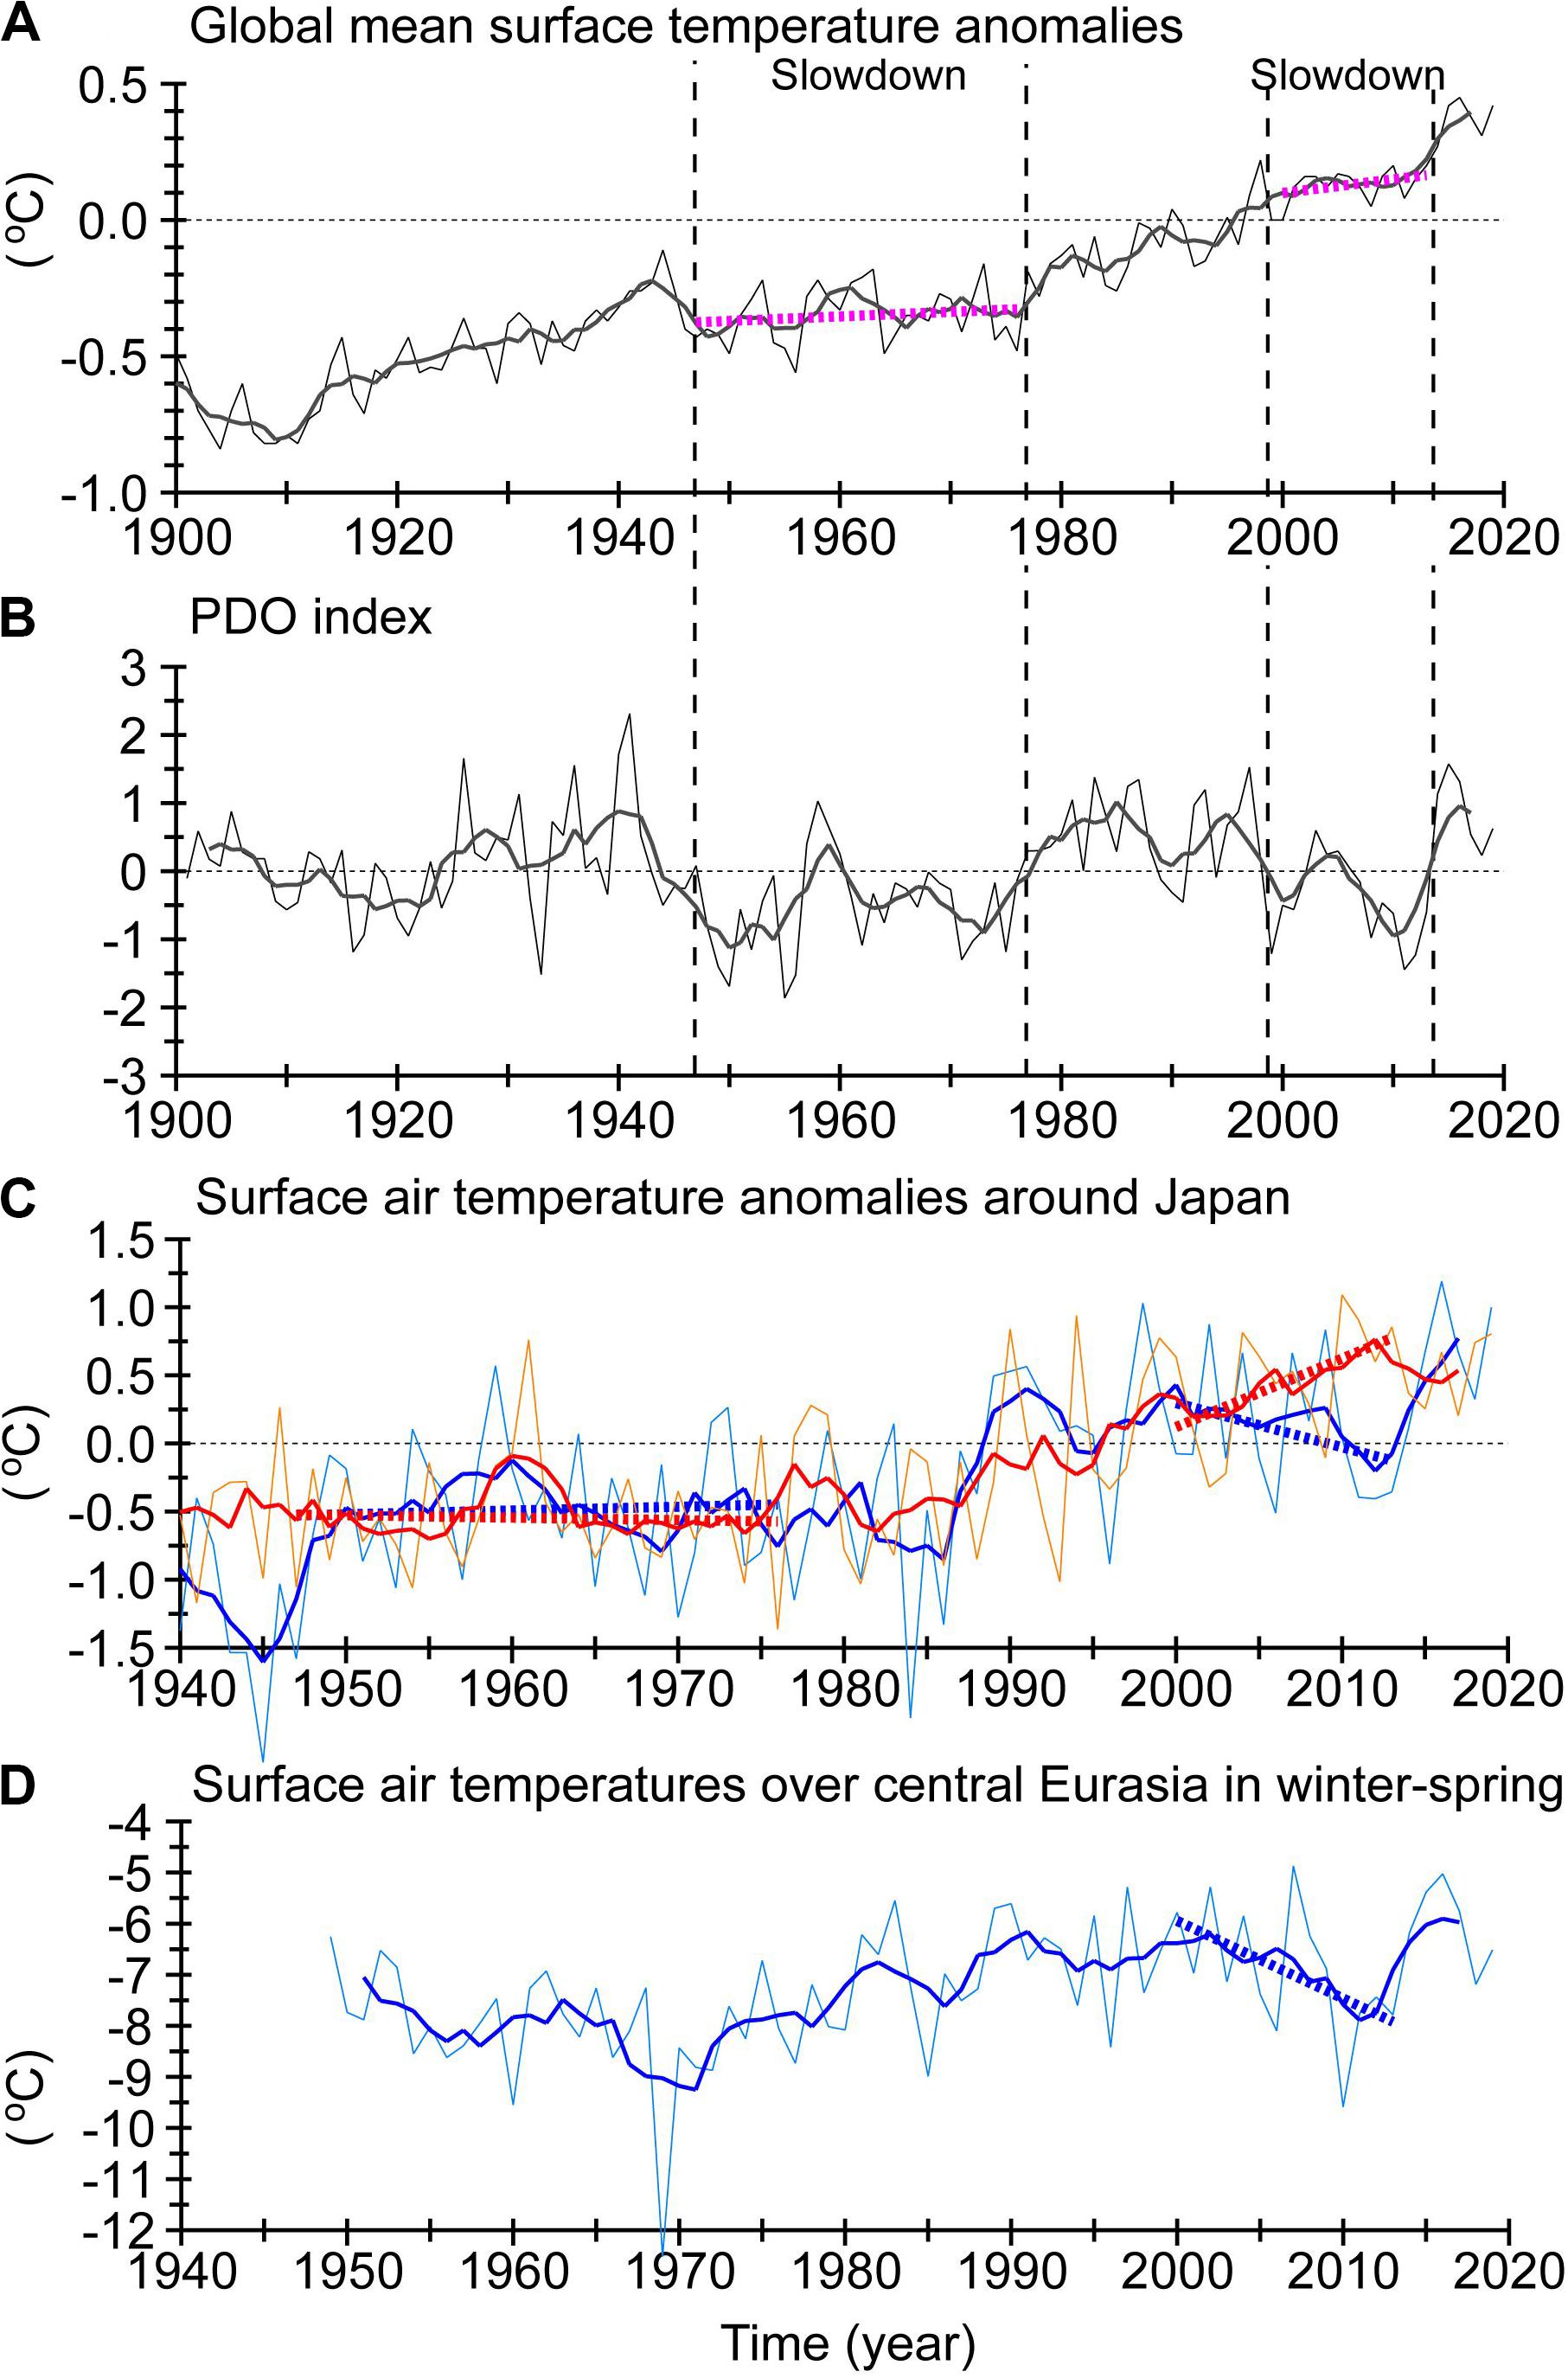
Figure 2. Time-series of annual means (thin lines) and 5-year running means (thick lines) of four climate-related indicators. Thick dashed lines denote linear trends. (A) Global mean surface temperature anomalies. (B) Time series of PDO index. (C) Land surface air temperature anomalies over Japan. In (C), orange and red (light and dark blue) lines indicate air temperatures for summer–autumn (winter–spring). (D) Land surface air temperatures in winter–spring over central Eurasia (the rectangular area from 50 to 120°E and 45 to 62°N; see Figure 3A). Data for (A–C) were downloaded from the Japan Meteorological Agency, and data for (D) are based on NCEP/NCAR reanalysis data.
Moreover, some major marine fisheries resources around Japan showed decadal increases or decreases beginning in the mid-2000s (Watanabe et al., 2017). For instance, the Pacific stock of Japanese sardine increased gradually after the mid-2000s, while that of Japanese anchovy decreased (Furuichi et al., 2020; Kamimura et al., 2020). These decadal changes after the mid-2000s also cannot be accounted for by the conventional PDO-based theory; the negative (positive) phase of the PDO usually corresponds to an anchovy/warming (sardine/cooling) regime around Japan.
The aim of this study is to summarize atmosphere and ocean conditions around Japan in the 2000s–2010s in terms of global climate change, and describe potential influences of the decadal SST trends on some major fisheries resources. We identify five major commercial fisheries resources in northern Japan (particularly around Hokkaido) that might have been affected by the unconventional SST regime.
This paper is organized as follows. First, we describe the data and methods of analysis. Next, we briefly explain oceanographic conditions around Japan from a climatological viewpoint and review atmosphere conditions based on surface air temperatures, primarily around Japan, in the 2000s–2010s in terms of global climate change. Ocean conditions based on SSTs in the 2000s–2010s are then described separately at the basin scale for the North Pacific and at the shelf scale around Hokkaido. We also describe potential impacts of decadal SST variations on five major fisheries resources. Finally, we summarize and discuss the new insights and understandings arising from this study.
Materials and Methods
We analyzed gridded SST datasets referred to as “Merged satellite and in-situ data Global Daily Sea Surface Temperature” (MGDSST) for 1982–2019. These datasets were compiled by the Japan Meteorological Agency and have a resolution of 0.25° (latitude) × 0.25° (longitude) at daily intervals (Kurihara et al., 2006).
This study employed reanalysis data from an operational ocean forecast system developed by the Japan Fisheries Research and Education Agency using the Regional Ocean Modeling System (FRA-ROMS) with a resolution of 0.1° (latitude) × 0.1° (longitude) (Kuroda et al., 2017a). The positions of the Kuroshio and Kuroshio Extension axes in 1993–2019 were estimated from reanalyzed velocity data at daily intervals by the same methods as those used by Kuroda et al. (2017a). The positions of the Oyashio/subarctic fronts were also roughly specified from reanalysis data by isolines of 5 °C at 100 m depth.
We used global surface air temperatures based on National Centers for Environmental Prediction/National Center for Atmospheric Research (NCEP/NCAR) reanalysis data at the surface, which has a resolution of 2.5° (latitude) × 2.5° (longitude) and covers the period from 1948 to 2019 (Kalnay et al., 1996).
Linear trends in several variables were estimated by using least-squares regressions to extract a decadal component from individual time-series. We assessed the statistical significance of trends by applying the Mann-Kendall test (Mann, 1945; Kendall, 1975) with inclusion of a tie correction (Helsel and Hirsch, 2002).
Throughout this study, we defined four seasons for ocean and marine fisheries resources: winter (January–March), spring (April–June), summer (July–September), and autumn (October–December). Seasons for air temperature alone precede these oceanic seasons by 1 month.
The data for commercial fisheries resources considered in this study, except for chum salmon Oncorhynchus keta, were derived from the latest stock assessment reports for the Japanese Pacific stock (JPS) of walleye pollock Gadus chalcogrammus (Sakai et al., 2020), the Pacific stocks of Japanese sardine Sardinops melanostictus (Furuichi et al., 2020) and Japanese anchovy Engraulis japonicus (Kamimura et al., 2020), and the winter spawning stock of Japanese flying squid Todarodes pacificus (Kaga et al., 2020). The stock assessments applied virtual population analysis (VPA) (Pope, 1972) to fisheries data with biological information to estimate annual abundance (number) and biomass (weight) for different year classes. The sum of the biomass for all of the year classes was used as the stock biomass. Recruitment is the abundance of the young-of-the-year portion of the stock. We used recruitment per spawning stock biomass (RPS) as a proxy for survival success or failure during the early life stages from hatching to recruitment. Note that although uncertainty in the VPA estimates is more concerning during very recent years in general, the magnitude of this uncertainty was not documented in the stock assessment reports. This type of uncertainty could be most severe for the Japanese Pacific stock of walleye pollock; in recent years, this species has mainly recruited to the fishery at around age 4 (Sakai et al., 2020), giving it the oldest age at recruitment of the above four stocks. Hence, we avoided drawing any conclusions based on biological estimates during the last few years.
Background
Overview of Oceanography Around Japan
Here, we present a brief overview of oceanographic conditions around Japan with a slight emphasis on the waters around Hokkaido in northern Japan. Prominent features include the western boundary currents of the subtropical gyre and the western subarctic gyre in the North Pacific, known as the “Kuroshio” and “Oyashio,” respectively (e.g., Qiu, 2001; Figure 1A). The Kuroshio transports warm high-salinity subtropical Kuroshio water to the vicinity of Japan, whereas the Oyashio transports cold low-salinity subarctic Oyashio water. East of Honshu Island, Kuroshio and Oyashio waters meet and mix in a complicated manner in the Mixed Water Region between the Kuroshio Extension and the Oyashio/subarctic front along the northeastward Oyashio return flow (e.g., Yasuda, 2003). From a climatological viewpoint, the Oyashio flows along the continental slope south of the Kuril and Four islands and off the southeastern coast of Hokkaido (Kuroda et al., 2017b). In some years, a clockwise mesoscale eddy with Kuroshio water, known as a “Kuroshio Warm Core Ring,” detaches from the Kuroshio Extension, approaches the Pacific coast of Hokkaido, and becomes isolated in Oyashio water (e.g., Itoh and Yasuda, 2010; Figures 1B,C).
There is another pathway for Kuroshio water to reach northern Japan. Far west of the Mixed Water Region, a branch of the Kuroshio enters the Sea of Japan via the Tsushima Strait (Figure 1A; Isobe, 1999). In the Sea of Japan, this Tsushima Warm Current transports subtropical water northeastward to the Hokkaido coast (Hase et al., 1999). A polar front almost along 40°N in the Sea of Japan separates subtropical and subarctic waters. Portions of the subtropical water in the Sea of Japan outflow to the North Pacific Ocean through the Tsugaru Strait (Conlon, 1982) and to the Sea of Okhotsk through the Soya Strait (Takizawa, 1982).
On the continental shelves around Hokkaido, coastal boundary currents are prominent throughout the year and change drastically on a seasonal time scale (Figures 1B,C) (Hanawa, 1984; Rosa et al., 2007; Ebuchi et al., 2009). In summer–autumn, the Tsushima–Tsugaru–Soya Warm Currents are dominant (Figure 1B) and the shelves around Hokkaido are covered with subtropical waters from the Sea of Japan. In winter–spring, the warm coastal boundary currents weaken while cold coastal boundary currents strengthen (Figure 1C; Kuroda et al., 2014). The East Sakhalin Current intensifies after late autumn and supplies very cold low-salinity water from the northern part of the Sea of Okhotsk to near the Hokkaido coast (Itoh and Ohshima, 2000). Some of this water outflows to the Pacific shelf (Sakamoto et al., 2010), and this so-called “Coastal Oyashio water” covers wide areas of the Pacific shelves south along the Hokkaido coast, inshore of the Oyashio. Overall, on the shelf–slope regions around Hokkaido, there are several boundaries between subtropical and subarctic waters, the dominance of which changes seasonally and interannually.
Air Temperatures Around Japan
In this section, we review air temperatures around Japan in the 2000s–2010s, together with global climate states. One of the largest recorded El Niño events occurred in 1998. Subsequently, there was a “global surface warming slowdown”1 (Figure 2A) (Easterling and Wehner, 2009; Trenberth and Fasullo, 2013; Chen and Tung, 2014; Meehl et al., 2014; Trenberth, 2015; Yan et al., 2016). A particularly important point is that SSTs over the tropical eastern Pacific Ocean persisted in a La-Niña-like pattern. Kosaka and Xie (2013) used an ocean–atmosphere coupled model with so-called “pacemaker protocol” to show that the decadal cooling of the tropical Pacific accompanied by La-Niña-like conditions caused the global surface warming slowdown of the 2000s. In contrast, global warming began to accelerate again after 2013 seemingly in response to the huge El Niño events of 2014–2016 (Figure 2A). The historical record of highest annual mean global mean surface temperature was repeatedly broken during 2014–2016, and six of the highest recorded temperatures were observed in 2014–2019. Hence, the global surface warming slowdown was sustained from 1998 to 2012 (Medhaug et al., 2017).
Note that surface air temperatures in some regions or some seasons did not necessarily exhibit a warming slowdown or pause in 1998–2012. Urabe and Maeda (2014) reported that surface air temperature anomalies averaged on the land over Japan increased (decreased) decadally during summer–autumn (winter–spring) in 1998–2013 (Figure 2C). The decadal variations likely stopped after 2013; surface air temperature anomalies in summer–autumn started to decrease after 2013, whereas those in winter–spring had a sudden, step-like jump in 2014–2015 rather than a gradual increase. Urabe and Maeda (2014) related the contrasting seasonal variations over Japan to La-Niña-like SST conditions via large-scale teleconnection, which were tied to the global surface warming slowdown. In terms of general statistics, La Niña events are associated with a high probability of cold winters and hot summers around Japan (Imada et al., 2017). That is, the relationship between the seasonal contrasts around Japan and La-Niña-like SST conditions during the slowdown period of the 2000s was qualitatively consistent.
It is worth noting that winter cooling of surface air temperatures was much more severe over central Eurasia (-2.12°C for the 13 years from 2000 to 2013; Figure 2D) than around Japan (-0.42°C for the same 13 years; Figure 2C; Horton et al., 2015; Huang et al., 2017). Some studies such as that by Johnson et al. (2018) interpreted the severe winter cooling as an extreme climate event. The decrease in surface air temperatures around Japan in winter–spring occurred near the easternmost edge of severe cooling (Figure 3A). One notable point is that surface air temperatures in winter–spring averaged over Japan were correlated with those averaged over central Eurasia (r = 0.73 for 5-year running means for 1949–2019) (Figures 2C,D). Many climate studies proposed two main mechanisms for the winter Eurasian cooling that were independent of La-Niña-like cooling in the tropical Pacific during the global surface warming slowdown of the 2000s: atmospheric internal variability (Li et al., 2015; Collow et al., 2018) and Arctic sea-ice loss (Honda et al., 2009; Mori et al., 2014, 2019; McCusker et al., 2016). However, Matsumura and Kosaka (2019) suggested that a combination of the tropical Pacific cooling and Arctic sea-ice loss contributed to the frequent Eurasian cold winters during the global surface warming slowdown in the 2000s. Thus, the exact mechanism behind the winter Eurasian cooling is still under debate.
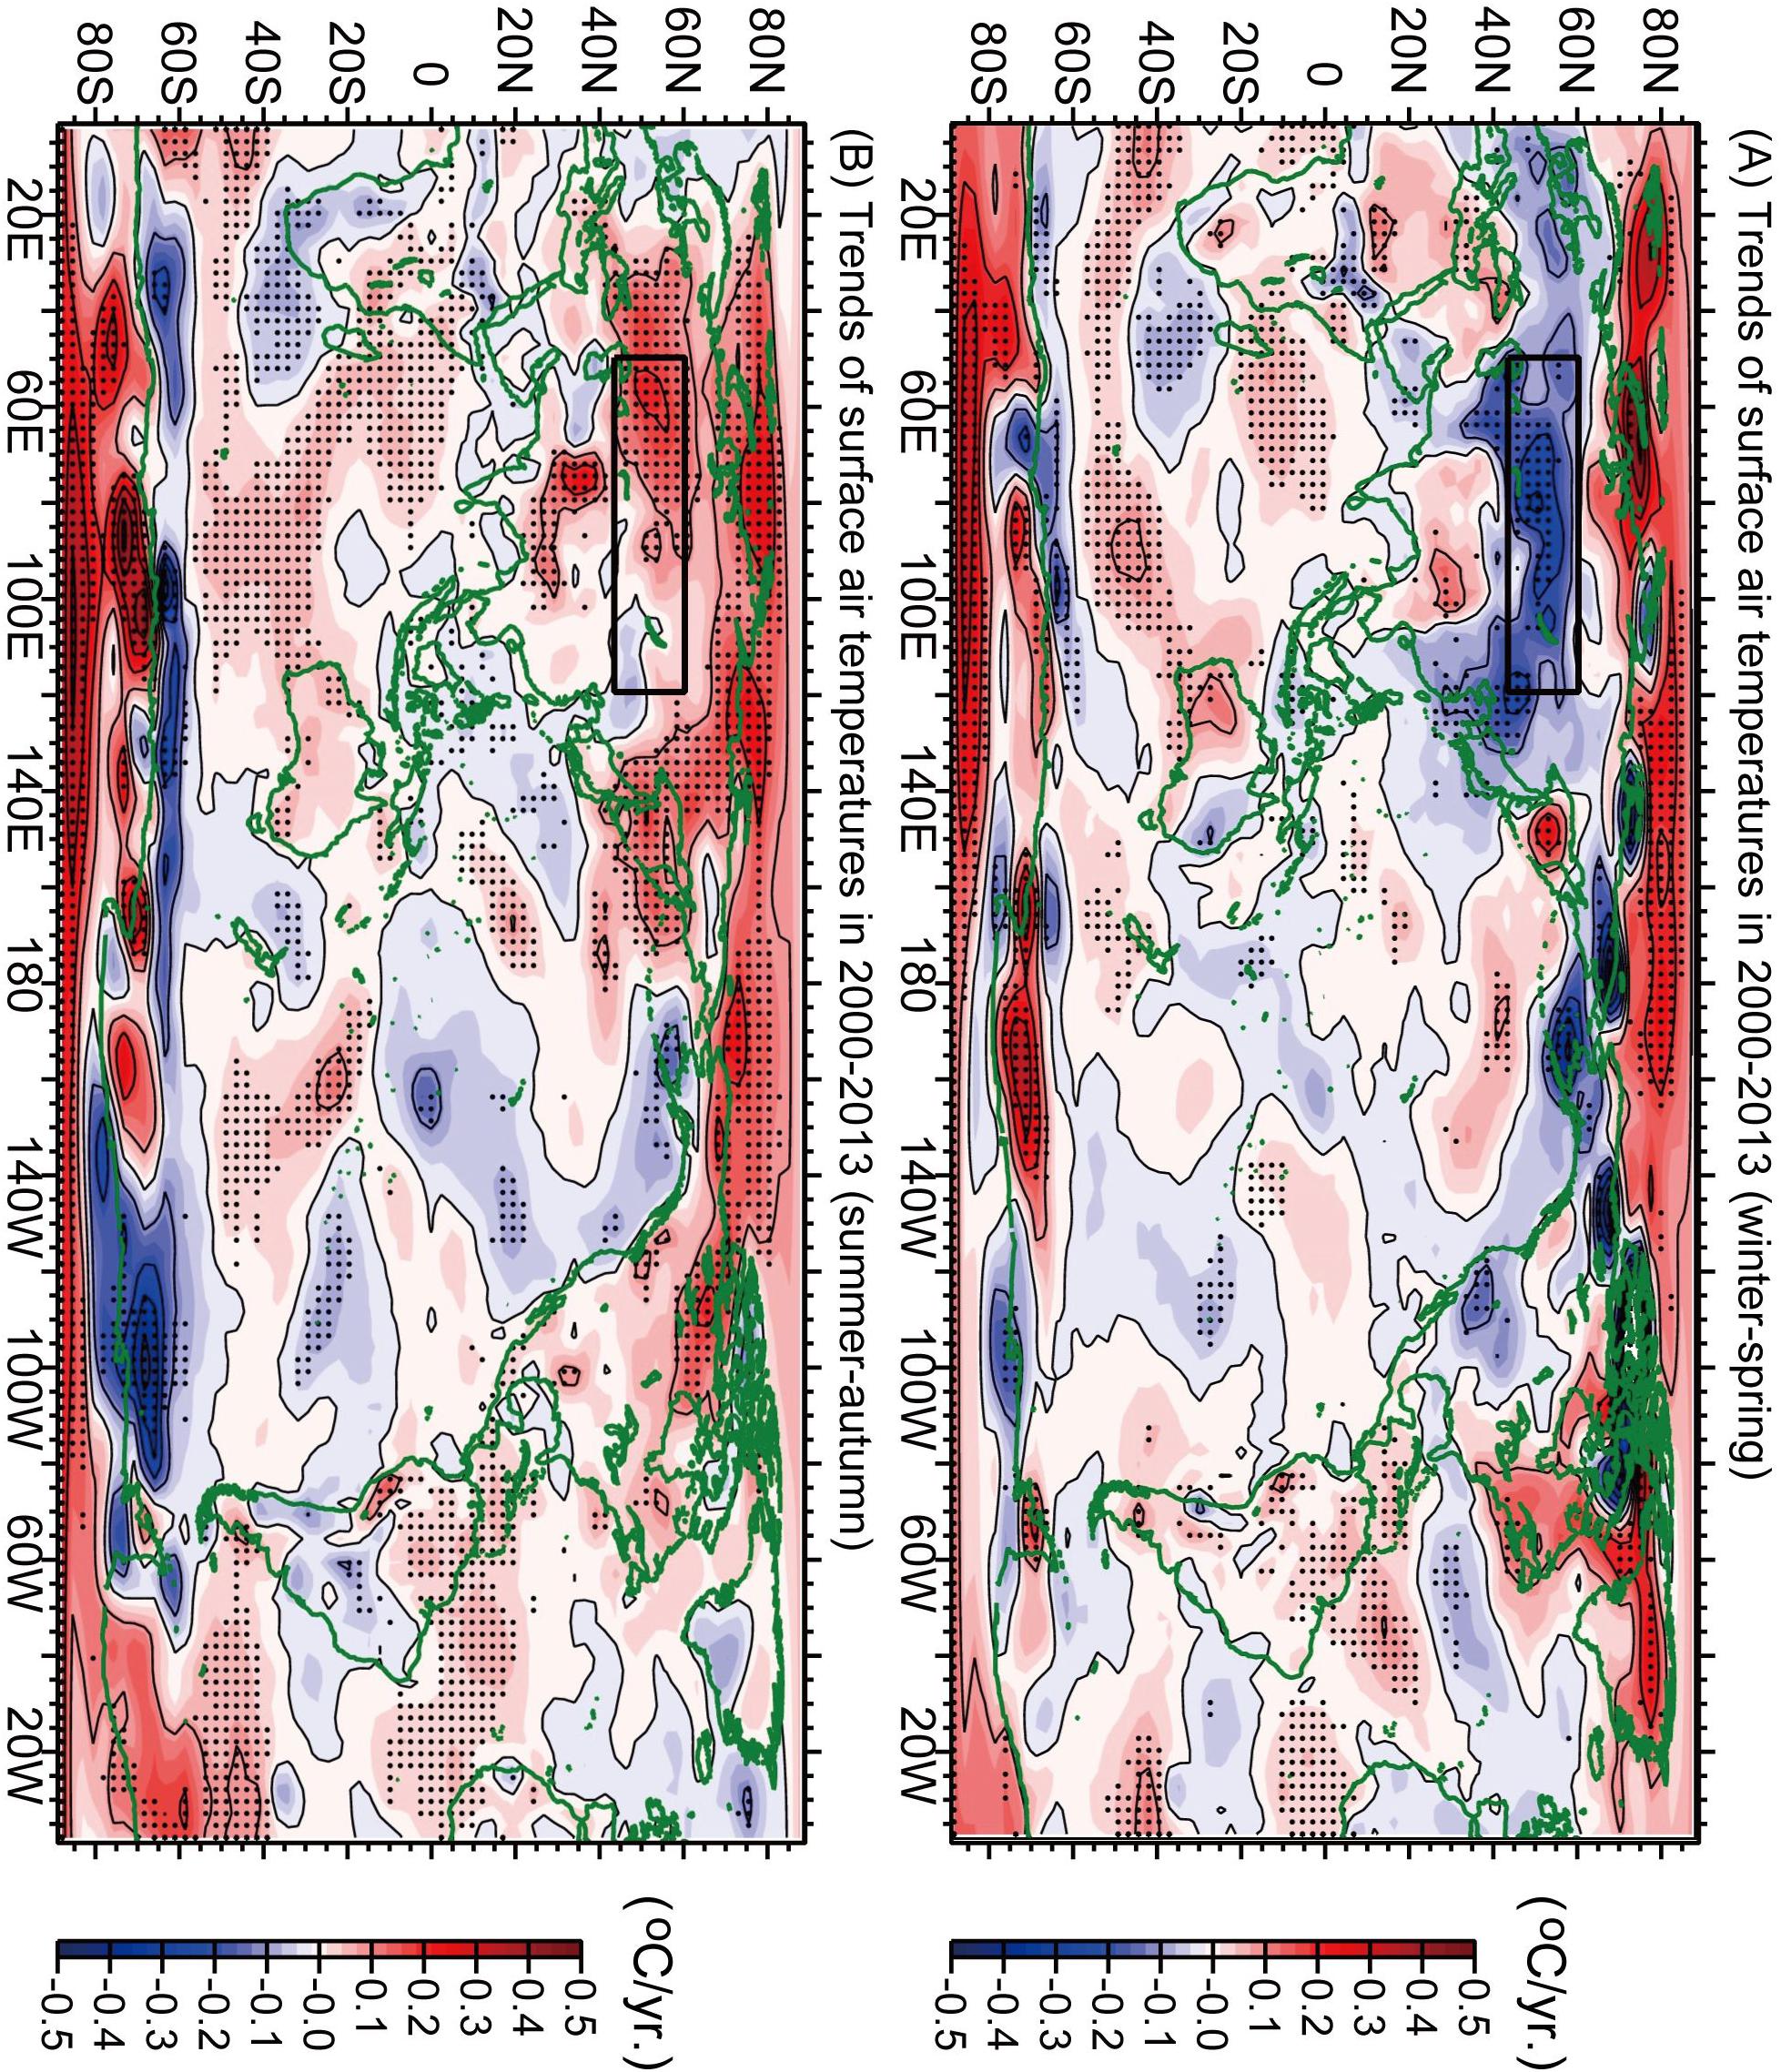
Figure 3. Trends of surface air temperatures in 2000–2013 for (A) winter–spring and (B) summer–autumn. Significant trends (P < 0.10) are denoted by dots. The area defined as “Central Eurasia” is outlined by the black rectangle.
What is the linkage between the global surface warming slowdown and the Pacific Decadal Oscillation (PDO)? Many studies reported that the global surface warming slowdown corresponded to negative phases of the PDO index (Figure 2B) or the Interdecadal Pacific Oscillation (IPO) index (Trenberth and Fasullo, 2013; Meehl et al., 2014; Trenberth, 2015), which is defined by performing empirical orthogonal function analysis of low-pass filtered SST (Tung et al., 2019). For instance, a long-term negative phase of the PDO index in 1947–1976 corresponded to a global surface warming slowdown during the 1940s–1970s (Figures 2A,B; Kosaka and Xie, 2016). The PDO index also tended to be negative in 1998–2013, and shifted to positive in response to the huge El Niño events of 2014–2016 (Imada et al., 2016; Chen et al., 2017; Hu and Fedorov, 2017). The positive shift of the PDO index in the mid-2010s corresponds to when global mean temperature resumed increasing rapidly after the end of the global surface warming slowdown of the 2000s (Figures 2A,B). Ensemble predictions based on a climate model project that the ongoing positive phase of the IPO/PDO will continue at least into the early 2020s (Meehl et al., 2016).
Results
Sea Surface Temperatures Around Japan
Basin-Scale SSTs in the North Pacific
Figures 4A–D maps decadal SST trends in the North Pacific during 2000–2014 for the four seasons. Throughout the year, significant warming trends were apparent mainly north of 40°N, except around Hokkaido and in the eastern Bering Sea in autumn–spring. SSTs in the western subarctic gyre and in the Sea of Okhotsk also tended to increase. In contrast, there were significant cooling trends west of 180° and south of 40°N, associated with the western–central parts of the subtropical gyre in the North Pacific. These seasonal patterns of basin-scale SST trends were consistent overall with those of basin-scale surface air temperature trends (Figure 3).
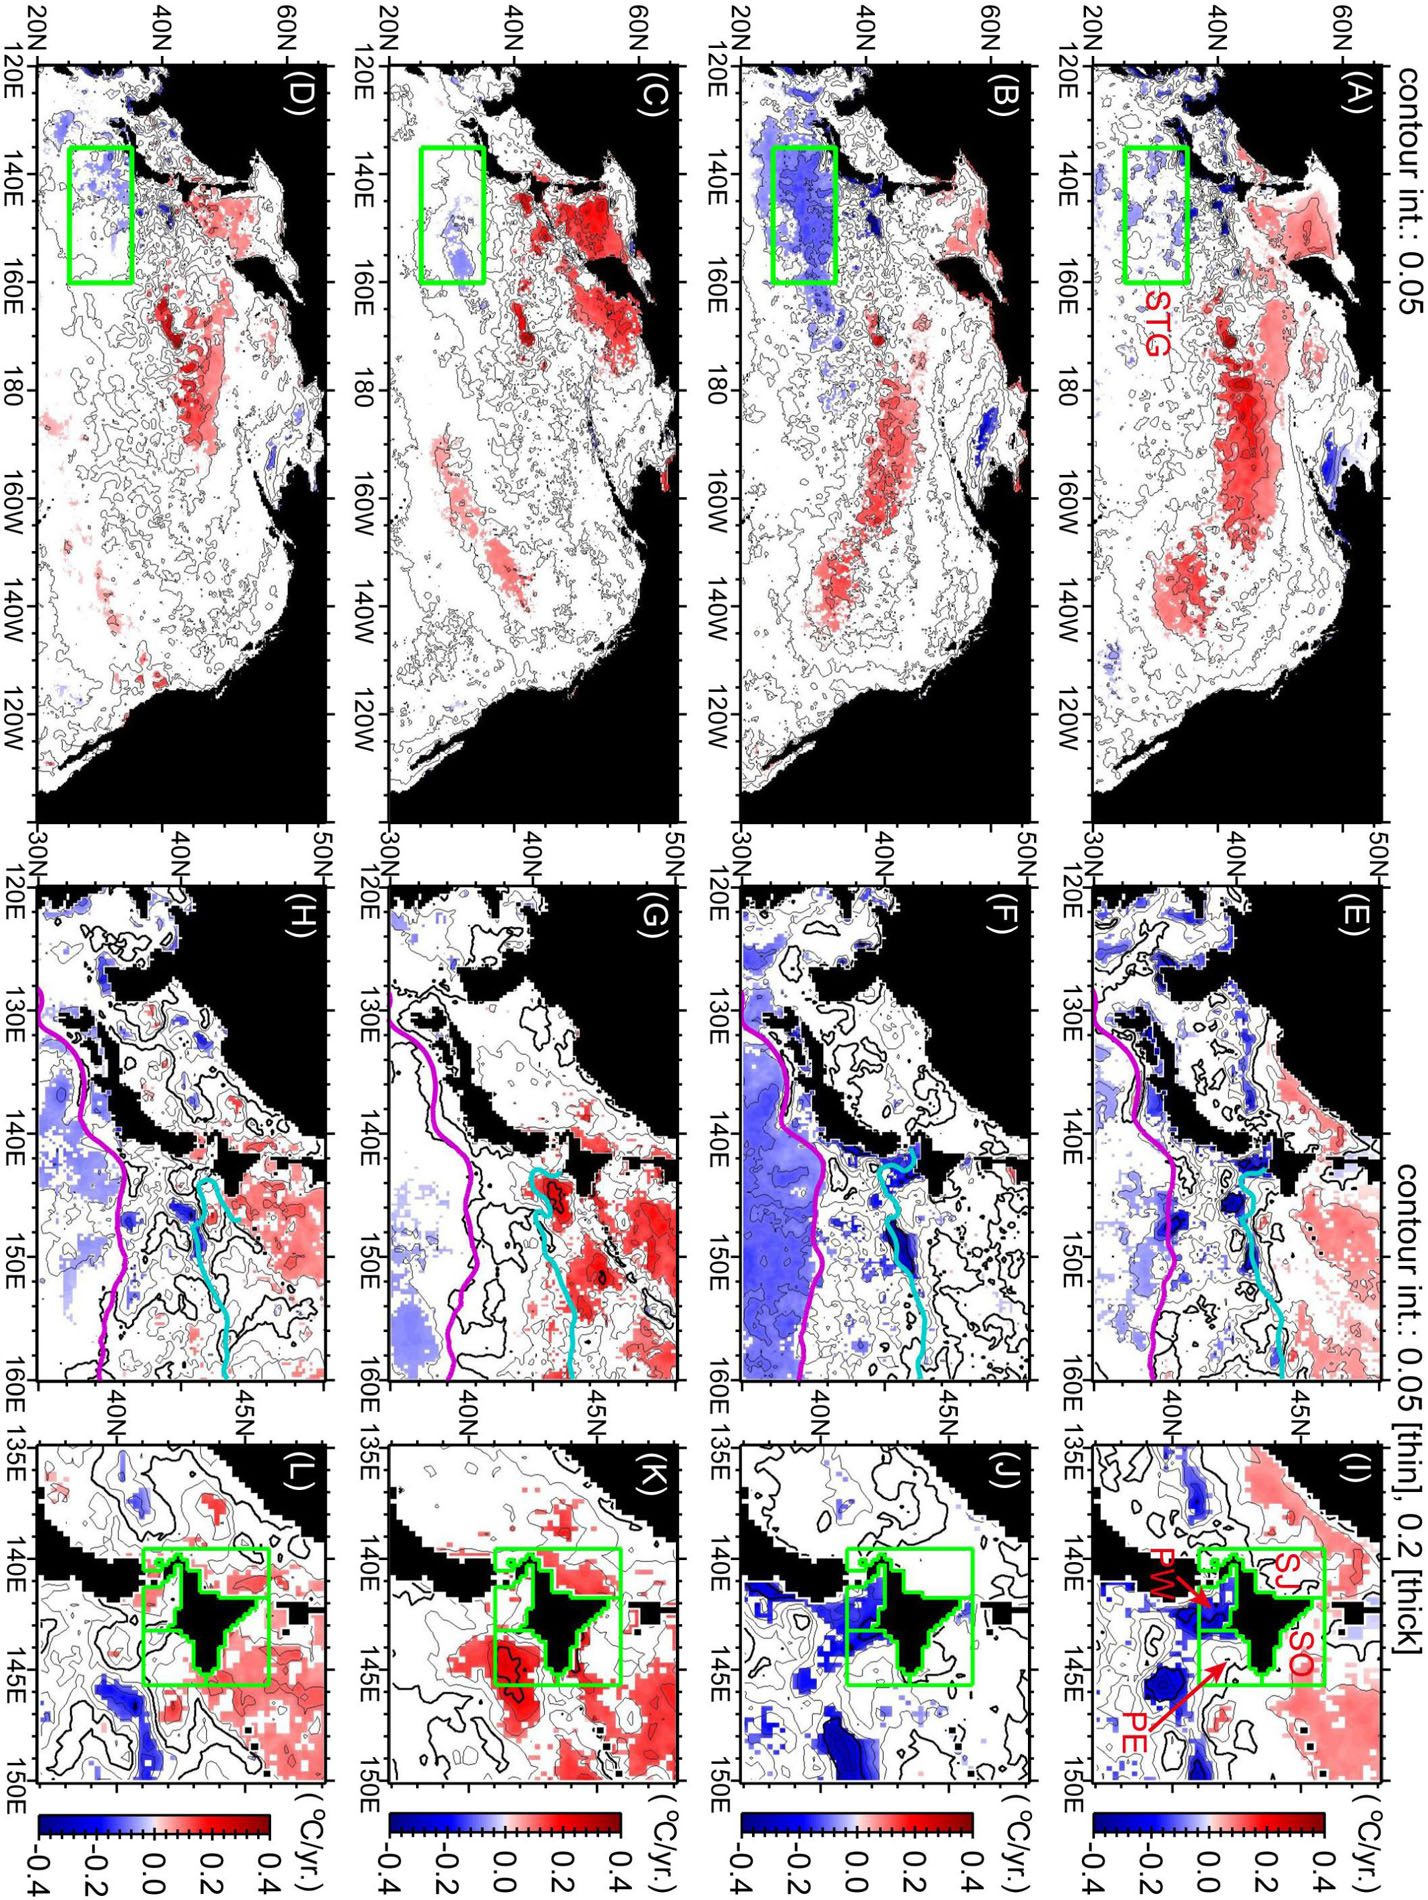
Figure 4. Trends of SSTs in 2000–2014 for winter (top panels), spring (second row of panels), summer (third row of panels), and autumn (bottom panels). Significant trends (P < 0.10) are shaded blue and red. Illustrated regions and scales are different for the left (A–D), center (E–H), and right (I–L) panels. Purple and light blue lines in the center panels indicate seasonal mean positions of the Kuroshio/Kuroshio Extension axis and the Oyashio/subarctic front in 2000 to 2014, respectively, which were estimated from FRA-ROMS. Seasonal mean SSTs are estimated in Figure 5 for the five green boxes in the left and right panels. STG, subtropical gyre; SO, Sea of Okhotsk; SJ, Sea of Japan; PW, Pacific Ocean off the southwest Hokkaido coast; and PE, Pacific Ocean off the southeast Hokkaido coast.
Here, we focus on SST trends in the western North Pacific (Figures 4E–H). In winter–spring (Figures 4E,F), SSTs around Japan tended to decrease decadally. In the southern part of this area, there were significant decreases of SST in the East China Sea and in the subtropical gyre around and south of the Kuroshio/Kuroshio Extension. In the northern part, SST decreases were localized near the polar front along 40°N in the Sea of Japan and the Oyashio/subarctic front in the North Pacific. During summer–autumn (Figures 4G,H), there was slight decadal cooling in the subtropical region, whereas there was decadal warming around Hokkaido and throughout the Sea of Okhotsk.
We spatially averaged the seasonal SSTs for region STG (i.e., 25–35°N, 135–160°E), which corresponds to the western part of the subtropical gyre around and south of the Kuroshio/Kuroshio Extension (Figures 5A–D). Linear decadal decreases were the most notable in winter–spring (Figures 5A,B). One interesting point is that the local minimum SST recorded in winter of 2015 (spring of 2014) is comparable to the low SSTs of the early and mid-1980s, which are well-known as a cool regime during a positive phase of the PDO. SSTs in winter (spring) also increased abruptly after 2015 (2014), 1–2 years after the positive shift of the PDO index in 2014. Only in summer did the spatially averaged SSTs show no marked trends (Figure 5C); in autumn they tended to decrease (Figure 5D).
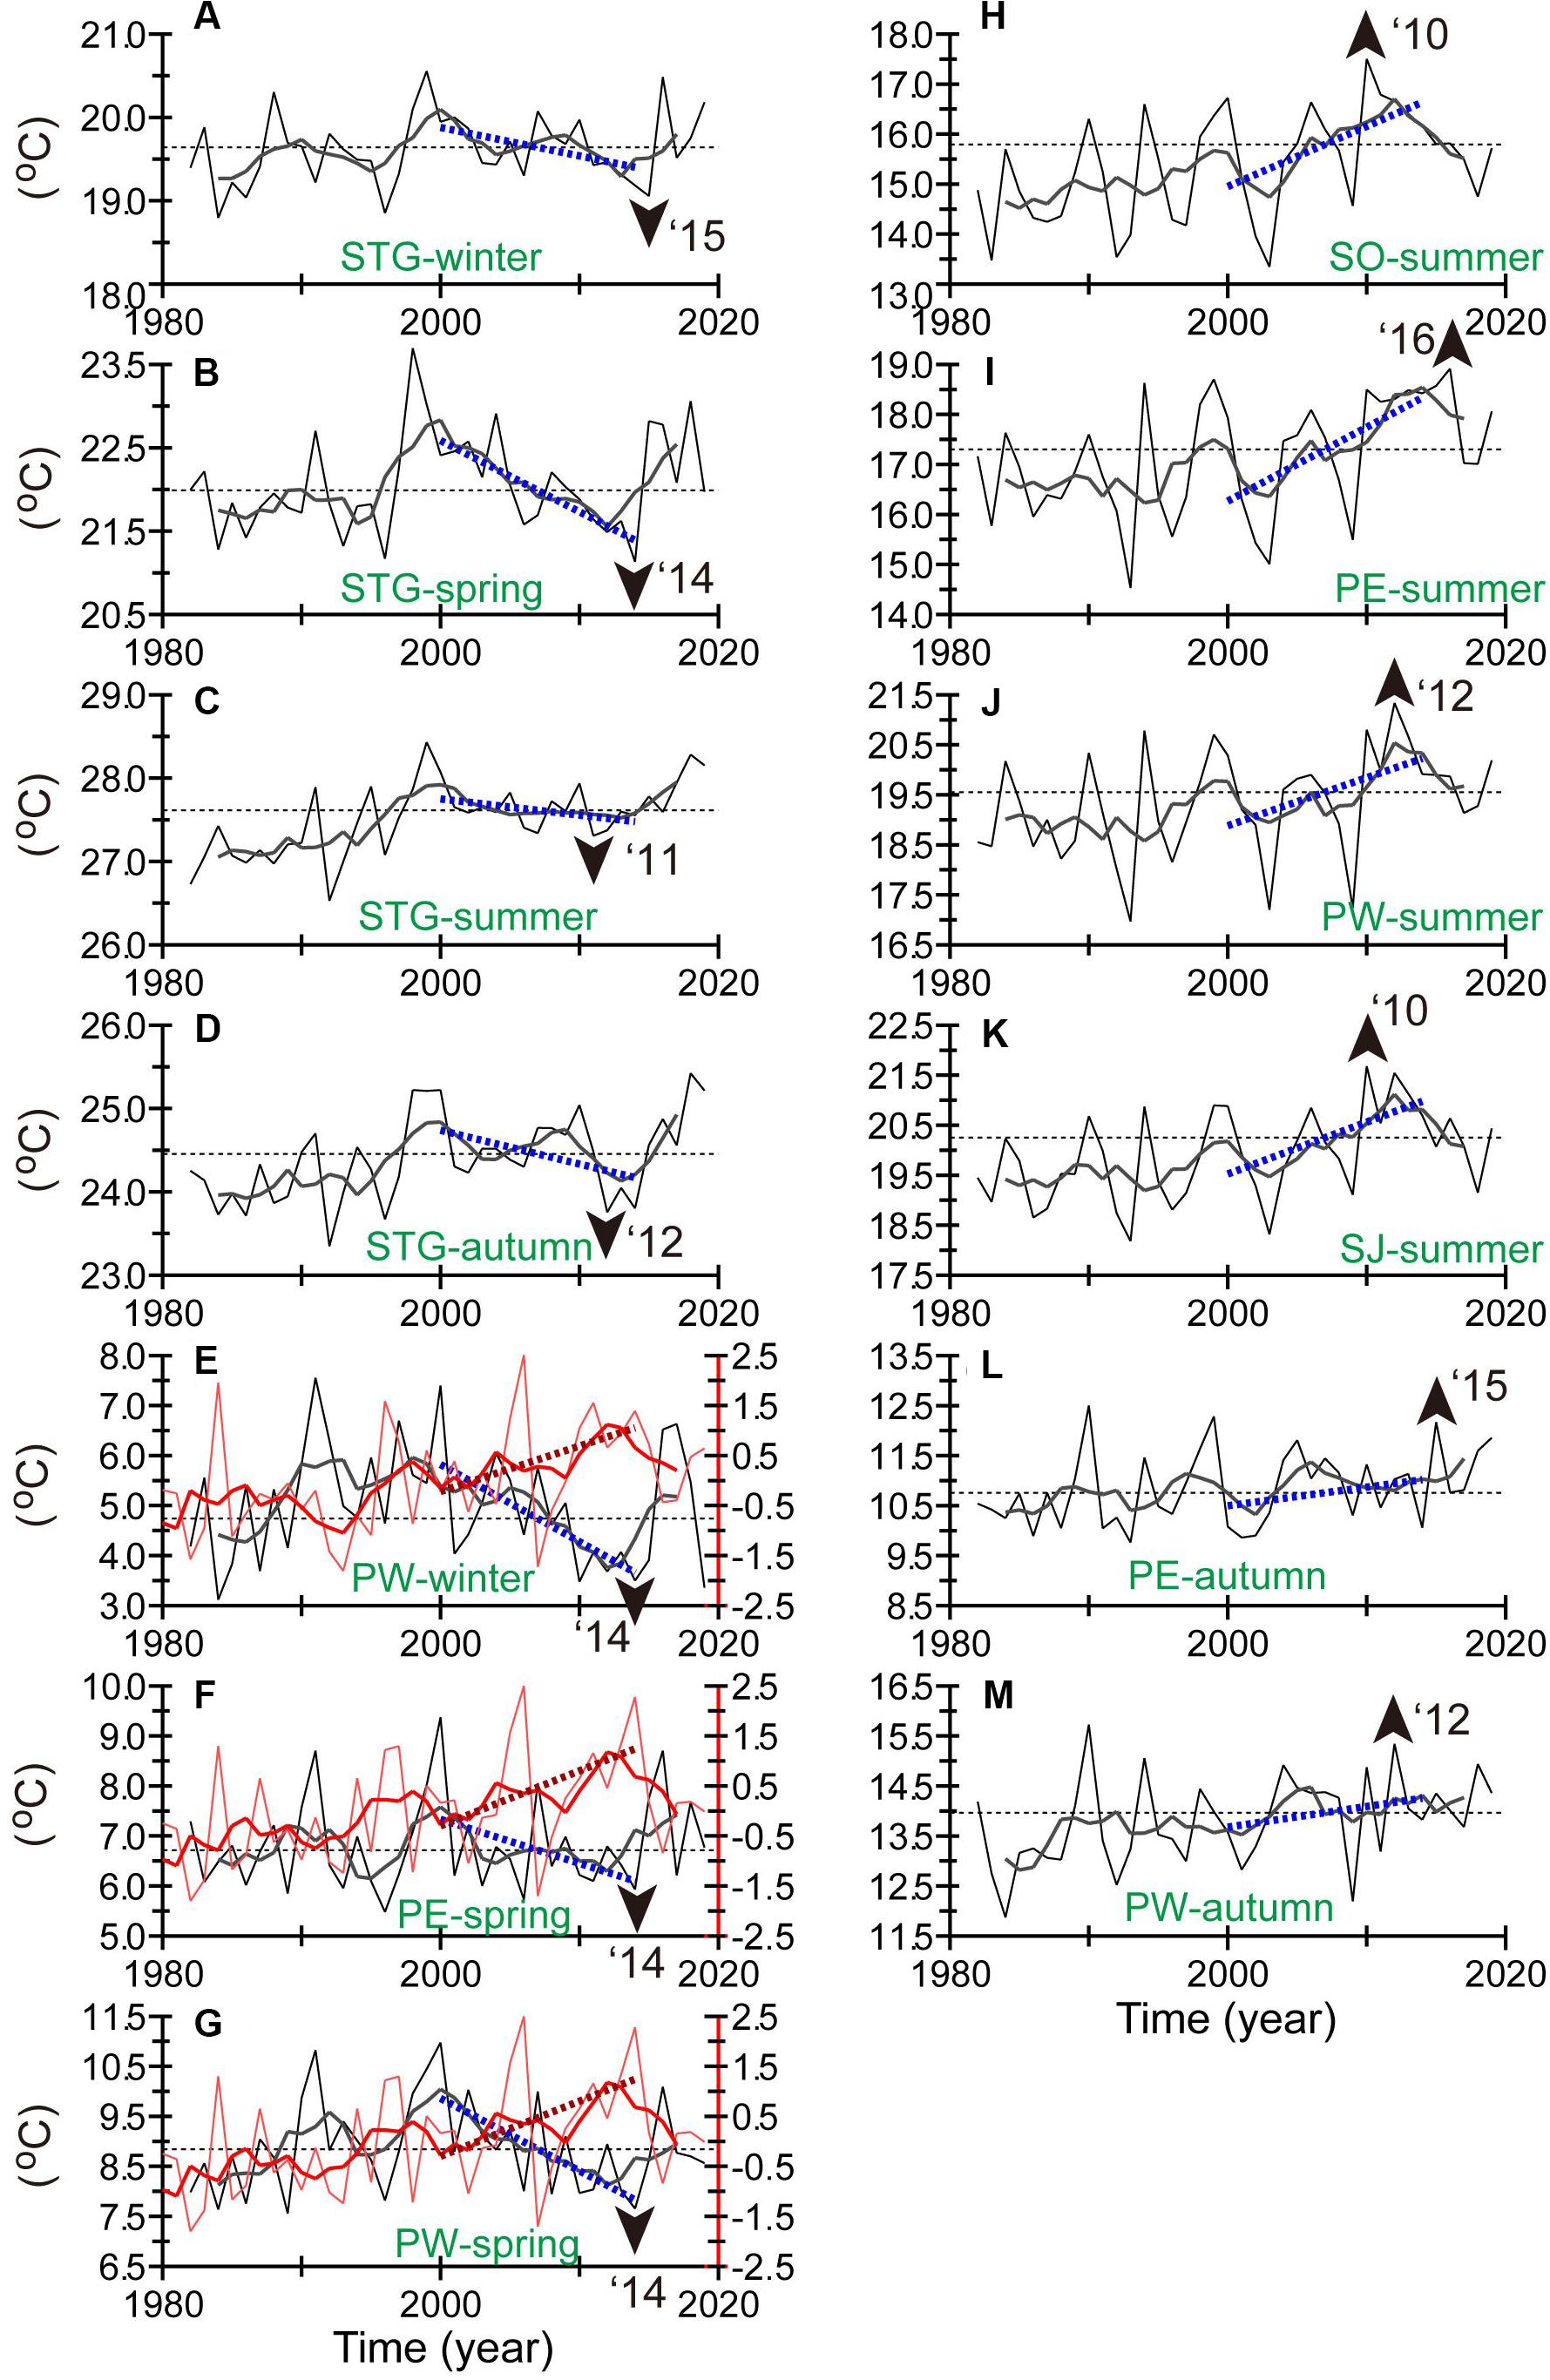
Figure 5. The same as Figure 2 but for mean SSTs for each season and region (see Figure 4 for regions). Green labels in each panel represent “season” and “region.” For example, “STG-winter” in (A) means SSTs averaged for region STG in winter. The lowest and highest SSTs for 2010–2016 are indicated by arrowheads in (A–G) and (H–M), respectively. In (E–G), the integrated transport of Coastal Oyashio water across 46°N east of the Sakhalin coast based on normalized values was added as red lines along with the corresponding right axis. The integrated transport for winter (spring) was estimated by integrating from 1 October in the preceding year to 15 February (30 April).
SSTs on the Shelf–Slope Around Hokkaido
Let us further focus on decadal SST trends around Hokkaido, where there are several boundaries between subarctic and subtropical waters (Figures 1B,C). Warming trends in summer–autumn were apparent over the shelves around Hokkaido (Figures 4K,L), where the Tsushima–Tsugaru–Soya Warm Currents strengthen during these seasons (Figure 1B). There were particularly large significant trends localized off the southeastern coast of Hokkaido in the North Pacific. Kuroda and Yokouchi (2017) attributed the localized increases to interdecadal increases in the frequency of clockwise mesoscale eddies such as the Kuroshio Warm Core Rings that appeared and stagnated near the Kuril–Kamchatka Trench off the southeastern coast of Hokkaido in summer–autumn after 2010. In addition, the southwestward intrusion of cold Oyashio waters along the Kuril, Four, and Hokkaido islands was blocked by the stagnant clockwise eddies and deflected to the south along the western–southwestern edge of these eddies (i.e., along the localized positive trends in Figure 4K) before cold waters reached the vicinity of the Hokkaido coast.
We spatially averaged SSTs for four regions around Hokkaido, designated “SO,” “SJ,” “PW,” and “PE” (see green boxes in Figure 4I). The SSTs in summer–autumn tended to increase gradually after the 1980s through 2000 as they fluctuated with periodic variations of 3–10 years (Figures 5H–M). The SSTs averaged for each region exhibited a local maximum between 2010 and 2016. The times of the local peaks were different among the four regions but were concentrated around 2014, when the PDO index shifted to positive (Figure 2B).
Meanwhile, as mentioned above, cooling trends in winter–spring were localized along the polar front at 40°N in the Sea of Japan and the Oyashio/subarctic front in the North Pacific (Figures 4E,F). The cooling trends were most apparent off the southwestern coast of Hokkaido in the North Pacific (region PW in Figures 4I,J). The local minimum in winter after 2010 was in 2014 for region PW (Figure 5E). The local minimum in spring after 2010 was in 2014 for regions PE (Figure 5F) and PW (Figure 5G). The SSTs during winter–spring increased abruptly in 2015–2016 (Figures 5E–G).
During 2000–2014, the seasonal contrast of SSTs tended to be decadally intensified around Hokkaido as a result of the combined effects of cooling in winter–spring (Figures 5E–G) and warming in summer–autumn (Figures 5H–M). This feature was qualitatively similar to that of surface air temperatures around Japan (Figure 2C), except for time lags of a few years when local minimums in winter–spring (local maximums in summer–autumn) appeared in the 2010s.
A possible cause for the decadal local cooling around Hokkaido was suggested by Kuroda et al. (2020): an extreme intensification of wind-induced circulation in the Sea of Okhotsk (i.e., the East Sakhalin Current) lasting a few months could trigger extremely cold SSTs along the northeastern Honshu coast, just south of region PW. Using the same method as used by Kuroda et al. (2020), we estimated a southward transport of Coastal Oyashio water (temperature < 2°C, salinity < 33) crossing 46°N along the eastern coast of Sakhalin Island in the Sea of Okhotsk, based on arrested topographic wave dynamics (Csanady, 1978; Nakanowatari and Ohshima, 2014) and using wind data from the Japanese 55-year Reanalysis (JRA55) at the sea surface (Kobayashi et al., 2015). We integrated the estimated transport from 1 October in the preceding year to winter or spring (red line in Figures 5E–G). The integrated southward transport and SSTs in winter–spring had negative correlations for regions PW (Figures 5E,G) and PE (Figure 5F). The integrated southward transport also exhibited decadal increases in 2000–2014 and declined abruptly after 2014. This timeline was strongly consistent with that of the decadal decrease and abrupt increase of SSTs in regions PW and PE. Moreover, the distribution of correlation coefficients between the integrated southward transport and winter–spring SSTs (Supplementary Figure 1) showed negative correlations localized near the Oyashio/subarctic front in the North Pacific, the pattern of which is similar to the spatial pattern of decadal SST cooling in 2000–2014 (Figures 4I,J). This similarity implies that increased southward transport of the cold waters along the Sakhalin coast resulted in greater outflow of the waters from the Sea of Okhotsk to the North Pacific and contributed to southward displacement of SST fronts near the Oyashio/subarctic front (Supplementary Figure 2).
Potential Impacts on Fisheries Resources Around Japan
In this section, we present an overview of the potential influences of decadal SST changes on the early life stages of five major fisheries resources in the waters around Japan. Although biological estimates and data included year-to-year variations (as will be discussed later), our specific focus was on the decadal variations of fisheries resources, particularly their decadal trends from the 2000s to the mid-2010s, which can be regarded as reflecting the low-frequency variability underlying year-to-year variations.
Japanese Pacific Stock of Walleye Pollock
Walleye pollock (Gadus chalcogrammus) is one of the most important target species for commercial fisheries around northern Japan. We focus on the JPS of walleye pollock, which is the largest among different stocks in Japanese waters (Figure 6A). In recent years, walleye pollock for the JPS recruited to the fishery mainly around age 4 and was caught mainly on the Pacific shelf around Hokkaido. Its biomass fluctuated decadally and declined after 2011 (Figure 7A). The catch for the JPS was stable, particularly after 2002, but declined after 2014. These declines of biomass and catch correspond to persistently low recruitments after 2009, when there were no strong recruitment year-classes (Figure 7B).
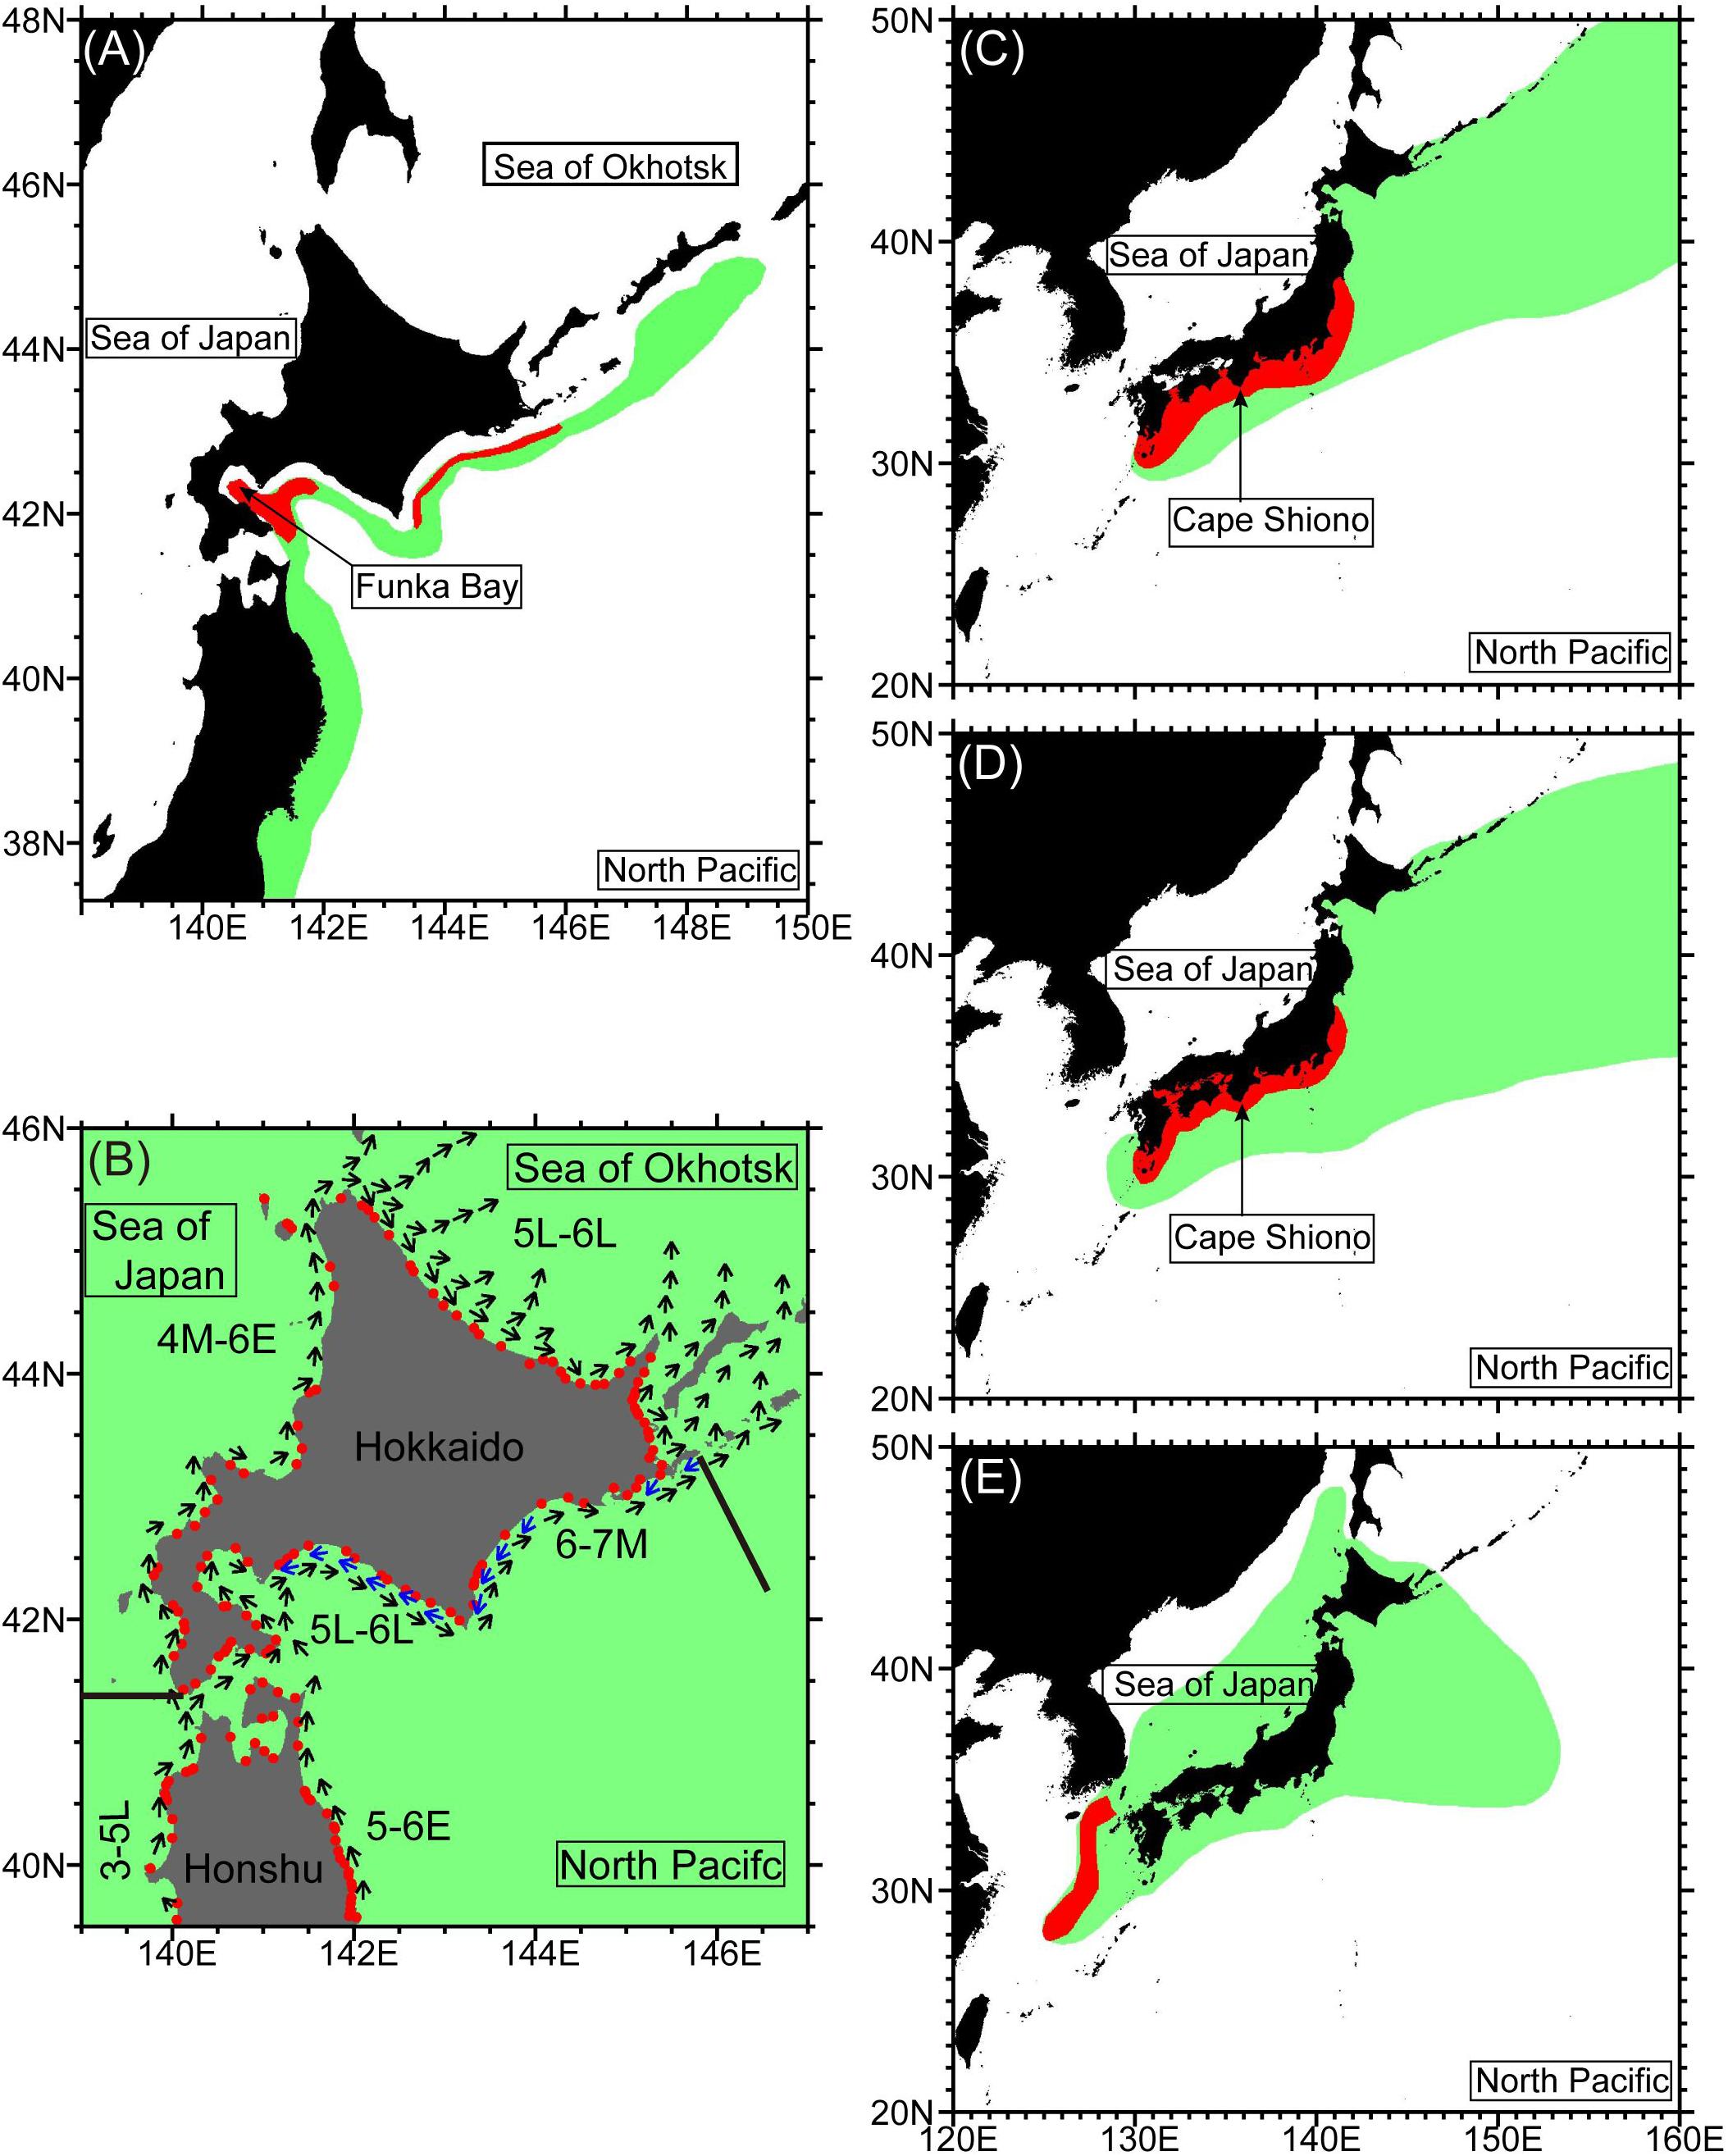
Figure 6. Spawning area (red shading) and distribution area (green shading) of (A) the Japanese Pacific stock (JPS) of walleye pollock, (B) Japanese chum salmon, (C) Pacific stock of Japanese sardine, (D) Pacific stock of Japanese anchovy, and (E) winter spawning stock of Japanese flying squid. Panel (A) is digitized from Sakai et al. (2019), (B) is from Urawa et al. (2018), (C,D) are from Oozeki et al. (2019), and (E) is from Kaga et al. (2019). Red circles in (B) indicate the mouths of rivers where data for chum salmon are registered in the Salmon Database (Saito et al., 2015). Juvenile chum salmon from Honshu and Hokkaido migrate near the coast in the direction of the vectors in (B) during the early (E), middle (M), or late (L) part of the months, indicated by numerals. Solid lines in (B) denote the westernmost and easternmost boundaries of Pacific waters along the Hokkaido coast, which are used in Figure 8B.
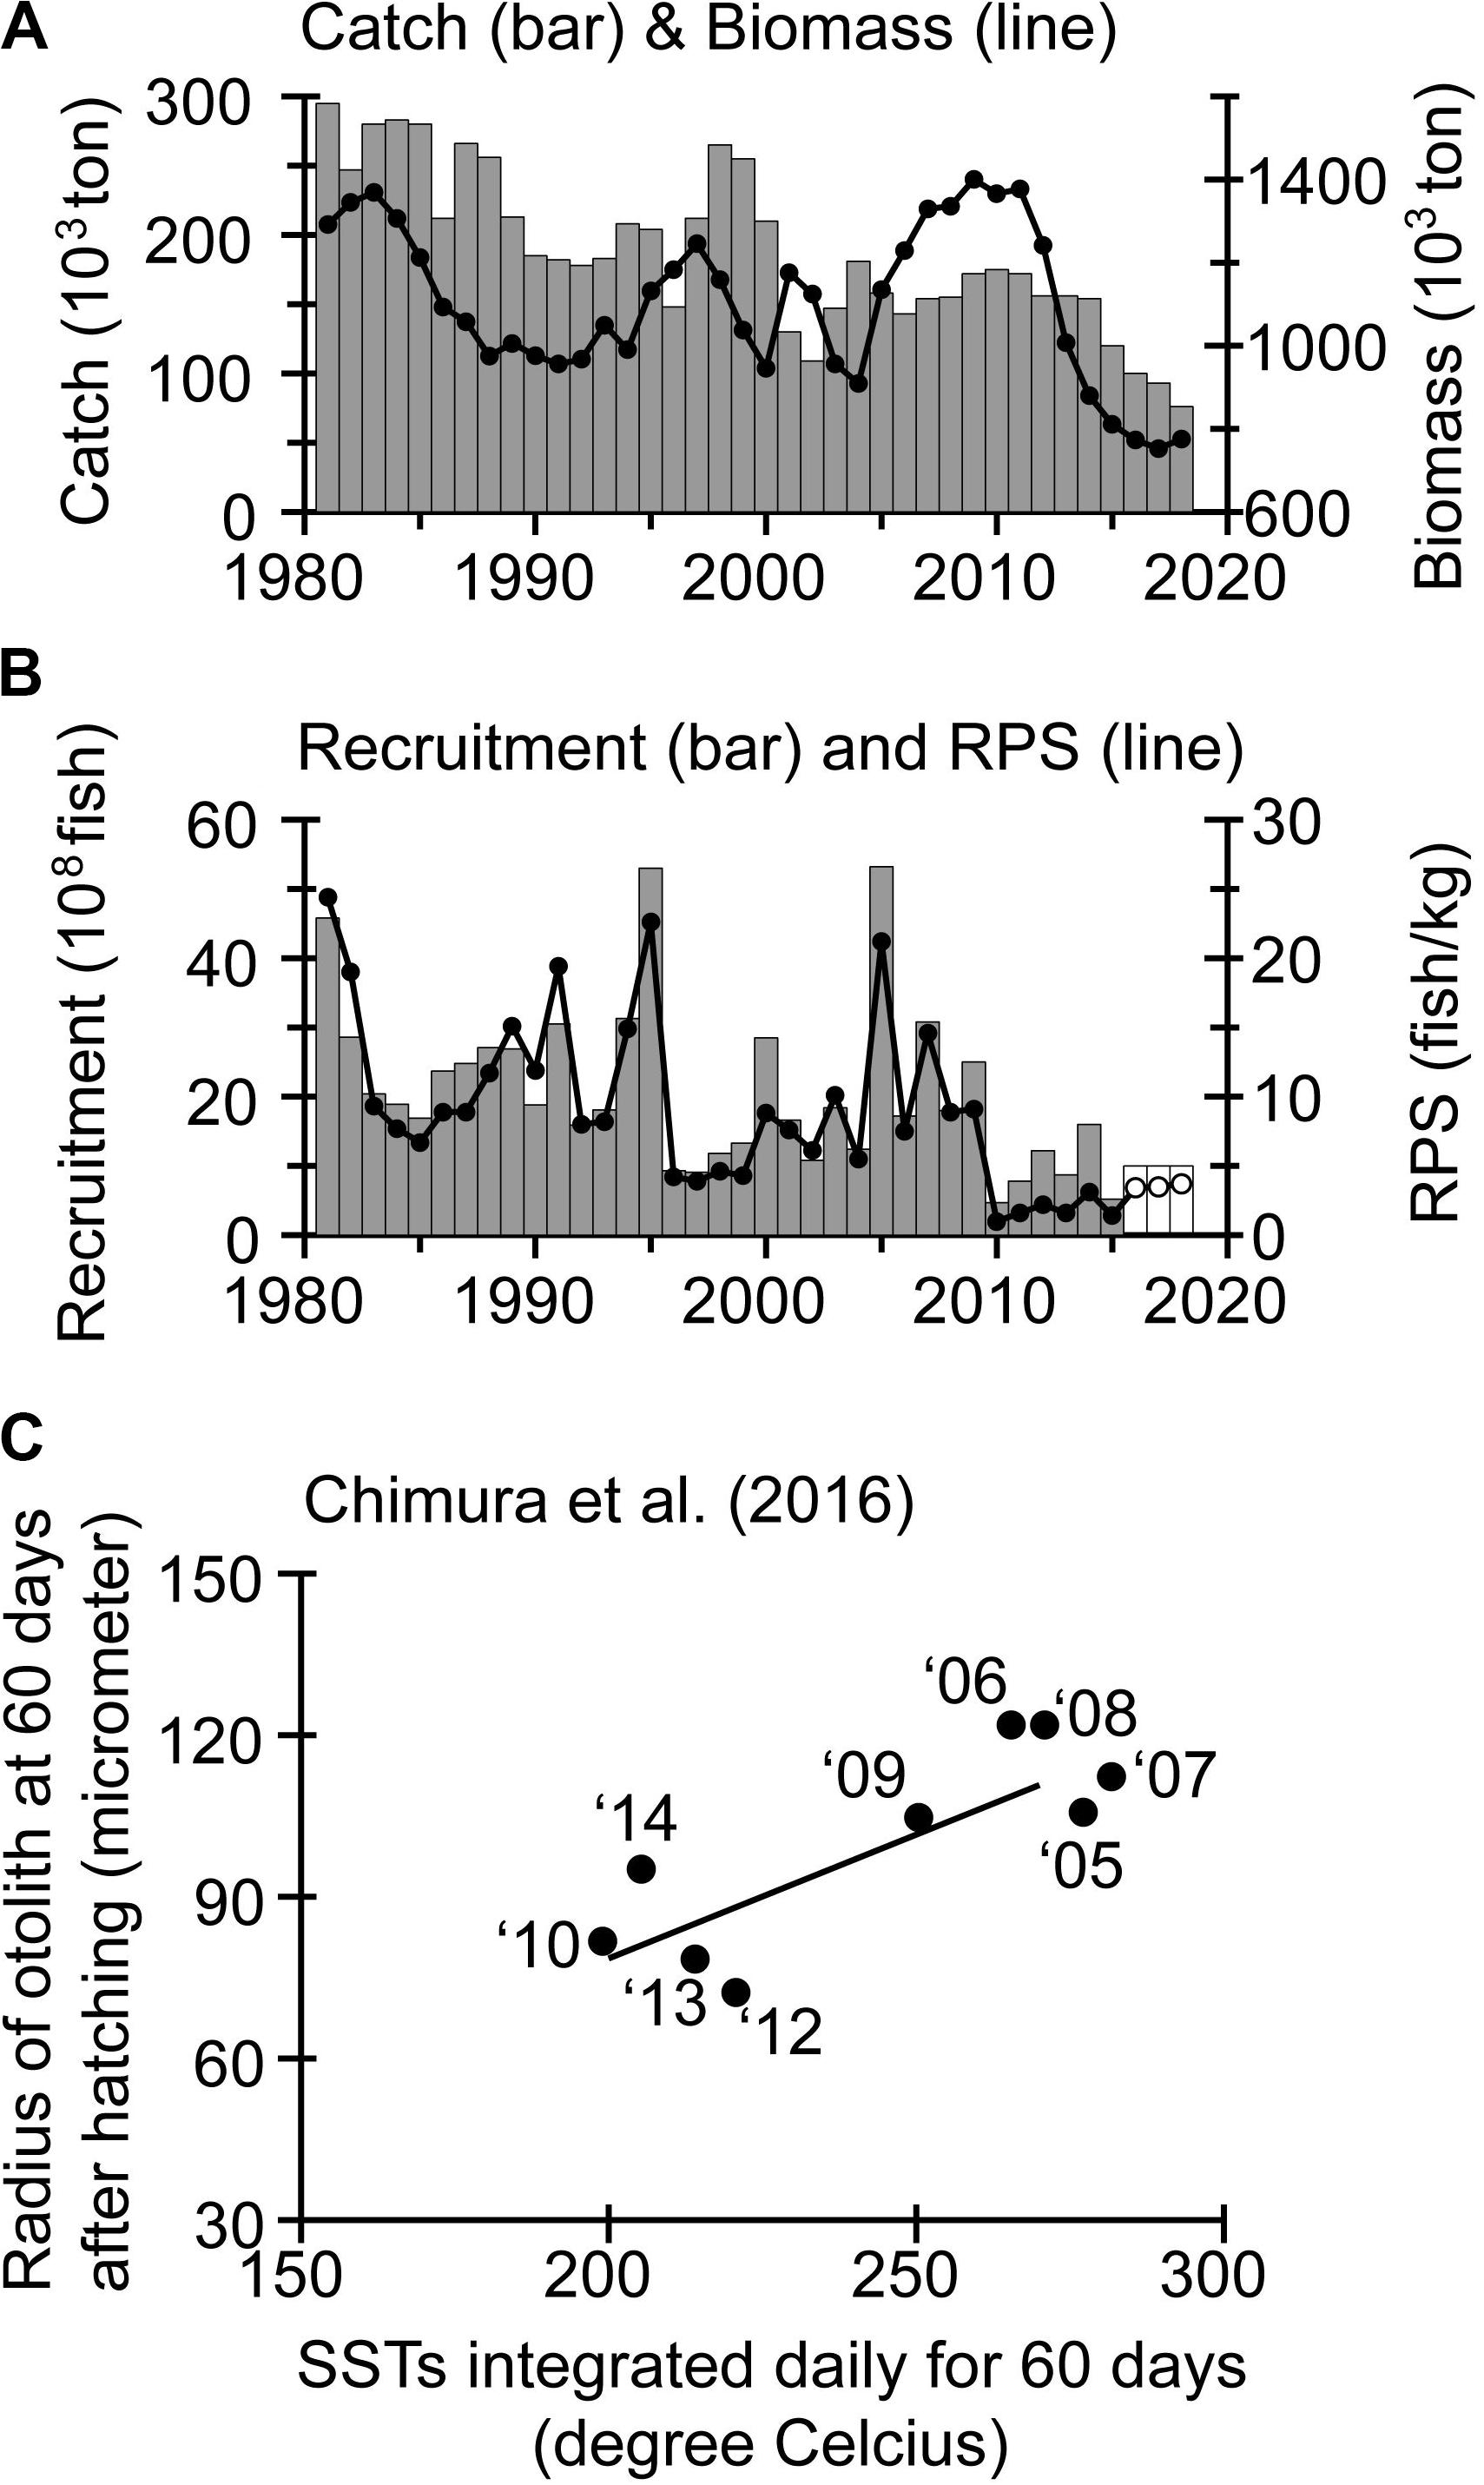
Figure 7. (A) Catch (bar chart), biomass (line graph), (B) recruitment (bar chart), and recruitment per spawning stock biomass (RPS) (line graph) for the Japanese Pacific stock (JPS) of walleye pollock. Open bars and circles in (B) indicate provisional values. (C) Relationship between SSTs integrated daily for 60 days in Funka Bay and otolith radius of walleye pollock larvae 60 days after hatching, averaged for each year class. The larvae were sampled from Funka Bay in April of 2005–2014. Panel (C) was digitized from Chimura et al. (2016).
The main spawning ground of the JPS is on the Pacific shelf around Funka Bay in southwestern Hokkaido, Japan, within region PW (Figure 6A). The spawning season extends from December to March. Eggs and larvae are transported near the sea surface and partially inside of Funka Bay. In May–June, the juveniles leave the bay and migrate eastward on the Pacific shelf along the Hokkaido coast to the nursery ground (Honda et al., 2004).
Chimura et al. (2016) analyzed daily increments of otoliths of walleye pollock larvae within Funka Bay in April of 2005–2014 (Figure 7C). The annual mean otolith radius at day 60 after hatching was positively correlated with SST in Funka Bay integrated daily over the same 60-day period. Notably, the radius of the otolith, an index of body length, was smaller after 2009 than before, in response to decadal SST cooling associated with intensification of wind-induced circulation in the Sea of Okhotsk (Figures 4I, 5E). Funamoto et al. (2014) indicated that recruitment for the JPS was positively correlated with SST in January and February around Funka Bay. They proposed the “bigger is better” hypothesis, such that during winters with high SSTs (i.e., less dominance of Coastal Oyashio water from the Sea of Okhotsk around Funka Bay), the survival of the JPS is enhanced by more successful transport of eggs into the bay and faster larval growth, whereby the faster larval growth is a direct result of higher temperature and larval food availability. Conversely, decadal cooling of SSTs (Figure 4I) could slow larval growth and potentially reduce their recruitment.
Chum Salmon From the Pacific Waters Near Hokkaido
Chum salmon (Oncorhynchus keta) is widely distributed across the subarctic region of the North Pacific Ocean and its marginal seas. Adult Japanese chum salmon at age 2–8 (mainly 3–5)2 return to individual natal rivers around northern Honshu and Hokkaido from summer to winter after extensive oceanic migrations (Figure 6B). The adult returns are caught during these seasons primarily in coastal and river waters and account for 16.6–23.0% of annual landings based on market value in Hokkaido during the last decade (Department of Fisheries and Forestry and Hokkaido Government [DFFHG], 2019).
There are natural- and hatchery-origin populations of chum salmon. The number of juveniles released annually from Japanese hatcheries increased rapidly in the 1970s and was stable thereafter with a moderate interdecadal decrease (Figure 8A). Nevertheless, the number of adult returns to Japanese waters fluctuated decadally after the 1970s. It is noteworthy that the number of returns to Japanese waters decreased linearly after the mid-2000s (Figure 8A). Similarly, the number of returns to Pacific waters near Hokkaido decreased after the mid-2010s (Figure 8B); this decrease is the focus of the present section. The decrease after the mid-2000s was also opposite to a decadal increase of commercial catches of chum salmon in Russia, particularly around the Amur River (Urawa et al., 2018).
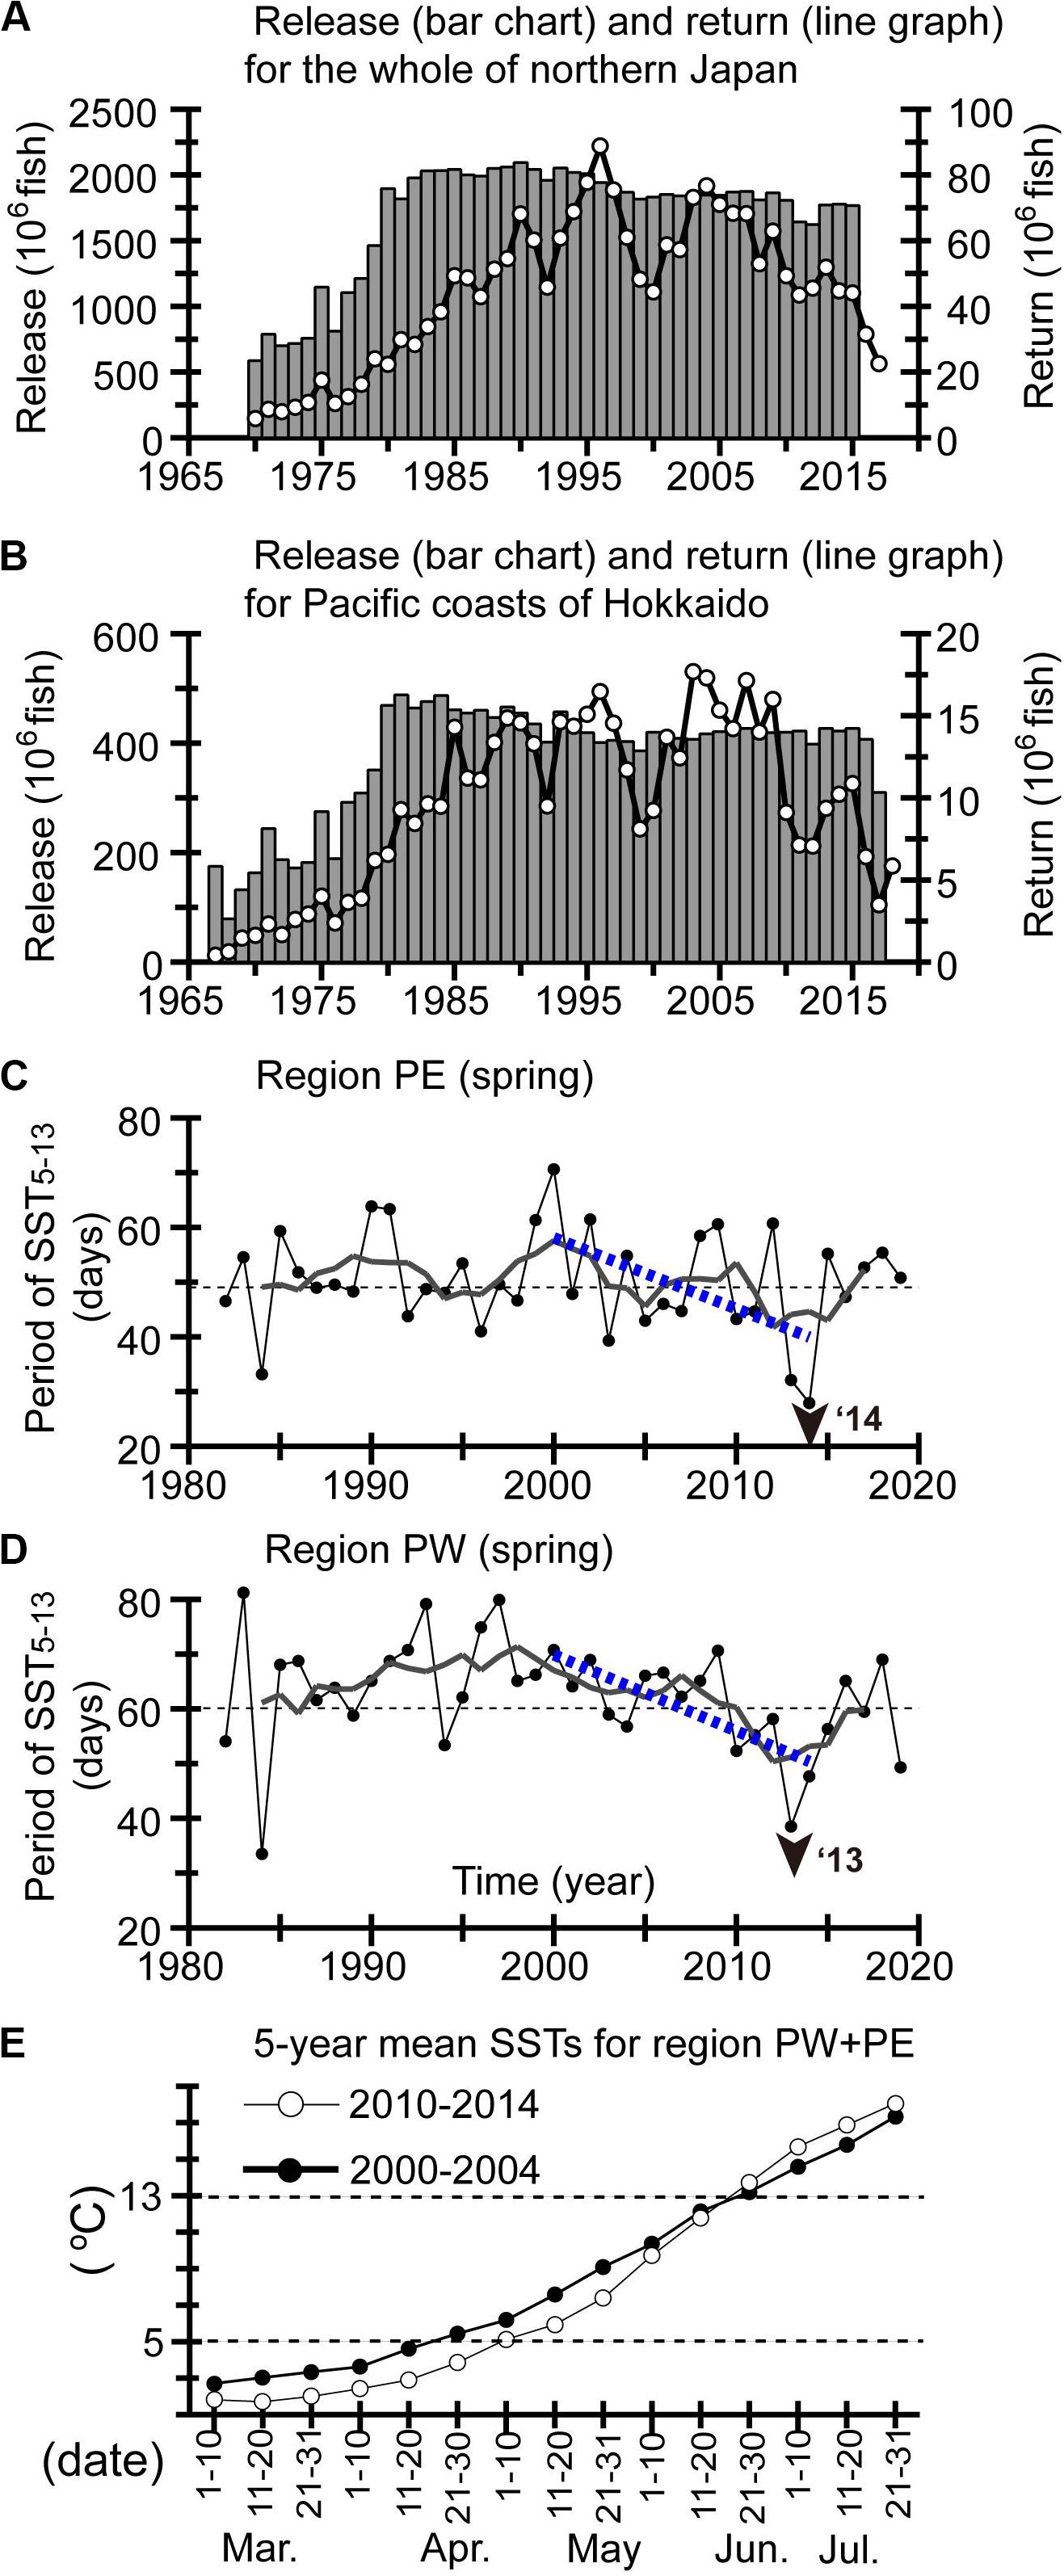
Figure 8. (A) The number of Japanese chum salmon released (bar chart) and adult returns (line graph) for all of Japan. (B) The same as (A), but for Pacific waters around Hokkaido (Figure 6B). The duration of periods with SSTs of 5–13 °C in spring for regions (C) PW and (D) PE. Display style in panels (C,D) are the same as in Figure 5. (E) SSTs in regions PW and PE over intervals of about 10 days were averaged for 2000–2004 (closed circles) and 2010–2014 (open circles).
The early period of marine residence in coastal waters is a critical stage in the life cycle of chum salmon (e.g., Healey, 1982; Bax, 1983). After sea entry in late winter to spring, the juveniles live in coastal waters for a few months, growing and migrating along the coastlines in northern Japan. Coastal waters in both regions PW and PE are utilized as a habitat by juvenile chum salmon with different origins, such as northern Honshu or Pacific rivers in Hokkaido (Figure 6B). Interestingly, a portion of juveniles entering coastal waters from rivers in region PE migrate to coastal waters in region PW along a route indicated by blue arrows in Figure 6B (Saito et al., 2013). The juveniles originating from different rivers then leave region PW, migrate to the east, and pass through region PE in June–late July, together with the rest of the juveniles from rivers in region PE (Figure 6B; Honda et al., 2017). In general, the juveniles appear in waters with SSTs of 5–13°C near the Japanese coast (Seki, 2013), and when SSTs exceed 13°C, the juveniles there disappear (Nagata et al., 2007); they leave coastal waters to enter the Sea of Okhotsk, an important nursery ground in summer to mid-autumn (Mayama and Ishida, 2003).
Many previous studies on chum salmon around Hokkaido reported that higher (lower) coastal SSTs in spring, corresponding to an early marine residence, contributed to better (worse) survival of juvenile chum salmon via growth, feeding, or swimming ability (e.g., Miyakoshi et al., 2007; Saito and Nagasawa, 2009; Kasugai et al., 2012; Nagata et al., 2016). Saito and Fukuwaka (2018) divided the Pacific coasts from northern Honshu to Hokkaido into four areas and showed that for each area, coastal SSTs during March–May in 1990–2014 had positive correlations with lagged catches of adult returns at age ≤ 4. These positive correlations imply that decadal cooling of SSTs in the Pacific waters near the Hokkaido coast in spring (Figure 4J) correspond to decadal decreases of adult returns (Figure 8B) in addition to their year-to-year correspondence. Saito and Fukuwaka (2018) also pointed out that cold springs were more frequent after 2000 than before along the Pacific coasts. This decadal increase in the frequency of such cold springs was attributed to decadal cooling of SSTs in spring after 2000 along the Pacific coast of northern Japan (Figures 4J, 5F,G) and could have negatively affected adult returns by a reduction in juvenile survival.
Moreover, Saito and Fukuwaka (2018) reported that in the 2010s, the period in spring with SSTs of 5–13°C, suitable for early marine residence, was shortened. The duration of the period with SSTs of 5–13°C showed negative trends for 2000–2014 throughout the Pacific coast of Hokkaido (Figure 9A). The magnitude of the negative trends for 2000–2014 is comparable between regions PW and PE (Figures 8C,D). Comparison of 5-year mean SSTs for regions PW and PE combined at intervals of about 10 days between 2000–2004 and 2010–2014 indicated that the negative trends could be attributed not only to prolongation of the appearance of SSTs < 5°C in the 2010s with decadal SST cooling but also to rapid/steep seasonal increases of SST in late spring (i.e., June) in the 2010s (Figure 8E). The latter was related to seasonal contrasts of SST around northern Japan that were decadally intensified through the combined effects of cooling in winter–spring (Figure 4J) and warming in summer–autumn (Figure 4K).
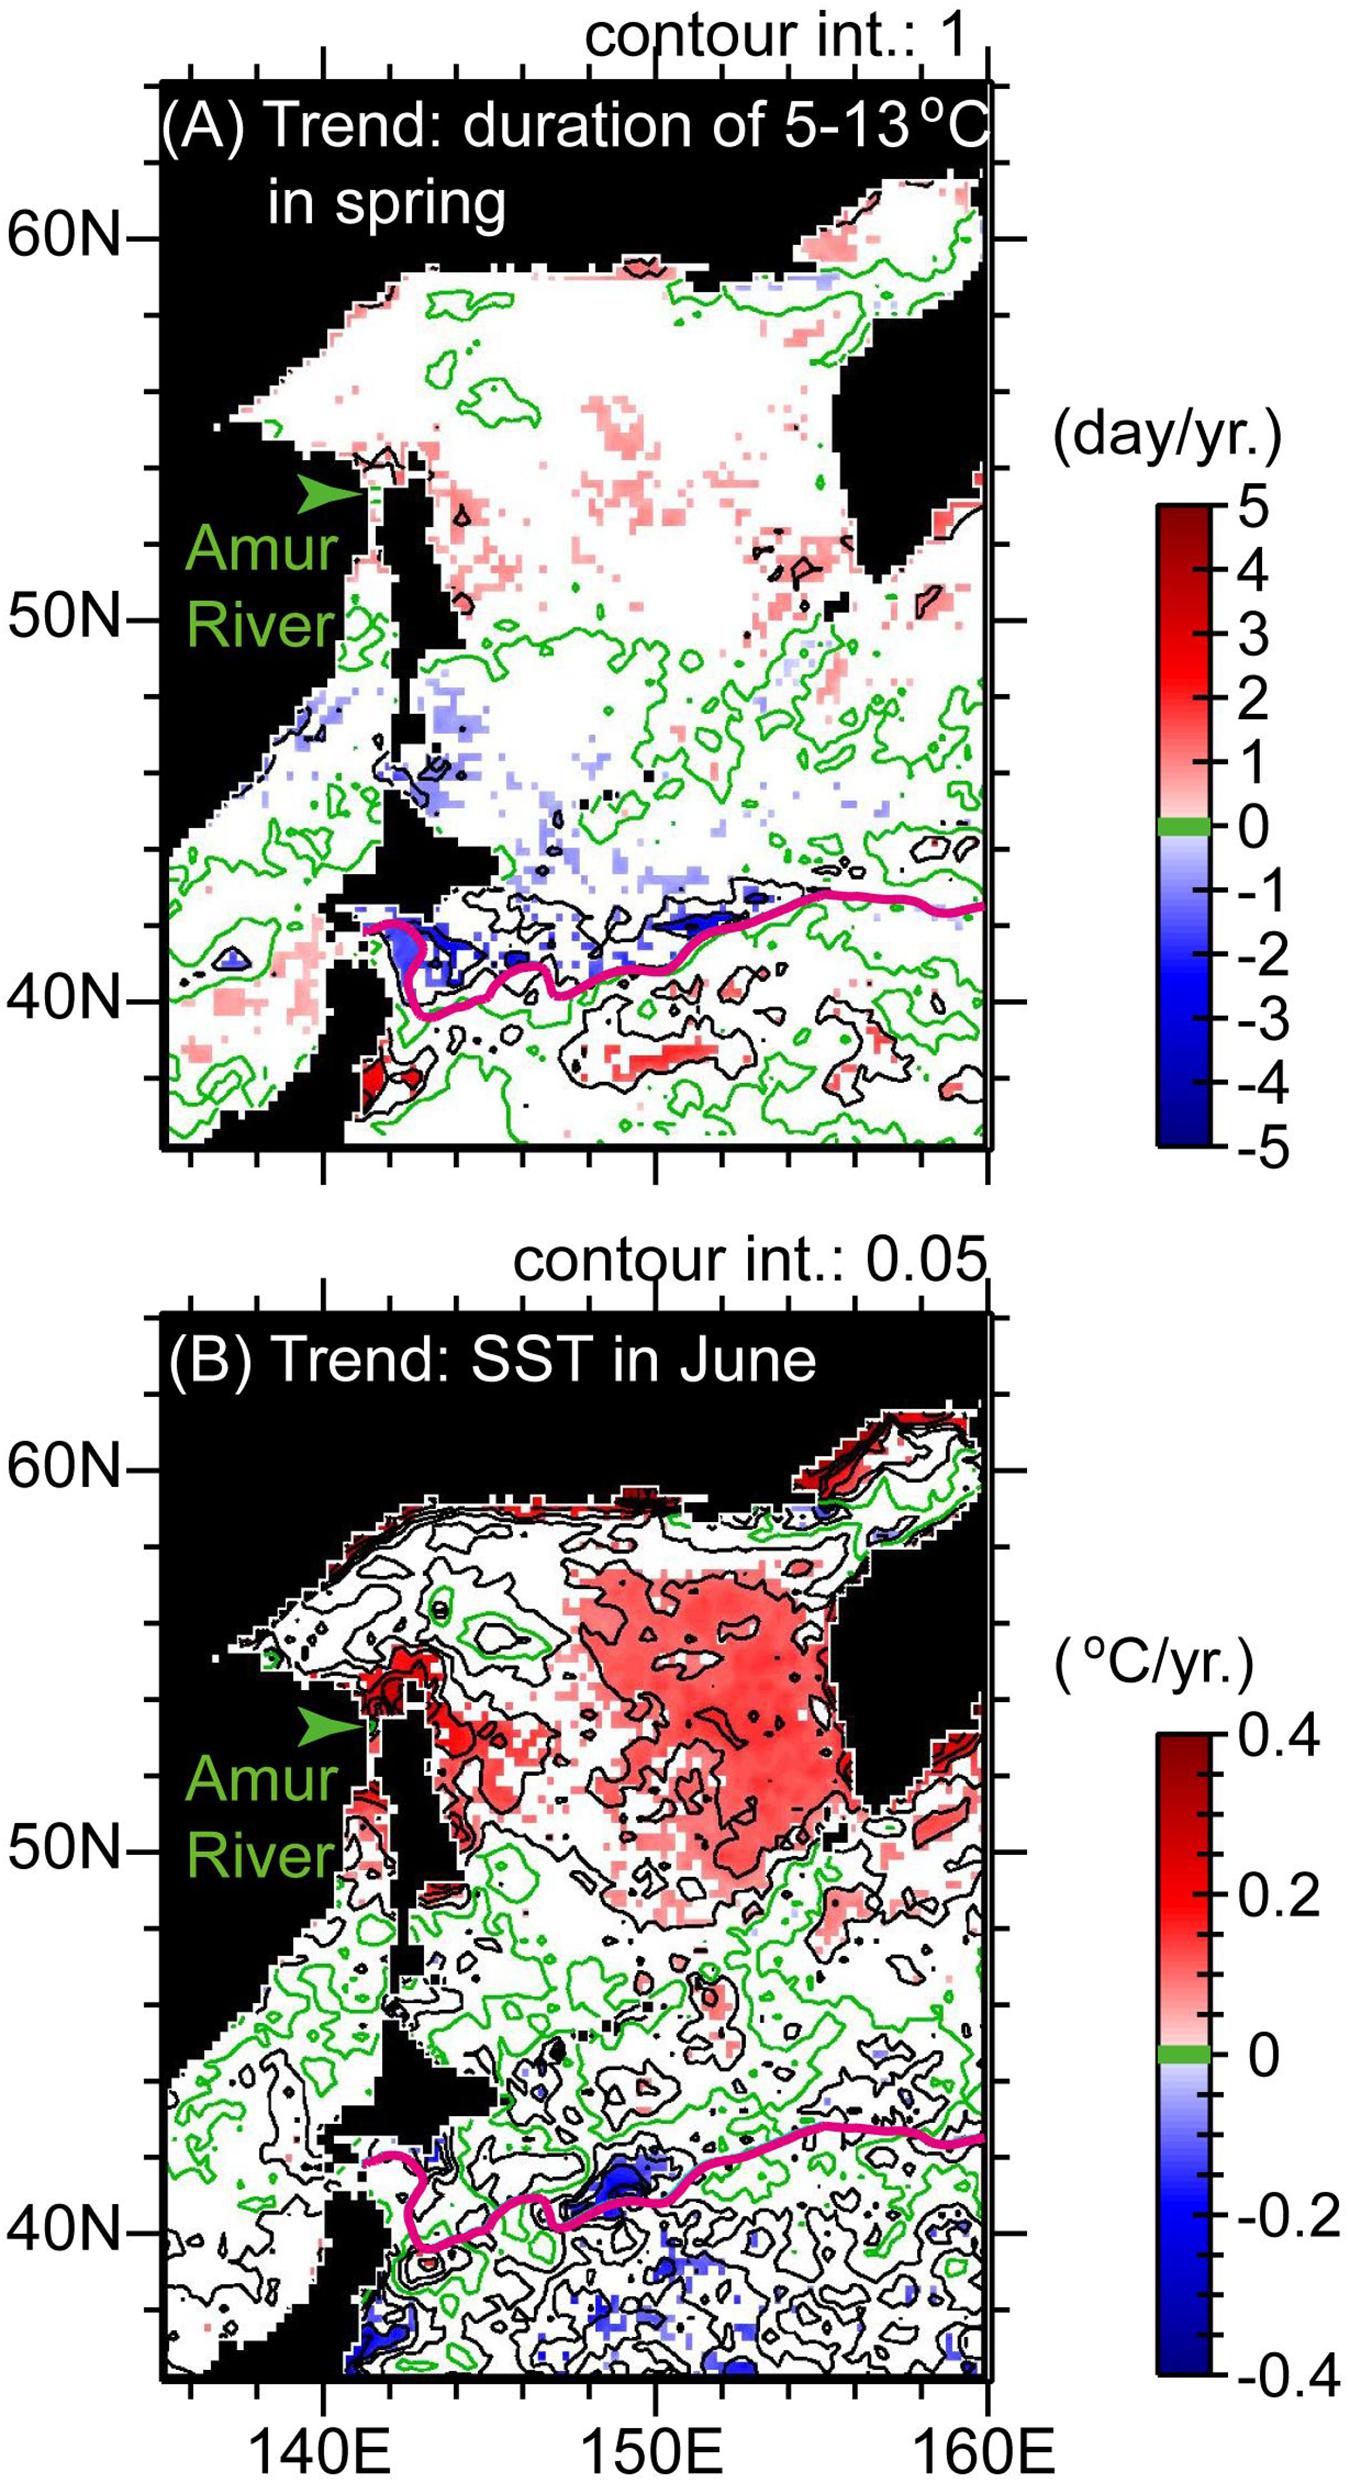
Figure 9. (A) Trends in 2000–2014 for the duration of periods with SSTs of 5–13°C in spring. (B) Trends of SSTs in June. Display style is the same as in Figure 4.
It is worth noting that catches of chum salmon in Russian waters, particularly around the Amur River, increased after the mid-2000s. Saito and Fukuwaka (2018) noted that SSTs in spring near the mouth of the Amur River increased after the mid-2000s, which is qualitatively consistent with decadal increases of SSTs (Figure 4B). The decadal increases of SSTs near the river mouth in spring were most prominent for June (Figure 9B), which corresponds to the month that sea entry begins for juvenile chum salmon from the Amur River. Moreover, Saito and Fukuwaka (2018) showed that year-to-year SSTs near the mouth of the Amur River in mid-June were correlated with residuals from the reproduction curve of the Beverton–Holt model for the 1989–2012 brood years. The period with SSTs of 5–13°C near the mouth of the Amur River also tended to lengthen decadally after 2000 (Figure 9A). In consequence, the latitudinal contrast of SST trends in spring between Pacific waters around Hokkaido and in the northwestern Sea of Okhotsk could account for contrasting trends in catches/returns of chum salmon after the mid-2000s.
Pacific Stocks of Japanese Sardine and Japanese Anchovy
Pacific stocks of Japanese sardine (Sardinops melanostictus) and Japanese anchovy (Engraulis japonicus) are widely distributed in the Northwestern Pacific (Figures 6C,D). The biomasses of these stocks have changed alternately in response to climate change or regime shifts. On the basis of VPA, the Pacific stock of Japanese sardine (anchovy) was at a high (low) level in the 1980s, a well-known cold regime around Japan, and decreased (increased) dramatically with the climate regime shift in 1988/1989 to a warm regime (Figure 10A). The biomass of sardine (anchovy) remained at a low (high) level during the 1990s, and increased (decreased) gradually after the mid-2000s. The gradual increase of sardine stock biomass was accompanied by a gradual increase of RPS after 2000 (Figure 10B).
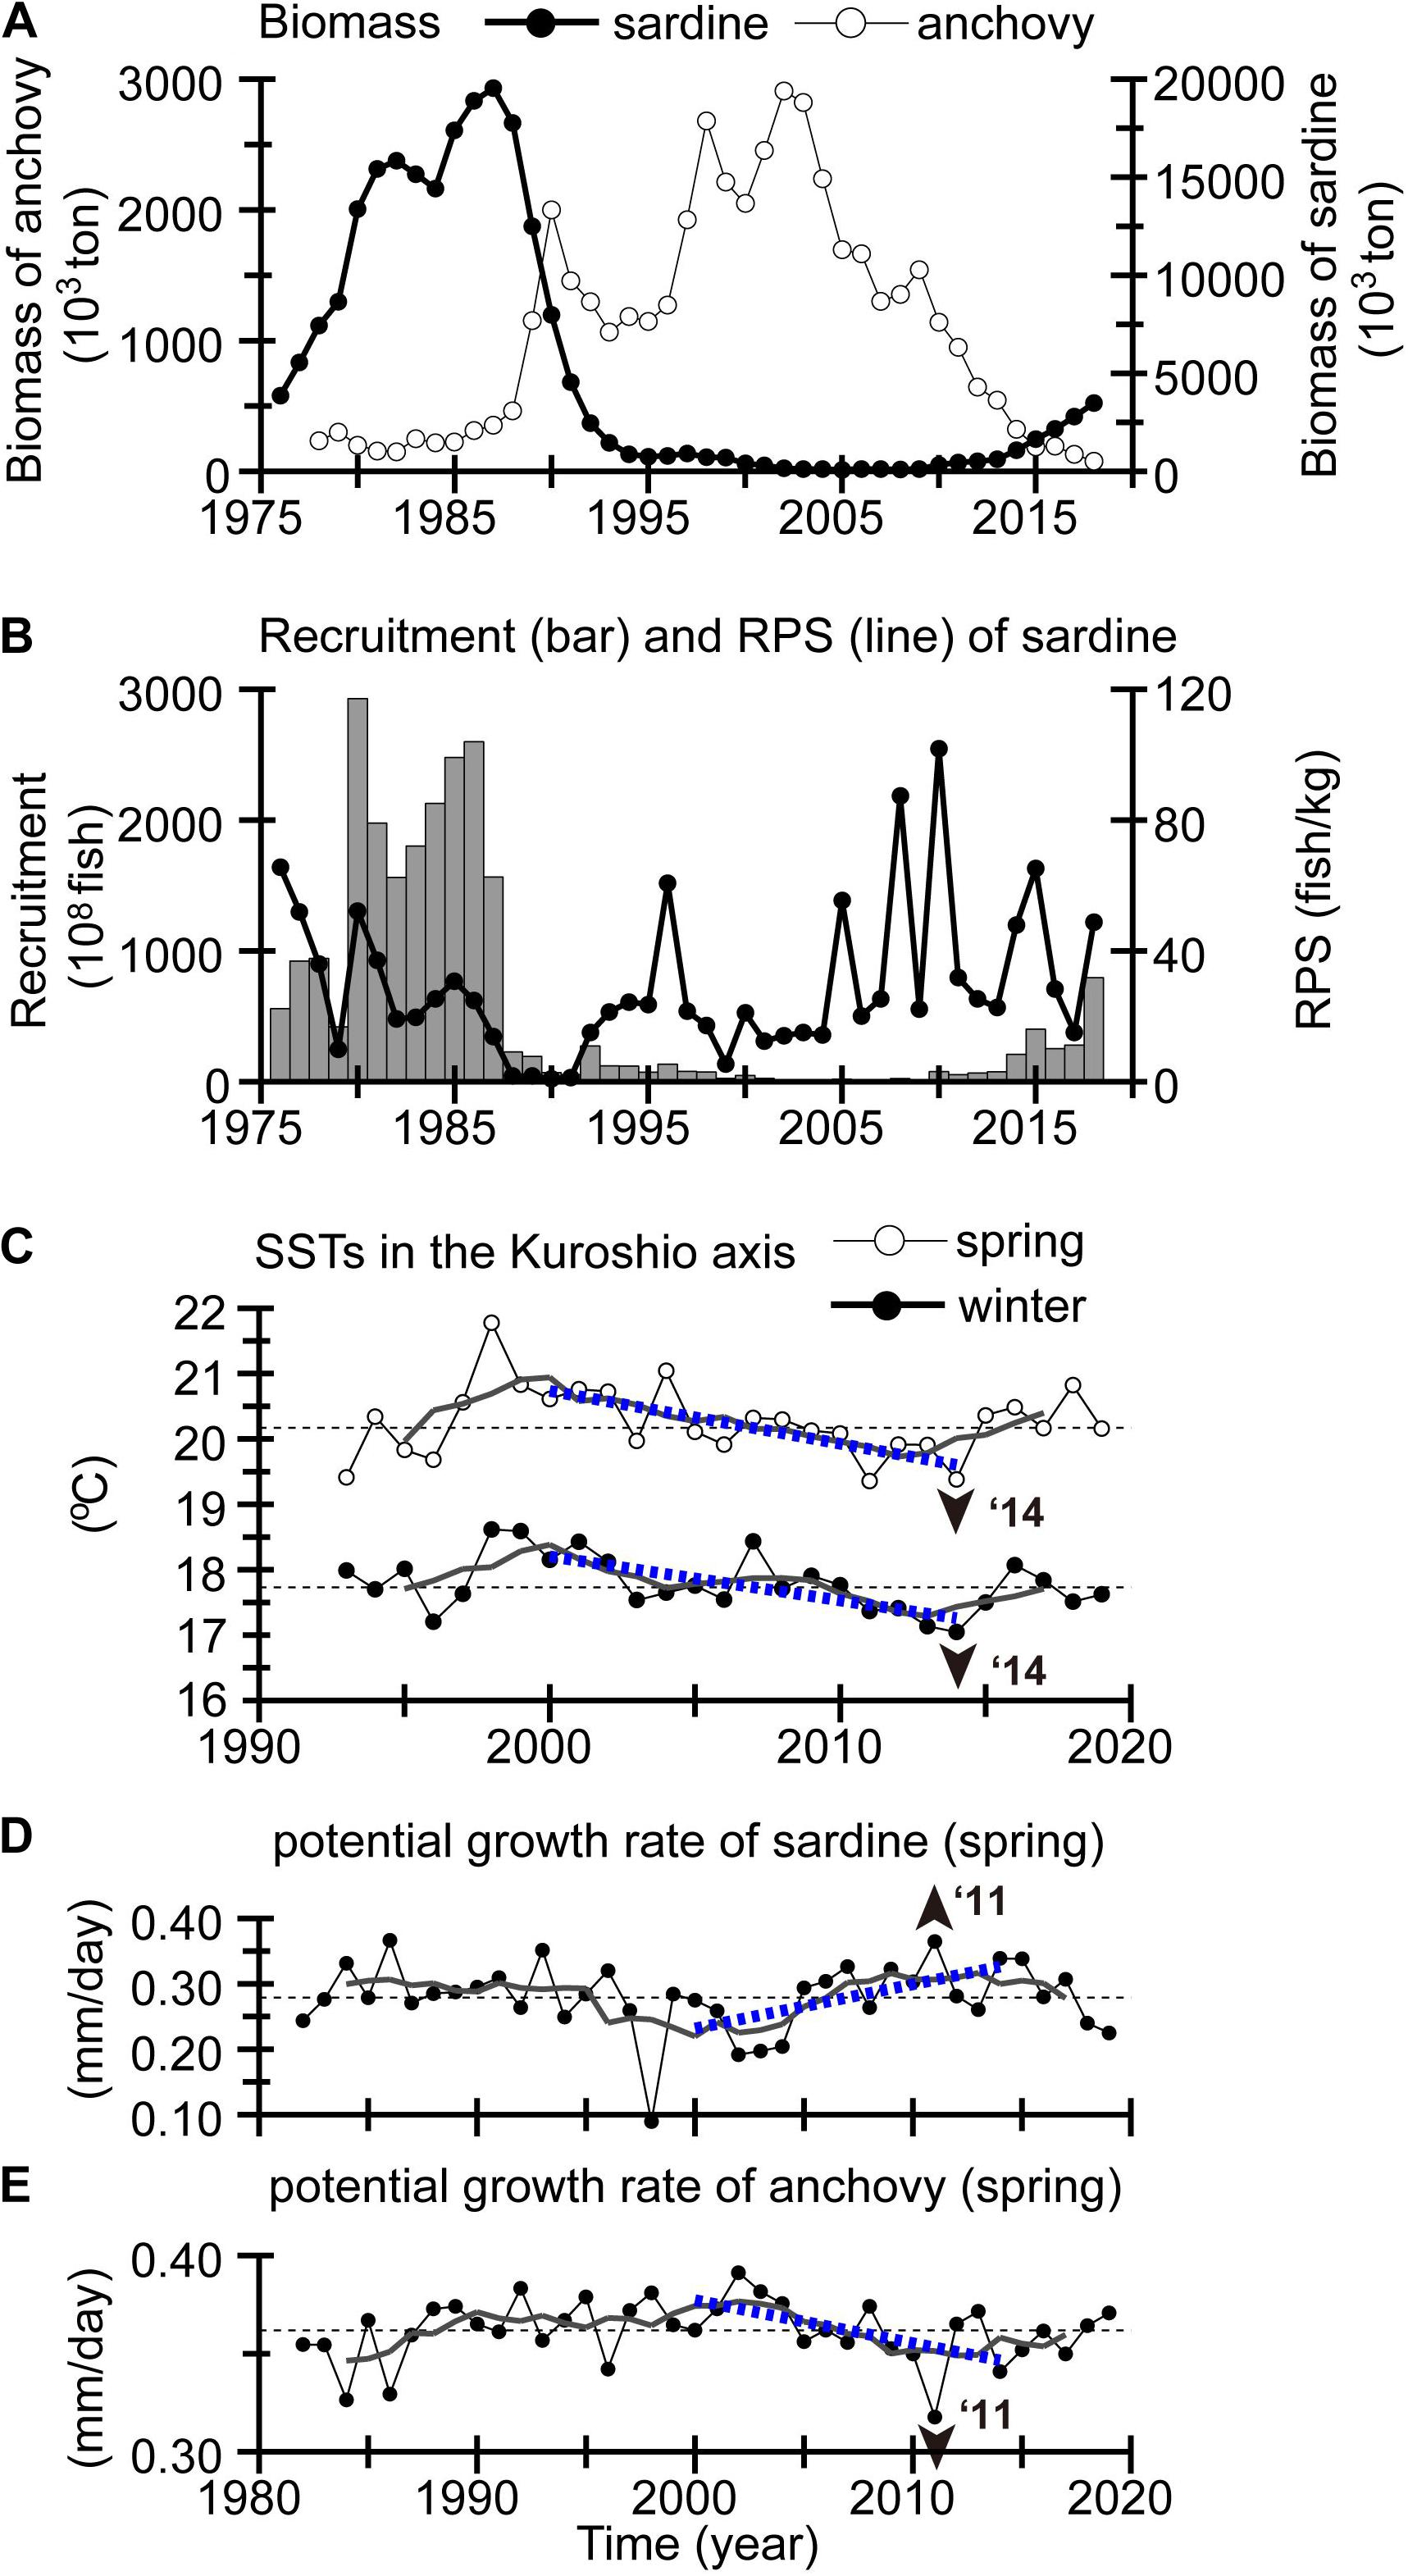
Figure 10. (A) Biomass of the Pacific stock of Japanese sardine (closed circles) and anchovy (open circles). (B) Recruitment (bar chart) and RPS (line graph) of sardine. (C) SSTs during winter (closed circles) and spring (open circles) averaged for the Kuroshio area from 130 to 160°E with a stream width of ± 50 km centered at the Kuroshio axis. Potential larval growth rate of (D) sardine and (E) anchovy in spring averaged for the green box in Figures 11B,F, respectively. Display style in (C–E) is the same as in Figure 5.
Since 1978, there have been monthly, extensive, fishery-independent egg surveys by a collaboration of Japanese research institutes along the Pacific coast of Japan (Oozeki et al., 2007). The surveys revealed that the spawning season of Japanese sardine is October–July (mainly February–April), whereas that of Japanese anchovy extends almost throughout the year (mainly April–July). Spawning grounds of the two species overlap during February–June in coastal waters north of the Kuroshio (Takasuka et al., 2008b; Figures 6C,D). Eggs and larvae are transported near the sea surface by the Kuroshio/Kuroshio Extension to the Mixed Water Region.
Nishikawa (2019) recently conducted particle-tracking experiments for the Pacific stock of Japanese sardine using daily reanalysis products from an operational ocean forecast system with a resolution of 0.1° in both latitude and longitude that were referred to as “Four-dimensional Variational Ocean ReAnalysis for the Western North Pacific (FORA-WNP)” (Usui et al., 2017). The initial positions of particles were set on the basis of the extensive egg surveys and tracked for 1 month, corresponding to an approximate egg and larval period. The particle-tracking experiments were conducted for the low stock period from 1995 to 2010. Nishikawa (2019) discovered that the ambient temperature experienced near the Kuroshio axis by particles (i.e., virtual larvae) for winter spawning groups had a significant negative correlation with the natural logarithm of RPS. That is, temperatures weighted by density of virtual larvae decreased decadally after 2000, when RPSs of Japanese sardine increased. We also confirmed that SSTs simply averaged for the Kuroshio axial area over 130–160°E similarly exhibited a decadal decrease during winter–spring after 2000 (Figure 10C). Therefore, decadal cooling of SSTs after 2000 in and around the subtropical gyre (Figures 5A,B) could be related to the decadal increase of Japanese sardine.
To obtain some clues about the sardine–anchovy species alternation after the mid-2000s, we considered the “optimal growth temperature hypothesis” proposed by Takasuka et al. (2007), in which out-of-phase population oscillations between anchovy and sardine (species alternations) are caused by differences in temperatures for optimal growth rates during their larval stage. Anchovy larvae had an optimal growth rate at 22.0°C, whereas sardine had an optimal growth rate at 16.2°C. We estimated trends of potential larval growth rate for sardine and anchovy in 2000–2014 using approximate quadratic curves of their growth rates as a function of SSTs that were determined by Takasuka et al. (2007). The trends of potential growth rates of the two species tended to exhibit a contrasting pattern in coastal waters north of the Kuroshio throughout the year, except for summer; a positive trend for sardine and a negative one for anchovy (Figure 11). We graphed the potential growth rates of the two species on the shelf–slope east of Cape Shiono, southern Honshu Island, during spring, i.e., roughly when their spawning seasons overlap (Figures 10D,E). For 2000–2014, the potential growth rate of sardine increased decadally (0.095 mm day–1 for 14 years), while that of anchovy decreased more slowly (0.031 mm day–1 for 14 years). The potential growth rate of sardine (anchovy) reached a high (low) level around 2014–2015 and was comparable to that in the 1980s. These results imply that decadal cooling after 2000 positively (negatively) affected the survival of sardine (anchovy) larvae via growth rate and resulted in contrasting changes in their biomass.
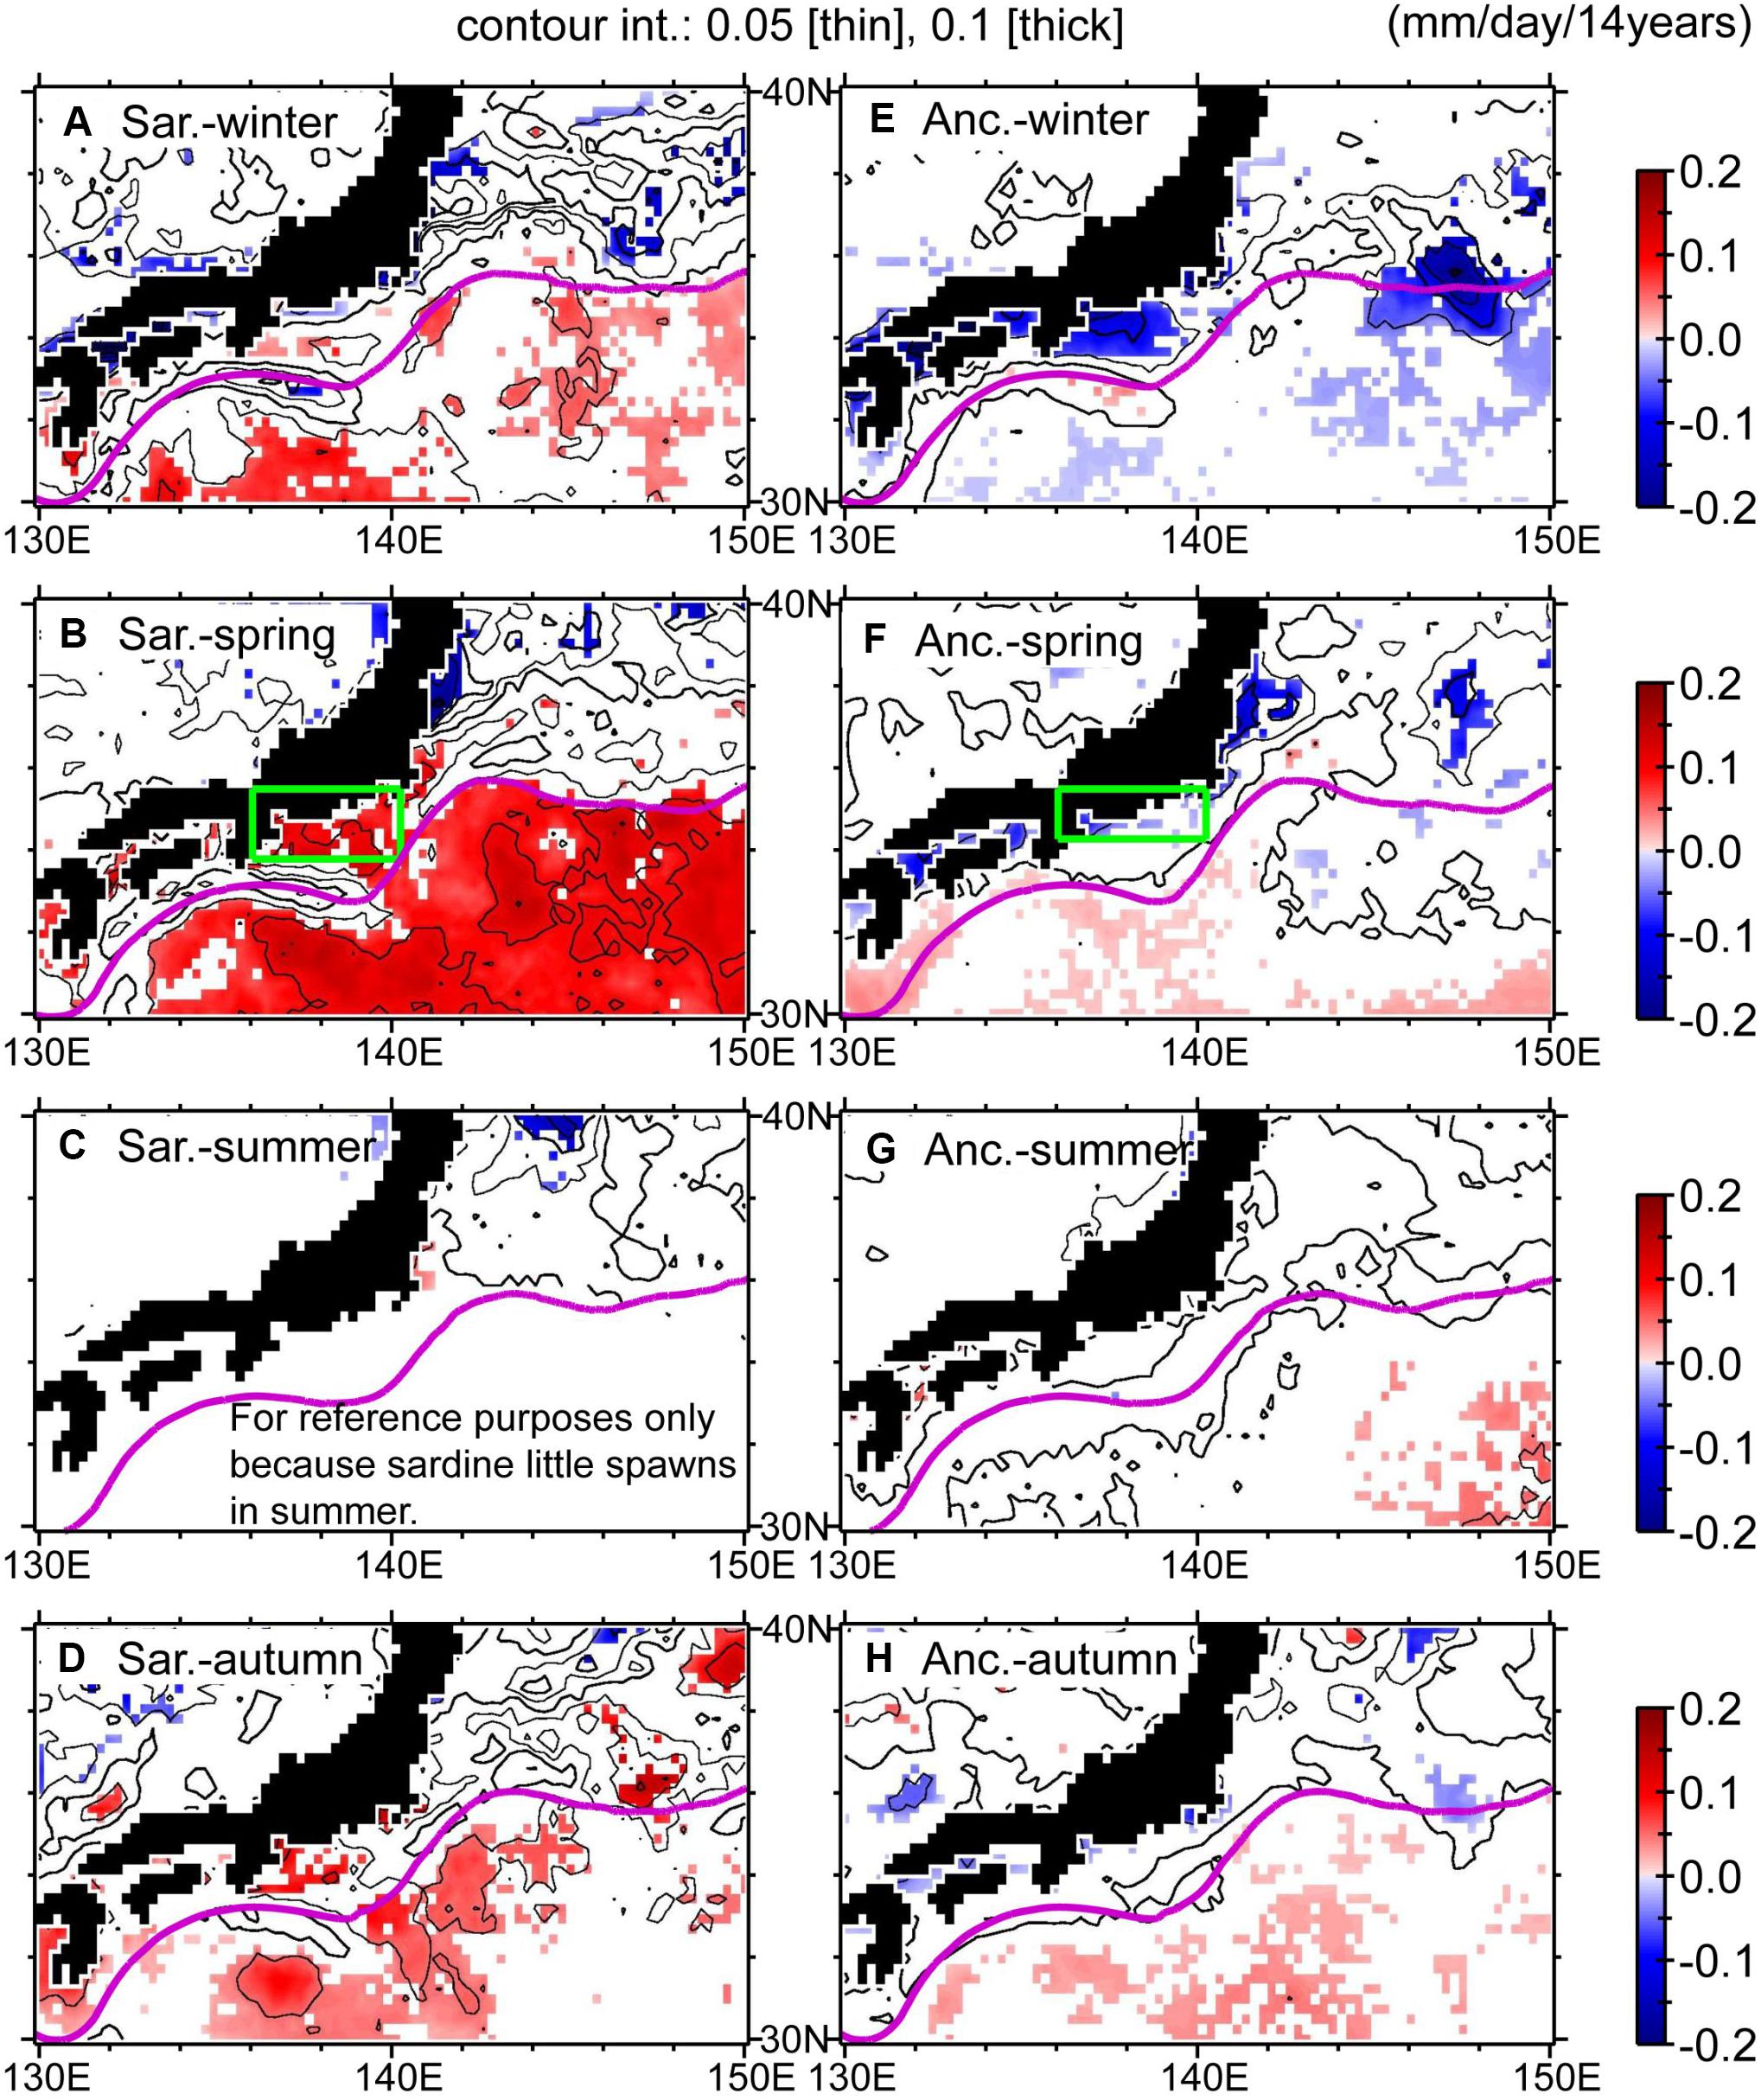
Figure 11. Trends for 2000–2014 in potential larval growth rate of Japanese sardine: (A) winter, (B) spring, (C) summer, and (D) autumn. (E–H) Same as (A–D), but for Japanese anchovy. Display style is the same as in Figure 4.
It is worth noting that, after 2014, the peak month for sardine spawning shifted earlier by about 1 month, from April to March, for the shelf–slope region east of Cape Shiono (Furuichi et al., 2019). The earlier spawning in 2015–2019 was associated with a step-like jump of SSTs around the subtropical gyre during winter–spring in 2014–2015 (Figures 5A,B, 10C). To quantitatively confirm this observation, we used the gridded SST data to estimate 5-year mean SSTs at about 10-day intervals for 2010–2014 and 2015–2019. For each grid point, we observed a time deviation between SSTs in April in 2010–2014 and the seasonal cycle of SSTs in 2015–2019 (e.g., red arrows in Figure 12A). Figures 12B,C shows a map of the maximum and mean deviations, respectively. The illustrated areas mostly show negative deviations, which means that seasonal SST changes came earlier in 2015–2019 than in 2010–2014. In contrast, there were positive deviations around the Kuroshio axis, where seasonal SST changes for 2015–2019 were delayed, partly because of a persistent shift of the Kuroshio path to a “Large Meander” beginning in 2017 (Nagano et al., 2019). For the shelf–slope region east of Cape Shiono (136–141°E) and north of the Kuroshio, there were localized extreme deviations, where SSTs in 2015–2019 arrived more than 35 days earlier (for the maximum deviation; Figure 12B) or more than 20 days (for the mean deviation; Figure 12C) than in 2010–2014. Hence, the spawning season of Japanese sardine could begin earlier locally on the shelf–slope east of the cape in response to SST jumps after the mid-2010s.
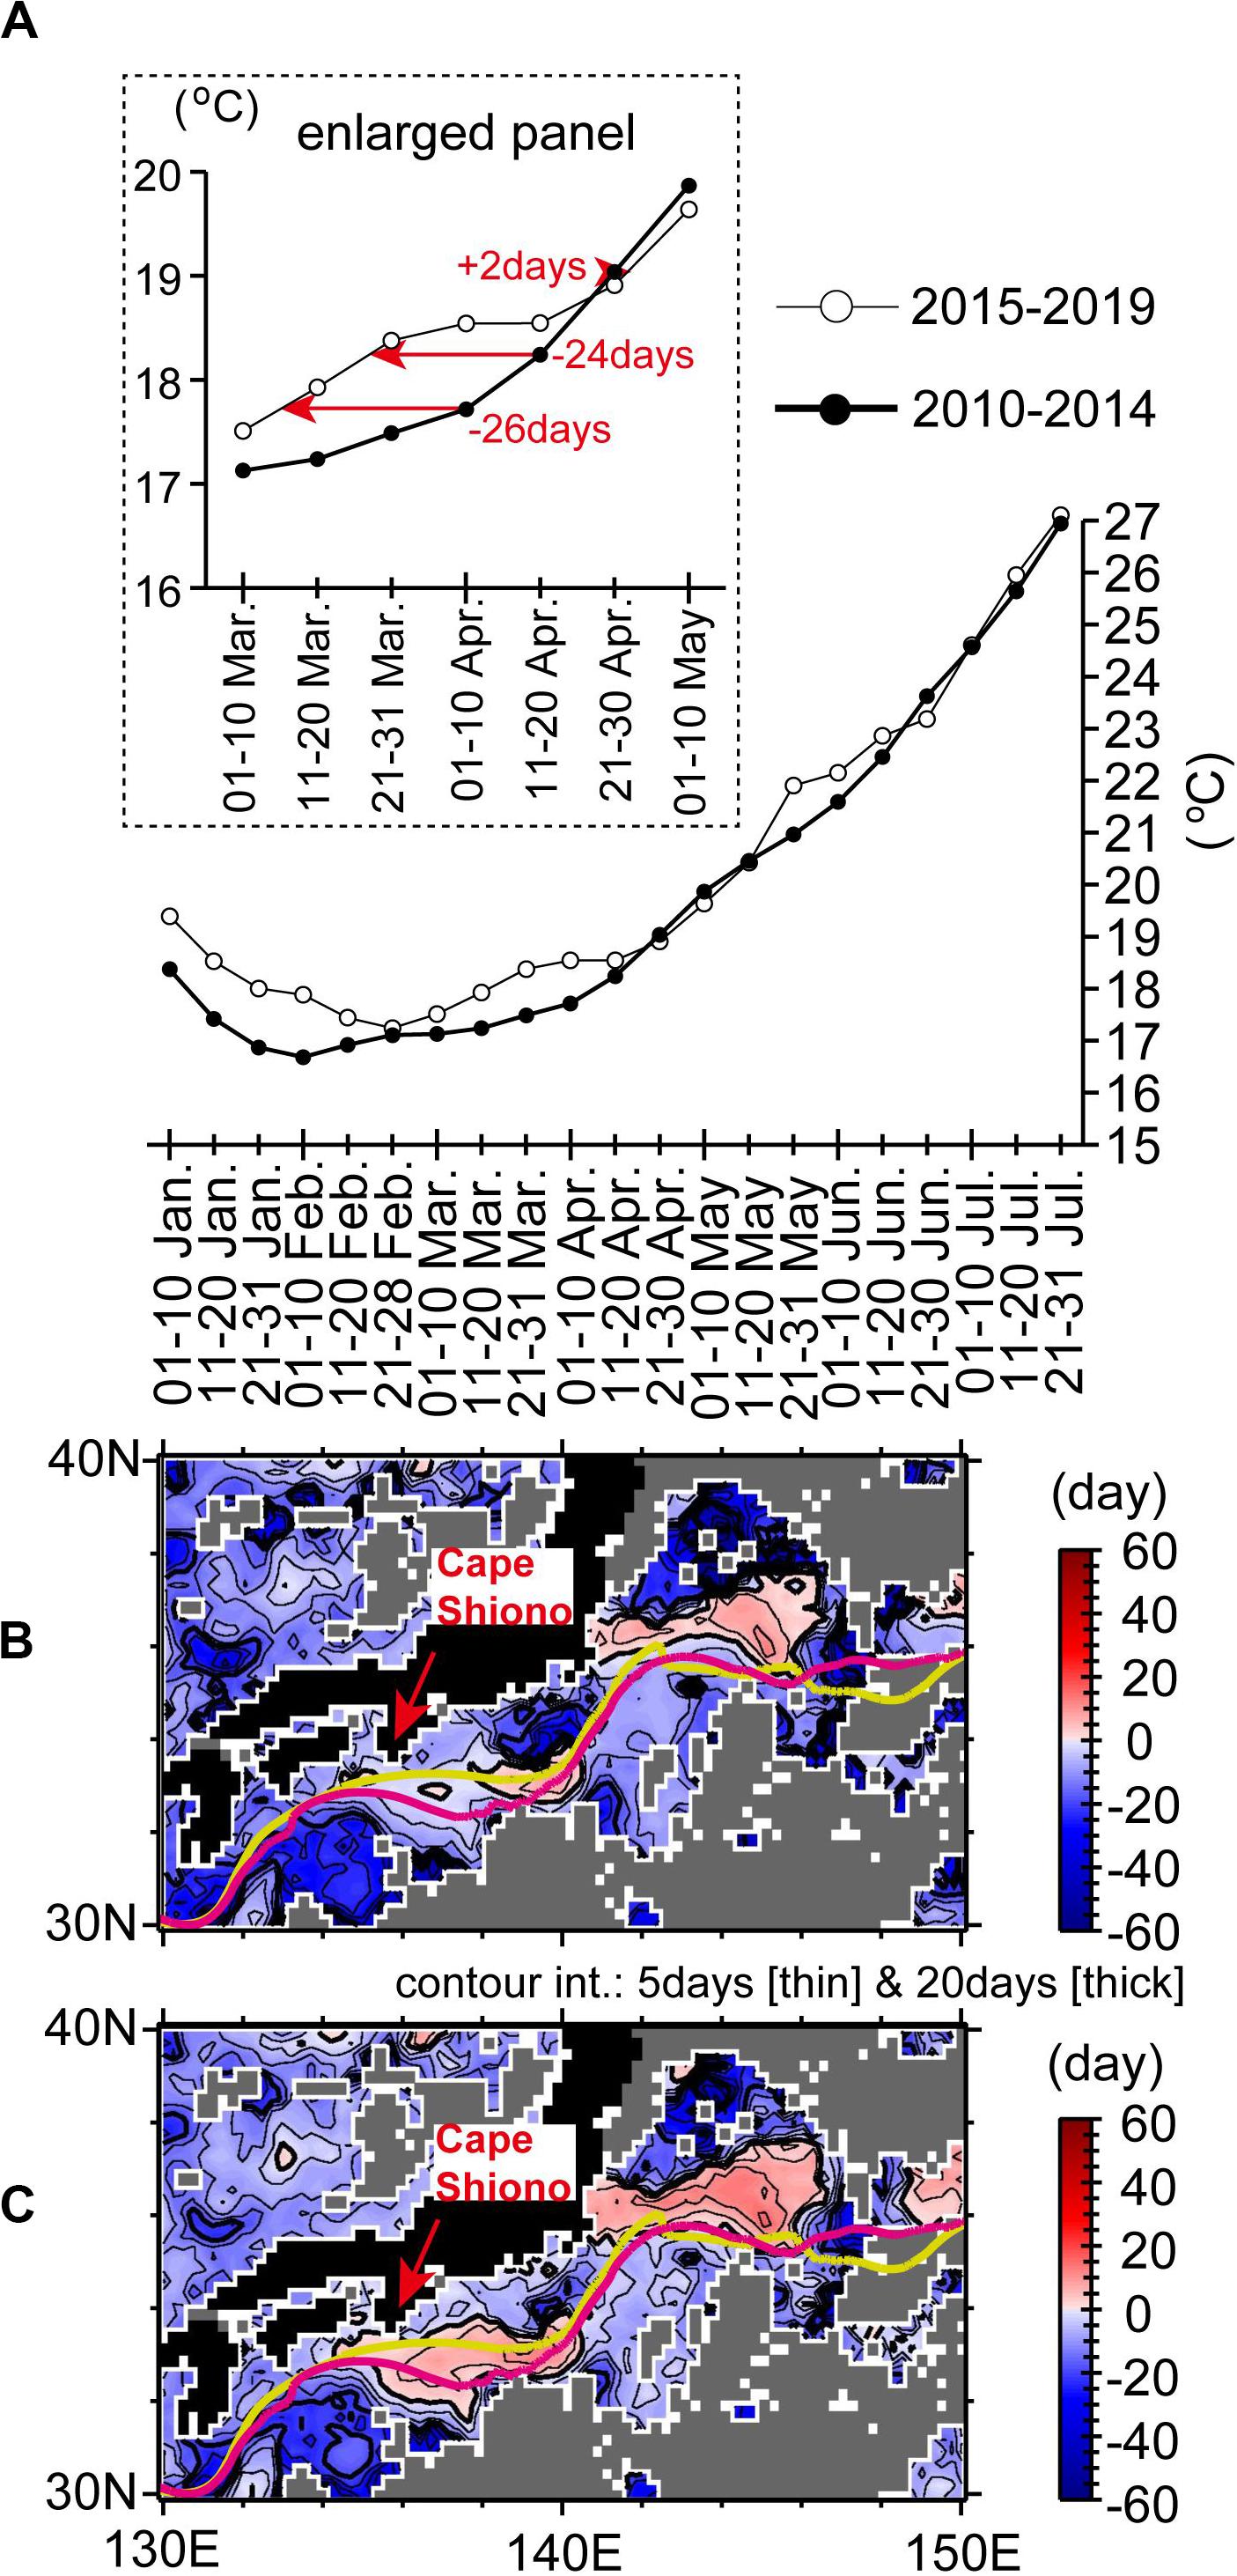
Figure 12. (A) SSTs at 139.875°E, 34.375°N averaged for 2010–2014 (closed circles) and 2015–2019 (open circles) over intervals of about 10 days. Red arrows with numerals in the upper-left enlarged panel indicate time deviations of 10-day SSTs in April for 2010–2014 from the seasonal cycle of SSTs for 2015–2019. The deviations are illustrated as a map of the monthly (B) maximum and (C) mean. Yellow-green (pink) lines in (B,C) indicate the Kuroshio axis position averaged for April in 2010–2014 (2015–2019). Gray shading means that the minimum of 10-day SSTs in April for 2010–2014 was lower than the minimum of 10-day SSTs throughout the year for 2015–2019.
Winter Spawning Stock of Japanese Flying Squid
The stock of Japanese flying squid (Todarodes pacificus) is classified into autumn and winter spawning stocks as part of the stock assessment. We focused on the winter spawning stock. The early life history of this stock is similar to that of Japanese Pacific sardine and anchovy, except for the main spawning season and ground. The main spawning season in recent years has been January–March, and the main spawning ground is on shelves with a water depth of 100–500 m north of the Kuroshio in the East China Sea (Rosa et al., 2011; Figure 6E). Potential spawning areas on these shelves were often identified based on SSTs of 18–23 or 19.5–23°C (Sakurai et al., 2013). After the adults spawn, the eggs and larvae are transported to the Mixed Water Region mainly by the Kuroshio/Kuroshio Extension, and the developing juveniles migrate northward to the vicinity of Hokkaido, where there is a commercial fishery after early summer.
After 1990, the stock generally remained at a medium–high level due to favorable oceanographic conditions for recruitment. However, after a local peak in 2007, the stock and catch decreased gradually (Figure 13A). These decreases were accompanied by persistent low RPSs that started after 2001 (median 2.7), except for in 2007 (Figure 13B).
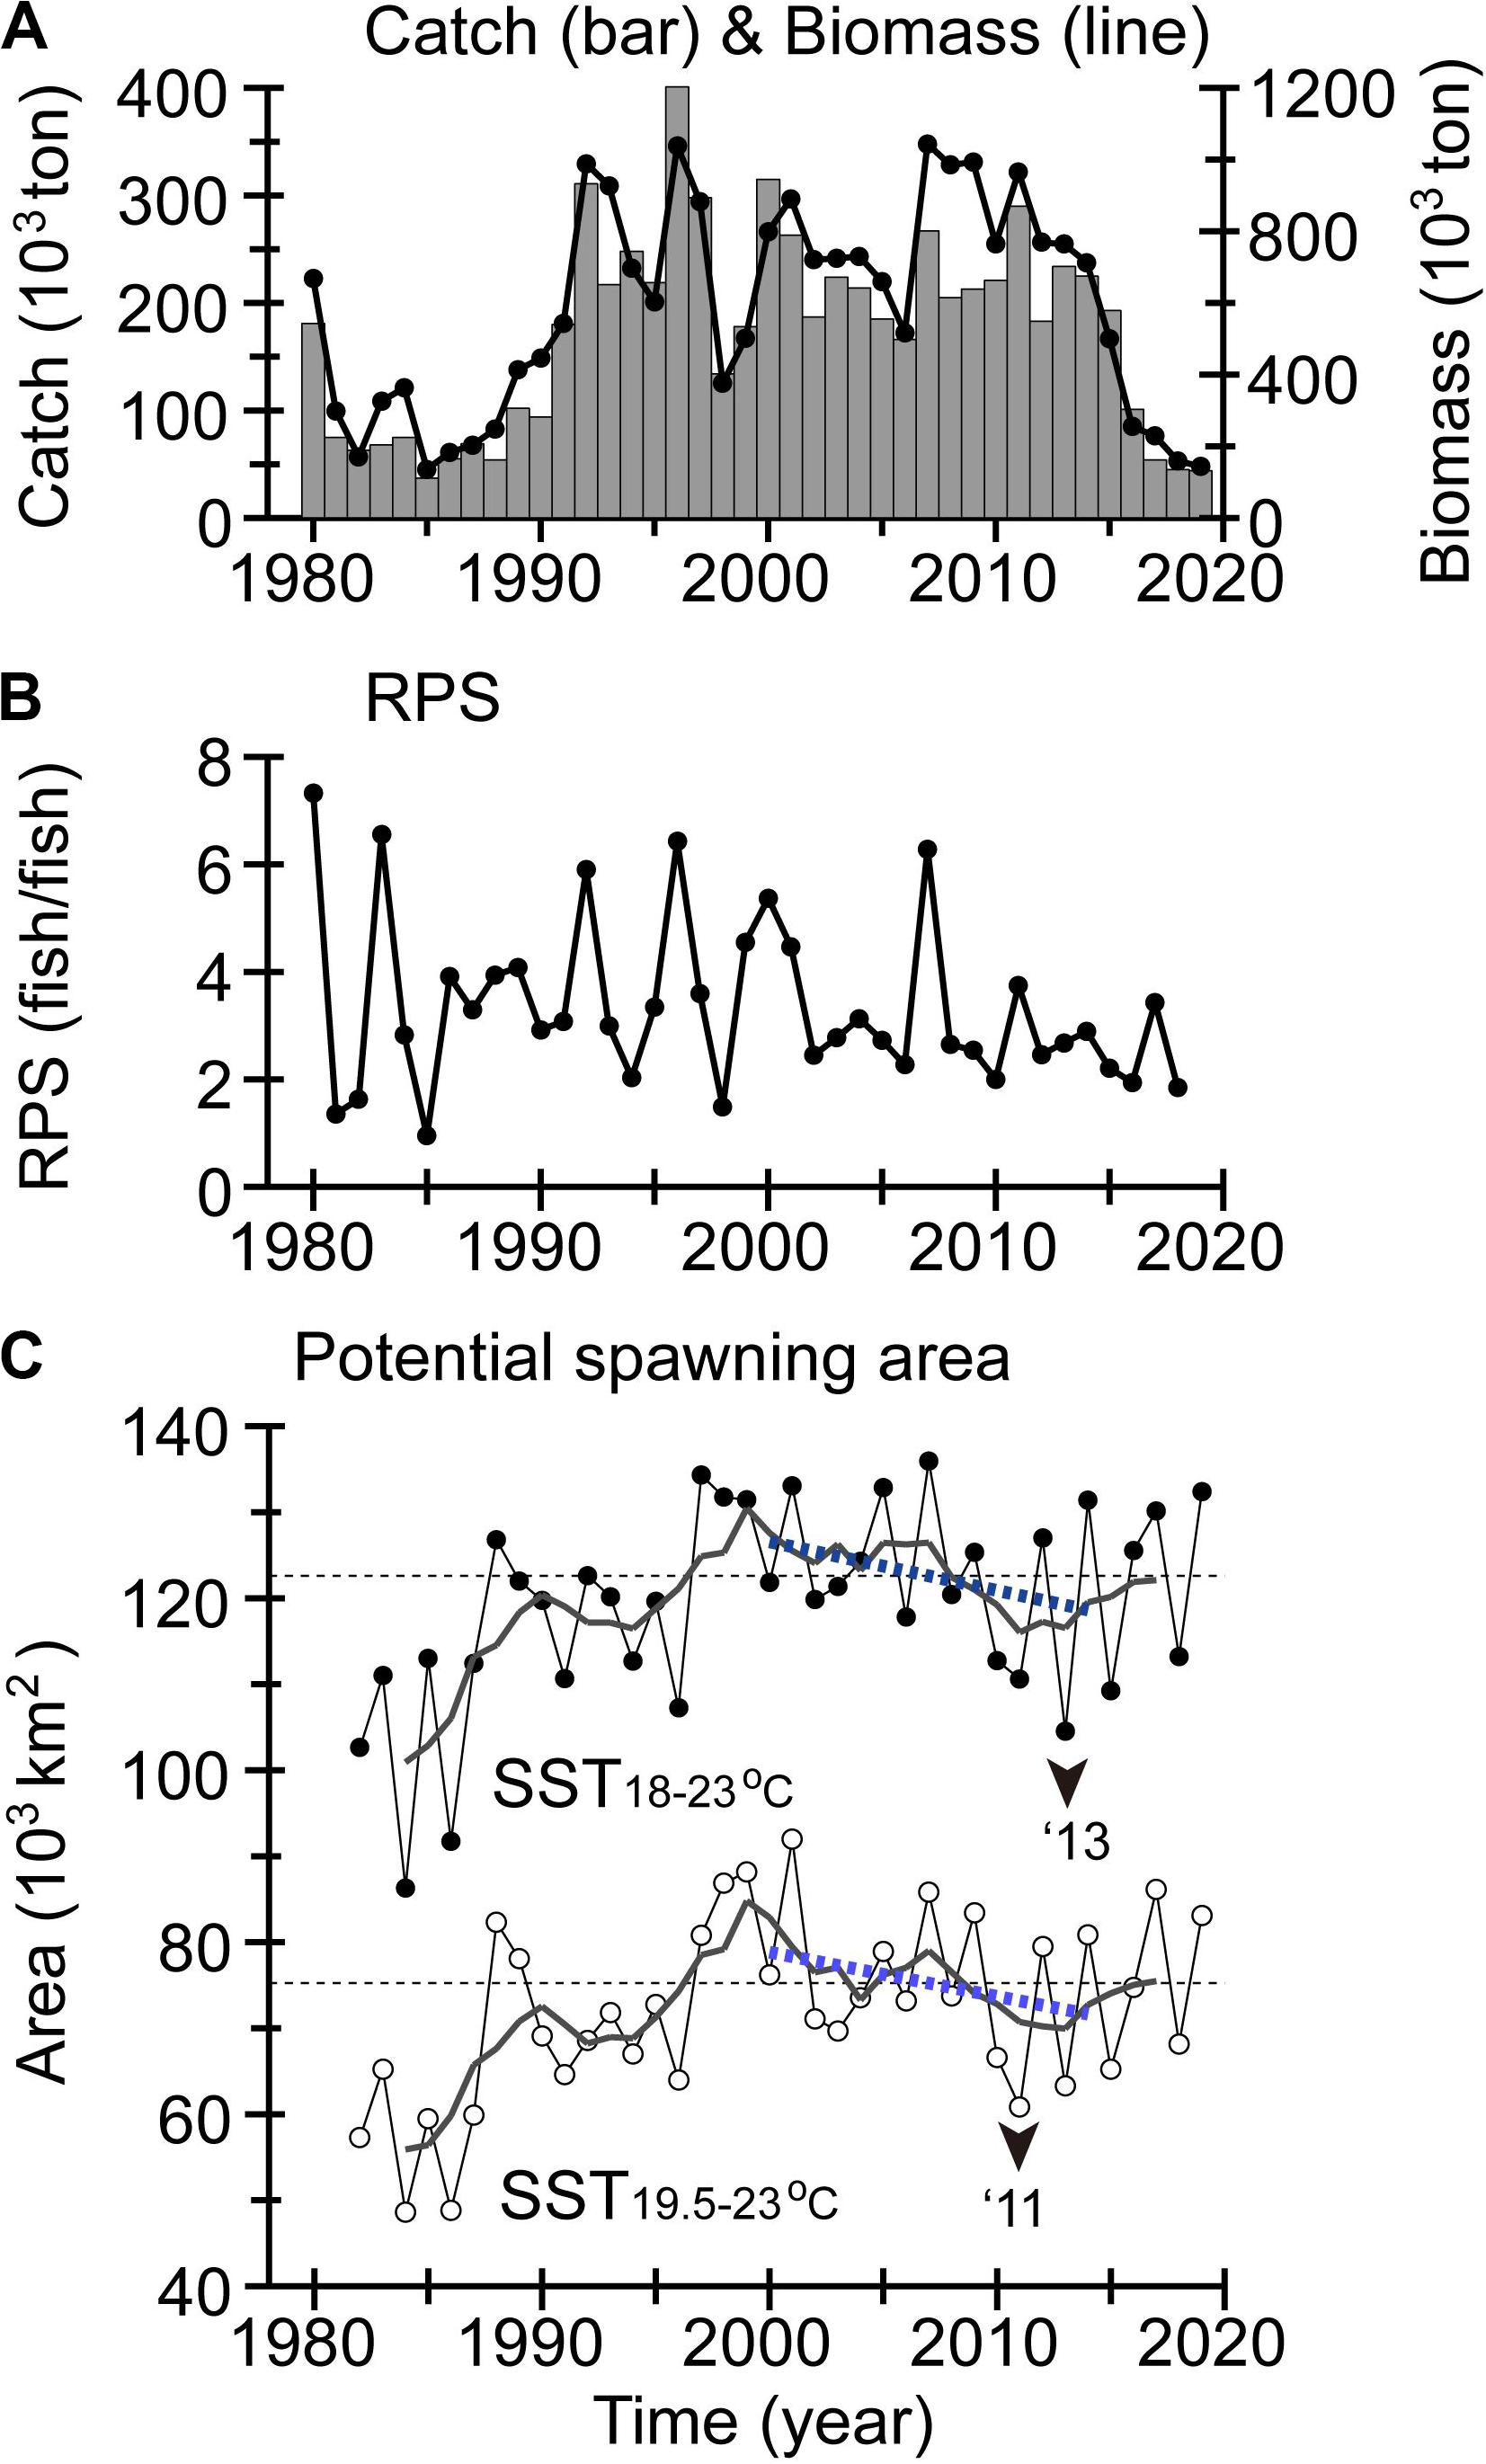
Figure 13. (A) Catch (bar chart), biomass (line graph), and (B) RPS for winter spawning stock of Japanese flying squid. (C) Potential spawning area as estimated by winter SSTs of 18–23°C (closed circles) and 19.5–23.0°C (open circles) on shelves with a water depth of 100–500 m, north of the Kuroshio in the East China Sea (Rosa et al., 2011). Display style in panel (C) is the same as in Figure 5.
Two processes have been proposed related to the early life history of the Japanese flying squid and affecting its recruitment. One concerns spawning conditions in the East China Sea (Sakurai et al., 2013), and the other is the condition of eggs and larvae during transport after spawning (Kuroda et al., 2013). Here, we highlight only the former process. As seen in Kaga et al. (2019), the potential area available for spawning decreased gradually after 2000 (Figure 13C). The total area was particularly small in 2010, 2011, 2013, 2015, and 2018, associated with low RPSs in the 2010s (Figure 13B). These decadal decreases in the potential spawning area were caused by decadal decreases of SST in winter after 2000 around the subtropical gyre (Figures 4A,E).
Note that year-to-year variations of RPS might not be completely accounted for by variations in potential spawning area. In fact, particle-tracking experiments based on FRA-ROMS reanalysis data (Kuroda et al., 2013) showed that a high RPS in 2007 was also attributable to successful transport of eggs and larvae from the spawning areas to the Mixed Water Region. Thus, the year-to-year variations of RPS might have been determined by combined effects of potential spawning area with transport of the eggs and larvae. This point will be discussed again in the subsequent section.
Discussion
We have presented an overview of air temperature and SST conditions around Japan during the 2000s–2010s in terms of global climate change. During the global surface warming slowdown in 1998–2012, corresponding to the negative phase of the PDO index (1998–2013), decadal cooling and warming of land surface air temperatures in Japan was apparent for winter–spring and summer–autumn, respectively. Some studies have suggested linkages via teleconnection between Japanese air temperatures and La-Niña-like cooling in the tropical Pacific, which was tied to the global surface warming slowdown of the 2000s (Urabe and Maeda, 2014; Imada et al., 2017). Meanwhile, note that the decadal cooling of Japanese air temperatures during winter–spring occurred near the easternmost edge of the region of severe cooling in central Eurasia. There have been some mechanisms proposed for the severe cooling that are associated with Arctic sea-ice loss and/or atmospheric internal variability, but these remain controversial.
It should be emphasized that decadal cooling (warming) in winter–spring (summer–autumn) was not evident in Japanese air temperatures during the period of a global surface warming slowdown in the 1940s–1970s (Figures 2A,C). Thus, such decadal cooling and decadal intensification of the seasonal contrast does not necessarily occur during a global surface warming slowdown but may be coincidentally identified with the recent slowdown period.
Moreover, SSTs around Japan provide evidence of an unconventional regime in the 2000s–mid-2010s: despite the negative phase of the PDO index, SSTs exhibited decadal cooling in some waters and seasons. Basin-scale SSTs in the western part of the subtropical gyre around and south of the Kuroshio/Kuroshio Extension gradually decreased, except for in summer. Meanwhile, basin-scale SSTs in the western subarctic gyre and in the Sea of Okhotsk increased. Local SSTs off the Hokkaido coast between the subtropical and subarctic waters exhibited seasonal contrasts that were decadally intensified because of the combined effects of cooling in winter–spring and warming in summer–autumn. The local cooling in winter–spring is attributable mainly to decadal intensification of wind-induced circulation in the Sea of Okhotsk. Around the mid-2010s, with a positive shift of the PDO index, both basin-scale and local cooling trends around Japan disappeared immediately and instead the SSTs showed step-like increases. These features of SST were consistent overall with those of air temperature, except for a time lag of a few years.
It should be remembered that a regime shift is generally defined by an abrupt transition from one quasi-steady-state to another, and that the transition period is much shorter than the lengths of the individual periods of each climatic state. Time-averaging of a variable (e.g., SST) is utilized in regime-shift analysis to determine the quasi-steady regime. SSTs around Japan during the negative phase of the PDO in the 2000s–mid-2010s were not stable but showed decadal increases and decreases, the distribution of which differed spatially and seasonally. This suggests that SST conditions around Japan during these decades cannot be classified as either cool or warm regimes in the context of the conventional framework of regime-shift analysis. It is therefore appropriate to designate the SST regime around Japan during these decades as an “unconventional regime.” This unconventional regime could be also interpreted as an extreme regime, because some climate studies (e.g., Johnson et al., 2018) interpreted winter cooling in Eurasia, mainly during the slowdown period (Figure 3A), as an extreme climate event. In any case, our analysis serves as a reminder that an unconventional regime can appear transiently during a state of global warming.
We should emphasize that our use of the term “unconventional” to describe this SST regime is based on relationships between SST/fisheries-resource conditions around Japan and the PDO index, which is commonly estimated by assuming a stationary relationship between evolving patterns of ocean climate variability and fixed patterns identified by the original statistical definitions. In fact, however, spatial patterns of dominant basin-scale SST variability in the North Pacific are nonstationary and have changed over multi-decadal timescales. The canonical spatial pattern of the PDO was apparent predominantly prior to 1988/1989; subsequently, the spatial pattern became distorted and the canonical pattern rarely appeared (Litzow et al., 2020). Likewise, nonstationary changes after 1988/1989 were also detected in the North Pacific Gyre Oscillation (NPGO), the second dominant mode of the principal component with respect to sea level anomalies (Di Lorenzo et al., 2008). Our main focus is after 2000, when canonical spatial patterns of the PDO and NPGO mostly disappeared (Litzow et al., 2020). Nonstationary relationships between the PDO/NPGO indices and ecological conditions were also identified particularly in the northeastern Pacific (Schmidt et al., 2014; Litzow et al., 2019; Malick, 2020). Thus, the unconventional regime of SSTs around Japan in the 2000s–2010s should be further studied within a framework of nonstationarity.
We have presented herein an overview of potential influences of decadal SST changes on major fisheries resources through their early life stages in the waters around Japan. For the JPS of walleye pollock, the larvae that remained within Funka Bay in April of 2005–2014 showed decreases in growth rate with decadal decreases of SSTs. Low growth rates in 2010–2014 could have reduced recruitment after 2009, according to the “bigger is better” hypothesis (Funamoto et al., 2014). Decadal decreases of SSTs near the Pacific coast of Hokkaido during spring could worsen the survival of juvenile chum salmon from Pacific waters around Hokkaido. In addition, the duration of the period in spring in Pacific coastal waters with SSTs of 5–13°C, suitable for juvenile early marine residence, was shortened owing to both prolongation of the appearance of SSTs < 5°C in the 2010s with decadal SST cooling and rapid seasonal increase of SST in late spring in the 2010s, which was related to decadal intensification of the seasonal contrast of SSTs between winter–spring and summer–autumn. These decadal SST trends were opposite to those near the mouth of the Amur River. That is, the latitudinal contrast of these SST trends between the waters around Hokkaido and in the northwestern Sea of Okhotsk could account for the contrast in commercial catches of chum salmon. For decadal increases (decreases) in the Pacific stock of Japanese sardine (anchovy), the key phenomenon was decadal cooling of SSTs in coastal waters around the Kuroshio throughout the year, except for summer. Moreover, adult sardine might have adjusted to an abrupt increase of SSTs in spring after the mid-2010s by shifting their spawning season earlier by about a month. In addition, decadal cooling of SSTs on the shelves in the East China Sea north of the Kuroshio gradually shrank potential spawning areas of Japanese flying squid for the winter-spawning stock.
Note that our analyses have some limitations. First, the gridded SST data that we analyzed were created by merging satellite and in situ SSTs using optimal interpolation. Satellite-derived SST data often suffer from cloud noise. Optimal interpolation also spatially smooths SSTs, even if sharp thermal fronts are present. Kaga et al. (2018) reported that SSTs based on 0.1° reanalysis data from FRA-ROMS predicted a large reduction of potential spawning area of Japanese flying squid in the East China Sea during winter 2016, associated with a low RPS (Figure 13B). The large reduction resulted from both losses of northern potential spawning areas through a decrease of SSTs and of southern potential spawning areas by increased SSTs of Kuroshio water. In our analysis, however, we could not identify a similar large reduction in potential spawning area (Figure 13C), probably because of the relatively low resolution of our SST dataset. Inter-comparison among different SST datasets is needed to provide more quantitative results.
Second, our analyses were based on Eulerian viewpoints without biological consideration of realistic spatio-temporal distribution of eggs, larvae, and juveniles. Our analyses based on 3-month seasons were also restricted to decadal trends in 2000–2014. Therefore, this study could not address potential impacts of SSTs on year-to-year variations in fisheries resources or clarify any physical–biological processes/interactions other than potential impacts. These weaknesses in our study should be rectified by Lagrangian experiments coupling in situ biological measurements with particle tracking, or individual-based models embedded in ocean forecast systems.
Third, it is unclear whether the potential impacts that we summarized could predict stock variations after the mid-2010s. The exception is the adult sardine, which seemed to respond to the jump of SSTs during spring by an acceleration of the spawning season by about 1 month. However, the adjustment of other fisheries resources to oceanographic transitions after 2014–2015 is still a poorly understood but essential issue.
This article highlights five major fisheries resources around Japan. However, the potential impacts of SST trends are probably not limited to these five species. For example, some local stocks of herring (Clupea pallasii), a representative cold-water fish that spawns mainly in spring, increased simultaneously along the coast around Hokkaido after the mid-2010s. In particular, there were high recruitments of the 2012 year-class from around the positive shift of the PDO index for local stocks off southeastern Hokkaido (Yokota et al., 2019). Understanding their relationships with decadal SST cooling is an area of ongoing research.
Note that changes observed in some fishery resources in the mid-2000s could be largely unrelated to the decadal SST trends that occurred during the unconventional regime. For example, chub mackerel (Scomber japonicus) populations have been increasing and their spawning grounds shifted northward with an expansion of the areas after the 2000s (Kanamori et al., 2019). The combined effects of winter cooling and spring warming around a main spawning area for chub mackerel could have induced strong year-classes with high recruitment after 2000 (Kaneko et al., 2019). However, because its main spawning grounds are localized around shoals near the Izu Islands, SST variations that are locally controlled by the Kuroshio axis would be more important, with less direct impacts from basin-scale SST decreases around the subtropical gyre.
There are some fishery resources that changed beginning in the mid-2000s through unknown relationships with decadal changes in SSTs during the unconventional regime. For example, the catch of Pacific saury by Japanese fisheries decreased after 2010, particularly in the early fishing season of August–September (Kuroda and Yokouchi, 2017). However, to date we have no conclusive evidence to explain this recent decrease in the stock. Further studies are needed not only in terms of the relationships between a single fisheries resource and oceanographic conditions, including SSTs, but also in the context of multi-species interactions among fisheries resources in response to the unconventional climate regime. This includes prey–predator interactions through different trophic levels and interspecific competitions at similar trophic levels (e.g., Nakayama et al., 2018; Takasuka et al., 2019a, b).
Lastly, climate-induced regime shifts are more-or-less linked among different regions of the world, as climate change is a global-scale phenomenon. Hence, there could be similarities and differences among the regions in the responses of fisheries resources to regional regimes. We anticipate that the present article will contribute to future comparisons of oceanography and fisheries among different ecosystems of the world under ongoing climate change. The past may not be repeated in the future.
Data Availability Statement
The datasets of daily SSTs were found at the website for the North-East Asian Regional component of the Global Ocean Observing System (NEAR-GOOS): https://ds.data.jma.go.jp/gmd/goos/data/database.html. The meteorological reanalysis data of monthly air temperature and 6-hourly wind were collected from the websites of NCEP/NCAR (https://www.esrl.noaa.gov/psd/data/gridded/data.ncep.reanalysis.pressure.html) and JRA55 (https://jra.kishou.go.jp/JRA-55/index_ja.html), respectively. The time-series data used in Figures 2A–C were downloaded from the website of the Japan Meteorological Agency: global mean surface temperature anomalies, https://www.data.jma.go.jp/cpdinfo/temp/list/csv/an_wld.csv; PDO index, https://www.data.jma.go.jp/gmd/kaiyou/data/db/climate/pdo/pdo.txt; and surface air temperatures over land in Japan, https://www.data.jma.go.jp/cpdinfo/temp/list/csv/ssn_jpn.csv. The time-series data used in Figures 8A,B were downloaded from websites of the Hokkaido Salmon Enhancement Program Association (http://sake-masu.or.jp/html/07-01.html) and the FRA (http://salmon.fra.affrc.go.jp/zousyoku/ok_relret.html).
Ethics Statement
Ethical review and approval was not required for the animal study because data of fisheries resources that this study analyzed were already published from Fisheries Agency and Fisheries Research and Education Agency of Japan, as cited in the main text.
Author Contributions
HK summarized the ideas and wrote the manuscript through discussions with co-authors. TN checked/modified the content related to climate change. TS and TK checked/modified the manuscript with respect to chum salmon and Japanese flying squid, respectively. AT, YK, and SF checked/modified the manuscript where it concerns Pacific sardine and anchovy. All authors contributed to the article and approved the submitted version.
Funding
Part of this study was supported by the funds provided by the Japan Fisheries and Education Agency, the Fisheries Agency of Japan, and the Ministry of Education, Culture, Sports, Science and Technology (KAKEN grants 17H00775 and 19K06216), but the study findings do not necessarily reflect the views of Fisheries Agency.
Conflict of Interest
The authors declare that the research was conducted in the absence of any commercial or financial relationships that could be construed as a potential conflict of interest.
Acknowledgments
We thank Dr. Masayuki Chimura and Norio Shirahuji of FRA for participating in discussions about some of the fisheries resources and Dr. Takashi Setou of FRA for preparation of FRA-ROMS reanalysis data. We also extend a special thanks to the editor and two reviewers for their encouragement and their many constructive comments.
Supplementary Material
The Supplementary Material for this article can be found online at: https://www.frontiersin.org/articles/10.3389/fmars.2020.574904/full#supplementary-material
Footnotes
- ^ The global surface warming slowdown has been frequently referred to as a “global warming hiatus,” but we avoid that term in the present study because the global surface warming slowdown does not represent a slowdown in warming of the climate system but rather is an energy redistribution within the oceans (Yan et al., 2016) that includes, e.g., continued deep-sea warming (Chen and Tung, 2014).
- ^ Chum salmon at age n spend n-1 winters in the ocean.
References
Bax, N. J. (1983). Early marine mortality of marked juvenile chum salmon (Oncorhynchus keta) released into Hood Canal, Puget Sound, Washington, in 1980. Can. J. Fish. Aquat. Sci. 40, 426–435. doi: 10.1139/f83-061
Chavez, F. P., Ryan, J., Lluch-Cota, S. E., and Miguel Ñiquen, C. (2003). From anchovies to sardines and back: multidecadal change in the Pacific Ocean. Science 299, 217–221. doi: 10.1126/science.1075880
Chen, L., Li, T., Wang, B., and Wang, L. (2017). Formation mechanism for 2015/16 super El Niño. Sci. Rep. 7:2975. doi: 10.1038/s41598-017-02926-3
Chen, X., and Tung, K.-K. (2014). Varying planetary heat sink led to global-warming slowdown and acceleration. Science 345, 897–903. doi: 10.1126/science.1254937
Chimura, M., Nakagawa, T., Yokota, T., Tadokoro, K., Mutoh, T., and Watanobe, M. (2016). “Survival and food environment of larvae–juveniles for Japanese Pacific stock of walleye pollock,” in Proceedings of the Annual Report of Analysis and Research to Clarify Variation Factors of Fishery Resources (Shigen Hendo Youin Bunseki Chosa) in Fiscal Year 2015, Tokyo, 20–21.
Collow, T. W., Wang, W., and Kumar, A. (2018). Simulations of Eurasian winter temperature trends in coupled and uncoupled CFSv2. Adv. Atmos. Sci. 35, 14–26. doi: 10.1007/s00376-017-6294-0
Csanady, G. T. (1978). The arrested topographic wave. J. Phys. Oceanogr. 8, 47–62. doi: 10.1175/1520-0485(1978)008<0047:tatw>2.0.co;2
Department of Fisheries and Forestry, Hokkaido Government [DFFHG]. (2019). Annual Statistics on Fishery and Aquaculture Production in Hokkaido (in Japanese). Available online at: http://www.pref.hokkaido.lg.jp/sr/sum/03kanrig/sui-toukei/suitoukei.htm (accessed June 2, 2020).
Di Lorenzo, E., Schneider, N., Cobb, K. M., Chhak, K., Franks, P. J. S., Miller, A. J., et al. (2008). North Pacific Gyre Oscillation links ocean climate and ecosystem change. Geophys. Res. Lett. 35:L08607. doi: 10.1029/2007GL032838
Easterling, D. R., and Wehner, M. F. (2009). Is the climate warming or cooling? Geophys. Res. Lett. 36:L08706. doi: 10.1029/2009GL037810
Ebuchi, N., Fukamachi, Y., Ohshima, K. I., and Wakatsuchi, M. (2009). Subinertial and seasonal variations in the Soya Warm Current revealed by HF ocean radars, coastal tide gauges, and bottom-mounted ADCP. J. Oceanogr. 65, 31–43. doi: 10.1007/s10872-009-0003-2
Funamoto, T., Yamamura, O., Shida, O., Itaya, K., Mori, K., Hiyama, Y., et al. (2014). Comparison of factors affecting recruitment variability of walleye pollock Theragra chalcogramma in the Pacific Ocean and the Sea of Japan off northern Japan. Fish. Sci. 80, 117–126. doi: 10.1007/s12562-014-0716-z
Furuichi, S., Watanabe, C., Yukami, R., Kamimura, Y., and Isu, S. (2019). “Stock assessment and evaluation for the Pacific stock of Japanese sardine (fiscal year 2018),” in Marine Fisheries Stock Assessment and Evaluation for Japanese Waters (fiscal year 2018/2019), ed. Fisheries Agency and Fisheries Research and Education Agency, Japan, 14–56.
Furuichi, S., Yukami, R., Kamimura, Y., Hayashi, A., Isu, S., and Watanabe, R. (2020). “Stock assessment and evaluation for the Pacific stock of Japanese sardine (fiscal year 2019),” in Marine Fisheries Stock Assessment and Evaluation for Japanese Waters (fiscal year 2019/2020), ed. Fisheries Agency and Fisheries Research and Education Agency of Japan (in Japanese). Available online at: http://www.abchan.fra.go.jp/digests2019/details/201901.pdf (accessed June 17, 2020).
Hase, H., Yoon, J. H., and Koterayama, W. (1999). The current structure of the Tsushima Warm Current along the Japanese coast. J. Oceanogr. 55, 217–235. doi: 10.1023/A:1007894030095
Healey, M. C. (1982). Timing and relative intensity of size-selective mortality of juvenile chum salmon (Oncorhynchus keta) during early sea life. Can. J. Fish. Aquat. Sci. 39, 952–957. doi: 10.1139/f82-130
Helsel, D. R., and Hirsch, R. M. (2002). Statistical Methods in Water Resources Techniques of Water Resources Investigations, Book 4, chapter A3. Reston, VA: U.S. Geological Survey.
Honda, K., Kawakami, T., Suzuki, K., Watanabe, K., and Saito, T. (2017). Growth rate characteristics of juvenile chum salmon Oncorhynchus keta originating from the Pacific coast of Japan and reaching Konbumori, eastern Hokkaido. Fish. Sci. 83, 987–996. doi: 10.1007/s12562-017-1137-6
Honda, M., Inoue, J., and Yamane, S. (2009). Influence of low Arctic sea ice minima on anomalously cold Eurasian winters. Geophys. Res. Lett 36:L08707. doi: 10.1029/2008GL037079
Honda, S., Oshima, T., Nishimura, A., and Hattori, T. (2004). Movement of juvenile walleye pollock, Theragra chalcogramma, from a spawning ground to a nursery ground along the Pacific coast of Hokkaido, Japan. Fish. Oceanogr. 13, 84–98. doi: 10.1111/j.1365-2419.2004.00318.x
Horton, D. E., Johnson, N. C., Singh, D., Swain, D. L., Rajaratnam, B., and Diffenbaugh, N. S. (2015). Contribution of changes in atmospheric circulation patterns to extreme temperature trends. Nature 522, 465–469. doi: 10.1038/nature14550
Hu, S., and Fedorov, A. V. (2017). The extreme El Niño of 2015–2016 and the end of global warming hiatus. Geophys. Res. Lett. 44, 3816–3824. doi: 10.1002/2017GL072908
Huang, J., Xie, Y., Guan, X., Li, D., and Ji, F. (2017). The dynamics of the warming hiatus over the Northern Hemisphere. Clim. Dyn. 48, 429–446. doi: 10.1007/s00382-016-3085-8
Imada, Y., Maeda, S., Watanabe, M., Shiogama, H., Mizuta, R., Ishii, M., et al. (2017). Recent enhanced seasonal temperature contrast in Japan from large ensemble high-resolution climate simulations. Atmosphere 8:57. doi: 10.3390/atmos8030057
Imada, Y., Tatebe, H., Watanabe, M., Ishii, M., and Kimoto, M. (2016). South Pacific influence on the termination of El Niño in 2014. Sci. Rep. 6:30341. doi: 10.1038/srep30341
Isobe, A. (1999). On the origin of the Tsushima Warm Current and its seasonality. Cont. Shelf Res. 19, 117–133. doi: 10.1016/S0278-4343(98)00065-X
Itoh, M., and Ohshima, K. I. (2000). Seasonal variations of water masses and sea level in the southwestern part of the Okhotsk Sea. J. Oceanogr. 56, 643–654. doi: 10.1023/A:1011121632160
Itoh, S., and Yasuda, I. (2010). Characteristics of mesoscale eddies in the Kuroshio–Oyashio Extension region detected from the distribution of the sea surface height anomaly. J. Phys. Oceanogr. 40, 1018–1034. doi: 10.1175/2009jpo4265.1
Jo, H.-S., Yeh, S.-W., and Kim, C.-H. (2013). A possible mechanism for the North Pacific regime shift in winter of 1998/1999. Geophys. Res. Lett. 40, 4380–4385. doi: 10.1002/grl.50798
Johnson, N. C., Xie, S., Kosaka, Y., and Li, X. (2018). Increasing occurrence of cold and warm extremes during the recent global warming slowdown. Nat. Commun. 9:1724. doi: 10.1038/s41467-018-04040-y
Kaeriyama, M., Seo, H., and Qin, Y. (2014). Effect of global warming on the life history and population dynamics of Japanese chum salmon. Fish. Sci. 80, 251–260. doi: 10.1007/s12562-013-0693-7
Kaga, T., Okamoto, S., and Yasuda, T. (2020). “Stock assessment and evaluation for winter spawning stock of Japanese flying squid (fiscal year 2019),” in Marine Fisheries Stock Assessment and Evaluation for Japanese Waters (fiscal year 2019/2020), ed. Fisheries Agency and Fisheries Research and Education Agency of Japan (in Japanese). Available online at: http://www.abchan.fra.go.jp/digests2019/details/201918.pdf (accessed June 17, 2020).
Kaga, T., Yamashita, N., Okamoto, S., and Hamatsu, T. (2018). “Stock assessment and evaluation for winter spawning stock of Japanese flying squid (fiscal year 2017),” in Marine Fisheries Stock Assessment and Evaluation for Japanese Waters (fiscal year 2017/2018), ed. Fisheries Agency and Fisheries Research and Education Agency, Japan, 626–666.
Kaga, T., Yamashita, N., Okamoto, S., and Hamatsu, T. (2019). “Stock assessment and evaluation for winter spawning stock of Japanese flying squid (fiscal year 2018),” in Marine Fisheries Stock Assessment and Evaluation for Japanese Waters (fiscal year 2018/2019), ed. Fisheries Agency and Fisheries Research and Education Agency, Japan, 652–697.
Kalnay, E. M., Kanamitsu, R., Kistler, W., Collins, D., Deaven, L., Gandin, M., et al. (1996). The NCEP/NCAR 40-year reanalysis project. Bull. Amer. Meteor. Soc 77, 437–471.
Kamimura, Y., Hayashi, A., Yukami, R., Isu, S., Furuichi, S., and Watanabe, R. (2020). “Stock assessment and evaluation for the Pacific stock of Japanese anchovy (fiscal year 2019),” in Marine Fisheries Stock Assessment and Evaluation for Japanese Waters (fiscal year 2019/2020), ed. Fisheries Agency and Fisheries Research and Education Agency of Japan (in Japanese). Available online at: http://www.abchan.fra.go.jp/digests2019/details/201924.pdf (accessed June 17, 2020).
Kamoey, A. (2015). The Japanese market for seafood. GLOBEFISH Research Programme, Vol. 117. Rome: FAO.
Kanamori, Y., Takasuka, A., Nishijima, S., and Okamura, H. (2019). Climate change shifts the spawning ground northward and extends the spawning period of chub mackerel in the western North Pacific. Mar. Ecol. Prog. Ser. 624, 155–166. doi: 10.3354/meps13037
Kaneko, H., Okunishi, T., Setou, T., Kuroda, H., Itoh, S., Koketsu, S., et al. (2019). Dual effects of reversed winter-spring temperatures on year-to-year variation in the recruitment of chub mackerel (Scomber japonicus). Fish. Oceanogr. 28, 212–227. doi: 10.1111/fog.12403
Kasugai, K., Torao, M., Kakizaki, H., Adachi, H., Shinhama, H., Ogasawara, Y., et al. (2012). Distribution and abundance of juvenile chum salmon (Oncorhynchus keta) in Nemuro Bay, eastern Hokkaido, Japan. N. Pac. Anadr. Fish. Comm. Tech. Rep. 8, 58–61.
Kawasaki, T. (1983). Why do some pelagic fishes have wide fluctuations in their numbers? FAO Fish. Rep. 291, 1065–1080.
Kidokoro, H., Goto, T., Nagasawa, T., Nishida, H., Akamine, T., and Sakurai, Y. (2010). Impact of a climate regime shift on the migration of Japanese flying squid (Todarodes pacificus) in the Sea of Japan. ICES J. Mar. Sci. 6, 1314–1322. doi: 10.1093/icesjms/fsq043
Kobayashi, S., Ota, Y., Harada, Y., Ebita, A., Moriya, M., Onoda, H., et al. (2015). The JRA-55 Reanalysis: general specifications and basic characteristics. J. Meteor. Soc. Japan 93, 5–48. doi: 10.2151/jmsj.2015-001
Kosaka, Y., and Xie, S. (2013). Recent global-warming hiatus tied to equatorial Pacific surface cooling. Nature 501, 403–407. doi: 10.1038/nature12534
Kosaka, Y., and Xie, S. (2016). The tropical Pacific as a key pacemaker of the variable rates of global warming. Nat. Geosci. 9, 669–673. doi: 10.1038/ngeo2770
Kurihara, Y., Sakurai, T., and Kuragano, T. (2006). Global daily sea surface temperature analysis using data from satellite microwave radiometer, satellite infrared radiometer and in-situ observations. Weather Service Bull. 73, s1–s18.
Kuroda, H., Setou, T., Kakehi, S., Ito, S., Taneda, T., Azumaya, T., et al. (2017a). Recent advances in Japanese fisheries science in the Kuroshio-Oyashio region through development of the FRA-ROMS ocean forecast system: Overview of the reproducibility of reanalysis products. Open J. Mar. Sci. 7, 62–90. doi: 10.4236/ojms.2017.71006
Kuroda, H., Takahashi, D., Mitsudera, H., Azumaya, T., and Setou, T. (2014). A preliminary study to understand the transport process for the eggs and larvae of Japanese Pacific walleye pollock Theragra chalcogramma using particle-tracking experiments based on a high-resolution ocean model. Fish. Sci. 80, 127–138. doi: 10.1007/s12562-014-0717-y
Kuroda, H., Toya, Y., Kakehi, S., and Setou, T. (2020). “Interdecadal variations of the Oyashio and extreme cold water events near the Japanese coast from the 1960s to the 2010s,” in Changing Asia-Pacific Marginal Seas, eds C.-T. A. Chen and X. Guo (Singapore: Springer), 217–244. doi: 10.1007/978-981-15-4886-4_13
Kuroda, H., Wagawa, T., Kakehi, S., Shimizu, Y., Kusaka, A., Okunishi, T., et al. (2017b). Long-term mean and seasonal variation of altimetry-derived Oyashio transport across the A-line off the southeastern coast of Hokkaido, Japan. Deep Sea Res. I 121, 95–109. doi: 10.1016/j.dsr.2016.12.006
Kuroda, H., Yamashita, N., Kaga, T., Azumaya, T., and Kuroda, H. (2013). A study of interannual variation in passive transport process of larvae of Japanese common squid, Todarodes pacificus, reproduced by numerical particle-tracking experiments based on FRA-ROMS. Ann. Rep. Res. Meet. Jap. Common Squid 18–19.
Kuroda, H., and Yokouchi, K. (2017). Interdecadal decrease in potential fishing areas for Pacific saury off the southeastern coast of Hokkaido. Japan. Fish. Oceanogr. 26, 439–454. doi: 10.1111/fog.12207
Li, C., Stevens, B., and Marotzke, J. (2015). Eurasian winter cooling in the warming hiatus of 1998–2012. Geophys. Res. Lett. 42, 8131–8139. doi: 10.1002/2015GL065327
Litzow, M. A., Ciannelli, L., Puerta, P., Wettstein, J. J., Rykaczewski, R. R., and Opiekun, M. (2019). Nonstationary environmental and community relationships in the North Pacific Ocean. Ecology 100:e02760. doi: 10.1002/ecy.2760
Litzow, M. A., Hunsicker, M. E., Bond, N. A., Burke, B. J., Cunningham, C. J., Gosselin, J. L., et al. (2020). The changing physical and ecological meanings of North Pacific Ocean climate indices. Proc. Natl. Acad. Sci. U.S.A. 117, 7665–7671. doi: 10.1073/pnas.1921266117
Makino, M. (2011). Fisheries Management in Japan: Its Institutional Features and Case Studies, Fish and Fisheries Series, Vol. 34. Netherlands: Springer.
Malick, M. J. (2020). Time-varying relationships between ocean conditions and sockeye salmon productivity. Fish Oceanogr. 29, 265–275. doi: 10.1111/fog.12469
Mantua, N. J., and Hare, S. R. (2002). The Pacific Decadal Oscillation. J. Oceanogr. 58, 35–44. doi: 10.1023/A:1015820616384
Matsumura, S., and Kosaka, Y. (2019). Arctic–Eurasian climate linkage induced by tropical ocean variability. Nat Commun. 10:3441. doi: 10.1038/s41467-019-11359-7
Mayama, H., and Ishida, Y. (2003). Japanese studies on the early ocean life of juvenile salmon. N. Pac. Anadr. Fish Comm. Bull. 3, 41–67.
McCusker, K., Fyfe, J., and Sigmond, M. (2016). Twenty-five winters of unexpected Eurasian cooling unlikely due to Arctic sea-ice loss. Nat. Geosci. 9, 838–842. doi: 10.1038/ngeo2820
Medhaug, I., Stolpe, M. B., Fischer, E. M., and Knutti, R. (2017). Reconciling controversies about the ‘global warming hiatus’. Nature 545, 41–47. doi: 10.1038/nature22315
Meehl, G. A., Hu, A., and Teng, H. (2016). Initialized decadal prediction for transition to positive phase of the Interdecadal Pacific Oscillation. Nat. comm. 7:11718. doi: 10.1038/ncomms11718
Meehl, G. A., Teng, H., and Arblaster, J. M. (2014). Climate model simulations of the observed early-2000s hiatus of global warming. Nature Clim. Change 4, s898–s902. doi: 10.1038/nclimate2357
Minobe, S. (2002). Interannual to interdecadal changes in the Bering Sea and concurrent 1998/99 changes over the North Pacific. Prog. Oceanogr. 55, 45–64. doi: 10.1016/S0079-6611(02)00069-1
Miyakoshi, Y., Saitoh, S., Matsuoka, A., Takada, H., Asami, H., Fujiwara, M., et al. (2007). Comparison of release timing of hatchery-reared juvenile chum salmon (Oncorhynchus keta) to spring coastal sea surface temperature during high and low survival period. GIS/Spatial Analy. Fish. Aquat. Sci. 3, 227–240.
Mori, M., Kosaka, Y., Watanabe, M., Nakamura, H., and Kimoto, M. (2019). A reconciled estimate of the influence of Arctic sea-ice loss on recent Eurasian cooling. Nat. Clim. Change 9, 123–129. doi: 10.1038/s41558-018-0379-3
Mori, M., Watanabe, M., Shiogama, H., Inoue, J., and Kimoto, M. (2014). Robust Arctic sea-ice influence on the frequent Eurasian cold winters in past decades. Nat. Geosci. 7, 869–873. doi: 10.1038/ngeo2277
Nagano, A., Yamashita, Y., Hasegawa, T., Ariyoshi, K., Matsumoto, H., and Shinohara, M. (2019). Characteristics of an atypical large-meander path of the Kuroshio current south of Japan formed in September 2017. Mar. Geophys. Res. 40, 525–539. doi: 10.1007/s11001-018-9372-5
Nagata, M., Miyakoshi, Y., Ando, D., Fujiwara, M., Sawada, M., Shimada, H., et al. (2007). Influence of coastal seawater temperature on the distribution and growth of juvenile chum salmon, with recommendations for altered release strategies. N. Pac. Anadr. Fish Comm. Bull. 4, 223–235.
Nagata, M., Miyakoshi, Y., Fujiwara, M., Kasugai, K., Ando, D., Torao, M., et al. (2016). Adapting Hokkaido hatchery strategies to regional ocean conditions can improve chum salmon survival and reduce variability. N. Pac. Anadr. Fish Comm. Bull. 6:7385.
Nakanowatari, T., and Ohshima, K. I. (2014). Coherent sea level variation in and around the Sea of Okhotsk. Prog. Oceanogr. 126, 58–70. doi: 10.1016/j.pocean.2014.05.009
Nakayama, S., Takasuka, A., Ichinokawa, M., and Okamura, H. (2018). Climate change and interspecific interactions drive species alternations between anchovy and sardine in the western North Pacific: Detection of causality by convergent cross mapping. Fish. Oceanogr. 27, 312–322. doi: 10.1111/fog.12254
Nishikawa, H. (2019). Relationship between recruitment of Japanese sardine (Sardinops melanostictus) and environment of larval habitat in the low-stock period (1995–2010). Fish Oceanogr. 28, 131–142. doi: 10.1111/fog.12397
Oozeki, Y., Ñiquen Carranza, M., Takasuka, A., Ayón Dejo, P., Kuroda, H., Tam Malagas, J., et al. (2019). Synchronous multi-species alternations between the northern Humboldt and Kuroshio Current systems. Deep Sea Res. II 159, 11–21. doi: 10.1016/j.dsr2.2018.11.018
Oozeki, Y., Takasuka, A., Kubota, H., and Barange, M. (2007). Characterizing spawning habitats of Japanese sardine (Sardinops melanostictus), Japanese anchovy (Engraulis japonicus), and Pacific round herring (Etrumeus teres) in the northwestern Pacific. CalCOFI Rep. 48, 191–203.
Pope, J. G. (1972). An investigation of the accuracy of virtual population analysis using cohort analysis. Int. Comm. Northwest Atl. Fish. Res. Bull. 9, 65–74.
Qiu, B. (2001). “Kuroshio and Oyashio Currents”, in Encyclopedia of Ocean Sciences. Cambridge, MA: Academic Press, 1413–1425.
Rosa, A. L., Isoda, Y., Uehara, K., and Aiki, T. (2007). Seasonal variations of water system distribution and flow patterns in the southern sea area of Hokkaido. Japan. J. Oceanogr. 63, 573–588. doi: 10.1007/s10872-007-0051-4
Rosa, A. L., Yamamoto, J., and Sakurai, Y. (2011). Effects of environmental variability on the spawning areas, catch, and recruitment of the Japanese common squid, Todarodes pacificus (Cephalopoda: Ommastrephidae), from the 1970s to the 2000s. ICES J. Mar. Sci. 68, 1114–1121. doi: 10.1093/icesjms/fsr037
Saito, T., and Fukuwaka, M. (2018). Status of Pacific salmon production in the North Pacific Ocean. Aquabiology 237, 319–329.
Saito, T., and Nagasawa, K. (2009). Regional synchrony in return rates of chum salmon (Oncorhynchus keta) in Japan in relation to coastal temperature and size at release. Fish. Res. 95, 14–27. doi: 10.1016/j.fishres.2008.07.004
Saito, T., Okamoto, Y., and Sasaki, K. (2015). Biological characteristics of chum salmon in Japan. Bull. Fish. Res. Agen. 39, 85–120.
Saito, T., Watanabe, K., Sasaki, K., and Takahashi, F. (2013). The dispersal pattern of juvenile chum salmon in the Pacific Ocean off the coast of Hokkadio. Japan. N. Pac. Anadr. Fish Comm. Tech. Rep. 9, 21–23.
Sakai, O., Yamashita, Y., Chimura, M., Ishino, M., Narimatsu, Y., and Sadayasu, K. (2020). “Stock assessment and evaluation for the Japanese Pacific stock of walleye pollock (fiscal year 2019),” in Marine Fisheries Stock Assessment and Evaluation for Japanese Waters (fiscal year 2019/2020), ed. Fisheries Agency and Fisheries Research and Education Agency of Japan (in Japanese). Available online at: http://www.abchan.fra.go.jp/digests2019/details/201912.pdf (accessed 17 June 2020).
Sakai, O., Yamashita, Y., Ishino, M., Chimura, M., and Yamashita, N. (2019). “Stock assessment and evaluation for the Japanese Pacific stock of walleye pollock (fiscal year 2018),” in Marine Fisheries Stock Assessment and Evaluation for Japanese Waters (fiscal year 2018/2019), ed. Fisheries Agency and Fisheries Research and Education Agency, Japan, 419–470.
Sakamoto, K., Tsujino, H., Nishikawa, S., Nakano, H., and Motoi, T. (2010). Dynamics of the Coastal Oyashio and its seasonal variation in a high-resolution western North Pacific Ocean model. J. Phys. Oceanogr. 40, 1283–1301. doi: 10.1175/2010jpo4307.1
Sakurai, Y. (2007). An overview of the Oyashio ecosystem. Deep Sea Res. II 54, 2526–2542. doi: 10.1016/j.dsr2.2007.02.007
Sakurai, Y., Kidokoro, H., Yamashita, N., Yamamoto, J., Uchikawa, K., and Takahara, H. (2013). “Chapter IX. Todarodes pacificus, Japanese common squid,” in Advances in Squid Biology, Ecology and Fisheries. Part II Oegopsid Squids, eds R. Rosa, G. Pierce, and R. O’Dor (New York, NY: Nova Science Publishers), 249–271.
Schmidt, A. E., Botsford, L. W., Eadie, J. M., Bradley, R. W., Di Lorenzo, E., and Jahncke, J. (2014). Non-stationary seabird responses reveal shifting ENSO dynamics in the northeast Pacific. Mar. Ecol. Prog. Ser. 499, 249–258. doi: 10.3354/meps10629
Seki, J. (2013). Development of hatchery techniques for releasing juvenile chum salmon in Japan. J. Fish. Tech. 6, 69–82.
Sugisaki, S., and Murakami, K. (2017). “Impacts of climate change on the marine resources of Japan,” in Climate Change Impacts on Fisheries and Aquaculture: A Global Analysis, eds B. F. Phillips and M. Pérez-Ramírez (Hoboken, NJ: Wiley), 121–218. doi: 10.1002/9781119154051.ch6
Takasuka, A., Kubota, H., and Oozeki, Y. (2008b). Spawning overlap of anchovy and sardine in the western North Pacific. Mar. Ecol. Prog. Ser. 366, 231–244. doi: 10.3354/meps07514
Takasuka, A., Oozeki, Y., and Aoki, I. (2007). Optimal growth temperature hypothesis: why do anchovy flourish and sardine collapse or vice versa under the same ocean regime? Can. J. Fish Aquat. Sci. 64, 768–776. doi: 10.1139/F07-052
Takasuka, A., Oozeki, Y., and Kubota, H. (2008a). Multi-species regime shifts reflected in spawning temperature optima of small pelagic fish in the western North Pacific. Mar. Ecol. Prog. Ser. 360, 211–217. doi: 10.3354/meps07407
Takasuka, A., Yoneda, M., and Oozeki, Y. (2019a). Density dependence in total egg production per spawner for marine fish. Fish Fish. 20, 125–137. doi: 10.1111/faf.12327
Takasuka, A., Yoneda, M., and Oozeki, Y. (2019b). Disentangling density-dependent effects on egg production and survival from egg to recruitment in fish. Fish Fish. 20, 870–887. doi: 10.1111/faf.12381
Takizawa, T. (1982). Characteristics of the Sôya Warm Current in the Okhotsk Sea. J. Oceanogr. Soc. Japan 38, 281–292. doi: 10.1007/BF02114532
Tian, Y., Ueno, Y., Suda, M., and Akamine, T. (2004). Decadal variability in the abundance of Pacific saury and its response to climatic/oceanic regime shifts in the northwestern subtropical Pacific during the last half century. J. Mar. Sys. 52, 235–257. doi: 10.1016/j.jmarsys.2004.04.004
Trenberth, K. E. (2015). Has there been a hiatus? Science 349, 691–692. doi: 10.1126/science.aac9225
Trenberth, K. E., and Fasullo, J. T. (2013). An apparent hiatus in global warming? Earth Future 1, 19–32. doi: 10.1002/2013ef000165
Tung, K., Chen, X., Zhou, J., and Li, K. (2019). Interdecadal variability in pan-Pacific and global SST, revisited. Clim. Dyn. 52, 2145–2157. doi: 10.1007/s00382-018-4240-1
Urabe, Y., and Maeda, S. (2014). The relationship between Japan’s recent temperature and decadal variability. SOLA 10, 176–179. doi: 10.2151/sola.2014-037
Urawa, S., Beacham, T. D., Fukuwaka, M., and Kaeriyama, M. (2018). “Ocean ecology of chum salmon,” in The Ocean Ecology of Pacific Salmon and Trout, ed. R. J. Beamish (Bethesda: American Fisheries Society), 161–317.
Usui, N., Wakamatsu, T., Tanaka, Y., Hirose, N., Toyoda, T., Nishikawa, S., et al. (2017). Four-dimensional variational ocean reanalysis: a 30-year high-resolution dataset in the western North Pacific (FORA-WNP30). J. Oceanogr. 73, 205–233. doi: 10.1007/s10872-016-0398-5
Watanabe, C., Shishidou, H., Funamoto, T., and Watanabe, Y. (2017). Marine fisheries resources around Japan that have entered a transitional period. Month. Kaiyo 49, 331–335.
Yan, X.-H., Boyer, T., Trenberth, K., Karl, T. R., Xie, S.-P., Nieves, V., et al. (2016). The global warming hiatus: Slowdown or redistribution? Earth Future 4, 472–482. doi: 10.1002/2016EF000417
Yasuda, I. (2003). Hydrographic structure and variability of the Kuroshio-Oyashio transition area. J. Oceanogr. 59, 389–402. doi: 10.1023/A:1025580313836
Yasunaka, S., and Hanawa, K. (2002). Regime shifts found in the northern hemisphere SST field. J. Meteor. Soc. Japan Ser. II 80, 119–135. doi: 10.2151/jmsj.80.119
Yatsu, A. (2019). Review of population dynamics and management of small pelagic fishes around the Japanese Archipelago. Fish. Sci. 85, 611–639. doi: 10.1007/s12562-019-01305-3
Yokota, T., Chimura, M., and Yamashita, N. (2019). “Stock assessment and evaluation for the herring in Hokkaido (fiscal year 2018),” in Marine Fisheries Stock Assessment and Evaluation for Japanese Waters (fiscal year 2018/2019), ed. Fisheries Agency and Fisheries Research and Education Agency, Japan, 833–845.
Keywords: unconventional regime, PDO, decadal trend, SST decrease, fisheries resources
Citation: Kuroda H, Saito T, Kaga T, Takasuka A, Kamimura Y, Furuichi S and Nakanowatari T (2020) Unconventional Sea Surface Temperature Regime Around Japan in the 2000s–2010s: Potential Influences on Major Fisheries Resources. Front. Mar. Sci. 7:574904. doi: 10.3389/fmars.2020.574904
Received: 22 June 2020; Accepted: 24 August 2020;
Published: 06 October 2020.
Edited by:
Jose Luis Iriarte, Austral University of Chile, ChileReviewed by:
Francisco Werner, National Marine Fisheries Service (NOAA), United StatesPaul David Spencer, National Marine Fisheries Service (NOAA), United States
Copyright © 2020 Kuroda, Saito, Kaga, Takasuka, Kamimura, Furuichi and Nakanowatari. This is an open-access article distributed under the terms of the Creative Commons Attribution License (CC BY). The use, distribution or reproduction in other forums is permitted, provided the original author(s) and the copyright owner(s) are credited and that the original publication in this journal is cited, in accordance with accepted academic practice. No use, distribution or reproduction is permitted which does not comply with these terms.
*Correspondence: Hiroshi Kuroda, kurocan@affrc.go.jp