Nanofragmentation of Expanded Polystyrene Under Simulated Environmental Weathering (Thermooxidative Degradation and Hydrodynamic Turbulence)
 Karin Mattsson
 Frida Björkroth
 Therese Karlsson
  Martin Hassellöv
- Department of Marine Sciences, Kristineberg Marine Research Station, University of Gothenburg, Fiskebäckskil, Sweden
Fragmentation of macroplastics into microplastics in the marine environment is probably one of the processes that have generated most drive for developing the microplastics research field. Thus, it is surprising that the level of scientific knowledge on the combinative effect of oxidative degradation and mechanical stressors on fragmentation is relatively limited. Furthermore, it has been hypothesized that plastic fragmentation continues into the nanoplastic size domains, but environmentally realistic studies are lacking. Here the effects of thermooxidative aging and hydrodynamic conditions relevant for the shoreline environment on the fragmentation of expanded polystyrene (EPS) were tested in laboratory simulations. The pre-degraded EPS was cut into pieces and subjected to mechanical, hydrodynamic simulations during four-day stirring experiments. Subsamples were filtered and subsequently analyzed with light microscopy with automated image analysis particle size distribution determinations, polymer identification with Raman spectroscopy, Scanning Electron Microscopy (SEM) with automated image analysis particle size distribution. The nanoplastic size fraction was measured using nanoparticle tracking analysis. In addition, the degree of polymer oxidation was spectroscopically characterized with Fourier transform infrared (FTIR) spectroscopy. The results illustrate that fragmentation of the mesoplastic objects is observed already after 2 days, but that is more distinct after 4 days, with higher abundances for the smaller size fractions, which imply more release of smaller sizes or fragmentation in several steps. For the nanoplastic fraction, day four shows a higher abundance of released or fragmented particles than day two. The conclusions are that nanofragmentation is an important and understudied process and that standardized test protocols for both thermooxidative degradation and mechanical treatments mimicking realistic environmental conditions are needed. Further testing of the most common macro- and mesoplastic materials to assess the rates and fluxes of fragmenting particles to micro- and nanoplastic fractions should be conducted.
Introduction
Plastic debris in a large variety of sizes can be found in all ecosystems around the world. Plastic particles between 1 and 10 mm are referred to as mesoplastics, while plastic particles between 1 and 1,000 μm are called microplastics, and nanoplastics are plastic particles with a size between 1 and 1,000 nm (Hartmann et al., 2019). Microplastics have been reported to compose the majority of the numerical abundance of the marine debris (Browne et al., 2010; Hidalgo-Ruz et al., 2012; Goldstein et al., 2013). Microplastics are present in the marine environments as primary particles or as secondary particles. Primary particles are plastic particles manufactured in the micrometer size range, such as virgin plastic pellets or powders, whereas secondary particles are fragments from larger ones. Most microplastic particles in the marine environment are secondary particles, i.e., fragments from larger pieces (Brandon et al., 2016; Song et al., 2017) with a higher abundance for the lower size classes (Enders et al., 2015; Ter Halle et al., 2016; Primpke et al., 2017). Moreover, microplastics collected from the environment and analyzed with Scanning Electron Microscopy (SEM) or spectroscopic techniques such as Fourier transform infrared (FTIR) Spectroscopy show that particles can be in an advanced state of weathering (Cooper and Corcoran, 2010).
Plastic particles in the environment are subjected to degradation, a chemically, physically, or biologically introduced process, and one consequence is the creation of smaller particles (Andrady, 2011). One important degradation process for floating plastic particles in the ocean, such as expanded polystyrene (EPS), is photooxidative degradation initiated by UV-radiation (Gewert et al., 2015; Weinstein et al., 2016). The PS absorbs light via the aromatic phenyl groups, and the energy is transferred to the nearest C-H bond, where it causes a bond braking, and free radicals are formed. The final products of the polymer radical reaction are the formation of ketones and olefins, while the main products of PS are styrene monomers since end-chain scission is predominant. However, oligomers of styrene can also be formed. The same process occurs when plastic particles are exposed to thermooxidation except that the bond-breaking process is catalyzed by heat instead of light. Mechanical fragmentation occurs when the particles are subject to mechanical stress from waves, rocks, sand, and other forces or substances that the polymer can interact with in the ocean. Biological degradation is when microorganisms such as bacteria and fungi degrade the plastics through extracellular or intracellular enzymes and use the plastics as a substrate for growth. However, biodegradation is complex and not fully understood (Ho et al., 2018).
UV-radiation causes degradation of PS particles and creates particles in the nanometer size range (Lambert and Wagner, 2016a,b) with increasing particle concentration with decreasing size (Lambert and Wagner, 2016b). However, when in the marine environment, this degradation process is slow compared to in air (Kalogerakis et al., 2017; Cai et al., 2018; Julienne et al., 2019) or in pure water (Cai et al., 2018). Moreover, the fragmentation increases for particles when exposed to water compared to in the air (Julienne et al., 2019). Comparing onshore and nearshore conditions show more fragmentation when exposed to nearshore conditions (Kalogerakis et al., 2017). The degree of degradation increases over time (Lambert and Wagner, 2016a; Cai et al., 2018) as well as the creation of cracks and flakes on the particle surface (Weinstein et al., 2016; Cai et al., 2018; Julienne et al., 2019). Extremely ruff mechanical forces, e.g., the force from a kitchen blender has also been shown to create PS nanoplastic particles (Ekvall et al., 2019). More environmentally relevant mechanical forces, e.g., the force from a rotating mixer filled with water and sediment mimicking a breaking wave in the swash zone, shows that EPS particles fragment linear while PS pellets fragmented in a quad dependent size over time (Efimova et al., 2018). There is also a correlation between the sediment particles’ size and the fragmentation pattern, where larger sediment particles lead to more fragmentation (Chubarenko et al., 2020). However, both swash zone studies only considered particle sizes down to 0.5 mm (Efimova et al., 2018; Chubarenko et al., 2020). In another study, plastic pellets have been exposed during 3 years to conditions mimicking plastics exposure on beaches, benthic environments, and floating on the sea surface. They report a non-linear aging pattern for the degradation over time when analyzing the chemical bonds with FTIR (Brandon et al., 2016). However, in general, during the first 13 months, the particles mimicking floating plastics showed more degradation than the other treatments (Brandon et al., 2016), while the combination of UV-radiation with mechanical abrasion shows that, in general, the more prolonged exposure to UV-radiation creates more fragments and that the number of fragmented particles increased with decreasing particle size (Song et al., 2017). Biodegradation also occurs in the environment (Zettler et al., 2013), and for PS, it occurs in natural environments but at a prolonged rate (Ho et al., 2018). Moreover, terrestrial insects from polar environments can feed on EPS and ingest small fragments (Bergami et al., 2020).
The weathering of plastics generates smaller particles; however, how these particles fragment and the time scales for weathering plastic in the marine environment is not well studied or known. Moreover, the parameters that affect the fragmentation pattern are not known or the links between the polymer’s exposure, nature, and its manufacturing process. We analyze the size distribution of weathering EPS particles under environmentally relevant conditions by using pre-degraded EPS by thermooxidation combined with hydrodynamic turbulence. EPS was chosen since it is commonly found in the environment (Hidalgo-Ruz et al., 2012), and prone to fragment (Efimova et al., 2018).
Materials and Methods
Particle Preparation and Thermal Oxidation Analysis
The polystyrene plastics originated from a conventional EPS packaging foam from an insulation box. The EPS was degraded in an oven at 80°C for 20 days. The thermal oxidation of EPS was verified by FTIR using the Thermo Scientific Nicolet iN10 infrared microscope. Three pieces were cut from the surface of the degraded EPS, and from the surface of the original, undegraded EPS and the absorption spectrum were recorded. All spectra were baseline corrected. The absorption spectrum of the degraded EPS was normalized to the peak at 3,028 cm–1, which corresponds to the C-H stretch in the average spectra of the undegraded spectra. The average area of the OH peaks (3,741–3,134 cm–1) for both the undegraded and degraded EPS spectrum was integrated, and the area was compared. Thereafter, the degraded EPS was cut by hand into pieces sized 5 × 5 mm. The thickness of the EPS varied between 1–2 mm and 20 pieces of EPS weighted 0.028 ± 0.0024 g. All plastics were stored in the refrigerator to decrease unwanted further degradation.
Fragmentation
To determine the time needed to create a suitable amount of fragmented particles, four fragmentation experiments with different fragmentation times were performed, 1, 2, 4, and 9.5 days. After evaluating the results, 2 and 4 days were concluded to be sufficient.
Initially, five 1 L-beakers were filled with 750 mL Milli-Q water together with 20 pieces of EPS. Two beakers were kept without plastics, serving as blank controls. The beakers containing plastic were placed in the flocculator, creating circle motion turbulence by paddles spinning at 250 rpm. The speed of 250 rpm was calculated to the Kolmogorov dissipation length scale to about 0.09 mm by using the following equation
where η is the Komogorov dissipation length, ν is the viscosity of the fluid, and ε is the average rate of dissipation energy per mass. The energy dissipation rate (ε) was estimated to be 0.019 mm, calculated from the ε = 0.023 mm at 300 rpm (Sulc et al., 2015), and with Milli-Q water’s viscosity 1.004 × 10⁻⁶ m2/s. All beakers were covered with aluminum foil, and the open side of the flocculator was wrapped in plastic to prevent contamination. The two beakers without plastics were placed beside the flocculator, also covered in aluminum foil and plastic. After 2 days of fragmentation, the paddles were removed from the beakers and rinsed with 50 mL Milli-Q water to release any particles stuck on their surfaces. For the blanks, 50 mL of Milli-Q water was added. All beakers were then covered in aluminum foil and placed in the refrigerator until filtering. Next, the fragmentation was repeated, but the experiment lasted for 4 days. Finally, the fragmentation was repeated for both times, with the control beakers placed inside the flocculator.
Filtration
Initially, the filter set-up had three filters, 1000, 300, and 10 μm. The 1,000 μm metal sieve was chosen to collect the 5 × 5 mm start pieces. The 300 μm mesh was chosen since it is a common size for microplastic sampling, and as an addition, 10 μm polycarbonate filters (Millipore Isopore 1 μm) were used. The remaining water with the smaller sized particles was kept for further analysis with Nanoparticle Tracking Analysis (NTA). However, when the experiment was repeated, two filters were added to the set-up; 1 μm and 200 nm. For the 1 μm, polycarbonate filters (Millipore Isopore 1 μm) were used where half of the number of filters were coated with a 100 nm thick aluminum layer. The 200 nm filters were made of aluminum oxide (Whatman Anopore).
Particle Characterization
Photo Characterization
Photo characterization was used to characterize the formed microplastics’ size distributions on the 300 and 10 μm filters. The photo characterization was carried out with a Lecia MZ16 A Stereomicroscope and the software ImageJ (version 1.51j8). All photos were analyzed for each sample, but some were excluded due to blurriness or lack of particles. The Petri dishes containing the samples were put on a dark blue background, and 5–7 photos were taken under the stereomicroscope. The dark background made it easier to distinguish the white microplastics. Firstly, the contrast was enhanced by allowing 0.30% of the pixels to become saturated. Secondly, the color threshold was adjusted, so just the particles were selected. Lastly, the function Analyze Particles was used to measure the area, the major and minor axis, and the maximum Feret diameter of each microplastic. The algorithm used replaced the particle’s area with the best fitting two-dimensional ellipse, and the major and minor axis was then measured. Hence the ellipse had the same area as the area measured. The microplastics in contact with the edges of the photo were excluded. The measured microplastics’ mask was also controlled to ensure the background and light flicker was fully excluded. The replicates’ microplastics were summed for EPS and the blanks each for the 2 and 4-day fragmentation to get enough data in the size bins to create number-based size distributions. For the 300 and 10 μm samples, binwidth 300 and 50 μm were used respectively.
Raman Spectroscopy
The pre-degraded EPS pieces, the particles collected in the 1,000 μm sieve, and on all filters were analyzed with Raman spectroscopy on a WiTec alpha300 R microscope equipped with a 532 nm laser. First, a confocal mosaic image was obtained, and then a Raman spectrum from the particles was recorded. Laser power depending on the size of the particles since different objectives (5x, 20x, and 100x) were used, and 50 accumulations of spectra with an integration time of 0.5 s were recorded. These spectra were baseline corrected and compared to identify any spectral changes. On the 1 μm filter, many particles were analyzed to distinguish between EPS particles and contamination.
Scanning Electron Microscopy
The EPS particles’ size present on 1 μm filters was imaged in SEM (Zeiss Sigma VP) in VP mode (30 Pa) using the BSD detector with a magnification of 3.5 kX and EHT 15 kV. With the confocal mosaic image obtained from the Raman microscope and the Raman spectra from the particles, a brightness-contrast threshold was defined, so only EPS particles were analyzed with SEM (Figure 1). The software SmartPI was used to automatically image a mosaic of a defined area of the filter. The size of all particles within the area was measured according to the defined brightness-contrast threshold. For the different fragmentation times, 2 and 4 days, a total of 18,287 and 16,989 EPS particles were measured, respectively.
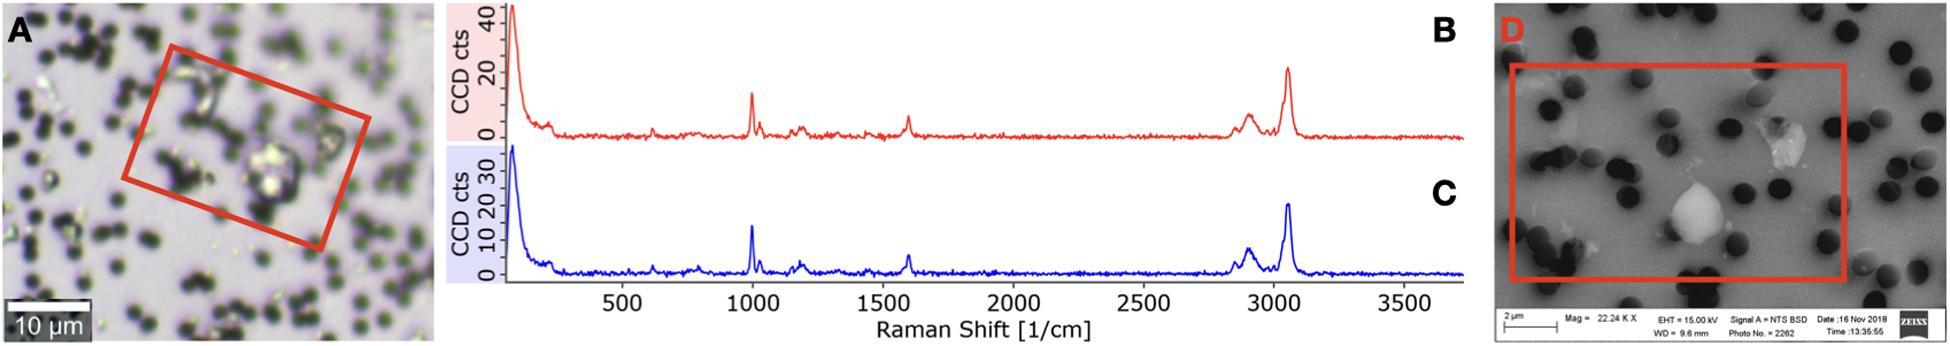
Figure 1. Raman-SEM identification for 1 μm membranes. (A) A confocal image of EPS particles obtained with the Raman microscope, (B) spectrum from the particles in a (C) spectrum from the exposed EPS pieces. (D) SEM image of the same particles.
The 200 nm filters were also analyzed with SEM. However, the fragmented particles on these filters were fluffy, and with blurry edges, it was not possible to measure the particles’ exact size, so these filters were neglected.
Nanoparticle Tracking Analysis
The instrument Malvern NanoSight LM10 was used for preforming NTA, measuring diffusion coefficients and hydrodynamic diameter of particles in the size range 10–1,000 nm. It is important to note that this instrument cannot distinguish what type of particles it is measuring. Three sub-samples from the collected water were analyzed. Every sub-sample was injected into the laser module chamber, and five videos were recorded over 1 min each, with a 5-s delay in between. After every recording, the sample temperature was noted. In between every sub-sample, the chamber was rinsed with Milli-Q water. The chamber was taken apart and cleaned with a 10% Hellmanex in Milli-Q solution, rinsed with Milli-Q water and dried with a 50% EtOH in Milli-Q solution and compressed air. After that, the software NanoSight (version 2.3) performed a summary analysis of the video batch. An excel macro was used to calculate the concentration in the size bins (binwidth 5 nm). The results from each 1 min recording were manually checked, and outliers were excluded. The EPS concentrations and the blanks were summed each for the 2 and 4-day fragmentations, and concentration based size distributions were computed.
Contamination
To investigate the contamination from the corrosion of the flocculator and the filter set-up, a test with blank beakers inside vs. outside the flocculator was performed. Three beakers were put in the flocculator, and three beakers were put on the outside, all containing 750 mL Milli-Q water. All beakers were covered with aluminum foil and plastic. After 4 days, the samples were filtered through 1,000, 300, and 10 μm and analyzed.
To exclude any contamination from the Milli-Q water produced by the Millipore Milli-Q Reference Water Purification System, the concentration of nanoparticles in the Milli-Q water was measured with NTA.
Results
Contamination
The contamination from the flocculator and/or the filter set-up was black in color for both treatments. As the black fragments could easily be excluded in the photo characterization performed on the 10 μm filters, the contamination was not quantified.
Particles that were not plastics on the 1 μm filters were identified with Raman spectroscopy and SEM-EDX, e.g., iron-rich particles that most likely originated from one of the holders used for the filtration set-up. However, this was not considered to interfere with the results since the plastic particles on these filters were first sorted through polymer identification with Raman spectroscopy and excluded in the SEM automated analysis with a brightness-contrast threshold.
The concentrations of nanoparticles were similar for both treatments 28.74 ± 16.63 ×10⁶ and 29.19 ± 13.86 ×10⁶ particles/mL for samples inside the flocculator vs. samples outside the flocculator. This concluded that the experiment set-up did not add any nano-sized particles to the samples.
The concentration of nanoparticles in Milli-Q water was 0 particles/mL. It was concluded that the corrosion from the flocculator and the filter-set up did not contaminate the samples with the contamination that could not be excluded in the sample analysis.
Thermal Aging
The absorption peaks found in the spectra for the undegraded EPS at 3,150–3,000 and 3,000–2,800 cm–1 correspond to the phenyl group and C-H backbone stretch, respectively (Figure 2A). These peaks can also be found in the spectra for the degraded EPS (Figure 2B). Additionally, the degraded EPS show absorption around 3,570–3,200 cm–1 corresponding to O-H stretch. In the wavelengths 2,000–400 cm–1 there is much disturbance in both spectra due to poorly calibrated measurements, but this range is not crucial for estimating degradation state. The hydroxyl bond’s integrated area at 3,741–3,134 cm–1 for the undegraded EPS was 7.72 area units, whereas, for the degraded EPS, the area was 16.71. This verifies that the degraded EPS was more thermal aged than the undegraded EPS (Andrady, 2017).
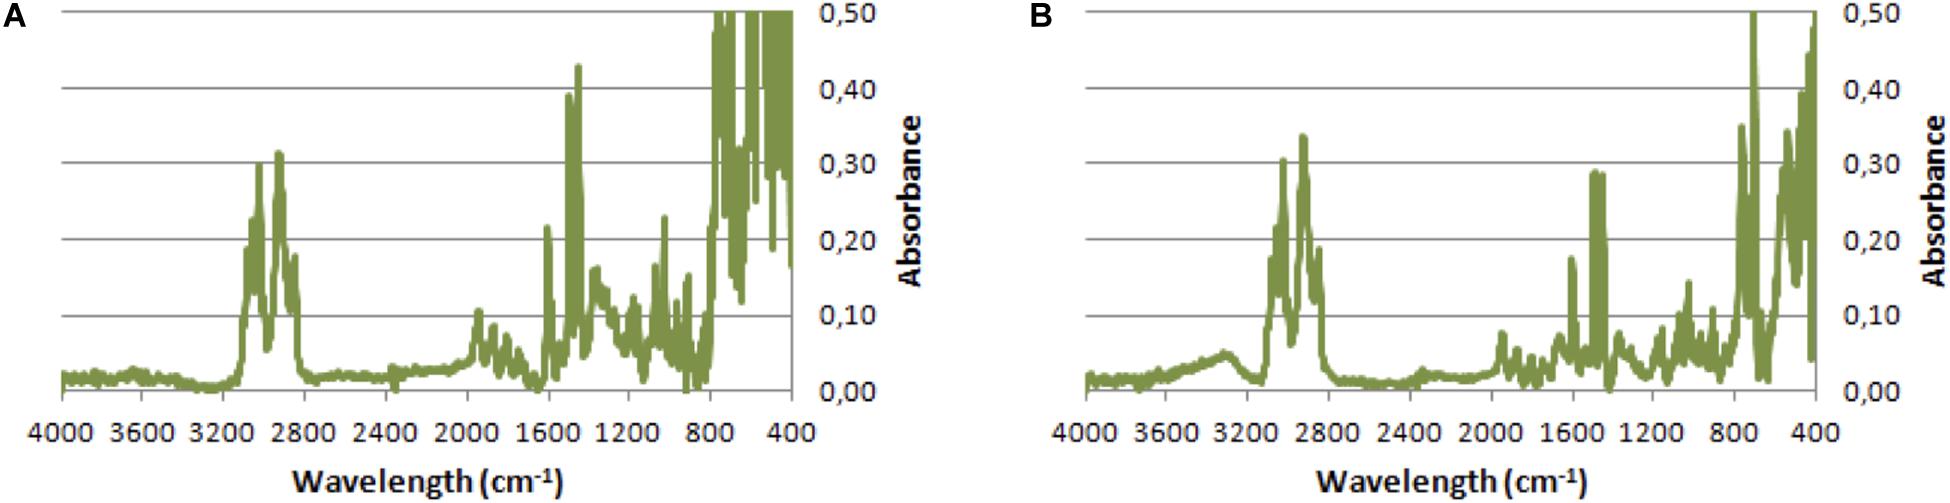
Figure 2. FTIR Absorption spectrum for (A) undegraded and (B) degraded EPS.
Fragmentation
All of the 5 × 5 mm start pieces of EPS were, as expected, collected in the 1,000 μm sieve, and no particles were found in the blanks. On the 300 μm filter, fragments of EPS were collected. After 2 and 4 days of fragmentation, 48 and 45 fragments of microplastics were found, respectively. The particles’ size distribution was similar for both times; however, there were more particles of the smaller sizes in the 4 days of fragmentation, 450–750 μm, nine vs. four (Figures 3A,B). There were no particles found in the blank samples. More particles were collected on the 10 μm filters, as expected, compared to the 300 μm. The particles’ size distribution was similar for both times, with more particles in the smaller size range. However, after 4 days of fragmentation, more particles were present 746 compared to 312 on the 2 days of fragmentation, an increase of 140% (Figures 4A,B). There were only 7 and 6 microplastics collected in the blanks after 2 and 4 days of fragmentation, respectively (Figures 4C,D). These particles were carried over from the filtration equipment and identified as EPS. The size distribution of the particles on the 1 μm filters was similar for both 2 and 4 days of fragmentation with a higher numerical amount of particles in the smaller size range, where 51% respectively, 49% of the particles were below 3.75 μm (Figures 5A,B). Most particles were identified between 2.25 and 4.25 μm, 62%, respectively, 61%. From the water samples, the concentration of EPS particles increased by 114% from 34.35 ± 10.70 × 10⁶ to 73.49 ± 23.36 × 10⁶ particles/mL (Figures 6A,B). The blank samples’ concentration was 15.07 ± 9.51 × 10⁶ and 9.27 ± 5.92 × 10⁶ particles/mL, respectively, a decrease of 38% (Figures 6C,D).
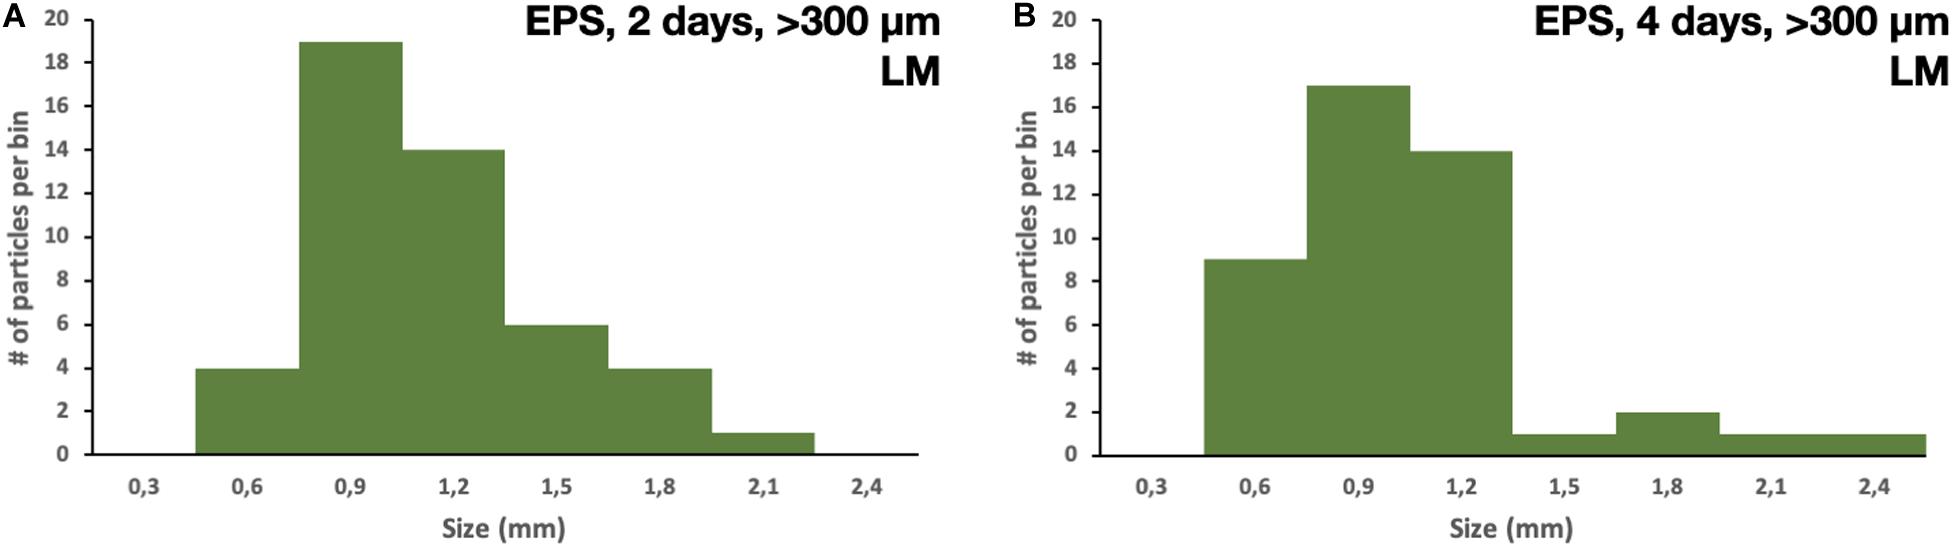
Figure 3. Size distribution of particles collected on the 300 μm filter after (A) 2 days of fragmentation and (B) 4 days of fragmentation.
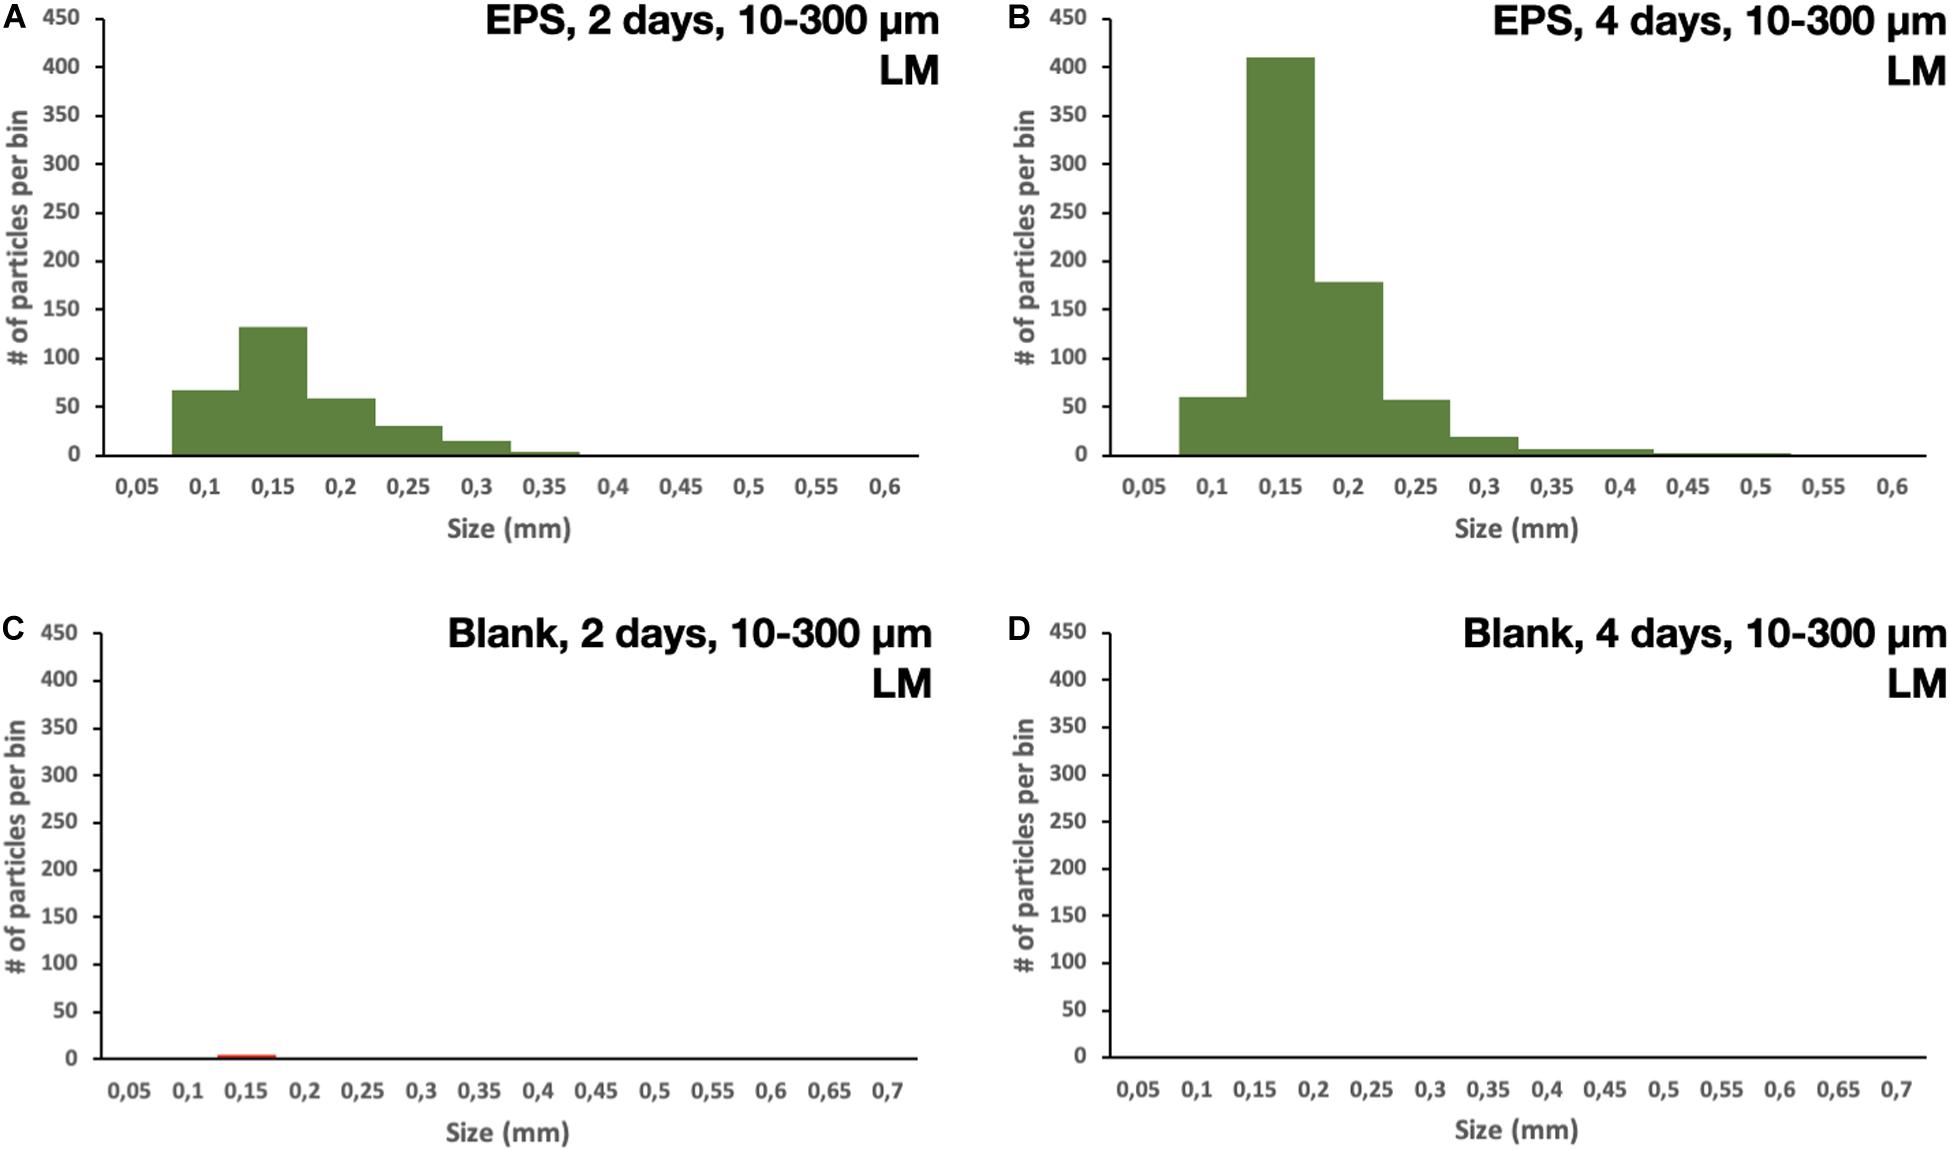
Figure 4. Size distribution of particles collected on the 10 μm filter after (A) 2 days of fragmentation, (B) 4 days of fragmentation, (C) blank samples after 2 days of fragmentation, and (D) blank samples after 4 days of fragmentation.
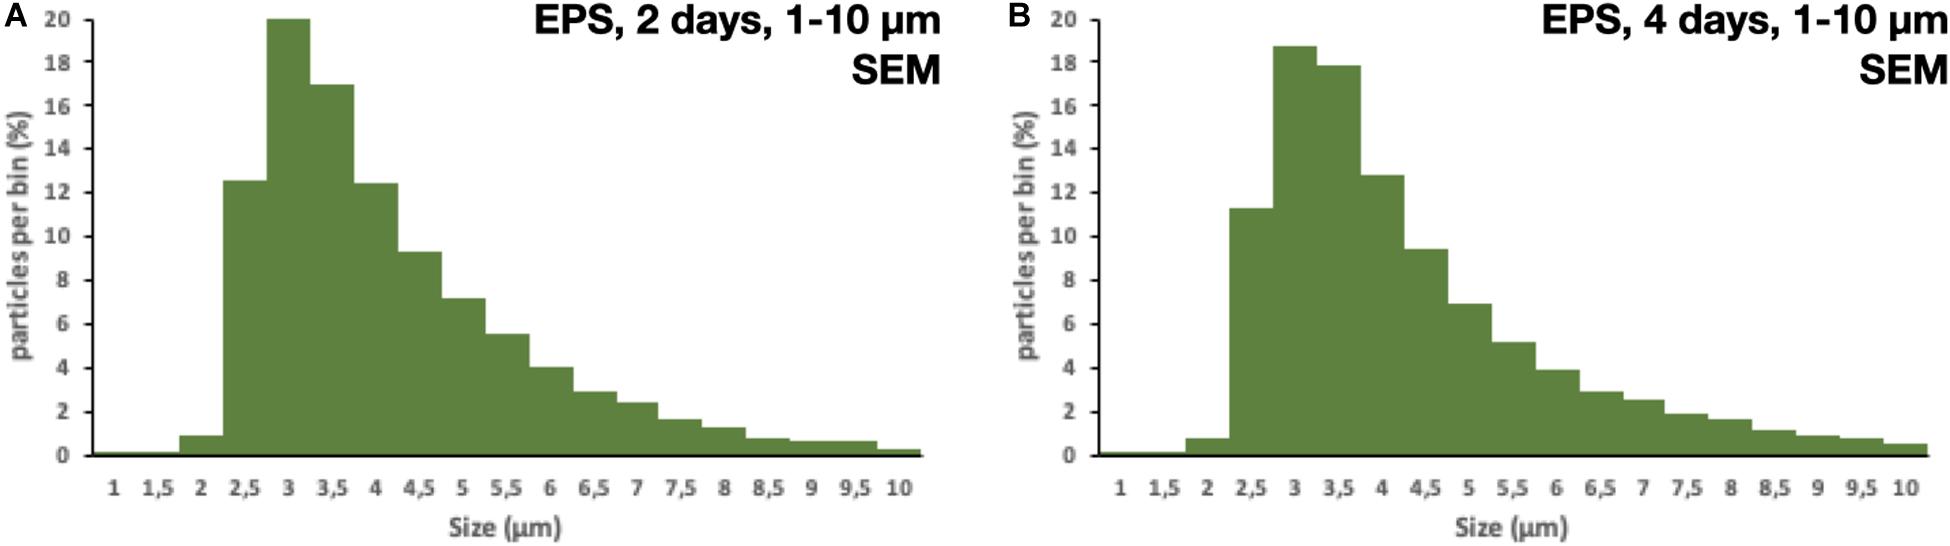
Figure 5. Size distribution of particles collected on the 1 μm filter after (A) 2 days of fragmentation and (B) 4 days of fragmentation.
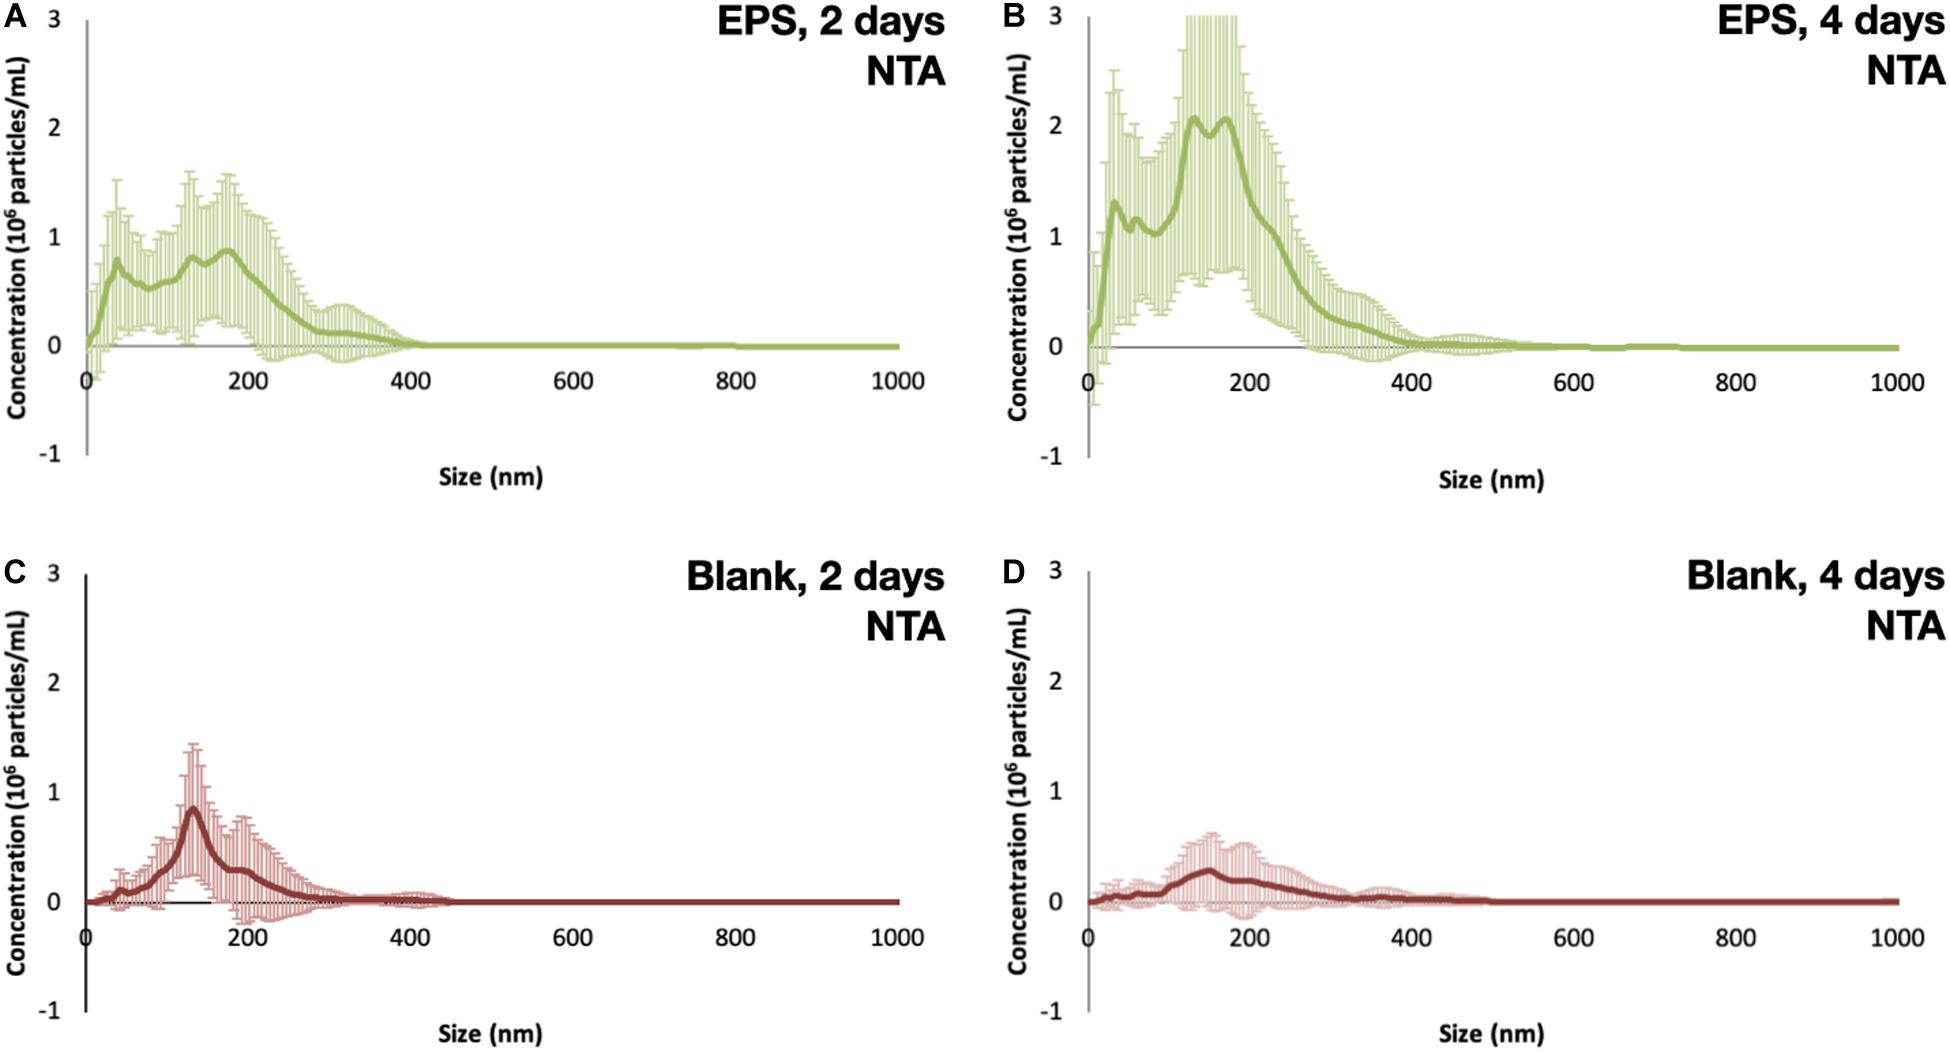
Figure 6. Size distribution of particles measured with NTA after (A) 2 days of fragmentation, (B) 4 days of fragmentation, (C) blank samples after 2 days of fragmentation, and (D) blank samples after 4 days of fragmentation.
Discussion
The degree of weathering can be determined with FTIR and SEM can be used to study the surface structure of the particles and identifying surface changes such as cracks or bacteria growth. We used FTIR to determine the thermal aging degree of the pre-degraded EPS pieces and show that the particles aged when exposed to heat. The size distribution shows a higher abundance for the smaller sized particles; however, for the particles with a size close to the pore size, the number of identified particles was low. On all filters, we measured the particles max ferret value, the longest distance between two parallel tangents on opposite sides of a randomly oriented particle measured for eight different angles. Most of the larger particles had an irregular shape, while for the smaller particles, the shape was more similar to a sphere or elliptical. The irregular sized particles can have one dimension smaller than the pore size and therefore passing through a filter. However, the impact from the particles with a size close to the pore size can be seen in Figure 7, where the last measured point on each membrane, i.e., the bin closest to the pore size have a drop in particle amount. For NTA, the hydrodynamic diameter was measured, the diameter of a sphere with the same hydrodynamic behavior as the particle being measured. The size limitations of NTA can be seen in Figures 6, 7, where there are only a few particles measured in the smaller sizes. The NTA data also show a size-dependent fragmentation over time (Figure 6).
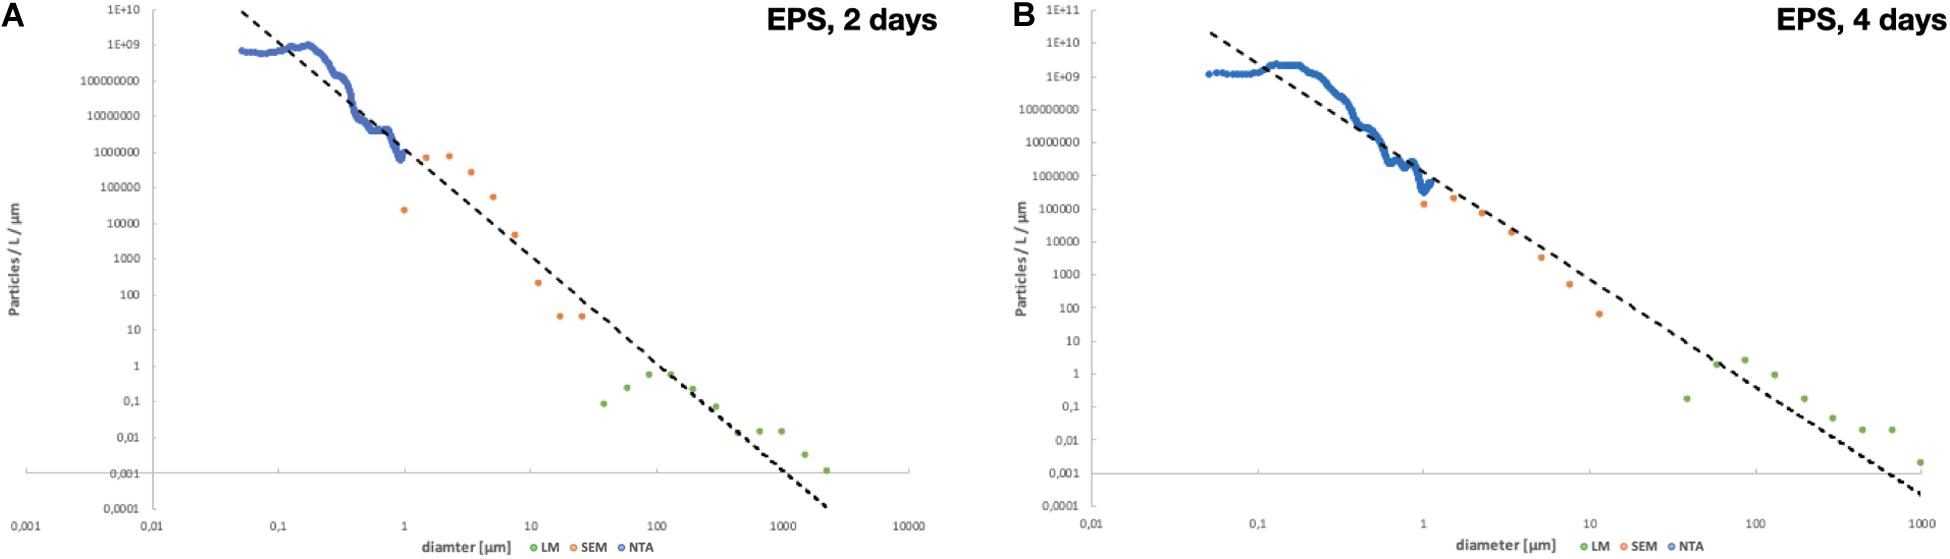
Figure 7. Total size distribution per particles/L/μm after (A) 2 days of fragmentation and (B) 4 days of fragmentation.
Even in a controlled laboratory study, contamination from the surroundings poses a threat to interfere with the results. For larger particles, visible through a light microscope, this does not have to interfere with the results. The contamination can be separated from the studied particles by comparing color, size, shape, and other ocular properties. For smaller particles, less than 10 μm, it is more challenging to distinguish between particles and contamination. However, spectroscopic techniques such as Raman or FTIR, which identifies the polymer can be used. For particles in solutions, light scattering techniques such as NTA and Dynamic light scattering (DLS) is widely used which measure the size distribution and concentration of the particles in the solution, but without distinguishing between different types of particles, i.e., the measured concentration can be higher than the actual value. In our experiment, contamination could easily be distinguished from EPS on the 10 μm filter by ocular inspection since the contamination had a different color then what the EPS particles had, black vs. white. The chemical fingerprint of the EPS particles was also confirmed with Raman spectroscopy. On the 1 μm filter, we first identified the EPS particles with Raman spectroscopy and, together with the confocal image, a threshold in which only registered EPS particles were applied in the SEM to measure the size distribution of the particles on these filters. The nano-sized particles were measured with NTA, and the concentration was compared with blank samples as well as with pure Milli-Q water.
Most studies have only considered one type of degradation; UV (Brandon et al., 2016; Lambert and Wagner, 2016a,b; Cai et al., 2018; Julienne et al., 2019) or mechanical forces (Kalogerakis et al., 2017; Efimova et al., 2018; Ekvall et al., 2019; Chubarenko et al., 2020), and only two has considered a combination of UV and mechanical forces (Weinstein et al., 2016; Song et al., 2017). One has used conditions that are not relevant for the environment (Ekvall et al., 2019); some focus on the characterization of the degree of degradation, and some investigate the fragmentation pattern; however, most studies only consider a small size range (Lambert and Wagner, 2016a,b; Efimova et al., 2018; Ekvall et al., 2019; Julienne et al., 2019; Chubarenko et al., 2020). We have analyzed the thermooxidation, and when exposed to hydrodynamic turbulence. Moreover, the fragmentation pattern was measured for particles larger than 30 nm.
Future developments of more environmentally realistic hydrodynamic reactors would be desirable, that for example, mimics the beach zone under different hydrodynamic and geomorphological conditions.
The insights from these simple simulations of hydrodynamic mixing that can occur in the nearshore environment such as a beach splash zone, illustrate the importance that macro plastic litter such as EPS, is promptly being remediated from the marine environment, e.g., by beach cleaning efforts, in order to minimize the oxidation-fragmentation reaction chain, that both may inflict more ecosystem impact, but also render the plastic matters virtually impossible to clean-up.
Conclusion
For both 2 and 4 days of fragmentation, there was a clear fragmentation pattern with more fragments in the smaller size classes. When comparing what happens over time, the size distribution is similar for both 2 and 4 days of fragmentation for all size classes (Figures 3–6). However, the number of particles in size range between 0.025 and 2.7 mm was higher, 993 particles/L for 4 days compared to 446 particles/L after 2 days.
The conclusions are that nanofragmentation is an important and understudied process and that standardized test protocols for both weathering and mechanical treatments mimicking realistic environmental conditions are needed and then further testing of the most common macroplastic materials to assess the rates and fluxes of fragmenting particles to micro- and nanoplastic fractions should be conducted.
Data Availability Statement
The raw data supporting the conclusions of this article will be made available by the authors, without undue reservation.
Author Contributions
KM and FB performed the experiment. KM, FB, and MH analyzed the results and wrote the manuscript. All authors designed the experiment.
Funding
This research was supported by the Swedish Research Council FORMAS Project Grant #2019-01016, “Nanofragmentation of weathered plastics in marine environment – increased toxicity or biodegradability.”
Conflict of Interest
The authors declare that the research was conducted in the absence of any commercial or financial relationships that could be construed as a potential conflict of interest.
References
Andrady, A. L. (2011). Microplastics in the marine environment. Mar. Pollut. Bull. 62, 1596–1605. doi: 10.1016/j.marpolbul.2011.05.030
Andrady, A. L. (2017). The plastic in microplastics: a review. Mar. Pollut. Bull. 119, 12–22. doi: 10.1016/j.marpolbul.2017.01.082
Bergami, E., Rota, E., Caruso, T., Birarda, G., Vaccari, L., and Corsi, L. (2020). Plastics everywhere: first evidence of polystyrene fragments inside the common Antarctic collembolan Cryptopygus antarcticus. Biol. Lett. 16:20200093. doi: 10.1098/rsbl.2020.0093
Brandon, J., Goldstein, M., and Ohman, M. D. (2016). Long-term aging and degradation of microplastic particles: comparing in situ oceanic and experimental weathering patterns. Mar. Pollut. Bull. 110, 299–308. doi: 10.1016/j.marpolbul.2016.06.048
Browne, M. A., Galloway, T. S., and Thompson, R. C. (2010). Spatial patterns of plastic debris along Estuarine shorelines. Environ. Sci. Technol. 44, 3404–3409. doi: 10.1021/es903784e
Cai, L., Wang, J., Peng, J., Wu, Z., and Tan, X. (2018). Observation of the degradation of three types of plastic pellets exposed to UV irradiation in three different environments. Sci. Total Environ. 628-629, 740–747. doi: 10.1016/j.scitotenv.2018.02.079
Chubarenko, I., Efimova, I., Bagaeva, M., Bagaev, A., and Isachenko, I. (2020). On mechanical fragmentation of single-use plastics in the sea swash zone with different types of bottom sediments: insights from laboratory experiments. Mar. Pollut Bull. 150:110726. doi: 10.1016/j.marpolbul.2019.110726
Cooper, D. A., and Corcoran, P. L. (2010). Effects of mechanical and chemical processes on the degradation of plastic beach debris on the island of Kauai. Hawaii. Mar. Pollut. Bull. 60, 650–654. doi: 10.1016/j.marpolbul.2009.12.026
Efimova, I., Bagaeva, M., Bagaev, A., Kileso, A., and Chubarenko, I. P. (2018). Secondary microplastics generation in the sea swash zone with coarse bottom sediments: laboratory experiments. Front. Mar. Sci. 5:313. doi: 10.3389/fmars.2018.00313
Ekvall, M. T., Lundqvist, M., Kelpsiene, E., Šileikis, E., Gunnarsson, S. B., Cedervall, T., et al. (2019). Nanoplastics formed during the mechanical breakdown of daily-use polystyrene products. Nanoscale Adv. 1, 1055–1061. doi: 10.1039/c8na00210j
Enders, K., Lenz, R., Stedmon, C. A., and Nielsen, T. G. (2015). Abundance, size and polymer composition of marine microplastics >/=10mum in the Atlantic Ocean and their modelled vertical distribution. Mar. Pollut Bull. 100, 70–81. doi: 10.1016/j.marpolbul.2015.09.027
Gewert, B., Plassmann, M. M., and MacLeod, M. (2015). Pathways for degradation of plastic polymers floating in the marine environment. Environ. Sci. Process Impacts. 17, 1513–1521. doi: 10.1039/c5em00207a
Goldstein, M. C., Titmus, A. J., and Ford, M. (2013). Scales of spatial heterogeneity of plastic marine debris in the northeast pacific ocean. PLoS One 8:e80020. doi: 10.1371/journal.pone
Hartmann, N. B., Hüffer, T., Thompson, R. C., Hassellöv, M., Verschoor, A., Daugaard, A. E., et al. (2019). Are we speaking the same language? Recommendations for a definition and categorization framework for plastic debris. Environ. Sci. Technol. 53, 1039–1047. doi: 10.1021/acs.est.8b05297
Hidalgo-Ruz, V., Gutow, L., Thompson, R. C., and Thiel, M. (2012). Microplastics in the marine environment: a review of the methods used for identification and quantification. Environ. Sci. Technol. 46, 3060–3075. doi: 10.1021/es2031505
Ho, B. T., Roberts, T. K., and Lucas, S. (2018). An overview on biodegradation of polystyrene and modified polystyrene: the microbial approach. Crit. Rev. Biotechnol. 38, 308–320. doi: 10.1080/07388551.2017.1355293
Julienne, F., Delorme, N., and Lagarde, F. (2019). From macroplastics to microplastics: role of water in the fragmentation of polyethylene. Chemosphere 236:124409. doi: 10.1016/j.chemosphere.2019.124409
Kalogerakis, N., Karkanorachaki, K., Kalogerakis, G. C., Triantafyllidi, E. I., Gotsis, A. D., Partsinevelos, P., et al. (2017). Microplastics generation: onset of fragmentation of polyethylene films in marine environment mesocosms. Front. Mar. Sci. 4:84. doi: 10.3389/fmars.2017.00084
Lambert, S., and Wagner, M. (2016a). Characterisation of nanoplastics during the degradation of polystyrene. Chemosphere 145, 265–268. doi: 10.1016/j.chemosphere.2015.11.078
Lambert, S., and Wagner, M. (2016b). Formation of microscopic particles during the degradation of different polymers. Chemosphere 161, 510–517. doi: 10.1016/j.chemosphere.2016.07.042
Primpke, S., Lorenz, C., Rascher-Friesenhausen, R., and Gerdts, G. (2017). An automated approach for microplastics analysis using focal plane array (FPA) FTIR microscopy and image analysis. Anal. Methods 9, 1499–1511. doi: 10.1039/c6ay02476a
Song, Y. K., Hong, S. H., Jang, M., Han, G. M., Jung, S. W., and Shim, W. J. (2017). Combined effects of UV exposure duration and mechanical abrasion on microplastic fragmentation by polymer type. Environ. Sci. Technol. 51, 4368–4376. doi: 10.1021/acs.est.6b06155
Sulc, R., Pesava, V., and Ditl, P. (2015). Local turbulent energy dissipation rate in a vessel agitated by a rushton turbine. Chem. Process Eng. 36, 135–149. doi: 10.1515/cpe-2015-0011
Ter Halle, A., Ladirat, L., Gendre, X., Goudouneche, D., Pusineri, C., Routaboul, C., et al. (2016). Understanding the fragmentation pattern of marine plastic debris. Environ. Sci. Technol. 50, 5668–5675. doi: 10.1021/acs.est.6b00594
Weinstein, J. E., Crocker, B. K., and Gray, A. D. (2016). From macroplastic to microplastic: degradation of high-density polyethylene, polypropylene, and polystyrene in a salt marsh habitat. Environ. Toxicol. Chem. 35, 1632–1640. doi: 10.1002/etc.3432
Keywords: nanofragmentation, environmental weathering, polystyrene, thermooxidative aging, hydrodynamic turbulence, Raman spectroscopy, FTIR, SEM
Citation: Mattsson K, Björkroth F, Karlsson T and Hassellöv M (2021) Nanofragmentation of Expanded Polystyrene Under Simulated Environmental Weathering (Thermooxidative Degradation and Hydrodynamic Turbulence). Front. Mar. Sci. 7:578178. doi: 10.3389/fmars.2020.578178
Received: 30 June 2020; Accepted: 28 December 2020;
Published: 18 January 2021.
Edited by:
Andrew Turner, University of Plymouth, United KingdomReviewed by:
Ilaria Corsi, University of Siena, ItalyChristian Laforsch, University of Bayreuth, Germany
Copyright © 2021 Mattsson, Björkroth, Karlsson and Hassellöv. This is an open-access article distributed under the terms of the Creative Commons Attribution License (CC BY). The use, distribution or reproduction in other forums is permitted, provided the original author(s) and the copyright owner(s) are credited and that the original publication in this journal is cited, in accordance with accepted academic practice. No use, distribution or reproduction is permitted which does not comply with these terms.
*Correspondence: Karin Mattsson, email@uni.edu; karin.mattsson@gu.se