Hunting by the Stroke: How Foraging Drives Diving Behavior and Locomotion of East-Greenland Narwhals (Monodon monoceros)
 Outi M. Tervo1*
  Susanne Ditlevsen2
  Manh C. Ngô1
  Nynne H. Nielsen1
  Susanna B. Blackwell3
  Terrie M. Williams4 Mads Peter Heide-Jørgensen1
- 1Department of Mammals and Birds, Greenland Institute of Natural Resources, Nuuk, Greenland
- 2Data Science Laboratory, Department of Mathematical Sciences, University of Copenhagen, Copenhagen, Denmark
- 3Greeneridge Sciences Inc., Santa Barbara, CA, United States
- 4Department of Ecology and Evolutionary Biology, University of California, Santa Cruz, Santa Cruz, CA, United States
Deep diving air-breathing species by necessity must balance submergence time and level of exercise during breath-holding: a low activity level preserves oxygen stores and allows longer duration submergence whereas high activity levels consume oxygen quickly and shorten submergence time. In this study, we combined high-resolution multi sensor animal-borne tag data to investigate diving behavior and locomotion styles of the narwhal (Monodon monoceros) (n = 13, mean record length 91 h)–a deep diving Arctic species. Narwhals in this study dove down to >800 m but despite the deep diving abilities, one-third of the dives (33%) were shallow (>100 m) and short in duration (<5 min). Narwhals utilized energy saving measures such as prolonged gliding during descent with increasing target depth but stroked actively throughout the ascent indicating excess oxygen storages. Foraging behavior, as detected by the presence of buzzes, was a key factor influencing dive depth and spinning behavior—the rolling movement of the animal along its longitudinal axes. Narwhals in East Greenland utilized two foraging strategies, while transiting and while stationary, with different target depths and buzzing rates. The first targeted deep-dwelling, possibly solitary prey items and the latter, more schooling prey closer to the surface. The buzzing rate during stationary foraging was on average twice as high as during transiting foraging. Spinning was an integrated part of narwhal swimming behavior but the amount of spinning was correlated with foraging behavior. The odds for spinning during all dive phases were 2–3 times higher during foraging than non-foraging. Due to the spinning behavior, stroking rate might be better suited for estimating energy consumption in narwhals than ODBA (overall dynamic body acceleration). The narwhal is considered as one of the most sensitive species to climate change–the results from this study can act as a baseline essential for evaluating changes in the behavior and energy usage of narwhals caused by stressors evolving in the Arctic.
Introduction
Marine mammals are forced to move between the surface and the deep in order to gain access to the two life sustaining resources–air at the surface and food at depth. Locomotion is therefore a significant contributor to energetic balance in the daily lives of marine mammals (Kooyman and Ponganis, 1997; Costa and Williams, 1999; Wilson et al., 2006; Gleiss et al., 2011). Marine mammals propel themselves with the help of flippers, or in the case of whales and dolphins, a powerful tail fluke. This movement can be detected as body acceleration and deceleration and can further be converted into individual strokes and gliding events (Sato et al., 2007; Williams et al., 2017b). Due to the energetic cost of locomotion, marine mammals often utilize energy saving measures during a dive such as prolonged gliding (Williams et al., 2000), relatively low mean swimming speeds (Williams, 2009) and a gait of alternating gliding and stroking (Williams et al., 1992, 2000; Skrovan et al., 1999). In this gait, the forward propelling energy created by a few strokes is utilized to the maximum where the body of the animal glides through the water with minimal effort (Williams et al., 2000). High speed and thus fast, energy-consuming stroking is, however, sometimes necessary. Short-finned pilot whales Globicephala macrorhynchus forage on fast moving prey and regularly launch themselves forward with a speed of 9 m/s during foraging events (Aguilar Soto et al., 2008). Similarly, high speed, uninterrupted stroking is sometimes required to escape from predators (Ford et al., 2006), or from anthropogenic disturbance (e.g., DeRuiter et al., 2017; Williams et al., 2017a,b; van Beest et al., 2018).
As stroking rates can be assigned specific energetic costs for an individual, changes in stroking rate and locomotion mode due to disturbance provide a measure of excess energy expenditure (Williams et al., 2017b). This in turn can be used to assess the effects and significance of a stressor on the energy budget of an individual.
Such elevated energetic costs can be challenging for wild marine mammal species. For example, the narwhal Monodon monoceros is considered to be one of the three most sensitive Arctic marine mammal species to climate change (Laidre et al., 2008) and is already now experiencing changes in its environment that may alter energetic balance. Due to climate change- induced decreases in sea ice coverage both temporally and spatially (Parkinson and Cavalieri, 2008; Serreze et al., 2007; Serreze and Stroeve, 2015; Stroeve et al., 2018), the Arctic has become more available for anthropogenic activities such as fisheries, tourism, military, shipping and oil, and gas exploration (Arctic Marine Shipping Assessment [AMSA] Report, 2009) that are, among other effects, altering the underwater soundscape (Moore et al., 2012) and movements of marine mammals. This may be especially problematic for the narwhal that typically is a slow-moving whale adapted to long endurance swimming (Williams et al., 2011). Due to these multiple impacts, underwater noise pollution from anthropogenic activities has in recent decades been recognized as an increasing threat to marine life (Richardson et al., 1995; Southall et al., 2007; Moore et al., 2012; Simmonds et al., 2014; Williams et al., 2015). This is particularly a concern for marine mammals that rely on sound as their main sensory modality more than any other marine taxa.
The presence of anthropogenic disturbance is adding to the list of stressors that the Arctic ecosystem is currently facing due to climate change. Among other features, narwhals are highly adapted to life in the cold with a thick blubber layer that functions as thermal insulation and energy storage. Even if securing core body temperature to avoid hypothermia is essential for all aquatic mammals, the ability to lose excess heat in connection with exercise is equally important. Bursts of high levels of exercise by narwhals that are built for slow speed swimming (Williams et al., 2011) may constrain their ability to remove excess heat, especially in a warming ocean (Chambault et al., 2020; Heide-Jørgensen et al., 2020).
To investigate these environmental challenges to narwhals, we took advantage of recent developments in compact, small and hydrodynamic animal-borne tags that have revolutionized research on marine mammal behavior in the wild (Brown et al., 2013). The large variety of modern multi-sensor tags enables the collection of data with sampling frequencies of hundreds to thousands of hertz, giving access to incredible amounts of detail on the lives of marine mammals. Furthermore, due to decreased physical size of modern animal-borne tags, it is now possible for some larger marine mammal species such as the narwhal, to carry a combination of different tag types in one deployment, and gain information on the behavior of the animal and the interactions between it and the environment in a more holistic manner. In this study, we coupled acoustic data on foraging attempts with acceleration, depth, and horizontal movement tracks from animal-borne instruments with the aim of describing and quantifying the baseline of diving and locomotion patterns of narwhals. The results from this study contribute to our general understanding of narwhal behavior and provide data for estimating energy expenditure during locomotion using stroking rates. Furthermore, results from this study can be used as a baseline for evaluating changes in the behavior and energy usage of narwhals caused by stressors evolving in the Arctic.
Materials and Methods
Live-Capture and Instrumentation of Narwhals
Live-capture of narwhals was conducted from a field station at Hjørnedal inside Scoresby Sound in East Greenland in collaboration with local Inuit hunters as part of a larger ongoing study on narwhal ecology, physiology and behavior (Heide-Jørgensen et al., 2020; Figure 1). This study took place during August in 2013–2017, and 2019 (Table 1). Set nets of either 40 or 80 m length and 5–8 m deep were deployed from shore to an anchor. Lookouts for whales were maintained from land ensuring that the nets were kept under constant surveillance. When whales were observed in the area, several 5–7-m fiberglass speedboats were launched and used to herd the whales toward the nets. If a whale was being entangled, the net was released from the anchor and the whale was pulled to the surface and toward the shore. Instrumentation of captured whales was conducted near the shore by four persons in survival suits standing next to the whale and priority was given to minimizing handling time. The length of the anchor line securing the whale to shore was adjusted accordingly to ensure that the whale was afloat at all times. Total time in net from capture to release was 66 (SD 14) min on average. The duration of handling time ranged from 9 to 41 min. Sex of the whales was determined based on presence (male) or absence (female) of a tusk. The curved length of the whale was measured from forehead to the tail notch with a measuring tape.
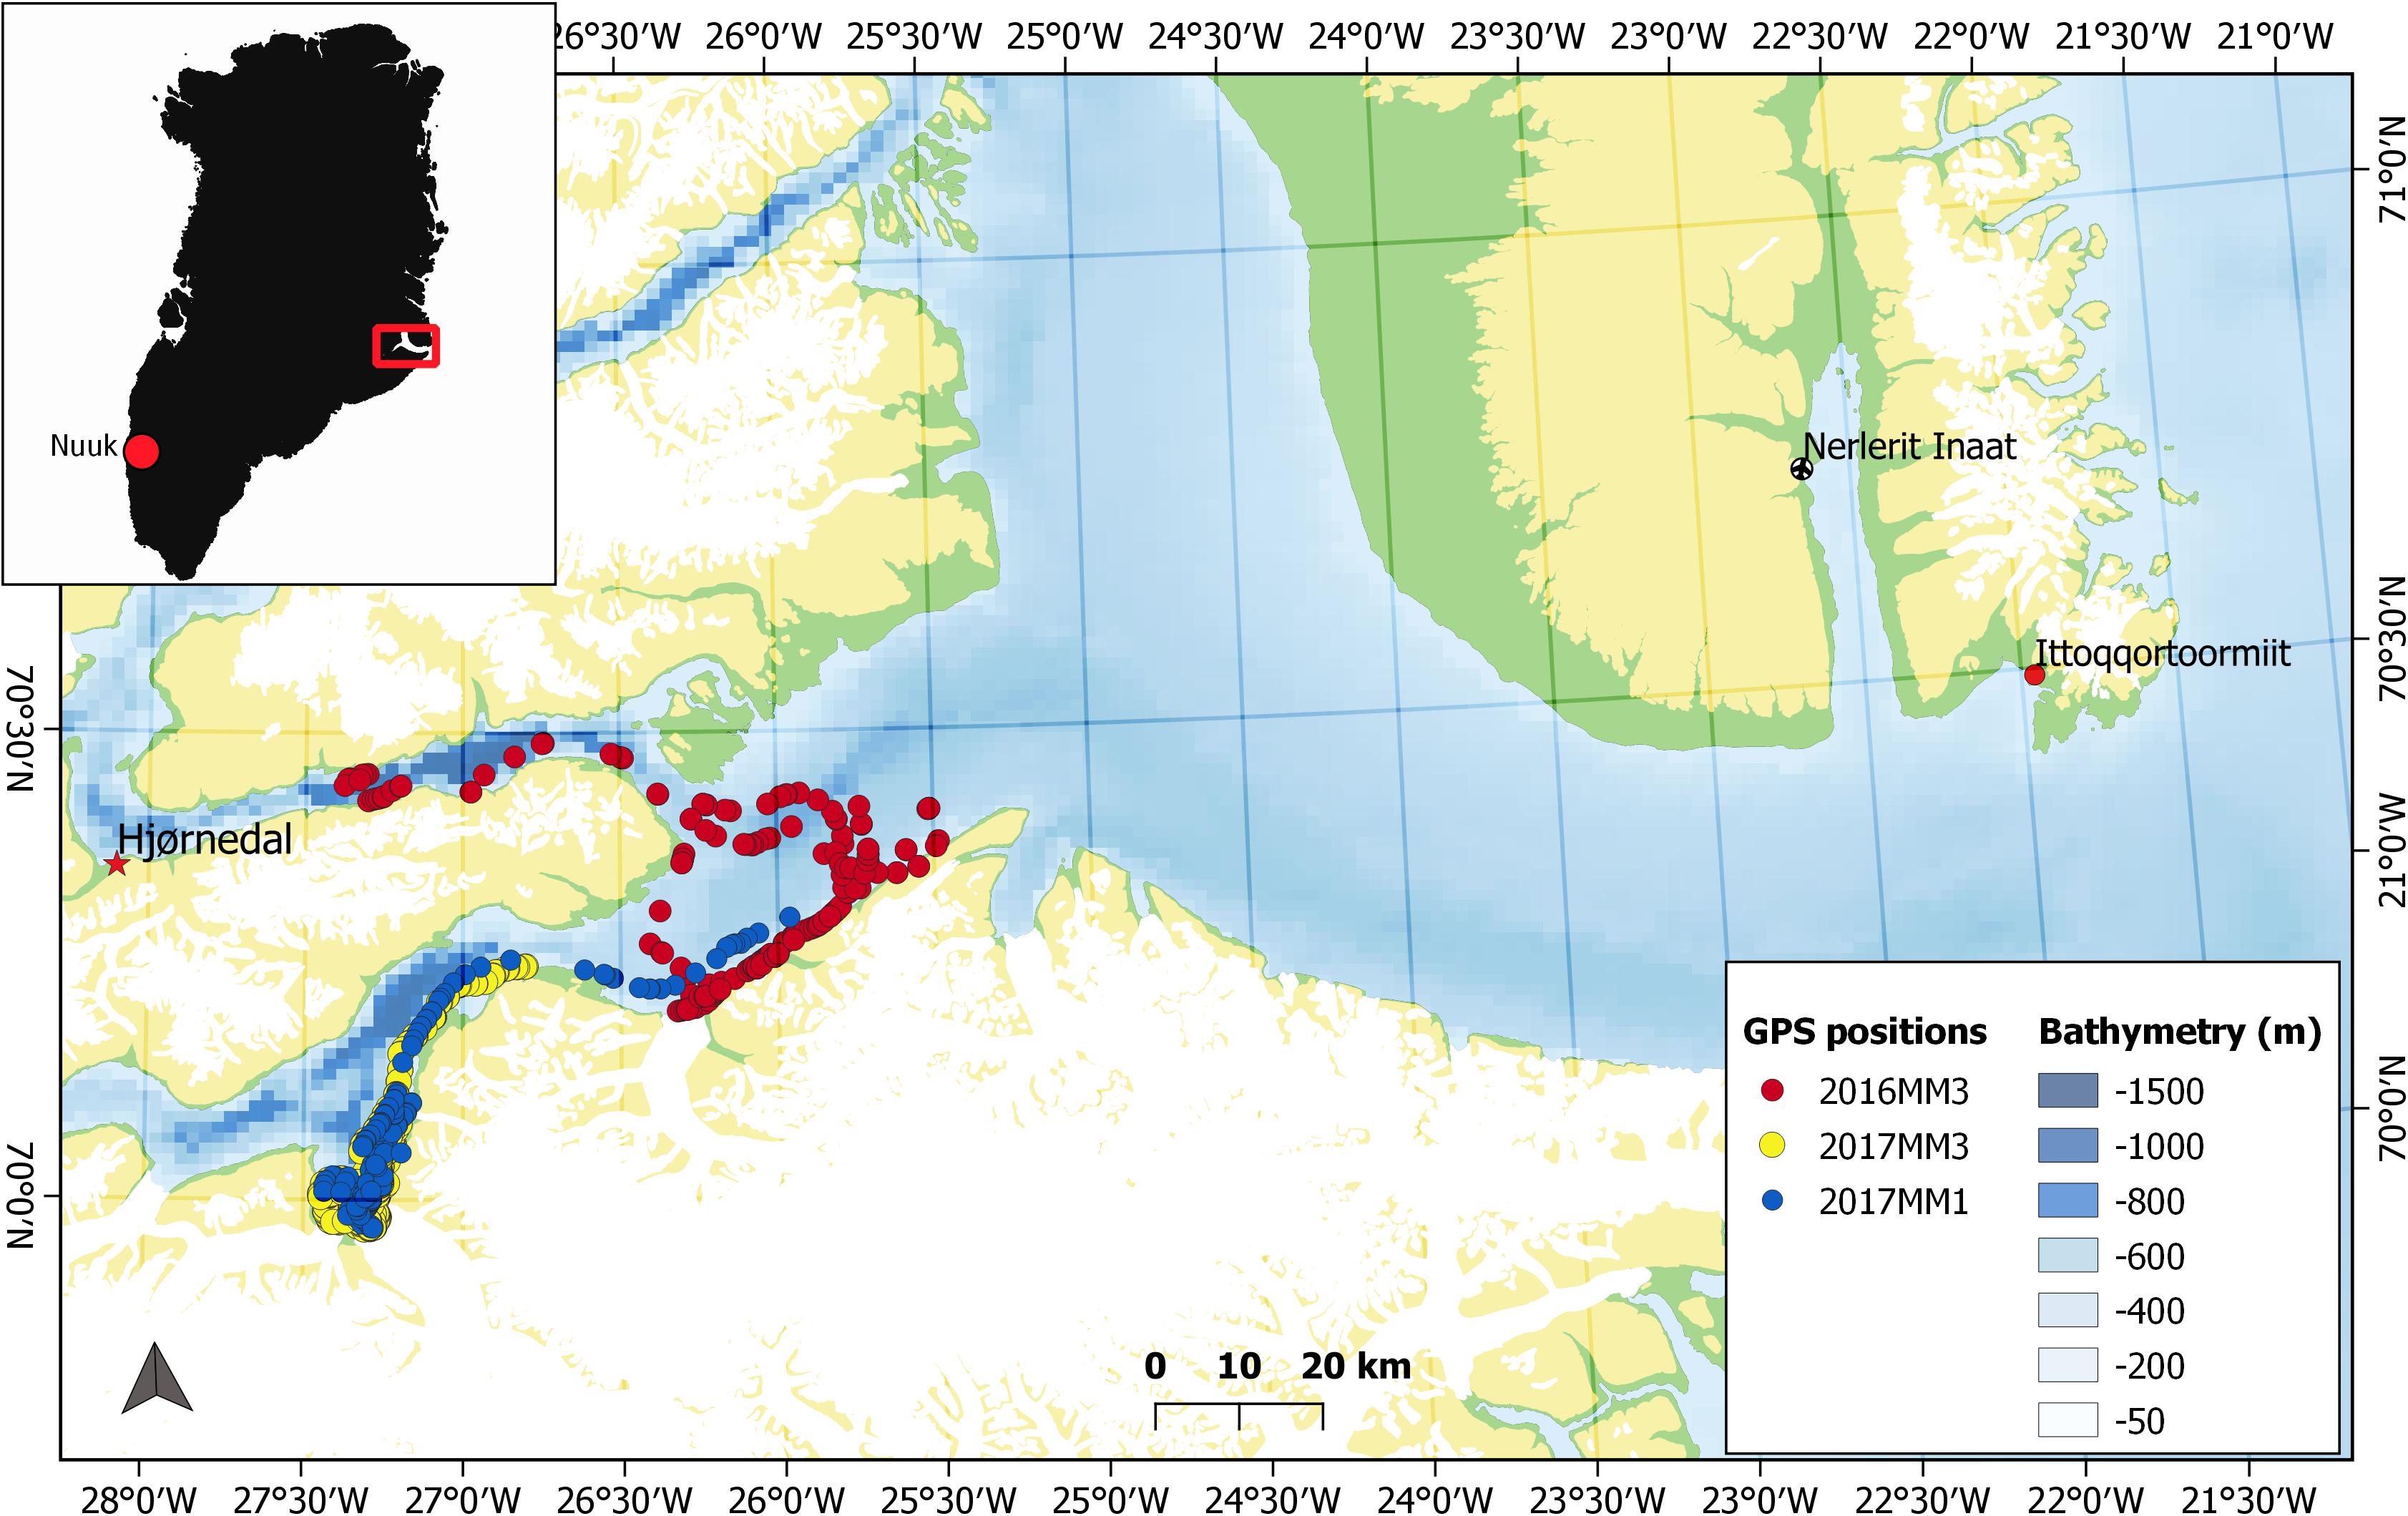
Figure 1. Map of Greenland showing the Scoresby Sound fjord (red box) in East Greenland and a zoomed in map of the study area with the location of the field site, Hjørnedal, where tagging of narwhals took place. Tracks of three individuals [2016MM3 (female), 2017MM1 (male) and 2017MM3 (male)] used in the behavioral change point analysis (bcpa), that incorporated horizontal and vertical movement, are shown.
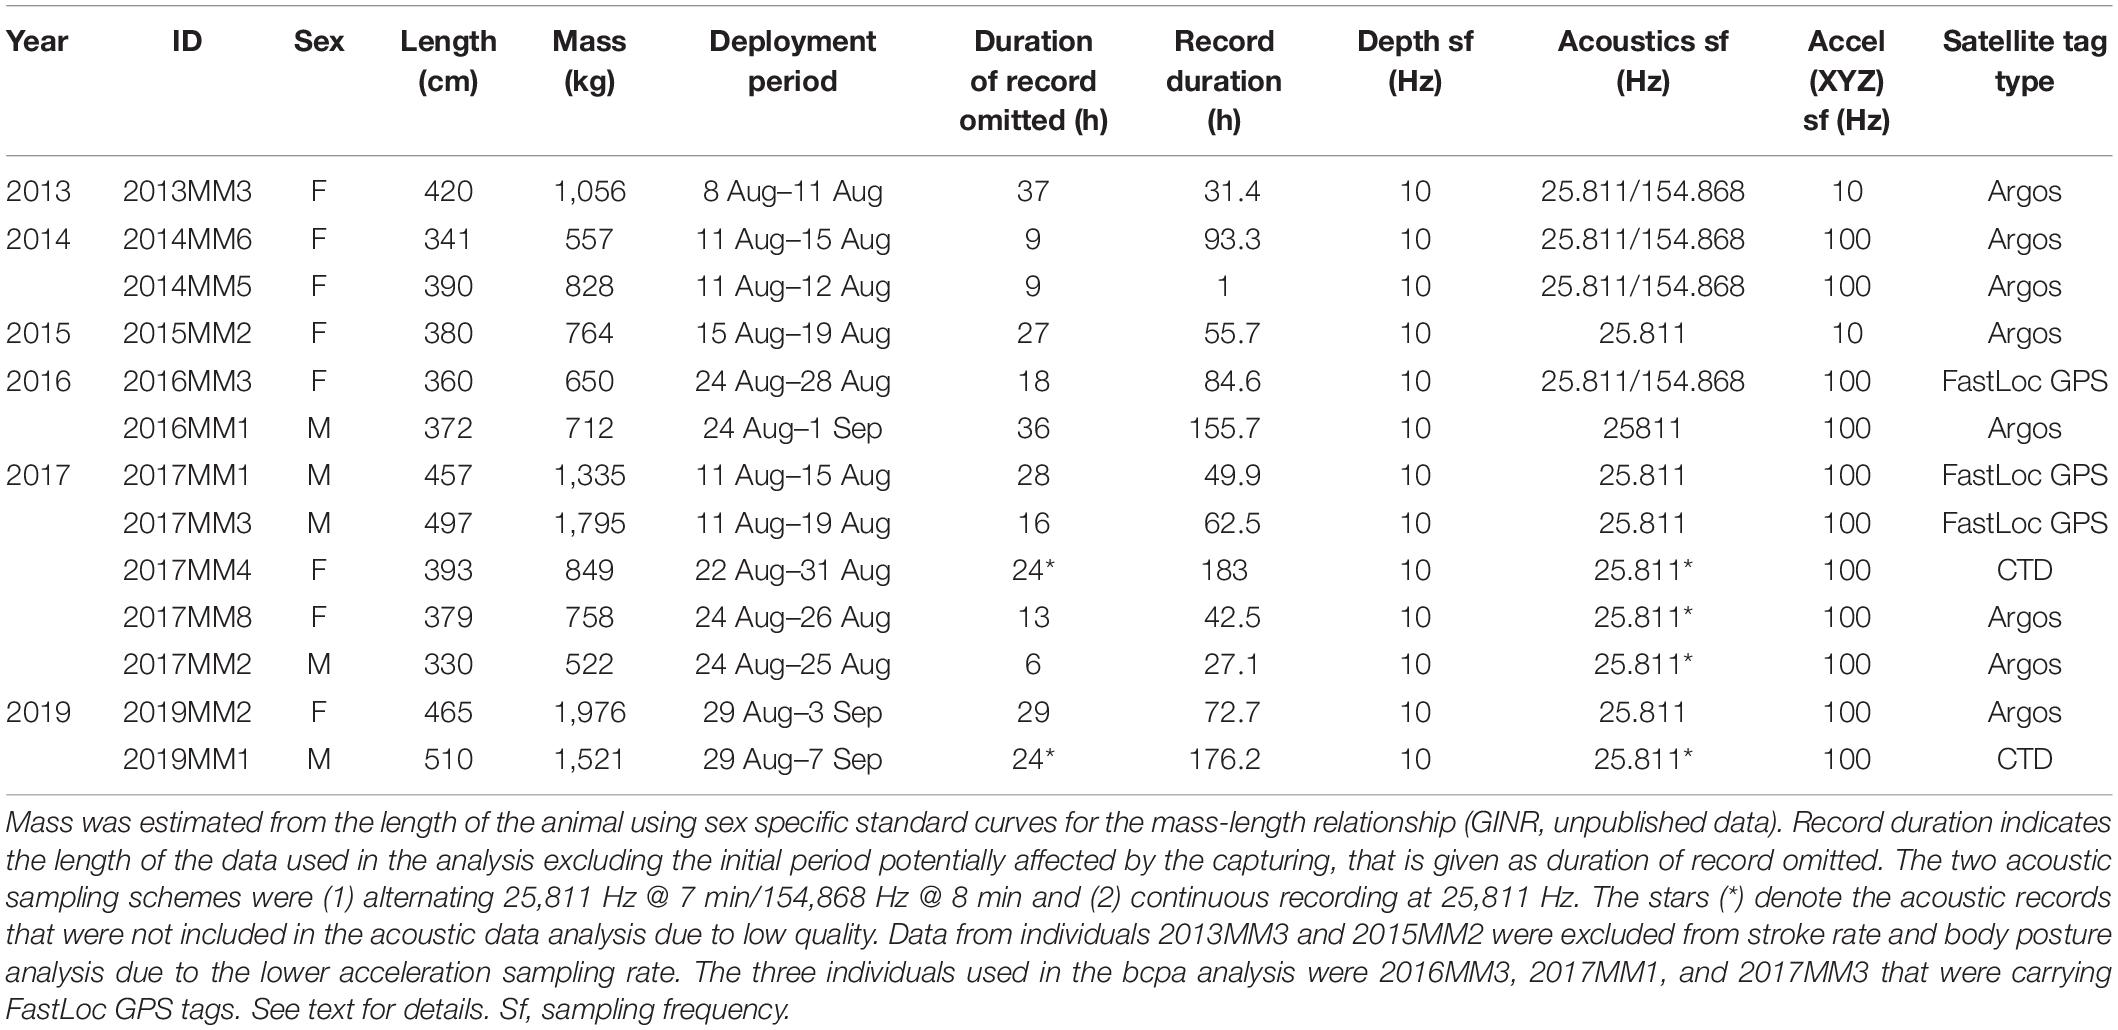
Table 1. Description of the individual deployments and datasets.
In this study, 13 narwhals (5 males and 8 females) were captured and instrumented with (1) a backpack satellite transmitter from Wildlife Computers1 and (2) an AcousondeTM acoustic and orientation tag2 (Table 1). The backpack tags were mounted on the back of the whale with either two or three 8 mm sterilized delrin nylon pins secured with washers and bolts on each end as described in detail in Heide-Jørgensen et al. (2003) and Dietz et al. (2008). The transmitters were programmed to collect an unrestricted number of positions through August. In this study we used data from only FastLoc GPS-receivers (Wildlife Computers, Redmond, Seattle, WA, United States) that yield high-resolution location data with an accuracy of 20 m. FastLoc snapshots were transmitted to and relayed through the Argos Location and Data Collection System3.
Data on acoustics, diving behavior and locomotion were collected using Acousonde tags, which were attached to the side of the dorsal ridge with suction cups. In order to extend the longevity of the attachment, two 1 mm nylon lines were threaded through the top of the dorsal ridge. The Acousonde was held to the lines with magnesium corrosible links, which ensured release of the recorder after a maximum of 8 days of attachment. Once detached, the instrument was retrieved with the help of signals from an Argos transmitter (Wildlife Computers SPOT5) and a VHS transmitter (ATS Telemetry) attached to the Acousonde. The Acousonde tags were programmed to collect continuous data of acoustic (sf 25 811 Hz or alternating sf 25,811 Hz/154,868 Hz), 3-axis acceleration (sf 100 Hz), 3-axis orientation (magnetometer, sf 10 Hz), pressure (sf 10 Hz), light (sf 10 Hz), and temperature (sf 10 Hz). Light, magnetometer and temperature data were not analyzed in this study. To avoid excess drag, size and hydrodynamic shape of the tags were minimized and represented less than 3% of the frontal area of the animal.
Data Analysis
Although the magnitude and duration of the effect of tagging for live-captured narwhals have not yet been quantified in detail, there are some results available. The acoustic behavior of narwhals can be affected for several hours after release as indicated by lack of vocalization (Blackwell et al., 2018) and by increased stroking rates during so-called escape dives immediately after release (Williams et al., 1992). To avoid effects of tagging interfering with normal and undisturbed diving behavior, the time period prior to initiation of echolocation was omitted from each record (n = 11, mean 20.17 SD 11.13 h). When this information was not available, the first 24 h of each record were omitted (n = 2, Table 1).
Acoustic Analysis
Acoustic analyses were performed on 9 of the 13 records with sufficient acoustic quality (Table 1). The analyses for this study were concentrated on buzzes–a characteristic click-based acoustic signal produced by odontocetes in the final stage of an echolocation sequence. Buzzes were detected using a custom-written buzz detector (Matlab, The MathWorks, Inc., Natick, MA, United States) described in Blackwell et al. (2018). All automatically detected buzzes were verified manually.
Diving Behavior
The time-depth data on the Acousonde records were averaged to 1 Hz and divided into surface and dive events. Surface events were defined as continuous time periods within 20 m from the surface. Periods during which the depth equaled or exceeded 20 m were defined as dives. For these dive events, a threshold of 10 m was chosen as the onset of descent and end of the ascent. Each dive was divided into bottom, descent and ascent phase (Figure 2). The bottom phase was defined as the time in minutes that the animal spent at or below 75% of the maximum depth of the dive (Figure 2). The descent was defined as the period between the onset of the dive and the onset of the bottom phase (Figure 2). Similarly, the ascent phase was defined as the period between the end of the bottom phase and the end of the dive (Figure 2). Maximum depth of the dive is also referred to as the target depth.
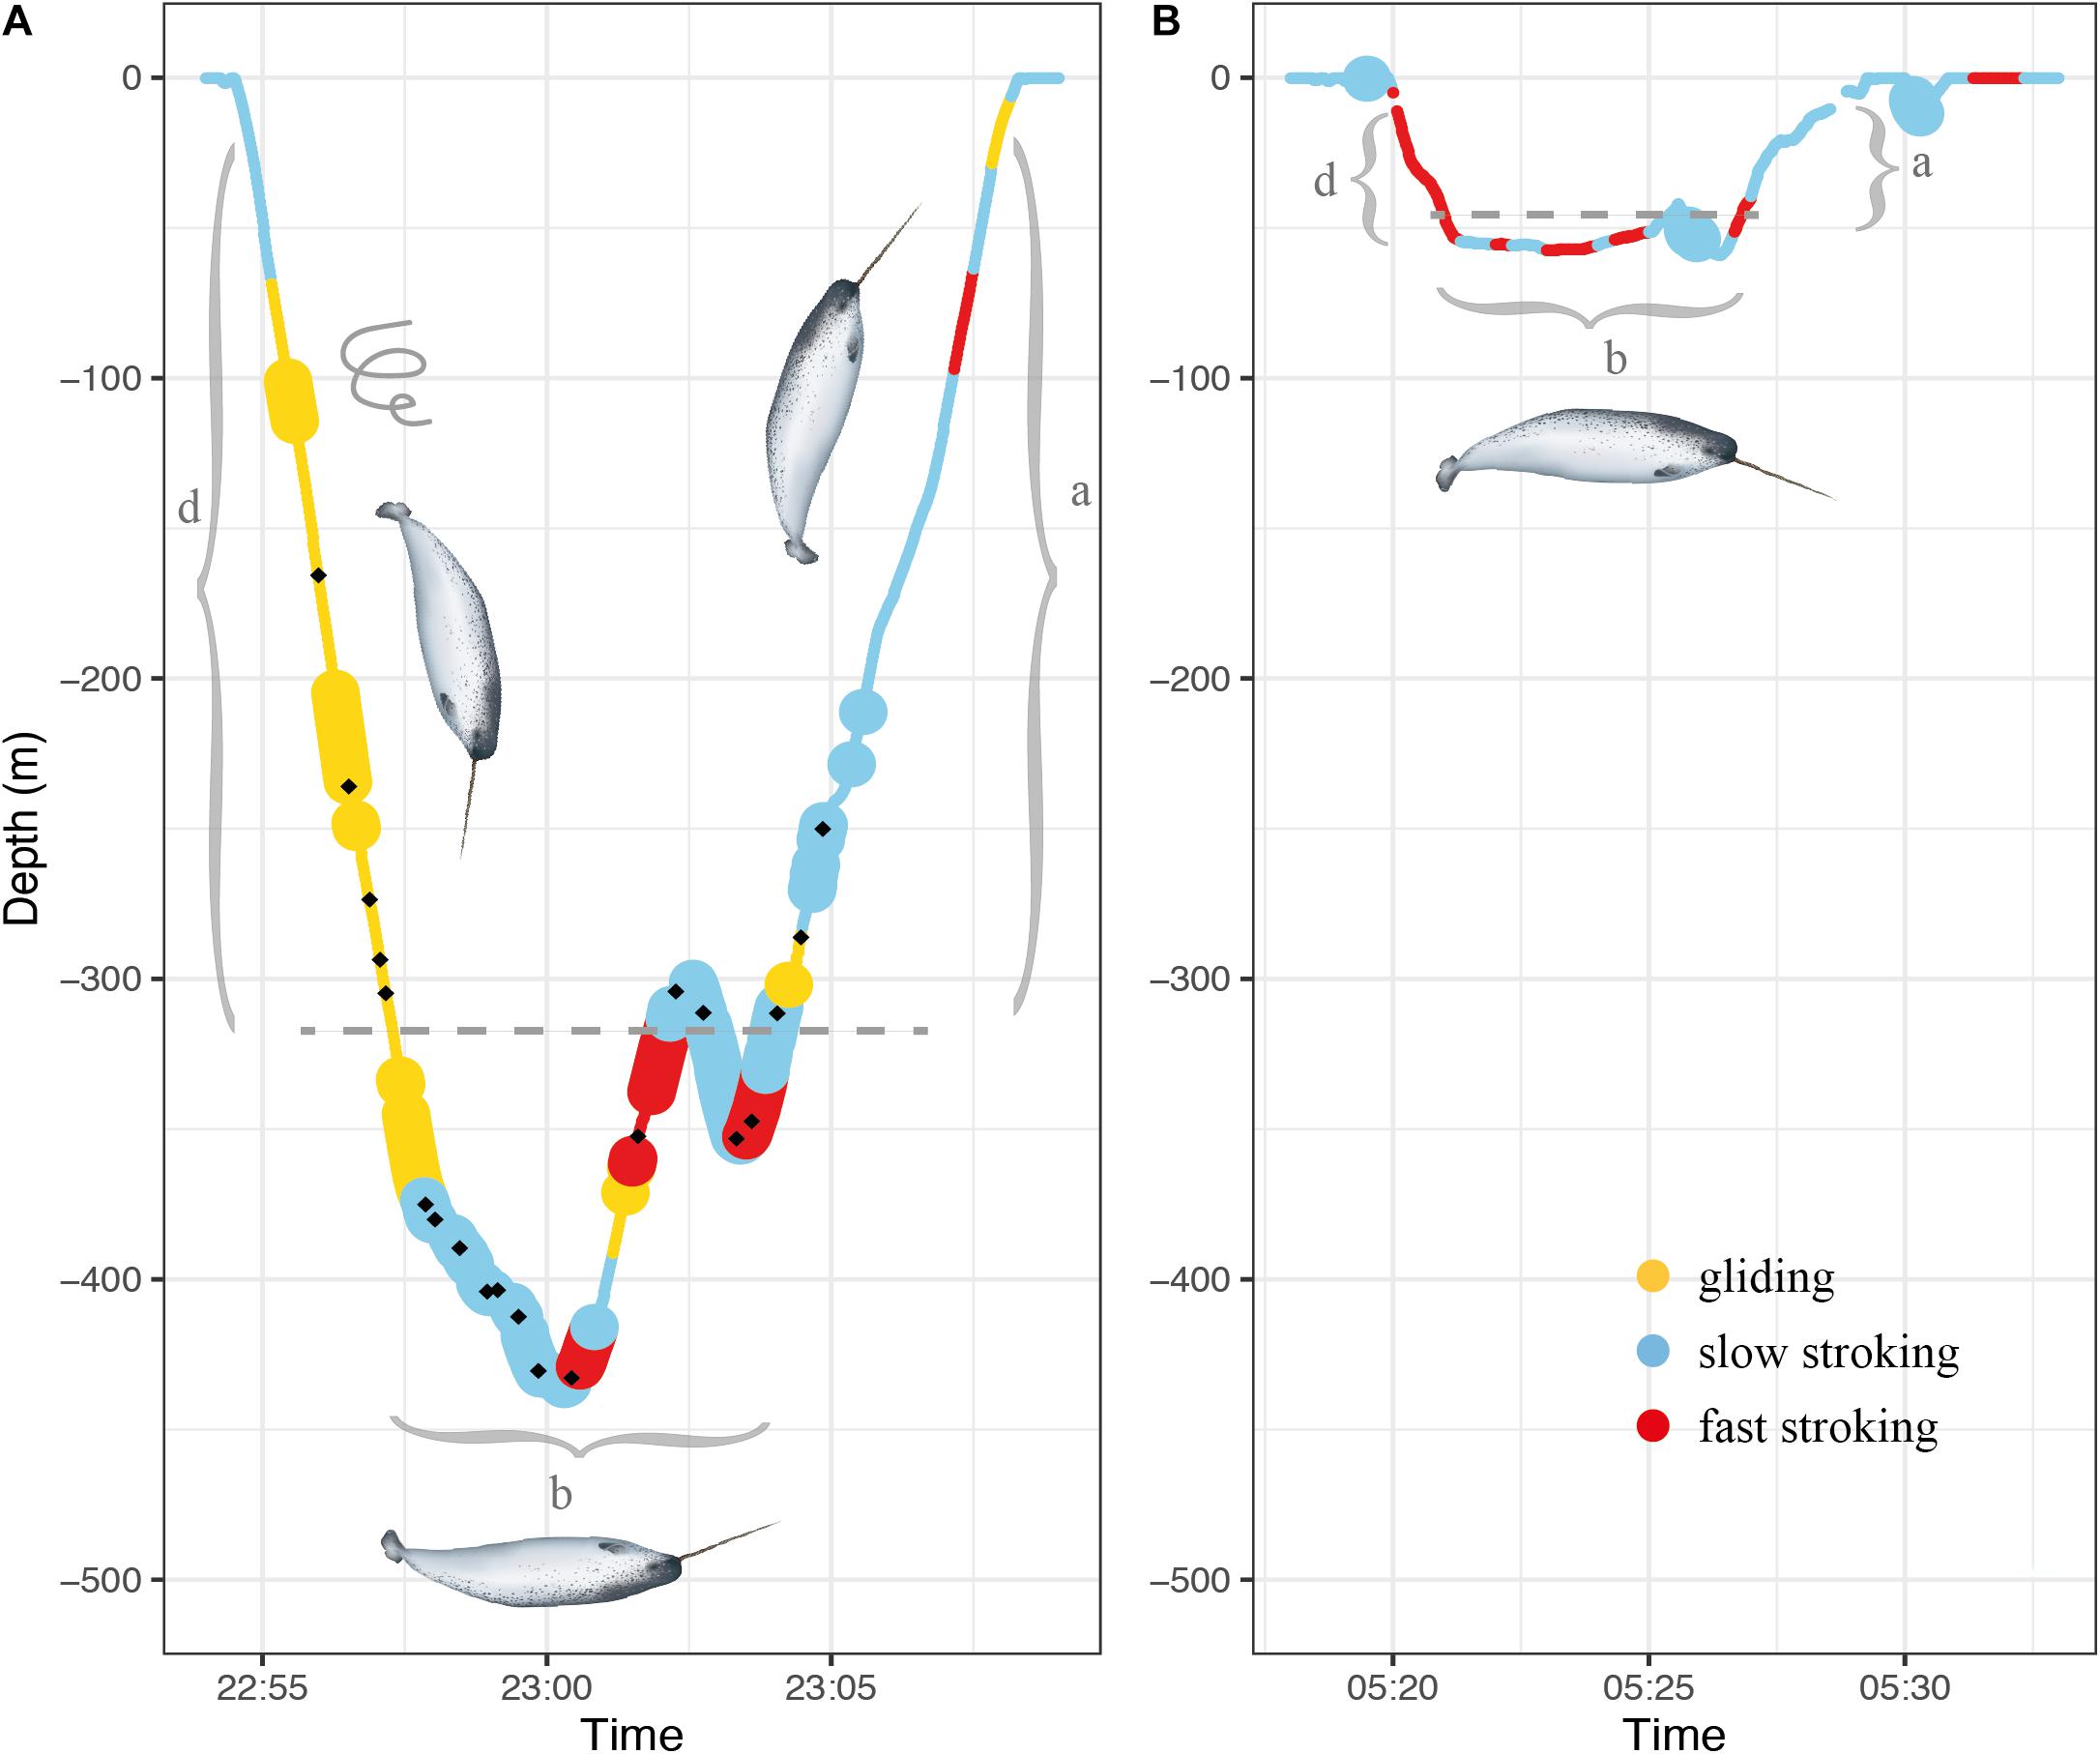
Figure 2. Examples of dive profiles of a foraging V dive (A) and non-foraging U dive (B). The gray brackets mark the different dive phases descent (d), bottom phase (b) and ascent (a). The dashed gray line on both graphs mark the depth threshold (75% maximum depth) used for determining bottom phase. The different colors represent the three stroking modes while large-size markers indicate spins. The black dots in panel A denote buzzes. Illustration of narwhal by Uko Gorter.
Dives were categorized as either U or V dives. In U dives, at least 66% of the total dive duration was spent at the bottom phase, giving the dive its typical flat-bottomed shape (Figure 2B). Dives were also classified as foraging-related or non-foraging related based on the presence or absence of feeding buzzes, respectively.
Swim speed of the animal was determined by combining the pitch of the animal with the rate of change in depth for each second. Only sections of the dive record where the animals were positioned vertically (> 75° absolute pitch angle) in the water column, were used to calculate vertical swim speeds shown in Table 2 but all the swim speed estimates were used to calculate median swim speeds during the first 100 m of descent used in model 2.
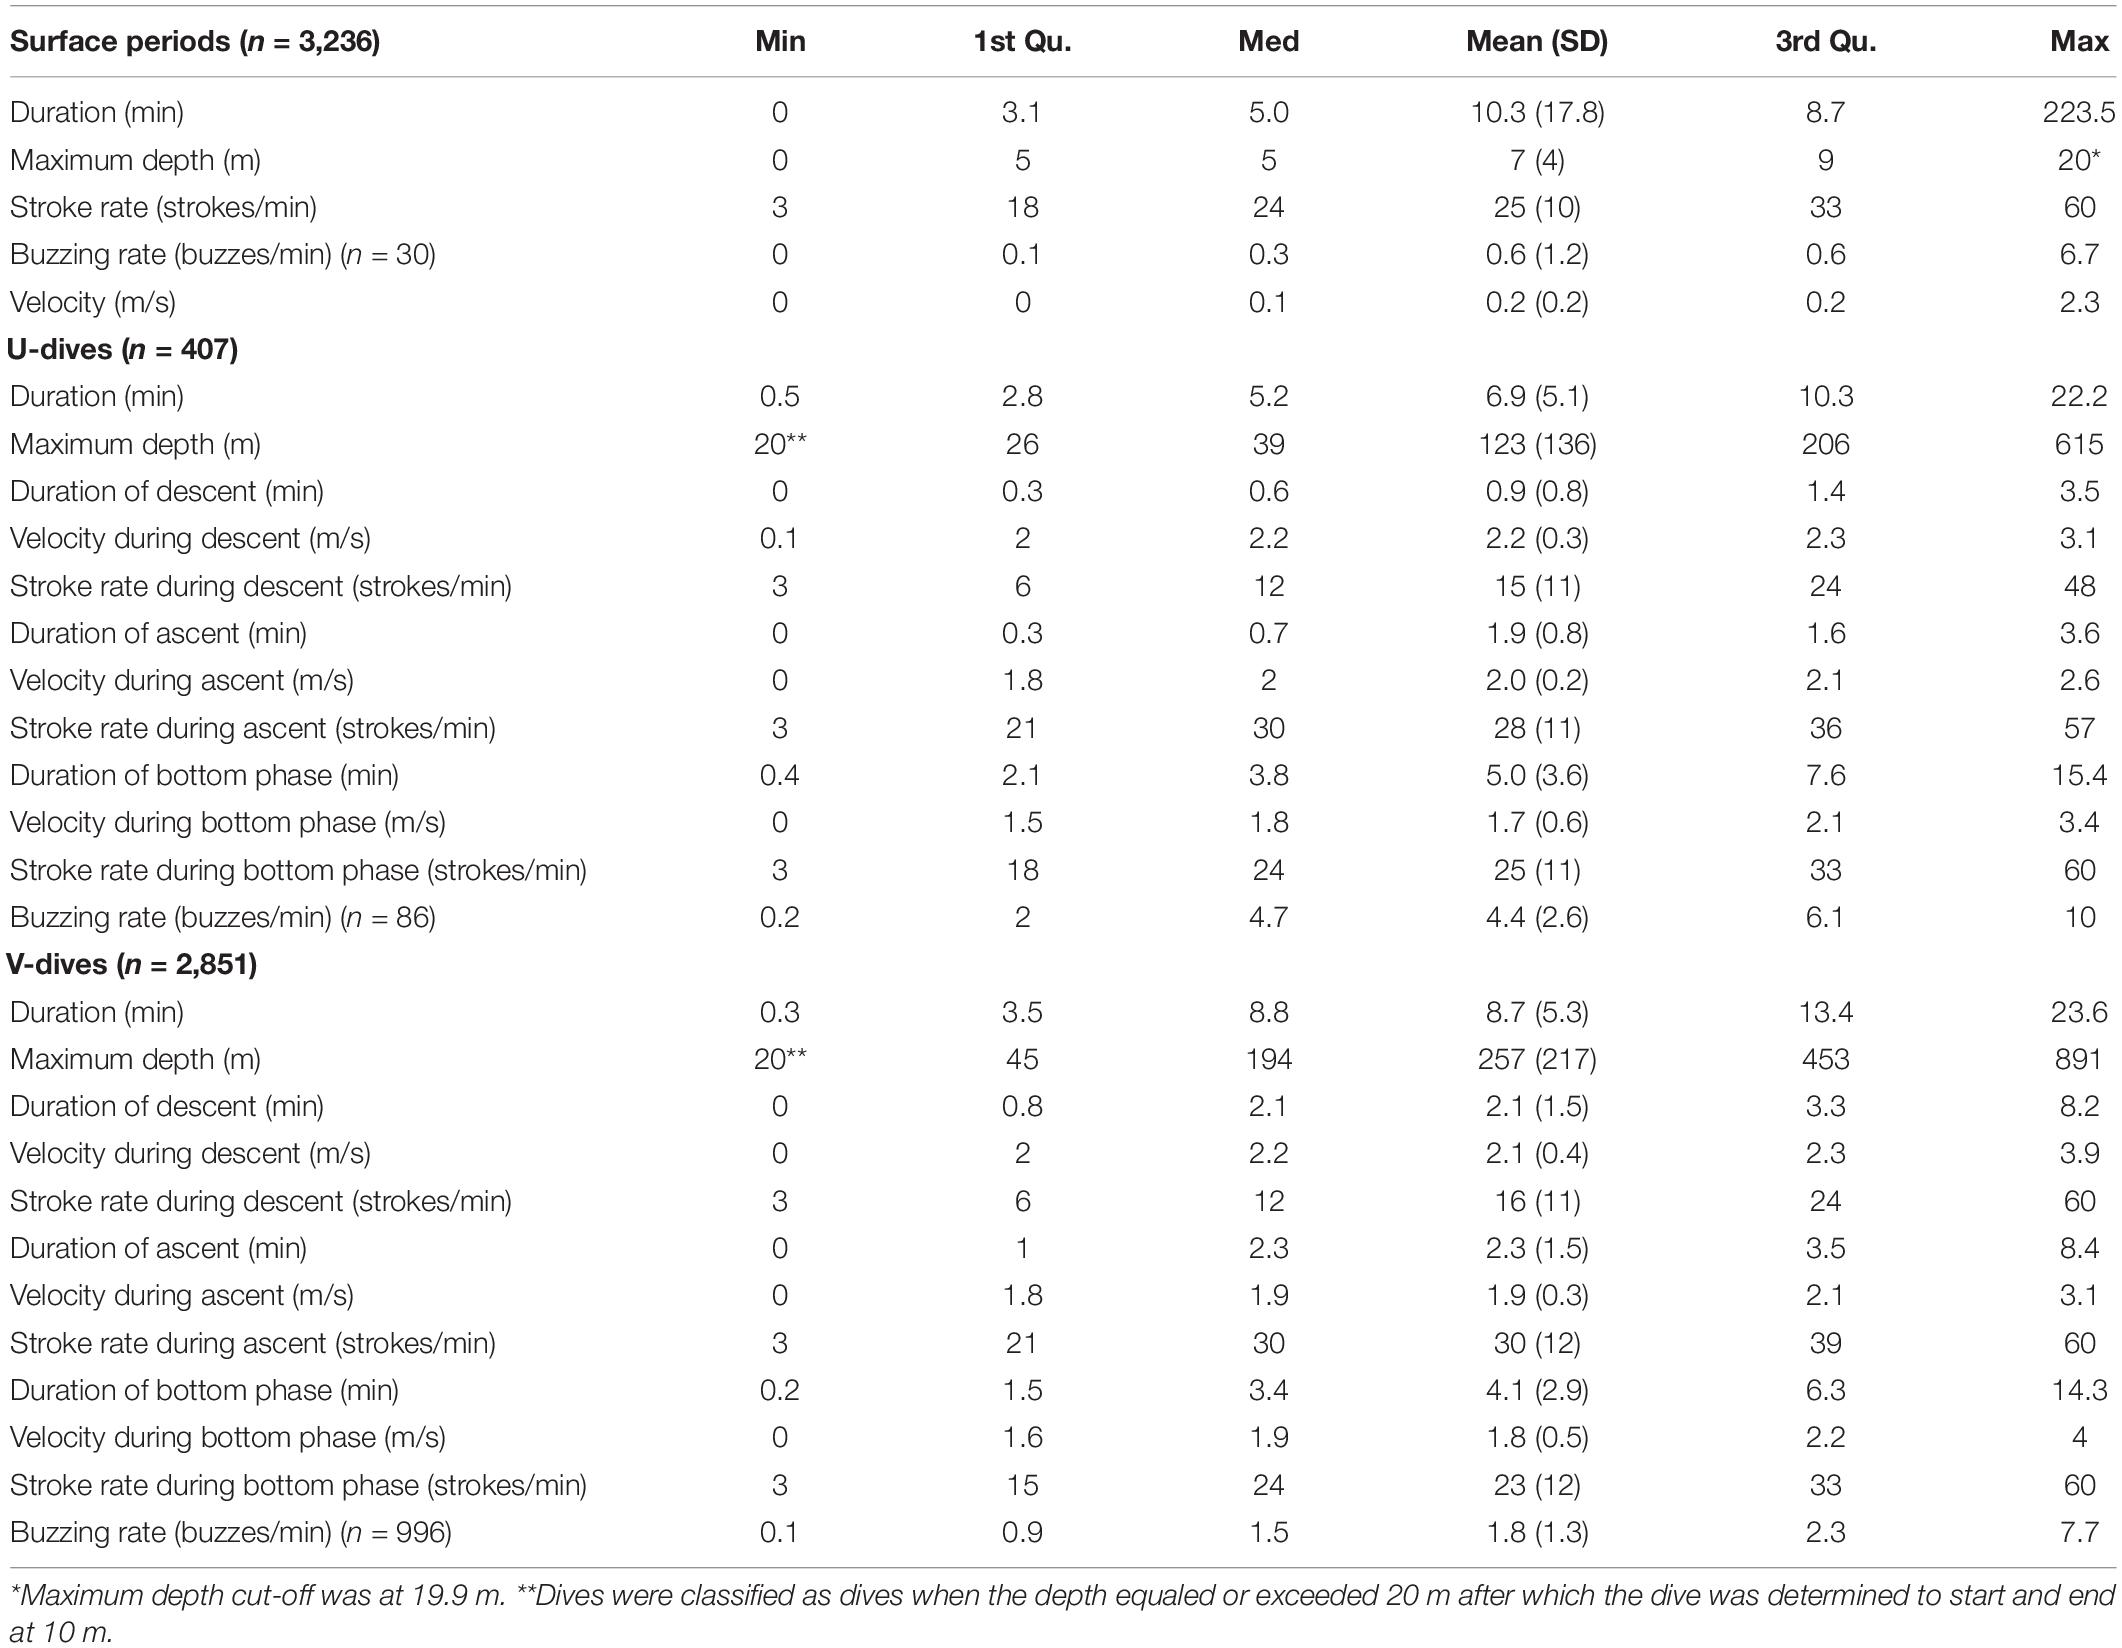
Table 2. Summary statistics for dives (n = 3,258) and surface periods (n = 3,236).
Body Posture and Stroking Rate
Data from 11 of the 13 animals where acceleration was sampled at a sufficiently high rate of 100 Hz were used to describe changes in body postures and stroking rates. Prior to analyses, a correction factor corresponding to the difference between the position of the tag and the dorsal midpoint of the whale on the longitudinal axis was applied to the data measured on the z-axis of the accelerometer. This resulted in a body posture at the surface having a value of −1 G (dorsal side up, 0° roll) and a horizontal position with ventral side up having a value of 1 G (180° roll). The roll of the body was then divided into three body postures each having a 90° window: dorsal side up (0 ± 45°), on the side (90 ± 45°or 270 ± 45°) and supine (180 ± 45°). A spin was determined as a change in body posture from dorsal side up to supine, or vice versa.
Strokes by the tail fluke were identified using a custom-written stroke detector developed in R (R Core Team, 2020). The detector was designed to identify and count slopes from peak to bottom (the upward movement of the tail fluke) in a 20 s timeframe from the acceleration measured on the x-axis of the accelerometer, that captures the pitch of the animal. If the animal changed its body posture to swimming on its side, the acceleration measured on the y-axis (yaw) was used as an input in the detector instead. The data were smoothed over 32 samples (sampling rate 100 Hz) prior to running the detector in order to avoid false positive detections from fast accelerations not related to the tail movement. The performance of the detector was verified by visual inspection of a subsample of the data [2 h of data from individuals 2016MM1 (male) and 2016MM3 (female), 4 h in total] by a manual analyst. The detector had an 81% correct detection rate. Thus, the stroking rates presented in this study should be considered as estimates.
The locomotion of the whales was divided into three stroking modes based on the stroking rate. These were (1) gliding (0–6 strokes/min), (2) slow stroking (7–26 strokes/min), and (3) fast stroking (≥27 strokes/min). A maximum 6 strokes/min was chosen as the threshold for gliding, as defined for other marine mammals (Williams et al., 2000, 2004). The stroke rate of 27 strokes/min was the most common median value across individuals and was chosen as the divider between low and high stroking modes (see Williams et al., 2017a,b for classification of preferred and high-speed stroking in cetaceans).
Behavioral Change Point Analysis
To examine and describe diving and locomotion during different behaviors, we divided the surface periods and dives into four behavioral categories based on behavioral change point analysis (package “bcpa” in R, Gurarie et al., 2009). The analysis divides a time-stamped horizontal movement track into trajectories using a likelihood-based method for identifying significant changes in two movement parameter values: horizontal speed and relative tortuosity. Relative tortuosity is measured as the tendency and magnitude of a movement to persist in a given direction (see details of the method in Gurarie et al., 2009). Based on these trajectories and on the presence or absence of buzzes during individual dives and surface events, the records of each animal were divided into four behavioral categories: (1) stationary foraging (buzzes present and trajectory with low speed and high tortuosity), (2) foraging while transiting (buzzes present and trajectory with high speed and low tortuosity), (3) stationary non-foraging (buzzes not present and trajectory with low speed and high tortuosity), and (4) transiting (buzzes not present and trajectory with high speed and low tortuosity). This analysis included 3 animals (2 males, 1 female) with high-resolution GPS data and good quality acoustic data (Table 1).
Statistical Analyses
The behavior of narwhals was assessed with generalized linear models using function glm (base package), function multinom (package nnet) for multinomial logistic regression and function betareg (package betareg) for beta regression. For the natural splines, the procedure ns (package splines) was used. Depth and target depth in the different models, were always entered non-linearly with natural splines with 3 degrees of freedom. This was chosen to accommodate the non-linear effects of depth, and degrees of freedom was kept constant and pre-specified in order not to overfit to random fluctuations in the data during model selection. Model selection of variables to be included was done using Akaike Information Criterion (AIC) scores, where the model with the lowest AIC score was chosen (Supplementary Table S1). If difference between AIC scores between two variants of the same model was smaller than 10, the simplest model with the lowest number of parameters was chosen instead of the lowest AIC score of these two (Burnham and Anderson, 2002). Below are descriptions of the models with the best fit, that are also summarized in Table 3:
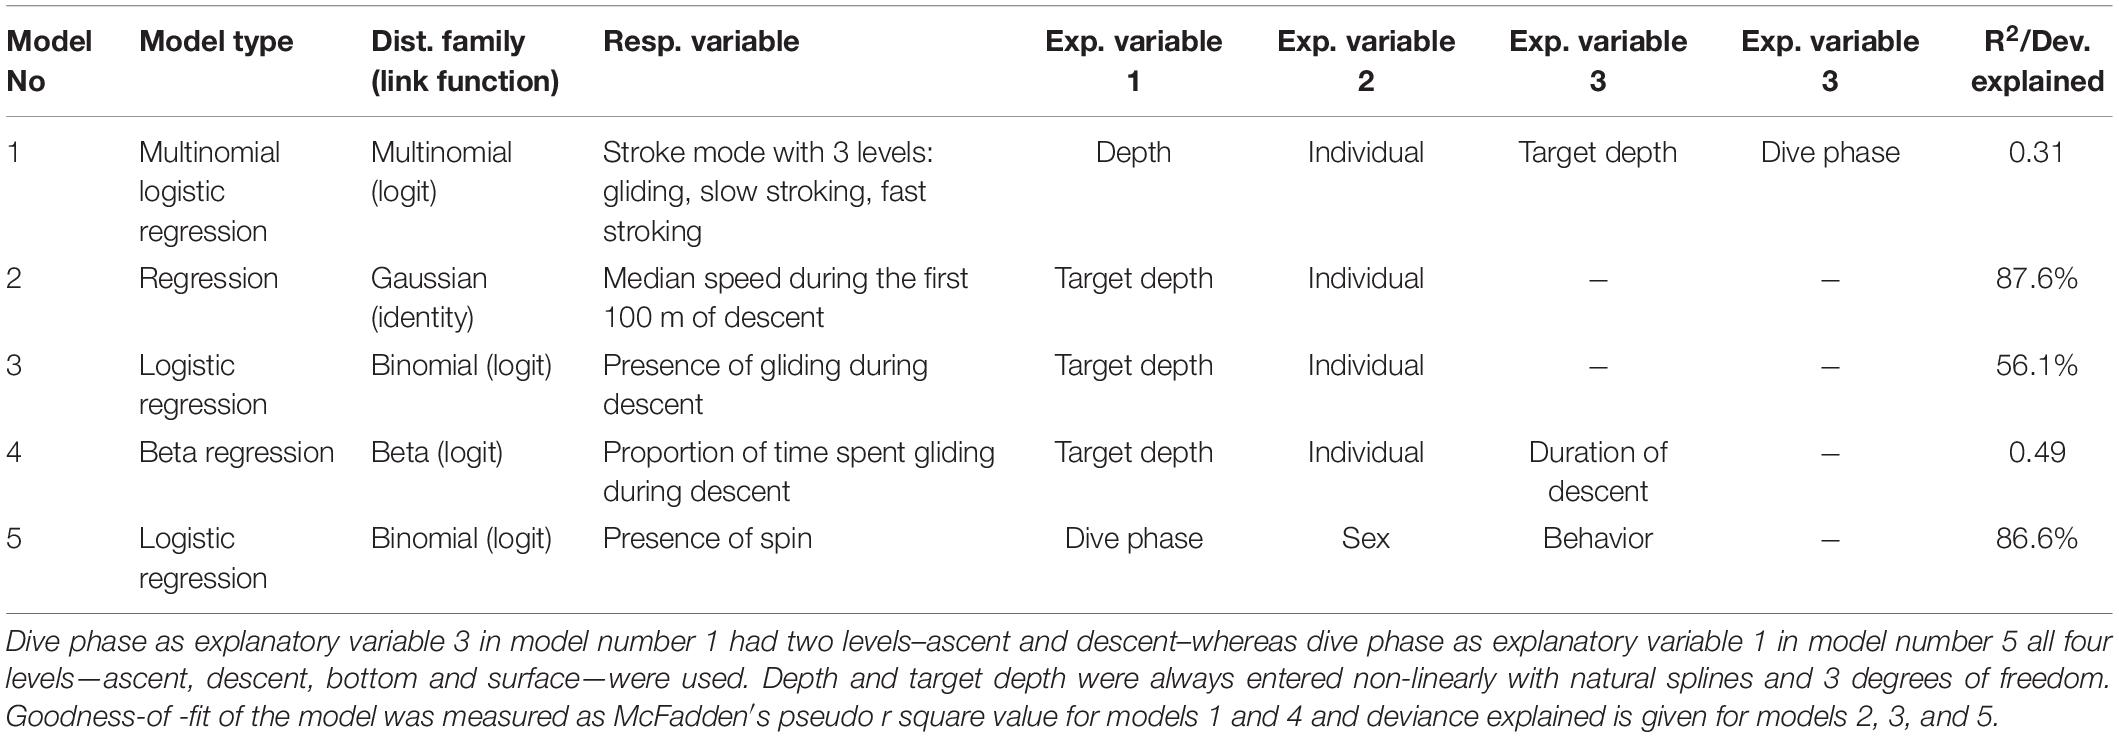
Table 3. Summary of the models with the best fit.
(1) The effect of dive phase, depth, target depth and individual on locomotion mode was modeled with a multinomial logistic regression as a multinomial response with a logit link, using the presence of a locomotion mode bout (gliding, slow stroking or fast stroking determined for every 20 s timeframe) as the response in a multinomial logistic regression, where dive phase (with two levels descent and ascent), depth, target depth and individual were entered as explanatory variables, with an interaction term between dive phase, depth and target depth. Depth was calculated as the mean depth of the 20 s timeframe in which stroking rates were determined.
(2) The effect of target depth on speed was modeled as a gaussian response with an identity link using median speed during the first 100 m of a descent of the dive as the response and target depth and individual as explanatory variable.
(3) The effect of target depth on the presence of gliding during descent was modeled as a binomial distribution with a logit link using presence of gliding as the response variable and target depth and individual as explanatory variables.
(4) The effect of target depth on the amount of gliding during descent was modeled as a beta distribution with a logit link using gliding rate during dives when gliding was present (calculated as proportion of time spent gliding during descent as percentage, with zeros removed) as the response variable and target depth, duration of descent, and individual as explanatory variables.
(5) The effect of sex, dive phase (descent, bottom, ascent, and surface) and behavior (foraging or non-foraging) on the spinning behavior, was modeled with a logistic regression with a logit link using the presence of a spin as a response, and sex, dive phase and behavior were entered as explanatory variables, with an interaction term between dive phase and behavior. The results of these models were presented as odds ratios, where odds ratios for dive phases were presented within each behavior type, and odds ratio for behavior were presented within each dive phase.
Results
General Diving Profiles of Narwhals
The length of Acousonde records varied between 1 h and 7 days 15 h (Table 1), and included a total of 3,236 surface intervals from 8 females (n = 1,975) and 5 males (n = 1,261) and 3,258 dives also from 8 females (n = 1,992) and 5 males (n = 1,266). The average duration of a surface interval was 10.3 min (SD 17.8 min) but it could last for up to 3 h 40 min (Table 2). The narwhals in this study spent on average 54% (SD 13%) of their time in the upper 20 m of the water column.
The deepest dive was 890 m (male 2019MM1, Table 2) but dives reaching depths below 800 m were rare both in females and males (Figures 3A,B and Table 2). One-third of the total number of dives were shallow, reaching depths less than 100 m and durations less than 5 min (33%, n = 1,093) (Figures 3A,B). A secondary peak in the dive distribution (23%, n = 752) was more pronounced in males although also present in females, and occurred between 300 and 550 m with durations between 10 and 20 min (Figures 3A,B). The longest dive lasted 23.6 min and was performed by female 2019MM2 (Table 2), which also had the highest estimated mass in this study. Mass in general, however, did not have an effect on dive duration or target depth. Proportion of time spent descending and ascending increased linearly from ∼250 m with increasing target depth with only little variation, whereas shallower dives than that had more variability in the proportion of time spent descending and ascending (Figures 3C,D).
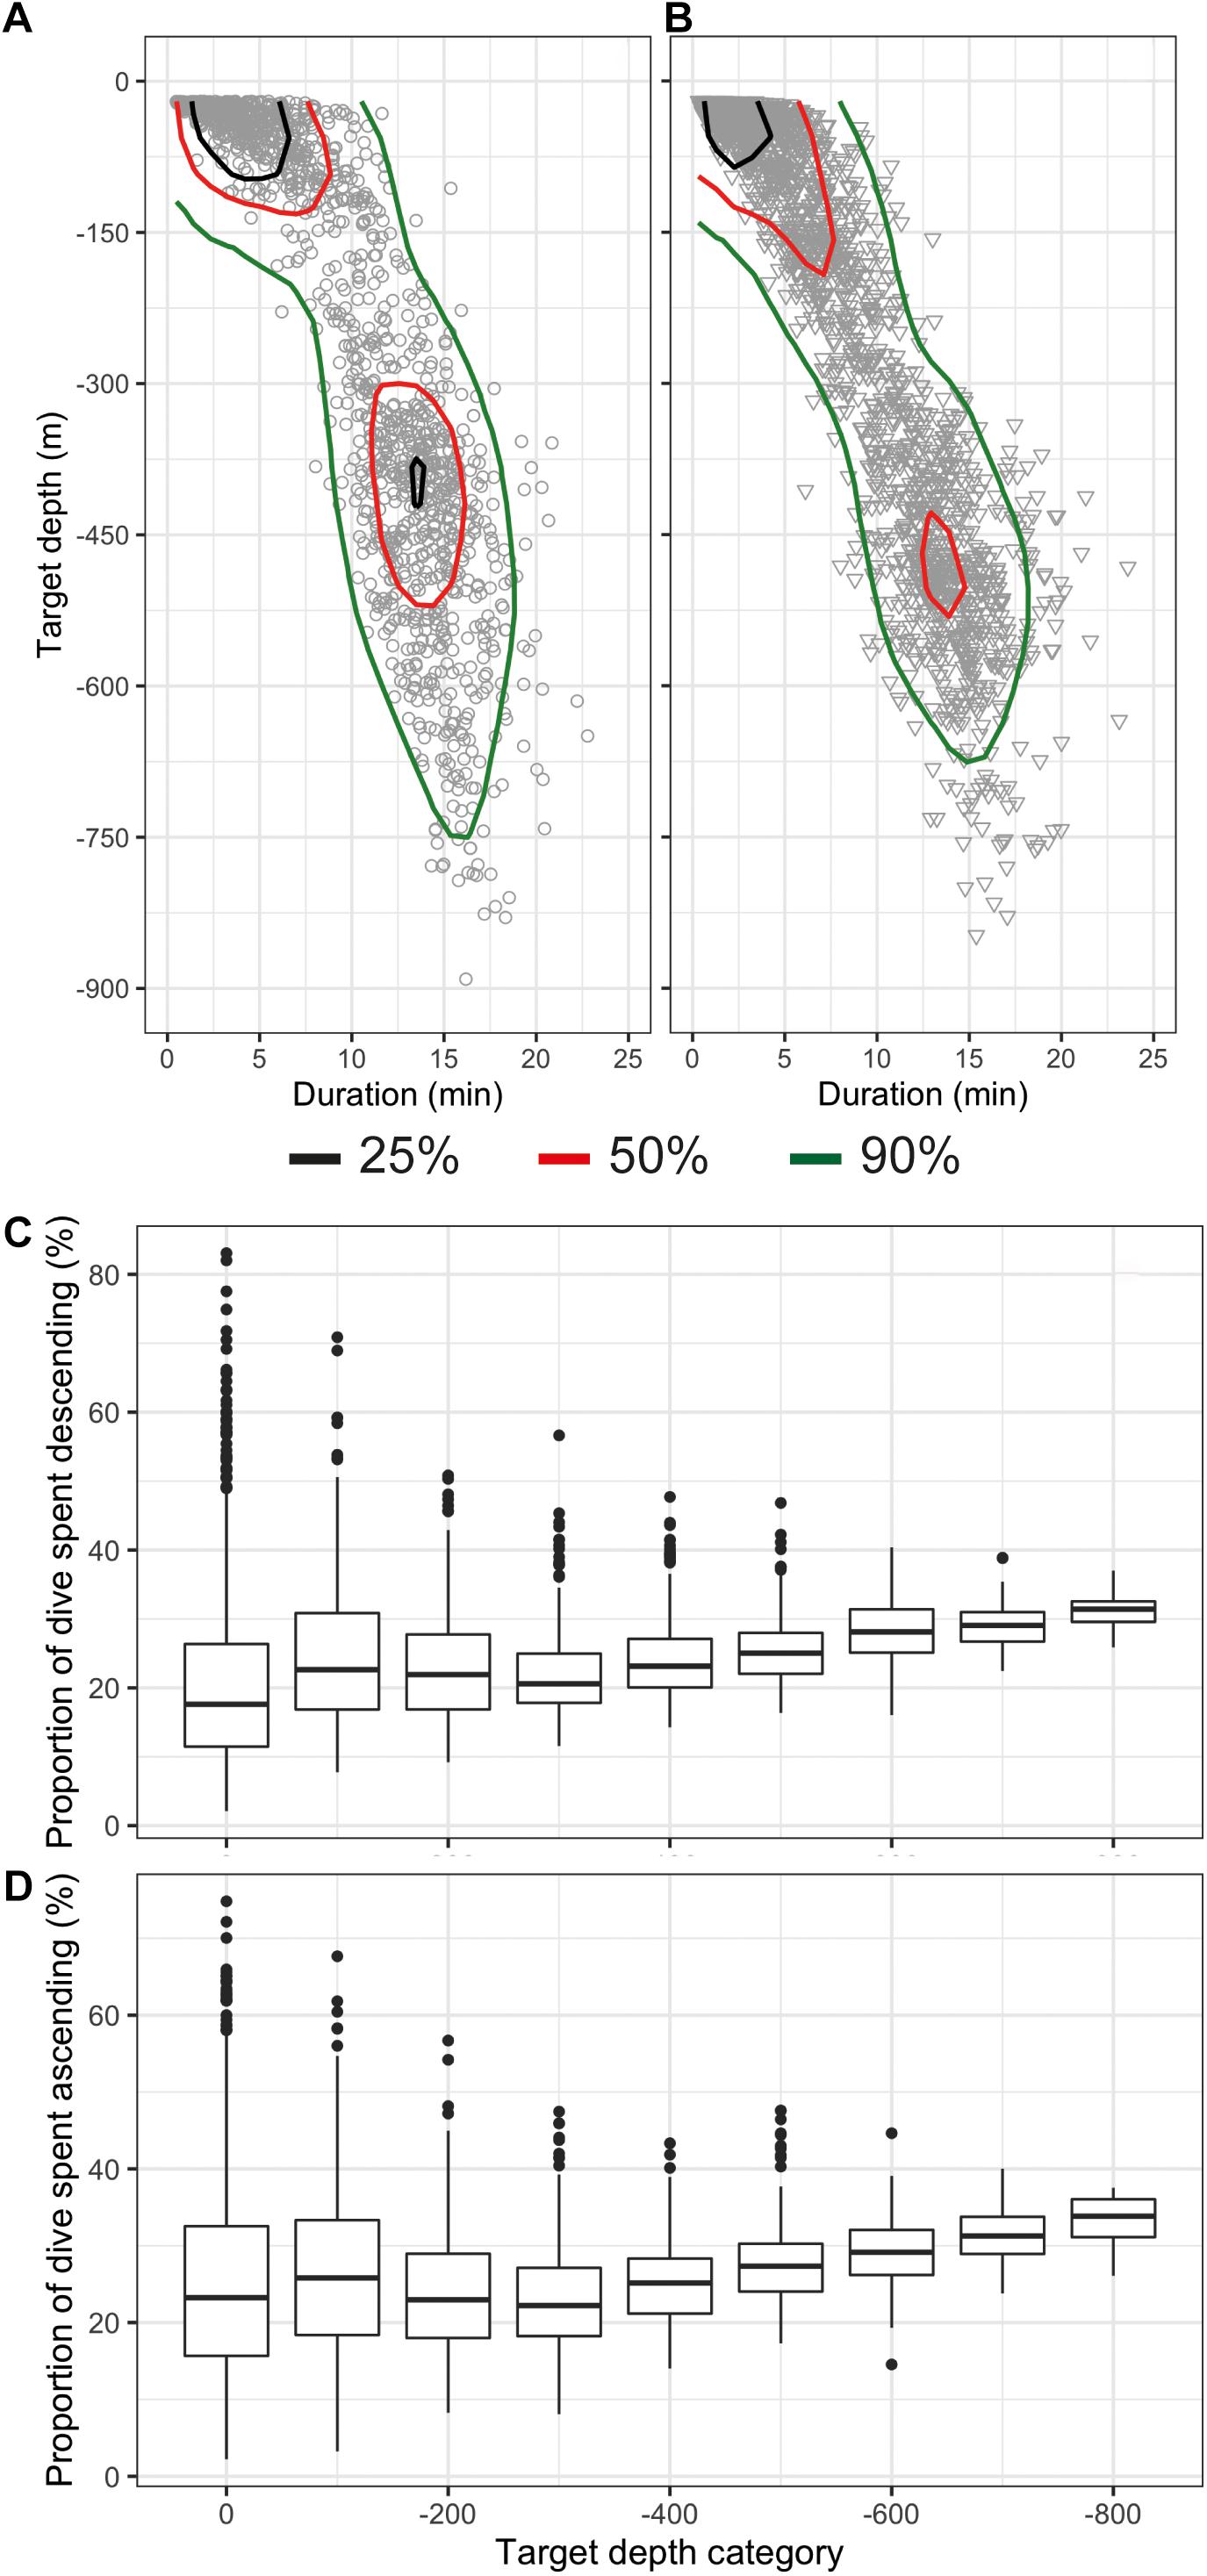
Figure 3. Distribution of dives as a function of target depth (m) and dive duration (min) shown as kernel quantiles for females (A) and males (B) and proportion of time spent descending (C) and ascending (D) of the total dive duration shown with boxplots. The target depth bin size is 100 m and the bin name denotes the maximum value of the bin.
Most of the dives were categorized as V dives (87%, n = 2,851, Table 2 and Figure 2A), where the animals spent on average 47% (SD 11%) of the total dive duration below 75% of the maximum depth. V-dives were on average deeper than U-dives as indicated also by the higher variability in proportion of time spent descending and ascending during shallow dives with maximum depths > −100 m leaving more time for moving horizontally within a certain depth stratum characteristic for U-dives (Figures 3C,D). The duration of the bottom phase of the U-dives (n = 407) was on average 4.9 (SD 3.6) min but could last up to 15 min. On average, 34% of the V dives and 21% of the U dives were related to foraging as indicated by the presence of buzzes (Table 2). The average buzzing rate of U dives of 4.4 (SD 2.6) buzzes/min was significantly higher than that for V dives (1.8 SD 1.3 buzzes/min, ANOVA, p < 0.001). For all foraging related dives combined (n = 1,082), buzzing rate during the bottom phase (3.1 SD 2.2 buzzes/min) was on average twice the rate during descent and ascent phases (1.5 SD 1.6 buzzes/min and 1.4 SD 1.9 buzzes/min, respectively, ANOVA followed by Tukey′s test, p < 0.001). On average, 89% of dives targeting 300–400 m were foraging-related, as indicated by the presence of buzzes, whereas all dives deeper than 600 m were solely related to foraging.
Stroking Rates at the Surface and During Descent, Ascent, and Bottom Phase
The stroking mode during the surface intervals was dominated by slow stroking rates of 20–26 strokes per minute (Table 2 and Figure 4A). Gliding was the least used stroking mode at the surface compared with the other stroking modes as would be expected due to the interrelationship between buoyancy, hydrostatic pressure and gliding behavior in marine mammals (Williams et al., 2000).
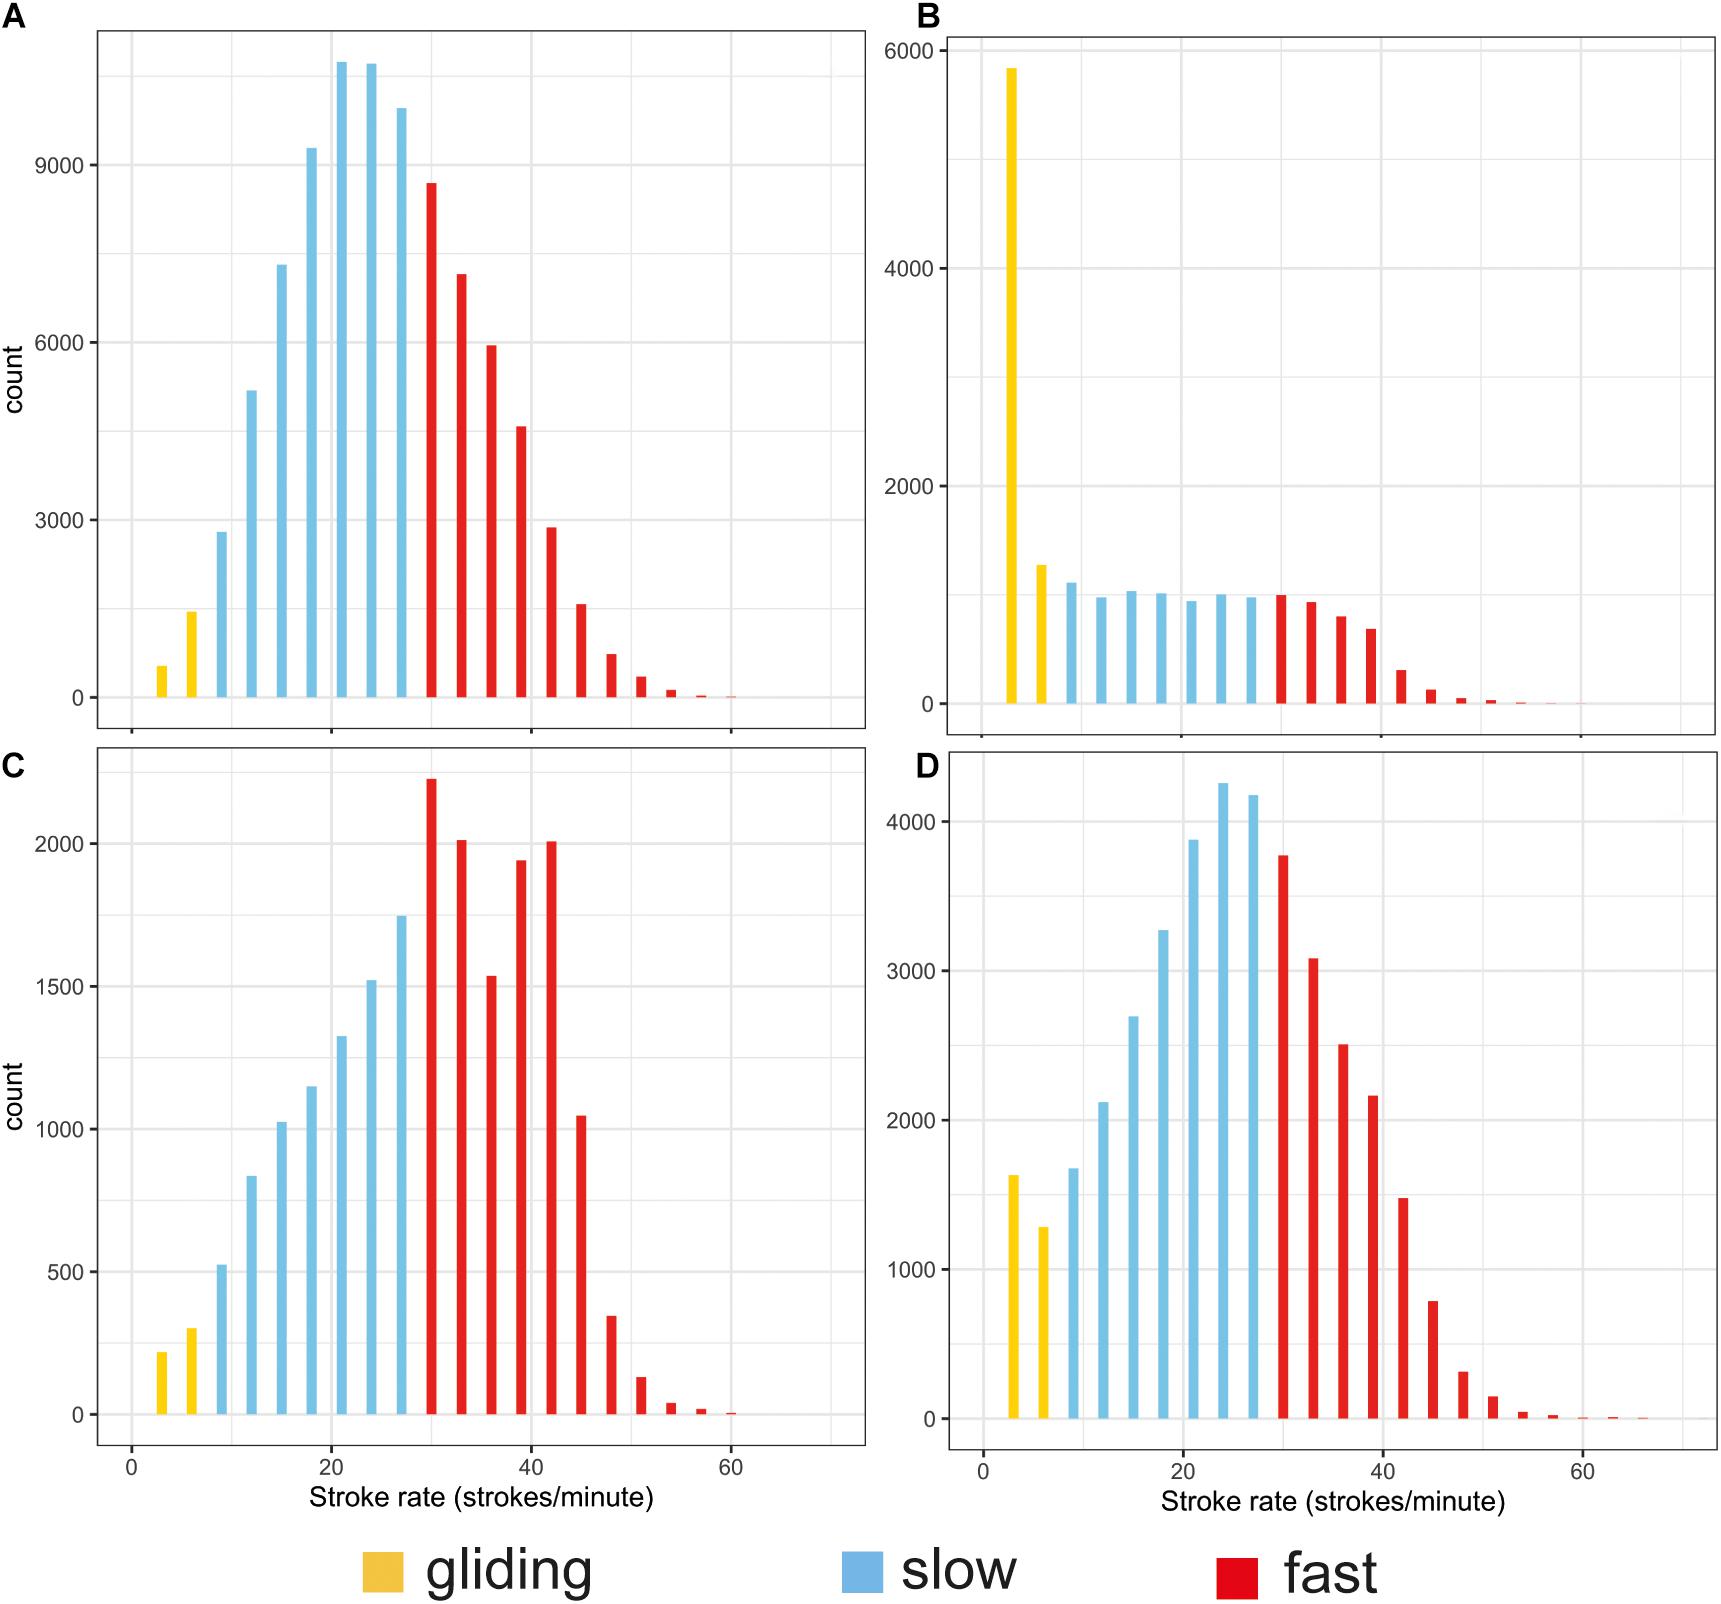
Figure 4. Histograms of the distribution of stroking rates during surface periods (A) and the descent (B), ascent (C), and bottom (D) phases of all dives. The different colors indicate gliding 0–6 strokes/min (yellow), low-rate stroking 7–26 strokes/min (blue) and high-rate stroking > 27 strokes/min (red). Note the different scales on the y axes.
There was a significant effect of target depth on the median speed measured during the first 100 m of a descent (p < 0.05, Figure 5A). After an initial decrease for shallow dives, speed increased with increasing target depth until ∼ 500 m, after which the speed leveled off to a constant speed between 1.5 and 2.25 m/s depending on the individual (Figure 5A). The mean swim speeds during descent and ascent, calculated when the animal was swimming near vertically at an angle of 75–90°, were similar for descents and ascents in both U and V-dives (2.2 m/s and 2.0 m/s during descent and ascent in U-dives and 2.1 m/s and 1.9 m/s in V-dives, Table 2).
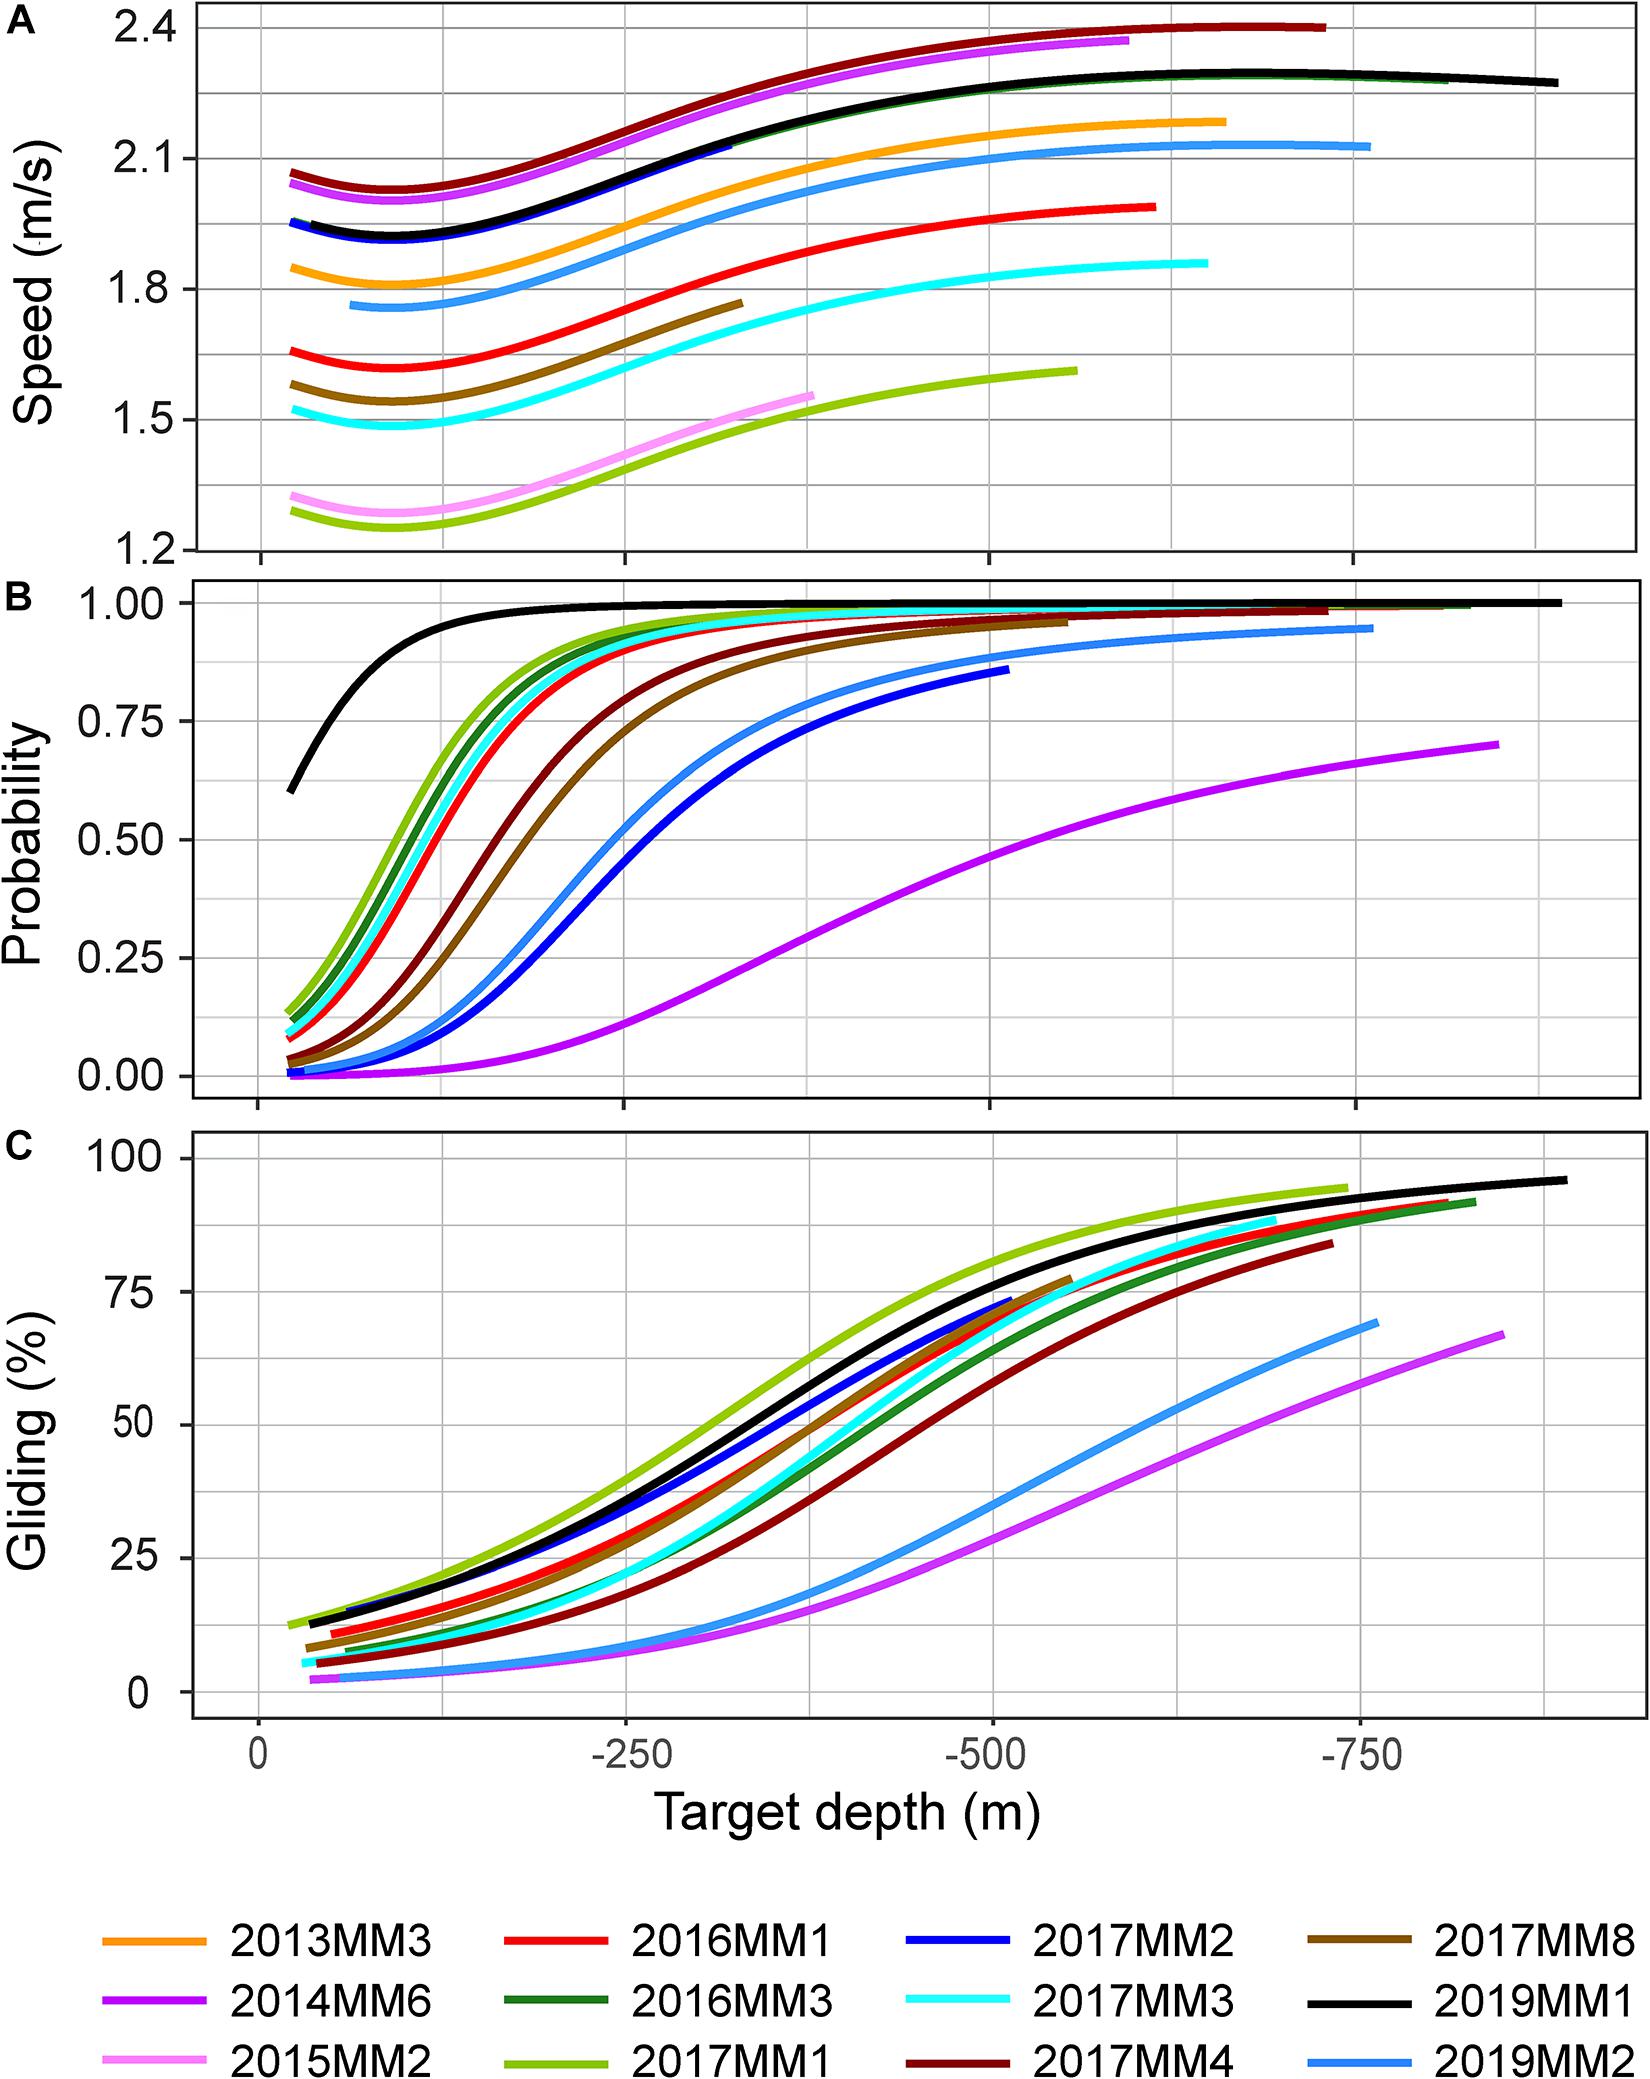
Figure 5. Model outputs for median speed during the first 100 m of a descent (A), probability for gliding during descent (B) and percentage of time spent gliding during descent (C) in relation to target depth of a dive. All individuals were included in A, apart from 2014MM5 due to small amount of data (< 1h). Animals with high resolution acceleration data, apart from 2014MM5, were included in B and C (see Table 2). The depth range of the model projections reflects the depth range of observations for each individual.
The stroking rates, however, showed a clear difference in the depth distribution of the different locomotion modes between descent and ascent phases of a dive (Figures 4B,C, 6). During descent, the animals were mainly gliding or stroking slowly (Figures 4B,C, 6). Depth had a significant effect on the stroking mode (p < 0.05, Figure 6). The probability of gliding increased rapidly at the start of the descent from 10 m to the 100–200 m depth interval, after which the probability of gliding remained more or less constant for the rest of the descent (Figure 6). There was also a correlation between the target depth of a dive and the probability for gliding as well as the amount of gliding during descent: target depth had a significant effect both on the probability of gliding and the percentage of time spent gliding during descent in all individuals (p < 0.001) (Figures 5B,C). The probability for gliding increased for all individuals with increasing target depth until about 250 m after which the probability remained at the highest level (Figure 5B). Individual 2014MM6, which was the second-smallest animal in this study, had the lowest probability for gliding (Figure 5B). Even if the amount of gliding varied between individuals, the trend with most gliding occurring during the deepest dives was present in all animals ranging from 50 to 95% of the duration of the descent phase (Figure 5C). Male 2019MM1, which was the longest and second-heaviest animal, glided most during descents (Figures 5B,C, 6). Female 2019MM2, that was estimated to have the largest mass, did not glide much during descents. Theoretically, this could have been due to a high fat content resulting in lower body density and thereby higher buoyancy.
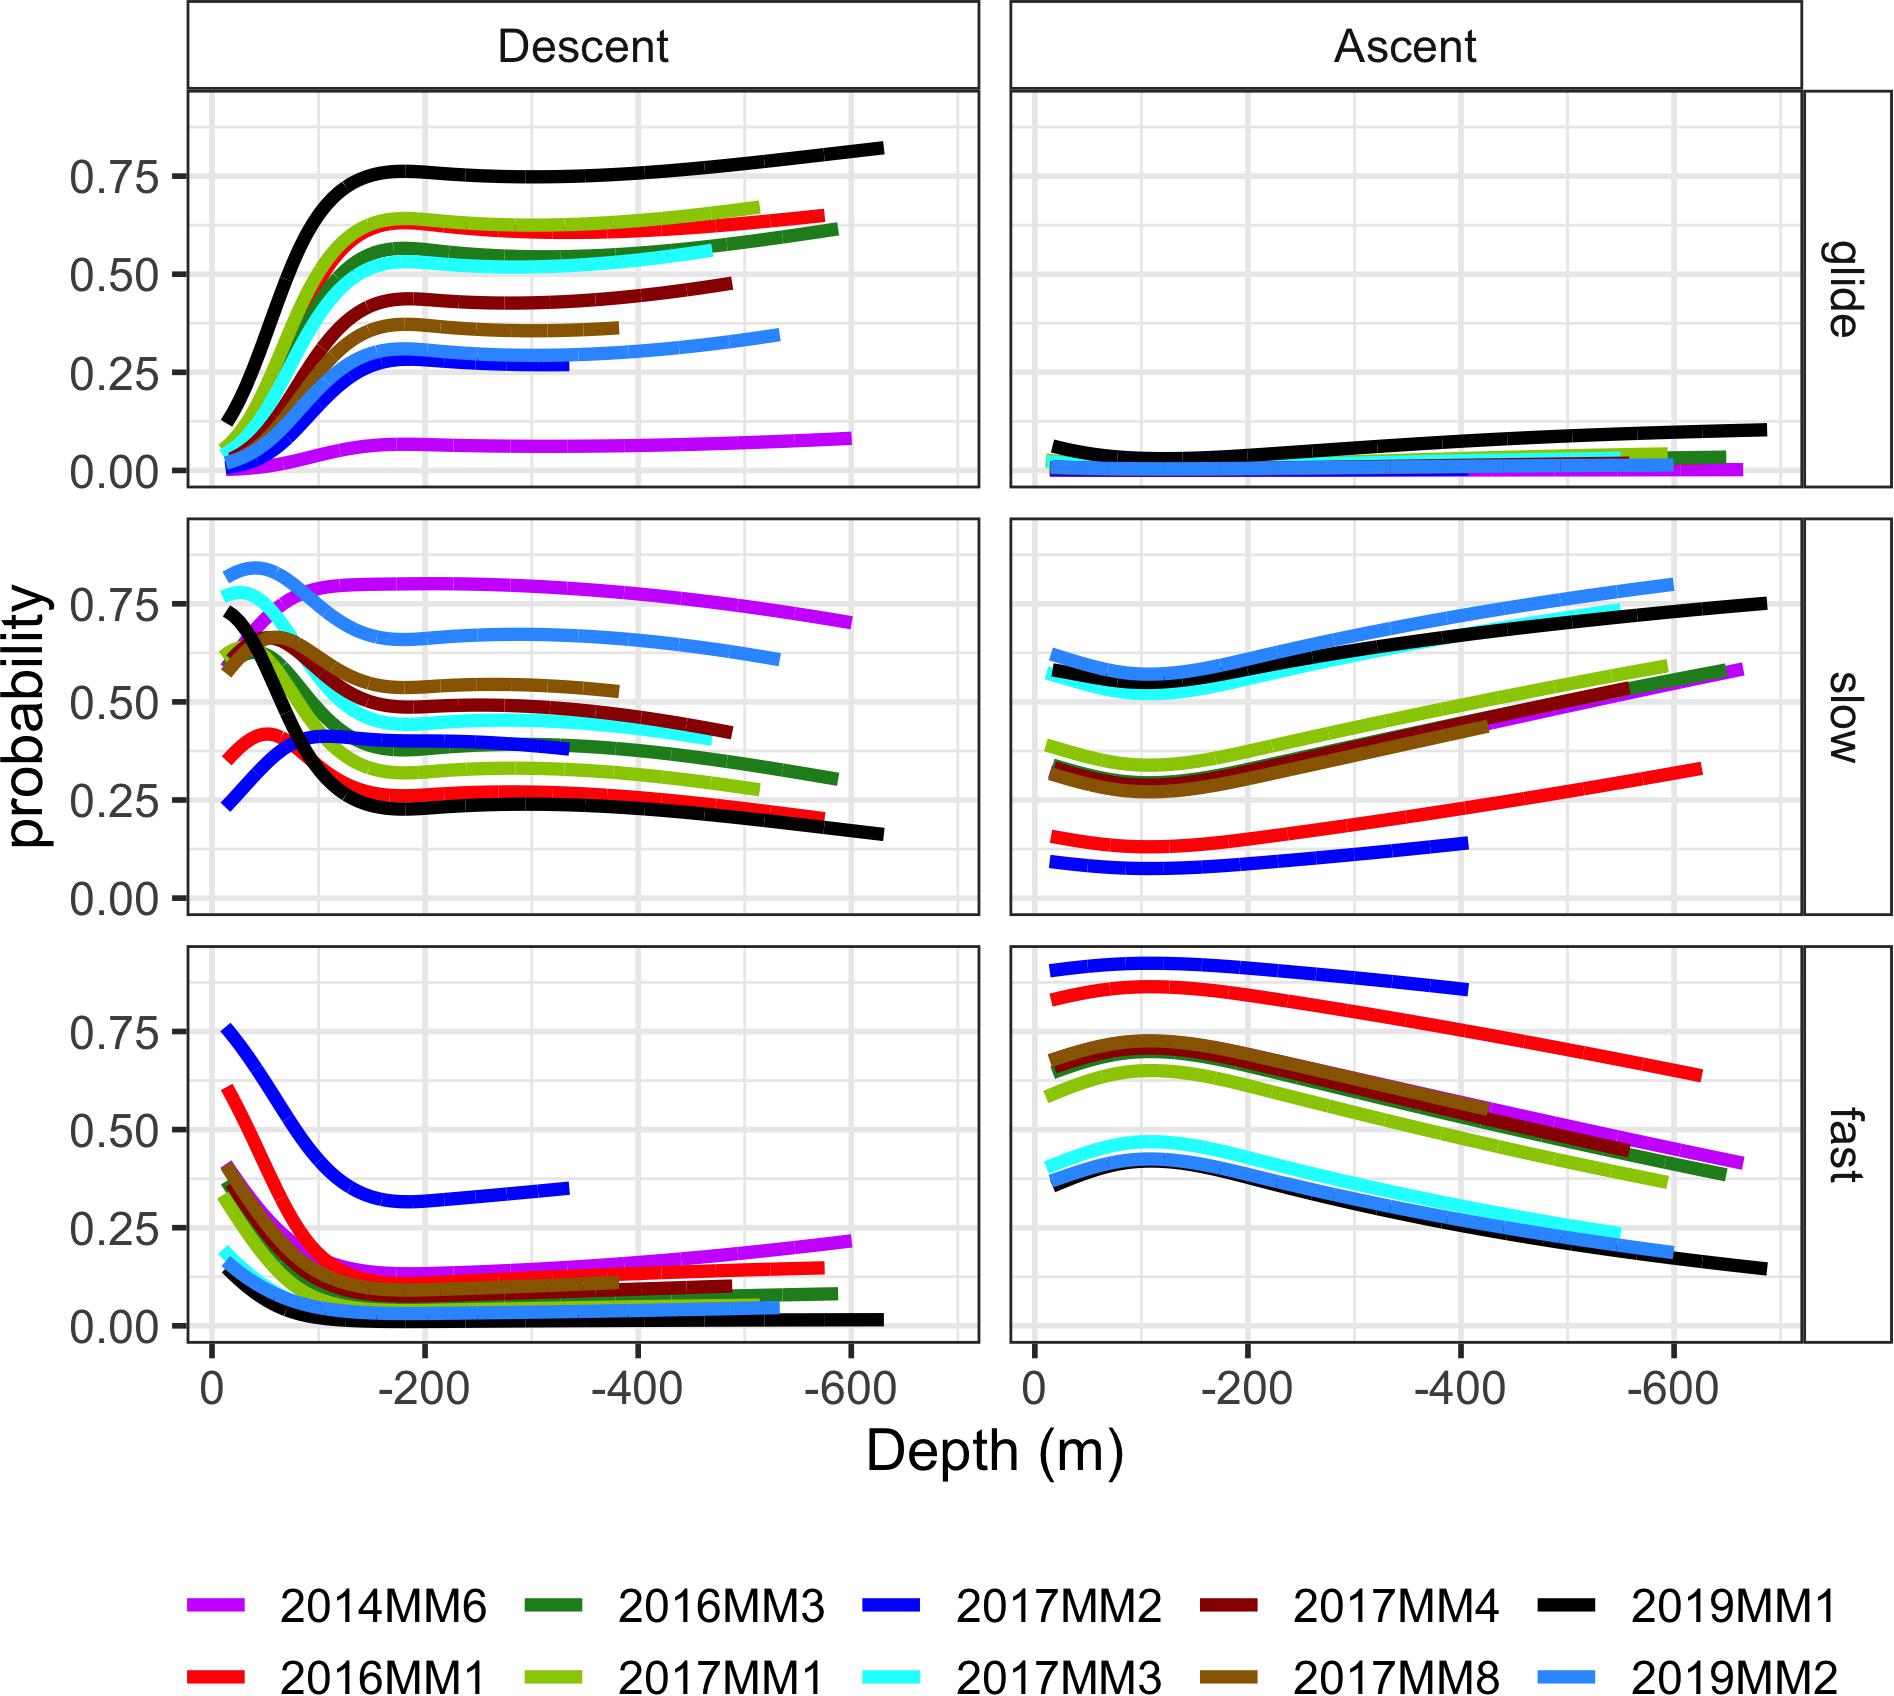
Figure 6. Model outputs for the probability of occurrence of the three stroking modes [glide, slow stroking (slow) and fast stroking (fast)] during ascent and descent in relation to depth (m). Each stroke bout lasted 20 s. The depth range of the model projections reflects the depth range of observations for each individual. Individual 2014MM5 was excluded due to small amount of data (< 1h).
The probability for slow stroking had a peak in all animals between 50 and 100 m depth after which the probability of it occurring increased with increasing depth (Figure 6). In some individuals, the probability of slow stroking was as high below 400 m, at the end of the descent, as it was during the initial peak, whereas for others the levels remained low for the rest of the descent.
There was in general a low number of fast stroking bouts during descents (Figure 4C), and the depth distribution of this stroking mode was the mirror image of that of gliding (Figure 6). Where the probability for gliding increased at the start of the descent, the probability for fast stroking decreased and remained low during the rest of the descent at deeper depths.
In contrast to the descent, fast stroking rates between 30 and 45 strokes/min were common during ascent (Figure 4C). There was some individual variation, but the general trend was a high probability of fast stroking close to the surface and at shallow depths after which the probability of fast stroking decreased with increasing depth (Figure 6). The other characteristic of ascent was the low level of gliding: the probability of gliding was low at all depths throughout the ascent in all individuals (Figures 4C, 6). The probability of slow stroking during ascent was similar to the level during descent. There was, however, no peak in probability of slow stroking at the shallow depths—instead the probability of slow stroking increased toward the end of the ascent (Figure 6).
In addition to the smaller amount of gliding during ascent compared with descent, there was also a difference in the duration of continuous gliding bouts (Table 4). The animals used an alternating stroking and gliding gait during both descent and ascent, however, the gliding bouts were significantly longer during descent compared with ascent (ANOVA, p < 0.001). The average duration of a gliding bout during descent was 1.6 (SD 1) min whereas during ascent, the animals glided continuously only on average 0.6 (SD 0.3) min (Table 4). The maximum duration of a gliding bout during descent lasted 5.7 min (Table 4).
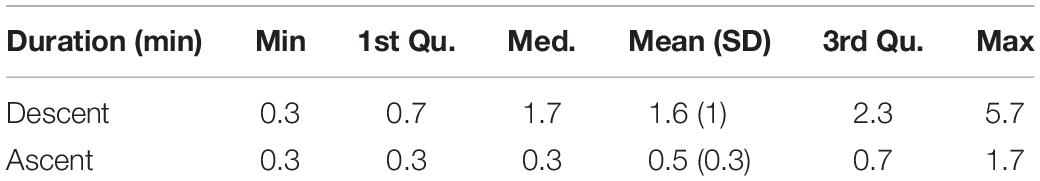
Table 4. Duration (min) of continuous gliding bouts during descent and ascent.
Stroking rates during the bottom phase resembled those at the surface (Figure 4D vs. Figure 4A), with most stroking at rates of 15–37 strokes per minute and a peak around 27 strokes/min. The only difference between stroking at the surface and in the bottom phase was that the latter had proportionally more gliding.
Spinning Behavior
Spinning was part of the behavior of the whales during all the different phases of both foraging and non-foraging dives including the surface, but there were, however, some differences (Table 5). During foraging, spinning had 2.34 times higher odds during the bottom phase of the dive compared with the ascent phase (Table 5). The second largest odds for spinning was during the descent phase, whereas spinning had the smallest odds for occurring at the surface (Table 5). During non-foraging, however, the largest odds for spinning of 2.13 was during the descent phase implying that whales were spinning relatively more during the descent than at the bottom phase compared with the ascent as opposed to during foraging (Table 5).
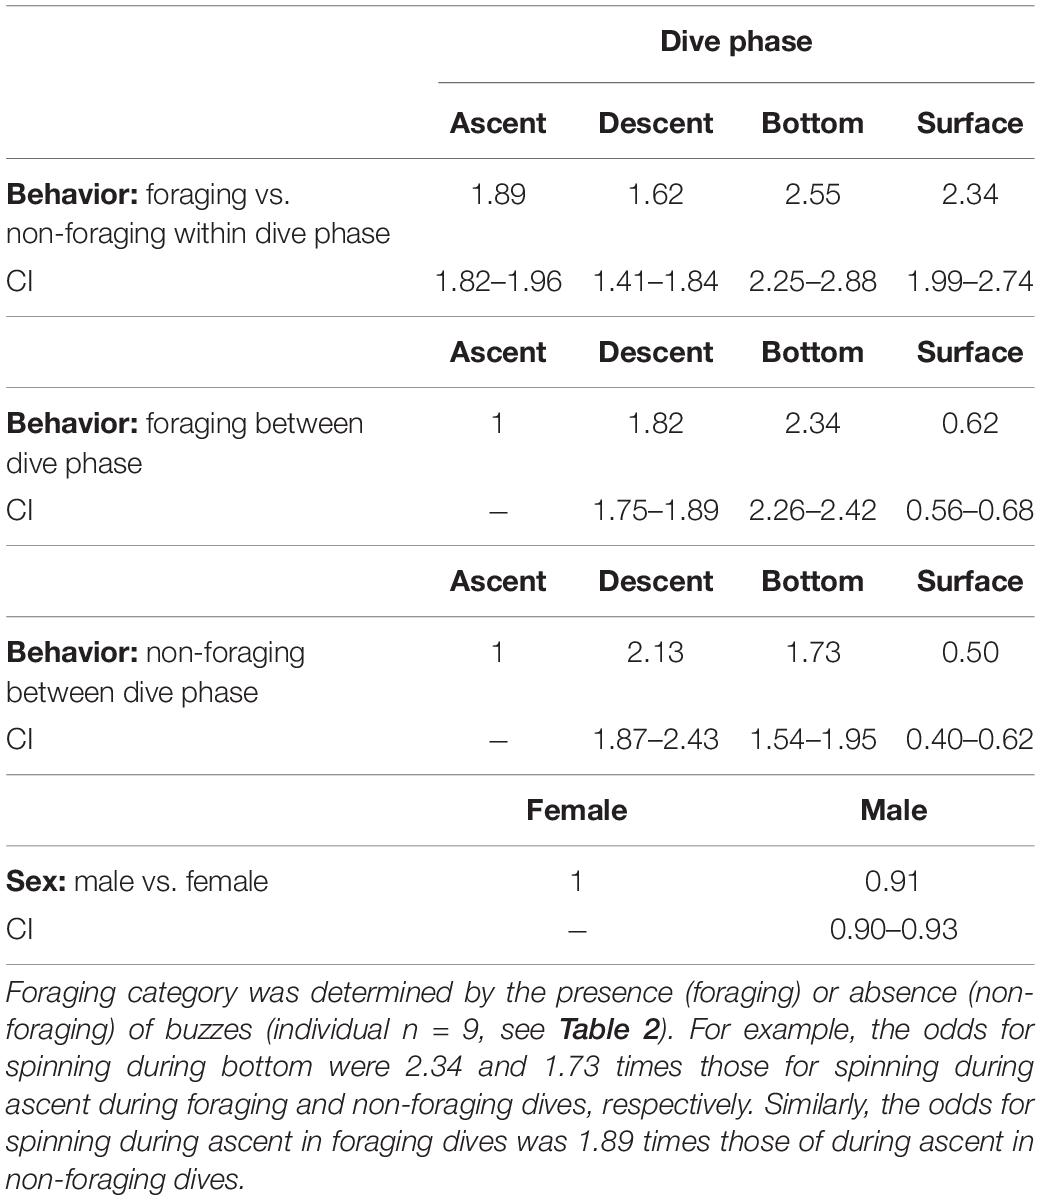
Table 5. Odds ratios for the occurrence of spinning during the four dive phases (descent, ascent, bottom, and surface) during foraging and non-foraging events and for males and females.
Furthermore, spinning was much more common during foraging events than during non-foraging events during all the different dive phases. The odds for spinning in the bottom phase during foraging was almost 3 times higher than in the bottom phase during non-foraging (Table 5). Similarly, the odds for spinning during ascent and surface were approximately twice as high (1.89 and 2.34) during foraging as during the corresponding non-foraging dive phases (Table 5). The increase in odds between foraging and non-foraging events during the descent phase was the smallest compared with during the rest of the dive phases: the odds for spinning during descent during foraging were only 1.62 times those during descent on non-foraging dives, indicating that foraging did not increase spinning during descent to the same extend as during the rest of the dive.
The odds for spinning for males were slightly smaller than for females (Table 5).
Behavioral Categories
The bcpa analysis identified 87.3 h of tortuous trajectories and 105.2 h of transiting trajectories from horizontal tracks of the three narwhals (altogether0 193 h of data) used in the analysis (Supplementary Table S2). These trajectories could be divided into 159 stationary foraging events, including dives and surface intervals (46% of the duration of the tortuous trajectories), 166 transiting foraging events (41% of the duration of the transiting trajectories), 335 stationary non-foraging events (54% of the duration of the tortuous trajectories) and 368 transiting non-foraging events (59% of the duration of the transiting trajectories, Table 6). Surface intervals contributed most to the non-foraging categories (77 and 76% of the events for tortuous and transiting, respectively) which also explained the significantly lower average maximum depths compared with events in the two foraging categories (ANOVA followed by Tukey’s test, p < 0.001, Table 6). Stationary foraging dives were shallower than transiting foraging dives (Figure 7, ANOVA, p < 0.001) and the buzzing rate within stationary foraging dives was on average twice as high as during transit foraging dives (ANOVA, p < 0.001). Stroking rates during surface intervals and during the different dive phases did not differ between categories. Locomotion methods, however, differed between foraging and non-foraging events, the first having on average longer gliding bouts and thereby shorter stroking bouts than the latter. The longest continuous stroking bout lasted 84.7 min and was performed by a non-foraging transiting whale.
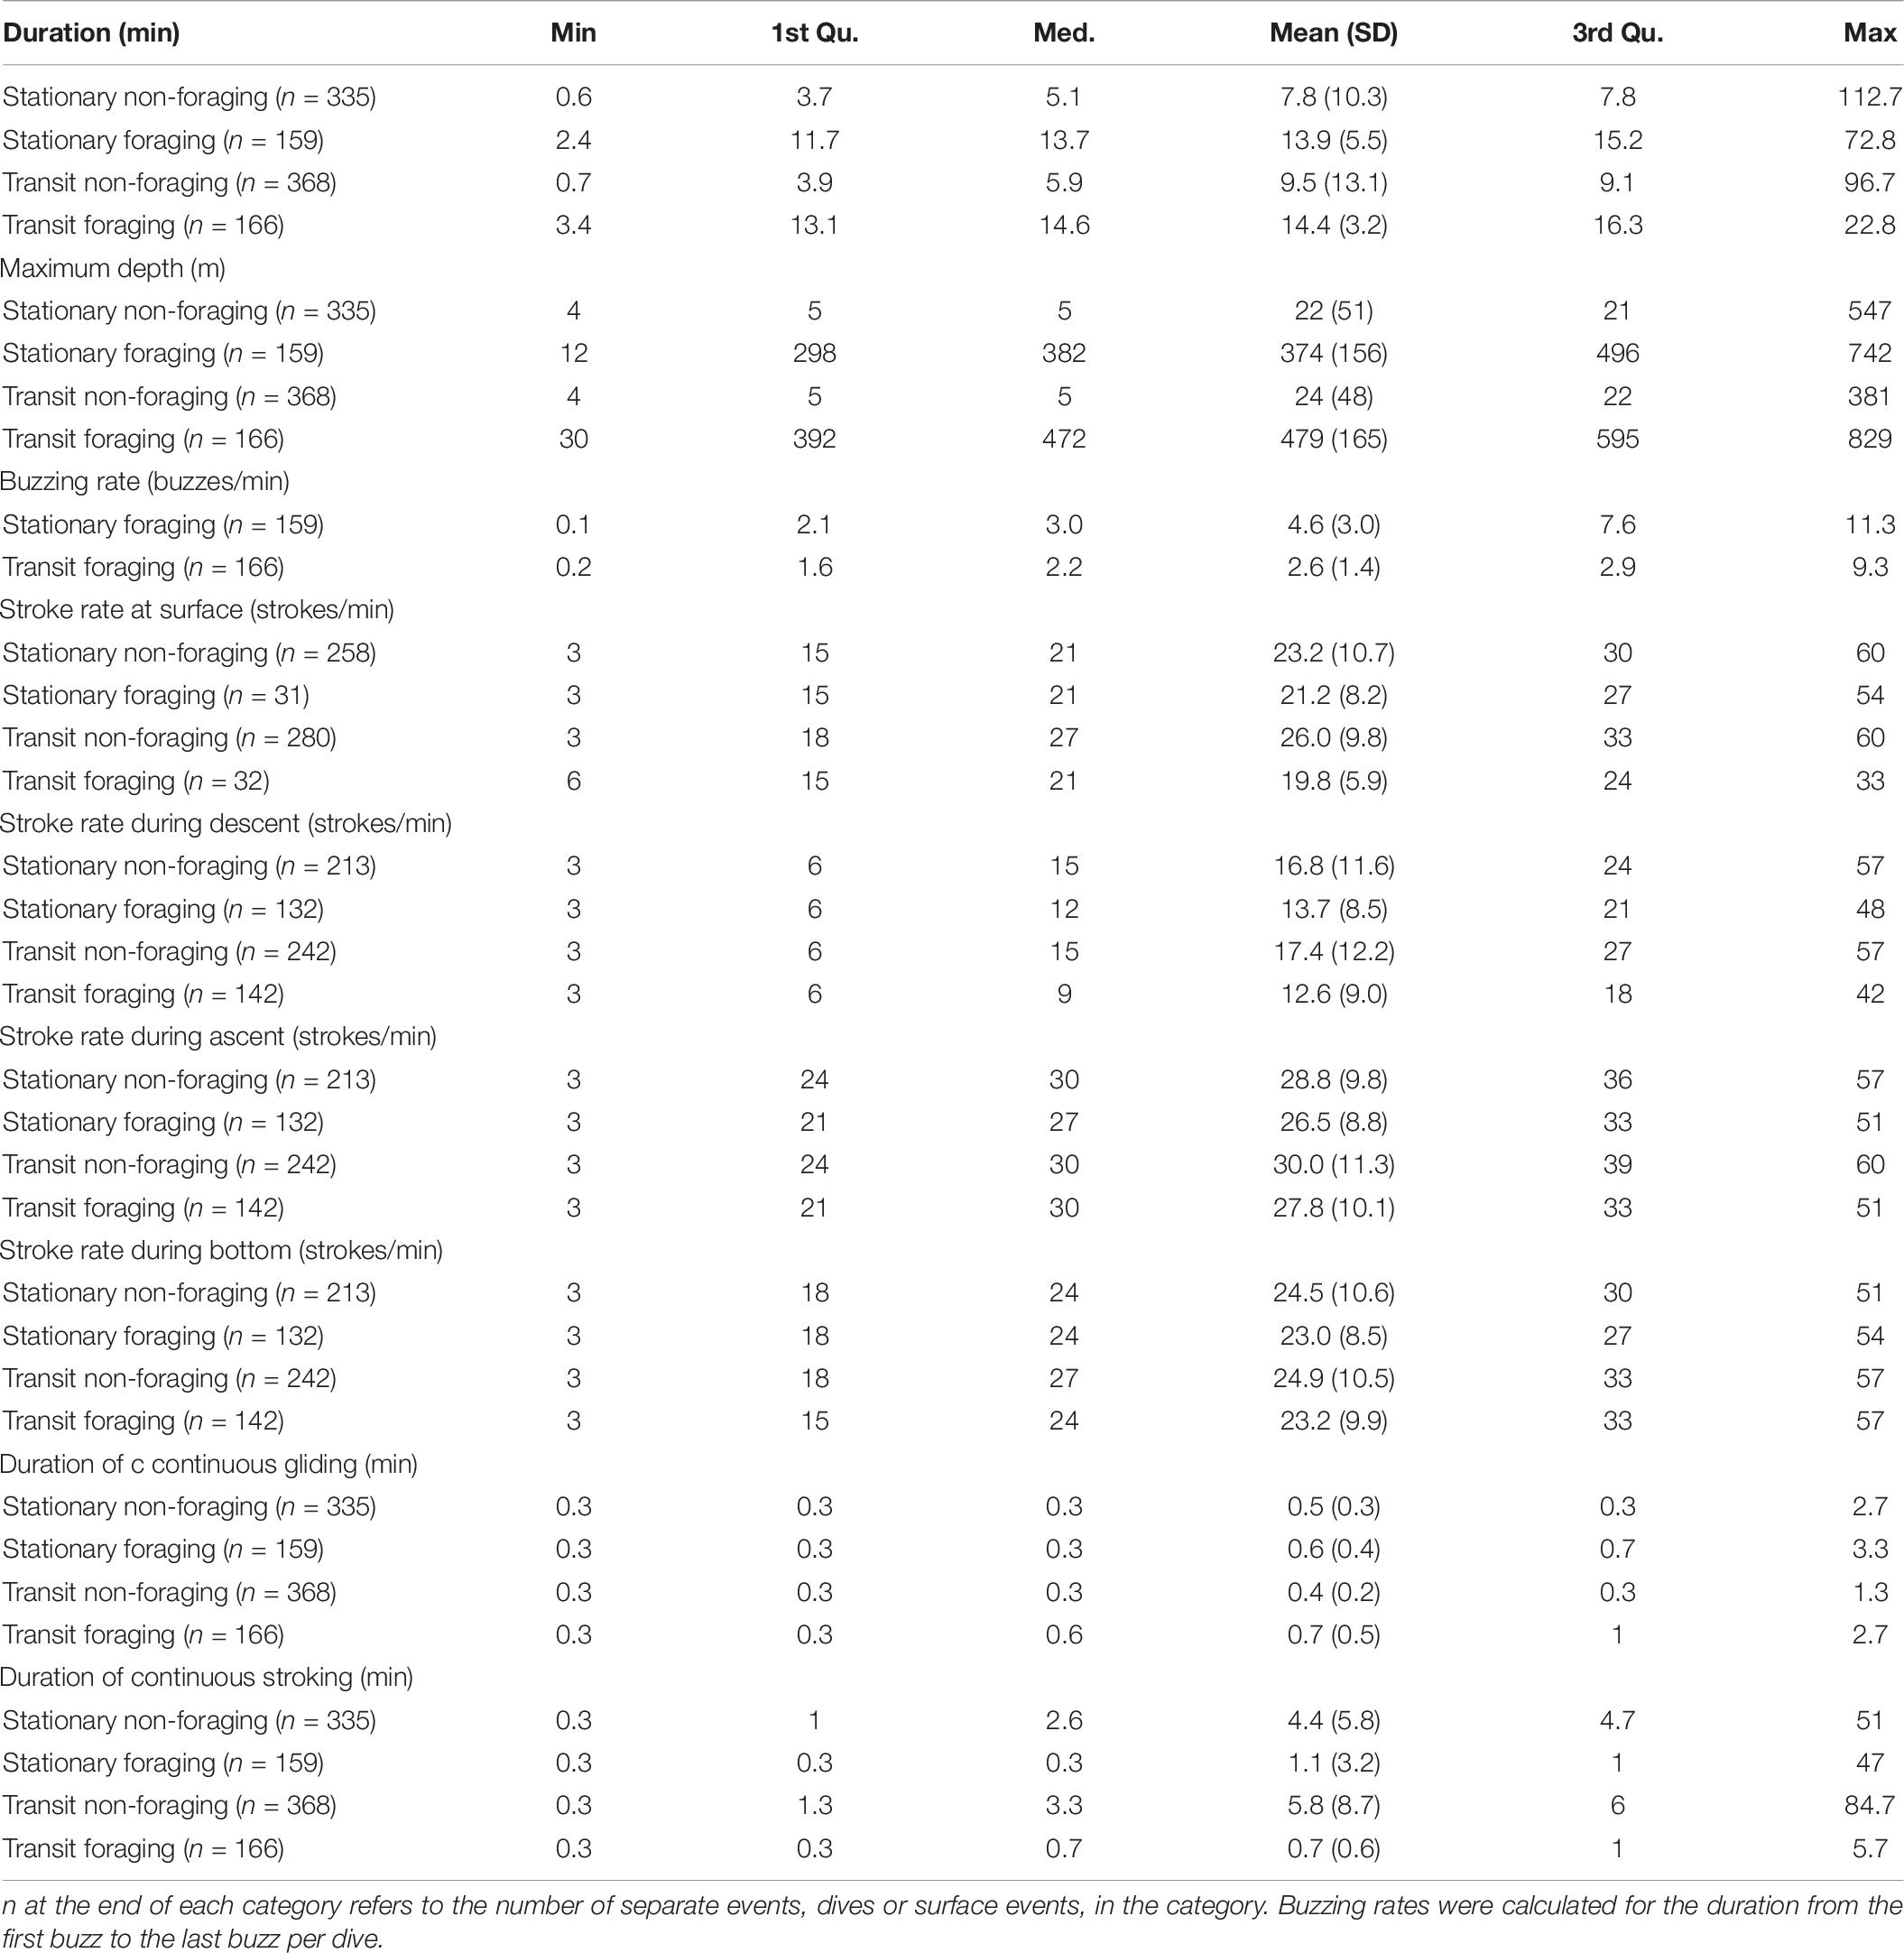
Table 6. Descriptive statistics for bcpa behavioral categories.
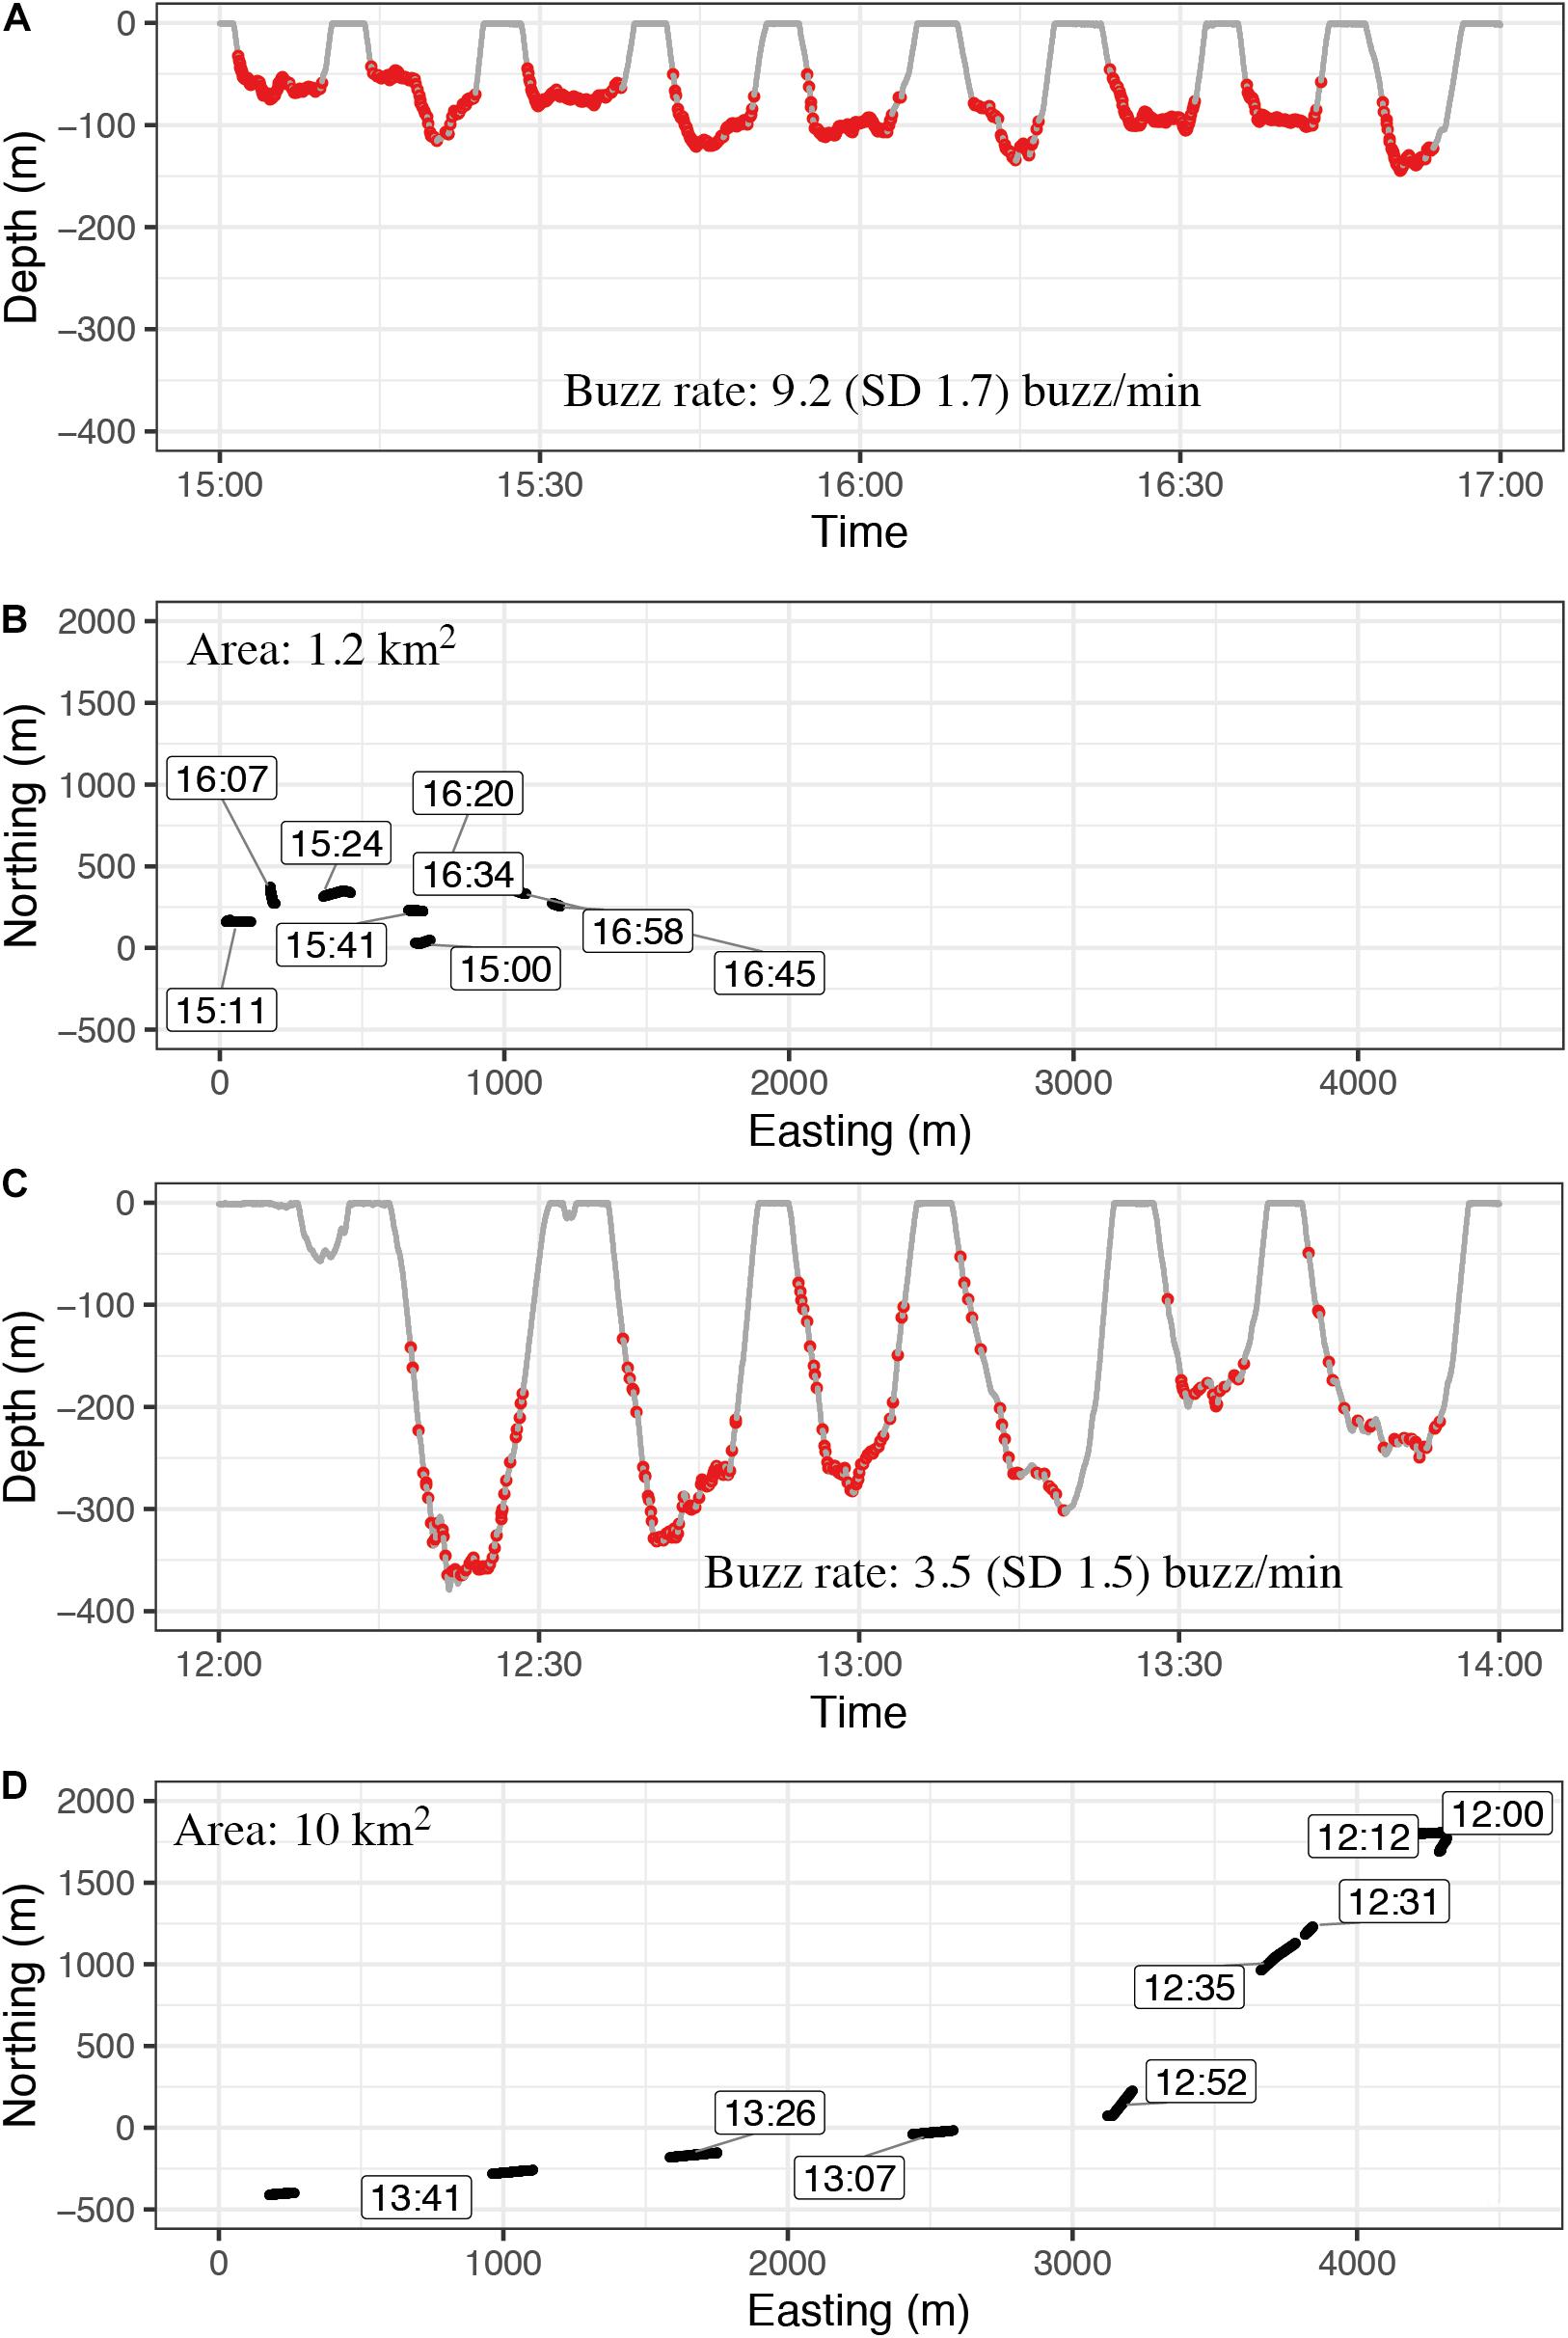
Figure 7. Examples of diving and buzzing behavior while the animal is circling a small area (stationary foraging category) (A,B) and foraging while transiting through a larger area in a fast and directed manner (C,D). All windows have a length of 2 h. Buzzing rate was calculated for the duration from the first buzz to the last buzz per dive. The average buzzing rate during stationary foraging events (A,B) was on average double as high as during transient foraging (C,D) (Table 4). These examples are sections from stationary phase with rank 4 and transit phase with rank 10 from individual 2017MM3 (Supplementary Table S2).
Discussion
Narwhals in this relatively short duration study conducted in August 2013–2017 and 2019 dove regularly to depths below 600 m with the deepest dives extending below 800 m, which agrees with previous findings from this and other populations (Heide-Jørgensen and Dietz, 1995; Watt et al., 2015; Ngô et al., 2019). Dive durations were also similar to results from previous studies on narwhal diving behavior (Martin et al., 1994; Heide-Jørgensen and Dietz, 1995; Laidre et al., 2002; Ngô et al., 2019). The higher variation in dive duration among shallow dives above 300 m compared with deeper dives below that depth was also found by Ngô et al. (2019). Both sexes performed deep, long dives, and no evidence of dive differences that could be attributed to sex or size of the individual were found. The deepest and longest dives were, however, performed by the largest animals in both sexes but on average, the target depth was not affected by mass of the individual. Large animals have a greater diving capacity due to larger oxygen stores (Schreer and Kovacs, 1997; Kooyman, 2009), which enables them to reach deeper depths than their smaller conspecifics. Male narwhals have been shown via stable isotope analysis to feed more on the benthos than females (Watt et al., 2013), which is an indirect proof of males diving deeper than the females. Male narwhals in East Greenland tend to be larger than females (Garde et al., 2015) and even if no differences in the diving performance between males and females nor related to mass were found in this study, it is possible that a sexual segregation in dive depth is present at the winter offshore habitat of the Scoresby Sound narwhal population, where the whales occasionally dive down to 1,500 m depth (Heide-Jørgensen et al., 2015). The lack of effect of mass on dive duration implies, that the dive duration of the dives in Scoresby Sound fjord system is affected by, for example, the distribution of prey, rather than the dive capacity of the whales.
Deep diving species by necessity must balance submergence time and level of exercise during breath-holding: a low activity level preserves oxygen stores and allows longer duration submergence whereas high activity levels consume oxygen quickly and shorten submergence time. Consequently, reaching a target depth hundreds of meters below the surface presents a challenge in terms of speed vs. duration that is dictated by metabolic demand and the rate of depletion of oxygen stores. We found that the narwhals in this study were shown to utilize the same energy-saving locomotor measures during descent as described previously for other cetaceans (Skrovan et al., 1999; Williams et al., 2000): a higher probability of gliding together with an increase in the percentage of time spent gliding with increasing target depth. During descent, the probability of gliding increased until a constant high level was reached between 100 and 200 m depth whereas the probability of in particular fast stroking decreased to a constant low level during the first 100 m of the water column. This indicates that narwhals in this study were positively buoyant near the surface, above 100–200 m depth. With increased depth the animals would reach the point of neutral to negative buoyancy when the lungs likely collapsed and promoted a sink-and-glide, low energy locomotion through the water column (Skrovan et al., 1999; Williams et al., 2000; Nowacek et al., 2001). During descent, the greater variation between individuals in the probabilities of gliding and slow stroking vs. fast stroking could imply that the high energetic cost of fast stroking constrained the use of this locomotion mode. Other factors, such as the buoyancy of the animal, target depth, or behavior (e.g., foraging, traveling) might also influence the use of gliding and slow stroking.
The likelihood of negative buoyancy at depth in narwhals was further demonstrated by the low level of gliding and the high levels of active stroking during the ascent, suggesting that the whales needed to swim actively to overcome negative buoyancy while reaching the surface. Gliding during ascent was therefore most likely restricted by the negative buoyancy of the animals at depth and consequently showed only little variation between individuals. In contrast, behavioral state, target depth or the size of oxygen reserves, discussed below, might have played a role during ascent in the use of fast and slow stroking modes, resulting in higher levels and greater individual variation in these locomotion modes.
The very end of the ascent can be considered as the most critical part of a dive: the partial pressure of oxygen decreases dramatically both due to sustained metabolic consumption and the rapid decrease in pressure (Kooyman, 2009). North Atlantic right whales Eubalaena glacialis have been shown to glide extensively during the latter part of the ascent facilitated by positive buoyancy from 80 to 30 m below the surface (Nowacek et al., 2001). Despite the indication that narwhals in this study were also positively buoyant near the surface, similar extensive gliding at the end of the ascent could not be detected. Gliding as a locomotion mode especially during ascent, can be considered either as an energy saving measure or evidence of near-depleted oxygen storages. The fact that narwhals in this study had a high probability of active stroking also at the end of the ascent close to the surface, conveys the message of them having sufficient reserves of oxygen for exercise even at the very end of the dive. This was also evident by the dive duration: the 75% quantile dive duration of 13.4 min for the deeper V-dives was well within the estimated aerobic dive limit of 21–24 min for adult narwhals (Williams et al., 2011).
Our results also showed a general positive correlation between median speed during the first 100 m of the descent and increasing target depth. This finding could be a result of narwhals planning their dives beforehand as shown for other cetaceans (Skrovan et al., 1999; Williams et al., 2015; Elmegaard et al., 2016; McDonald et al., 2018). It is likely that 1.5–2.5 m/s vertical speed of narwhals presents a limit after which an increase in speed is either not energetically efficient, or not sustainable. In part this may be due to the unique locomotor muscles of this cetacean. Narwhals are adapted to slow endurance swimming, with a high proportion of slow twitch muscle fibers in the major locomotor muscles used for swimming (Williams et al., 2011); therefore, this species appears to be bound to a relatively narrow range of speeds compared with many other odontocetes (e.g., Johannessen and Andharder, 1960; Fish, 1998; Aguilar Soto et al., 2008).
It is noteworthy, that narwhals were capable of maintaining similar vertical speeds during gliding and active stroking. Due to a similar finding in bottlenose dolphins Tursiops truncatus, Skrovan et al. (1999) concluded that speed was a relatively poor indicator of aquatic effort and this needs to be considered when assessing energetic costs in diving marine mammals, as the energetic costs of each swimming style, gliding, and active stroking, will be different. Another metric overall dynamic body acceleration (ODBA), has successfully been used as a proxy for the energy expenditure of locomotion in certain animals (Wilson et al., 2006; Pagano and Williams, 2019). ODBA is calculated by summing the acceleration in the three dimensions (Wilson et al., 2006), and it captures essentially the magnitude of body acceleration at a given time regardless of its direction. In swimming marine mammals, the interpretation and use of ODBA, however, presents a problem: active stroking and spinning along the longitudinal axis of the body can both result in high ODBA values, but again, the energetic consequences of each may be very different. During a stroke the tail fluke can replace a proportionally bigger quantity of water than during a longitudinal spin. Hence, the energy requirements of the former likely exceed the latter. Spinning is an integrated part of narwhal swimming behavior (Dietz et al., 2007, this study) and is commonly performed especially during descents and the bottom phase. As a consequence of this, the combination of high-rate spinning and low-rate stroking during descent can result in similar ODBA values as the opposite combination of low-rate spinning and high-rate stroking during ascent. For narwhals, ODBA is therefore potentially a poorer estimator of the energetic cost of descent and ascent for narwhals than stroking rate.
Most of the dives in this study were categorized as V-dives characterized by the proportionally little time spent at the bottom of the dive. As the vast majority of deep dives below 300 m were used for foraging, this strategy was most likely related to the distribution of prey. The notion of scattered distribution of prey was further supported by the fact that buzzing was initiated already during the descent and continued during the ascent, even if the buzzing rate was on average highest at the bottom of the dive. The bcpa analysis revealed, however, another layer in foraging behavior that suggested a patchy distribution of prey spatially rather than vertically in the water column. For the three individuals included in the analysis, half the foraging events were during tortuous trajectories. These events were characterized by significantly shallower target depths and significantly higher buzzing rates compared with transiting foraging events. The stationary foraging behavior can indicate either a higher concentration of prey items, or the presence of another prey type that is more likely to school. Watt et al. (2013) reported that narwhals from East Greenland foraged more on pelagic prey than in other areas. The stomach contents of harvested narwhals in Scoresby Sound in August included squids and to a lesser degree capelin (Heide-Jørgensen et al., 2014). In their offshore winter grounds, narwhals in West Greenland feed mainly on polar cod Boreogadus saida, Greenland halibut Reinhardtius hippoglossoides, shrimp Pandalus borealis, squids Gonatus sp. (Laidre and Heide-Jørgensen, 2005) and to a lesser degree on capelin Mallotus villosus but information on distribution and abundance of these species are lacking for the Scoresby Sound fjord complex.
This study revealed a significant increase in odds for spinning during foraging dives. Whereas spinning was an integrated part of descent during both foraging and non-foraging dives, spinning had higher odds for occurring during all dive phases when the animals were foraging. Toothed whales orient themselves and localize objects in the water by echolocating. Narwhals produce high-frequency broadband echolocation clicks with detectable energy up to 240 kHz (Rasmussen et al., 2015). Due to the spectral qualities of these clicks resembling those of the Indo-Pacific bottlenose dolphin Tursiops aduncus and white-beaked dolphin Lagernohynchus albirostris Rasmussen et al. (2015) estimated the −3- and −10-dB beamwidths, the angular width of the radiation pattern between points −3 or −10 dB from maximum beam level, of narwhal clicks to be 8 and 10°, respectively. Widening this beam can be achieved by decreasing the frequency of the emitted clicks (Au et al., 1995; Madsen et al., 2004). Controlling the time delay between activation of the two pairs of sonic-lips (Moore et al., 2008; Lammers and Castellote, 2009) or by controlling the sound-producing soft tissues (Madsen et al., 2010) have also been hypothesized to play a role in active beam control. As widening the echolocation beam can be an advantage during prey search and in the last phase of the approach to compensate for the evasive maneuvers of a prey item (Jakobsen and Surlykke, 2010), a behavioral solution to the same could be spinning and/or spiraling where the animal increases the area swept by the echolocation beam by rotating its entire body. In addition, narwhals lack a “stabilizer” in the form of dorsal fin or large pectoral fins making spinning perhaps more effortless for this species compared with other cetaceans with protruding appendages.
Despite the deep diving abilities of narwhals, the majority of the dives, however, were shallow in depth, < 100 m, and short in duration, < 5 min. Furthermore, only 1.5% of the surface intervals and 56.4% of the dives were used for foraging (29% of surface intervals and dives together), indicating that summer grounds also serve other functions than foraging. Some studies (Martin et al., 1994; Laidre et al., 2002) have shown that shallow diving is characteristic for narwhals on their summer grounds, but these studies were done in coastal Canada where the bathymetry is effectively preventing dives deeper than ∼300 m, making these results difficult to compare to this study. Although the reported mean dive depth of narwhals summering in another deep habitat (Melville Bay in West Greenland) was 200–300 m deeper in August than found in this study, Heide-Jørgensen and Dietz (1995) found a clear increase in maximum dive depth with advancing season with the shallowest dives occurring in August. This fits well with what is known about narwhal foraging behavior: feeding, indicated by presence of buzzes, occurs predominantly at depths exceeding ∼350 m (Blackwell et al., 2018; Heide-Jørgensen et al., 2020, this study) and foraging rates are highest at the offshore winter grounds (Laidre et al., 2003; Laidre and Heide-Jørgensen, 2005).
In summary, the results from this study provide new insights into narwhal locomotion and foraging behavior. We found that narwhals, like other deep diving marine mammals, utilized energy-saving measures during descent by increasing gliding. The whales increased their speed during descent as well as increased the proportion of time spent gliding when their target depth was deeper, possible evidence of narwhals planning their dives. Two types of foraging strategies were identified: (1) transit foraging with faster and more straight-line horizontal movement during a dive, lower buzzing rates and deeper target depths and (2) slower, more tortuous horizontal movements during a dive, high buzzing rates and shallower target depths, indicating either two prey types (single vs. schooling) or two prey densities. Narwhals in Scoresby Sound are estimated to have 10 prey capture events per day based on stomach temperature measurements (Heide-Jørgensen et al., 2014) but the prey capture efficiency during different foraging strategies is unknown. Spinning behavior was much more common during foraging than during non-foraging, and the spinning movement of the animal could be related to prey search or capture events. Spiraling in connection with spinning should also be targeted in future studies to shed light on the function of spinning.
Estimation of excess energy expenditure as a response to external stressors and the consequences of that on the resilience of the population, are especially important for a species like the narwhal, that is living in a rapidly changing Arctic. Due to the spinning behavior, stroking rate can be better suited for the overall energy consumption calculations in narwhals than ODBA measurements, however, further studies are needed to capture the energetic cost of spinning. In addition, ODBA would be a reliable tool for detecting inactivity in narwhals, for example in connection with resting behavior or “freeze” behavior as a response to threats.
Data Availability Statement
The raw data supporting the conclusions of this article will be made available by the authors, without undue reservation.
Ethics Statement
The animal study was reviewed and approved by the IACUC of the University of Copenhagen.
Author Contributions
OT: concept, data collection, data analysis, illustrations, and manuscript writing lead. SD: data analysis and manuscript writing. MN: data analysis and manuscript writing. NN: data collection, illustrations, and manuscript writing. SB: data collection, data analysis, illustrations, and manuscript writing. TW: concept, data collection, and manuscript writing. MH-J: concept, data collection, manuscript writing, and funding. All authors contributed to the article and approved the submitted version.
Conflict of Interest
SB was employed by the company Greeneridge Science Inc.
The remaining authors declare that the research was conducted in the absence of any commercial or financial relationships that could be construed as potential conflict of interest.
Acknowledgments
We thank the hunters from Ittoqqortoormiit for their assistance in catching the whales, deploying and collecting instruments. We are particularly grateful to Inuuta Scoresby Hammeken, Hans Christian Schmidt and Mikkel Sinding, who facilitated a major part of the field operations. Mikkel Skovrind, Jeppe Møhl, Mads Fage Christoffersen, Sixten Hüllert, Solveig Heide-Jørgensen, Alice Hüllert, Beau Richter and Eva Garde are thanked for their help with field logistics, camp maintenance and capture operations in Hjørnedal. Alexander Conrad is thanked for his help and contributions to the buzz detector and two reviewers are thanked for their comments that have greatly improved this manuscript. This study is part of the Northeast Greenland Environmental Study Program. The Northeast Greenland Environmental Study Program is a collaboration between DCE—Danish Centre for Environment and Energy at Aarhus University, the Greenland Institute of Natural Resources, and the Environmental Agency for Mineral Resource Activities of the Government of Greenland. Oil companies operating in Greenland are obliged to contribute to knowledge regarding environmental matters. The Strategic Environmental Impact Assessment and the background study program is funded under these commitments administered by the Mineral Licence and Safety Authority and the Environmental Agency for Mineral Resource Activities. Permission for capturing, handling, and tagging of narwhals was provided by the Government of Greenland (Case ID 2010 ± 035453, document number 429 926). The project was reviewed and approved by the IACUC of the University of Copenhagen (17 June 2015). Access and permits to use land facilities in Scoresby Sound were provided by the Government of Greenland.
Supplementary Material
The Supplementary Material for this article can be found online at: https://www.frontiersin.org/articles/10.3389/fmars.2020.596469/full#supplementary-material
Footnotes
References
Aguilar Soto, N., Johnson, M. P., Madsen, P. T., Díaz, F., Domínguez, I., Brito, A., et al. (2008). Cheetahs of the deep sea: deep foraging sprints in short-finned pilot whales off Tenerife (Canary Islands). J. Anim. Ecol. 77, 936–947. doi: 10.1111/j.1365-2656.2008.01393.x
Au, W. W. L., Pawloski, J. L., Nachtigall, P. E., Blonz, M., and Gisner, R. C. (1995). Echolocation signals and transmission beam pattern of a false killer whale (Pseudorca crassidens). J. Acoust. Soc. Am. 98, 51–59. doi: 10.1121/1.413643
Blackwell, S. B., Tervo, O. M., Conrad, A. S., Sinding, M. H. R., Ditlevsen, S., and Heide-Jørgensen, M. P. (2018). Spatial and temporal patterns of sound production in East Greenland narwhals. PLoS One 13:e0198295. doi: 10.1371/journal.pone.0198295
Brown, D. D., Kays, R., Wikelski, M., Wilson, R., and Klimley, A. P. (2013). Observing the unwatchable through acceleration logging of animal behavior. Anim. Biotel. 1:20. doi: 10.1186/2050-3385-1-20
Burnham, K. P., and Anderson, D. R. (2002). Model Selection and Multimodel Inference: A Practical Information – Theoretic Approach, 2nd Edn. Berlin: Springer.
Chambault, P., Tervo, O. M., Garde, E., Hansen, R. G., Blackwell, S. B., Williams, T. M., et al. (2020). The impact of rising sea temperatures on an Arctic top predator, the narwhal. Sci. Rep. 10:18678. doi: 10.1038/s41598-020-75658-6
Costa, D. P., and Williams, T. M. (1999). “Marine mammal energetics,” in The Biology of Marine Mammals, eds J. E. Reynolds and S. A. Rommel (Washington, DC: Smithsonian Institution Press), 176–217.
DeRuiter, S. L., Langrock, R., Skirbutas, T., Goldbogen, J. A., Calambokidis, J., Friedlaender, A. S., et al. (2017). A multivariate mixed hidden Markov model for blue whale behaviour and responses to sound exposure. Annals Appl. Statist. 11, 362–392. doi: 10.1214/16-aoas1008
Dietz, R., Heide-Jørgensen, M. P., Richard, P., Orr, J., Laidre, K., and Schmidt, H. C. (2008). Movements of narwhals (Monodon monoceros) from Admiralty Inlet monitored by satellite telemetry. Pol. Biol. 31, 1295–1306. doi: 10.1007/s00300-008-0466-4
Dietz, R., Shapiro, A. D., Bakhtiari, M., Orr, J., Tyack, P. L., Richard, P., et al. (2007). Upside-down swimming behaviour of free-ranging narwhals. BMC Ecol. 7:14. doi: 10.1186/1472-6785-7-14
Elmegaard, S. L., Johnson, M., Madsen, P. T., and McDonald, B. I. (2016). Cognitive control of heart rate in diving harbor porpoises. Curr. Biol. 26, R1167–R1176. doi: 10.1016/j.cub.2016.10.020
Fish, F. E. (1998). Comparative kinematics and hydrodynamics of Odontocete cetaceans: morphological and ecological correlates with swimming performance. J. Exp. Biol. 201, 2867–2877.
Ford, J. K. B., Ellis, G. M., Matkin, D. R., Balcomb, K. C., Briggs, D., and Morton, A. B. (2006). Killer whale attacks on minke whales: prey capture and antipredator tactics. Mar. Mamm. Sci. 21, 603–618. doi: 10.1111/j.1748-7692.2005.tb01254.x
Garde, E., Hansen, S. H., Ditlevsen, S., Tvermosegaard, K. B., Hansen, J., Harding, K. C., et al. (2015). Life history parameters of narwhals (Monodon monoceros) from Greenland. J. Mammal. 96, 866–879. doi: 10.1093/jmammal/gyv110
Gleiss, A. C., Wilson, R. P., and Shepard, E. L. C. (2011). Making overall dynamic body acceleration work: on the theory of acceleration as a proxy for energy expenditure. Methods Ecol. Evol. 2, 23–33. doi: 10.1111/j.2041-210X.2010.00057.x
Gurarie, E., Andrews, R. D., and Laidre, K. L. (2009). A novel method for identifying behavioural changes in animal movement data. Ecol. Lett. 12, 395–408. doi: 10.1111/j.1461-0248.2009.01293.x
Heide-Jørgensen, M. P., Blackwell, S. B., Williams, T. M., Sinding, M.-H. S., Skovrind, M., Tervo, O., et al. (2020). Some like it cold: temperature-dependent habitat selection by narwhals. Ecol. Evol. 10, 8073—8090 doi: 10.1002/ece3.6464
Heide-Jørgensen, M. P., and Dietz, R. (1995). Some characteristics of narwhal, Monodon monoceros, diving behaviour in Baffin Bay. Can. J. Zool. 73, 2120–2132. doi: 10.1139/z95-249
Heide-Jørgensen, M. P., Dietz, R., Laidre, K., Schmidt, H. C., Richard, P., and Orr, J. (2003). The migratory behaviour of narwhals (Monodon monoceros). Can. J. Zool. 81, 1298–1305. doi: 10.1139/z03-117
Heide-Jørgensen, M. P., Nielsen, N. H., Hansen, R. G., and Blackwell, S. B. (2014). Stomach temperature of narwhals (Monodon monoceros) during feeding events. Anim. Biotel. 2:9. doi: 10.1186/2050-3385-2-9
Heide-Jørgensen, M. P., Nielsen, N. H., Hansen, R. G., Schmidt, H. C., Blackwell, S. B., and Jørgensen, O. A. (2015). The predictable narwhal: satellite tracking shows behavioural similarities between isolated subpopulations. J. Zool. (Lond) 297, 54–65. doi: 10.1111/jzo.12257
Jakobsen, L., and Surlykke, A. (2010). Vespertilionid bats control the width of their biosonar sound beam dynamically during prey pursuit. Proc. Natl. Acad. Sci. U S A. 107:935.
Johannessen, C. L., and Andharder, J. A. (1960). Sustained swimming speeds of dolphins. Science 132, 1550–1551. doi: 10.1126/science.132.3439.1550
Kooyman, G. L. (2009). “Diving physiology,” in The Encyclopaedia of Marine Mammals, eds W. F. Perrin, B. Würsig, and J. G. M. Thewissen (San Diego, CA: Academic Press), 327–332. doi: 10.1016/B978-0-12-373553-9.00079-1
Kooyman, G. L., and Ponganis, P. J. (1997). The challenges of diving to depth. Am. Sci. 85, 530–539.
Laidre, K., and Heide-Jørgensen, M. P. (2005). Winter feeding intensity of narwhals (Monodon monoceros). Mar. Mam. Sci. 21, 45–57. doi: 10.1111/j.1748-7692.2005.tb01207.x
Laidre, K., Heide-Jørgensen, M. P., and Dietz, R. (2002). Diving behaviour of narwhals (Monodon monoceros) at two coastal localities in the Canadian High Arctic. Can. J. Zool. 80, 624–635. doi: 10.1139/z02-041
Laidre, K. L., Heide-Jørgensen, M. P., Dietz, R., Hobbs, R. C., and Jørgensen, O. A. (2003). Deep-diving by narwhals, Monodon monoceros: differences in foraging behavior between wintering areas? Mar. Ecol. Prog. Ser. 261, 269–281.
Laidre, K. L., Stirling, I., Lowry, L. F., Wiig, Ø, Heide-Jørgensen, M. P., and Ferguson, S. H. (2008). Quantifying the sensitivity of Arctic marine mammals to climate-induced habitat change. Ecol. Appl. 18, S97–S125.
Lammers, M., and Castellote, M. (2009). The beluga whale produces two pulses to form its sonar signal. Biol. Lett. 5, 297–301. doi: 10.1098/rsbl.2008.0782
Madsen, P. T., Kerr, I., and Payne, R. (2004). Echolocation clicks of two free-ranging, oceanic delphinids with different food preferences: false killer whales Pseudorca crassidens and Risso’s dolphins Grampus griseus. J. Exp. Biol. 207, 1811–1823. doi: 10.1242/jeb.00966
Madsen, P. T., Wisniewska, D., and Beedholm, K. (2010). Single source sound production and dynamic beam formation in echolocating harbour porpoises (Phocoena phocoena). J. Exp. Biol. 213, 3105–3110. doi: 10.1242/jeb.044420
Martin, A. R., Kinglsey, M. C. S., and Ramsay, M. A. (1994). Diving behaviour of narwhal (Monodon monoceros) on their summer grounds. Can. J. Zool. 72, 118–125. doi: 10.1139/z94-015
McDonald, B. I., Johnson, M., and Madsen, P. T. (2018). Dive heart rate in harbour porpoises is influenced by exercise and expectations. J. Exp. Biol. 221:jeb168740. doi: 10.1242/jeb.168740
Moore, P. W., Dankiewicz, L. A., and Houser, D. S. (2008). Beamwidth control and angular target detection in an echolocating bottlenose dolphin (Tursiops truncatus). J. Acoust. Soc. Am. 124, 3324–3332. doi: 10.1121/1.2980453
Moore, S. E., Reeves, R. R., Southall, B. L., Ragen, T. J., Suydam, R., and Clark, C. W. (2012). A new framework for assessing the effects of anthropogenic sound on marine mammals in a rapidly changing Arctic. Bioscience 62, 289–295. doi: 10.1525/bio.2012.62.3.10
Ngô, M. C., Heide-Jørgensen, M. P., and Ditlevsen, S. (2019). Understanding narwhal diving behaviour using hidden markov models with dependent state distributions and long range dependence. PLoS Comp. Biol. 15:e1006425. doi: 10.1371/journal.pcbi.1006425
Nowacek, D. P., Johnson, M. P., Tyack, P. L., Shorter, K. A., McLellan, W. A., and Pabst, D. A. (2001). Buoyant balaenids: the ups and downs of buoyancy in right whales. Proc. R. Soc. Lond. B 268, 1811–1816. doi: 10.1098/rspb.2001.1730
Pagano, A. M., and Williams, T. M. (2019). Estimating the energy expenditure of free-ranging polar bears using triaxial accelerometers: a validation with doubly labeled water. Ecol. Evol. 9, 4210–4219. doi: 10.1002/ece3.5053
Parkinson, C. L., and Cavalieri, D. J. (2008). Arctic sea ice variability and trends, 1979–2006. J. Geo. Res. 113:C7. doi: 10.1029/2007JC004558
R Core Team (2020). R: A Language and Environment for Statistical Computing. Vienna: R Foundation for Statistical Computing.
Rasmussen, M., Koblitz, J. C., and Laidre, K. L. (2015). Buzzes and high-frequency clicks recorded from narwhals (Monodon monoceros) at their wintering ground. Aqu. Mamm. 41, 256–264. doi: 10.1578/am.41.3.2015.256
Richardson, W. J., Greene, C. R., Malme, C. I., and Thomson, D. H. (1995). Marine Mammals and Noise. San Diego, CA: Academic Press.
Sato, K., Watanuki, Y., Takahashi, A., Miller, P. J. O., Tanaka, H., Kawabe, R., et al. (2007). Stroke frequency, but not swimming speed, is related to body size in free-ranging seabirds, pinnipeds and cetaceans. Proc. R Soc. Lond. B. Biol. Sci. 274, 471–477. doi: 10.1098/rspb.2006.0005
Schreer, J. F., and Kovacs, K. M. (1997). Allometry of diving capacity in air-breathing vertebrates. Can. J. Zool. 75, 339–358. doi: 10.1139/z97-044
Serreze, M. C., Holland, M. M., and Stroeve, J. (2007). Perspectives on the Artic′s shrinking sea-ice cover. Science 315, 1533–1536.
Serreze, M. C., and Stroeve, J. (2015). Arctic sea ice trends, variability and implications for seasonal ice forecasting. Phil. Trans. R. Soc. A. 373:20140159. doi: 10.1098/rsta.2014.0159
Simmonds, M. P., Dolman, S. J., Jasny, M., Parsons, E. C. M., Weilgart, L., Wright, A. J., et al. (2014). Marine noise pollution-increasing recognition but need for more practical action. J. Ocean Tech. 9, 71–90.
Skrovan, R. C., Williams, T. M., Berry, P. S., Moore, P. W., and Davis, R. W. (1999). The diving physiology of bottlenose dolphins (Tursiops truncatus) – II. Biomechanics and changes in buoyancy at depth. J. Exp. Biol. 202, 2749–2761.
Southall, B., Bowles, A., Ellison, W., Finneran, J., Gentry, R., Greene, C., et al. (2007). Marine mammal noise exposure criteria: initial scientific recommendations. Aquat. Mamm. 33, 411–521.
Stroeve, J. C., Schroder, D., Tsamados, M., and Feltham, D. (2018). Warm winter, thin ice? Cryosphere 12, 1791–1809. doi: 10.5194/tc-12-1791-2018
van Beest, F. M., Teilmann, J., Hermannsen, L., Galatius, A., Mikkelsen, L., Sveegaard, S., et al. (2018). Fine-scale movement response of free-ranging harbor porpoises to capture, tagging and short-term noise pulses from a single airgun. R. Soc. 5:170110. doi: 10.1098/rsos.170110
Watt, C. A., Heide-Jørgensen, M. P., and Ferguson, S. H. (2013). How adaptable are narwhal: a comparison of foraging patterns among the world’s three narwhal populations. Ecosphere 4:71. doi: 10.1890/ES13-00137.1
Watt, C. A., Orr, J. R., Heide-Jørgensen, M. P., Nielsen, N. H., and Fergusen, S. H. (2015). Differences in dive behavior among the world’s three narwhal (Monodon monoceros) populations correspond with dietary differences. Mar. Ecol. Prog. Ser. A 525, 273–285. doi: 10.3354/meps11202
Williams, R., Wright, A. J., Ashe, E., Blight, L. K., Bruintjes, R., Canessa, R., et al. (2015). Impacts of anthropogenic noise on marine life: publication patterns, new discoveries, and future directions in research and management. Ocean Coastal Management 115, 17–24. doi: 10.1016/j.ocecoaman.2015.05.021
Williams, T. M. (2009). “Swimming,” in Encyclopedia of Marine Mammals, Vol. 2, eds W. E. Perrin, B. Wursig, and J. G. M. Thewissen (San Diego, CA: Academic Press), 1140–1147.
Williams, T. M., Davis, R. W., Fuiman, L. A., Francis, J., Le Boeuf, B. J., Horning, M., et al. (2000). Sink or swim: strategies for cost-efficient diving by marine mammals. Nature 288, 133–136. doi: 10.1126/science.288.5463.133
Williams, T. M., Friedl, A. W., Fong, M. L., Yamada, R. M., Sedivy, P., and Haun, J. E. (1992). Travel at low energetic cost by swimming and wave-riding bottlenose dolphins. Nature 355, 821–823. doi: 10.1038/355821a0
Williams, T. M., Fuiman, L. A., Horning, M., and Davis, R. W. (2004). The cost of foraging by a marine predator, the Weddell seal Leptonychotes weddellii: pricing by the stroke. J. Exp. Biol. 207, 973–982. doi: 10.1242/jeb.00822
Williams, T. M., Blackwell, S. B., Richter, B., Sinding, M.-H. S., and Heide-Jørgensen, M. P. (2017a). Paradoxical escape responses by narwhals (Monodon monoceros). Science 23, 1328–1331. doi: 10.1126/science.aao2740
Williams, T. M., Kendall, T. L., Richter, B. P., Ribeiro-French, C. R., John, J. S., Odell, K. L., et al. (2017b). Swimming and diving energetics in dolphins: a stroke-by- stroke analysis for predicting the cost of flight responses in wild odontocetes. J. Exp. Biol. 220, 1135–1145. doi: 10.1242/jeb.154245
Williams, T. M., Noren, S. R., and Glenn, M. (2011). Extreme physiological adaptations as predictors of climate-change sensitivity in the narwhal. monodon monoceros. Mar. Mamm. Sci. 27, 334–349. doi: 10.1111/j.1748-7692.2010.00408.x
Keywords: behavior, Arctic, narwhal, foraging behavior, locomotion, diving behavior
Citation: Tervo OM, Ditlevsen S, Ngô MC, Nielsen NH, Blackwell SB, Williams TM and Heide-Jørgensen MP (2021) Hunting by the Stroke: How Foraging Drives Diving Behavior and Locomotion of East-Greenland Narwhals (Monodon monoceros). Front. Mar. Sci. 7:596469. doi: 10.3389/fmars.2020.596469
Received: 19 August 2020; Accepted: 24 December 2020;
Published: 21 January 2021.
Edited by:
Adrian C. Gleiss, Murdoch University, AustraliaReviewed by:
Yuuki Watanabe, National Institute of Polar Research, JapanSamantha Andrzejaczek, Stanford University, United States
Copyright © 2021 Tervo, Ditlevsen, Ngô, Nielsen, Blackwell, Williams and Heide-Jørgensen. This is an open-access article distributed under the terms of the Creative Commons Attribution License (CC BY). The use, distribution or reproduction in other forums is permitted, provided the original author(s) and the copyright owner(s) are credited and that the original publication in this journal is cited, in accordance with accepted academic practice. No use, distribution or reproduction is permitted which does not comply with these terms.
*Correspondence: Outi M. Tervo, outi@ghsdk.dk