3D Photogrammetry Reveals Dynamics of Stony Coral Tissue Loss Disease (SCTLD) Lesion Progression Across a Thermal Stress Event
 Sonora Meiling
 Erinn M. Muller
 Tyler B. Smith
 Marilyn E. Brandt
- 1Center for Marine and Environmental Studies, University of the Virgin Islands, St. Thomas, USVI, United States
- 2Mote Marine Laboratory, Sarasota, FL, United States
Stony coral tissue loss disease (SCTLD) was first observed in the United States Virgin Islands in January 2019 on a reef at Flat Cay off the island of St. Thomas. A year after its emergence, the disease had spread to several reefs around St. Thomas causing significant declines in overall coral cover. Rates of tissue loss are an important metric in the study of coral disease ecology, as they can inform many aspects of etiology such as disease susceptibility and resistance among species, and provide critical parameters for modeling the effects of disease among heterogenous reef communities. The present study quantified tissue loss rates attributed to SCTLD among six abundant reef building species (Colpophyllia natans, Montastraea cavernosa, Diploria labyrinthiformis, Pseudodiploria strigosa, Orbicella annularis, and Porites astreoides). Field-based 3D models of diseased corals, taken approximately weekly, indicated that the absolute rates of tissue loss from SCTLD slowed through time, corresponding with the accumulation of thermal stress that led to mass bleaching. Absolute tissue loss rates were comparable among species prior to the bleaching event but diverged during and remained different after the bleaching event. Proportional tissue loss rates did not vary among species or through time, but there was considerable variability among M. cavernosa colonies. SCTLD poses a significant threat to reefs across the Caribbean due to its persistence through time, wide range of susceptible coral species, and unprecedented tissue loss rates. Intervention and management efforts should be increased during and immediately following thermal stress events in order maximize resource distribution when disease prevalence is decreased.
Introduction
The Caribbean is known as a coral disease “hot spot” (Green and Bruckner, 2000) due to its high prevalence of disease occurrence (van Woesik and Randall, 2017). Several of these diseases affect multiple species of coral and can, therefore, have wide ranging impacts on Caribbean coral communities. For instance, white plague and black band disease affect 22 and 42 species of Caribbean corals, respectively (Bruckner, 2007), and have caused significant declines in reef-building coral species abundances (Edmunds, 1991; Miller et al., 2009; Weil et al., 2009; Muller and Van Woesik, 2011). Recently, a new coral disease has emerged, stony coral tissue loss disease (SCTLD), which has proven more virulent and persistent than black band or white plague (Walton et al., 2018).
SCTLD was first reported in Southeast Florida in 2014 off the coast of Miami-Dade County (Precht et al., 2016; Walton et al., 2018), which is part of the northern Florida Coral Reef Tract (FRT). The FRT spans nearly 580 linear kilometers along the southeast coast of the state of Florida (NOAA Coral Reef Information System, 2019). Between 2014 and 2020, SCTLD spread through the FRT to as far south as the Marquesas situated west of Key West. Coral reef monitoring data from reefs off of southeast Florida showed declines in coral diversity of ~30% in the first 2 years after its emergence (Walton et al., 2018). These surveys also found declines in living coral tissue area of ~60% on reefs of all habitat types that were impacted by SCTLD over the same time frame.
SCTLD is identified by rapid tissue loss that results in exposure of stark white skeleton (Figure 1). The case definition of stony coral tissue loss disease describes it as “focal, multifocal, locally extensive to diffuse areas of acute to subacute tissue loss distributed basally, peripherally, or both. In some cases, tissues bordering areas of chronic tissue loss have indistinct bands (1–5 cm) of pallor progressing to normal pigmentation away from denuded skeleton.” (NOAA Stony Coral Tissue Loss Disease Case Definition, 2018). Once a colony is affected, total mortality can occur within weeks to months (Florida Keys National Marine Sanctuary, 2019). Twenty-two (22) Caribbean species of scleractinian corals, five of which are listed as threatened under the U.S. Endangered Species Act, have been reportedly affected by SCTLD. Meandrina meandrites has been designated an early indicator species with up to a 95% decrease in density on affected reefs in Florida (Walton et al., 2018). Other species, including Dendrogyra cylindrus, Pseudodiploria strigosa, and Diploria labyrinthiformis are also known to be affected early by rapidly progressing multi-focal lesions. Having these quickly identifiable parameters has helped distinguish SCTLD outbreaks from outbreaks of other rapid tissue loss diseases, including white plague, and has contributed to defining the spatial boundaries of the disease. Tissue loss signs on these species have also helped in the analysis of the disease's spatio-temporal progression and has been an indicator of the disease's appearance at other Caribbean locations.
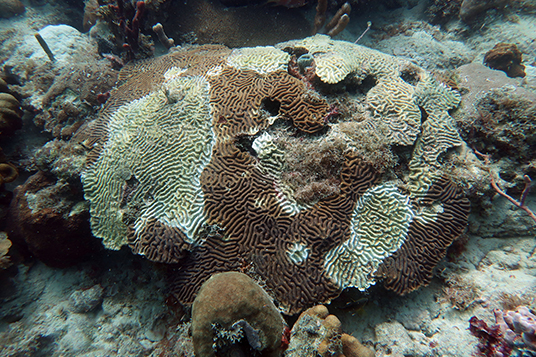
Figure 1. Stony coral tissue loss disease (SCTLD) at the Black Point study site. A colony of C. natans affected by SCTLD, identified by the patches of exposed white skeleton indicating lesions that are quickly progressing (photo: Marilyn Brandt, August of 2019).
Not only do different species have different rates of incidence, which contributes to how quickly they display signs of SCLTD, but surveys have also observed differences in tissue loss rates among species (Neely, 2018). Tracking of marked corals and monitoring corals at permanent sites showed surface area tissue loss rates of 20–40 cm2/day for M. meandrites, Colpophyllia natans, and Pseudodiplora strigosa, and 5 cm2/day for Dichocoenia stokesii (Sharp and Maxwell, 2018). Aeby et al. (2019) observed tissue loss rates of 3.3 (± 1.6 SEM) cm2/day for D. labyrinthiformis and 5.3 (± 0.73) cm2/day for P. strigosa, and rates for Montastraea cavernosa were 0.82 (± 0.28) cm2/day to 4.2 (± 0.8) cm2/day, depending on geographic location. Defining and distinguishing tissue loss rates among species can assist in distinguishing species-specific susceptibility and is important for modeling the spread and ecological consequences of a coral disease (Brandt and McManus, 2009).
In January 2019, SCTLD was identified affecting reefs off the southwest coast of St. Thomas, US Virgin Islands (USVI) (Brandt, 2019; Kramer et al., 2019). Preliminary observations suggested that tissue loss on corals from SCTLD was more rapid in St. Thomas than Florida. For example, at a long-term coral reef monitoring location south of St. Thomas called Flat Cay there was a 34% decrease in coral cover attributable to SCTLD between observations made 4 months apart from December 2018 and March 2019 (Ennis et al., 2019). This is just slightly less than the impact of the disease observed in Southeast Florida over 4 years (Walton et al., 2018). The difference is that the loss of coral cover observed at Flat Cay occurred in a manner of months rather than years.
Many methods have been applied to quantify tissue loss rates associated with coral disease. Early studies of coral disease often used linear measurements between the tissue edge and a stationary point on the coral to quantify tissue loss rates in situ resulting in a linear measurement. With the advent of digital underwater cameras, two-dimensional photo analysis became a standard method applied for both linear (Sato et al., 2011) and areal tissue loss rates (Clemens and Brandt, 2015). These photographs not only allowed for records of tissue loss rates that could be revisited but decreased the in-water time necessary for other methods such as measuring the lesions in situ.
2D photogrammetry has provided valuable information for comparing disease severity among species and regions, however, this approach has limitations because the methodology does not accurately consider the three-dimensional structure of corals. Recently, new technology has allowed for the construction of 3D models of sessile objects, such as corals, using photographs from basic underwater cameras (Gutiérrez-Heredia et al., 2015, 2016). The 3D modeling approach also creates a platform to analyze changes between these models through time down to the mm scale (Chong and Stratford, 2002; Gutiérrez-Heredia et al., 2015, 2016; Ferrari et al., 2017; Olinger et al., 2019). 3D models were chosen for quantifying SCTLD tissue loss rates over 2D images in the present study because this method allows for greater accuracy when measuring approximately semi-spherical objects. Hundreds of photos of a single object, taken from various angles, are overlapped in 3D space to create a model. Overlapping the images in 3D space negates the error when calculating distance from a 2D image created when pictures are taken at slightly different angles and heights. In addition, image analysis using 2D photos may exclude a part of the coral that is not visible from a single overhead angle but is easily captured in a 3D model. The high resolution of the models (Figure 2) allows for more detailed measurements than 2D image software, particularly for quantifying the surface area of objects that have irregular, as opposed to smooth, surfaces such as corals. Finally, capturing the entire colony and some of its immediate surroundings offers an unbiased representation of the colony, which can lead to more holistic depictions of health. This new technology provides the opportunity to more rigorously record changes to living coral tissue on individual corals through time (Reichert et al., 2016), especially on the less complex mound and boulder species. The present study used 3D photogrammetry to quantify SCTLD-related tissue loss rates for multiple species of corals in St. Thomas, US Virgin Islands. The goal of the study was to compare tissue loss rates among species, through time, and with rates recorded in Florida. Ultimately, these results provide valuable information important to understanding species susceptibility and the impact of this devastating disease on US Virgin Islands reefs.
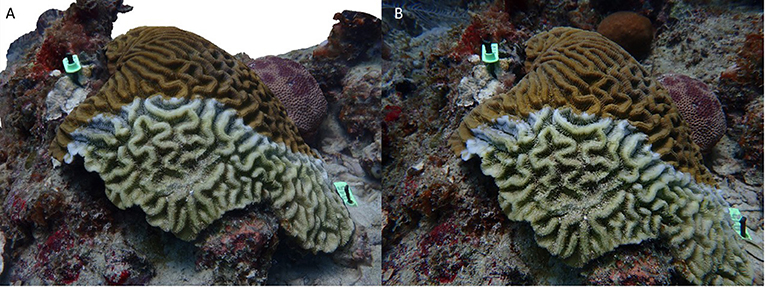
Figure 2. Comparison of 3D model and photograph. (A) Screenshot of a 3D model of a C. natans affected with SCTLD. (B) One of the photographs used to build the model seen in (A).
Methods
In August of 2019, six (6) colonies of each species (P. strigosa, C. natans, D. labyrinthiformis, M. cavernosa, Orbicella annularis, and Porites astreoides) were marked with unique identification number tags at Black Point, St. Thomas, USVI (18.344859, −64.985664). All colonies were exhibiting signs consistent with those described for SCTLD (NOAA Stony Coral Tissue Loss Disease Case Definition, 2018; Aeby et al., 2019) amidst a well-characterized SCTLD outbreak affecting southwest St. Thomas (Ennis et al., 2019). Colonies were chosen that were >20 cm, but smaller than 50 cm in diameter and had >50% surface area of living tissue remaining. At the same location, two (2) colonies of healthy D. labyrinthiformis and one (1) healthy colony of P. strigosa were tagged and monitored for signs of health impairment. Unfortunately, paired controls for all tagged disease corals could not be located due to the extensive prevalence of SCTLD at the site. Two (2) tags were placed within 20 cm of the edge of each coral, on opposite sides of the coral by hammering masonry nails through the tag and into the reef substrate (Figure 3).
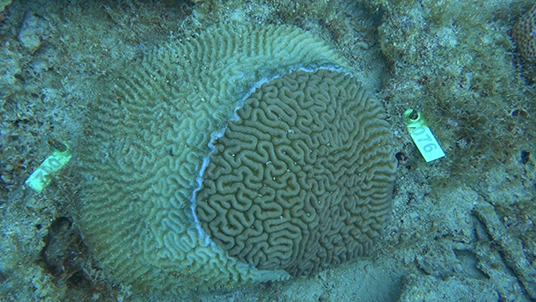
Figure 3. Monitored coral. Example alignment of unique numbered cattle-tags for monitoring of a P. strigosa affected with SCTLD using 3D photogrammetry.
On each visit, divers removed all materials that would have elicited motion within the frame of the video, such as sponges, sea fans, or macroalgae (primarily Dictyota spp.). Removing these objects increased the resolution and probability of proper photo alignment when building the 3D model. Divers then recorded a video of each colony in 1,080 HD at 60 fps, lasting between 1:40 and 2:30 min in duration using a Sony RX100 held within an underwater housing with attached strobe lights (when available). The camera remained 10–30 cm away from the coral surface. The lower bound of the video duration was chosen because one frame was extracted from every second, thus a 1:40 min video produced 100 images which was a low, but acceptable number to create a viable model. The videos covered the entire surface area of the coral colony. The first 0:50 s to 1 min were spent documenting the edge of the colony slowly and steadily. Successful models were created with no <25% overlap, but >80% overlap between photos was ideal, which was why slow movement around the coral was required. After the colony was circumnavigated, divers documented the remaining surface area of the colony either in a zigzag or spiraling pattern. Once the whole colony surface area had been recorded, divers very slowly recorded along the lesion border at ~5–20 cm away from the coral surface (Supplementary Figure 1). Increased coverage and proximity to the coral helped to ensure high resolution of the divide between healthy and necrotic tissue on the 3D model, which ultimately increased accuracy of the measurements and thus results. Finally, divers ended the video with an overhead shot of the coral that included both tags (Figure 3).
Each colony was revisited and rerecorded in the same manor twice a week for the first 2 weeks, then once a week for 5 months, or until complete colony mortality (Supplementary Table 1). Upon sequential visits to corals, the tags were cleaned of any debris or benthic recruitment to ensure visibility of the numbers, and crisp edges of the tags in the constructed 3D models for use as scales.
The computer used for image extraction and model construction was a Dell running Windows 10 Pro for Workstations with a 3.21GHz Intel Xeon processor and 64.0 GB of RAM. Using the program framer through ffmpeg (Booker, 2018) the highest quality frame from every second was extracted from each coral video. “Quality” of each frame was defined by sharpness of edges in the image. These photos were then imported into the program Agisoft Metashape (Professional Version 1.5.4) to construct 3D models of each colony using the recommended settings from Mallison (2015) (Supplementary Figure 2). Once the photos were uploaded into Agisoft Metashape (each coral was a separate “chunk”), the software aligned the photos in three-dimensional space with high accuracy to build the sparse point cloud (Figure 4A). The initial tie point cloud was cleaned of any points in which the software was not certain about their placement, all of which were then deleted. The cleaned point cloud contained an average of 20,140 ± 6,374 (SD) tie points with a minimum of 9,302. Once the tie point cloud was cleaned, the software used a depth map created from the overlapping images and sparse point cloud to build a dense point cloud (Figure 4B). The minimum points produced for a dense point cloud was 3,788,108 with an average (± SD) of 5,533,558 ± 1,066,245 points. Next, a solid mesh was created between the points from the dense point cloud (Figure 4C). Finally, the overlapping images were combined to create a texture that was overlaid onto the mesh (Figure 4D). Once the models were complete, they were scaled by adding markers with known distances using the width and length of the cattle-tag next to the coral. Average (± SD) scale error for all models from a single timepoint was 0.35 ± 0.26 mm and did not exceed 1.19 mm.
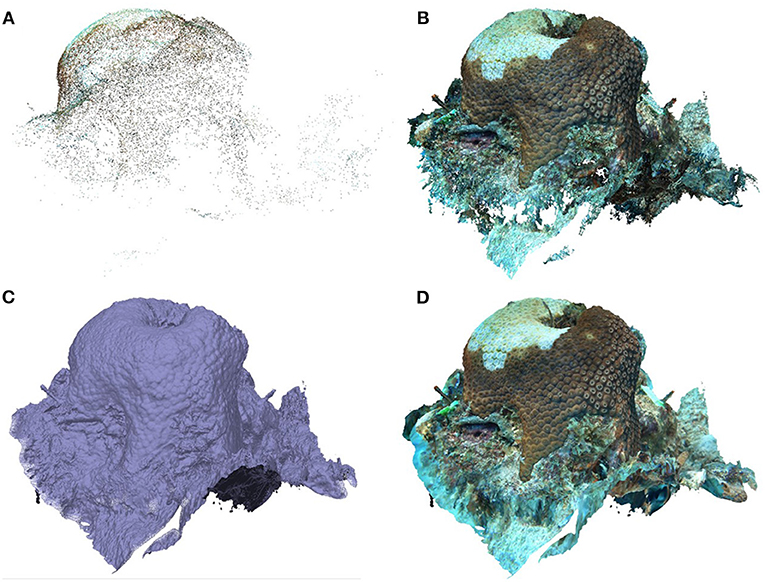
Figure 4. Stages of building a 3D model. (A) Sparse point cloud. (B) Dense point cloud. (C) Mesh. (D) Textured mesh.
To measure the surface area of the coral, models were imported into the program CloudCompare (v. 2.10.2). Using the “segment” tool, the coral was isolated from the surrounding habitat, and then the areas of healthy tissue, recent mortality, and old mortality were separated from each other (Supplementary Figure 3). With the “measure surface” feature, the surface area of each partition was measured.
HOBO temperature loggers deployed at Black Point by the USVI Territorial Coral Reef Monitoring (TCRMP) program (Smith et al., 2016a) recorded the water temperature at the reef level every 15 min during the study period. These data were then processed to calculate average daily temperatures and Degree Heating Weeks (DHW) corresponding to each time period for which tissue loss rates were calculated. DHW, is a measure of coral thermal stress that takes into account intensity and duration and was calculated for Black Point throughout the monitoring period by using the site-specific bleaching threshold determined by Smith et al. (2016b). The onset and decline of DWH, as well as visual signs of bleaching, were used to define the timepoints before, during, and after the thermal stress event.
To quantify changes in the healthy tissue surface area from each model between consecutive site visits on August 13th, 20th, September 3rd, and 10th, 2019, a rate of areal tissue loss (cm2/day) was calculated for each colony for all species. Additional rates for M. cavernosa, and O. annularis were based on changes in healthy tissue surface area between consecutive site visits on October 1st, 14th, 24th, and November 5th, 13th, 26th, and December 20th, 2019, and January 16th, 2020. Only these two species were evaluated after September due to full colony mortality in other species. Change in healthy tissue surface area was used (instead of area of recent or old mortality), because it allowed for a more consistent area of confirmed measurements on the coral between models. Since the amount of tissue loss depends on the area of total tissue (i.e., the more there is, the more there is to lose), the proportional change in tissue area was also calculated by dividing each calculated tissue loss rate by the previous measurement's total healthy tissue area. Areal lesion progression rates were chosen as opposed to linear progression measurements that have traditionally been reported in other coral disease studies in order to directly compare with published SCTLD rates (e.g., Sharp and Maxwell, 2018; Aeby et al., 2019). However, we calculated linear progression measurements on the 3D models for the species C. natans and found statistically similar results in the rates compared to the areal measurements (r = 0.650; p = 0.009). Although areal progression rates can be confounded by variable quantities of lesions among colonies, there was negligible impact on the present study's results. Only two colonies of C. natans developed a second lesion on September 10th, 2019 and multiple lobes of O. annularis had a single lesion. Areal rates were also chosen because unlike using a few linear measurements, they account for variable expansion of the lesion perimeter (i.e., some lesion edges may progress faster than others).
We are confident the tissue loss documented in this study was caused by SCTLD rather than bleaching because of the visible tissue remaining on the associated polyps (Supplementary Table 3). In addition, data from long term monitoring indicated that Black Point coral cover decreased by an absolute value of 3.25% (± 1.08% SEM) across the bleaching event (Ennis et al., 2019). In contrast, seven shallow water sites in the northern USVI that were not yet impacted by SCTLD over the course of the 2019 bleaching event had no loss of coral cover (average change in coral cover +0.31% ± 0.42%; Ennis et al., 2019; Supplementary Table 3), suggesting that bleaching was not a driver of coral cover change over the event and that tissue loss at Black Point was almost entirely SCTLD related.
Porites astreoides was ultimately excluded from tissue loss rate and fatality analyses because the presentation of lesions was highly variable among colonies, and after inspection of the full photo time series, it was not clear if the marked colonies were affected by SCTLD. One colony of P. astreoides was lost in a tropical storm, lesions on two marked corals were determined to be bleaching-related, and two colonies had progressing lesions that may have been SCLTD, but in one case the lesions stopped expanding (Supplementary Figure 4) and the other also experienced bleaching mortality (Supplementary Figure 5). In addition, two colonies of O. annularis were excluded from analyses due to an inability to distinguish bleaching mortality from disease-related tissue loss.
A correlation test was run initially to determine if colony size and areal tissue loss rate, both absolute and proportional, were related using the cor.test function in R (version 1.2.5033). These tests were completed using the log total surface area of each coral (cm2) at the start of the monitoring period and the log average total or proportional rate of tissue loss between August 13th and September 10th, 2019. Due to the significant correlation between size and tissue loss rate, an additional correlation test was run between colony size and species.
Additional correlation tests were conducted to compare the two tissue loss rates (absolute and proportional) to two different measures of potential thermal stress: temperature and Degree Heating Weeks (DHW). Non-parametric Kendall rank correlation analyses were used for correlation tests because transformations were unsuccessful in creating normal distributions for temperature and DHW. Further correlation tests were conducted to compare the tissue loss rates to bleaching extent. Bleaching extent was defined and analyzed as both percent total bleaching, and percent bleaching and paling combined. Bleaching was defined as stark white areas with remaining tissue and paling was defined as areas with less than normal color.
Using the program JMP (version 15.1.0) a repeated-measures analysis of variance (RM-ANOVA) was used to test for the effect of time and species on areal tissue loss and proportional tissue loss rates. Covariates of initial colony size (healthy tissue area) and initial proportion of disease-related mortality were tested in preliminary RM-ANOVA models, but ultimately not used because they had no significant effect and did not improve the fit of the model.
Case fatalities both before and after the bleaching event were compared among species. Using a Fisher's exact test, the proportion of colonies initially showing signs of SCTLD that survived was compared among species to those that experienced full mortality at the end of each time period. Differences in survival were compared using pairwise log-rank tests in the survival package in R. It is important to note that this does not represent true mortality, only case fatalities, because it is unknown when the colonies initially became affected.
Results
No healthy marked colonies showed signs of SCLTD between August 13th and December 20th, 2019. On January 16th, 2020 one of the marked healthy colonies of D. labyrinthiformis had developed a small tissue-loss lesion.
In March 2019, the reef level water temperature began to increase at Black Point, St. Thomas, USVI (Figure 5). On September 6th, 2019, the temperature passed the site-specific bleaching threshold (29.75°C; Smith et al., 2016b), which was exceeded for nearly 2 months. On September 10th, 2019, Black Point had accrued 1.33 Degree Heating Weeks (DHW). As the temperature remained above the bleaching threshold, the DHW accumulated to a maximum of 9.13 by October 20th, 2019. This peak thermal stress was maintained until November 30th, 2019 then declined to 0 on January 5th, 2020.
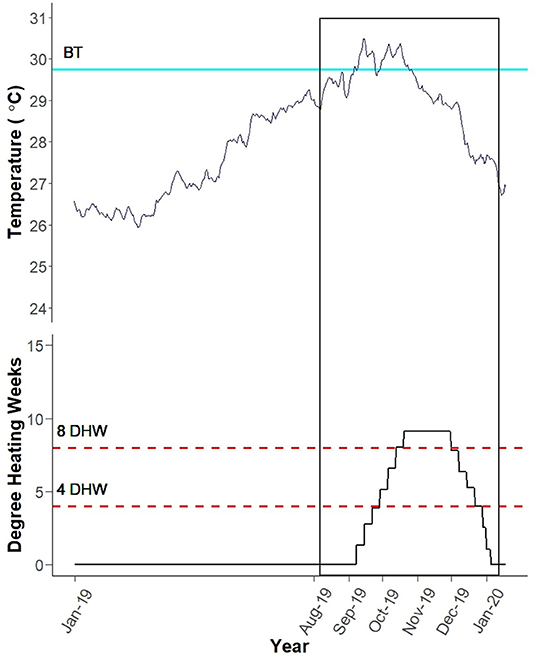
Figure 5. Black Point Degree Heating Weeks (DHW). Blue line labeled “BT” depicts the site-specific bleaching threshold (Smith et al., 2016b). Black vertical box encompasses the monitoring period (August 13th, 2019–January 16th, 2020). Site-specific DHW were calculated using average daily temperatures recorded by HOBO temperature loggers at the reef level by TCRMP. Figure created by Rosmin Ennis.
Absolute tissue loss rates did not differ among species (F = 2.638 p = 0.082), but significantly declined through time prior to the bleaching event (F = 5.625, p = 0.020; Figure 6A). At the beginning of the monitoring period, the average absolute tissue loss rate was 14.18 ± 2.84 cm2 day−1 and dropped to 4.77 ± 1.00 cm2 day−1 by September 10th, 2019. This decline was consistent among species, therefore there was no interaction between species and time (F = 0.624, p = 0.699; Figure 6A).
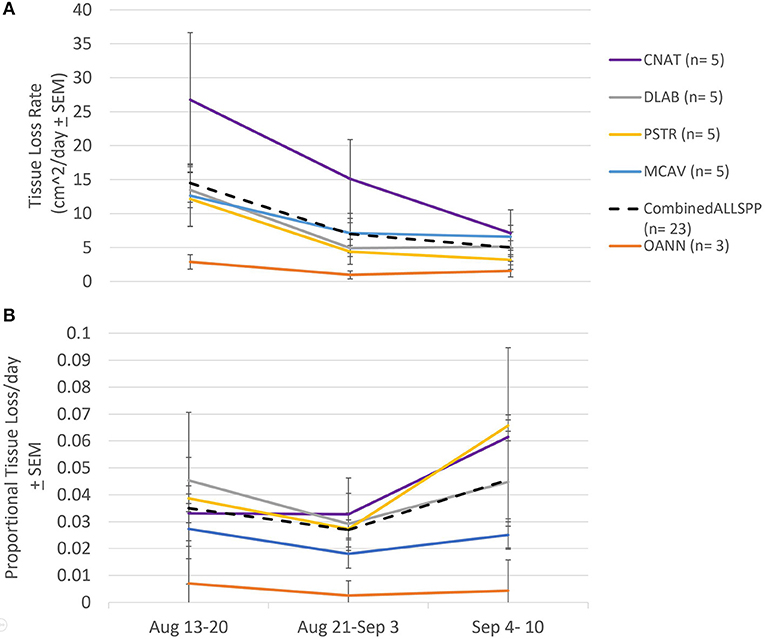
Figure 6. Species specific tissue loss rates pre-bleaching. (A) Average tissue loss rates (± standard error) among species calculated for three time frames prior to the bleaching event. No difference in tissue loss rate between species, but a significant decline in rate over the month prior to the bleaching event. CNAT, Colpophyllia natans; DLAB, Diploria labyrinthiformis; MCAV, Montastraea cavernosa; PSTR, Pseudodiploria strigosa; OANN, Orbicella annularis; Combined: average of all species combined. (B) Average proportional tissue loss rates (± standard error). No difference in tissue loss rate between species nor over time over the month prior to the bleaching event.
When tissue loss rates were considered relative to the amount of living tissue present at the previous time point (i.e., proportional tissue loss rate), they did not differ among species (F = 1.596, p = 0.234), nor through time (F = 1.714, p = 0.213), and there was no interaction between species and time (F = 0.696, p = 0.621 Figure 6B). The average proportional tissue loss rate of all species prior to the bleaching event was 3.24 ± 0.43% day−1.
There was a slowing or cessation of SCTLD progression with the onset of a bleaching event for the two species that were followed over the full time of the study (M. cavernosa and O. annularis). When considering the absolute areal tissue loss rates, there was a significant difference over time (RM ANOVA F = 2.838 p = 0.013) and a significant difference between the two species (RM ANOVA F = 30.663 p = 0.012; Figure 7). M. cavernosa had a higher rate of tissue loss than O. annularis, but for both species the rates declined at the start of the bleaching event (October 1st, 2019 initial bleaching observed, DHW= 1.27; Figure 7). However, while tissue loss was slower on M. cavernosa during the bleaching event, it was persistent on three of the five colonies during the bleaching event and into the winter. Of the two other colonies, one had lesions that stopped completely and the other had lesions that restarted and then stopped during recovery (Supplementary Table 2). Meanwhile, tissue loss completely stopped on all colonies of O. annularis by the onset of significant bleaching (October 14th, 2019) and were not observed to restart (Figure 7A).
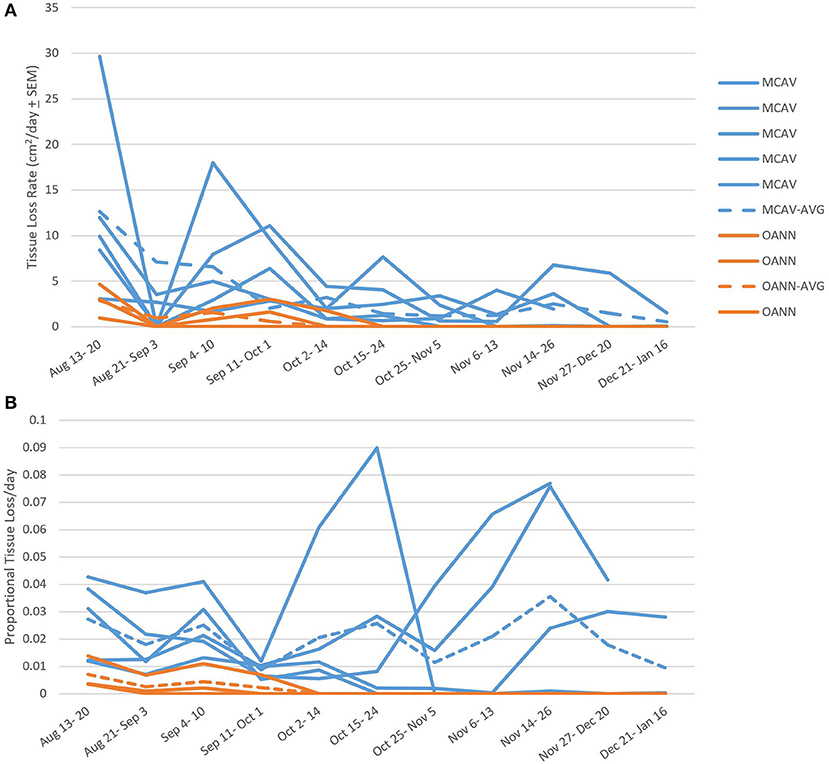
Figure 7. Species specific tissue loss rates. (A) Tissue loss rates among species calculated before, during, and after the bleaching event. Individual colony rates are marked with solid lines, while the average for the species is marked with a dashed line. There was a significant difference in tissue loss rate between species and decline in rate over time. MCAV, Montastraea cavernosa; OANN, Orbicella annularis; Combined: average of the two species combined. (B) Proportional tissue loss rate among species calculated before, during, and after the bleaching event. Individual colony rates are marked with solid lines, while the average for the species is marked with a dashed line. There was no difference in proportional tissue loss rates between species nor over time over the bleaching event.
There were no differences in proportional tissue loss rates before, during, and after the bleaching event between M. cavernosa and O. annularis (F = 7.106 p = 0.076) nor over time (F = 0.431 p = 0.920; Figure 7B). M. cavernosa had an average proportional tissue loss rate of 0.02 ± 0.0011 day−1; while O. annularis had an average proportional tissue loss rate of 0.0015 ± 0.00046 day−1, even though lesions on all colonies of this species ceased to progress after the onset of thermal stress.
There was a significant positive correlation between coral colony total surface area and tissue loss rate (p = 0.002 r = 0.611; Supplementary Figure 6). The average size of the colonies measured in this study were grouped by species, with C. natans being the largest (1529.24 ± 278.64 cm2) and P. strigosa being the smallest (482.25 ± 136.78 cm2, ANOVA F = 3.19 p = 0.038; Tukey HSD p = 0.021; Supplementary Figure 7). However, there was no relationship between coral colony total surface area and proportional tissue loss rate (p = 0.831 r = 0.047).
Both total and proportional tissue loss rates were negatively correlated with Degree Heating Weeks (DHW) (p = 3.468e-08, Kendall's tau = −0.355; Supplementary Figure 8A, p = 1.59e-04, Kendall's tau = −0.243 Supplementary Figure 8B, respectively). Total tissue loss rate also showed a significant negative correlation with water temperature, although only ~12 % of the variance was explained by this association (p = 0.047, Kendall's tau = −0.121; Supplementary Figure 8C). The proportional tissue loss rate, however, was not correlated with water temperature (p = 0.067, tau = 0.112). Both total and proportional tissue loss rate were negatively correlated with bleaching extent (p < 0.002, z = −3.09, Kendall's tau = −0.250; Supplementary Figure 8D, and p < 0.001, z = −3.746, Kendall's tau = −0.300; Supplementary Figure 8E, respectively) and there was a stronger relationship when paling was excluded (p < 0.001, z = −3.78, Kendall's tau = −0.326; Supplementary Figure 8F, and p < 0.001, z = −4.14, Kendall's tau = −0.356; Supplementary Figure 8G, respectively).
Case fatalities did not statistically differ among species prior to the bleaching event (Fisher's exact test p = 0.239; Figure 8). However, 3 of 5 P. strigosa colonies exhibited complete mortality, while all colonies of both M. cavernosa and O. annularis were alive at the onset of bleaching (39% total case fatality). By the end of the bleaching event, there was a significant difference in fatalities between species (Fisher's exact test p = 0.002; Figure 8). All five (5) colonies of D. labyrinthiformis experienced complete mortality, while all colonies of both M. cavernosa and O. annularis remained partially alive (48% total case fatality). It is important to note that by October 14th, 2019, 9 of the 23 colonies were completely dead, and 7 of the 14 remaining colonies no longer had active lesions. Two (2) months after the bleaching event, there was still a significant difference in case fatalities between species (Fisher's exact test p = 0.036; Figure 8). Colonies of C. natans, P. strigosa, and M. cavernosa experienced full mortality (65% total case fatality). All three (3) colonies of O. annularis remained partially alive despite having severely bleached.
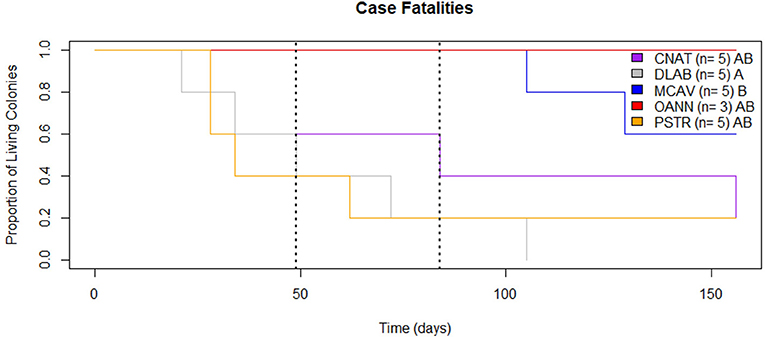
Figure 8. Case Fatalities. Proportion of SCTLD affected colonies alive throughout the monitoring period (August 13th, 2019 to January 16th, 2020). The dashed lines mark the beginning of the bleaching event (Left) and beginning of recovery (Right). Species with distinct letters (see legend) are statistically different.
Discussion
This study demonstrated 3D photogrammetry as an effective method for documenting lesion progression rates due to SCTLD. Results of this project indicate that tissue loss rates among multiple coral species commonly affected by SCTLD did not significantly differ but that tissue loss rates in two species showed correlations with thermal stress that led to bleaching. These results suggest that even though coral species become affected with SCTLD on reefs at different times (Walton et al., 2018), the impact of disease on the loss of living coral tissue is consistent among species. However, thermal stress may slow lesion progression rates and there are differences among species in how this occurs.
Sharp and Maxwell (2018) also found no difference in tissue loss rates under normal conditions between C. natans and P. strigosa, however, the rate they reported (20–40 cm2/day) was much higher than what was observed in this study (16.31 ± 4.27 cm2/day and 6.56 ± 1.78 cm2/day, respectively; Figure 6). The tissue loss rates between studies may differ due to regional differences in pathogen(s) virulence, environmental stress (Lapointe et al., 2005; Ennis et al., 2016), or coral resilience (Bruno et al., 2003; Voss and Richardson, 2006; Ennis et al., 2016). The data in the present study support dynamic impacts of SCTLD on a short-term and local level, thus it is reasonable to assume differences in tissue loss rates between regions.
In contrast, Aeby et al. (2019) showed differences in tissue loss rates between species, specifically between D. labyrinthiformis and P. strigosa, with rates similar to those recorded here. The tissue loss rates of P. strigosa in Aeby et al. (2019) were comparable to the average tissue loss rates of the same species in the present study prior to the bleaching event (5.3 ± 0.73 cm2/day compared with 6.56 ± 1.78 cm2/day; Figure 6). However, the tissue loss rates for D. labyrinthiformis reported by Aeby et al. (2019) were lower than those observed on this species in the present study (3.3 ± 1.6 cm2/day compared with 8.02 ± 1.57 cm2/day; Figure 6). While this difference in rates is much smaller than the rates from the present study compared to Sharp and Maxwell (2018), the same explanations may apply.
We found that the amount of tissue lost due to SCTLD was significantly positively correlated to the amount of tissue area available on the coral. When considered relative to this area of remaining living tissue, tissue loss rates did not differ through time. Therefore, as affected colonies lost tissue, the disease lesion area was reduced, resulting in a slower rate of absolute tissue area loss, but consistent proportional tissue loss through time. This may suggest that the virulence or abundance of the disease pathogen is dependent on the amount of living tissue available (i.e., the size of the fire is dependent on the amount of fuel) and that host resistance may not be playing a large role in how the disease manifests on the corals once they are affected.
Disease lesions on O. annularis colonies stopped in early October, while the majority of M. cavernosa colonies continued to lose tissue. This may have indicated an increase in host defense mechanisms successfully combating the disease or a decrease in rate in later compared to initial stages of lesion development. While this study cannot fully describe the tissue loss rates throughout the entire lesion development, we do not suspect stage of lesion development significantly impacted the rate of tissue loss since the proportional rates were comparable throughout the monitoring period. Instead, the decrease and halting of tissue loss recorded here coincided with the onset of a thermal stress event. Sharp et al. (2020) also showed a decrease in SCTLD incidence associated with thermal stress and high temperatures in the summer of 2018, but disease activity remained reduced the following year and did not show a further reduced response in the summer of 2019. Corals are mutualist hosts to algal symbionts that supply them with the majority of their metabolic requirements (Houlbrèque and Ferrier-Pagès, 2009). However, during thermal anomalies, concentrations of these symbionts within the host significantly reduce as the coral “bleaches” (Jokiel, 2004), which is sometimes followed by a disease outbreak (Miller et al., 2006, 2009; Smith et al., 2013), likely due to compromised coral host immunity (Bruno et al., 2007; Muller et al., 2008; Brandt and McManus, 2009). In this study, M. cavernosa colonies only displayed visual signs of paling, most often at the disease edge, and lesions on this species were statistically unaffected by the bleaching event (Figure 7). However, O. annularis colonies experienced severe bleaching and all lesions on this species stopped at the onset or shortly after bleaching began (Figure 7). The bleaching responses of these two species in this study is comparable to responses recorded in the same region during the 2005 bleaching event, where M. cavernosa experienced significantly lower bleaching than O. annularis (formerly M. annularis) and no significant decrease in coral cover (Smith et al., 2013).
In this study, there was a stronger correlation between M. cavernosa and O. annularis tissue loss rates and DHW than with temperature, suggesting that accumulated thermal stress affecting the host and associated symbionts is what impacted lesion progression rates rather than an external effect of temperature on the virulence of possible SCTLD pathogen(s). No corals previously affected by SCTLD developed new lesions after the recovery period, however, further monitoring into the cooler months may have shown otherwise. All monitored colonies of O. annularis fully bleached and did not develop new lesions, while the colonies of M. cavernosa did not bleach but lesions did slow down and stop during bleaching. During normal thermal conditions, some colonies of Orbicella spp. and M. cavernosa exhibit partial bleaching or paling preceding the lesion boundary of SCTLD (Aeby et al., 2019; Brandt and Meiling per. obs.) where the polyps may already be affected but have yet to lose tissue. None of the colonies of O. annularis monitored in this study exhibited bleaching margins and all colonies' lesions stopped. In addition, only 1/5 colonies of M. cavernosa exhibited bleaching margins at the lesion edge, and this was the first colony of this species in which the lesion stopped. The occasional bleaching margin on diseased colonies was not associated with thermal stress nor was it related to lesion activity in this study, which may further support variable susceptibility to SCTLD among endosymbiont species or suggest other factors contributed to lesion cessation. The potential relationship between the diseased coral host and endosymbionts is further supported by the crystalline inclusion bodies (CIB) found in the gastrodermis within vacuoles with zooxanthellae of necrosing polyps (Landsberg et al., 2018). The location of these CIBs may suggest the pathogen(s) is being ingested during heterotrophic feeding by the coral, with subsequent possibility of infection to either the coral host or zooxanthellae.
Interestingly, unlike other coral diseases, the activity of SCTLD within the present study slowed or halted when thermal stress increased. Many other coral diseases, such as white plague (Weil et al., 2009), black band disease (Edmunds, 1991; Muller and Van Woesik, 2011), and white-band disease (Muller et al., 2018) have been positively associated with temperature and/or thermal stress. However, there have been some coral diseases that halt during bleaching stress. Brandt and McManus (2009) found that dark spot lesions on Siderastrea siderea disappeared during thermal stress and bleaching, possibly because of a negative relationship between the disease and hosting of thermally tolerant symbionts (Correa et al., 2009). The emergence of SCLTD in Florida has been associated with a mass bleaching event that coincided with its initial observations (Precht et al., 2016), but it was also noted that bleaching of an individual colony is not a prerequisite for SCTLD (Gintert et al., 2019). It is also possible that the two events were a coincidence, further supported by Walton et al. (2018) predicting the disease emerged months earlier than identified by Precht et al. (2016). Muller and van Woesik (2020) found no relationship between SCTLD prevalence and temperature in Florida reports; however, this study did not include marked corals monitored frequently through time like the present study. The results of the present study correlating thermal stress and disease activity should be interpreted with caution and controlled laboratory experiments should be conducted to further investigate the effect of thermal stress on SCTLD lesions.
Trends in O. annularis proportional tissue loss rates were consistent with the absolute tissue loss rate; however, there was large variation in the proportional tissue loss rates among M. cavernosa colonies, potentially suggesting differences in intra-species resilience for this species. Genotypic resilience has been documented for other diseases within the species Acropora cervicornis, in which there was significant genotypic variation in both risk of transmission and tissue loss rate (Miller et al., 2019). Intra-species differences in disease resilience in response to thermal stress have also been documented in the Pacific species Montipora capitata, in which one color morph was more disease resilient and the other was more bleaching tolerant (Shore-Maggio et al., 2018). The presence of genotypic variability in disease activity can serve as a target for management, by selecting for more disease resistant genotypes for restoration. Our results suggest that this may be a possibility for at least M. cavernosa.
Prior to the bleaching event, there was no difference in case fatalities among species with SCTLD. Considering all colonies were approximately equal size, this supports our findings of comparable tissue loss rates among species because all species were experiencing full mortality at approximately the same time. However, case fatalities differed among all five (5) monitored species during and after the mass bleaching event. The ultimate case fatality for the full six (6) months of monitoring was 65%, which is lower than that observed in Florida in just 1 month (73% Aeby et al., 2019). The higher case fatality is most likely due to monitoring of highly susceptible species in Florida (M. jacksoni and D. stokesii), which experienced full mortality very quickly after initial disease signs, rather than a true regional difference. In addition, the monitoring site reported in Aeby et al. (2019) had higher coral cover, which may have contributed to the expedited spread of the disease and resulting mortality.
Even the lowest of the SCTLD tissue loss rates recorded in this study have the potential to significantly alter reef communities. This disease is a threat to Caribbean reefs not only because of how quickly it spreads, but because of how rapidly it kills corals. The tissue loss rates of SCTLD are unprecedented, causing loss of tissue up to 35-fold higher than other diseases such as white plague (0.8 ± 0.2 cm2/day, Clemens and Brandt, 2015), black band (0.52 cm/day, Sato et al., 2011), or white syndrome (2.28 ± 0.21 cm/day, Pollock et al., 2013). In addition to SCTLD lesions progressing faster than other diseases, many affected colonies experienced 100% mortality. Previous diseases, such as white plague, do not always result in full mortality of affected colonies. During the six months of monitoring for this study, 65% of the colonies experienced full mortality (Figure 8). This case fatality rate is comparable to losses seen from the largest bleaching event and white plague outbreak in the USVI over an entire year (Miller et al., 2009). SCTLD is a much more serious threat to Caribbean reef communities than previously documented coral diseases because it is a prolonged outbreak that may only lessen during particular seasons rather than completely stop (Aeby et al., 2019). While other coral diseases have peak prevalence during warm months and then drop to minimal occurrences during cold periods, SCTLD appears to slow down during warm months and persists year-round. This poses an enormous threat to coral communities because reefs with SCTLD are now stressed continuously throughout the entire year.
The results from the present study suggest species-specific intervention should be prioritized by incidence rates, rather than lesion progression rates because they are comparable among species. If there is a negative relationship between thermal stress and lesion progression, efforts and resources for managing SCTLD may be more effectively distributed during and following a bleaching event. Currently, the most practiced method of intervention is multiple applications of a mixture of Base2B (Ocean Alchemists) with amoxicillin around the lesion border of affected corals (Neely et al., 2020). Although this method has been highly effective in Florida (Neely et al., 2020), it is laborious and financially demanding. We propose that if progression rates of SCTLD predictably reduce during thermal stress events, this time period may provide an opportunity to upscale intervention activities to more effectively reduce the effects of SCTLD.
Here we show the highly precise results of monitoring SCTLD lesions with 3D photogrammetry. Under normal conditions, we found no difference in areal lesion progression rates among species affected by SCTLD but a significant decrease over time. Our monitoring period was serendipitously intercepted by a thermal stress event which we believe contributed to the decline in rates over time. It is notable that all lesions on colonies of O. annularis stopped at the onset of thermal stress. SCTLD lesions reported in this study are similar to other studies, but magnitudes higher than other rapid tissue loss diseases which shows how detrimental the disease is. Further research needs to be conducted to quickly identify best practices for propagating more colonies and increasing resilience and resistance of susceptible species.
Data Availability Statement
The raw data supporting the conclusions of this article will be made available by the authors, without undue reservation.
Author Contributions
SM, MB, TS, and EM were involved with experimental design, statistical analyses, and editing this publication. SM and MB also contributed to data collection. All authors contributed to the article and approved the submitted version.
Funding
Funding was provided for this project by VI EPSCoR (NSF #0814417), a RAPID grant to MB and EM from the NSF Biological Oceanography Program (NSF #1928753), OCOVI CARICOOS, the Virgin Islands Department of Planning and Natural Resources Division of Coastal Zone Management, and Mote Marine Laboratory Eminent Scholarship to EM and the NOAA Coral Reef Conservation Program (NA17NOS4820033/ G007PNRT17).
Conflict of Interest
The authors declare that the research was conducted in the absence of any commercial or financial relationships that could be construed as a potential conflict of interest.
Acknowledgments
This work could not have been completed without the hours of lab and fieldwork dedicated by the Brandt Lab Beasts (Brad Arrington, Danielle Lasseigne, Daniel Mele, Kathryn Cobleigh, Adam Glahn, Natasha Bestrom, Joseph Townsend, and Alex Gutting), and technical assistance from Rosmin Ennis and Viktor Brandtneris.
Supplementary Material
The Supplementary Material for this article can be found online at: https://www.frontiersin.org/articles/10.3389/fmars.2020.597643/full#supplementary-material
References
Aeby, G., Ushijima, B., Campbell, J. E., Jones, S., Williams, G., Meyer, J. L., et al. (2019). Pathogenesis of a tissue loss disease affecting multiple species of corals along the Florida Reef Tract. Front. Marine Sci. 6:678. doi: 10.3389/fmars.2019.00678
Booker, R. (2018). Framer. Available online at: https://github.com/ryanbooker/framer (accessed August 10, 2019).
Brandt, M. E. (2019). “Stony coral tissue loss disease observations in St. Thomas,” in Presentation to Emergency Session of the Virgin Islands Coral Reef Advisory Group.
Brandt, M. E., and McManus, J. W. (2009). Disease incidence is related to bleaching extent in reef-building corals. Ecology 90, 2859–2867. doi: 10.1890/08-0445.1
Bruckner, A. W. (2007). Field guide to western atlantic coral diseases and other causes of coral mortality. NOAA, UNEP-WCMC, PADI. Available online at: https://www.agrra.org/wp-content/uploads/2019/03/Final-WA-disease-id-cards-Bruckner-2.pdf (accessed October 16, 2018).
Bruno, J. F., Petes, L. E., Drew Harvell, C., and Hettinger, A. (2003). Nutrient enrichment can increase the severity of coral diseases. Ecol. Lett. 6, 1056–1061.doi: 10.1046/j.1461-0248.2003.00544.x
Bruno, J. F., Selig, E. R., Casey, K. S., Page, C. A., Willis, B. L., Harvell, C. D., et al. (2007). Thermal stress and coral cover as drivers of coral disease outbreaks. PLoS Biol. 5:e50124. doi: 10.1371/journal.pbio.0050124
Chong, A. K., and Stratford, P. (2002). Underwater digital stereo-observation technique for red hydrocoral study. Photogr. Eng. Remote Sens. 68, 745–752.
Clemens, E., and Brandt, M. (2015). Multiple mechanisms of transmission of the caribbean coral disease white plague. Coral Reefs 34, 1179–1188. doi: 10.1007/s00338-015-1327-6
Correa, A. M. S., Brandt, M. E., Smith, T. B., Thornhill, D. J., and Baker, A. C. (2009). Symbiodinium associations with diseased and healthy scleractinian corals. Coral Reefs 28, 437–448. doi: 10.1007/s00338-008-0464-6
Edmunds, P. J. (1991). Extent and effect of black band disease on a caribbean reef. Coral Reefs 10, 161–165. doi: 10.1007/BF00572175
Ennis, R. S., Brandt, M. E., Grimes, K. R. W., and Smith, T. B. (2016). Coral reef health response to chronic and acute changes in water quality in St. Thomas, United States Virgin Islands. Mar. Pollut. Bull. 111, 418–427. doi: 10.1016/j.marpolbul.2016.07.033
Ennis, R. S., Kadison, E., Heidmann, S., Brant, M. E., Henderson, L., and Smith, T. B. (2019). “The United States virgin islands territorial coral reef monitoring program,” in 2019 Annual Report, University of the Virgin Islands, United States Virgin Islands. 308p.
Ferrari, R., Figueira, W. F., Pratchett, M. S., Boube, T., Adam, A., Kobelkowsky-Vidrio, T., et al. (2017). 3D photogrammetry quantifies growth and external erosion of individual coral colonies and skeletons. Sci. Rep. 7, 1–9. doi: 10.1038/s41598-017-16408-z
Florida Keys National Marine Sanctuary (2019). Florida Reef Tract Corals Disease Outbreak: Disease. Retrieved from: https://floridakeys.noaa.gov/coral-disease/disease.html (accessed March 8, 2019).
Gintert, B. E., Precht, W. F., Fura, R., Rogers, K., Rice, M., Precht, L. L., et al. (2019). Regional coral disease outbreak overwhelms impacts from a local dredge project. Environ. Monit. Assess. 191:630. doi: 10.1007/s10661-019-7767-7
Green, E. P., and Bruckner, A. W. (2000). The significance of coral disease epizootiology for coral reef conservation. Biol. Conserv. 96, 347–361. doi: 10.1016/S0006-3207(00)00073-2
Gutiérrez-Heredia, L., Benzoni, F., Murphy, E., and Reynaud, E. G. (2016). End to end digitisation and analysis of three-dimensional coral models, from communities to corallites. PLoS ONE 11:e0149641. doi: 10.1371/journal.pone.0149641
Gutiérrez-Heredia, L., D'Helft, C., and Reynaud, E. G. (2015). Simple methods for interactive 3D modeling, measurements, and digital databases of coral skeletons. Limnol. Oceanogr. 13, 178–193. doi: 10.1002/lom3.10017
Houlbrèque, F., and Ferrier-Pagès, C. (2009). Heterotrophy in tropical scleractinian corals. Biol. Rev. 84, 1–17. doi: 10.1111/j.1469-185X.2008.00058.x
Jokiel, P. L. (2004). “Temperature stress and coral bleaching,” in Coralhealth and Disease, eds. Rosenberg and Y. Loya (New York, NY: Springer-Verlag), 401–425. doi: 10.1007/978-3-662-06414-6_23
Kramer, P. R., Roth, L., and Lang, J. (2019). Map of stony coral tissue loss disease outbreak in the Caribbean. Available online at: www.agrra.org
Landsberg, J. H., Kiryu, Y., Wilson, P., Perry, N., Waters, Y., and Huebner, L. (2018). “Disease lab analysis updates,” in Powerpoint Presentation Presented to the Florida Coral Disease Advisory Counsil.
Lapointe, B. E., Barile, P. J., Littler, M. M., and Littler, D. S. (2005). Macroalgal blooms on southeast florida coral reefs: II. Cross-shelf discrimination of nitrogen sources indicates widespread assimilation of sewage nitrogen. Harmful Algae 4, 1106–1122. doi: 10.1016/j.hal.2005.06.002
Mallison, H. (2015). Photogrammetry tutorial 11: how to handle a project in Agisoft Photoscan. Dinosaurpaleo. Available online at: https://dinosaurpalaeo.wordpress.com/2015/10/11/photogrammetry-tutorial-11-how-to-handle-a-project-in-agisoft-photoscan/ (accessed August 13, 2019).
Miller, J., Muller, E., Rogers, C., Waara, R., Atkinson, A., Whelan, K. R. T., et al. (2009). Coral disease following massive bleaching in 2005 causes 60% decline in coral cover on reefs in the US Virgin Islands. Coral Reefs 28:925. doi: 10.1007/s00338-009-0531-7
Miller, J., Waara, R., Muller, E., and Rogers, C. (2006). Coral bleaching and disease combine to cause extensive mortality on reefs in US Virgin Islands. Coral Reefs 25:418. doi: 10.1007/s00338-006-0125-6
Miller, M. W., Colburn, P. J., Pontes, E., Williams, D. E., Bright, A. J., Serrano, X. M., et al. (2019). Genotypic variation in disease susceptibility among cultured stocks of elkhorn and staghorn corals. PeerJ 7:e6751. doi: 10.7717/peerj.6751
Muller, E., and van Woesik, R. (2020). Spatial epidemiology of the stony-coral-tissue-loss-disease in Florida. Front. Mar. Sci. 7:163. doi: 10.3389/fmars.2020.00163
Muller, E. M., Bartels, E., and Baums, I. B. (2018). Bleaching causes loss of disease resistance within the threatened coral species Acropora cervicornis. Elife 7:e35066. doi: 10.7554/eLife.35066
Muller, E. M., Rogers, C. S., Spitzack, A. S., and van Woesik, R. (2008). Bleaching increases likelihood of disease on Acropora palmata (Lamarck) in Hawksnest Bay, St. John, U.S. Virgin Islands. Coral Reefs 27, 191–195. doi: 10.1007/s00338-007-0310-2
Muller, E. M., and Van Woesik, R. (2011). Black-band disease dynamics: Prevalence, incidence, and acclimatization to light. J. Exp. Marine Biol. Ecol. 397, 52–57. doi: 10.1016/j.jembe.2010.11.002
Neely, K. (2018). Surveying the Florida Keys Southern Coral Disease Boundary. Miami, FL: Florida DEP. 1–15.
Neely, K., Macauly, K., Hower, E., and Dobler, M. (2020). Intervention Work: Florida Keys. Powerpoint presentation.
NOAA Coral Reef Information System (2019). NOAA Coral Reef Information System. Retrieved from: https://www.coris.noaa.gov/portals/florida.html (accessed March 8, 2019).
NOAA Stony Coral Tissue Loss Disease Case Definition (2018). NOAA stony coral tissue loss disease case definition. Available online at: https://floridadep.gov/sites/default/files/Copy%20of%20StonyCoralTissueLossDisease_CaseDefinition%20final%2010022018.pdf (accessed August 13, 2020).
Olinger, L. K., Scott, A. R., McMurray, S. E., and Pawlik, J. R. (2019). Growth estimates of Caribbean reef sponges on a shipwreck using 3D photogrammetry. Sci. Rep. 9, 1–12. doi: 10.1038/s41598-019-54681-2
Pollock, F. J., Katz, S. M., Bourne, D. G., and Willis, B. L. (2013). Cymo melanodactylus crabs slow progression of white syndrome lesions on corals. Coral Reefs 32, 43–48. doi: 10.1007/s00338-012-0978-9
Precht, W. F., Gintert, B. E., Robbart, M. L., Fura, R., and van Woesik, R. (2016). Unprecedented disease related coral mortality in Southeastern Florida. Sci. Rep. 6:31374. doi: 10.1038/srep31374
Reichert, J., Schellenberg, J., Schubert, P., and Wilke, T. (2016). 3D scanning as a highly precise, reproducible, and minimally invasive method for surface area and volume measurements of scleractinian corals. Limnol. Oceanogr. 14, 518–526. doi: 10.1002/lom3.10109
Sato, Y., Bourne, D. G., and Willis, B. L. (2011). Effects of temperature and light on the progression of black band disease on the reef coral, Montipora hispida. Coral Reefs 30:753. doi: 10.1007/s00338-011-0751-5
Sharp, W., and Maxwell, K. (2018). Investigating the ongoing coral disease outbreak in the Florida Keys: collecting corals to diagnose the etiological agent(s) and establishing sentinel sites to monitor transmission rates and the spatial progression of the disease. Florida Fish and Wildlife Conservation Commission.
Sharp, W., Maxwell, K., Smith, K., and Hunt, J. (2020). Investigating the ongoing coral disease outbreak in the Florida Keys: continued SCTLD monitoring at middle and lower Florida Keys, experimental coral restoration of SCTLD-susceptible coral species, and assessing the prevalence of SCTLD on intermediate reef habitat. Florida Fish and Wildlife Conservation Commission.
Shore-Maggio, A., Callahan, S. M., and Aeby, G. S. (2018). Trade-offs in disease and bleaching susceptibility among two color morphs of the Hawaiian reef coral, Montipora capitata. Coral Reefs 37, 507–517. doi: 10.1007/s00338-018-1675-0
Smith, T. B., Brandt, M. E., Calnan, J. M., Nemeth, R. S., Blondeau, J., Kadison, E., et al. (2013). Convergent mortality responses of Caribbean coral species to seawater arming. Ecosphere 4, 1–40. doi: 10.1890/ES13-00107.1
Smith, T. B., Ennis, R., Kadison, E., Nemeth, R. S., and Henderson, L. M. (2016a). “The united states virgin islands territorial coral reef monitoring program,” in 2016 Annual Report. University of the Virgin Islands, United States Virgin Islands. 286.
Smith, T. B., Gyory, J., Brandt, M. E., Miller, W. J., Jossart, J., and Nemeth, R. S. (2016b). Caribbean mesophotic coral ecosystems are unlikely climate change refugia. Glob. Change Biol. 22, 2756–2765. doi: 10.1111/gcb.13175
van Woesik, R., and Randall, C. J. (2017). Coral disease hotspots in the Caribbean. Ecosphere 8:e01814. doi: 10.1002/ecs2.1814
Voss, J. D., and Richardson, L. L. (2006). Nutrient enrichment enhances black band disease progression in corals. Coral Reefs. 25, 569–576. doi: 10.1007/s00338-006-0131-8
Walton, C. J., Hayes, N. K., and Gilliam, D. S. (2018). Impacts of a regional, multi-year, multi-species coral disease outbreak in Southeast Florida. Front. Marine Sci. 5:323. doi: 10.3389/fmars.2018.00323
Keywords: stony coral tissue loss disease, coral disease, thermal stress, lesion progression rate, 3D photogrammetry, Caribbean, Bleaching, United States Virgin Islands
Citation: Meiling S, Muller EM, Smith TB and Brandt ME (2020) 3D Photogrammetry Reveals Dynamics of Stony Coral Tissue Loss Disease (SCTLD) Lesion Progression Across a Thermal Stress Event. Front. Mar. Sci. 7:597643. doi: 10.3389/fmars.2020.597643
Received: 24 August 2020; Accepted: 30 November 2020;
Published: 22 December 2020.
Edited by:
Cliff Ross, University of North Florida, United StatesReviewed by:
Aldo Cróquer, Simón Bolívar University, VenezuelaDouglas Fenner, NOAA NMFS Contractor, United States
Copyright © 2020 Meiling, Muller, Smith and Brandt. This is an open-access article distributed under the terms of the Creative Commons Attribution License (CC BY). The use, distribution or reproduction in other forums is permitted, provided the original author(s) and the copyright owner(s) are credited and that the original publication in this journal is cited, in accordance with accepted academic practice. No use, distribution or reproduction is permitted which does not comply with these terms.
*Correspondence: Sonora Meiling, sonora.meiling@gmail.com