 Jun Zhou1
 Zhuo-Yi Zhu
 Huan-Ting Hu
 Gui-Ling Zhang
- 1State Key Laboratory of Estuarine and Coastal Research, East China Normal University, Shanghai, China
- 2School of Oceanography, Shanghai Jiao Tong University, Shanghai, China
- 3Key Laboratory of Marine Chemistry Theory and Technology, Ministry of Education/Institute for Advanced Ocean Study, Ocean University of China, Qingdao, China
The Changjiang Estuary and its adjacent East China Sea are among the largest coastal hypoxic sites in the world. The oxygen depletion in the near-bottom waters (e.g., meters above the seabed) off the Changjiang Estuary is caused by water column respiration (WCR) and sedimentary oxygen respiration (SOR). It is essential to quantify the contributions of WCR and SOR to total apparent oxygen utilization (AOU) to understand the occurrence of hypoxia off the Changjiang Estuary. In this work, we analyzed the δ18O and O2/Ar values of marine dissolved gas samples collected during a field investigation in July 2018. We observed that the δ18O values of dissolved oxygen in near-bottom waters ranged from 1.039 to 8.457‰ (vs. air), generally higher than those of surface waters (−5.366 to 2.336‰). For all the sub-pycnocline samples, the δ18O values were negatively related to O2 concentrations (r2 = 0.97), indicating apparent fractionation of δ18O during oxygen depletion in the water column. Based on two independent isotope fractionation models that quantified the isotopic distillation of dissolved oxygen concentration and its δ18O, the mean contributions of WCR and SOR to total near-bottom AOU were calculated as 53 and 47%, respectively. Beneath the pycnocline, the WCR contribution to the total AOU varied from 24 to 69%, and the SOR contribution varied from 31 to 76%. The pooled samples beneath both the pycnocline and upper mixed layer indicated that WCR contributions (%) to total AOU increased with increasing AOU (μmol/L), whereas SOR% – AOU had the reverse trend. We propose that the WCR% and SOR% contributions to the total AOU of the sub-pycnocline waters are dynamic, not stationary, with changes in ambient environmental factors. Under hypoxic conditions, we observed that up to 70% of the total AOU was contributed by WCR, indicating that WCR is the major oxygen consumption mechanism under hypoxia; that is, WCR plays a vital role in driving the dissolved oxygen to become hypoxic off the Changjiang Estuary.
Introduction
Dissolved oxygen is essential and of great importance for most marine habitats. Dissolved oxygen depletion in estuarine and coastal near-bottom waters is worsening worldwide (2001), causing negative effects on the structure of marine ecosystems and their biodiversity (Nilsson and Rosenberg, 1994; Crain, 2007). Severe oxygen depletion, or hypoxia, destroys fishery resources and brings economic losses (Sindermann and Swanson, 1979; Naqvi et al., 2000). In addition, the change in the oxygen concentration changes the redox potential of the water environment, alters the balance of oxygen, carbon and nitrogen cycles, and hence produces feedback to global climate change. Therefore, hypoxia has recently attracted much attention in marine research (Diaz, 2001; Keeling et al., 2010).
The Changjiang Estuary and its adjacent offshore areas are typical estuarine and coastal sea environments that are affected by one of the largest rivers worldwide. In recent decades, Changjiang fluvial nutrients have increased more than ten times, and such eutrophication trends are expected to continue (Zhang et al., 1999; Yan et al., 2003; Daoji and Daler, 2004). Under the eutrophication background, estuarine and coastal summer algal blooms have increased dramatically in recent decades (Liu et al., 2013; Li et al., 2014). As the water depth is only tens of meters, excess organic matter generated in surface waters can quickly settle and reach near-bottom waters, which fuels oxygen consumption at the bottom of the water column. Furthermore, the water column is usually well stratified in summer, with high-temperature and low-salinity Changjiang diluted water at the surface and high-salinity Kuroshio-originated water prevailing at the bottom (Su, 1998). The degradation of this excess organic matter in the near-bottom waters has a strong influence on dissolved oxygen off the Changjiang Estuary.
Hypoxia off the Changjiang Estuary is unstable, in contrast to other marginal sea hypoxic conditions, such as the Gulf of Mexico (Turner et al., 2005) and the Baltic Sea (Carstensen et al., 2014). The earliest recorded hypoxia (1900 km2) off the Changjiang Estuary was in August 1959, with a minimum dissolved oxygen concentration ([O2]) as low as 0.34 mg/L (Office of Integrated Oceanographic Survey of China, 1961). Hypoxic areas have increased significantly in the last 20 years relative to earlier times. In August 1999, 2006, and 2013, hypoxic areas were 13,700 km2, 15,400 km2, and 11,150 km2, respectively (Li et al., 2002; Zhu et al., 2011, 2017). To the best of our knowledge, another hypoxic event, with an area likely over 10,000 km2, occurred off the Changjiang Estuary in the summer of 2016 (WD Zhai, personal communication). Although hypoxia is unstable and can disappear for several years before the next occurrence of a severe hypoxic event (Zhu et al., 2017), in the 21st century, the Changjiang Estuary and adjacent East China Sea (ECS) became another coastal sea region with a hypoxic area exceeding 10,000 km2, similar to the Baltic Sea (Carstensen et al., 2014), the Gulf of Mexico (Wendel, 2015), and the northwestern shelf of the Black Sea (Capet et al., 2013).
The occurrence of hypoxia in near-bottom waters is primarily due to the stratification of the water column and the degradation of excess organic matter (Diaz, 2001). This also applies to the case off the Changjiang Estuary (Li et al., 2002; Wei et al., 2007, 2017; Chi et al., 2020). With hypoxic mechanism studies in recent years, it has been revealed that wind (Ni et al., 2016; Zhang et al., 2019), tides (Zhu et al., 2017), topography (Wang, 2009), and [O2] in Kuroshio waters (Qian et al., 2017) also have an important influence on the occurrence, development, and/or severity of hypoxia.
Despite the above hypoxic mechanism studies, integrated research that quantified both sediment oxygen respiration (SOR) and water column respiration (WCR) contributions is still sparse. On the one hand, the locations of hypoxia vary from year to year (Zhu et al., 2011), indicating that the floating and sinking of organic matter (i.e., WCR), rather than stationary sediment (i.e., SOR), play a more important role in the formation of hypoxia. Studies that focused on water column processes provide additional evidence that WCR dominates hypoxia. For example, hypoxia tends to correlate with sites with high chlorophyll concentrations and high sinking rates in the water column (Li et al., 2018), and the degraded organic matter that fuels hypoxia is of marine origin (Wang et al., 2016, 2017). In addition, a significant relationship between a high chlorophyll concentration in the surface waters and low [O2] in the near-bottom waters was observed (Chen et al., 2017). However, some work that focused on sediments highlighted the contribution of SOR to the occurrence of hypoxia. For example, a study based on the radium-thorium imbalance method indicated that the SOR contribution ranged from 6 to 61% of the total oxygen depletion in the near-bottom waters (Cai et al., 2014). Furthermore, in situ SOR incubations conducted on the deck suggested that the contribution of SOR ranged from 15% (Song et al., 2016) to 100% (Zhang et al., 2017). The reported SOR contribution range varied greatly (15–100%) (Song et al., 2016; Zhang et al., 2017), indicating that the contribution of SOR may have a dynamic spatial and/or temporal distribution gradient. Due to the lack of integrated WCR and SOR studies, WCR% (the WCR contribution to total apparent oxygen utilization (AOU) in percent) and SOR% (the SOR contribution to total AOU in percent) in the total oxygen depletion of near-bottom waters remain unclear. This uncertainty hinders the comprehensive understanding of the occurrence of hypoxia, preventing accurate hypoxia prediction (e.g., by modeling), and hence interferes with the formulation of environmental protection policies in the future.
Oxygen has three natural stable isotopes (16O-99.76, 17O-0.04, and 18O-0.20%). Fractionation of oxygen usually follows a mass-dependent law; for example, 18O is less preferred in aerobic respiration than 16O (Lane and Dole, 1956). In the water column, [O2] is consumed by various processes but seldom reaches zero (Zhu et al., 2011; Wang et al., 2017), resulting in enriched 18O in residual O2 due to isotopic fractionation caused by respiration. However, the oxygenated depth in sediments is usually only a few millimeters, beneath which [O2] could be totally consumed. Previous studies reported that fractionation factors (ε) of WCR range from −12 to −25‰ (Bender and Grande, 1987) and SOR ranges from 0 to 3‰ (Brandes and Devol, 1997). Because of the significant differences between WCR and SOR fractionation factors, it is possible to distinguish the different isotopic effects of WCR and SOR on dissolved oxygen 18O and hence evaluate the WCR% and SOR% contribution to total AOU in the near-bottom waters. In the Gulf of Mexico, SOR contributed an average of 73% to the total bottom AOU under nonhypoxic circumstances, but the contribution of WCR was larger when hypoxia occurred (Quinones-Rivera et al., 2007). Later, it was found that there may be a lack of a relationship between declining O2 and δ18O in the water column (Ostrom et al., 2014). However, to the best of our knowledge, the dissolved gas 18O approach has never been applied to hypoxia off the Changjiang Estuary, and the contributions of WCR and SOR remain largely unclear (Cai et al., 2014; Song et al., 2016).
Therefore, we bring up the question of the spatial features of WCR and SOR% regarding the near-bottom AOU off the Changjiang Estuary and adjacent ECS and the implications for the occurrence of hypoxia. To address this question, we conducted a cruise off the Changjiang Estuary and adjacent ECS in July 2018. Dissolved gas samples for δ18O analyses were collected onboard into a pre-vacuumed bottle and analyzed in the laboratory. Then, we interpreted the δ18O data via a self-developed isotopic model and via a reported model (Fry, 2006; Quinones-Rivera et al., 2007). We also applied sensitivity tests for the modeled WCR% and SOR% using different WCR fractionation factors. We discussed the potential controlling factors of the WCR% and SOR%, especially for the sub-pycnocline [O2]. Finally, we proposed a schematic oxygen consumption mechanism behind the occurrence of hypoxia off the Changjiang Estuary.
Materials and Methods
Field Sampling
The field investigation was conducted in July 2018, covering the Changjiang Estuary and its adjacent coastal sea (Figure 1). Discrete water samples for dissolved gas analyses were collected by Niskin samplers attached to a CTD (Seabird 911), which also measured the temperature and salinity profile. Surface samples were collected 3 m beneath the surface, and near-bottom waters were collected ~2 m above the sea bed. At stations D3 and E2, water samples at the middle layers (but beneath the pycnocline) were also collected (Figure 1).
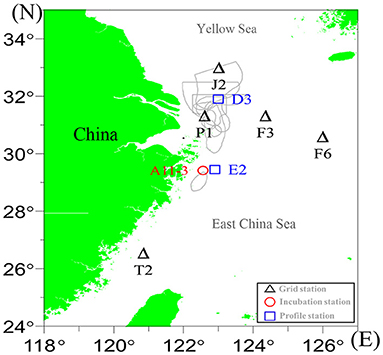
Figure 1. The study area and sampling stations. Gray lines indicate the observed hypoxia in previous studies derived from Zhu et al. (2011).
On board the ship, water samples were collected following the same protocol as that used by Reuer et al. (2007). Briefly, homemade glass flasks (500 mL) with Louwers-Hanique valves on top (Supplementary Figure 1) were thoroughly rinsed with deionized water. All internal valves were cleaned, and all O-rings were greased for better sealing. Sample flasks were poisoned with saturated HgCl2 (~75 μL), dried at 40°C, and then evacuated to 10−5 mbar. We usually collected ~200 ml (at most 250 ml of water) of seawater from the Niskin sampler. Bubble-free seawater entered the pre-evacuated sample flask through the side arm of a Louwers-Hanique valve, while dripping water maintained a good seal during the whole collection period. Collected seawater samples had a final HgCl2 concentration higher than 21 μg/mL, higher than the 20 μg/mL concentration recommended by Kirkwood (1992), ensuring that the dissolved gases preserved the in situ isotopic compositions. Flasks were stored at room temperature until analyses were conducted in the laboratory.
Dark Incubation
We also performed a dark incubation experiment using surface seawater to determine the respiration fractionation factor for living organisms off the Changjiang Estuary. Basically, the surface water of station A11-3 (Figure 1) was collected into a few independent BOD bottles, incubated for 0, 300, 450, and 760 h, collected into the same pre-evacuated sample flasks, and then analyzed for δ18O values.
Laboratory Measurements
In the laboratory, headspace dissolved gases were equilibrated with underneath seawater in the sample flasks at room temperature (22°C) for at least 48 h. The equilibrated dissolved gases were then extracted (Supplementary Figure 2) and purified through a vacuum line (Supplementary Figure 3) to remove the CO2 and water vapor in the gas mixture. The final gas mixture containing O2, Ar, and N2 was collected onto a sample finger filled with silica gel at liquid nitrogen temperature. A detailed description and schematics of the sampling and processing of dissolved gas samples can be found in Supplementary Materials.
The sample finger was heated at 100°C for 15 min to mix all gases well before introduction into the mass spectrometer, a Delta V plus with a dual inlet system, for isotopic analysis. For every sample, we ran 3 blocks of 15 cycles in total, with a pre-delay time of 20 s. The integration time for every cycle was 10 s. The instrument was equipped with Faraday cups with masses of 28, 32, 34, and 40, so δ18O and δO2/Ar could be simultaneously analyzed in this study; δ18O and δO2/Ar were calculated as follows:
During the period of measurement, the result of the reference gas vs. reference gas (so-called zero enrichment) was −0.018‰ (±0.022 SD, 1σ) and 0.1‰ (±0.2 SD, 1σ) for δ18O and δO2/Ar, respectively. For all sample data, a chemical slope calibration was conducted to correct the isotopic interference of δ18O values caused by the differences in elemental ratios (N2/O2/Ar ratios) between sample gases and the reference gas. We applied two calibration curves of δN2/O2 vs. δ18O and δAr/O2 vs. δ18O to correct the δ18O values of all samples.
Then, all data were normalized to concurrent analyses of air (δ18O ≡ 0‰, δO2/Ar ≡ 0‰) collected in the back yard of the laboratory, Shanghai, China. During the course of this study, we observed analytical precisions for δ18O and δO2/Ar of 0.057‰ and 0.4‰ (n = 11), respectively. Equilibrated dissolved gases in water at 22°C (deionized water poisoned with HgCl2) were also repeatedly collected and measured in the laboratory, and we observed mean values of δ18O = 0.706 ± 0.051‰ and δO2/Ar = −95.0 ± 0.7‰, which were within the accepted error threshold compared to their theoretical values. All data running on the same filament were finally converted to values relative to air after the chemical slope corrections.
The sampling flasks were prepared and evacuated by a vacuum line at East China Normal University. Dissolved gas extractions and analyses were conducted at the Stable Isotope Climate Lab at Shanghai Jiao Tong University, Shanghai, China.
The temperature and salinity data of all stations and the analyzed δ18O and δO2/Ar data of all samples are listed in Table 1. AOU and modeled WCR% and SOR% in the following sections are also listed in Table 1.
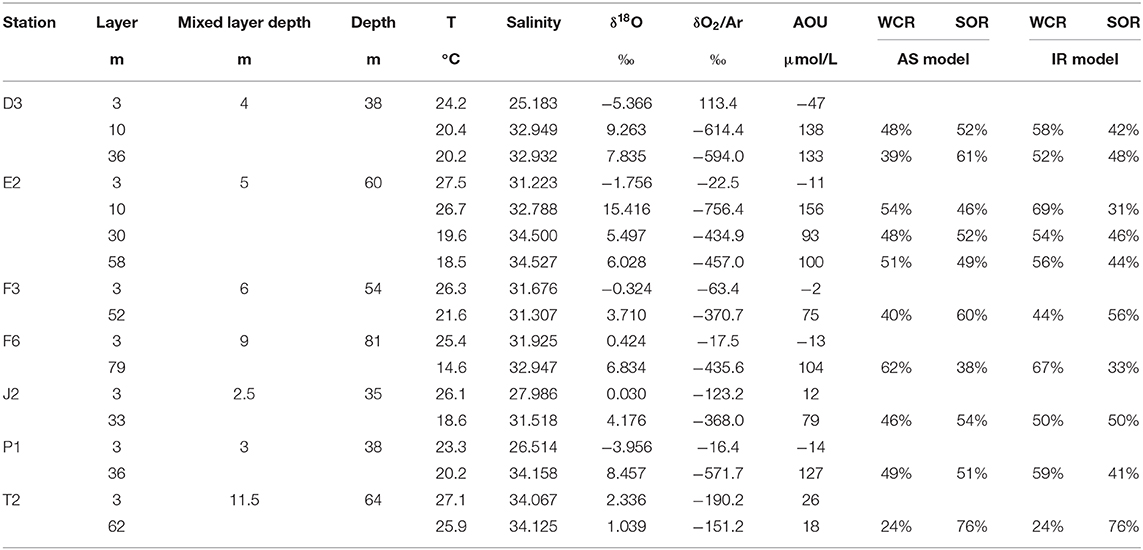
Table 1. Temperature, salinity, and O2 results, and estimated WCR% and SOR% in this study.
Results
In July 2018, warm and fresh water prevailed in the surface layer, whereas waters of lower temperature and higher salinity were commonly found in the near-bottom layers (Figure 2 and Table 1). The temperature of the surface waters varied between 23.3°C and 27.5°C and 14.6°C to 25.9°C for the near-bottom layers. The surface and near-bottom salinities ranged between 25.183 and 34.067 and 31.307 and 34.527, respectively. Waters with low temperature and low salinity were identified in the surface layer of station P1, indicating the presence of Changjiang diluted water, and a gradual eastward increase in both temperature and salinity was observed (Figures 2A,B). In the near-bottom waters, temperature and salinity gradually decreased from south to north (Figures 2C,D).
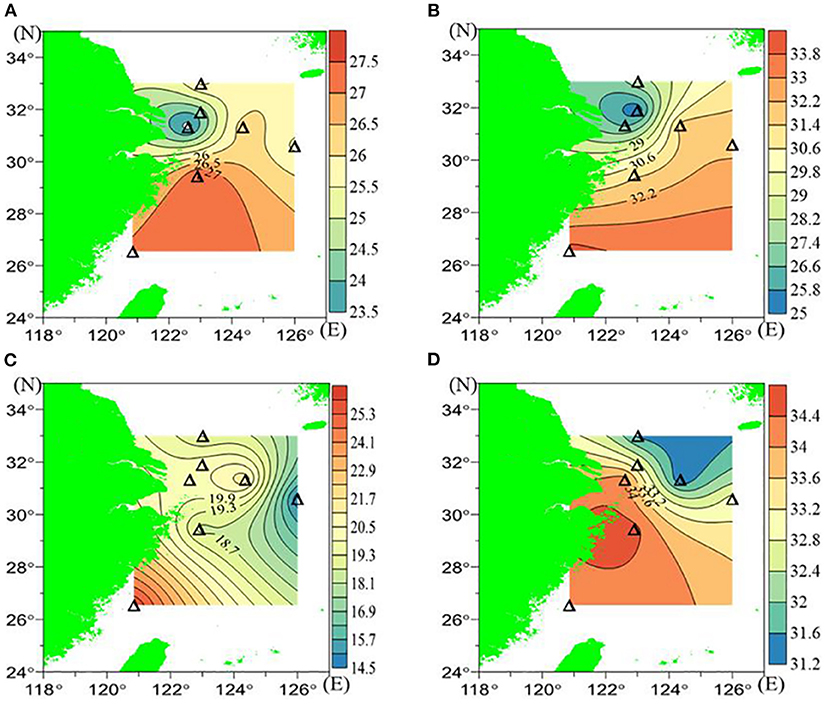
Figure 2. The hydrological background in July 2018: (A) Surface temperature (°C), (B) surface salinity, (C) bottom temperature (°C), and (D) bottom salinity.
The water column was well stratified in our observations for all the stations we covered, namely, the density of near-bottom waters was higher than that of the surface waters. The density differences between near-bottom waters and surface waters ranged from 0.58 to 8.39 kg/m3, with the maximum value (8.39 kg/m3) occurring at station D3. Based on the temperature and salinity profile and a 0.125 kg/m3 threshold, the upper mixed layer depth ranged from 2.5 m (J2) to 11.5 m (T2) during our observations, with a mean depth of 4.9 m. The upper mixed layer was shallower than the corresponding pycnocline.
The δO2/Ar values at the surface varied from −190.2 to 113.4‰, and in the near-bottom waters, they varied from −594.0 to −151.2‰. The lowest δO2/Ar value in the near-bottom waters occurred at station D3 (−594.0‰), and it gradually increased both southwards and eastwards (Figure 3B and Table 1). The distribution of δO2/Ar in the near-bottom water was opposite to that in the surface water (Figures 3A,B); that is, higher δO2/Ar values in surface waters usually corresponded to lower δO2/Ar values in the corresponding near-bottom waters. The [O2] was calculated from the observed δO2/Ar, assuming that Ar was saturated in all layers. Accordingly, the [O2] ranged from 182 μmol/L to 279 μmol/L in the surface waters and from 104 μmol/L to 195 μmol/L in the near-bottom waters (Figures 3C,D).
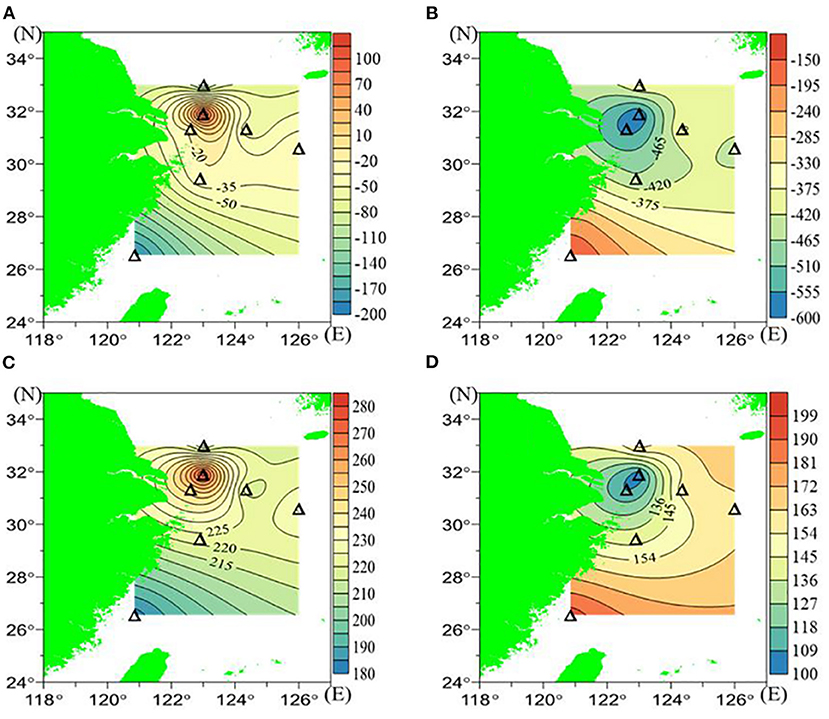
Figure 3. The δO2/Ar (‰) and [O2] (μmol/L) calculated based on δO2/Ar in July 2018: (A) surface δO2/Ar, (B) bottom δO2/Ar, (C) calculated surface [O2], and (D) calculated bottom [O2].
AOU was calculated by subtracting the observed [O2] from the equilibrated [O2], which ranged from −47 to 26 μmol/L for the surface waters and from 18 to 133 μmol/L for the near-bottom waters. In the near-bottom waters, elevated AOU and δ18O (133 μmol/L and 7.835‰, respectively) were found at station D3. By contrast, minimum values in the near-bottom waters were found at station T2, which were 18 μmol/L and 1.039‰ (Figures 4C,D). A similar mirrored distribution pattern between AOU and δ18O was found in the surface waters (Figures 4A,B and Table 1).
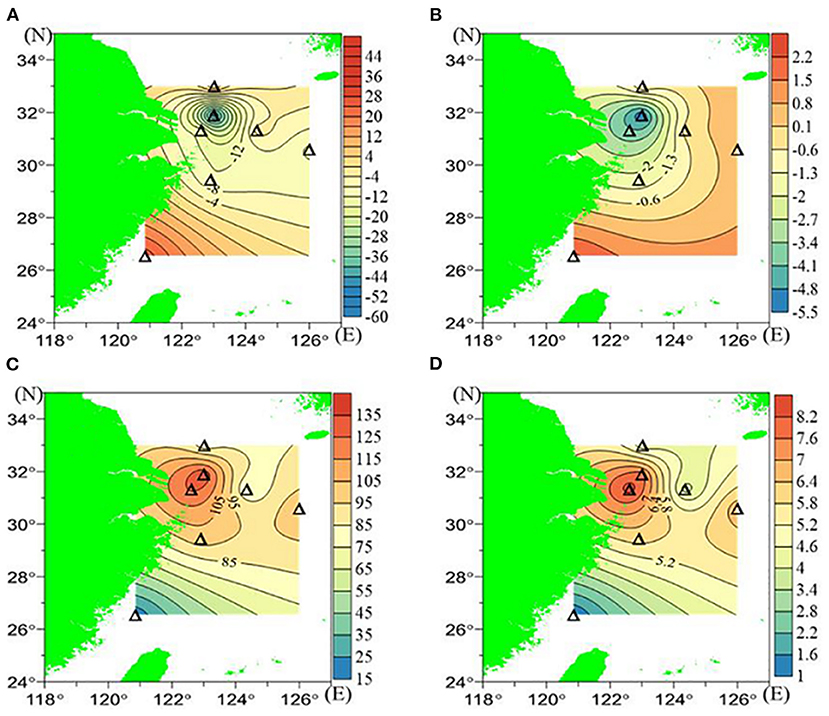
Figure 4. The AOU and δ18O in July 2018: (A) surface AOU (μmol/L), (B) surface δ18O (‰), (C) bottom AOU (μmol/L), and (D) bottom δ18O (‰).
Vertically, obvious water stratification was identified by the temperature and salinity profile. δO2/Ar (or [O2]) gradually decreased from the surface to near the bottom waters, but the δO2/Ar minimum (or [O2] minimum) occurred in the intermediate layers beneath the pycnocline (10 m; Figure 5), indicating that most oxygen consumption occurred in the middle layer instead of near-bottom waters. The [O2] at 10 m at station E2 (56 μmol/L) was the minimum observed [O2], even lower than the corresponding near-bottom [O2]. Horizontally, the δ18O values showed a good relationship with declining [O2] (Figure 3D vs. Figure 4D). Vertically, although discrete samples were limited in number, the δ18O values were also well related to declining [O2] (Figure 5). Indeed, among all sub-pycnocline samples, the relationship between δ18O and declining [O2] (as [O2]/[O2]0) was significant (r2 = 0.97; Supplementary Figure 4), indicating apparent isotope fractionation during O2 consumption in the water column.
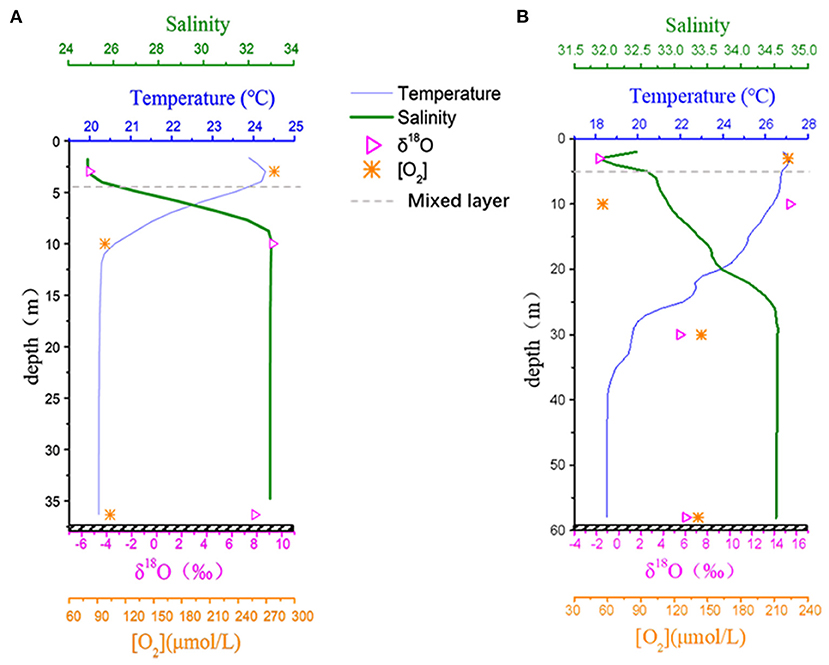
Figure 5. Vertical profile of salinity, temperature (°C), and [O2] (μmol/L) calculated using δO2/Ar, and δ18O (‰) for (A) station D3 and (B) station E2. The gray dashed lines indicate the depth of the upper mixed layer.
Model
Under the simplest condition, we assume that the near-bottom waters are in the dark and beneath the upper mixed layer. There is no diapycnal gas exchange between the upper mixed layer and near-bottom waters. Photosynthesis in near-bottom waters can be ignored, and the vertical mixing process is strongly prohibited by stratification over one to a few weeks. The oxygen budget is controlled only by WCR and SOR. In addition, the fractionation factors for WCR and SOR are constant during oxygen consumption. Based on these assumptions, we used two separate one-dimensional models to quantify the contributions of WCR and SOR to total AOU. In the following section, we first describe the principle of the two models and then use the models to calculate WCR and SOR%. Further discussions of the model results and their implications for the local environment are presented in section 5.1.
Model Description
Oxygen Isotope Rayleigh Fractionation Model (IR Model)
Visualizing the entire fate of O2 in the water column: initially, O2 is first dissolved (or generated) in the water column in surface layers via air-sea gas exchange or photosynthesis. Then, O2 consumption caused by WCR occurs in the surface layers, and SOR will also influence O2 when sediments get involved in the water column. The impacts of both SOR and WCR on O2 are recorded in the O2 properties, including the O2 concentration and δ18O values. Finally, in the current case, large amounts of O2 are consumed in the layers beneath the pycnocline, with certain WCR and SOR proportions relative to the total AOU until our observations.
The IR model is built using the isotope ratio R (R = 18O/16O) and [O2]. The initial dissolved O2 in the water column is assumed to be at equilibrium with air at the air-sea interference before any oxygen consumption takes place. Beneath the pycnocline, there are no air-sea gas exchange and no O2 production, only oxygen consumption occurs, and the O2 budget is:
where [O2]obs is the observed [O2]. [O2]0 is the initial oxygen concentration, which is assumed at saturation. [O2]WCR is the oxygen consumed by water column respiration; [O2]SOR is the oxygen consumed by sediment oxygen respiration.
Respiration is a Rayleigh fractionation process, that is,
where αWCR (= Rrespired/Rresidual) is the respiration fractionation factor for the WCR process. RWCR is the 18O/16O value of residual O2 after WCR consumption, which can be measured from our collected samples. R0 is the 18O/16O value of [O2]0, and f is the fraction of residual [O2] relative to the initial [O2]0 (ranging between 0 and 1). As WCR occurs in all layers and at all times in the water column, the fraction of residual O2 after WCR consumption can be written as .
Therefore, from equation 4 we obtain
In addition to WCR processes, SOR would also consume O2. However, the fractionation factor of SOR processes, αSOR, is very close to 1 (Brandes and Devol, 1997), and oxygen will be mostly and totally consumed once it interacts with sediments. In other words, the SOR processes will cause no or negligible isotopic fractionation of the R values of dissolved O2 and will only influence the O2 concentrations. Therefore,
where Robs is the observed isotopic composition of O2 from the near-bottom water samples. Based on equation 6, [O2]WCR can be calculated with known Robs, R0, [O2]0, and αWCR. [O2]0 is the saturated concentration of O2 at the known temperature and salinity for each station, and R0 is calculated from the isotopic composition, δ18O = 0.7%0, of saturated O2 at the sea surface.
Then, the fraction of oxygen consumed by WCR (WCR%) is calculated as:
Additionally, SOR% = 1 – WCR%, which is the fraction of oxygen consumed by SOR.
Apparent Fractionation Factor-Based and Step-By-Step Model (AS Model)
In principle, this model is similar to the model presented by Bender and Grande (1987) and the model with sequential steps reported by Fry (2006). It has been used in the Gulf of Mexico (Quinones-Rivera et al., 2007). As we focused on the oxygen budget in the near-bottom waters in this work, where no photosynthesis is present, only respiration processes are considered.
At the initial given O2 concentrations and δ18O values, the depletion of O2 was calculated at a given respiration rate. In every step, we decreased the initial O2 (i.e., caused by WCR and SOR, simultaneously) with a step size of ~1 μmol/L. The corresponding increase in δ18O (in ‰) was quantified by logarithmic distillation equations (exact expression; Mariotti et al., 1981). Through a repeated step-by-step calculation, the O2 concentration will finally decrease to nearly zero, with very high corresponding δ18O values. By doing this, a curve can be made, with the x-axis as the modeled O2 concentration and the y-axis as the modeled δ18O. The fractionation factor for all steps was fixed; changing the fractionation factor would change the shape (curvature) of the curve. By tuning the model fractionation factor, we found the best fit of the modeled curve and our observed [O2] – δ18O pairs for every near-bottom water sample. Then, the best-fit model fractionation factor was recorded for that sample, termed the apparent fractionation factor (εapp) (Quinones-Rivera et al., 2007). Similarly, the initial O2 properties for modeling were set as the theoretical equilibrium value (100% solubility and 0.7‰ δ18O for dissolved O2). The respiration rate was set as 0.03 mg O2/L/h.
The apparent fractionation factor was then used to calculate the relative contributions from WCR and SOR using a previously reported equation (Quinones-Rivera et al., 2007):
where εapp is the apparent fractionation factor, εWCR is the water column respiration fractionation factor, and εSOR is the sedimentary oxygen respiration fractionation factor.
Model Results
A previous study suggested a value of −22‰ for the WCR fractionation factor εWCR in coastal waters such as the Gulf of Mexico (Quinones-Rivera et al., 2007). In this work, εWCR was regarded as −20.8‰ (αWCR = 0.9792) based on incubation experiments using in situ surface seawater (Supplementary Figure 5). For the SOR processes, during which O2 is totally consumed, the fractionation factor εSOR is regarded as 0 (αSOR = 1, namely, no isotopic fractionation of residual O2) (Brandes and Devol, 1997).
Results of the IR Model
The mean WCR% that contributed to the total AOU beneath the pycnocline was 53%, and the remaining 47% was contributed by SOR. Except for a few stations (T2, F3, J2), the WCR% was usually higher than the SOR (Figure 6). The maximum WCR% occurred in the 10 m layer (not near the bottom layer) of E2 (69%). Among all the near-bottom samples, the minimum value occurred at the southernmost station T2 (WCR% = 24%) (Figure 6 and Table 1).
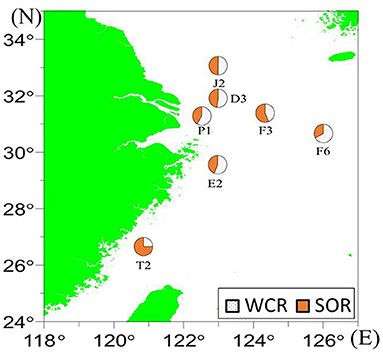
Figure 6. The WCR and SOR% contributions to total AOU in the near-bottom waters in July 2018 as revealed by the IR model.
Results of the AS Model
The mean SOR% relative to the total AOU beneath the pycnocline was 54%, and the WCR% contributed the remaining 46% (Figure 7 and Table 1). The minimum SOR% (and hence maximum WCR%) was found at station F6 (SOR=38%, WCR=62%), and the maximum SOR% (and the minimum WCR%) occurred at station T2 (SOR=76%, WCR=24%).

Figure 7. The WCR% and SOR% contributions to total AOU in the near-bottom waters in July 2018, as revealed by the AS model.
We observed good consistencies and correlations of the results between the IR model and the AS model (slope = 1.18, r2 = 0.89, Figure 8).
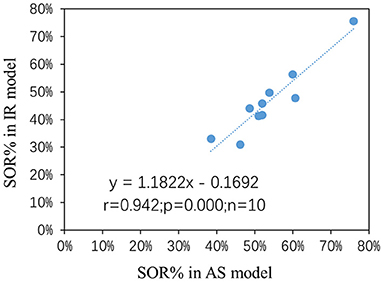
Figure 8. The SOR% contribution to the total AOU based on both models: AS model result vs. IR model result.
Discussion
Caveats and Limitations of the Models
For both the IR and AS models, we assumed equilibrium of the initial O2 (concentration and δ18O) at the sea surface. However, photosynthetic O2 and fresh water input might influence the initial conditions of O2. Here, we propose that these influences are not significant because of the limited fractions of photosynthetic O2 relative to dissolved atmospheric O2 and the small isotopic effects of fresh water input.
In the vicinity of Changjiang, the terrestrial impact is very clear. Changjiang water has a δ18O-H2O value of −31.6‰ (vs. air, converted from the VSMOW scale) (Li et al., 2010), which is 8.3‰ lower than that of seawater (−23.3‰ vs. air). Photosynthesis generates O2 by splitting the H-O bond in water, and hence, photosynthetic O2 has the same δ18O as its source water, which usually has much lower δ18O values than dissolved O2 from the atmosphere. However, we believe the terrestrial impact on δ18O-O2 was limited for our samples. We will use the surface waters of D3, where the lowest surface salinity (25.183) was observed, as an example for the following discussion. Given a typical marine water salinity of 34.500 and a salinity of 25.183 for the surface waters at D3, the freshwater contribution in the surface waters of D3 was expected to be 27%, with the remaining 73% as marine water based on a mass-balance calculation. If the δ18O-H2O of Changjiang water is linearly diluted by marine water along with increasing salinity, the presence of 27% freshwater would then reduce the bulk surface water δ18O-H2O from the original −23.3to −25.5‰ (vs. air). Therefore, photosynthetic O2 would have a δ18O-O2 of −25.5‰ instead of −23.3‰, assuming that there is trace fractionation of oxygen isotopes during the assimilation process in photosynthesis (Hopkinson and Smith, 2005). Therefore, the freshwater input would only change the δ18O of photosynthetic O2 by 2.2‰ (i.e., 23.3–25.5) or by 9.5% for all photosynthetic O2 at station D3. This estimation of freshwater influence is expected to be the maximum, as all the remaining stations had salinities much higher than 25.183 (Figure 2).
The coupling of δ18O and [O2] is impacted by various processes off the Changjiang Estuary and adjacent ECS, such as mixing with other water masses and additional freshwater input. However, there is barely an effect of these two processes from previous years because the residence time of the ECS shelf water is only one year (Tsunogai et al., 1997). Instead, the impact from mixing or freshwater input on δ18O and [O2] coupling is expected to be reset every year. However, more work is still needed to clarify the mixing process effect on δ18O and [O2] coupling over short time scales.
Another point is the euphotic zone depth and its relationships with the upper mixed layer depth. In the flood season (i.e., July), Changjiang water is very turbid and exerts a great impact on the estuary and adjacent coastal sea, as indicated by the salinity distribution pattern at the surface (Figure 2B). Under this background, the euphotic zone and upper mixed layer are very shallow (Zhu et al., 2009). For the near-bottom water samples, the sampling depths were all deeper than the euphotic zone and upper mixed layer depth. For the profile stations (D3 and E2), the middle layer samples were also all below the upper mixed layer, indicated by the density differences (density difference was > 1.5 kg/m3 or even > 7.4 kg/m3, far higher than 0.125 kg/m3).
Previously, while δ18O basically showed a good relationship with declining [O2], at times, sub-pycnocline samples showed a lack of such a relationship at certain sites in the Gulf of Mexico (Ostrom et al., 2014). This was suggested to be due to the fast oxygen consumption rate and hence an SOR-like process in the microenvironment in the water column (Ostrom et al., 2014). In our case, all sub-pycnocline δ18O and O2 were negatively coupled (r2 = 0.97; Supplementary Figure 4), indicating apparent isotope fractionation in the water column. Critically, we again claim that SOR in this work was related to any process in which [O2] was totally consumed in the depletion process, regardless of whether it occurred in the sediment, at the sediment-water interface or in the water column. However, given the good relationship between δ18O and [O2] (Supplementary Figure 4), it is unlikely that the SOR process (or diffusion-controlled process) significantly took place in the water column during our observation. Further work is needed to explore and confirm this.
Finally, the WCR endmember fractionation factor impacts the final output. The reported aerobic respiration fractionation factor has a large range, varying from −12 to −25‰ (Bender and Grande, 1987). Our in situ incubation indicated that the fractionation factor off the Changjiang Estuary was −20.8‰ (ε = −20.8‰ or α = 0.9792; Supplementary Figure 5). Previously, a WCR endmember fractionation factor of −22‰ was reported based on incubations in the Gulf of Mexico (Quinones-Rivera et al., 2007). Additionally, Hendricks et al. (2005) reported a respiration fractionation factor ranging between −21 and −22‰ (Hendricks et al., 2005), both of which are very close to our incubated value of −20.8‰ for Changjiang Estuary surface waters. Nevertheless, we also ran a sensitivity test showing that changing the WCR endmember fractionation factor from the current value (−20.8‰) to either −16 or −25‰ indeed introduced some changes in the estimated WCR% and SOR%, but the overall distribution pattern and relationships remained unchanged (see Supplementary Figures 6, 7).
Implications of the Oxygen Depletion Mechanisms off the Changjiang Estuary
The main controlling factor for WCR is organic matter (OM) degradation driven by microbial respiration (Diaz, 2001). As organic matter sinking from the upper waters is much more abundant (in % of total suspended matter) and more labile relative to the sediment, the WCR of the near-bottom waters is greatly contributed to and controlled by sinking organic matter from the surface waters instead of by resuspended sediment OM, in which the organic matter is more depleted and refractory. Off the Changjiang Estuary, there are two sources of OM in the surface waters, namely, OM from rivers and OM from in situ production. Previous studies have shown that the OM that degrades in near-bottom waters and drives hypoxia is mainly of marine origin (Wang et al., 2016, 2017). Although surface productivity data are lacking, such a rate can be inferred by the negative AOU of surface waters. AOU in the surface waters ranged from −47 to 26 μmol/L (Figure 4A and Table 1), with the minimum AOU (−47 μmol/L) occurring at station D3 and gradually increasing southwards and outwards (Figure 4A). This trend was similar to the [O2] distribution pattern in the near-bottom waters (Figure 3D); that is, higher O2 production (lower AOU values) at the surface correlated with lower [O2] in the near-bottom waters (Figure 9), which also suggests a coupling between excess organic matter production at the surface and stronger O2 consumption beneath. Furthermore, although there was an outlier (a sample from station D3), near-bottom water WCR% showed a good negative relationship with surface AOU in both models (Figures 10A,B). In other words, lower surface water AOU (higher O2 productivity at the surface) corresponded to a higher WCR% contribution to AOU in the near-bottom waters (Figures 10A,B), which is consistent with the mechanism by which the generation of excess organic matter fuels near-bottom water O2 consumption (Diaz, 2001).
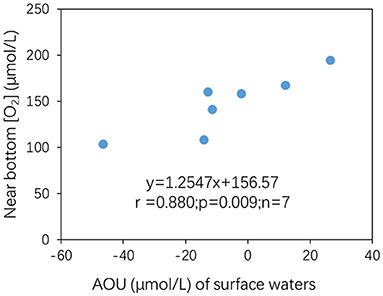
Figure 9. Near-bottom [O2] (μmol/L) plotted against AOU (μmol/L) in the surface waters.
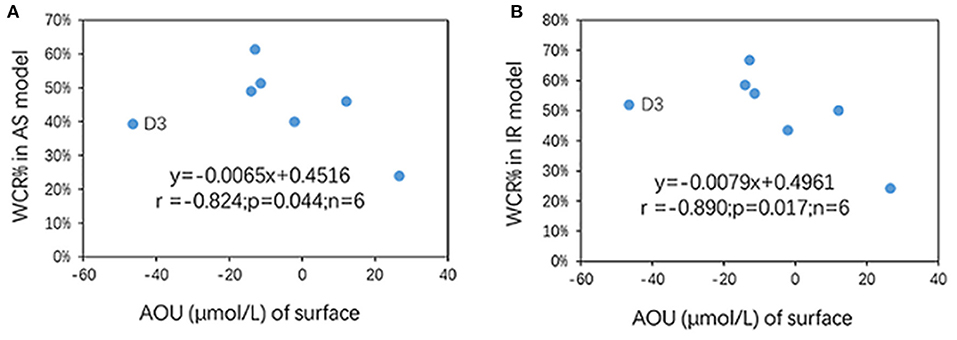
Figure 10. The WCR% contribution to the total AOU of the near-bottom waters and its relationship with AOU of the surface waters: (A) AS model and (B) IR model. Note that only near-bottom water samples are shown; r, p, n in the plot were derived without data from D3.
With respect to SOR, the influential factors have been adequately reviewed (Glud, 2008), including sedimentation rates, near-bottom [O2], diffusive boundary layers, faunal activity, light, temperature, and sediment permeability. Because these influential factors vary greatly and the SOR is usually determined by these factors simultaneously, the dynamics of near-bottom [O2] are complicated but of great interest.
From the aspect of direct diffusion, the depth of O2 penetration into sediment (L) and the diffusive oxygen utilization (DOU) between sediment and near-bottom waters can be described using equation 9 (Cai and Sayles, 1996) and equation 10 (Rasmussen and Jorgensen, 1992), respectively:
where in Equation 9, ∅ and DS are the respective porosity and diffusivity of O2 in the sediment, [O2]BW is the near-bottom [O2], and is the benthic oxygen flux. In equation 10, D0 is the diffusion coefficient of oxygen in water at a certain temperature and salinity, and dC(z)/dz is the oxygen content decreasing gradient (rate, or slope) along the diffusive boundary layer. Both equations 9 and 10 indicate that a higher SOR rate is expected under a higher near-bottom [O2]. Although positive cases can be found to support such expectations (Rowe et al., 2002; Murrell and Lehrter, 2011; Lehrter et al., 2012), a few contrary examples have also been reported (Mccarthy et al., 2013).
The SOR% contribution to the total AOU beneath the pycnocline was positively related to near-bottom [O2] (Figures 11A,C) for the results from both models, supporting the expectation that higher bottom [O2] is accompanied by a higher SOR rate (Murrell and Lehrter, 2011; Song et al., 2020). The latest incubation work carried out on deck suggested that the SOR rate (mmol O2/m2/day) was positively related to near-bottom [O2] in summer (Song et al., 2020), which is consistent with our suggested SOR% pattern with bottom [O2] (Figure 11). As a comparison, lower near-bottom [O2] corresponded to a greater WCR contribution (Figures 11B,D). Furthermore, sensitivity analysis indicated that the pattern in Figure 12 held even when the WCR endmember fractionation factor varied from −16 to −25‰ (Supplementary Figures 5, 6), suggesting that our findings (Figure 11) are robust under a wide range of scenarios.
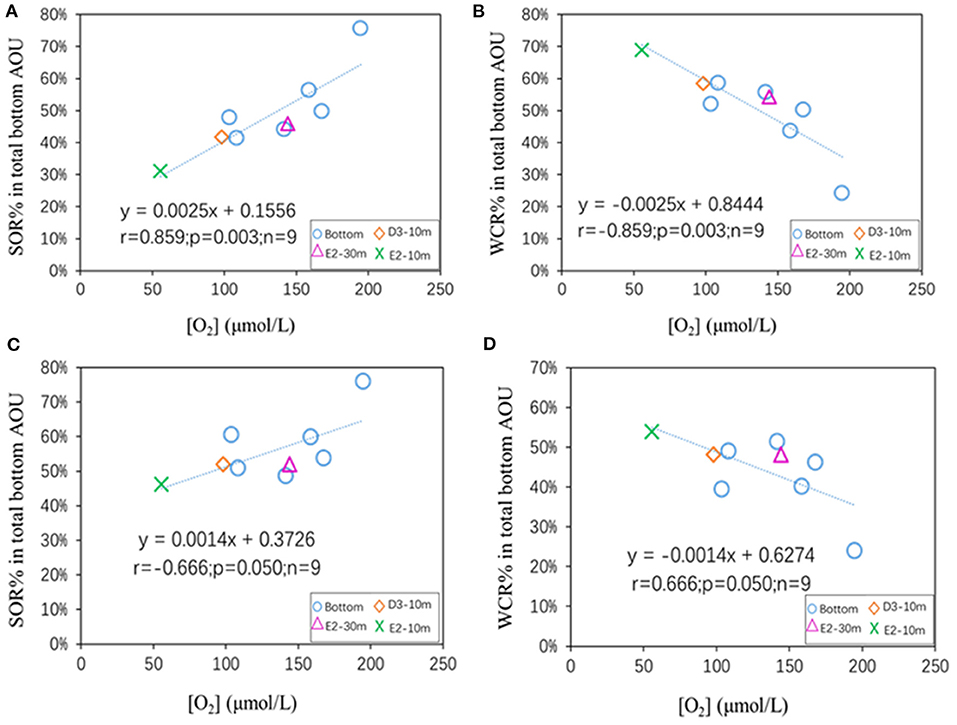
Figure 11. The relationship between [O2] (μmol/L) and the SOR% and WCR% contributions to total AOU for all sub-pycnocline samples shallower than 70 m: (A,B) Calculated from the IR model, (C,D) calculated from the AS model.
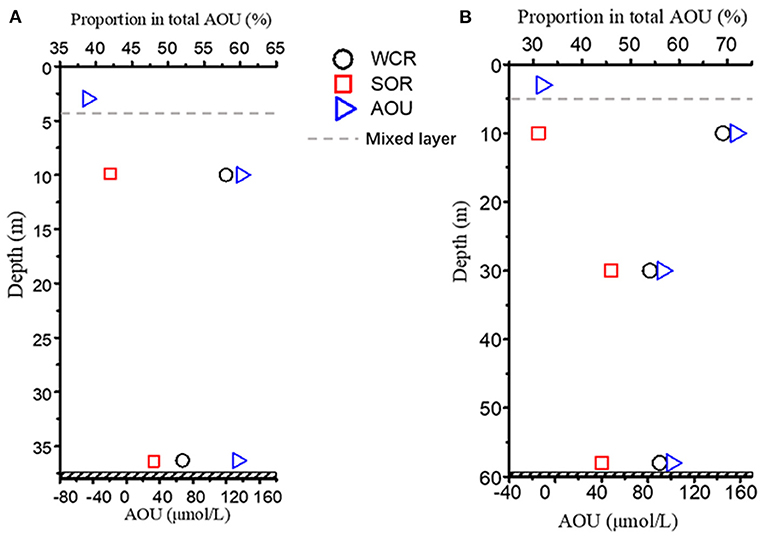
Figure 12. The vertical distribution of the SOR% and WCR% contributions to total AOU at (A) station D3 and (B) station E2.
In addition to the horizontal distribution pattern (Figures 11A,C), the vertical distribution was investigated. A higher WCR% (lower SOR%) was usually expected at shallower depths, whereas in deeper layers (e.g., in the near-bottom waters), the SOR% could be higher than that in the corresponding shallower layers (Figure 12). At station E2, however, a reverse trend was found, where SOR% in deeper layers was generally lower than that at the shallower depth (i.e., SOR% at 60 m < SOR% at 30 m; Figure 12B). Oxygen depletion at 60 m was more severe than that at 30 m, with AOU values at 30 m and 60 m of 93 and 100 μmol/L, respectively. The SOR% and AOU relationship between 30 m and 60 m indicated that WCR tended to play a larger role in the more severe oxygen depletion scenario beneath the pycnocline, regardless of the depth (Figure 12).
Given the horizontal (Figure 11) and vertical patterns (Figure 12) of WCR% and SOR%, we propose dynamic, instead of fixed, oxygen consumption mechanisms of WCR and SOR in the near-bottom waters beneath the pycnocline (Figures 10A,B, 11) that finally cause hypoxia off the Changjiang Estuary and adjacent ECS (Figure 13): In the stratified water column, the SOR contribution to the total bottom AOU is a background-like, chronic process that exists at all times. The WCR contribution to the total AOU can be very limited in near-bottom waters relative to SOR when no extra organic matter is abruptly introduced (e.g., via particle sinking). During the productive season (summer), however, excess organic matter assimilates in the surface waters, intensively sinks to the near-bottom waters within a very short time period, and hence stimulates WCR in the near-bottom waters. Compared to the background-like, chronic SOR, a sudden increase in WCR is a pulse-like and acute event (Figures 10A,B). If stratification prevails and prevents additional O2 supply, hypoxia occurs. With decreasing [O2], the O2 penetration depth, as well as the diffusion rate of oxygen into the sediment, is expected to be increasingly restricted (Equations 9, 10), which in turn would further reduce the SOR contributions in the bottom AOU at that site during our observation. Therefore, the dominating oxygen consumption mechanisms would shift from SOR to WCR under such circumstances. Similar dynamics of the oxygen consumption shift between SOR and WCR can be inferred in the case of hypoxia in the Gulf of Mexico (Quinones-Rivera et al., 2007).
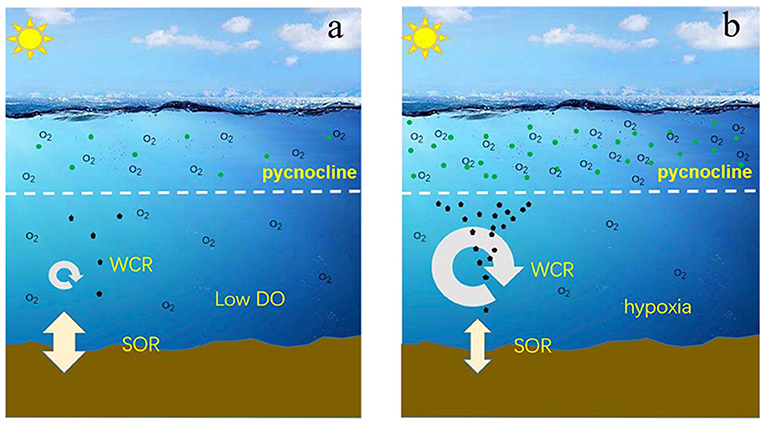
Figure 13. Schematic of the dynamic WCR and SOR contributions to the total AOU at a fixed depth: (a) low DO ([O2]>2 mg/L) scenario when there is no excess organic matter exported into the near-bottom waters and SOR dominates the bottom AOU; (b) hypoxia scenario when there is excess organic matter exported into the near-bottom waters and WCR drives [O2] to a hypoxic level.
If the oxygen consumption scenario in Figure 11 is valid for our observations, bloom management, instead of sediment management, would reduce organic matter that sinks into the near-bottom waters and hence would be more effective and instant in reducing hypoxia. Unfortunately, even if blooms in surface waters are controlled, near the bottom, [O2] is unlikely to recover promptly. This is because of the presence of background-like, chronic SOR. In the worst condition, with controlled blooms in the surface waters, the reduced WCR and alleviated sub-pycnocline [O2] will in turn promote increasing SOR contributions to oxygen depletion. Our work suggests that hypoxia management would be a comprehensive and long-term mission.
It should be pointed out that such a schematic (Figure 13) is at least partly based on an assumption that sediments in the whole study area are homogeneous in nature. Instead, the sediment grain size, porosity, and organic carbon content show clear spatial patterns (Niino and Emery, 1961; Song et al., 2016; Yang et al., 2016; Zhang et al., 2020). Although the sediment total organic carbon and total nitrogen contents showed no clear relationship with the SOR rate, the grain size effect has been suspected in the ECS (Song et al., 2016), with coarser surface sediment having stronger sediment-water exchange efficiency and hence playing an equally important role in SOR relative to organic matter-abundant fine sediment (De Beer et al., 2005).
Based on the radium-thorium imbalance method, SOR contributed 6–61% of the total bottom AOU (Cai et al., 2014), whereas sediment incubations carried out on deck on the ship showed that the SOR contribution could reach 100% (Zhang et al., 2017). While previous work showed a large variation range for SOR%, our result, which is based on an oxygen isotope and O2 budget approach, also showed some fluctuations (Figures 11A,C). The fluctuation may result from the uncertainties of our approach, or more likely, from the heterogeneous sediment nature, which led to the SOR rate and further SOR% difference. We are also aware that O2 diffusion-controlled fractionation may play a role in such a δ18O-based approach (Ostrom et al., 2014). But off the Changjiang Estuary, at least during our observation, similar decoupling between [O2] and δ18O was not observed. Nevertheless, more observation-based integrated studies (i.e., covering both SOR and WCR contributions) are needed to clarify the shift in SOR and WCR contributions to bottom hypoxia off the Changjiang Estuary and adjacent ECS.
Conclusion
In addition to respiration incubation experiments using sediments and water column organic matter, the oxygen isotope budget provides another approach to quantify both WCR and SOR under oxygen depletion. In the near-bottom waters off the Changjiang Estuary and adjacent ECS, the δ18O of dissolved oxygen ranged from 1.039 to 8.457‰, indicating a significant fractionation effect during oxygen consumption.
To clarify the WCR and SOR contributions to the total AOU, respiration models are used to quantify the coupling between [O2] and the corresponding δ18O. In addition to a model published by Quinones-Rivera (AS model) (Quinones-Rivera et al., 2007), we also developed an IR model to evaluate the WCR and SOR% in the sub-pycnocline waters. The results from the two models basically agreed with each other, but the pattern of decreasing SOR% contribution to the total AOU with decreasing [O2] was clearer in the IR model than in the AS model (Figure 11A).
Our results indicated that the WCR and SOR% contributions to the total AOU of the near-bottom waters were dynamic, not stationary, and were likely affected by ambient environmental factors (e.g., [O2]; Figure 11). Accordingly, we propose that SOR is the main factor that determines the background AOU of the near-bottom waters off the Changjiang Estuary, but the WCR drives the dissolved oxygen level to hypoxia. In July 2018, WCR contributed ~70% of the total AOU when hypoxia occurred ([O2] ~50 μmol/L).
As primary research, there are still some other factors that are not well addressed in the oxygen isotope budget. Although the terrestrial input from the Changjiang River is expected to play a limited role in increasing bias in the expected coupling between [O2] and δ18O, the mixing effect of various water masses in the study area and its impact on the oxygen isotope budget (Bender, 1990) should still be considered in the future.
Data Availability Statement
The original contributions presented in the study are included in the article/Supplementary Materials, further inquiries can be directed to the corresponding authors.
Author Contributions
G-LZ participated field sampling and revised the manuscript. H-TH provided the IR model, helped and funded the sample measurements, and revised the manuscript. Z-YZ composed the idea and scientific question, revised the manuscript, and funded the project. JZ wrote the original manuscript and measured the samples. Q-QW conducted the incubation experiment. All authors contributed to the article and approved the submitted version.
Funding
This work was funded by the Ministry of Science and Technology in China (via the National Key Research and Development Program of China, No. 2020YFA0608301), by the Shanghai Sailing Program under grant 19YF1422500, and by the National Natural Science Foundation of China (No. 41976042, 41776122, and 41530960).
Conflict of Interest
The authors declare that the research was conducted in the absence of any commercial or financial relationships that could be construed as a potential conflict of interest.
Acknowledgments
We are grateful to the captain and crew of R/V Dongfanghong 2 and R/V Runjiang for their assistance in the field. We thank Chuan Qin from OUC for collecting water samples in July 2018. Z-YZ thanks Michael L. Bender for his help and inspiration during the early period of the dissolved gas isotope study.
Supplementary Material
The Supplementary Material for this article can be found online at: https://www.frontiersin.org/articles/10.3389/fmars.2020.623581/full#supplementary-material
References
Bender, M. L. (1990). The δ18O of dissolved O2 in seawater: a unique tracer of circulation and respiration in the deep sea. J. Geophys. Res. 95, 22243–22252. doi: 10.1029/JC095iC12p22243
Bender, M. L., and Grande, K. D. (1987). Production, respiration, and the isotope geochemistry of O2in the upper water column. Glob. Biogeochem. Cycles 1, 49–59. doi: 10.1029/GB001i001p00049
Brandes, J. A., and Devol, A. H. (1997). Isotopic fractionation of oxygen and nitrogen in coastal marine sediments. Geochim. Cosmochim. Acta 61, 1793–1801. doi: 10.1016/S0016-7037(97)00041-0
Cai, P. H., Shi, X. M., Moore, W. S., Peng, S. Y., Wang, G. Z., and Dai, M. H. (2014). 224Ra:228Th disequilibrium in coastal sediments: implications for solute transfer across the sediment–water interface. Geochim. Cosmochim. Acta 125, 68–84. doi: 10.1016/j.gca.2013.09.029
Cai, W.-J., and Sayles, F. L. (1996). Oxygen penetration depths and fluxes in marine sediments. Marine Chem. 52, 123–131. doi: 10.1016/0304-4203(95)00081-X
Capet, A., Beckers, J. M., and Grégoire, M. (2013). Drivers, mechanisms and long-term variability of seasonal hypoxia on the Black Sea northwestern shelf – is there any recovery after eutrophication? Biogeosciences 10, 3943–3962. doi: 10.5194/bg-10-3943-2013
Carstensen, J., Andersen, J. H., Gustafsson, B. G., and Conley, D. J. (2014). Deoxygenation of the Baltic Sea during the last century. Proc. Natl. Acad. Sci. U.S.A. 111, 5628–5633. doi: 10.1073/pnas.1323156111
Chen, J. Y., Pan, D. L., Liu, M. L., Mao, Z. H., Zhu, Q. K., Chen, N. H., Zhang, X. Y., and Tao, B. Y. (2017). Relationships between long-term trend of satellite-derived chlorophyll-a and hypoxia off the changjiang Estuary. Estuaries Coasts 40, 1055–1065. doi: 10.1007/s12237-016-0203-0
Chi, L., Song, X., Yuan, Y., Wang, W., Cao, X., Wu, Z., and Yu, Z. (2020). Main factors dominating the development, formation and dissipation of hypoxia off the Changjiang Estuary (CE) and its adjacent waters, China. Environ. Pollution 265:115066. doi: 10.1016/j.envpol.2020.115066
Crain, C. M. (2007). Shifting nutrient limitation and eutrophication effects in marsh vegetation across estuarine salinity gradients. Estuaries Coasts 30, 26–34. doi: 10.1007/BF02782964
Daoji, L., and Daler, D. (2004). Ocean Pollution from Land-based Sources: East China Sea, China. AMBIO 33, 107–113. doi: 10.1579/0044-7447-33.1.107
De Beer, D., Wenzhöfer, F., Ferdelman, T. G., Boehme, S. E., Huettel, M., Van Beusekom, J. E. E., Böttcher, M. E., et al. (2005). Transport and mineralization rates in North Sea sandy intertidal sediments, Sylt-Rømø Basin, Wadden Sea. Limnol. Oceanogr. 50, 113–127. doi: 10.4319/lo.2005.50.1.0113
Diaz, R. J. (2001). Overview of hypoxia around the world. J. Environ. Qual. 30, 275–281. doi: 10.2134/jeq2001.302275x
Glud, R. N. (2008). Oxygen dynamics of marine sediments. Marine Biol. Res. 4, 243–289. doi: 10.1080/17451000801888726
Hendricks, M. B., Bender, M. L., and Barnett, B. A. (2005). Triple oxygen isotope composition of dissolved O2 in the equatorial Pacific: A tracer of mixing, production, and respiration. J. Geophys. Res. 110:C12021. doi: 10.1029/2004JC002735
Hopkinson, C. S., and Smith, E. M. (2005). “Estuarine respiration: an overview of benthic, pelagic, and whole system respiration,” in Respiration in Aquatic Ecosystems, eds P. Giorgio, A. Del, and P. J. L. B. Williams (New York, NY: Oxford University Press), 123–146. doi: 10.1093/acprof:oso/9780198527084.003.0008
Keeling, R. F., Körtzinger, A., and Gruber, N. (2010). Ocean deoxygenation in a warming world. Annual Rev. Marine Sci. 2, 199–229. doi: 10.1146/annurev.marine.010908.163855
Kirkwood, D. S. (1992). Stability of solutions of nutrient salts during storage. Marine Chem. 38, 151–164. doi: 10.1016/0304-4203(92)90032-6
Lane, G. A., and Dole, M. (1956). Fractionation of oxygen isotopes during respiration. Science 123, 574–576. doi: 10.1126/science.123.3197.574
Lehrter, J. C., Beddick, D. L., Devereux, R., Yates, D. F., and Murrell, M. C. (2012). Sediment-water fluxes of dissolved inorganic carbon, O2, nutrients, and N2 from the hypoxic region of the Louisiana continental shelf. Biogeochemistry 109, 233–252. doi: 10.1007/s10533-011-9623-x
Li, D. J., Zhang, J., Huang, D. J., Wu, Y., and Liang, J. (2002). Oxygen depletion off the Changjiang (Yangtze River) Estuary. Sci. China Seri. D 45, 1137–1146. doi: 10.1360/02yd9110
Li, H.-M., Tang, H.-J., Shi, X.-Y., Zhang, C.-S., and Wang, X.-L. (2014). Increased nutrient loads from the Changjiang (Yangtze) River have led to increased Harmful Algal Blooms. Harmful Algae 39, 92–101. doi: 10.1016/j.hal.2014.07.002
Li, S. L., Liu, C. Q., Li, J., Liu, X. L., Chetelat, B., Wang, B. L., and Wang, F. S. (2010). Assessment of the sources of nitrate in the changjiang river, China using a nitrogen and oxygen isotopic approach. Environ. Sci. Technol. 44, 1573–1578. doi: 10.1021/es902670n
Li, Z., Song, S. Q., Li, C. W., and Yu, Z. M. (2018). The sinking of the phytoplankton community and its contribution to seasonal hypoxia in the Changjiang (Yangtze River) estuary and its adjacent waters. Estuarine Coastal Shelf Sci. 208, 170–179. doi: 10.1016/j.ecss.2018.05.007
Liu, L., Zhou, J., Zheng, B., Cai, W., Lin, K., and Tang, J. (2013). Temporal and spatial distribution of red tide outbreaks in the Yangtze River Estuary and adjacent waters, China. Marine Pollut. Bull. 72, 213–221. doi: 10.1016/j.marpolbul.2013.04.002
Mariotti, A., Germon, J. C., Hubert, P., Kaiser, P., Letolle, R., Tardieux, A., and Tardieux, P. (1981). Experimental determination of nitrogen kinetic isotope fractionation: some principles; illustration for the denitrification and nitrification processes. Plant Soil 62, 413–430. doi: 10.1007/BF02374138
Mccarthy, M. J., Carini, S. A., Liu, Z., Ostrom, N. E., and Gardner, W. S. (2013). Oxygen consumption in the water column and sediments of the northern Gulf of Mexico hypoxic zone. Estuarine Coastal Shelf Sci. 123, 46–53. doi: 10.1016/j.ecss.2013.02.019
Murrell, M. C., and Lehrter, J. C. (2011). Sediment and lower water column oxygen consumption in the seasonally hypoxic region of the louisiana continental shelf. Estuar. Coasts 34, 912–924. doi: 10.1007/s12237-010-9351-9
Naqvi, S. W. A., Jayakumar, D. A., Narvekar, P. V., Naik, H., Sarma, V. V., D'souza, S. S., et al. (2000). Increased marine production of N2O due to intensifying anoxia on the Indian continental shelf. Nature 408, 346–349. doi: 10.1038/35042551
Ni, X. B., Huang, D. J., Zeng, D. Y., Zhang, T., Li, H. L., and Chen, J. F. (2016). The impact of wind mixing on the variation of bottom dissolved oxygen off the Changjiang Estuary during summer. J. Marine Syst. 154, 122–130. doi: 10.1016/j.jmarsys.2014.11.010
Niino, H., and Emery, K. O. (1961). Sediments of shallow portions of east China Sea and South China Sea. Geol. Soc. Am. Bull. 72:731. doi: 10.1130/0016-7606(1961)72[731:SOSPOE]2.0.CO;2
Nilsson, H. C., and Rosenberg, R. (1994). Hypoxic response of two marine benthic communities. Marine Ecol. Progr. Seri. 115, 209–217. doi: 10.3354/meps115209
Office of Integrated Oceanographic Survey of China (1961). Dataset of the National Integrated Oceanographyic Survey. vol 1. Survey data of hydrometeorological and chemical elements in the bohai, Huanghai and East China Seas (Beijing).
Ostrom, N. E., Gandhi, H., Kamphuis, B., Decamp, S., Liu, Z., Mccarthy, M. J., and Gardner, W. S. (2014). Oxygen metabolism and water mass mixing in the northern Gulf of Mexico hypoxic zone in 2010. Geochim. Cosmochim. Acta 140, 39–49. doi: 10.1016/j.gca.2014.05.020
Qian, W., Dai, M., Xu, M., Kao, S.-J., Du, C., Liu, J., Wang, H., Guo, L., and Wang, L. (2017). Non-local drivers of the summer hypoxia in the East China Sea off the Changjiang Estuary. Estuarine Coastal Shelf Sci. 198, 393–399. doi: 10.1016/j.ecss.2016.08.032
Quinones-Rivera, Z. J., Wissel, B., Justic, D., and Fry, B. J. M. (2007). Partitioning oxygen sources and sinks in a stratified, eutrophic coastal ecosystem using stable oxygen isotopes. Mar. Ecol. Progr. 342, 69–83. doi: 10.3354/meps342069
Rasmussen, H., and Jorgensen, B. B. (1992). Microelectrode studies of seasonal oxygen uptake in a coastal sediment: role of molecular diffusion. Marine Ecol. Progr. Seri. 81, 289–303. doi: 10.3354/meps081289
Reuer, M. K., Barnett, B. A., Bender, M. L., Falkowski, P. G., and Hendricks, M. B. (2007). New estimates of Southern Ocean biological production rates from O2/Ar ratios and the triple isotope composition of O2. Deep Sea Res. Part I 54, 951–974. doi: 10.1016/j.dsr.2007.02.007
Rowe, G. T., Kaegi, M. E. C., Morse, J. W., Boland, G. S., and Escobar Briones, E. G. (2002). Sediment community metabolism associated with continental shelf hypoxia, Northern Gulf of Mexico. Estuaries 25, 1097–1106. doi: 10.1007/BF02692207
Sindermann, C. J., and Swanson, R. L. (1979). Oxygen depletion and associated benthic mortalities in New York Bight, 1976/editors, R. Lawrence Swanson, Carl J. Sindermann. National Oceanic and Atmospheric Administration. doi: 10.5962/bhl.title.4193
Song, G.-D., Liu, S.-M., Zhang, J., Zhu, Z.-Y., Zhang, G.-L., Marchant, H. K., Kuypers, M. M. M., and Lavik, G. (2020). Response of benthic nitrogen cycling to estuarine hypoxia. Limnol. Oceanogr. 9999, 1–15. doi: 10.1002/lno.11630
Song, G.-D., Liu, S.-M., Zhu, Z.-Y., Zhai, W.-D., Zhu, C.-J., and Zhang, J. (2016). Sediment oxygen consumption and benthic organic carbon mineralization on the continental shelves of the East China Sea and the Yellow Sea. Deep Sea Res. Part II 124, 53–63. doi: 10.1016/j.dsr2.2015.04.012
Su, J. L. (1998). “Circulation dynamics of the China Sea north of 18°N,” in The Sea eds A. R. Robinson and K. H. Brink (New York, NY: John Wiley and Sons Inc.), 483–505.
Tsunogai, S., Shuichi, W., Yunya, N., Tsuneo, O., and Tetsuro, S. (1997). A preliminary study of carbon system in the East China Sea. J. Oceanogr. 53, 9–17. doi: 10.1007/BF02700744
Turner, R. E., Rabalais, N. N., Swenson, E. M., Kasprzak, M., and Romaire, T. (2005). Summer hypoxia in the northern Gulf of Mexico and its prediction from 1978 to 1995. Marine Environ. Res. 59, 65–77. doi: 10.1016/j.marenvres.2003.09.002
Wang, B., Chen, J. F., Jin, H. Y., Li, H. L., Huang, D. J., and Cai, W. J. (2017). Diatom bloom-derived bottom water hypoxia off the Changjiang estuary, with and without typhoon influence. Limnol. Oceanogr. 62, 1552–1569. doi: 10.1002/lno.10517
Wang, B. D. (2009). Hydromorphological mechanisms leading to hypoxia off the Changjiang estuary. Marine Environ. Res. 67, 53–58. doi: 10.1016/j.marenvres.2008.11.001
Wang, H. J., Dai, M. H., Liu, J. W., Kao, S.-J., Zhang, C., Cai, W.-J., et al. (2016). Eutrophication-driven hypoxia in the east China Sea off the changjiang estuary. Environ. Sci. Technol. 50, 2255–2263. doi: 10.1021/acs.est.5b06211
Wei, H., He, Y., Li, Q., Liu, Z., and Wang, H. (2007). Summer hypoxia adjacent to the Changjiang Estuary. J. Marine Syst. 67, 292–303. doi: 10.1016/j.jmarsys.2006.04.014
Wei, Q. S., Wang, B. D., Yu, Z. G., Chen, J. F., and Xue, L. (2017). Mechanisms leading to the frequent occurrences of hypoxia and a preliminary analysis of the associated acidification off the Changjiang Estuary in summer. Sci. China Earth Sci. 60, 360–381. doi: 10.1007/s11430-015-5542-8
Wendel, J. (2015). Gulf of Mexico dead zone largest since 2002. Mar. Ecol. Progr. Series 96. doi: 10.1029/2015EO033929
Yan, W., Zhang, S., Sun, P., and Seitzinger, S. P. (2003). How do nitrogen inputs to the Changjiang basin impact the Changjiang River nitrate: a temporal analysis for 1968-1997. Glob. Biogeochem. Cycles 17. doi: 10.1029/2002GB002029
Yang, Y.-P., Zhang, M.-J., Li, Y.-T., and Fan, Y.-Y. (2016). Trend and dynamic cause of sediment particle size on the adjacent continental shelf of the Yangtze Estuary. China Ocean Eng. 30, 992–1003. doi: 10.1007/s13344-016-0065-z
Zhang, H. Y., Zhao, L., Sun, Y., Wang, J. N., and Wei, H. (2017). Contribution of sediment oxygen demand to hypoxia development off the Changjiang Estuary. Estuarine Coastal Shelf Sci. 192, 149–157. doi: 10.1016/j.ecss.2017.05.006
Zhang, J., Zhang, Z. F., Liu, S. M., Wu, Y., Xiong, H., and Chen, H. T. (1999). Human impacts on the large world rivers: Would the Changjiang (Yangtze River) be an illustration? Glob. Biogeochem. Cycles 13, 1099–1105. doi: 10.1029/1999GB900044
Zhang, S., Liang, C., and Xian, W. (2020). Spatial and temporal distributions of terrestrial and marine organic matter in the surface sediments of the Yangtze River estuary. Continental Shelf Res. 203:104158. doi: 10.1016/j.csr.2020.104158
Zhang, W.-X., Wu, H., Hetland, R. D., and Zhu, Z.-Y. (2019). On mechanisms controlling the seasonal hypoxia hot spots off the changjiang river estuary. J. Geophys. Res. 124, 8683–8700. doi: 10.1029/2019JC015322
Zhu, Z.-Y., Wu, H., Liu, S.-M., Wu, Y., Huang, D.-J., Zhang, J., and Zhang, G.-S. (2017). Hypoxia off the Changjiang (Yangtze River) estuary and in the adjacent East China Sea: quantitative approaches to estimating the tidal impact and nutrient regeneration. Marine Pollution Bull. 125, 103–114. doi: 10.1016/j.marpolbul.2017.07.029
Zhu, Z.-Y., Zhang, J., Wu, Y., Zhang, Y.-Y., Lin, J., and Liu, S.-M. (2011). Hypoxia off the Changjiang (Yangtze River) Estuary: Oxygen depletion and organic matter decomposition. Marine Chem. 125, 108–116. doi: 10.1016/j.marchem.2011.03.005
Keywords: hypoxia, δ18O, Changjiang estuary, sediment oxygen respiration, water column respiration
Citation: Zhou J, Zhu Z-Y, Hu H-T, Zhang G-L and Wang Q-Q (2021) Clarifying Water Column Respiration and Sedimentary Oxygen Respiration Under Oxygen Depletion Off the Changjiang Estuary and Adjacent East China Sea. Front. Mar. Sci. 7:623581. doi: 10.3389/fmars.2020.623581
Received: 30 October 2020; Accepted: 22 December 2020;
Published: 09 February 2021.
Edited by:
Hongjie Wang, Pacific Marine Environmental Laboratory (NOAA), United StatesReviewed by:
Neha Ghaisas, Louisiana State University, United StatesBaodong Wang, Ministry of Natural Resources, China
Copyright © 2021 Zhou, Zhu, Hu, Zhang and Wang. This is an open-access article distributed under the terms of the Creative Commons Attribution License (CC BY). The use, distribution or reproduction in other forums is permitted, provided the original author(s) and the copyright owner(s) are credited and that the original publication in this journal is cited, in accordance with accepted academic practice. No use, distribution or reproduction is permitted which does not comply with these terms.
*Correspondence: Zhuo-Yi Zhu, emh1LnpodW95aUBzanR1LmVkdS5jbg==; Huan-Ting Hu, aHVhbnRpbmcuaHVAc2p0dS5lZHUuY24=