 Peng Chen
 Jiahao Chen2
- 1School of Engineering, Newcastle University, Newcastle upon Tyne, United Kingdom
- 2Guangdong Electric Power Design Institute Co., Ltd., China Energy Engineering Group, Guangzhou, China
- 3College of Shipbuilding Engineering, Harbin Engineering University, Harbin, China
Floating offshore wind turbines (FOWTs) still face many challenges on how to better predict the dynamic responses. Artificial intelligence (AI) brings a new solution to overcome these challenges with intelligent strategies. A new AI technology-based method, named SADA, is proposed in this paper for the prediction of dynamic responses of FOWTs. Firstly, the methodology of SADA is introduced with the selection of Key Disciplinary Parameters (KDPs). The AI module in SADA was built in a coupled aero-hydro-servo-elastic in-house program DARwind and the policy decision is provided by the machine learning algorithms deep deterministic policy gradient (DDPG). Secondly, a set of basin experimental results of a Hywind Spar-type FOWT were employed to train the AI module. SADA weights KDPs by DDPG algorithms' actor network and changes their values according to the training feedback of 6DOF motions of Hywind platform through comparing the DARwind simulation results and that of experimental data. Many other dynamic responses that cannot be measured in basin experiment could be predicted in higher accuracy with this intelligent DARwind. Finally, the case study of SADA method was conducted and the results demonstrated that the mean values of the platform's motions can be predicted by AI-based DARwind with higher accuracy, for example the maximum error of surge motion is reduced by 21%. This proposed SADA method takes advantage of numerical-experimental method and the machine learning method, which brings a new and promising solution for overcoming the handicap impeding direct use of traditional basin experimental technology in FOWTs design.
Introduction
The floating wind farms are beginning to flourish as offshore wind energy technology gradually matures. Due to water depth, seabed geology, visibility and noise impacts, the fixed offshore wind turbines are technically or commercial unfeasible at suitable sites, which also inspired further research into FOWTs (Spring, 2020). Being dependent on the way of supporting the platform to obtain stability and restoring force, four substructure designs were proposed for FOWTs: barge, semi-submersible, spar buoy and tension leg platform. Liu et al. (2016) presents a comprehensive review on the semi-submersible foundation, which includes the conceptual design and the projects currently under operation. Thiagarajan et al. (2014) summarized the above three types of floating platforms in terms of stability, resonance considerations and technology. Pérez-Collazo et al. (2015) and Tomey-Bozo et al. (2015) reviewed and compared different floating combinations between FOWTs and WEC. For example Semi-Submersible Flap Combination (Luan et al., 2014; Michailides et al., 2014) and Spar Torus Combination (Wan et al., 2015, 2016), etc. However, FOWTs encountered some notable hurdles and set-backs, where these were due to fundamentals of design or analysis in terms of R&D, cost, operation and maintenance.
FOWTs is a highly complex system, which accounts for the coupling between aero-hydro-servo-elastic dynamics. Due to the high cost of the floating substructure and foundations, there is a large overall cost difference (Wu et al., 2019). More precisely the inadequate design or analysis may cause cost of operation and maintenance of the wind farm increase, such as gearbox failures; grounted connections; accelerated blade surface erosion; accidental ship collision (Zhang et al., 2020). The deterioration of the mooring line over time will lead to an increase in the failure of single or multiple lines as well (Lugsdin, 2012). Regardless of the aspect, only based on reasonable and reliable R&D can minimize exposure to technical risks and reduce the cost. In an earlier stage, the significant R&D effort of FOWTs has been made with the appearance of coupled numerical tools (Jonkman and Sclavounos, 2006; Wayman et al., 2006; Jonkman and Technology, 2009). With several projects, it has greatly promoted the development of FOWTs. For example, Hywind and DeepCwind in the OC projects (Jonkman and Musial, 2010; Robertson et al., 2014, 2017, 2020) and OO-Star Wind Floater (Pegalajar-Jurado et al., 2018), Nautilus steel semisubmersible (Galván et al., 2018), IDEOL concrete floater (Beyer et al., 2015) in LIFES50+ project, etc.
However, there are still some challenges impeding the success of more accurately predict the dynamic responses of FOWTs and validate a new full-scale concept under high coupling effects. These challenges have been receiving great attention and led to many efforts by both academia and industry. Chen et al. (2020) summarized several intrinsic challenges and validation techniques in terms of on-site measurement, numerical simulation and basin model scale experiment. Among these challenges, how to use basin experimental technology conducting FOWTs test and transfer the model-scale testing results data to full-scale data, is one of the most critical ones. The impossibility of applying traditional basin testing data-processing technology directly for FOWTs testing is due to the reasons listed as below.
• Scaling issues:
Froude number and Reynolds number cannot be satisfied simultaneously, but aerodynamic performance and hydrodynamic performance of FOWTs are both important and neither can be neglected. Coupling effects between aero-hydro and structural dynamic responses are also important. Thus, the full-scale performance cannot be obtained by transferring model-scale data directly by using traditional method, who normally neglects Reynold number and uses Froud number as the unique dominating factor.
• Blade pitch control strategies:
Simulation of pitch control is very difficult to conduct under basin testing scenario, due to the mass sensitivity and signal delay.
• Experimental facilities and calibration methods:
There are also some other challenges, including mass property simulation, installation of measurement devices and wind-wave generator techniques.
In response to these existing challenges, scholars have made many efforts and summarized the existing experimental and numerical progresses (Stewart and Muskulus, 2016). Müller et al. (2014) listed some representative basin experiments and projects in the past and put forward a methodology for the existing problems by redesigned model scale rotor. Table 1 shows the different methodologies to conduct the experiment of FOWTs. For numerical methods, the balance between accuracy and speed (calculation time) is also an important consideration for evaluating the dynamic response of FOWTs. The linear (or quasi-linear) method is used in the preliminary research phase. And Non-linear methods are suitable for non-moderate design situations (e.g., wave-structure interaction under extreme events). Cruz and Atcheson (2016) gave a detailed explanation on the principles and applications of numerical methods and related experimental verification. They also summarized the specific issues that the designers are concerned about (for example: design load (Nichols et al., 2016) and certification (Ronold et al., 2010).
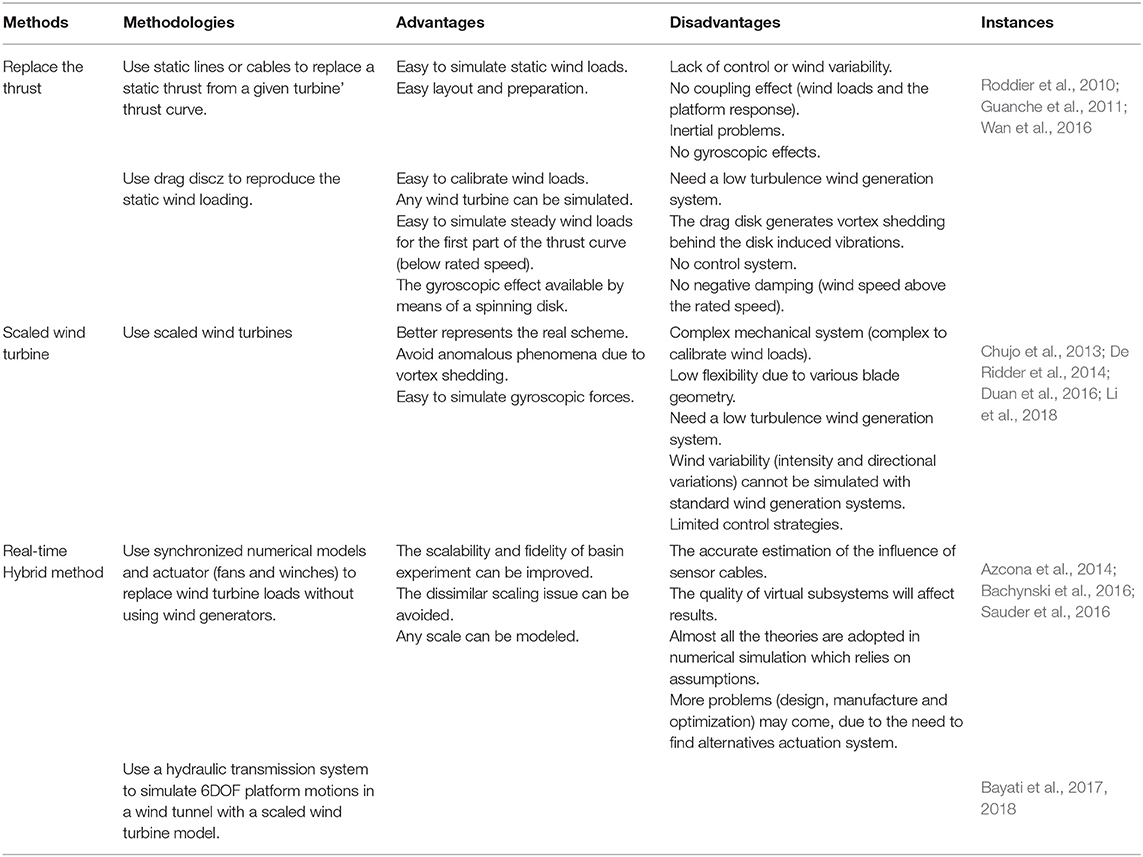
Table 1. Different methodologies to match the wind and wave loads.
FOWTs is a novel engineering structure involving a wide range of multi-disciplinary technologies. A reliable design does not only save costs in construction and installation, but also effectively avoid various problems that may occur in later operation and maintenance. It is an urgent demand for establishing an innovative and reliable hybrid numerical-basin experimental method to predict the dynamic responses of FOWTs. It will be therefore essential to thoroughly select the adequate setup for each test and include features and effects where possible. Basin experiment and numerical calculation have been regarded as useful and reliable methods. But they both have advantages and disadvantages as well. Under current experimental technical conditions, only some fractional physical quantities are available, including platform motions, fairlead tensions and nacelle accelerations, etc. However, the designer is concerned about the large number of physical quantities of FOWTs, which cannot be obtained by experiments directly, such as blade responses and tower responses, etc.
In recent years, AI technology has successfully made some progress in the wind industry. Machine learning (ML) is one of the most important extensions of the AI field, which can be divided into the following methods (Alpaydin, 2020): Supervised Learning, Unsupervised Learning and Reinforcement Learning (RL). Stetco et al. (2019) reviews the recent literature on machine learning (ML) models that have been used for condition monitoring in wind turbines. Related to the power generation of wind turbines, the AI model is a good choice for short-term wind power forecasting and pre-diagnosis of wind turbine (Khan et al., 2020). Pelletier et al. (2016) modeled wind turbine power curves by an multi-stage modeling techniques. In addition, there is no shortage of excellent innovative attempts in a control system (Jafarnejadsani and Pieper, 2014; Ma et al., 2018; Merabet et al., 2018; Sclavounos and Ma, 2018) Li et al. (2019) studied the wave energy control algorithm with an artificial neural network to implement the real-time wave force prediction (Li et al., 2020). The corresponding prediction of the motion of the platform is also carried out directly through the neural network (Chen et al., 2019b).
However, in addition to the combination of wind turbine power generation and control strategies, few researchers have explored other technical problems of FOWTs by machine learning.
Therefore, on purpose of proposing an efficient and functional method, an innovative hybrid basin experimental with software-in-the-loop combined reinforcement learning method, named SADA, is introduced in this paper. It mainly includes the introduction and classification of KDPs concepts, the methodology of SADA including introducing of an in-house program DARwind and AI technology Deep Deterministic Policy Gradient (DDPG) algorithm. Cases study was conducted by employing two models, namely discrete model and continuous model, respectively. SADA employed experimental data to train the reinforcement learning model and made the DARwind intelligent. It not only can predict 6DOF motion of FOWTs more accurately, but can also analyze the working conditions not conducted in the basin experiment. SADA method will benefit FOWT design greatly because SADA can help designers to obtain more accurate forecasts of dynamic responses of FOWTs system for many critical design factors under a wide range of different sea state.
Methodology of SADA
Conceptual Proposal
This section aims to introduce where the concept comes from in terms of design and verification of FOWTs. The theoretical analysis results of FOWTs need to be compared with the basin model test and on-site measurement to determine the feasibility, accuracy, and promote the development of the theories. Conversely, theoretical guidance can improve the methodology of experiment and numerical simulation. However, it is challenging tasks to make results from basin experiment and those from numerical analysis matching well, due to the strong non-linearity of FOWTs system, especially facing a completely new concept. This will inevitably lead to many unreasonable phenomena in the research and development process, but the existing theories cannot fully explain. Basin experimental technology can be used to obtain non-linear dynamic responses of FOWT and validate numerical tools. However, due to the intrinsic unresolved ratio scaling problems described in Section Introduction, the experimental results cannot be transferred to prototype data based on traditional way. Therefore, the validation of numerical software with prototype data from basin experiment is not an easy task. This unsolved problem puts forward higher challenges to FOWT designers, requiring them to design and confirm the critical parameters based on their experiences but without a direct support from experimental results. Fortunately, the emergence of AI technology provides a potential solution for the combination of using numerical simulation and basin experiment in a proper way.
This paper proposes a new method on the utilization of AI technology in the analysis of dynamic responses of FOWTs, named Software-in-the-loop combined Artificial intelligence method for Dynamic response Analysis of FOWTs (SADA). The overall layout of SADA is presented in Figure 1. Different from the traditional numerical calculation process, the SADA method incorporates AI technology into the combination of numerical program and basin experimental results, and make the numerical program intelligent by weighting the critical design parameters named KDPs in SADA method. As shown in Figure 1, SADA starts form the green button by selecting the initial critical KDPs by FOWTs designers. AI technology discussed in this paper is a reinforcement learning algorithm named DDPG. An in-house program named DARwind is utilized to run the dynamics response analysis of FOWTs with the initial critical KDPs. For more information of the DARwind program, please refer to the published literature (Chen et al., 2017, 2018, 2019a). Then, some physical quantities such as 6DOF motions are chosen as the states in DDPG to conduct AI training for DARwind program. According to the states, the actor network will give the corresponding action probability distribution, which will be used to adjust the KDPs values properly to run next loop if the error analysis is not satisfied.
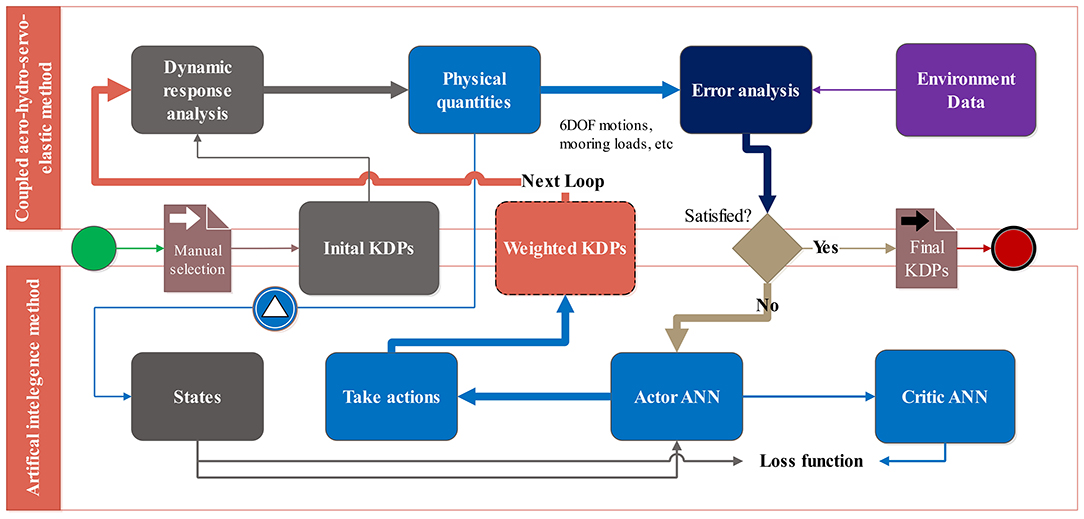
Figure 1. The overall layout of proposed SADA method.
From software-in-the-loop concept, SADA can effectively adjust KDPs values to reduce errors between numerical analysis results and basin experimental results. Consequently, when the errors are reduced to a satisfiable status, it means SADA method has trained the DARwind program good enough to conduct intelligent numerical analysis. In addition, some other physical quantities that cannot be measured directly in the experiment can be predicted with AI-trained DARwind program as well. Besides, through the training process, the AI-trained DARwind can also exclusively complete the FOWTs dynamic response analysis in the sea states different from those used in basin experiment. The specific introduction and discussion of the SADA method will be listed in the following sections.
Key Disciplinary Parameters Selection
This section summarizes key disciplinary parameters (KDPs) used in this paper, through theoretical analysis of each discipline used in dynamic analysis of FOWTs. Dynamic responses prediction of FOWTs involves multiple disciplines, including aerodynamics, hydrodynamics, structural mechanics, multi-body dynamics and kinematics, mooring dynamics, etc. Many of the functions and formulas involved in these theories are determined based on assumptions and empirical parameter values. However, these empirical parameters values may not be proper for FOWTs due to its high non-linear coupling effect. For example, the empirical aerodynamic parameter values such as wind resistance coefficient of blades, can bring potential problems to the later numerical simulation of the entire FOWTs system. Many other key environmental parameters such as wave parameters in hydrodynamics and mooring line damping values etc. are difficult to be issued unique values during the analysis. Therefore, as the first step of using SADA method it is of great importance select these key discipline parameters properly. This paper demonstrates an example of SADA method application and some key KDPs selections are also presented in this section.
Multidisciplinary KDPs
Aerodynamics
Wind load calculation is of critical significance in FOWTs dynamic responses analysis. The wind profile index n and Glauert correction coefficient for high axial induction factor ac are chosen. Taking into account the viscous effect of sea level on wind speed, change of the average wind speed gradient along the height conforms to the logarithmic rate:
Where, h is the reference height above sea level is usually 10 m; ū(h) is the average wind speed at the reference height; z is above sea level; ū(z) is the average wind speed at z; n is the wind profile index, which characterizes the sea level roughness. For the open coastal area, the value is usually 3, and for the uncovered sea area, the value is usually 7 ~ 8. But its real value varies and depends quite a lot on experience in simulation, so parameter n is chosen as one KDP.
In addition, for aerodynamic calculation, when the axial induction factor becomes larger than ~0.4, the simple momentum theory breaks down. Different empirical relations between the thrust coefficient CT and a can be made to fit with measurements, for example:
or:
F is Prandtl's tip loss factor and corrects the assumption of an infinite number of blades. The last expression is found in Spera and Ny (2009) and ac is ~0.2. Because ac is an empirical value, so it is chosen as one KDP.
Servo Dynamics
Control operation will induce some unexpected dynamic responses of FOWTs, so some control parameters are selected as KDP in this paper. The generator torque constant k2 in the rated wind speed operation region (high speed shaft side) is chosen as one of the KDP in SADA method.
In this region, the generator torque is calculated by a quadratic relationship proportional to the rotation speed.
The value of parameter k2 is normally determined as 2.332287 as an empirical value of Hywind. But it varies for different type of FOWTs. Therefore, k2 is chosen as one KDP.
Hydrodynamics
The current exponential coefficient c and added linear viscous damping matrix coefficient are chosen as hydrodynamic KDPs.
For the current model, the velocity of the current varies with the depth of the power function, and the velocity at the bottom of the ocean is zero.
z is the vertical depth below the water surface; h is the depth of the water to the bottom; U0 is the velocity of the water. Parameter c normally uses empirical value 1/7, but it varies for different sea states. Thus, c is chosen as one of the hydrodynamic KDPs.
Potential flow damping cannot consider the viscous effect of fluids on underwater structures, and platforms of FOWTs usually have a truss or buoy structure with a small diameter, so the calculation of viscous damping force needs to be paid attention to. From Morrison's equation correction we can get:
Where, D is the diameter of the cylinder; vw and vs are the velocity component of the fluid velocity when the water mass is not disturbed and the cross-sectional slice velocity of the underwater component perpendicular to the cross-section axis; is drag coefficient; lm is the radius from the center point of the section to the unified coordinate system. From added constant viscosity damping coefficient matrix we can get:
CLD is linear coefficient matrix; CSD is quadratic coefficient matrix.
The Morrison equation more accurately considers the coupling effect and non-linear of the viscous damping. The values of coefficients matrix CLD and CSD are chosen as hydrodynamic KDPs.
Kinematics and Structural Dynamics
The mode superposition method (Andreaus et al., 2016) is used in DARwind to approximate the finite DOF of the three-dimensional beam deformation U0, as follows:
Among them, the axial and lateral deformation are as follows:
Where, spatial shape function matrix:
The coefficients of polynomial mode φx1 value is 0.0622 as an empirical value of Hywind. But it varies for different type of structure and material. Therefore, φx1, will be adopted as one KDP in kinematics & structural module, which is the x-axis component of spatial shape function.
Summary of KDPs
In addition to some of the parameters described, wet density (w) in mooring dynamic is also selected as one KDP. Table 2 summarizes 11 KDPs used in this paper. Certainly, there are more KDPs that have not been considered, such as static force and restoring force in hydrostatics, tower drag coefficient, Young's modulus coefficient of mooring lines and so on. They can be added in KDPs in further analysis.
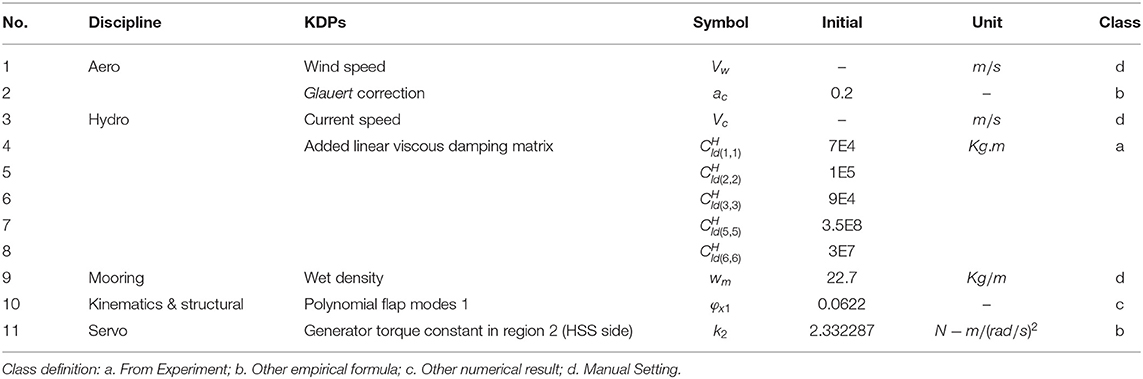
Table 2. KDPs in SADA.
Although KDPs cover a wide range of disciplines, they can be effectively classified. Through classification, designers can study which type of KDPs has the greatest impact on errors in future research. In general, KDPs can be divided into four categories:
a. Experimental correction: to modify the relevant parameters of the numerical simulation based on the experimental results. For example, still water decay test for added viscous damping matrix and added mooring line restoring stiffness matrix.
b. Empirical formula: Empirical coefficient or an empirical formula, such as tower resistance coefficient, polynomial coefficients.
c. Numerical correction: Parameters are obtained from other numerical tools, such as physical blade element parameters (Bladed software), hydrodynamic parameters (WAMIT software).
d. Manual setting: Some physical quantities that are known to have small changes with the environment and time, such as gravitational acceleration, wet weight or stiffness of mooring line.
Deep Deterministic Policy Gradient
Deepmind (Lillicrap et al., 2015) proposed an improved version of the actor–critic algorithm named DDPG, which uses the deep neural networks to estimate the optimal policy function instead of choosing the action based on a specific distribution (Qiu et al., 2019). Luo et al. (2019) give a brief literature review on DDPG method. DDPG can avoid the curse of dimensionality compared with Markov decision process (Van Otterlo and Wiering, 2012) and Q-learning (Watkins and Dayan, 1992) which require the discretization of the state. Therefore, it is attractive to study whether DDPG can resolve the continuous coupled problems in FOWTs. The specific algorithm of DDPG is shown in Appendix by Lillicrap et al. (2015). Below are the notations and nouns of SADA in this paper:
• Agent: DARwind (use KDPs to run the dynamic response analysis)
• State(S): The numerical results from DARwind (for example 6DOF platform motions).
• Action(A): The act of weighting KDPs according to state and other considerations.
• Reward(R): The reward and punishment obtained by error assessment between numerical and experimental results.
There are 7 states in each observation, including average 6DOF platform motions and work done signal. The work done signal is used to demonstrate whether the error between experimental results and simulation results can be reduced to a tolerable range. At the same time, an interval range is set for each KDPs, which is used to determine that the KDPs are still within the available range after each weight. If the output value of the action exceeds the range, it will be truncated. It is necessary to determine the boundary of each KDPs, which can be derived theoretically and experimental data, for example, the still water decay test. When KDPs touched the boundary, action cannot further change KDPs across the boundary. For example, the current wind speed is 11.4 m/s, and the boundary of wind speed is [11.35, 11.45]. After one action, the wind speed will not become 11.3 m/s even though the action is −0.1 m/s. The model will force it to become 11.35 if the weighted value lower than 11.35. But exceeding the boundary conditions does not mean that the KDPs stop optimization. In addition, the situation of touching the boundary will be avoided as much as possible, because the maximum value of each corresponding action is different. Some KDPs cover arrays and matrices in this paper, for example, the added linear viscous damping matrix coefficient and polynomial flap modes of tower. However, each element in these arrays and matrices will be set as an independent value according to each action and part of element in them may be ignored.
SADA
Based on DDPG algorithm and DARwind, SADA can be applied in different demands. Two models are discussed in this paper, which are:
• Discrete model: Suitable for analysis of a single known sea state and working condition. For example, optimize KDPs to further reduce errors in a single case.
• Continuous model: Suitable for analysis of known (implement in the experiment) and unknown (not implement in the experiment) sea states and working conditions. For example, the optimizable working conditions are not limited to experiment. Two method will be discussed in continuous model in this paper, which are:
a. Single training (ST) method: train model by each known working condition in a certain order.
b. Combined training (CT) method: train model by each known working condition in a random order.
The flow chart of SADA method is listed in Figure 2, and the main loop is the thick black solid line.
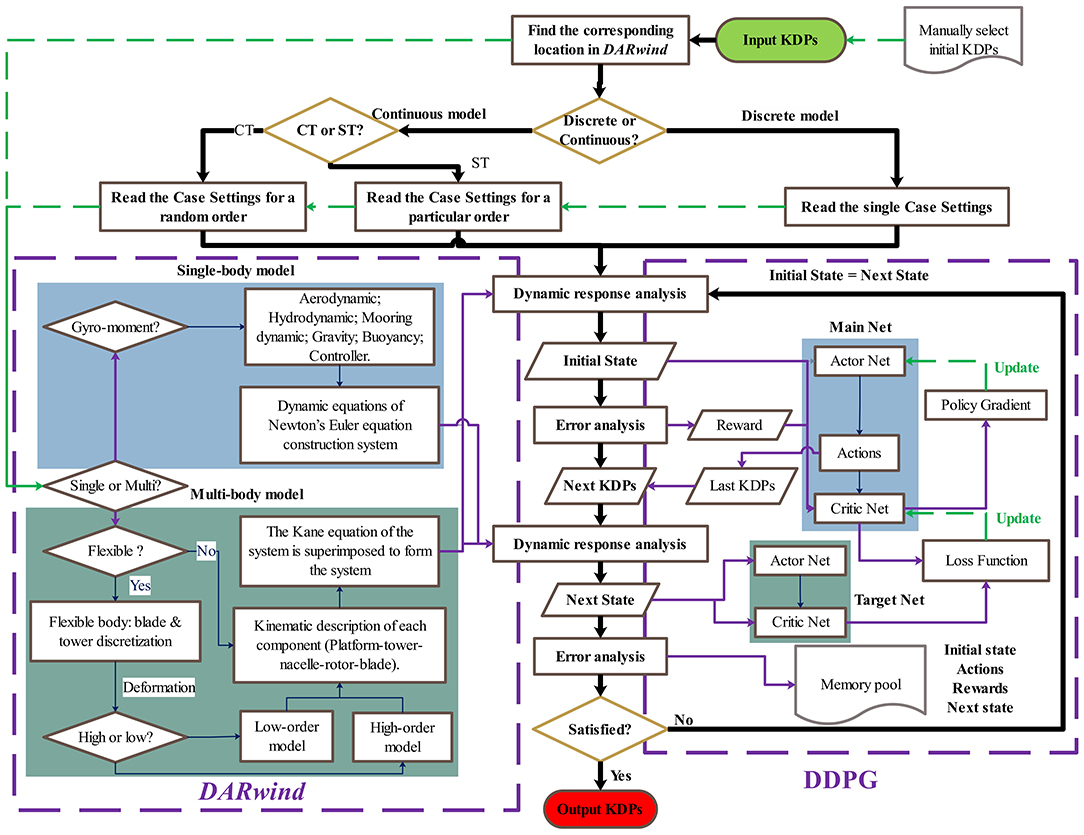
Figure 2. The flowchart of SADA.
The specific process in Figure 2 is as follows:
• Step 1. Manual selection of KDPs from disciplines.
• Step 2. Correspond each action to the KDPs and locate the position of these KDPs in DARwind program.
• Step 3. Use initial KDPs to run dynamic response analysis in DARwind program to obtain state.
• Step 4. KDPs in DARwind program are weighted by actions by the actor network in DDPG.
• Step 5 Use weighted KDPs to run dynamic response analysis to obtain next state.
• Step 6. Use experimental data for error analysis and train neural networks.
• Step 7. Determine whether the error meets the requirements. If yes, output KDPs, if not, return to Step 4.
• Step 8. Use final KDPs to run dynamic response analysis in DARwind program.
In the specific process, the designers should first select the initial KDPs artificially among different disciplines. On this basis, find the corresponding positions of these KDPs in dynamic response tool DARwind. The physical variables calculated by DARwind are regarded as “state.” Subsequently, the KDPs in DARwind are weighted by the actions output by the actor network. For the weighted KDPs, the second dynamic response analysis and error analysis are performed again.
The SADA method includes dynamic response analysis, reinforcement learning algorithms and experimental data utilization. The traditional dynamic response algorithm can only analyze based on the KDPs provided by the designer, but cannot consider some phenomena and changes that may exist in the actual environment changes in the basin experiment. AI-based DARwind can overcome the limitations of traditional software, and optimize its own from the basic theoretical part through the training of experimental results. The intelligence of DARwind -SADA is reflected in its self-training to optimize errors. It can realize the interaction between itself and the environment, instead of just passively setting parameters manually by the designer. In addition, the trained AI model can not only deal with the existing experimental environment, but also work well in the undeveloped environment.
Case of Study and Discussions
This section gives a case of study for the SADA methodology proposed in this paper. The experiment data is provided by an experiment conducted at the Deepwater Offshore Basin at Shanghai Jiao Tong University using OC3 Hywind model. Figure 3 shows the experimental model and sensors and main dimensions of the spar-type floater.
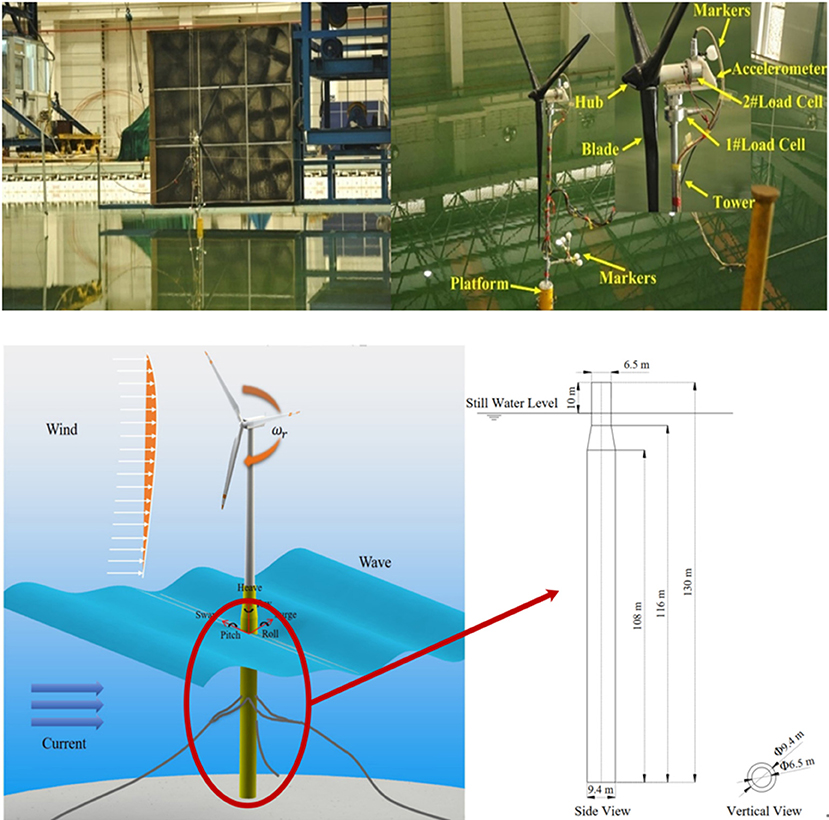
Figure 3. Experimental model & sensors and main dimensions of spar-type Floater.
More details on the test executions, such as the model blades fabrication, wind field tests, restoring tests of the mooring system can be found in references (Duan et al., 2015, 2016). Two numerical models will be discussed in this section, which are Discrete model and Continuous model. In continuous model, Single training (ST) method and Combined training (CT) method will be used to run the prediction.
Discrete Model
This section gives case-of-study for application of SADA method on discrete model. 9 testing cases are selected for AI training and are shown in Table 3. These testing cases include the cases of wind only, wave only, current only, wind and wave, wind and wave and current (WWC). In Table 3, the irregular wave is based on the JONSWAP wave spectrum, wherein H represents the significant wave height, Tp represents the spectral peak wave period, and γ represents the spectral peak parameter. Vw, Vr and VC are the speed of wind, rotor and current, respectively.
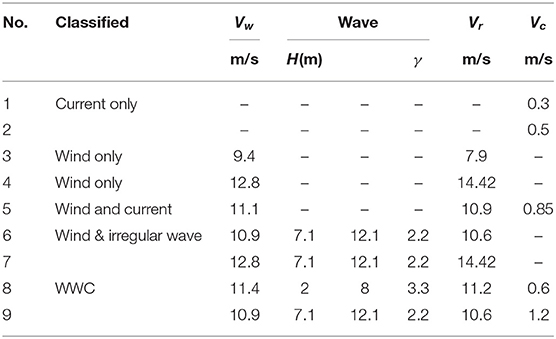
Table 3. Test matrix.
In error analysis, the variation of error (Errorvariation) will be defined as:
The Outputmodel test is the experimental physical quantity. The OutputDARwind(inital KDPs) is the numerical results by initial KDPs by DARwind. Correspondingly, OutputDARwind(weighted KDPs) is the numerical results by the weighted KDPs by DARwind. The Errorvariation is used to measure whether the results of SADA is better than the original DARwind. If the Errorvariationis positive, it means that the error between experiment and numerical simulation has decreased by SADA, otherwise the error has increased.
In Table 4, the positive value shows that SADA reduced the error between numerical calculation and experiment by percentage, and vice versa, it represents the percentage of error increase. The number of actions taken in each case is different, which is determined according to the specific case. From the perspective of the motions, the Errorpresent of surge is less than Errorinital, especially significant in case 1, 2, and 5. The Errorpresent of pitch basically maintains a relatively stable variation range.
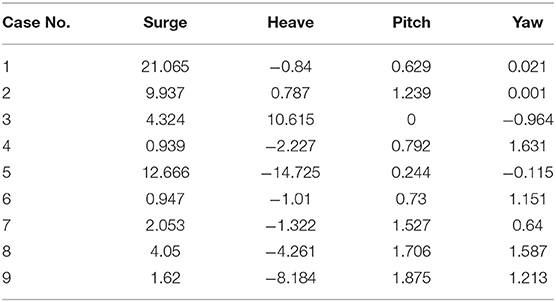
Table 4. Errorvariation of FOWT platform motions (%).
Case Analysis
In case 1 (Figure 4), SADA weighs the KDPs 7 times. In the first 4 actions, the error of surge has changed significantly by each action. However, the fifth action is unchanged compared to the fourth one. It is because the weighted KDPs has been chosen as most suitable one. Therefore, the error of each step is unchanged from the previous step. In some case, only part of sea state has been considered, for example in wind only (case 3 &4), which will not be changed with some KDPs (current speed, wave loads, etc.).
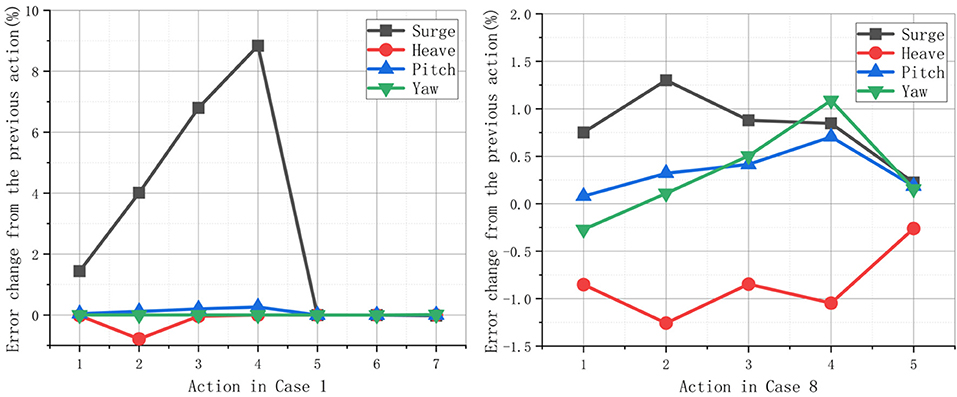
Figure 4. Comparison in each action under case 1 & 8.
Figure 5 shows the trend of the average amplitude of surge with each action. As showed, the red solid line is the average experimental value of 7.07 m, and the red dashed line is the 5% tolerance in range of 6.7165 m. Similar to the situation encountered in case 1, the amplitude of surge remains unchanged after the fourth weighting action in a fully coupled environment (WWC). It can be seen from Table 4 that the error of heave in case 9 is increased, while the experimental result of heave in case 9 is only 0.307 m, so the slight change is within the tolerable error range. The results of other cases are not listed, which are all provided in Table 4.
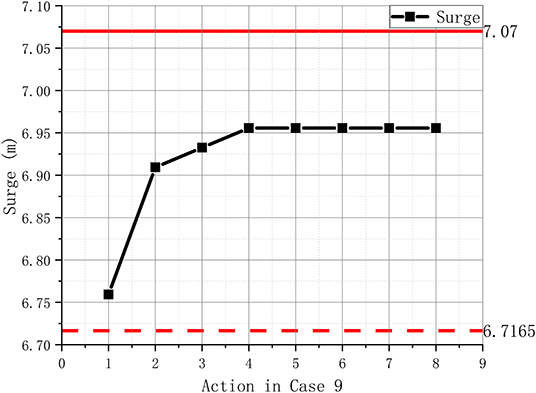
Figure 5. Average surge amplitude change in case 9.
Platform Motions Analysis
This section analyzes the Errorvariation of the average amplitude of the specific platform motion in all 9 cases. From Figure 6, the entire FOWTs system is in a shutdown state, without influence of wind and waves in case 1 (current only). Compared with wind only and case 5, it shows that in the coupled environment of wind and current, weighted KDPs can effectively reduce the error of surge. In the last four couple cases, the amplitude of the surge is very close to the experimental value in these coupled cases. Therefore, the error remains stable. Although the heave is decreasing in most cases, its experimental value is only 0.065 m. In general, the amplitude of heave in all 9 cases is basically two decimal places. In addition, there are not many KDPs that directly affect the heave. Therefore, the added static force and added linear restoring matrix can also be considered for further optimization.

Figure 6. Variation of error of platform motions in 9 cases.
Comparing case 6 and case 7, the higher the wind speed, the better the optimization of pitch in wind and wave environment. At this time, the average amplitude of pitch is 6.42 deg and 4.512 deg in case 6 and case 7, respectively. In last two cases, the 11 KDPs can achieve the greatest optimization. If KDPs are expanded from 11 to 31 and more factors included, then it is conceivable that there will be a very large change in pitch in WWC environment. The Errorvariation of yaw is more dramatic. In current only case, the Errorvariation did not change which shows that the current speed does not impact the yaw motion a lot. In wind only, it has a greater impact due to the difference in wind speed. But comparing experimental results (−0.281 deg and −0.866 deg), the larger wind speed causes the amplitude of yaw to increase. In addition, the errors are all reduced under the combined wind and wave conditions. Not only because wind will inhibit the motion of the platform under wave conditions, but also the hydrodynamic parameters in KDPs have been more accurately corrected.
Continuous Model
A multi-combination training mechanism is set according to the selected cases in continuous model. Not only the cases conducted in the experiment, but also the undesigned cases can also be optimized. As Table 5 shown, the first three cases are training cases and case 4 is the forecast cases.
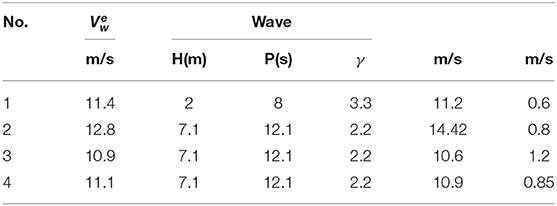
Table 5. Test matrix.
Two continuous methods were proposed for comparing their efficiency. The single training (ST) method, which is to use 3 independent cases for training in a specific permutation. In combining training (CT) method, the three cases will be selected in a random order for training the model (Figure 7). For example, case 1 gets a new state through action, and the number of this action is manually set (if 10). However, after 10 actions, the training does not end, but the model automatically and intelligently updates the new numerical calculation settings according to the given case list, starts the calculation of the next case and loops in turn. This also means that the three cases do not necessarily represent only three loops. Instead, it can train over and over in three cases in several loops. There is no fixed exit condition in actual operation. Generally, only one maximum number of loops is set. Unlike classification and identification problems, due to the limitations of numerical software, it is currently difficult to define the exit conditions, which is determined according to the needs of the designer. It can be the error of the platform's motions between numerical results and experimental results, or any other conditions they care about.
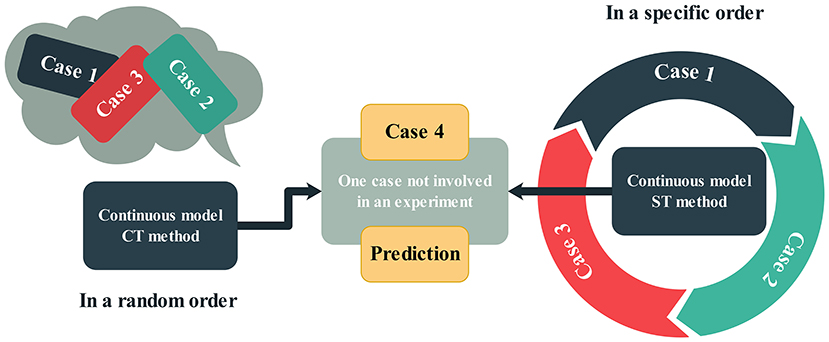
Figure 7. Two training method in Continuous model.
Platform Motions Analysis
From Table 6, the optimization effect of CT method is more significant than ST method. The case 2 has a general performance in the variation of error of each motion. This may be caused by the wind load and the high rotor speed. Wind load can effectively restrain the motion of the platform, but too high rotor speed will increase the influence of gyro moment.
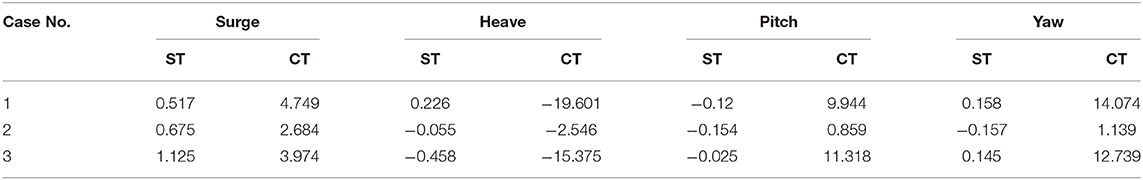
Table 6. Variation of error of two methods (%).
The three cases belong to the combination of wind, wave and current, and the Errorvariation of platform motions is carried out according to each action. In Figure 8, the CT method has the advantages of rapid convergence compared with the ST method. For example, in case 1, the KDPs of the CT basically reach the boundary after the sixth action, and no longer change. The ST model still has a tendency to change after the 11th action. This also means that the CT method can judge the next step more effectively according to the state obtained after each action. However, the ST method obtains the best KDPs after 25 operations which did not show in Figure 8. The error in the first action of the CT method drops by 11%. In the next 5 actions, the error gradually increased, but the percentage increase was very small (within 2%). This is also a reflection of the intelligence of the CT method. The model itself measures how to act to obtain better benefits. According to the reward engineering, as long as the error of surge reaches within 10%, which represents the acceptable range.
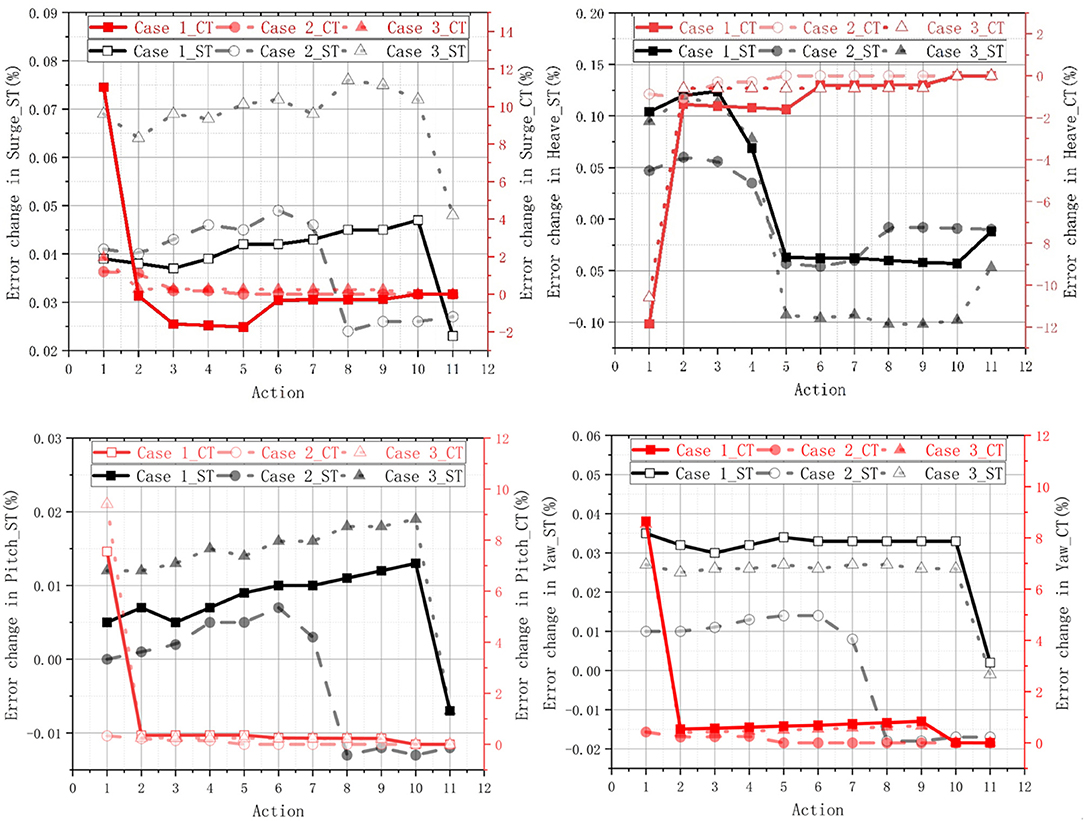
Figure 8. Actions of platform motions in three cases.
For heave, the ST model performed well at the beginning, and the error gradually decreased, but after the fifth action, it remained basically unchanged. For the CT method, the error increases rapidly after the first action, but it remains stable afterwards. However, the heave amplitude is only 0.411 m in case 1, even if the error of the first action increases by 12%, the impact on the entire FOWTs system is very small. This is also the intelligence of the CT model, which can effectively filter the weight of the maximum benefit, by choosing between surge and heave.
For pitch and yaw motions, the optimization effect of CT method is much better than that of ST model, in case 1. The error reduction of each step in ST method is only kept in a very small interval. The CT method is consistent with two motions discussed above. In the first action, SADA made a very wise choice, reducing the error by about 8%. In subsequent actions, on the one hand, the KDPs may reach the boundary, and it weighs other factors and benefits. Therefore, the error no longer changes greatly, and basically maintains fluctuations in a small range.
Prediction
The previous section discussed two continuous method for known cases. This section will use the trained model to numerically optimize an unknown continuous case 4. Although case 4 is also part of the experimental case, here we assume that it is an unknown case. Case 4 does not participate in the previous training process, which will be directly used for optimization by the trained continuous model. In order to understand the Errorvariation more intuitively, Figure 9 shows 3 time-history curves of surge. Through different actions, the final numerical calculation result of the weighted KDPs has changed. Although the error reduction is limited (due to the setting of the boundary), it is still desirable.
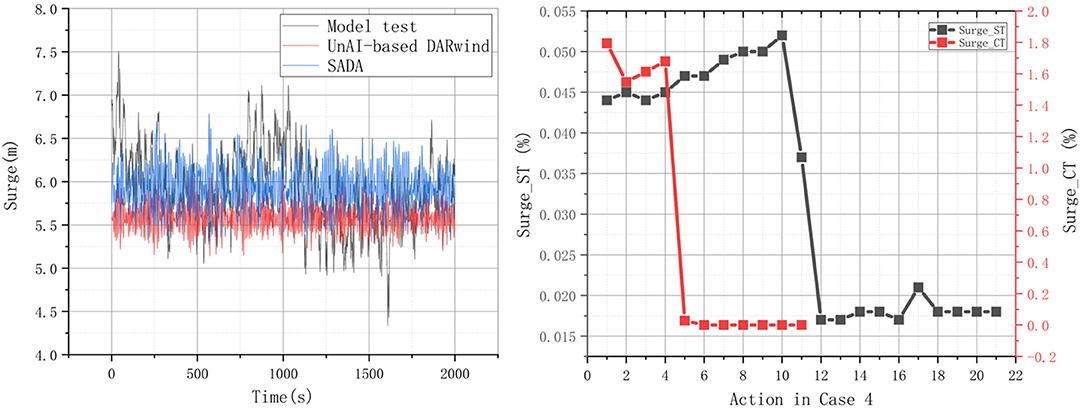
Figure 9. Comparison of surge motion in case 4.
In CT method, surge and pitch are reduced by 6.662% and 1.94%, respectively. In ST method, pitch and yaw motion is greatly increased. And the heave motion remains unchanged. In Figure 9, the CT method maintains a 1.5–1.8% drop rate in the first four actions. By the fifth action, the error remains basically unchanged. The ST method is known to maintain a rate of about 0.05% until the 11th action. The CT method can more intelligently screen effective and high-yield actions according to different cases when facing unknown continuous working conditions.
Conclusion
Summary of SADA
The traditional dynamic response software can only analyze based on the KDPs provided by the designer, but cannot consider some phenomena and changes that may exist in the actual environment changes in the basin experiment. This article proposes an innovative and intelligent method to optimize the numerical calculation of FOWTs by reinforcement learning method. SADA can overcome the limitations of traditional software, and optimize its own from the basic theoretical part through the training of experimental results. Based on the DDPG algorithm and DARwind program, discrete model in SADA can effectively reduce the error of platform motions. Two continuous methods in SADA are proposed, namely ST and CT. A comparison of these two methods:
• ST: The method is simple; each step is relatively stable; not too much fluctuation. However, it contains hyper-parameters; work not well-under unknown conditions and errors increase in some quantities.
• CT: The optimization effect is remarkable; the convergence is rapid; the unknown cases can be better optimized. However, it contains many hyper-parameters and errors increase in some quantities.
The intelligence is reflected in its self-training to optimize errors. It can realize the interaction between DARwind and the environment, instead of just passively setting parameters manually by the designer. In addition, the trained AI model can not only deal with the existing experimental environment, but also work well in the undeveloped environment. However, there are some limitations in this research:
• Limitation of selected KDPs: Only 11 KDPs have been selected in this paper. The more KDPs are added to the training, the better performance will SADA show. For example, the optimization of heave needs more KDPs (static force, restoring force)
• Limitation of boundary condition of KDPs: It is basically plus or minus 0.5 or 1–2 orders of magnitude smaller than the initial KDPs. The boundary conditions of different KDPs are inevitably different. For example, the coefficients in aerodynamics and the damping coefficients in hydrodynamics can differ by up to 1E10. In addition, KDPs can be changed from unified to independent. For example: various coefficients between different positions of blades and towers (11 tower stations share a resistance coefficient of 0.5).
• Limitation of cases: For continuous model, the more training cases, the more accurate and the better optimization.
• Hyper-parameters are used: For neural network training, different numbers of neurons and neural layers will affect the convergence effect of the model. For example, in this study, two actor networks are three-layer neural networks, the first layer of neuron nodes is 50, and the second layer is 200. The activation functions are all ReLU, and the output layer is tanh. The two critic networks are two-layer neural networks, the number of nodes in the first layer is 100, and the activation function is ReLU. The output layer is 200 and activation function is ReLU as well.
Future Work
In response to the above problems, more work can be carried out:
• Expand more states: in addition to the platform motions, some other physical quantities in experiment can be selected as states. For example, in addition to platform motions as a standard, physical quantities that can be easily obtained in experiments such as fairlead tension can also be considered.
• Compare more physical quantities: much more results can be added as well, such as power generation, blade deformation, tower deformation, etc.
• Impact on different disciplines of KDPs: the impact of the KDPs of each discipline can be analyzed.
• Debugging of hyperparameters in AI module: For this study, the selection of KDPs and the simulation of overall FOWTs dynamic response are one of the most critical studies. However, in future research, this is also one of the essential links.
In general, SADA can combine experiments with numerical simulations and make them intelligent. However, although the AI technological changes brought new ideas to our traditional research. It is undeniable that no matter how excellent AI technology is, it must be based on the theoretical knowledge and engineering application of various disciplines in the field of FOWTs. For example, the optimization of heave motion mentioned in this article. The selected KDPs in this paper did not select parameters that are strongly related to heave, which in turn reflects the importance of the choice of KDPs.
Data Availability Statement
The raw data supporting the conclusions of this article will be made available by the authors, without undue reservation.
Author Contributions
PC and ZH proposed the concept of the SADA method. JC and ZH developed the DARwind program. All authors contributed to the article and approved the submitted version.
Funding
This project was supported by Marine, Offshore and Subsea Technology Group at School of Engineering, Newcastle University, United Kingdom.
Conflict of Interest
JC was employed by company Guangdong Electric Power Design Institute.
The remaining authors declare that the research was conducted in the absence of any commercial or financial relationships that could be construed as a potential conflict of interest.
Abbreviations
FOWTs, Floating Offshore Wind Turbines; AI, Artificial Intelligence; SADA, Software-in-the-loop combined Artificial intelligence method for Dynamic response Analysis of FOWTs; KDPs, Key Disciplinary Parameters; DARwind, Dynamic Analysis for Response of Wind Turbines; DDPG, Deep Deterministic Policy Gradient; ST method, Single Training method; CT method, Combing Training method.
References
Andreaus, U., Baragatti, P., and Placidi, L. J. I. J. O. N.-L. M. (2016). Experimental and numerical investigations of the responses of a cantilever beam possibly contacting a deformable and dissipative obstacle under harmonic excitation. Int. J. Non-Linear Mech. 80, 96–106. doi: 10.1016/j.ijnonlinmec.2015.10.007
Azcona, J., Bouchotrouch, F., González, M., Garciandía, J., Munduate, X., Kelberlau, F., et al. (2014). Aerodynamic thrust modelling in wave tank tests of offshore floating wind turbines using a ducted fan. J. Phys. 524:012089. doi: 10.1088/1742-6596/524/1/012089
Bachynski, E. E., Thys, M., Sauder, T., Chabaud, V., and Sæther, L. O. (2016). “Real-time hybrid model testing of a braceless semi-submersible wind turbine: Part II—Experimental results,” in International Conference on Offshore Mechanics and Arctic Engineering. Busan: American Society of Mechanical Engineers. doi: 10.1115/OMAE2016-54437
Bayati, I., Belloli, M., Bernini, L., Giberti, H., and Zasso, A. J. I. R. P. G. (2017). Scale model technology for floating offshore wind turbines. IET Renew. Power Generat. 11, 1120–1126. doi: 10.1049/iet-rpg.2016.0956
Bayati, I., Facchinetti, A., Fontanella, A., Giberti, H., and Belloli, M. (2018). “A wind tunnel/HIL setup for integrated tests of floating offshore wind turbines,” in 7th Science of Making Torque from Wind, TORQUE 2018. Milan: Institute of Physics Publishing. doi: 10.1088/1742-6596/1037/5/052025
Beyer, F., Choisnet, T., Kretschmer, M., and Cheng, P. W. (2015). “Coupled MBS-CFD simulation of the IDEOL floating offshore wind turbine foundation compared to wave tank model test data,” in Proceedings of the Twenty-fifth (2015) International Ocean and Polar Engineering Conference (Hawaii).
Chen, J., Hu, Z., Liu, G., Tang, Y. J. J. O. R., and Energy, S. (2017). Comparison of different dynamic models for floating wind turbines. J. Renew. Sustain. Energy 9:063304. doi: 10.1063/1.5002750
Chen, J., Hu, Z., Liu, G., and Wan, D. J. R. E. (2019a). Coupled aero-hydro-servo-elastic methods for floating wind turbines. Renew. Energy 130, 139–153. doi: 10.1016/j.renene.2018.06.060
Chen, J., Hu, Z., Wan, D., and Xiao, Q. J. O. E. (2018). Comparisons of the dynamical characteristics of a semi-submersible floating offshore wind turbine based on two different blade concepts. Ocean Eng. 153, 305–318. doi: 10.1016/j.oceaneng.2018.01.104
Chen, P., Chen, J., Hu, Z. J. J. O. M. S., and Application (2020). Review of experimental-numerical methodologies and challenges for floating offshore wind turbines. J. Marine Sci. Appl. 19, 339–361. doi: 10.1007/s11804-020-00165-z
Chen, P., Hu, Z., and Hu, C. (2019b). “Software-in-the-loop method to predict the global dynamic responses of full-scale floating wind turbines by artificial neural network,” in 11th International Workshop on Ship and Marine Hydrodynamics (Hamburg).
Chujo, T., Minami, Y., Nimura, T., and Ishida, S. (2013). “Experimental study for spar type floating offshore wind turbine with blade-pitch control,” in International Conference on Offshore Mechanics and Arctic Engineering. Nantes: Citeseer. doi: 10.1115/OMAE2013-10649
Cruz, J., and Atcheson, M. (2016). Floating Offshore Wind Energy: The Next Generation of Wind Energy. Cham: Springer. doi: 10.1007/978-3-319-29398-1
De Ridder, E.-J., Otto, W., Zondervan, G.-J., Huijs, F., and Vaz, G. (2014). “Development of a scaled-down floating wind turbine for offshore basin testing,” in ASME 2014 33rd International Conference on Ocean, Offshore and Arctic Engineering. San Francisco, CA: American Society of Mechanical Engineers Digital Collection. doi: 10.1115/OMAE2014-23441
Duan, F., Hu, Z., and Niedzwecki, J. J. M. S. (2016). Model test investigation of a spar floating wind turbine. Marine Struct. 49, 76–96. doi: 10.1016/j.marstruc.2016.05.011
Duan, F., Hu, Z., and Wang, J. (2015). “Model tests of a spar-type floating wind turbine under wind/wave loads,” in International Conference on Offshore Mechanics and Arctic Engineering. Newfoundland, CA: American Society of Mechanical Engineers. doi: 10.1115/OMAE2015-41391
Galván, J., Sánchez-Lara, M., Mendikoa, I., Pérez-Morán, G., Nava, V., and Rodríguez-Arias, R. (2018). “NAUTILUS-DTU10 MW floating offshore wind turbine at gulf of maine: public numerical models of an actively ballasted semisubmersible,” in Journal of Physics: Conference Series. Hamburg: Institute of Physics Publishing. doi: 10.1088/1742-6596/1102/1/012015
Guanche, R., Vidal, C., Piedra, A., and Losada, I. (2011). “IDERMAR METEO. Offshore wind assessment at high and very high water depths,” in OCEANS 2011 IEEE-Spain. Santander: IEEE. doi: 10.1109/Oceans-Spain.2011.6003525
Jafarnejadsani, H., and Pieper, J. J. I. T. O. C. S. T. (2014). Gain-scheduled $ ell _ {1} $-optimal control of variable-speed-variable-pitch wind turbines. J. Magazines 23, 372–379. doi: 10.1109/TCST.2014.2320675
Jonkman, J., and Musial, W. (2010). Offshore Code Comparison Collaboration (OC3) for IEA Wind Task 23 Offshore Wind Technology and Deployment. Golden, CO: National Renewable Energy Lab (NREL). doi: 10.2172/1004009
Jonkman, J., and Sclavounos, P. (2006). “Development of fully coupled aeroelastic and hydrodynamic models for offshore wind turbines,” in 44th AIAA Aerospace Sciences Meeting and Exhibit. Reno. doi: 10.2514/6.2006-995
Jonkman, J. M. J. W. E. I. J. F. P., and Technology, A. I. W. P. C. (2009). Dynamics of offshore floating wind turbines—model development and verification. Wind Energy 12, 459–492. doi: 10.1002/we.347
Khan, N. M., Khan, G. M., and Matthews, P. (2020). “AI Based Real-Time Signal Reconstruction for Wind Farm with SCADA Sensor Failure,” in IFIP International Conference on Artificial Intelligence Applications and Innovations. Cham: Springer.
Li, L., Gao, Y., Hu, Z., Yuan, Z., Day, S., and Li, H. J. R. E. (2018). Model test research of a semisubmersible floating wind turbine with an improved deficient thrust force correction approach. Renew. Energy 119, 95–105. doi: 10.1016/j.renene.2017.12.019
Li, L., Gao, Y., Ning, D., Yuan, Z. J. R., and Reviews, S. E. (2020). Development of a constraint non-causal wave energy control algorithm based on artificial intelligence. Renew. Sustain. Energy Rev. 3:110519. doi: 10.1016/j.rser.2020.110519
Li, L., Gao, Z., and Yuan, Z.-M. J. O. E. (2019). On the sensitivity and uncertainty of wave energy conversion with an artificial neural-network-based controller. Ocean Eng. 183, 282–293. doi: 10.1016/j.oceaneng.2019.05.003
Lillicrap, T. P., Hunt, J. J., Pritzel, A., Heess, N., Erez, T., Tassa, Y., et al. (2015). Continuous control with deep reinforcement learning. Available online at: https://ui.adsabs.harvard.edu/abs/2015arXiv150902971L (accessed September 1, 2015).
Liu, Y., Li, S., Yi, Q., Chen, D. J. R., and Reviews, S. E. (2016). Developments in semi-submersible floating foundations supporting wind turbines: a comprehensive review. Renew. Sustain. Energy Rev. 60, 433–449. doi: 10.1016/j.rser.2016.01.109
Luan, C., Michailides, C., Gao, Z., and Moan, T. (2014). “Modeling and analysis of a 5 MW semi-submersible wind turbine combined with three flap-type wave energy converters,” in International Conference on Offshore Mechanics and Arctic Engineering. San Francisco, CA: American Society of Mechanical Engineers. doi: 10.1115/OMAE2014-24215
Luo, S., Lin, X., Zheng, Z. J. T. R. P. E. L., and Review, T. (2019). A novel CNN-DDPG based AI-trader: Performance and roles in business operations. Transport. Res. Part E: Logistics Transport. Rev. 131, 68–79. doi: 10.1016/j.tre.2019.09.013
Ma, Y., Sclavounos, P. D., Cross-Whiter, J., and Arora, D. J. R. E. (2018). Wave forecast and its application to the optimal control of offshore floating wind turbine for load mitigation. Renew. Energy 128, 163–176. doi: 10.1016/j.renene.2018.05.059
Merabet, A., Eshaft, H., and Tanvir, A. J. I. R. P. G. (2018). Power-current controller based sliding mode control for DFIG-wind energy conversion system. IET Renew. Power Generat. 12, 1155–1163. doi: 10.1049/iet-rpg.2017.0313
Michailides, C., Luan, C., Gao, Z., and Moan, T. (2014). “Effect of flap type wave energy converters on the response of a semi-submersible wind turbine in operational conditions,” in International Conference on Offshore Mechanics and Arctic Engineering. San Francisco, CA: American Society of Mechanical Engineers.
Müller, K., Sandner, F., Bredmose, H., Azcona, J., Manjock, A., and Pereira, R. (2014). “Improved tank test procedures for scaled floating offshore wind turbines,” in International Wind Engineering Confrence IWEC 2014 (Stockholm).
Nichols, J., Ronold, K. O., and Hopstad, A. L. (2016). “Key design considerations,” in Floating Offshore Wind Energy, eds J. Cruz and M. Atcheson (Cham: Springer), 241–269. doi: 10.1007/978-3-319-29398-1_5
Pegalajar-Jurado, A., Bredmose, H., Borg, M., Straume, J. G., Landbø, T., Andersen, H. S., et al. (2018). “State-of-the-art model for the LIFES50+ OO-Star Wind Floater Semi 10MW floating wind turbine,” in Journal of Physics: Conference Series. Trondheim: IOP Publishing. doi: 10.1088/1742-6596/1104/1/012024
Pelletier, F., Masson, C., and Tahan, A. J. R. E. (2016). Wind turbine power curve modelling using artificial neural network. Renew. Energy 89, 207–214. doi: 10.1016/j.renene.2015.11.065
Pérez-Collazo, C., Greaves, D., Iglesias, G. J. R., and Reviews, S. E. (2015). A review of combined wave and offshore wind energy. Renew. Sustain. Energy Rev. 42, 141–153. doi: 10.1016/j.rser.2014.09.032
Qiu, C., Hu, Y., Chen, Y., and Zeng, B. J. I. I. O. T. J. (2019). Deep deterministic policy gradient (DDPG)-based energy harvesting wireless communications. IEEE Int. Things J. 6, 8577–8588. doi: 10.1109/JIOT.2019.2921159
Robertson, A., Jonkman, J., Masciola, M., Song, H., Goupee, A., Coulling, A., et al. (2014). Definition of the Semisubmersible Floating System for Phase II of OC4. Golden, CO: National Renewable Energy Lab (NREL).
Robertson, A. N., Gueydon, S., Bachynski, E., Wang, L., Jonkman, J., Alarcón, D., et al. (2020). “OC6 Phase I: Investigating the underprediction of low-frequency hydrodynamic loads and responses of a floating wind turbine,” in Journal of Physics: Conference Series. IOP Publishing. doi: 10.1088/1742-6596/1618/3/032033
Robertson, A. N., Wendt, F., Jonkman, J. M., Popko, W., Dagher, H., Gueydon, S., et al. (2017). OC5 project phase II: validation of global loads of the DeepCwind floating semisubmersible wind turbine. Energy Proc. 137, 38–57. doi: 10.1016/j.egypro.2017.10.333
Roddier, D., Cermelli, C., Aubault, A., Weinstein, A. J. J. O.R., and Energy, S. (2010). WindFloat: a floating foundation for offshore wind turbines. J. Renew. Sustain. Energy 2:033104. doi: 10.1063/1.3435339
Ronold, K. O., Hansen, V. L., Godvik, M., Landet, E., JøRgensen, E. R., and Hopstad, A. L. H. (2010). “Guideline for offshore floating wind turbine structures,” in International Conference on Offshore Mechanics and Arctic Engineering (Shanghai).
Sauder, T., Chabaud, V., Thys, M., Bachynski, E. E., and Sæther, L. O. (2016). “Real-time hybrid model testing of a braceless semi-submersible wind turbine: part I—the hybrid approach,” in International Conference on Offshore Mechanics and Arctic Engineering. Busan: American Society of Mechanical Engineers. doi: 10.1115/OMAE2016-54435
Sclavounos, P. D., and Ma, Y. (2018). “Wave energy conversion using machine learning forecasts and model predictive control,” in 33rd International Workshop on Water Waves and Floating Bodies (Brest).
Spera, D. J. N. Y., and Ny, U. S. A. (2009). Wind Turbine Technology: Fundamental Concepts in Wind Turbine Engineering: ASME. ASME Press. doi: 10.1115/1.802601
Spring, M. J. J. (2020). “Global expansion of offshore wind power depends on overcoming significant challenges facing floating wind turbines,” in Offshore Technology Conference. Houston, TX: Offshore Technology Conference. doi: 10.4043/30524-MS
Stetco, A., Dinmohammadi, F., Zhao, X., Robu, V., Flynn, D., Barnes, M., et al. (2019). Machine learning methods for wind turbine condition monitoring: a review. Renew. Energy 133, 620–635. doi: 10.1016/j.renene.2018.10.047
Stewart, G., and Muskulus, M. J. E. P. (2016). A review and comparison of floating offshore wind turbine model experiments. Energy Proc. 94, 227–231. doi: 10.1016/j.egypro.2016.09.228
Thiagarajan, K., Dagher, H. J. J. O. O. M., and Engineering, A. (2014). A review of floating platform concepts for offshore wind energy generation. J. Offshore Mech. Arct. Eng. 136:020903. doi: 10.1115/1.4026607
Tomey-Bozo, N., Murphy, J., Lewis, T., and Thomas, G. (2015). “A review and comparison of offshore floating concepts with combined wind-wave energy,” in Proc 11th Eur Wave Tidal Energy Conf (Nantes).
Van Otterlo, M., and Wiering, M. (2012). “Reinforcement learning and markov decision processes,” in Reinforcement Learning, eds M. Wiering and M. van Otterlo (Berlin; Heidelberg: Springer), 3–42.
Wan, L., Gao, Z., Moan, T., and Lugni, C. J. R. E. (2016). Experimental and numerical comparisons of hydrodynamic responses for a combined wind and wave energy converter concept under operational conditions. Renew. Energy 93, 87–100. doi: 10.1016/j.renene.2016.01.087
Wan, L., Gao, Z., and Moan, T. J. C. E. (2015). Experimental and numerical study of hydrodynamic responses of a combined wind and wave energy converter concept in survival modes. Coastal Eng. 104, 151–169. doi: 10.1016/j.coastaleng.2015.07.001
Watkins, C. J., and Dayan, P. J. M. L. (1992). Q-learning. Mach. Learn. 8, 279–292. doi: 10.1007/BF00992698
Wayman, E. N., Sclavounos, P., Butterfield, S., Jonkman, J., and Musial, W. (2006). Coupled Dynamic Modeling of Floating Wind Turbine Systems. Golden, CO: National Renewable Energy Lab (NREL).
Wu, X., Hu, Y., Li, Y., Yang, J., Duan, L., Wang, T., et al. (2019). Foundations of offshore wind turbines: a review. Renew. Sustain. Energy Rev. 104, 379–393. doi: 10.1016/j.rser.2019.01.012
Zhang, Y., Hu, Z., Ng, C., Jia, C., and Jiang, Z. J. M. S. (2020). Dynamic responses analysis of a 5 MW spar-type floating wind turbine under accidental ship-impact scenario. Marine Struct. 75:102885. doi: 10.1016/j.marstruc.2020.102885
Appendix
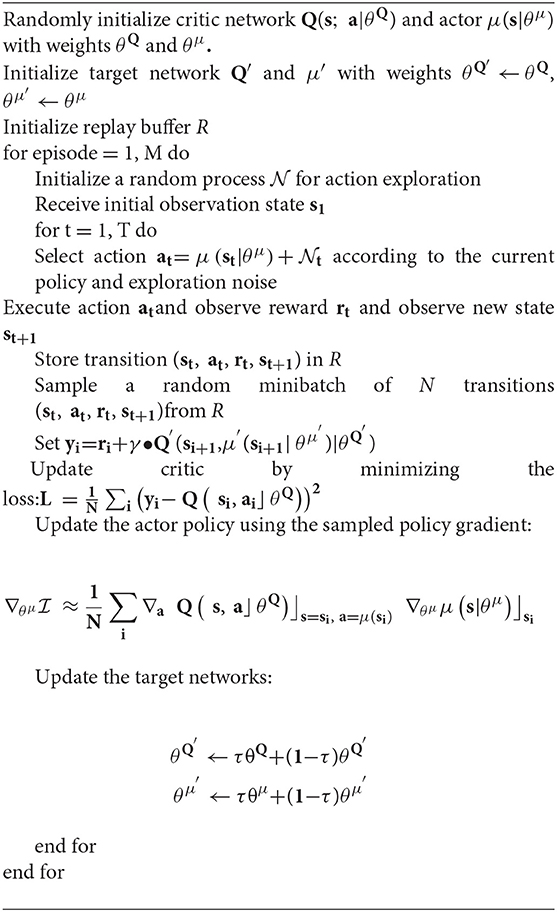
Algorithm 1. The algorithm of DDPG.
Keywords: floating offshore wind turbines (FOWT), artifical intelligence (AI), reinforcement learning (RL), software in the loop (SIL) simulation, DARwind, basin experiment, machine learning
Citation: Chen P, Chen J and Hu Z (2021) Software-in-the-Loop Combined Reinforcement Learning Method for Dynamic Response Analysis of FOWTs. Front. Mar. Sci. 7:628225. doi: 10.3389/fmars.2020.628225
Received: 11 November 2020; Accepted: 24 December 2020;
Published: 28 January 2021.
Edited by:
Dezhi Ning, Dalian University of Technology, ChinaReviewed by:
Liang Li, University of Strathclyde, United KingdomZi Lin, Northumbria University, United Kingdom
Copyright © 2021 Chen, Chen and Hu. This is an open-access article distributed under the terms of the Creative Commons Attribution License (CC BY). The use, distribution or reproduction in other forums is permitted, provided the original author(s) and the copyright owner(s) are credited and that the original publication in this journal is cited, in accordance with accepted academic practice. No use, distribution or reproduction is permitted which does not comply with these terms.
*Correspondence: Peng Chen, cC5jaGVuOEBuZXdjYXN0bGUuYWMudWs=