Genetic Structure of the Goniopora lobata and G. djiboutiensis Species Complex Is Better Explained by Oceanography Than by Morphological Characteristics
 Nina Yasuda
 Yuko F. Kitano
 Hiroki Taninaka3
  Satoshi Nagai
- 1Department of Marine Biology and Environmental Science, Faculty of Agriculture, University of Miyazaki, Miyazaki, Japan
- 2Biodiversity Division, National Institute for Environmental Studies, Tsukuba, Japan
- 3Interdisciplinary Graduate School of Agriculture and Engineering, University of Miyazaki, Miyazaki, Japan
- 4Fisheries Resources Institute, Japan Fisheries Research and Education Agency, Yokohama, Japan
- 5Kuroshio Biological Research Foundation, Kochi, Japan
- 6Fisheries Technology Institute, Japan Fisheries Research and Education Agency, Ishigaki, Japan
Species delimitation of closely related corals is often challenging due to high intraspecies morphological variation and phenotypic plasticity with a lack of characteristic features and scarcity of relevant molecular markers. Goniopora spp. are one such coralline group, and the species status of Goniopora lobata and Goniopora djiboutiensis, an Indian and Pacific Ocean hermatypic coral species complex, has been questioned on the basis of previous molecular and morphological analyses. To further examine the species boundaries between G. lobata and G. djiboutiensis in Japan, specimens collected from areas spanning from Ryukyu Island to temperate Japanese regions were morphologically identified based on traditional morphological descriptions. Then, the genetic structure of the G. lobata and G. djiboutiensis species complex was examined using six newly developed microsatellite markers. The majority of the collected specimens had intermediate morphologies, and a STRUCTURE analysis using the LOCPRIOR model based on typical G. lobata and G. djiboutiensis morphology indicated that there were no genetic differences between these morphologies. On the other hand, STRUCTURE analysis based on oceanographic regions revealed that there was a genetic break between the temperate and subtropical regions. This weak genetic break corresponded with the Kuroshio-associated barrier, which prevents larval transport between subtropical and temperate regions. This study confirms that the current morphological identification criteria for G. lobata and G. djiboutiensis do not match the existing genetic boundaries and thus the two should be regarded as a species complex. This study also highlighted the robustness of using a multi-locus population genetic approach, including a geographic context, to confirm the species boundaries of closely related species.
Introduction
Species are the fundamental units of biodiversity and are worth consideration in the conservation of ecosystems. However, the delimitation of some closely related taxa, including corals, is often challenging due to the fact that coral skeletons exhibit high phenotypic plasticity under different environmental conditions. The paucity of effective molecular tools for coral identification, together with frequent hybridization and possible reticulate evolution, has long hindered the classification of many reef-building corals (Todd, 2008). The delimitation of coral species is essential for conservation because one-third of all coral species are now facing the threat of extinction globally (Carpenter et al., 2008). In Japan, corals in subtropical areas have experienced mass bleaching because of elevated water temperatures, whereas some corals have reportedly migrated to and expanded in temperate areas (Yamano et al., 2011). Therefore, studies on the genetic connectivity between subtropical and temperate areas of coral species are important to understand such phenomena. However, no study has investigated the genetic connectivity of coral species between subtropical and temperate areas, except for Acropora (Nakabayashi et al., 2019). Moreover, no study has focused on other coral species, possibly because the identification of coral species in the field is challenging.
Corals belonging to the genus Goniopora are widely distributed across the Indian and Pacific Oceans, including subtropical and temperate areas in Japan, and have few skeletal characteristics in addition to highly variable skeletal and polyp morphologies. There are 15 nominal species in the genus Goniopora found in Japan (Nishihira and Veron, 1995). Veron (1993) reported that one of the relatively common species, Goniopora lobata, is distributed in both subtropical and temperate areas (up to Tatayama) and is very difficult to identify accurately, especially in temperate areas where skeletal variations are primarily correlated with non-reef environments. Kitano et al. (2013) reported the existence of many intermediate morphologies between closely related G. lobata and G. djiboutiensis species in Japan. G. djiboutiensis is less common than G. lobata, and its distribution overlaps with that of G. lobata, especially in subtropical areas (Veron, 1993; Nishihira and Veron, 1995). The first comprehensive genetic approach to delineate the species covering this whole genus was conducted in the Red Sea (Terraneo et al., 2016). The authors of the aforementioned study found discordance among genetic, morphological, and micromorphological data related to G. lobata and G. djiboutiensis, wherein G. lobata and G. djiboutiensis shared common alleles and thus could not be delineated using genetic markers including a mitochondrial region, the internal transcribed spacer (ITS) region, and the calmodulin (CalM) and ATPaseβ genes (ATPsβ). Based on this molecular and morphological evidence, the aforementioned authors questioned the species status of G. lobata and G. djiboutiensis, although the study was ultimately inconclusive.
Although species delimitation analysis is often attempted via a phylogenetic approach, population genetic approaches considering the geographic contexts of processes driving population divergence and speciation have proven to be more effective in identification of species boundaries in some phylogenetically complex groups (Medrano et al., 2014; Nakabayashi et al., 2019). Thus, further genetic studies using a multi-locus population genetic approach may help to confirm the species boundary between G. lobata and G. djiboutiensis. In this study, G. lobata-like and G. djiboutiensis-like specimens were collected from a wide range of coral habitats in Japan, including different oceanographic regions (subtropical and temperate regions) separated by an ocean current system. Six novel polymorphic microsatellite markers for Goniopora spp. were developed to analyze the genetic structures of the G. lobata and G. djiboutiensis species complex. Then, the specimens were comprehensively studied based on traditional morphological descriptions, ITS sequences, and microsatellites to reveal the species boundaries between G. lobata and G. djiboutiensis.
Materials and Methods
Sample Collection
Owing to the fact that species identification of living colonies is difficult in the field, G. lobata- and G. djiboutiensis-like samples were collected from 15 areas spanning from Ryukyu Island to temperate regions of Japan (Table 1 and Figure 1). Samples (100–500 cm3) were collected using a hammer and chisel. A small portion of each coral sample (<1 cm3) was preserved in CHAOS solution (Fukami et al., 2004) to dissolve proteins for DNA analyses, and the remnants of the samples were bleached for morphological analyses. Total genomic DNA was extracted from colonies of the samples using the method outlined by Fukami et al. (2004). The skeletal specimens are retained either in University of Miyazaki (MUFS) or in Seto Marine Biological Laboratory (SMBL).
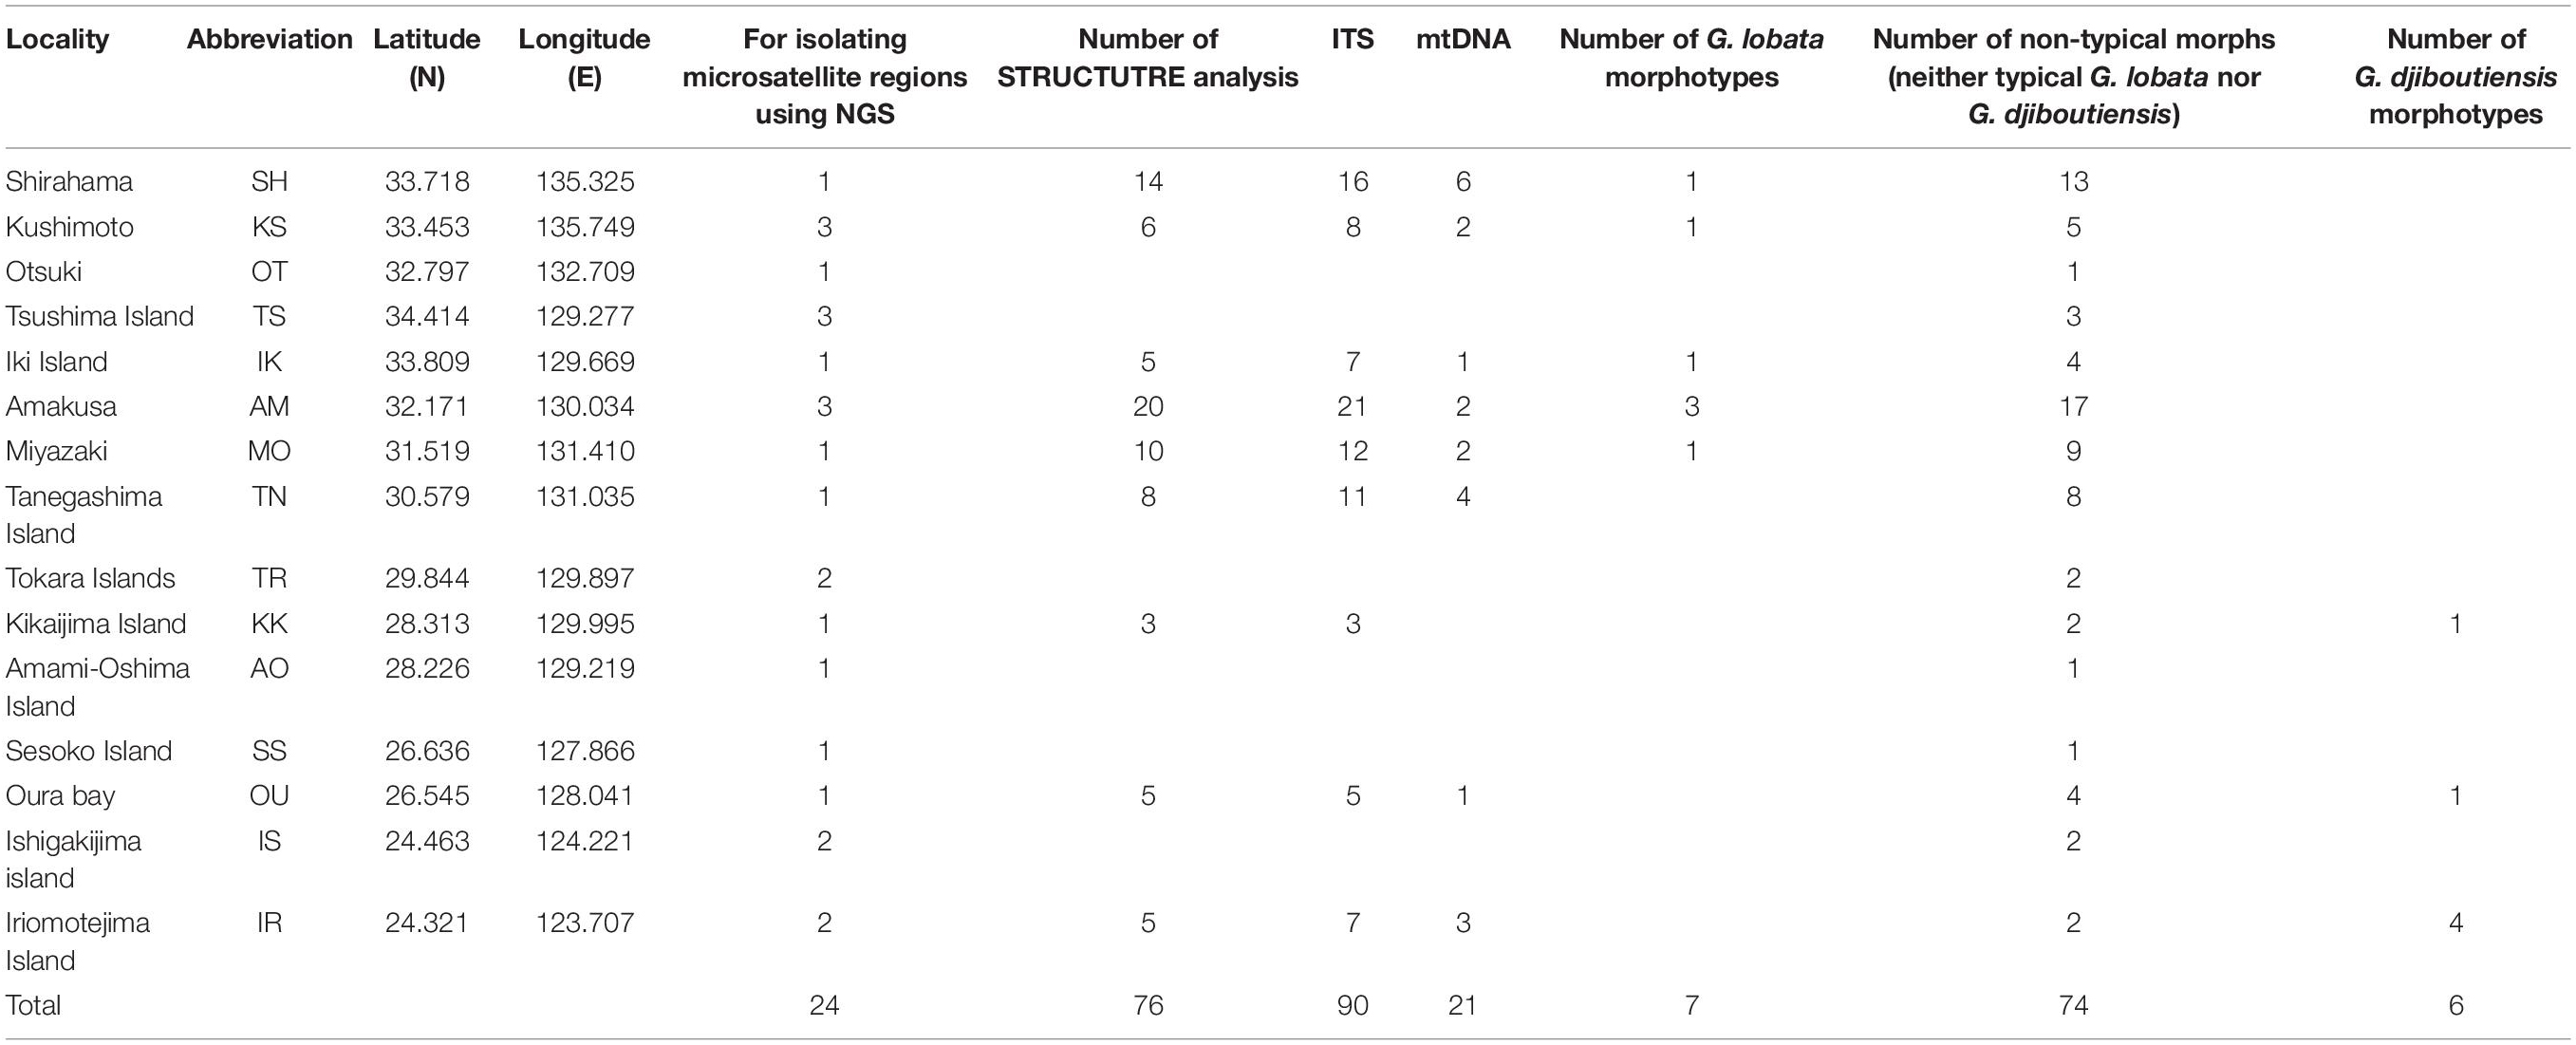
Table 1. The list of G. lobata-like and G. djiboutiensis-like samples used in this study.
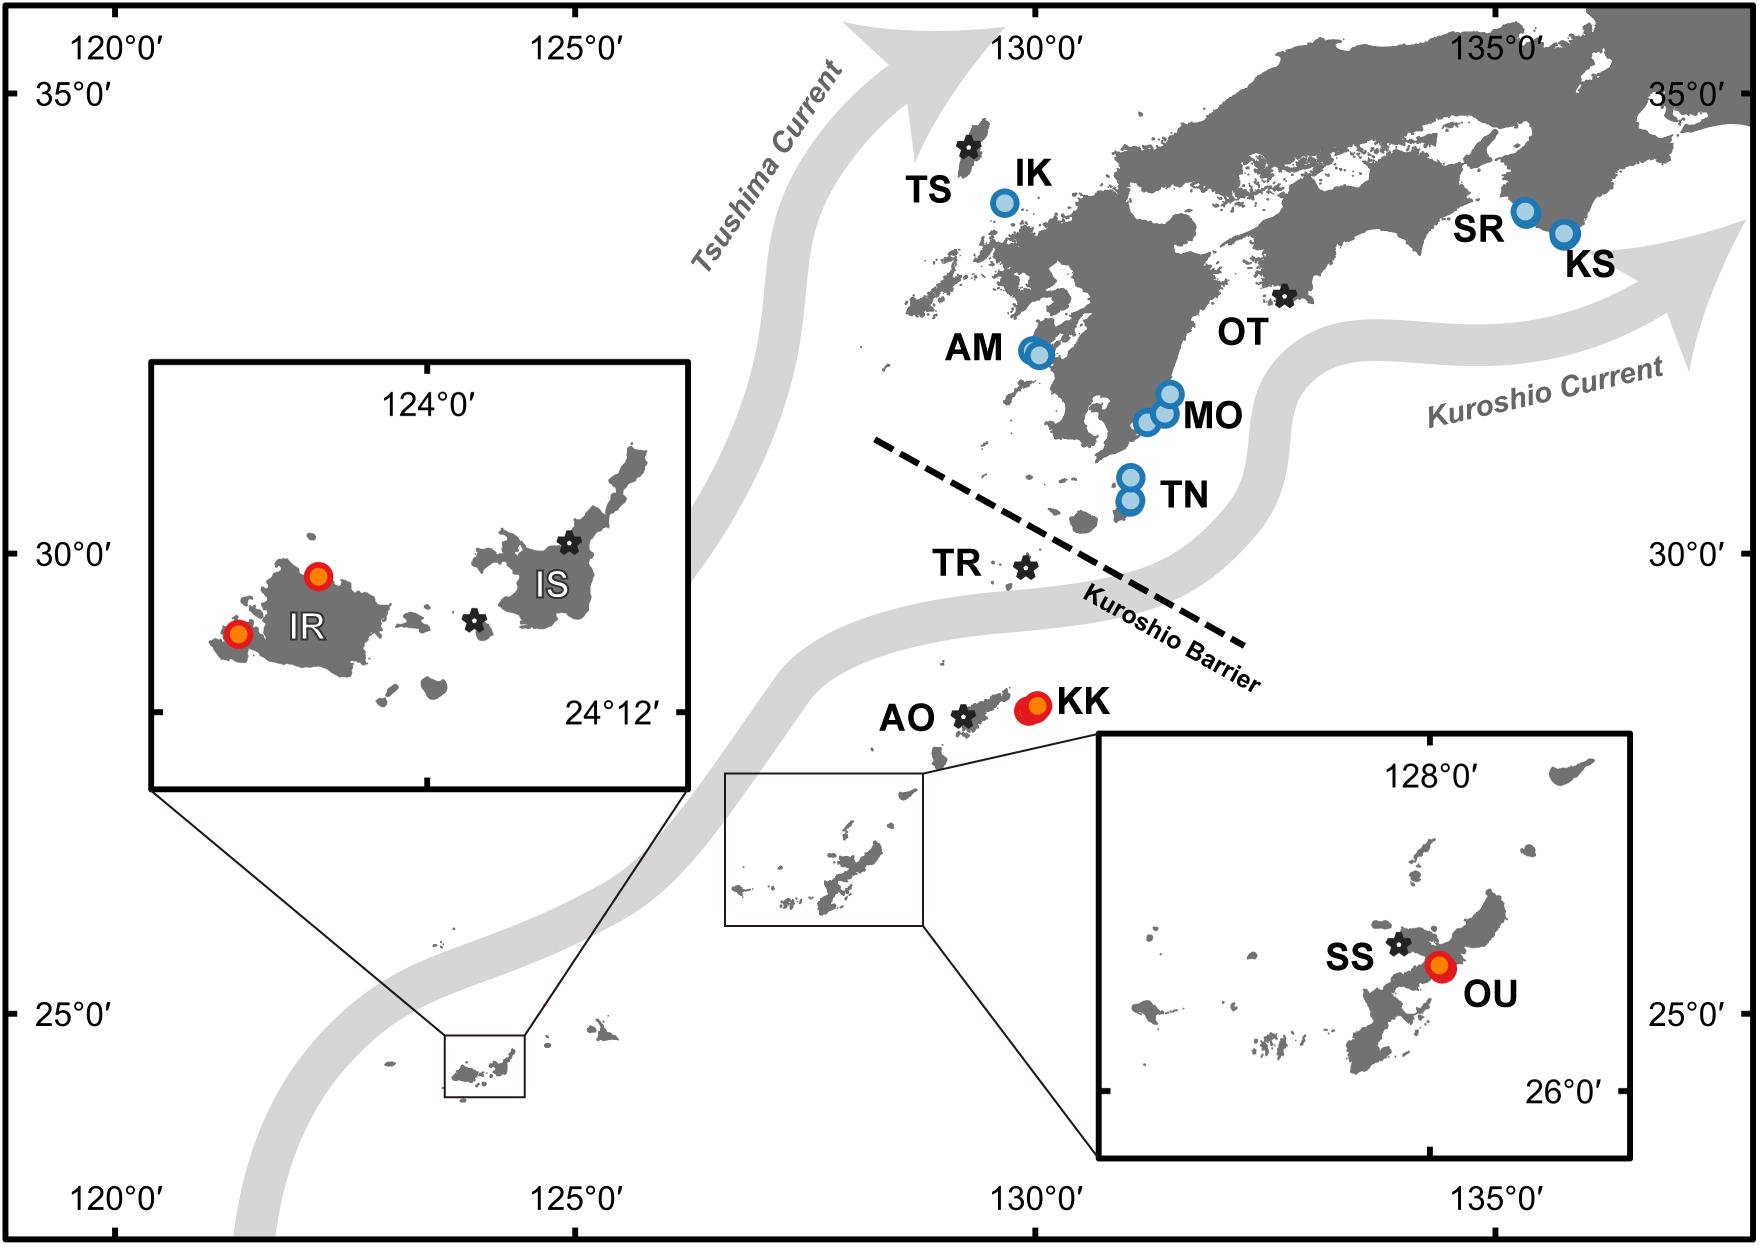
Figure 1. Map of sampling locations. Stars indicate sampling sites collected for development of microsatellite markers, and circles indicate samples used for genotyping analysis. Blue indicates temperate populations, and orange indicates subtropical populations. The Kuroshio Barrier (Nakabayashi et al., 2019) is shown as a dashed line. The corresponding site names for the abbreviations in the map can be found in Table 1.
Morphological Identification
Morphological identification was based on original species descriptions and related literature (Milne-Edwards and Haime, 1851; Bedot, 1907; Vaughan, 1907; Veron and Pichon, 1982; Terraneo et al., 2016). Each five mature corallites per colony were measured to determine the range of calice diameter using a vernier caliper. Seven skeletal characteristics were also examined (calice depth, width of calice wall, morphology of columella, columella divided to six parts or not, tips of columellar threads, existence of pali or paliform lobes, and septa under binocular stereomicroscope to classify the species. If specimens had morphological characteristics typical of both G. lobata and G. djiboutiensis in different categories, they were classified as “intermediate.”
ITS Analysis
In order to compare the microsatellite results of the present study with those obtained in previous studies, the ITS region (including partial 18S, ITS-1, 5.8S, ITS-2, and partial 28S) was sequenced and compared with the sequences reported by Terraneo et al. (2016). Polymerase chain reaction (PCR) and sequencing conditions were exactly the same as in protocol (Kitano et al., 2013). Previously published sequences (G. lobata and G. djiboutiensis in the Red Sea; Supplementary Table 2) were also included in the following analysis to identify the conformity of the resultant genetic clades with those reported by Terraneo et al. (2016). The ITS sequences with a maximum length of 926 bp were aligned using MAFFT online (Katoh et al., 2017), and all gap regions were trimmed using the “-nogaps” option in trimAl v. 1.4 (Capella-Gutiérrez et al., 2009), which removes all gap sites in the alignment, resulting in 899 bp in length for analysis. To identify the genetic clades defined by Terraneo et al. (2016), a phylogenetic tree was constructed using two different algorithms: maximum likelihood (ML) using IQ-TREE2 v.2.0.6 (Minh et al., 2020) and Neighbor-Joining (NJ) using MEGA X (Kumar et al., 2018). In total, 135 sequences across 11 Goniopora spp. were used for the analysis, including 44 reference sequences reported by Terraneo et al. (2016).
For the ML tree, the best-fitting nucleotide substitution model (K2P + R2) was estimated based on the Bayesian information criterion (BIC), using the “-m MFP” option, which performs extended model selection followed by tree inference. Confidence values for the trees were inferred using the ultrafast bootstrap method (Hoang et al., 2018) with 1,000 replicates. For the NJ tree, the Kimura two-parameter (Kimura, 1980) model with a gamma distribution was selected by a model test implemented in MEGA X, with bootstrap values calculated from 1,000 replicates. Unrooted phylogeny was reconstructed using FigTree v.1.4.41. Confidence values for the trees were inferred using 1,000 bootstrap replicates.
Microsatellite Marker Development Using High-Throughput Sequencing
The total genomic DNA for microsatellite marker isolation was obtained from the samples listed in Table 1. The 24 genomic DNA isolates from CHAOS solution samples were mixed and were further purified using the DNeasy Blood and Tissue kits (Qiagen, Hilden, Germany) according to the manufacturer’s instructions. The purified genomic DNA was fragmented into c.a. 300–800 bp, and the adapter sequences were ligated to each end of the fragments. The resulting DNA library was subjected to shotgun sequencing on GS FLX Titanium picotiter plates using the Roche GS FLX 454 system. A total of 603,951 sequences were obtained with a total of 306 Mb. These sequencing reads were assembled using Newbler Assembler software ver. 2.6 (Roche Applied Sciences, Indianapolis, IN, United States) with default settings. Subsequent contigs and singletons were screened using a Perl pipeline coupled with Tandem Repeats Finder ver. 4.0.4 (Benson, 1999) and PRIMER 3 ver. 2.2.2 beta (Rozen and Skaletsky, 2000), which were eventually used to design primers for the potential microsatellite loci (Nakamura et al., 2013). A total of 1,136 pairs of primers with di-, tri-, and tetra-nucleotide motif loci were designed, from which 240 primer sets were selected for initial amplification trials. After removing the primers that did not amplify correctly (multiple bands or no amplification), coral microsatellite markers were further discriminated from those of their symbiont algae (family: Symbiodiniaceae) using the same primers. Owing to the fact that Goniopora spp. is known to host Symbiodiniaceae species of Cladocopium goreaui (formerly clade C type C1) in Taiwan (Chen et al., 2005) and Hong Kong (Wong et al., 2016) and Durusdinium trenchii (formerly clade D type D1–4) in Indian Ocean (LaJeunesse et al., 2010), the following four Symbiodiniaceae culture strains were tested: AJIS2-C2 (reported by Yamashita and Koike, 2013, Symbiodinium microadriaticum former clade A type A1), CCMP2466 (C. goreaui), CCMP2556 (D. trenchii), and AJIS5-A10 (D. trenchii, previously isolated by one of the authors H. Yamashita). The culture strains CCMP2466 and CCMP2556 were purchased from the Provasoli–Guillard National Center for Culture of Marine Algae and Microbiota (ME, United States). As a result, total 39 primer pairs of potential microsatellite markers including trinucleotide motif loci for Goniopora spp. were selected. To examine the effectiveness of PCR amplification of the 39 fluorescent-labeled primer pairs that were successfully identified as Goniopora microsatellite regions, we performed PCR in a thermal cycler (PC-808, ASTEC) in a reaction mixture (10 μL) containing 1 μL (ca. 10 ng) template DNA, 5 μL of 2× Go Taq Colorless Master mix (Promega Corporation, United States, containing Taq DNA polymerase, dNTPs, MgCl2, and reaction buffers at optimal concentrations), 0.35 μM of each designed primer pair, with one fluorescently labeled primer, and 3.76 μL of ultra-pure quality water. The PCR cycling conditions were as follows: 2 min at 95°C, 30 cycles at 95°C for 30 s, 50°C–55°C (primer-specific annealing temperature, Table 3) for 30 s, 72°C for 30 s, and a final elongation at 72°C for 5 min.
Genetic Structure of the G. lobata and G. djiboutiensis Species Complex
To examine the species boundaries and spatial genetic structure of the G. lobata and G. djiboutiensis complex, 76 samples were genotyped (Table 1 and Figure 1). One microliter of the 80-times diluted PCR product was added to 10 μL Hi-Di formamide containing 0.15 μL GeneScan 600 LIZ size standard (Applied Biosystems), followed by denaturation at 95°C for 3 min. The samples were run on an ABI 3130 xl genetic analyzer (Applied Biosystems) and were analyzed using GeneMapper ver. 5.0 software (Applied Biosystems). Using Amakusa, Shirahama, and Miyazaki samples from which more than 10 samples could be collected (Table 1), the observed and expected heterozygosity and the Hardy–Weinberg equilibrium (HWE) were calculated using GenAlEx ver. 6.5 (Peakall and Smouse, 2012). Linkage disequilibria between the loci were tested in Genepop ver.4.0 (Raymond and Rousset, 1995) with 5,000 dememorizations, 500 batches, and 5,000 iterations per batch. Micro-Checker version 2.2.3 (Van Oosterhout, 2004) was used to check the presence of scoring error due to stuttering, large allele dropout, and null alleles for each locus.
A total of 10 independent runs of Structure ver. 2.3.4 (Pritchard et al., 2000) were calculated assuming K = 1–6 with 500,000 Markov chain Monte Carlo (MCMC) iterations after a 500,000 burn-in using admixture and an allele frequency correlated model to examine genetic structure. To examine the genetic structure assuming different hypotheses, three different priors were used as follows: (1) no prior, (2) morphological prior (two categories: typical G. lobata-morph and typical G. djiboutiensis-morph) using LOCPRIOR (Hubisz et al., 2009), and (3) oceanographic regions prior (two categories: temperate and subtropical regions). While it was assumed that the largest mean LnP(K) with a biologically meaningful low number of K was the optimal number of clusters [as suggested by Pritchard et al., 2000], delta K (Evanno et al., 2005) was also estimated using STRUCTURE HARVESTER (Earl and von Holdt, 2012). Then, CLUMPAK (Kopelman et al., 2015) was used to visualize the STRUCTURE results.
Additionally, the population-based genetic structure was visualized by principal coordinate analysis (PCoA) using GenAlEx ver. 6.5 (Peakall and Smouse, 2012). Furthermore, Arlequin ver. 3.5 (Excoffier and Lischer, 2010) was used to examine the genetic structure (FCT) between temperate (Ooura and Iriomote) and subtropical (the others) regions and the calculated global FST. With regard to these population-based analyses, the Kikai population was excluded due to an extremely small (n = 3) sample size.
Results
As mentioned by Kitano et al. (2013), most of the collected samples (64 out of 76) had intermediate morphologies, thereby indicating that it was impossible to distinguish between the two species groups using the current morphological criteria (Figure 2 and Supplementary Table 1). None of the eight morphological features previously used were effectively able to discriminate between G. lobata and G. djiboutiensis (Supplementary Table 1).
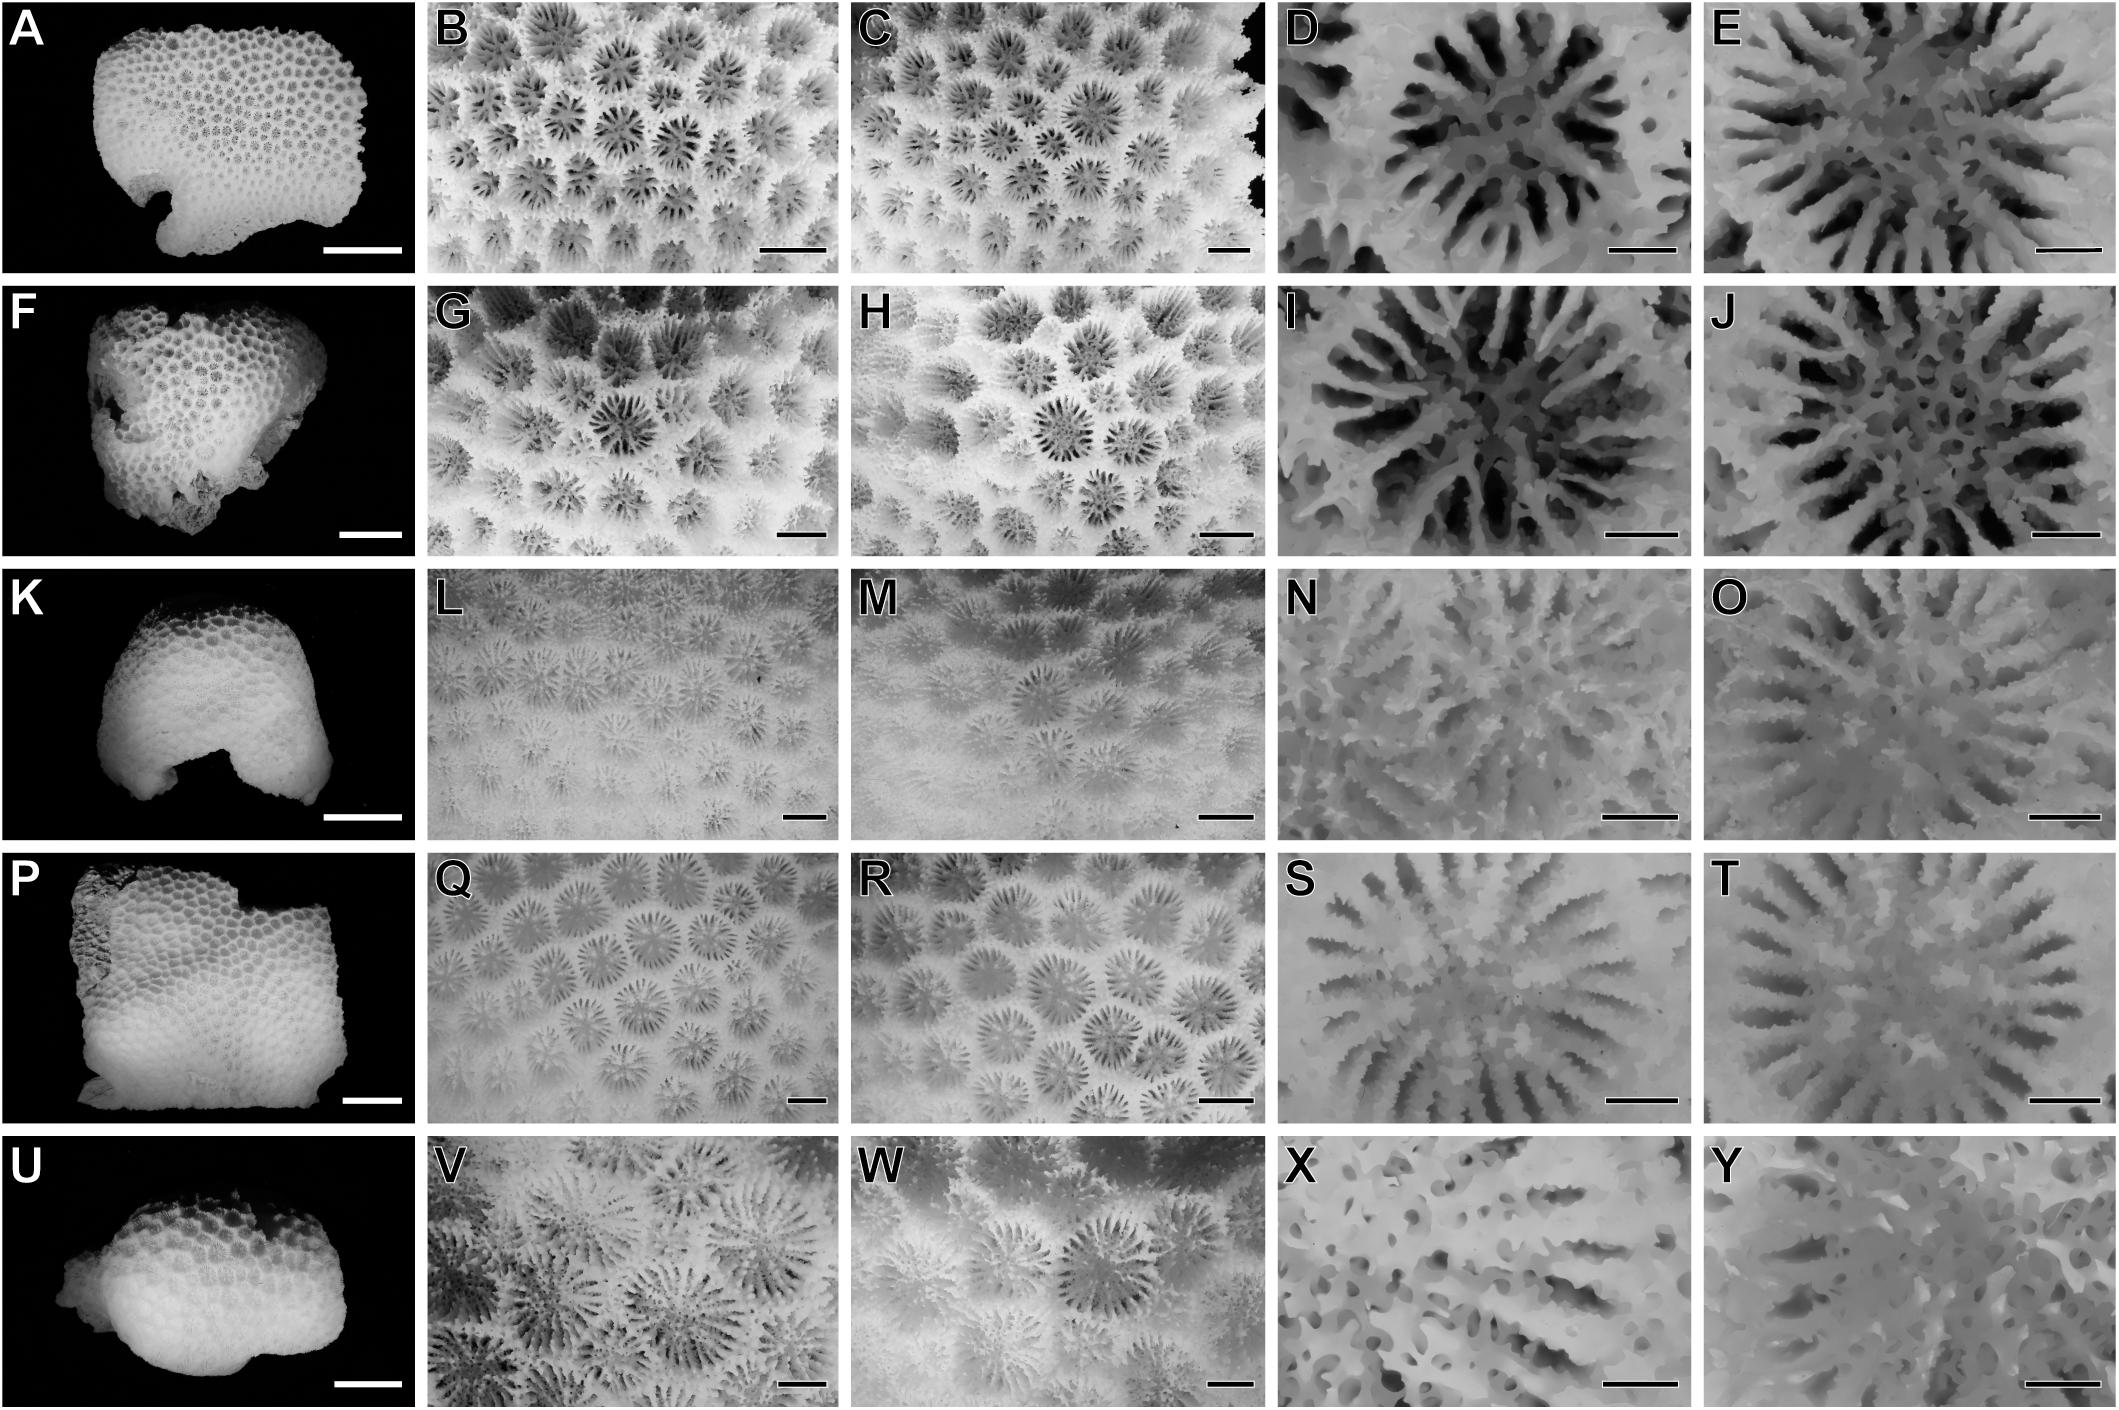
Figure 2. Morphological variations in the Goniopora lobata complex. (A–E) Goniopora lobata (KS53), (F–T) Three different “intermediate” types of the two morphological species (F–J): TN79, (K–O): AM26, (P–T): KK16, (U–Y): Goniopora djiboutiensis (IR68). Corallum of each sample [(A,F,K,P,U), scale bar = 20 mm], major examples of calices in the corallum [(B,C,G,H,L,M,Q,R,V,W), for (A,F,K,P,U), respectively, scale bar = 3 mm], close-up photography of calices [(D,E,I,J,N,M,S,T,X,Y), scale bar = 1 mm].
The ML and NJ trees using the ITS region were consistent; therefore, only the ML tree has been shown in Figure 3 (raw data available in Supplementary Data 1). The reconstructed ITS tree suggested that all the samples used in this study belonged to clade II in Terraneo et al. (2016), which was previously found to be a G. lobata and G. djiboutiensis complex clade (Figure 3). Consistent with the findings reported by Terraneo et al. (2016), there was no subclade corresponding to geographic areas or specific morphological features within clade II.
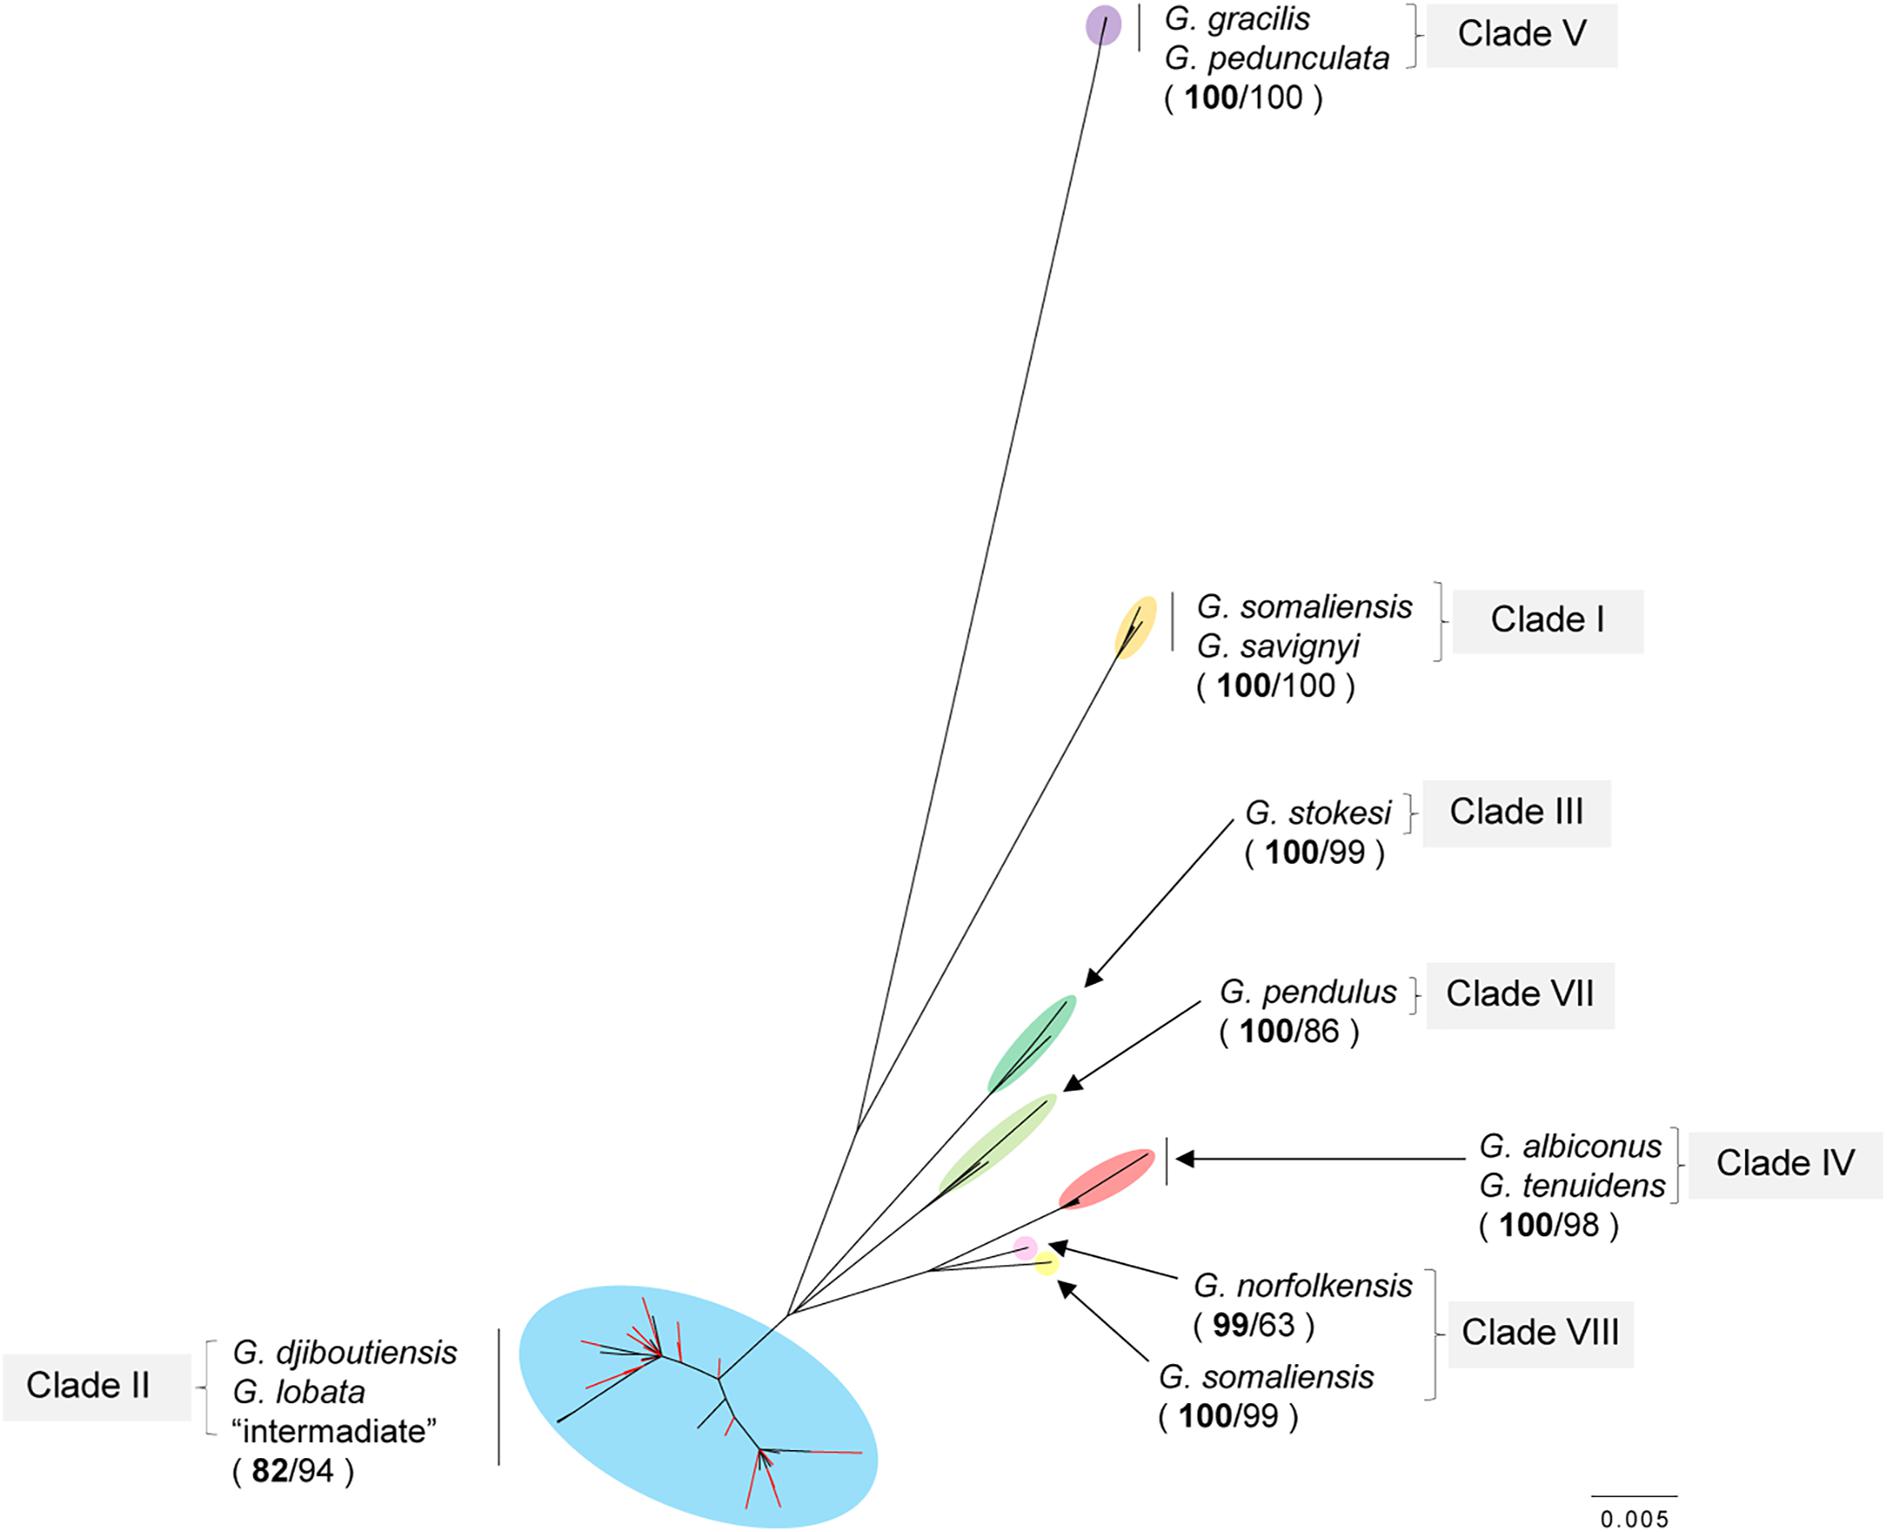
Figure 3. Unrooted Maximum likelihood phylogenetic tree using internal transcribed spacer (ITS) regions including 44 reference sequences (Goniopora somaliensis, G. savignyi, G. djiboutiensis, G. lobata, G. stokesi, G. albiconus, G. tenuides, G. pedunculata (G. minor in Terraneo et al., 2016), G. gracilis, G. pendulus, and G. norfolkensisis) taken from Terraneo et al. (2016). Clade names also correspond with those reported by Terraneo et al. (2016). Nodes in red colors represent the Japanese samples used in the present study. The values on each node represent bootstrap values for the ML and NJ methods. Bootstrap values from the ML method are shown in boldface. Scale bar shows 0.005 substitutions par site.
After PCR testing, six primer pairs of Goniopora spp. that could amplify microsatellite regions were identified, including the tri-nucleotide motif (Table 2). No significant linkage disequilibriums were detected among the loci after Bonferroni correction (α > 0.05). Only the G329 locus in the Miyazaki population was found to be significantly deviated from the HWE locus (P = 0.001, Table 3). Additionally, Micro-Checker analysis detected that the G329 locus might include null alleles. Although analysis was completed with and without G329 and it was confirmed that there was no discrepancy in the results, only the results excluding G329 have been presented this paper. All the used genotyping data is available in Supplementary Table 2.
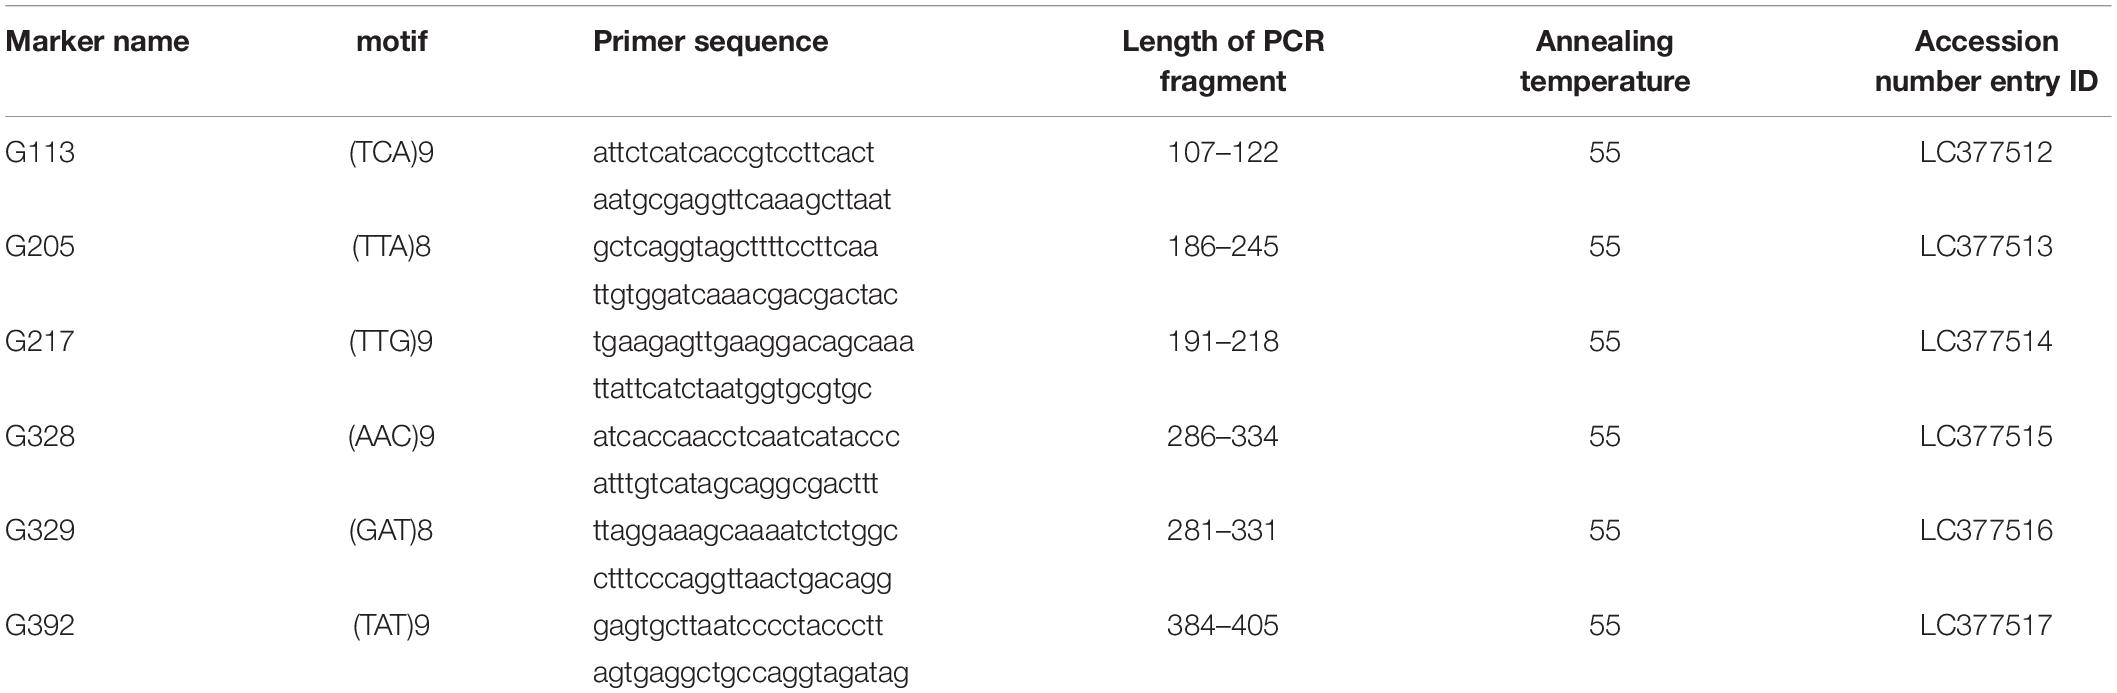
Table 2. Microsatellite markers of Goniopora spp. developed in this study.
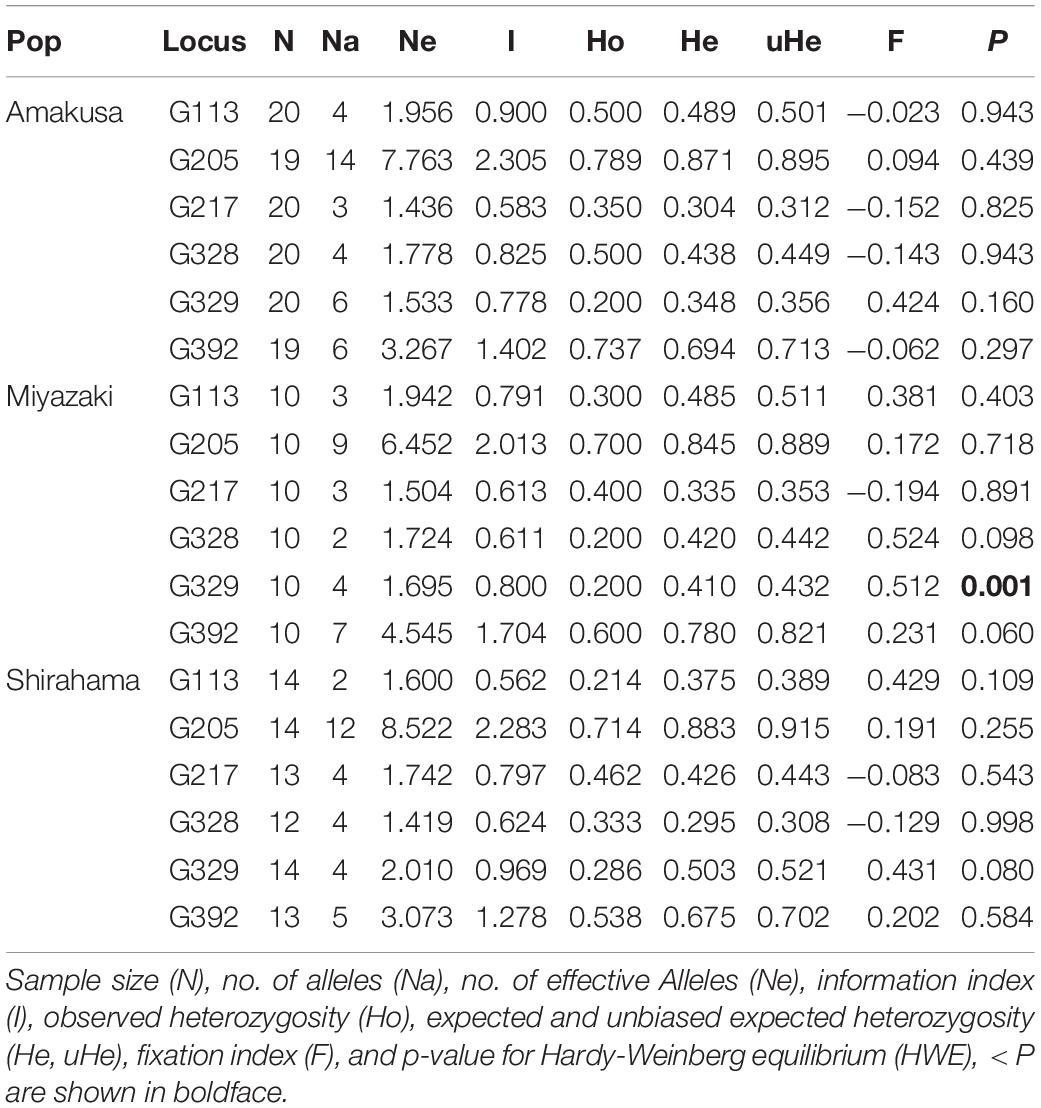
Table 3. Summary for the basic population genetic parameters using microsatellite loci.
STRUCTURE analysis with a uniform prior showed admixed patterns, and the maximum mean LnP(K) was observed at K = 1, thereby indicating that only one cluster was estimated (Figure 4 and Supplementary Table 3). A similar result was obtained using a morphological prior, and while K = 2 was selected as the optimal number of clusters based on the largest Mean LnP(K) value, no genetic structuring between the typical G. djiboutiensis-morph and G. lobata-morph was found (Figure 4). On the other hand, STRUCTURE analysis using oceanographic regions suggested that K = 2 was the best model based on Mean LnP(K) as well as delta K estimation (Supplementary Table 3), and a clear genetic break between subtropical and temperate regions was detected with a low mean r value (0.365), thereby indicating that the geographic prior was able to detect a genetic structure within the data (Figure 4 and Supplementary Table 4).
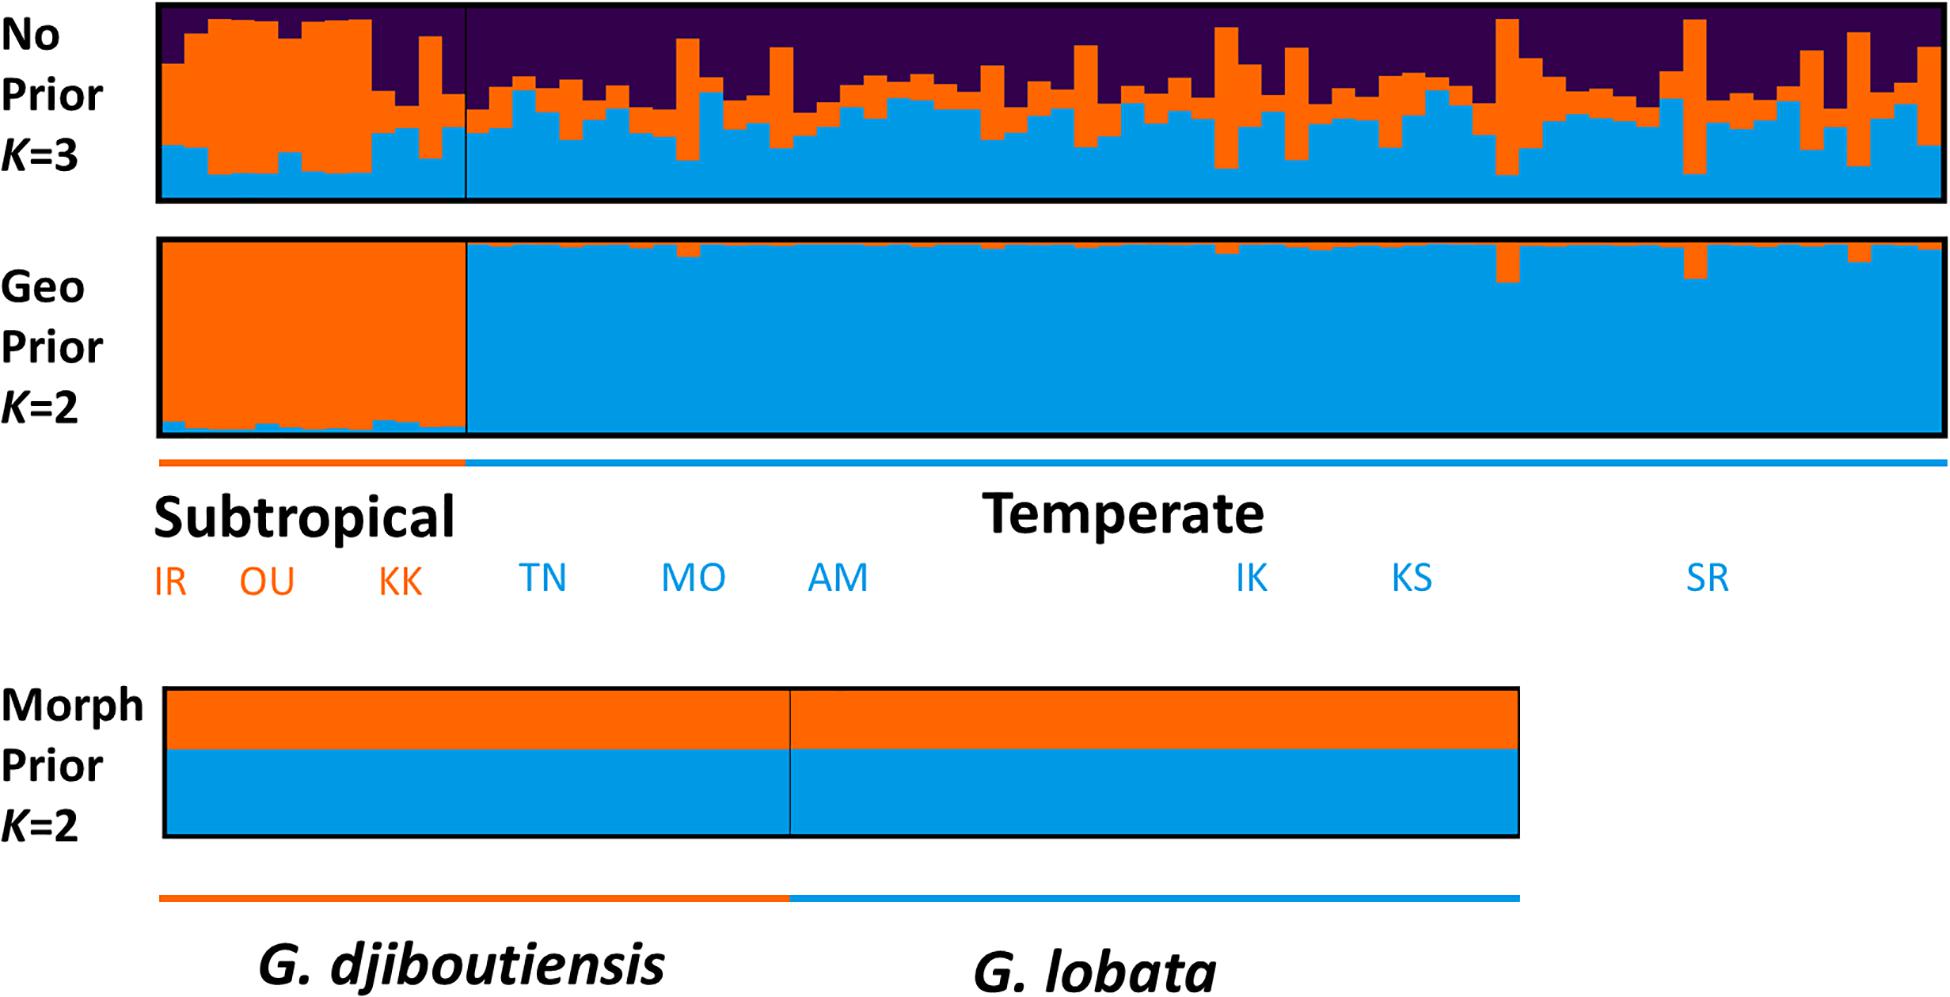
Figure 4. STRUCTURE bar-plot results using no prior (upper) at K = 3, geographic prior at K = 2 (middle), and morphological prior at K = 2 (lower). The x-axis indicates each individual, and the y-axis indicates the proportion of assigned clusters shown in different colors.
Principle coordinate analysis indicated that the subtropical populations (Oura and Iriomote) were separated from the six temperate populations by coordinate 1, which explained 65.12% of the variation in the data (Figure 5). A significant genetic structure was observed according to the global FST value (FST = 0.033, P = 0.027). Genetic structuring among predefined oceanographic groups (subtropical vs. temperate) was also significant (FCT = 0.095, P = 0.037).
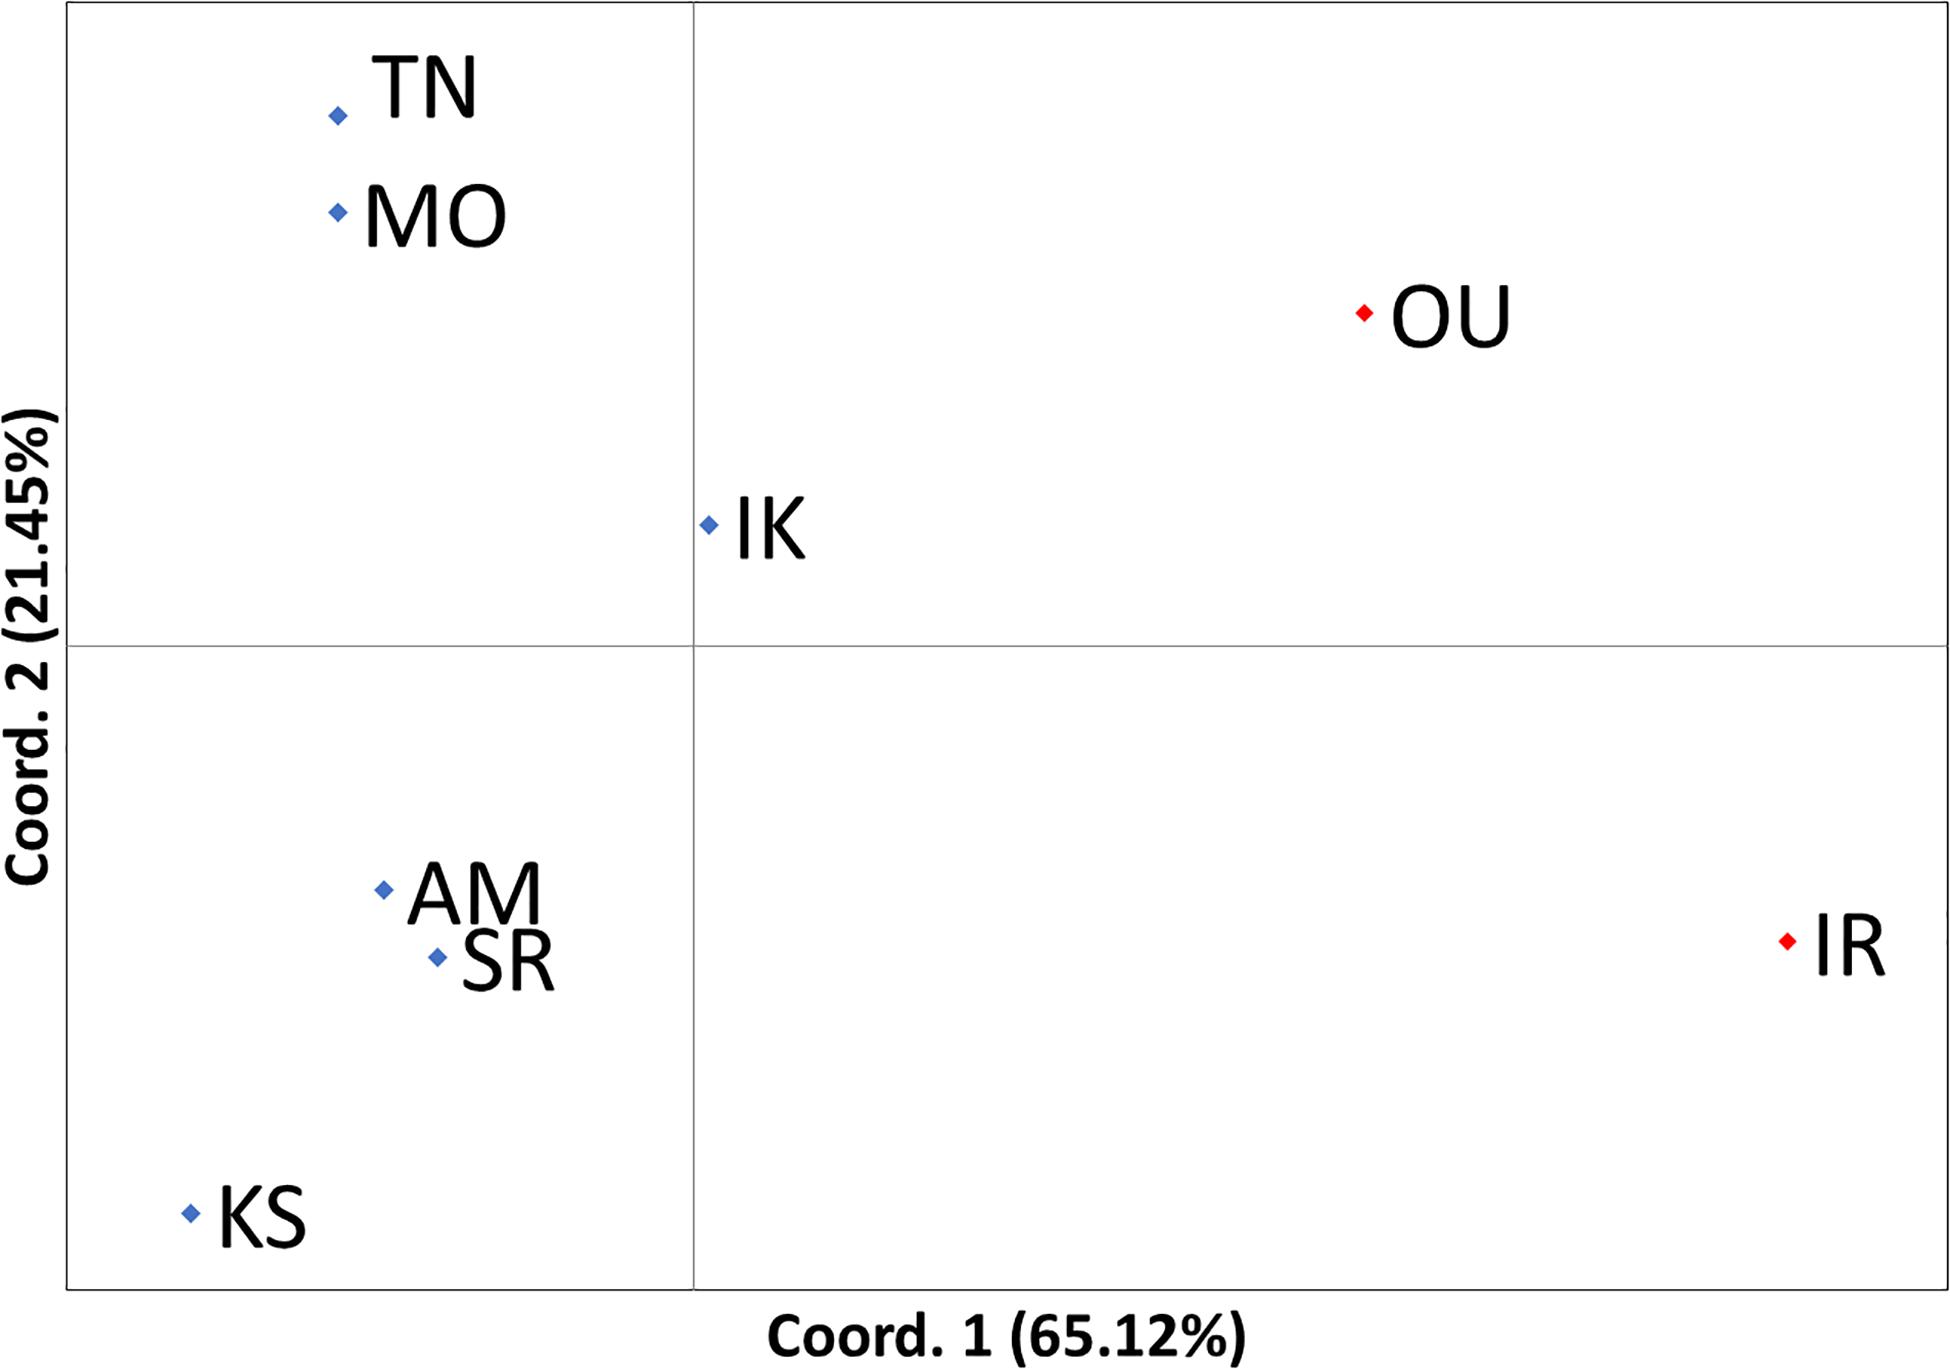
Figure 5. Population-based principal coordinate analysis. Coordinate 1 explained 65.12% of the variation in the data and coordinate 2 explained 21.45% of the variation. Blue rhomboids indicate temperate populations and red rhomboids indicate subtropical populations. The name of the sites corresponding to each abbreviation is found in Table 1.
Discussion
Microsatellite Markers as a Tool to Examine Species Boundaries
Recent advances in high-throughput sequencing technology have made microsatellite markers rather outdated. In general, a higher number of loci can resolve finer scale genetic structures (Jeffries et al., 2016). However, in some circumstances, using microsatellite markers can be advantageous compared to newly emerged genomic methods such as RAD-seq (Wagner et al., 2013). Hodel et al. (2016) reviewed and compared microsatellite markers with more recently developed genomic methods and concluded that microsatellite markers remained useful in terms of both effectiveness and cost-efficiency (Hodel et al., 2016).
Microsatellite markers are useful in many molecular ecological applications, including parentage analysis, conservation genetics, phylogeography, and population genetics (Hodel et al., 2016). Among the many molecular markers, microsatellite markers are more useful in detection of species boundaries between closely related coral species. Previous population genetic studies using microsatellite markers in corals with appropriate sampling design including geographical contexts have revealed underestimated species diversity even when phylogenetic trees cannot detect recent speciation owing to incomplete lineage sorting (Bongaerts et al., 2011; Nakajima et al., 2012; Yasuda et al., 2015).
Microsatellite analyses using sufficient sample sizes and including a geographic context enable us to detect species boundaries by accounting for incomplete lineage sorting and/or introgression (Nakajima et al., 2012; Nakabayashi et al., 2019). However, caution is required when planning the sampling design in terms of both the number of samples and the sampling strategy itself because individual-based Bayesian clustering methods, including STRUCTURE, are known to be sensitive to sampling design (Schwartz and McKelvey, 2008). In addition, because the molecular evolutionary patterns of microsatellite regions are not as well-known and the “phylo-” part of the analysis will be lost in population-based analysis, integrated approaches taking phylogenetics, morphology, and ecology into account are nonetheless important.
This study confirms the absence of species boundaries between G. lobata and G. djiboutiensis morphologies using microsatellite markers. Such a multi-locus population genetic approach, including a geographic context, would be also useful for delineating the species boundaries of other closely related species including corals.
Species Status of G. lobata and G. djiboutiensis
Although the concept of “species” is a fundamental unit for biodiversity conservation, the species delimitation of closely related coral species has been morphologically and genetically challenging due to high phenotypic plasticity and the paucity of suitable molecular markers. There are many proposed and widely used species concepts, including morphological species concepts that require morphological differentiation, the genealogical species concept that requires allelic coalescence (Baum and Donoghue, 1995), and the biological species concept that requires reproductive isolation (Mayr, 1942). However, whichever species concept is used, a species represents an independent metapopulation lineage through time (de Queiroz, 2005).
In this study, the species boundary between G. lobata and G. djiboutiensis was examined based on previously used morphological characteristics as well as newly developed microsatellite markers, including a geographic context for testing the hypothesis of “independent metapopulation lineages through time” for each species. The majority (84.2%) of the samples collected in Japan had intermediate forms, suggesting that the eight morphological characteristics used in the present study could not distinguish G. lobata from G. djiboutiensis. This fact corresponds with a previous study that reported an abundance of morphotypes in Goniopora spp. including G. lobata and G. djiboutiensis in the region (Kitano et al., 2013) and Veron (1993) who noted that G. lobata in Japan are “always difficult to identify with certainty in higher latitudes, where skeletal variations occur that are primarily correlated with non-reefal environments.” Additionally, microsatellite STRUCTURE analysis using either uniform prior or morphological prior indicated genetic homogeneity and could not detect any genetic boundaries between typical G. lobata and G. djiboutiensis morphologies, which was consistent with previous studies using other molecular markers (Kitano et al., 2013). Lastly, a genetic break (0.030 of allele frequency divergence between pops, FCT-like value estimated by STRUCTURE) was discovered using a geographic prior, which could be explained by the presence of population isolation caused by oceanographic conditions rather than by morphological characteristics. This suggests that the current morphological characteristics defining G. lobata and G. djiboutiensis do not represent independent metapopulation lineages over time. Goniopora lobata and G. djiboutiensis could not be morphologically and genetically delimited as species. It is likely that the high morphological diversity in the G. lobata species complex may lead to overestimation of morphological species. The present study underlines the usefulness of a population genetics approach including a geographic context in examining the boundaries between closely related species. Given that the nomenclature of Goniopora lobata Milne-Edwards and Haime, 1851, has been used more than that of Goniopora djiboutiensis Vaughan, 1907, it would be appropriate to use “G. lobata species complex” rather than “G. djiboutiensis species complex” to describe the samples in clade II.
The Kuroshio-Associated Oceanographic Barrier
Remarkably, a clear genetic break was discovered between subtropical and temperate regions, irrespective of morphological characteristics, suggesting that genetic exchange via larval dispersal was somewhat limited between subtropical and temperate regions in the G. lobata species complex. This genetic break corresponds not only to climatic regions (subtropical vs. temperate) but also to the Kuroshio-associated larval dispersal barrier reported by Nakabayashi et al. (2019). Thus, it is possible that this genetic barrier could be caused by oceanographic barriers and/or local adaptation owing to environmental factors, such as water temperature.
According to larval dispersal oceanographic simulations, larval transport between subtropical and temperate regions in Japan via the Kuroshio Current and its associated currents is limited to a few generations, and this phenomenon is referred to as the Kuroshio-associated barrier (Nakabayashi et al., 2019). Goniopora spp. are known to be gonochoric and are broadcast spawners (Richmond and Hunter, 1990) with at least 5 days of pelagic larval duration (Babcock and Heyward, 1986). Although the dispersal potential of the G. lobata species complex is not precisely known, considering the markedly lower population density of the G. lobata species complex than that of Acropora spp. especially in subtropical areas, the number of larvae that can cross the Kuroshio-associated barrier would be fewer than that of Acropora spp., which have similar genetic breaks.
Alternatively, it is possible that this genetic break is caused by environmental factors. Among the environmental factors that we summarized for each sampling region [the mean surface water temperature of the coldest month, yearly average of mean surface water temperature, chlorophyll-a concentration, and particulate inorganic carbon (PIC) concentration], (Yara et al., 2012; NASA, 2018) the range of chlorophyll-a and PIC concentration overlapped between temperate and subtropical regions (Supplementary Table 4). The ranges of water temperature between the two regions did not overlap, although the difference between the two regions was minor (Supplementary Table 4). In addition, the following gradual changes along latitude were observed: 20.82–22.87°C (coldest month average) and 24.63–26.17°C (year average) in the subtropical region and 14.23–19.57°C (coldest month) and 20.27–24.22°C (year average) in the temperate region (Yara et al., 2012; Supplementary Table 4). If there were no clear physical barrier between the temperate and subtropical regions, one would expect a gradual change in different genotypes along the Kuroshio Current. The clear genetic break between temperate and subtropical regions is, therefore, impossible to explain only by the differences in environmental factors (i.e., water temperature, PIC concentration, and chlorophyll-a concentration) alone, although we cannot deny the possibility that these differences in environmental factors further facilitate local adaptation and genetic divergence.
In the present study, we used putatively neutral microsatellite markers. Thus, further genomic studies that can detect loci under natural selection, such as restriction site-associated DNA sequencing (RAD-seq, Wagner et al., 2013), as well as physiological studies of larval and adult corals between temperate and subtropical regions are needed to test this hypothesis. Similar genetic evidence of peripheral temperate isolation has been reported in other coral species, such as Acropora hyacinthus (Nakabayashi et al., 2019), and other marine species, including sea slugs (Hoang et al., 2018) and groupers. Further genetic connectivity studies of coral and other marine species with different dispersal potential would provide insights into the formation of genetic breaks associated with the Kuroshio-associated barrier.
Limitations of This Study
While this study indicated a clear genetic break between temperate and subtropical regions irrespective of morphological features, there are some limitations in this study. The number of microsatellite loci analyzed in this study is limited. We only succeeded in isolating six independent microsatellite loci, which may be insufficient to accurately identify asexually produced clones within some populations. Fortunately, to our knowledge there is no report on asexually produced clones in the G. lobata species complex. We have also confirmed that there are no possible clones (having exactly the same genotype based on six loci) within our data, indicating all the samples used in this study were sexually reproduced genetically unique individuals.
A second limitation is the number of samples we analyzed in this study. Although this is characteristic of our target region, 84.2% of studied specimens had intermediate morphologies, and only 13 specimens could be identified as morphotypes of G. lobata (n = 7) or G. djiboutiensis (n = 6). While Terraneo et al. (2016) found major discordance between morphology and molecular data between G. lobata and G. djiboutiensis morphotypes, concordant with our study, they could at least identify G. lobata and G. djiboutiensis morphotypes in the Red Sea (a type locality of G. lobata). Thus, genetic analysis using more G. lobata and G. djiboutiensis morphotypes from other regions including type localities would be necessary to clarify the species boundaries of the G. lobata species complex.
Lastly, this study lacks a morphometric analysis, and individual-based environmental data. Further study, providing more detailed morphometric analysis, together with environmental data for each specimen would offer insights into the morphological variations and phenotypic plasticity of this group.
Using the present data as a baseline, genome-wide genetic analyses such as RAD-seq or MIG-seq using a larger number of collected morphotype specimens, including geographic context, would be useful to further clarify species boundaries and possible ecological speciation in relation to morphological features and evolutionary history of G. lobata species complex.
Data Availability Statement
The datasets presented in this study can be found in online repositories. The names of the repository/repositories and accession number(s) can be found below: DNA Data Bank of Japan (accession numbers listed in Supplementary Table 4). All the supplementary data is available in Figshare 10.6084/m9.figshare.1479.
Author Contributions
NY and YK conceived the study. YK, TM, and HY collected the samples. YK conducted the morphological identification and Sanger sequencing. NY, SN, HY, and HT developed microsatellite markers. NY conducted the genetic analysis and drafted the manuscript. All the authors have checked and agreed to the final manuscript.
Funding
This study was funded by the Environment Research and Technology Development Fund (grant no. 4RF-1501), Ministry of the Environment, Japan, Japan Society for the Promotion of Science, Grant-in-Aid for Young Scientists (A) (grant no. 17H04996), Grant-in-Aid for Scientific Research (B) (grant no. 21H02274), Grant-in-Aid for Research Fellows: 201921342, and the Program to Disseminate Tenure Tracking System from the Ministry of Education, Culture, Sports, Science and Technology (MEXT).
Conflict of Interest
The authors declare that the research was conducted in the absence of any commercial or financial relationships that could be construed as a potential conflict of interest.
Acknowledgments
We are grateful to the members of the Japanese Society for Coral Taxonomy, particularly Mr. Kenji Iwao, Mr. Keiichi Nomura, Dr. Hiroyuki Yokochi, and Dr. Satoshi Nojima, for providing the coral specimens. We also appreciate Dr. Kazuhiko Sakai’s assistance during sampling. We are grateful to Ms. Yumi Yamamoto and Mr. Ryo Shimbo for helping with the genetic experiments. Sampling was conducted under the Okinawa Prefectural Government permit (Nos. 27–81, 27–29, 26–10, 25–44, 24–36) and the Kochi Prefectural Government permit (No. 530). For other samplings, we submitted notifications to the local governments and worked in agreement with local fishing corporations. We would like to thank Editage (www.editage.com) for English language editing. We appreciate the reviewers and editors who assisted in improving this manuscript.
Supplementary Material
The Supplementary Material for this article can be found online at: https://www.frontiersin.org/articles/10.3389/fmars.2021.592608/full#supplementary-material
Supplementary Figure 1 | STRUCTURE bar-plot results using no prior (upper) at K = 2, 4 and geographic prior at K = 3, 4.
Supplementary Table 1 | Morphological data of samples used for STRUCTURE analyses.
Supplementary Table 2 | Microsatellite dataset used in this study in GenAlEx format.
Supplementary Table 3 | Delta K calculations for STRUCTURE analysis.
Supplementary Table 4 | Environmental parameters of different regions.
Supplementary Data 1 | Internal transcribed spacer region dataset used for phylogenetic tree reconstruction.
Footnotes
References
Babcock, R. C., and Heyward, A. J. (1986). Larval development of certain gamete-spawning scleractinian corals. Coral Reefs 5, 111–116. doi: 10.1007/BF00298178
Baum, D. A., and Donoghue, M. J. (1995). Choosing among alternative” phylogenetic” species concepts. Syst. Bot. 20, 560–573. doi: 10.2307/2419810
Benson, G. (1999). Tandem repeats finder: a program to analyze DNA sequences. Nucleic Acids Res. 27, 573–580. doi: 10.1093/nar/27.2.573
Bongaerts, P., Riginos, C., Hay, K., van Oppen, M., Hoegh-Guldberg, O., and Dove, S. (2011). Adaptive divergence in a scleractinian coral: physiological adaptation of Seriatopora hystrix to shallow and deep reef habitats. BMC Evol. Biol. 11:303. doi: 10.1186/1471-2148-11-303
Capella-Gutiérrez, S., Silla-Martínez, J. M., and Gabaldón, T. (2009). trimAl: a tool for automated alignment trimming in large-scale phylogenetic analyses. Bioinformatics 25, 1972–1973. doi: 10.1093/bioinformatics/btp348
Carpenter, K. E., Abrar, M., Aeby, G., Aronson, R. B., Banks, S., Bruckner, A., et al. (2008). One-third of reef-building corals face elevated extinction risk from climate change and local impacts. Science 321, 560–563. doi: 10.1126/science.1159196
Chen, C. A., Yang, Y. W., Wei, N. V., Tsai, W. S., and Fang, L. S. (2005). Symbiont diversity in scleractinian corals from tropical reefs and subtropical non-reef communities in Taiwan. Coral Reefs 24, 11–22. doi: 10.1007/s00338-004-0389-7
de Queiroz, K. (2005). A unified concept of species and its consequences for the future of taxonomy. Proc. Calif. Acad. Sci. 56, 196–215.
Earl, D. A., and von Holdt, B. M. (2012). STRUCTURE HARVESTER: a website and program for visualizing STRUCTURE output and implementing the Evanno method. Conserv. Genet. Res. 4, 359–361. doi: 10.1007/s12686-011-9548-7
Evanno, G., Regnaut, S., and Goudet, J. (2005). Detecting the number of clusters of individuals using the software STRUCTURE: a simulation study. Mol. Ecol. 14, 2611–2620. doi: 10.1111/j.1365-294X.2005.02553.x
Excoffier, L., and Lischer, H. E. (2010). Arlequin suite ver 3.5: a new series of programs to perform population genetics analyses under Linux and Windows. Mol. Ecol. Resour. 10, 564–567. doi: 10.1111/j.1755-0998.2010.02847.x
Fukami, H., Budd, A., Levitan, D., Jara, J., Kersanach, R., and Knowlton, N. (2004). Geographic differences in species boundaries among members of the Montastrea annularis complex based on molecular and morphological markers. Evolution 58, 324–337. doi: 10.1111/j.0014-3820.2004.tb01648.x
Hoang, D. T., Chernomor, O., von Haeseler, A., Minh, B. Q., and Vinh, L. S. (2018). UFBoot2: improving the ultrafast bootstrap approximation. Mol. Biol. Evol. 35, 518–522. doi: 10.1093/molbev/msx281
Hodel, R. G. J., Segovia-Salcedo, M. C., Landis, J. B., Crowl, A. A., Sun, M., Liu, X., et al. (2016). The report of my death was an exaggeration: a review for researchers using microsatellites in the 21st century. Appl. Plant. Sci. 4:1600025. doi: 10.3732/apps.1600025
Hubisz, M. J., Falush, D., Stephens, M., and Pritchard, J. K. (2009). Inferring weak population structure with the assistance of sample group information. Mol. Ecol. Resour. 9, 1322–1332. doi: 10.1111/j.1755-0998.2009.02591.x
Jeffries, D. L., Copp, G. H., Lawson Handley, L., Olsén, K. H., Sayer, C. D., and Hänfling, B. (2016). Comparing RAD seq and microsatellites to infer complex phylogeographic patterns, an empirical perspective in the Crucian carp, Carassius carassius, L. Mol. Ecol. 25, 2997–3018. doi: 10.1111/mec.13613
Katoh, K., Rozewicki, J., and Yamada, K. D. (2017). MAFFT online service: multiple sequence alignment, interactive sequence choice and visualization. Brief. Bioinform. 20, 1160–1166. doi: 10.1093/bib/bbx108
Kimura, M. (1980). A simple method for estimating evolutionary rates of base substitutions through comparative studies of nucleotide sequences. J. Mol. Evol. 16, 111–120. doi: 10.1007/BF01731581
Kitano, Y. F., Obuchi, M., Uyeno, D., Miyazaki, K., and Fukami, H. (2013). Phylogenetic and taxonomic status of the coral Goniopora stokesi and related species (Scleractinia: Poritidae) in Japan based on molecular and morphological data. Zool. Stud. 52:25. doi: 10.1186/1810-522X-52-25
Kopelman, N. M., Mayzel, J., Jakobsson, M., Rosenberg, N. A., and Mayrose, I. (2015). Clumpak: a program for identifying clustering modes and packaging population structure inferences across K. Mol. Ecol. Resour. 15, 1179–1191. doi: 10.1111/1755-0998.12387
Kumar, S., Stecher, G., Li, M., Knyaz, C., and Tamura, K. (2018). MEGA X: molecular evolutionary genetics analysis across computing platforms. Mol. Biol. Evol. 35, 1547–1549. doi: 10.1093/molbev/msy096
LaJeunesse, T. C., Pettay, D. T., Sampayo, E. M., Phongsuwan, N., Brown, B., Obura, D. O., et al. (2010). Long-standing environmental conditions, geographic isolation and host–symbiont specificity influence the relative ecological dominance and genetic diversification of coral endosymbionts in the genus Symbiodinium. J. Biogeogr. 37, 785–800. doi: 10.1111/j.1365-2699.2010.02273.x
Medrano, M., López-Perea, E., and Herrera, C. M. (2014). Population genetics methods applied to a species delimitation problem: endemic trumpet daffodils (Narcissus Section Pseudonarcissi) from the Southern Iberian Peninsula. Int. J. Planci. Sci. 175, 501–517. doi: 10.1086/675977
Milne-Edwards, H., and Haime, J. (1851). A monograph of the British fossil corals. 2. Corals from the oolitic formations. Monogr. Palaeontogr. Soc. 5, 73–145. doi: 10.1080/02693445.1851.12113202
Minh, B. Q., Schmidt, H. A., Chernomor, O., Schrempf, D., Woodhams, M. D., von Haeseler, A., et al. (2020). IQ-TREE 2: new models and efficient methods for phylogenetic inference in the genomic era. Mol. Biol. Evol. 37, 1530–1534. doi: 10.1093/molbev/msaa015
Nakabayashi, A., Yamakita, T., Nakamura, T., Aizawa, H., Kitano, Y. F., Iguchi, A., et al. (2019). The potential role of temperate Japanese regions as refugia for the coral Acropora hyacinthus in the face of climate change. Sci. Rep. 9:1892. doi: 10.1038/s41598-018-38333-5
Nakajima, Y., Nishikawa, A., Iguchi, A., and Sakai, K. (2012). The population genetic approach delineates the species boundary of reproductively isolated corymbose Acroporid corals. Mol. Phylogenet. Evol. 63, 527–531. doi: 10.1016/j.ympev.2012.01.006
Nakamura, Y., Shigenobu, Y., Sugaya, T., Kurokawa, T., and Saitoh, K. (2013). Automated screening and primer design of fish microsatellite DNA loci on pyrosequencing data. Ichthyol. Res. 60, 184–187. doi: 10.1007/s10228-012-0317-8
NASA (2018). Goddard Space Flight Center, Ocean Ecology Laboratory, Ocean Biology Processing Group MODIS-Aqua Level-2 Ocean Color Data Version, NASA OB.DAAC. doi: 10.5067/AQUA/MODIS/L2/OC/2018 (accessed January 1, 2018).
Nishihira, M., and Veron, J. E. N. (1995). Hermatypic Corals of Japan. Tokyo: Kaiyusha Publishers. (In Japanese).
Peakall, R., and Smouse, P. (2012). GenAlEx 6.5: genetic analysis in excel. Population genetic software for teaching and research – an update. Bioinformatics 28, 2537–2539. doi: 10.1093/bioinformatics/bts460
Pritchard, J. K., Stephens, M., and Donnely, P. (2000). Inference of population structure using multilocus genotype data. Genetics 155, 945–959. doi: 10.1093/genetics/155.2.945
Raymond, M., and Rousset, F. (1995). GENEPOP: population genetics software for exact tests and ecumenicism. J. Hered. 86, 248–249. doi: 10.1093/oxfordjournals.jhered.a111573
Richmond, R. H., and Hunter, C. L. (1990). Reproduction and recruitment of corals: comparisons among the Caribbean, the tropical Pacific, and the Red Sea. Mar. Ecol. Prog. Ser. 60, 185–203. doi: 10.3354/meps060185
Rozen, S., and Skaletsky, H. (2000). Primer3 on the WWW for general users and for biologist programmers. Methods Mol. Biol. 132, 365–386. doi: 10.1385/1-59259-192-2:365
Schwartz, M. K., and McKelvey, K. S. (2008). Why sampling scheme matters: the effect of sampling scheme on landscape genetic results. Conserv. Genet. 10:441. doi: 10.1007/s10592-008-9622-1
Terraneo, T. I., Benzoni, F., Arrigoni, R., and Berumen, M. L. (2016). Species delimitation in the coral genus Goniopora (Scleractinia, Poritidae) from the Saudi Arabian Red Sea. Mol. Phylogenet. Evol. 102, 278–294. doi: 10.1016/j.ympev.2016.06.003
Todd, P. (2008). Morphological plasticity in scleractinian corals. Biol. Rev. Camb. Philos. Soc. 83, 315–337. doi: 10.1111/j.1469-185x.2008.00045.x
Van Oosterhout, C. (2004). Micro-checker: software for identifying and correcting genotyping errors in microsatellite data. Mol. Ecol. Notes 4, 535–538. doi: 10.1111/j.1471-8286.2004.00684.x
Vaughan, T. W. (1907). Some madreporarian corals from French Smaliland, East Africa, collected by Dr. Charles Gravier. Proc. U. S. Natl. Mus. 32, 249–266. doi: 10.5479/si.00963801.32-1526.249
Veron, J. E. N. (1993). A biogeographic database of hermatypic corals. Species of the Central Indo-Pacific, genera of the world. Aust. Inst. Mar. Sci. Monogr. Ser. 10, 1–433.
Veron, J. E. N., and Pichon, M. (1982). Scleractinia of eastern Australia. Part 4. Aust. Inst. Mar. Sci. Monogr. Ser. 5, 1–159.
Wagner, C. E., Keller, I., Wittwer, S., Selz, O. M., Mwaiko, S., Greuter, L., et al. (2013). Genome-wide RAD sequence data provide unprecedented resolution of species boundaries and relationships in the Lake Victoria cichlid adaptive radiation. Mol. Ecol. 22, 787–798. doi: 10.1111/mec.12023
Wong, J. C., Thompson, P., Xie, J. Y., Qiu, J. W., and Baker, D. M. (2016). Symbiodinium clade C generality among common scleractinian corals in subtropical Hong Kong. Reg. Stud. Mar. Sci. 8, 439–444. doi: 10.1016/j.rsma.2016.02.005
Yamano, H., Sugihara, K., and Nomura, K. (2011). Rapid poleward range expansion of tropical reef corals in response to rising sea surface temperatures. Geophys. Res. Lett. 38:L04601. doi: 10.1029/2010GL046474
Yamashita, H., and Koike, K. (2013). Genetic identity of free-living Symbiodinium obtained over a broad latitudinal range in the Japanese coast. Psychol. Res. 61, 68–80. doi: 10.1111/pre.12004
Yara, Y., Vogt, M., Fujii, M., Yamano, H., Hauri, C., Steinacher, M., et al. (2012). Ocean acidification limits temperature-induced poleward expansion of coral habitats around Japan. Biogeosciences 9, 4955–4968. doi: 10.5194/bg-9-4955-2012
Yasuda, N., Taquet, C., Nagai, S., Fortes, M., Fan, T.-Y., Harii, S., et al. (2015). Genetic diversity, paraphyly and incomplete lineage sorting of mtDNA, ITS2 and microsatellite flanking region in closely related Heliopora species (Octocorallia). Mol. Phylogenet. Evol. 93, 161–171. doi: 10.1016/j.ympev.2015.07.009
Keywords: microsatellite markers, species delimitation, coral reefs, biodiversity, Kuroshio Current
Citation: Yasuda N, Kitano YF, Taninaka H, Nagai S, Mezaki T and Yamashita H (2021) Genetic Structure of the Goniopora lobata and G. djiboutiensis Species Complex Is Better Explained by Oceanography Than by Morphological Characteristics. Front. Mar. Sci. 8:592608. doi: 10.3389/fmars.2021.592608
Received: 07 August 2020; Accepted: 21 May 2021;
Published: 01 July 2021.
Edited by:
Hajime Kayanne, The University of Tokyo, JapanReviewed by:
Yuichi Nakajima, Okinawa Institute of Science and Technology Graduate University, JapanDavid A. Paz-García, Centro de Investigación Biológica del Noroeste (CIBNOR), Mexico
Copyright © 2021 Yasuda, Kitano, Taninaka, Nagai, Mezaki and Yamashita. This is an open-access article distributed under the terms of the Creative Commons Attribution License (CC BY). The use, distribution or reproduction in other forums is permitted, provided the original author(s) and the copyright owner(s) are credited and that the original publication in this journal is cited, in accordance with accepted academic practice. No use, distribution or reproduction is permitted which does not comply with these terms.
*Correspondence: Nina Yasuda, nina27@cc.miyazaki-u.ac.jp
†These authors have contributed equally to this work and share first authorship