Early Diagenesis in the Hypoxic and Acidified Zone of the Northern Gulf of Mexico: Is Organic Matter Recycling in Sediments Disconnected From the Water Column?
 Christophe Rabouille1*†
  Bruno Lansard1
  Shannon M. Owings2
  Nancy N. Rabalais3 Bruno Bombled1
  Edouard Metzger4 Julien Richirt4 Eryn M. Eitel2
  Anthony D. Boever2
  Jordon S. Beckler5 Martial Taillefert2
- 1Laboratoire des Sciences du Climat et de l’Environnement, UMR 8212 CEA-CNRS-UVSQ, CEA-Orme des Merisiers, IPSL and Université Paris-Saclay, Gif-sur-Yvette, France
- 2School of Earth and Atmospheric Sciences, Georgia Institute of Technology, Atlanta, GA, United States
- 3Department of Oceanography and Coastal Sciences, Louisiana State University, Baton Rouge, LA, United States
- 4LPG-BIAF, UMR 6112 CNRS, Université d’Angers, Angers, France
- 5Harbor Branch Oceanographic Institute, Florida Atlantic University, Boca Raton, FL, United States
Hypoxia and associated acidification are growing concerns for ecosystems and biogeochemical cycles in the coastal zone. The northern Gulf of Mexico (nGoM) has experienced large seasonal hypoxia for decades linked to the eutrophication of the continental shelf fueled by the Mississippi River nutrient discharge. Sediments play a key role in maintaining hypoxic and acidified bottom waters, but this role is still not completely understood. In the summer 2017, when the surface area of the hypoxic zone in the nGoM was the largest ever recorded, we investigated four stations on the continental shelf differentially influenced by river inputs of the Mississippi-Atchafalaya River System and seasonal hypoxia. We investigated diagenetic processes under normoxic, hypoxic, and nearly anoxic bottom waters by coupling amperometric, potentiometric, and voltammetric microprofiling with high-resolution diffusive equilibrium in thin-films (DET) profiles and porewater analyses. In addition, we used a time-series of bottom-water dissolved oxygen from May to November 2017, which indicated intense O2 consumption in bottom waters related to organic carbon recycling. At the sediment-water interface (SWI), we found that oxygen consumption linked to organic matter recycling was large with diffusive oxygen uptake (DOU) of 8 and 14 mmol m–2 d–1, except when the oxygen concentration was near anoxia (5 mmol m–2 d–1). Except at the station located near the Mississippi river outlet, the downcore pore water sulfate concentration decrease was limited, with little increase in alkalinity, dissolved inorganic carbon (DIC), ammonium, and phosphate suggesting that low oxygen conditions did not promote anoxic diagenesis as anticipated. We attributed the low anoxic diagenesis intensity to a limitation in organic substrate supply, possibly linked to the reduction of bioturbation during the hypoxic spring and summer.
Introduction
Ocean de-oxygenation is a major concern due to warming and eutrophication, especially in the coastal zone (Pörtner et al., 2007; Diaz and Rosenberg, 2008; Gilbert et al., 2010; Zhang et al., 2010; Breitburg et al., 2018; Capet et al., 2020). The occurrence, frequency and extent of hypoxic events (dissolved oxygen concentration < 63 μmol L–1) are increasing in many coastal zones due to global warming and local eutrophication. The oxygenation of sea water is fundamental to biological and biogeochemical processes. Its decline can cause major changes in ocean productivity, biodiversity, and biogeochemical cycles. Despite the recognized impact of hypoxia on many coastal ecosystems, the numerous benthic processes which promote or limit its negative effects are largely under-investigated. Oxygen availability affects remineralization processes and associated sources and sinks of important nutrient elements, such as nitrogen, phosphorus, and iron (Breitburg et al., 2018). In the general context of ocean acidification caused by anthropogenic CO2 invasion (Orr et al., 2005), coastal acidification shows some specific features. In addition to surface invasion of CO2, coastal acidification is amplified by the microbial respiration of terrigenous and marine organic matter in bottom waters, and the accumulation of DIC in stratified waters (Cai et al., 2011). In coastal regions, seasonal hypoxia is generally associated with significant bottom water acidification because of concomitant DIC production and oxygen consumption during aerobic mineralization of organic matter thus imposing a double stressor to coastal ecosystems (Cai et al., 2011). Sediments play a key role in maintaining hypoxic and acidified bottom waters, but this role is still not completely understood (Middelburg and Levin, 2009).
The northern Gulf of Mexico (nGoM) and the Louisiana shelf near the Mississippi River delta includes one of the largest seasonal hypoxic zones of the coastal ocean (Rabalais et al., 2002). Coastal eutrophication associated with nutrient input from the Mississippi River watershed is responsible for the onset of hypoxia through increased primary production, organic matter sedimentation, and mineralization in the bottom waters of the stratified water column (Rabalais et al., 2002; Turner et al., 2006, 2008; Bianchi et al., 2010; Fennel and Testa, 2019). The aerobic microbial degradation of organic matter also generates in situ ocean acidification by the formation of metabolic CO2 without significant total alkalinity (TA) production (Cai et al., 2011). The consumption of bottom water oxygen in the nGoM is intense and correlated to the vertical flux of organic matter originating from primary production in the Mississippi River plume and adjacent continental shelf waters (Redalje et al., 1994; Rabalais et al., 2014; Wang et al., 2018). This organic matter flux promotes a rise in bacterial oxygen consumption with depletion time of several days to a few weeks (Chin-Leo and Benner, 1992; Amon and Benner, 1998; Rabalais et al., 2007; Rabouille et al., 2008). Mobile muds contribute to sediment redistribution and export across the continental shelf (Corbett et al., 2004, 2007; McKee et al., 2004) and to oxygen consumption in the bottom water during resuspension events (Moriarty et al., 2018). In addition to water column respiration, sediment oxygen demand was identified as an important contributor to hypoxia (Turner et al., 2008) with benthic oxygen consumption rates obtained by in situ benthic chambers ranging from 5 to 50 mmol O2 m–2 d–1 (Morse and Rowe, 1999; Rowe et al., 2002; Berelson et al., 2019) and by ex situ sediment core incubations ranging from 10 to 20 mmol O2 m–2 d–1 (Murrell and Lehrter, 2011). It was also proposed that dissolved inorganic carbon (DIC) benthic fluxes contribute to the acidification of bottom waters (Hu et al., 2017). As anoxic mineralization in sediments produces alkalinity (Krumins et al., 2013; Rassmann et al., 2020), benthic alkalinity fluxes may also mitigate bottom water acidification if the TA/DIC flux ratio is above one (Hu and Cai, 2011). Several 3D models dealing with hypoxia in the nGoM utilized sediment oxygen consumption (SOC) representations and DIC fluxes to explain the onset and maintenance of hypoxia and the related acidification throughout the summer season (Hetland and DiMarco, 2008; Fennel et al., 2013; Laurent et al., 2017). Specific sediment models were also developed with the aim of understanding oxygen fluxes and their relationship with organic matter deposition and oxygen concentration in the water column (Morse and Eldridge, 2007; Laurent et al., 2016). Benthic-pelagic exchange processes were recognized as key features of mathematical models for accurate representation of hypoxia occurrence and persistence in the nGoM (Fennel et al., 2013; Feist et al., 2016).
Yet, benthic processes involved in bottom water oxygen consumption and acidification remain poorly characterized. After the pioneering work of Lin and Morse (1991) on pyrite formation in the Gulf of Mexico, which included pore water depth profiles of sulfur species (SO42–, ΣH2S), few pore water data have been published in the following 20 years. Morse and Rowe (1999) investigated the benthic biogeochemistry at three stations beneath the Mississippi river plume and some other data have been published in a later paper (Morse and Eldridge, 2007). Pore water data obtained at five stations across the Louisiana shelf for 5 years (2002–2007) were published in a report (Murrell et al., 2013) without a thorough discussion of the underlying biogeochemical processes. Later, these processes were partially discussed for two of the five stations (Devereux et al., 2015; Laurent et al., 2016), although a larger collection of pore water profiles was published more recently (Devereux et al., 2019) together with sulfate reduction rate measurements. In contrast to the large sediment oxygen demands reported in the above studies, all data sets indicated poorly active subsurface sediments with limited increase of metabolite concentrations (NH4+, DIC) in shelf sediments under the river plume and adjacent continental shelf waters.
In most of these studies, the contribution of benthic processes, in particular the role of dissolved iron, manganese and sulfide oxidation at the oxic-anoxic interface in sediments, to the onset and persistence of hypoxic bottom waters throughout the summer was not investigated thoroughly. Furthermore, the role of benthic processes on DIC and TA fluxes to bottom waters and its link to acidification during both normoxic and hypoxic periods was not considered, despite the potential release of alkalinity produced by increased anoxic diagenesis (Krumins et al., 2013; Rassmann et al., 2020).
In this paper, the role of early diagenesis in Louisiana shelf sediments on bottom water hypoxia was investigated in the summer of 2017, when the surface area of the hypoxic zone was the largest ever recorded (Rabalais and Turner, 2019). Surface sediments and pore waters within and beyond the hypoxic zone were examined using multiple techniques, including in situ and ex situ micro-electrodes, diffusive equilibrium in thin films (DET) probes and classical pore water extractions. Time series data (7 months) of bottom water dissolved oxygen from a fixed station in 20-m water depth collected simultaneously were also included to examine the oxygen conditions before, during, and after hypoxia and assess the dynamics of oxygen consumption in the water column. The main objectives of this paper are to: (i) examine the contribution of water column, interface and subsurface sediments to the overall oxygen demand of bottom waters; (ii) investigate whether anoxic early diagenesis in subsurface sediments (metal oxides and sulfate reduction) is enhanced by hypoxic conditions; and (iii) examine the contribution of early diagenesis to bottom water acidification through benthic DIC and TA production and their potential release to the overlying waters.
Materials and Methods
Site Characteristics and Sampling
The Louisiana shelf near the Mississippi River delta in the nGoM is one of the largest seasonal hypoxic zones of the coastal ocean (Rabalais et al., 2002; Rabouille et al., 2008). These sediments contain high concentrations of particulate organic carbon (POC) which decrease slightly from the River mouth (1.4% OC dry weight) to the shelf (1.1% OC dw) (Goni et al., 1997; Gordon and Goni, 2004; Bianchi et al., 2014). Although terrestrial organic carbon from C3 and C4 plants is present, a decreasing proportion of terrestrial organic carbon and a progressive replacement by marine organic matter is observed westward (Waterson and Canuel, 2008) with a proportion of 60–80% of marine OC in shelf sediments. Most of the recycled carbon is derived from marine organic carbon as attested by the δ13C signature of bottom water DIC (Wang et al., 2018). The export of POC to the Mississippi canyon is also significant (Bianchi et al., 2006) and probably related to mobile mud resuspension and transport (Corbett et al., 2004, 2007). Sedimentation rates indicate large sedimentation near the river outlet (>2.5 cm y–1) with values ranging between 0.1 and 0.7 cm y–1 on the Louisiana shelf (Gordon and Goni, 2004; Corbett et al., 2006).
The MissRhoDia 1 cruise was conducted in the nGoM in the plume of the Mississippi River on the R/V Savannah, operated by the Skidaway Institute of Oceanography at the University of Georgia (United States), from July 19th to August 13th 2017. Four stations were investigated on the Louisiana continental shelf along a 170 km east-west transect from the river mouth to the open shelf (Figure 1). Station 2b was located near the Mississippi River delta at 65 m depth, whereas the three other stations (4, MK, and 5B) were located on the Louisiana shelf around the 20 m isobath in and around the reported hypoxic zone. Indeed, the reported hypoxia frequency for these three stations are 50–100% during the hypoxic season (Rabalais and Turner, 2019). Four other stations were investigated during the same cruise on the slope and are presented in a companion paper (Owings et al., 2021). At each station, CTD profiles were measured, bottom water was sampled with Niskin bottles, one microprofiler deployment was conducted and three sediment cores were collected using a MC-800 multicorer (Ocean Instruments) and immediately treated on board: one for porosity, one for voltammetry followed by porewater extraction, and one for DET measurements. In addition, dissolved oxygen time series in bottom waters obtained in 2017 at station C6C are included, as a subset of the time series obtained over the last 20 years by LUMCON (Rabalais and Turner, 2019).
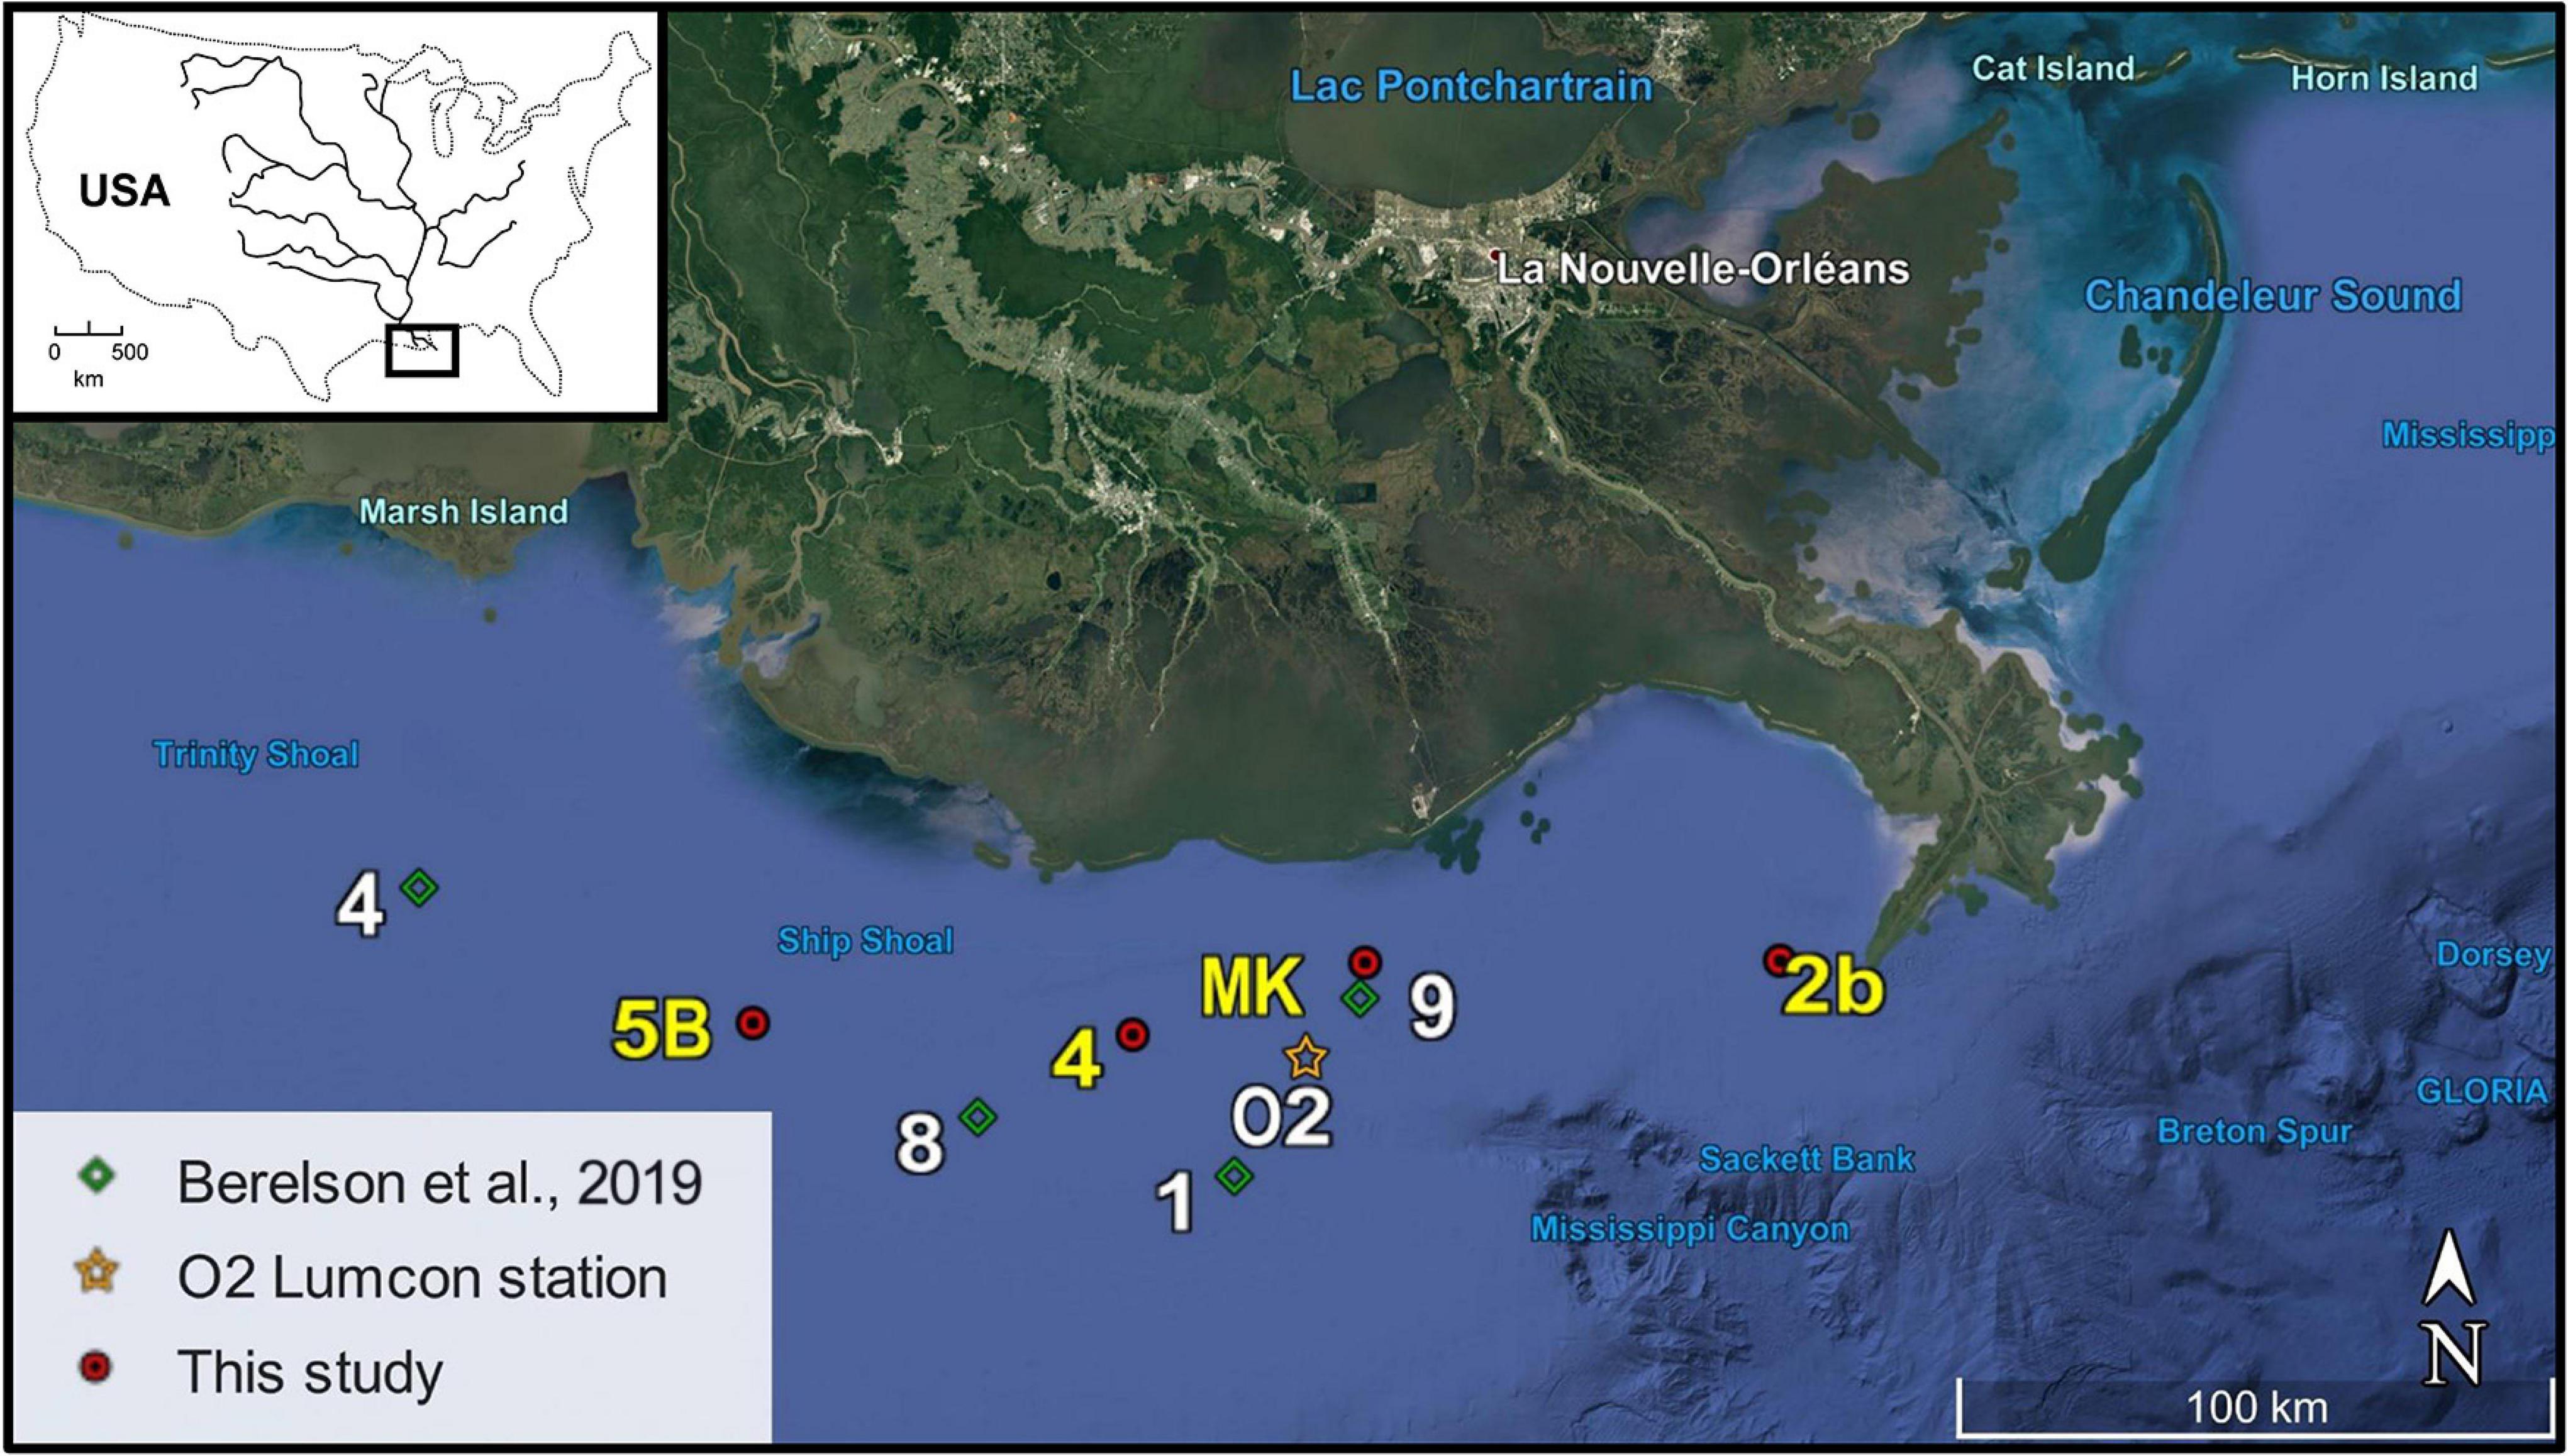
Figure 1. Map of the Louisiana shelf showing the location of the four stations (2b, MK, 4, and 5B) sampled by the R/V Savannah in July-August 2017. Station O2 (orange star) refers to the seasonal monitoring station C6C maintained by LUMCON with bottom water oxygen measurements, whereas stations 1, 8, and 9 (green diamonds) refer to Berelson et al. (2019) benthic chamber measurements.
CTD and Bottom Water Measurements
Seawater samples were collected using a rosette system (10 × 6-L Niskin bottles) equipped with a conductivity-temperature-depth sensor (CTD, Seabird® SBE 19), a dissolved O2 sensor (Seabird® SBE 43), a turbidity sensor (ECO-BB, Wet Lab®) and a fluorometer (Seapoint®). The temperature, conductivity, turbidity and fluorometer probes were calibrated by the manufacturer. Bottom water samples were collected using the CTD/Rosette as close as possible to the seafloor approximately 1.5–2 m above the seabed. Temperature and salinity were immediately measured using a manual thermometer (precision 0.1°C) and a thermo-salinometer (WTW 331, precision 0.1). DIC and TA samples were collected in 500 mL borosilicate glass bottles, poisoned with 100 μL of saturated HgCl2 and measured by the SNAPO-CO2 at the LOCEAN French laboratory (Paris, France). These analyses were performed by a potentiometric closed-cell titration (DOE, 1994), on 120 mL sample volumes, at 25°C and with a precision of 0.15%. Bottom water pH was measured on board in triplicates by the unpurified m-cresol spectrophotometric method of Clayton and Byrne (1993) at 25°C with uncertainties < 0.01 pH units. The pH at in situ conditions was then calculated using the CO2sys program (Pierrot et al., 2006) with ex situ pH, TA, salinity, temperature, and pressure as inputs parameters. Following the recommendations of Orr et al. (2015), all calculations with CO2sys were performed using the acid dissociation constants of carbonate Ka1 and Ka2 reported by Lueker et al. (2000) and total dissolved boron (BT) reported by Uppström (1974). The in situ pH is reported on the total proton scale (pHT). In order to validate our pH values, we compared the obtained in situ pHT to that calculated using measured DIC and TA (SNAPO-CO2) at in situ pressure, salinity and temperature by the CO2sys program. These two independent values were in good agreement within 0.015 pH units or better.
Continuous O2 Records in Bottom Waters
Data from the C6C station (O2 on Figure 1) were obtained every 15 min for bottom water dissolved oxygen from May 2017 to Nov 2017. The data were collected at 1 m above the seabed using dissolved oxygen meters YSI6600 calibrated before and after deployment with Winkler titrations. Water quality probes were replaced optimally at 4- to 6-week intervals to ensure adequate battery life and to avoid fouling, which was minimal because of low oxygen concentrations and high turbidity at these depths. Independent measurements of oxygen were also obtained with a profiling YSI6820 on dive trips when changing the water quality probes to provide an independent quality control on the dissolved oxygen concentration of the deployed YSI6600. The YSI6820 was also pre- and post-calibrated and compared to Winkler titrations in the laboratory.
In situ Micro-Electrode Measurements in Sediment
The in situ distributions of O2 and pH at the sediment-water interface (SWI) were obtained using a benthic micro-profiler (Rassmann et al., 2016, 2020) equipped with five Clark Au/Ag oxygen microelectrodes, two pH glass microelectrodes, two pH references (Ag/AgCl) and one resistivity electrode. After landing on the sediment, the sensing head of the lander carrying the microelectrodes moved vertically over 4 cm across the SWI with a resolution of 200 μm. The O2 microelectrodes were calibrated with a two-point calibration technique using the bottom water O2 concentration determined by Winkler titration and the anoxic pore waters. The pH microelectrodes were calibrated using NBS buffers (pH 4.00, 7.00, and 9.00 at 20°C), and electrode slopes were used to calculate pH variations (ΔpH) in the pore waters at in situ temperature. The ΔpH values were then added to the spectrophotometrically determined pHT of the bottom waters to obtain pore water pHT. Signal drift of O2 and pH microelectrodes during profiling was checked to be less than 5%. Diffusive Oxygen Uptake rates (DOU) were calculated for each micro-profile using the observed O2 concentration gradient calculated over 400 μm in the sediment, the porosity value and the O2 diffusion coefficient at in situ temperature (Broecker and Peng, 1974) corrected for tortuosity. The oxygen penetration depth (OPD) was operationally defined as the depth where O2 concentrations dropped below 1 μmol L–1 (Rabouille and Gaillard, 1991).
Sediment Porosity Measurements
For each station, a sediment core was dedicated to porosity measurements. The core was sub-cored using a 50-ml plastic syringe with end cut off and then cut into 2 mm slices on the first centimeter, every 5 mm on the next 9 cm and finally on 2 cm slices for the rest of the core (Cathalot et al., 2010). The sediments from each section were stored in petri dishes and frozen. Porosity was measured in the laboratory based on the salt-corrected mass difference between wet and dry samples (1 week at 60°C) and a sediment density of 2.65 g cm–3.
Voltammetric ex situ Profiling
A replicate core collected from the same MC800 deployment was profiled in millimeter increments for dissolved oxygen [O2(aq)], thiosulfate (S2O32–), total dissolved sulfide (ΣH2S = H2S + HS– + S0 + Sx2–), dissolved iron(II) (Fe2+), and dissolved manganese(II) (Mn2+) with 100 μm gold/mercury (Au/Hg) voltammetric microelectrodes (Owings et al., 2021). The electrodes were prepared daily and deployed on a computer-controlled micromanipulator with a DLK 70 electrochemical analyzer (Analytical Instrument Systems, Inc.) in a three-electrode system (Ag/AgCl reference, Pt counter, and Au/Hg working electrodes) as reported previously (Brendel and Luther, 1995; Luther et al., 2008). All measurements were performed according to Owings et al. (2021). Except for O2(aq) which was calibrated using the Winkler-determined overlying water measurements, five-point external calibrations in 0.54 M NaCl were performed with Mn2+ as pilot ion, and S2O32–, Fe2+, and ΣH2S were quantified from the pilot ion method (Brendel and Luther, 1995) with the following minimum detection limits (MDLs): ∼15 μM for Mn2+, ∼25 μM for Fe2+, and ∼0.2 μM for ΣH2S. The electrochemical system also allows detection of organic complexes of Fe(III) [org-Fe(III)] (Taillefert et al., 2000) and aqueous iron sulfide clusters [FeS(aq)] as intermediates in the precipitation of FeS(s) (Theberge and Luther, 1997). As the chemical composition of these species is variable and not well defined, they cannot be quantified and are thus reported in normalized current intensities (Meiggs and Taillefert, 2011).
Pore Water Extraction and Analyses
After voltammetric profiles were completed, typically 3 h after core recovery, the same core was transferred to a glove bag (Sigma Aldrich) with a N2 atmosphere for sectioning in 7–10 mm increments down to 12.5 cm and then in 20 mm increments down to the bottom of the core (Owings et al., 2021). For station 2b, the increment was increased to 50 mm after 20 cm depth. Sediment sections were partitioned into 50 mL Falcon tubes, centrifuged for 10 min at 3,000 rpm under N2 atmosphere to extract pore waters, which were then immediately filtered through 0.2-micron Whatman® nitrocellulose Puradisc syringe filters into 15 mL Falcon tubes under N2 atmosphere. The pore waters were then split for onboard analyses of dissolved iron [Fe(II) and Fe(III)] speciation, dissolved manganese (Mnd), dissolved inorganic phosphate (DIP), DIC, and TA. The remaining aliquots were acidified (HCl 0.1 N) and preserved at 4°C or at −20°C until analysis at Georgia Tech (NH4+, SO42–, NO3–).
Pore water TA measurements were conducted according to Dickson et al. (2007), with a 3 mL open-cell potentiometric titration (Rassmann et al., 2016) using 0.01 M HCl, which was calibrated every day using Seawater Reference Material (standard batch #150) provided by the Scripps Institution of Oceanography (A. G. Dickson laboratory). Error in this analysis represents the standard deviation from the mean of duplicate samples and averages 0.5%. DIC was determined by flow injection analysis, if necessary after 5 mM ZnCl2 amendment to avoid dissolved sulfide interference (Hall and Aller, 1992) with an uncertainty of 2–3%. Total dissolved Mn (Mnd) was determined in duplicate using the porphyrin kinetic spectrophotometric method (Madison et al., 2011) modified to account for dissolved Fe2+ interferences (Owings et al., 2021). Mnd was quantified by converting the final absorbance to concentration using the molar absorptivity (ε = 91.2 ± 0.4 × 10⁻³ μM cm–1) determined from external calibration curves with Mn2+ (MDL: 0.11 μM, 3σ of blanks, n = 24). Dissolved orthophosphates (ΣPO43–) were quantified with the methylene blue method after correction for silica interference (Murphy and Riley, 1962). Finally, dissolved Fe2+ was quantified using the ferrozine method without hydroxylamine whereas total dissolved Fe (Fed) was determined by reacting a separate aliquot with hydroxylamine hydrochloride (0.2 M) in the dark for 24 h. Dissolved Fe3+ was obtained by subtracting the dissolved Fe2+ concentration from total dissolved Fe (Stookey, 1970; Viollier et al., 2000). Dissolved ammonium (NH4+) was quantified by the indophenol blue method (Strickland and Parsons, 1972) and anions (SO42–, NO2–, and NO3–) via HPLC with UV detection using a 3.2 mM NaCO3/1.0 mM NaHCO3 buffer (SO42–; Minimum detection limit = 114 μM respectively) and 54 mM NaCl (NO2– NO3–, MDL = 0.12, and 0.11 μM) eluents (Beckler et al., 2014). All standard deviations reported for pore water measurements represent analytical error propagated from calibration curves.
“Diffusive Equilibrium in Thin Films” Profiling
Two-dimensional (2D) distributions of total dissolved iron (Fed) were obtained by insertion of a 2D-DET probe into a separate sediment core collected simultaneously at each station. The 2D-DET probe was composed of a polycarbonate plate as support, a 100 × 40 × 0.5 mm hydrated polyacrylamide gel (details in Jézéquel et al., 2007) and a 0.1 mm-thick PVDF membrane (Durapore®). Before deployment, the probe was deoxygenated by N2 bubbling for at least 3 h. Probes were inserted in the sediment cores for 3 h for chemical equilibrium with the pore waters. During this time, oxygen concentration in the core overlying water was maintained by bubbling an N2/air mix. Temperature of the core was also maintained at in situ value using a Thermo-Fisher cryostat. At the same time, a 0.5 mm-thick gel was also equilibrated with a solution of ascorbic acid (30 mM) and ferrozine (12.2 mM) to form a reagent gel. After retrieval, the probe gel was laid onto the reagent gel. After 15 min, a magenta color whose intensity is proportional to total iron content was read using an office flatbed scanner. Standardization was realized according to Cesbron et al. (2014) with (NH4)2Fe(SO4)2⋅6H2O and ascorbic acid solutions. Scanned images were processed using ImageJ software and the green band was used for calibration and quantification (Jézéquel et al., 2007). For comparison to extracted porewaters, average profiles were calculated using the mean and standard deviations of all pixels within the same depth interval as core slices.
Calculation of the Carbonate Saturation State
Calcium carbonate (CaCO3) saturation states with respect to calcite (ΩCa) and aragonite (ΩAr), reported classically as the ion activity product divided by the apparent solubility equilibrium constant of calcite or aragonite, were calculated using the CO2SYS program (Pierrot et al., 2006) following the recommendations of Orr et al. (2015), using measured values of pH, TA, temperature, salinity, DIP, and silicate from Berelson et al. (2019). Calcium carbonate saturation states at a millimeter scale near the SWI were calculated from in situ pH profiles and linear interpolation of the centimeter-scale TA profiles. The uncertainties of ΩCa and ΩAr were estimated using the standard deviation of the mean in situ pH profiles and the pore water TA (± 15 μmol kg–1).
Integrated Reaction Rate Calculations Using PROFILE
To quantify the mineralization of organic carbon in shelf sediments, integrated reaction rates of DIC production were calculated using the PROFILE software (Berg et al., 1998) using different bioirrigation rate constants (α in y–1). Alpha coefficients were constant with depth until 5–6 cm depth below which they rapidly decreased to 0. Four to five values were used for each profile fit in order to bracket the best fit for each station. Measured porosity profiles were used with diffusion coefficients adjusted to the observed water temperature and salinities. Fits to the measured DIC concentration profiles were optimized by the software and computed integrated reaction rates were then converted to mmol m–2 d–1.
Results
Water Column Measurements
Vertical distributions of temperature, salinity, fluorescence, turbidity, and dissolved O2 concentration in the water column are shown in Figure 2. Surface water temperatures ranged from 28 to 30°C, with the lowest temperature observed near the Mississippi River delta (St. 2b), and water temperatures remained consistently high to 20 m in depth (≥28°C). The water column showed a haline stratification at all stations, with the lowest surface salinity measured at St. 4 (S = 12), which was probably most directly in the path of the freshwater discharge, and the highest surface salinity observed at St. 5B (S = 24). In contrast, bottom water salinities were close to marine waters (Table 1). This haline stratification (Wiseman et al., 1997) was correlated to a strong gradient in dissolved O2 concentration from the surface to the bottom. Dissolved O2 concentrations were slightly supersaturated around 240 μmol L–1 in surface waters at St. MK and 4, reached close to 190 μmol L–1 at St. 2b, and were slightly lower at Station 5B (180 μmol L–1). Dissolved O2 concentrations decreased with depth at all stations (Figure 2). Bottom water O2 concentration reached 109 and 106 μmol L–1 at St. 2b and 4, respectively (Table 1). Near-hypoxic values were observed at St. MK (64 μmol L–1) while hypoxic values were observed at St. 5B (18 μmol L–1). Bottom water pHT followed the decrease in oxygen concentrations, with larger values at stations 2b and 4, slightly lower pHT at St. MK, and a minimum was measured at St. 5B (Table 1). The Chl-a concentration was relatively low (2–5 mg m–3) within the uppermost 10 m of the water column at all stations and decreased below the pycnocline (Figure 2) to reach a constant value of 2 mg m–3 except at St. 2b. The turbidity signal was relatively high above the pycnocline at stations 2b, MK and 4, which are located in the coastal waters around the Mississippi river mouth, and decreased deeper. A nepheloid layer was mostly detected close to the seafloor at St. MK, and to a lesser extent at St. 2b and 5B.
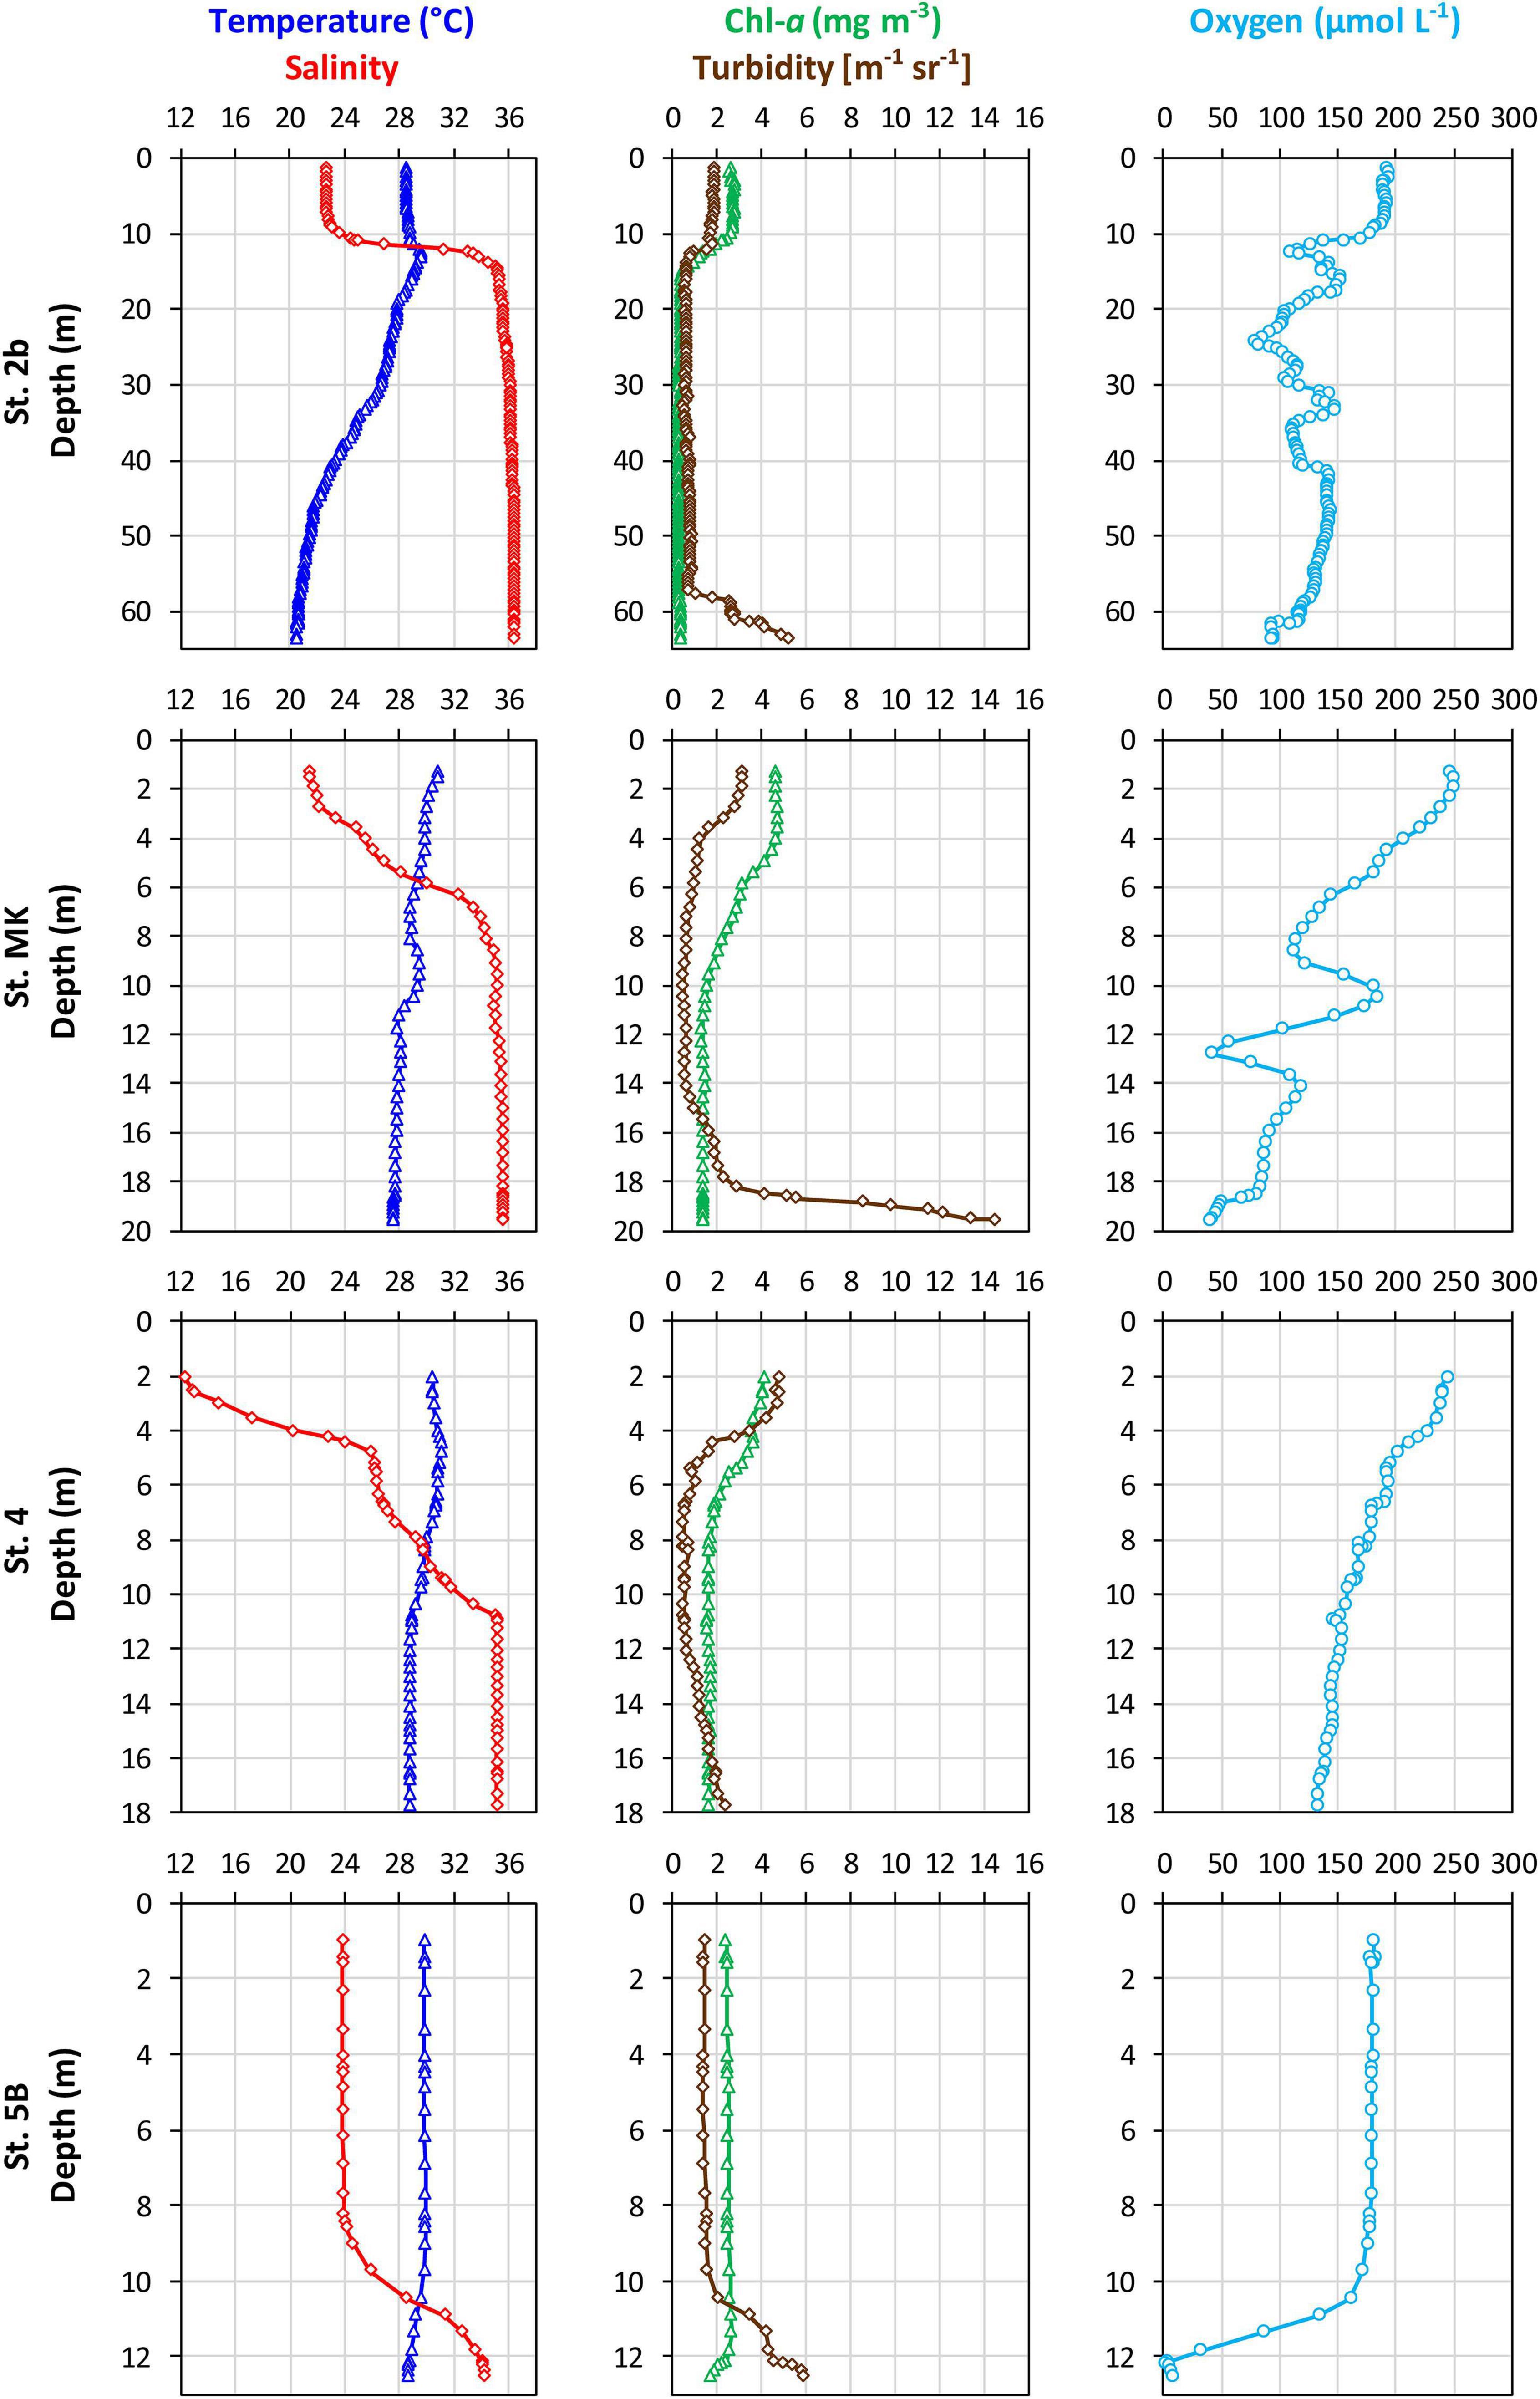
Figure 2. Water column distribution of temperature (°C), salinity, Chl-a concentration (mg m–3), turbidity (m–1 sr–1), and dissolved O2 concentration (μmol L–1) measured in situ with the CTD/Rosette at the four stations on the Louisiana shelf (in July-August 2017).
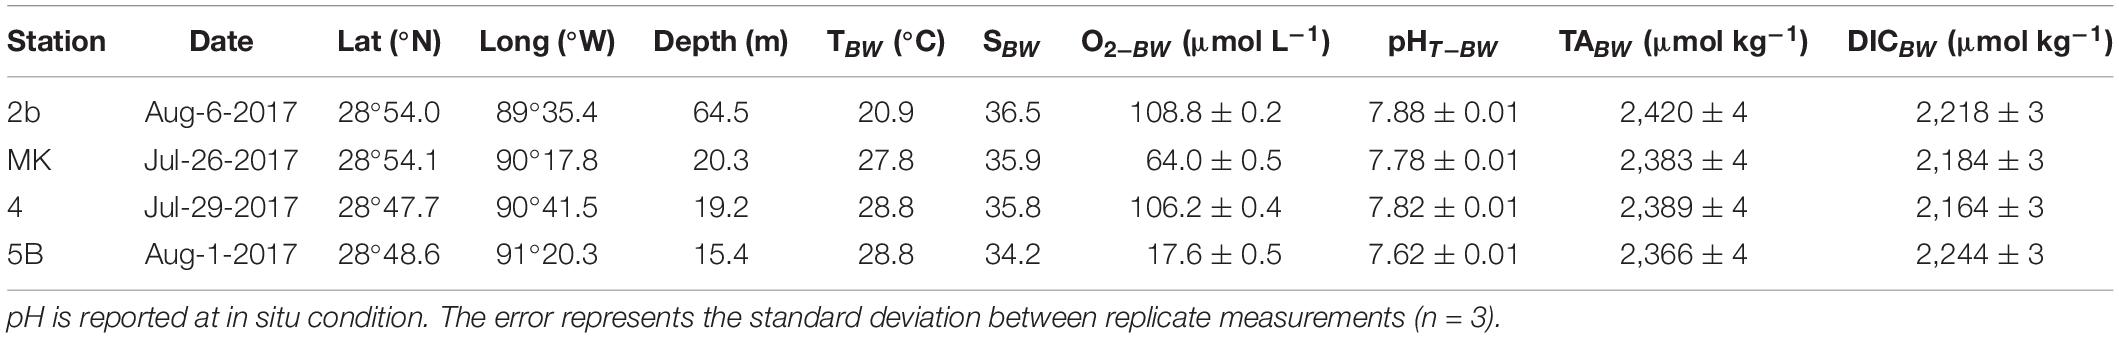
Table 1. Position, depth, and sampling date of the four stations on the Louisiana shelf (nGoM) along with parameters recorded in the bottom waters (T, S, O2, pH, TA, and DIC).
Bottom Water Oxygen Time Series
Dissolved oxygen time series in bottom waters are reported for 7 months at site C6C in the center of the seasonal hypoxic zone. The bottom water oxygen concentrations were consistent with independent measurements conducted during maintenance visits (red diamonds). The time series indicated extended periods of hypoxia in May-June, July, and August-September with re-oxygenation of the bottom waters in June after the tropical storm Cindy on June 21st and in September-October (Figure 3). Periods of rapid consumption of oxygen occurred during the summer: at the beginning of July (1st July), the oxygen concentration in the bottom waters dropped from 150 μmol L–1 to hypoxia (63 μmol L–1) in 30 h. Similarly, on July 16th, the oxygen concentration switched from hypoxia to near anoxia in only 2 days.
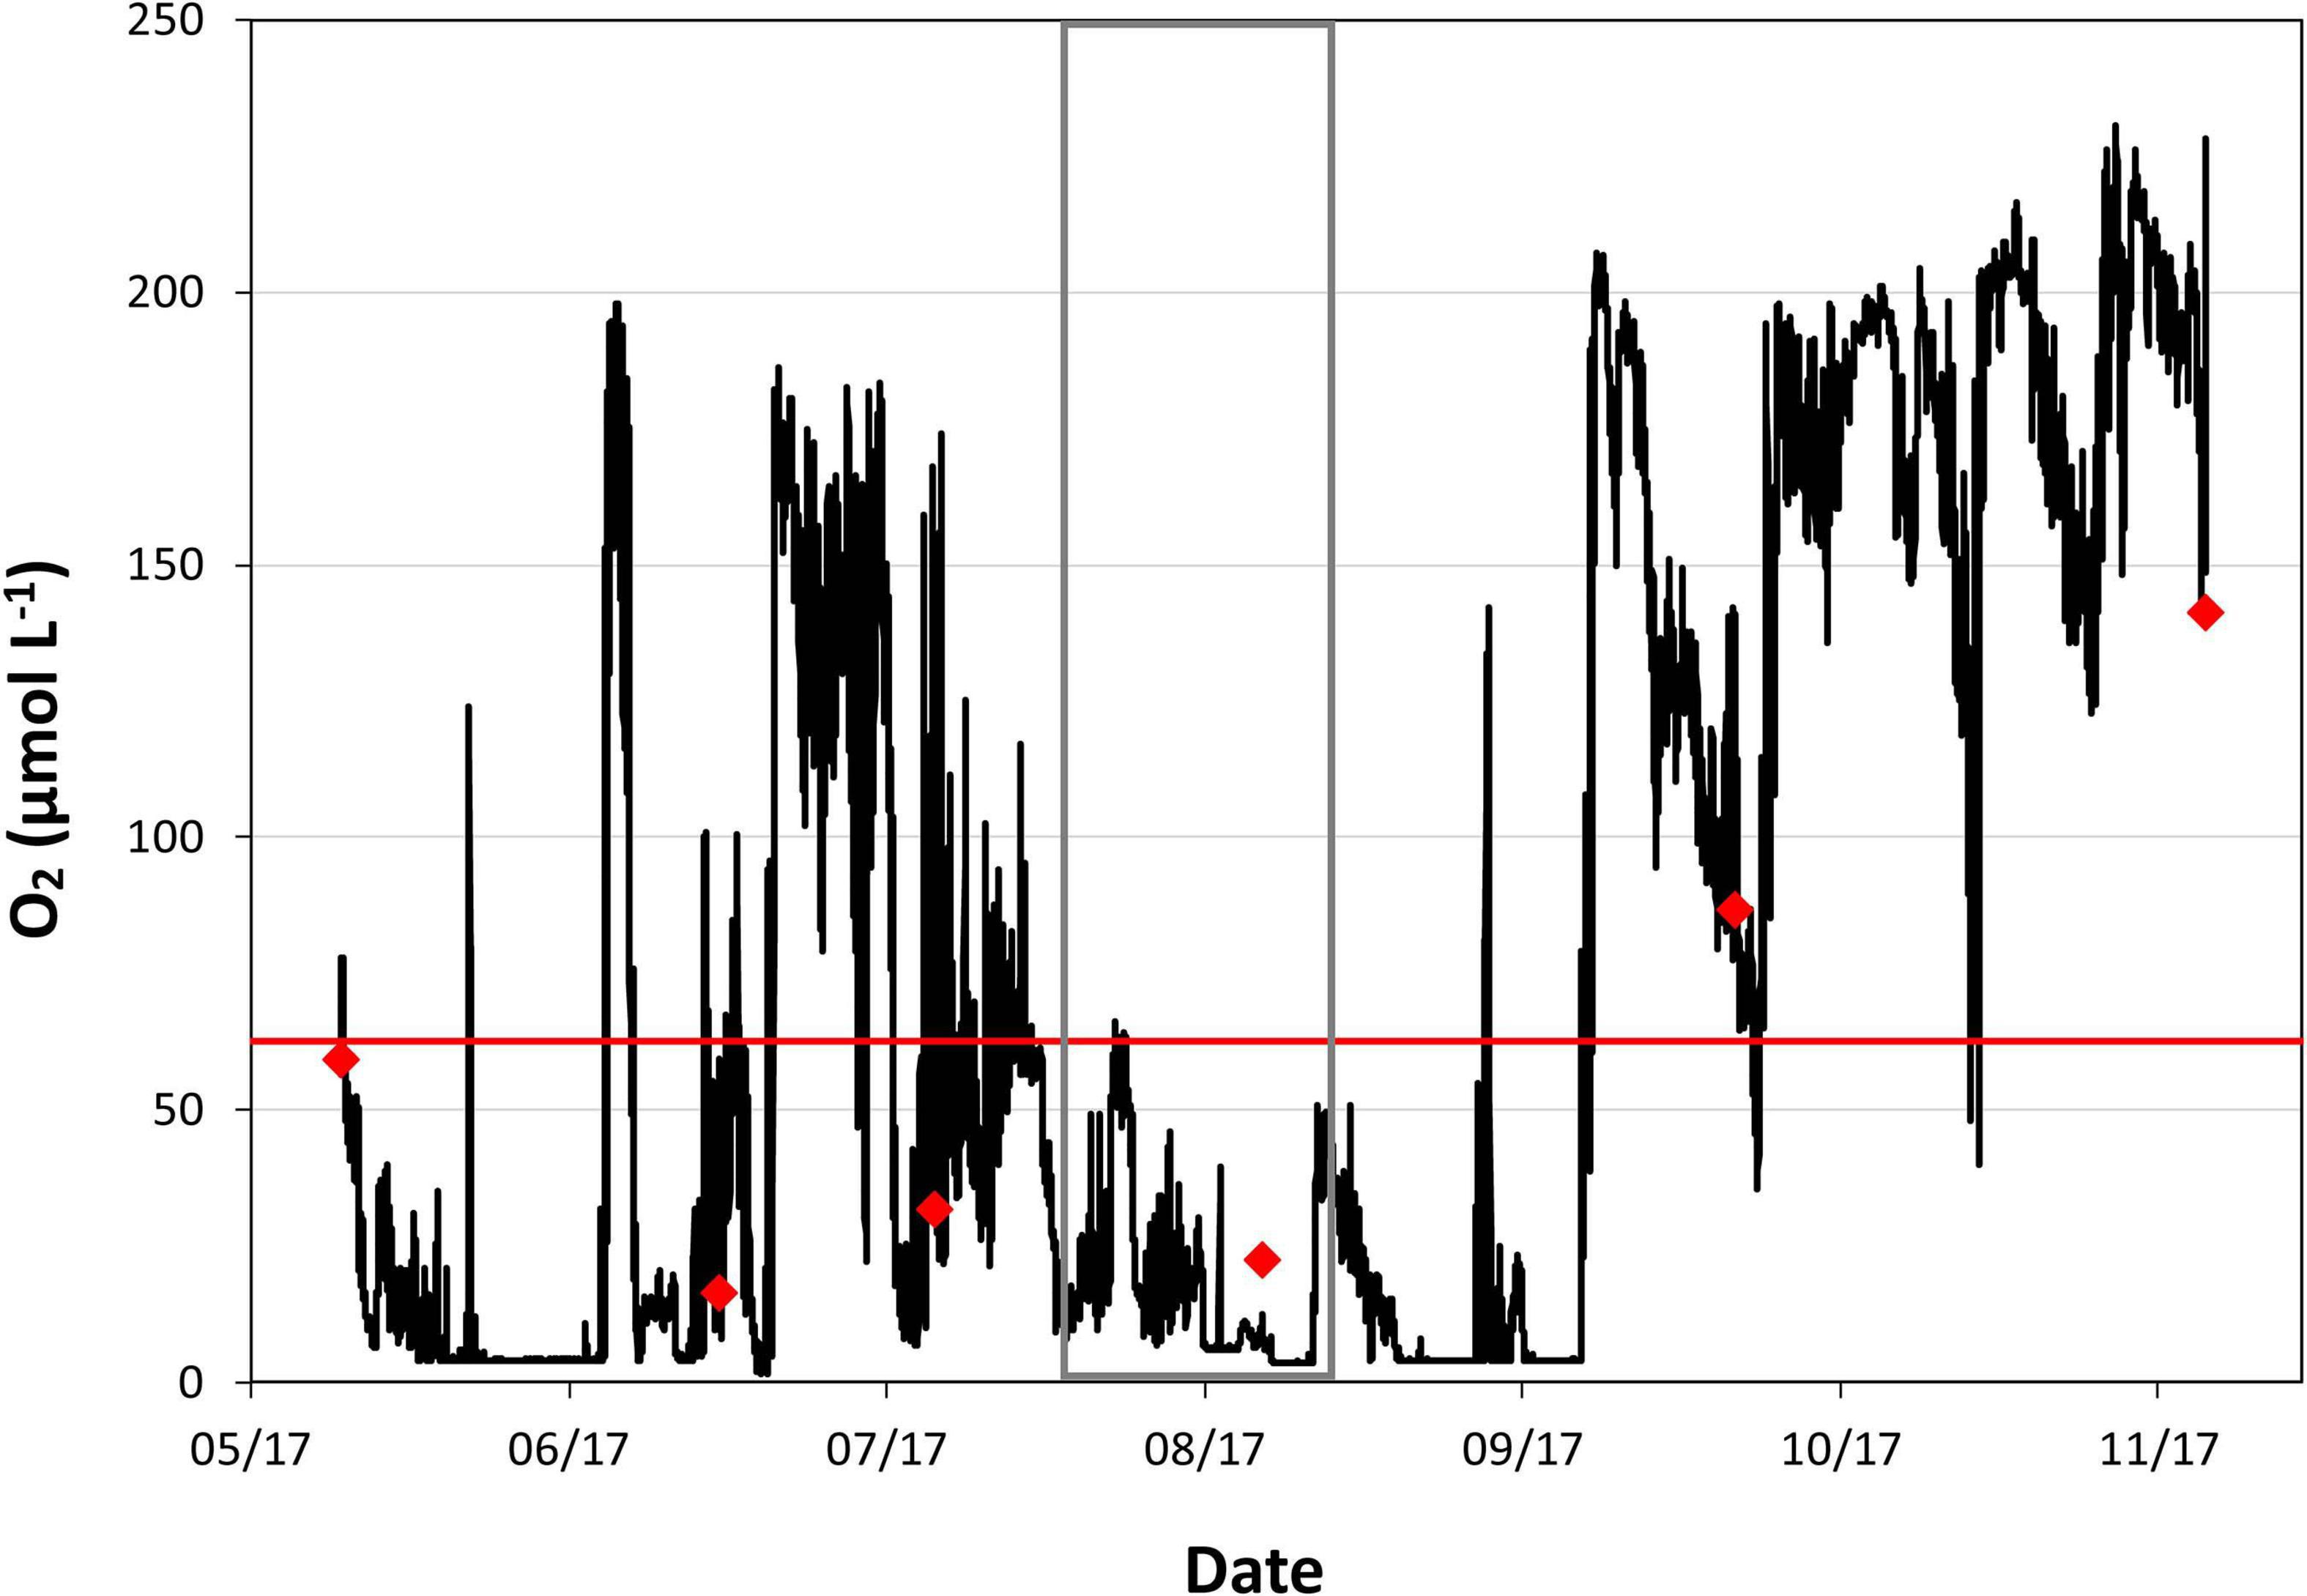
Figure 3. Time series of dissolved oxygen concentration in bottom water (μmol L–1) at Station C6C (O2 on Figure 1) showing substantial variability linked to tropical storms (Cindy on June 21st 2017) and subsequent water column mixing followed by rapid de-oxygenation at the beginning of July 2017 and later. The red line indicates the level of hypoxia (O2 = 63 μmol L–1). Red diamonds represent dates of sensor replacements and independent measurements of oxygen (see section “Materials and Methods”). Gray rectangle represents the sampling period during MissRhoDia 1 cruise.
Oxygen and pH Micro-Profiles
The in situ distribution of oxygen at the SWI revealed a large decrease of oxygen concentration in the first millimeters of the sediment (Figure 4). Stations MK and 5B, which showed the lowest oxygen concentration in the bottom water, nearly hypoxic and hypoxic respectively, showed highly reproducible profiles and were characterized by average OPD of 0.4–0.6 mm (Table 2). In contrast, St. 4 and 2b, in oxic conditions, displayed more heterogeneous sediment profiles with average OPD of 1.6–2.0 mm. DOU rates ranged between 5 and 15 mmol m–2 d–1 and decreased with decreasing bottom water O2 from St. 2b to St. 5B (Table 2).
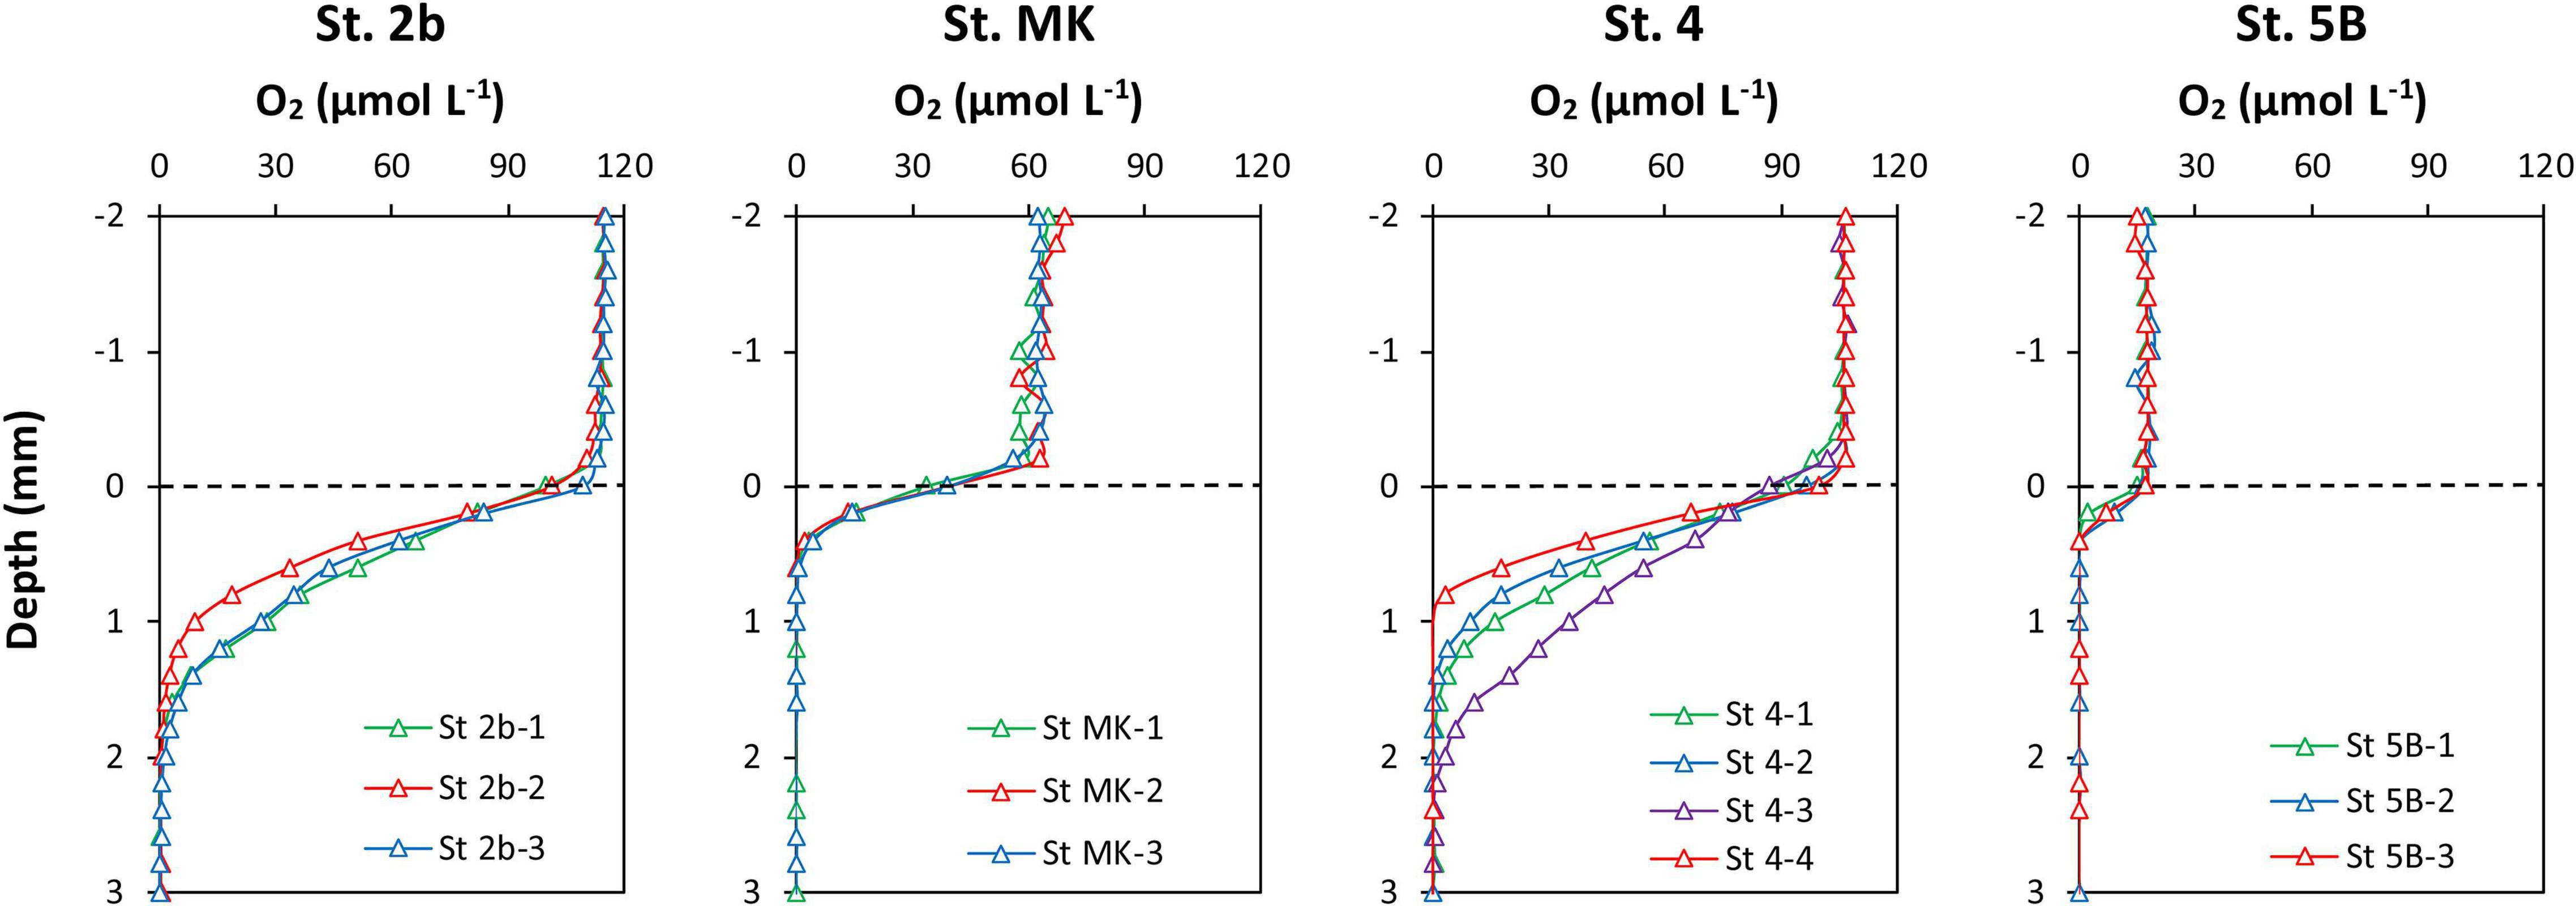
Figure 4. In situ dissolved oxygen micro-profiles obtained in sediments from the four stations on the Louisiana shelf in July 2017. The horizontal dashed line represents the sediment-water interface.
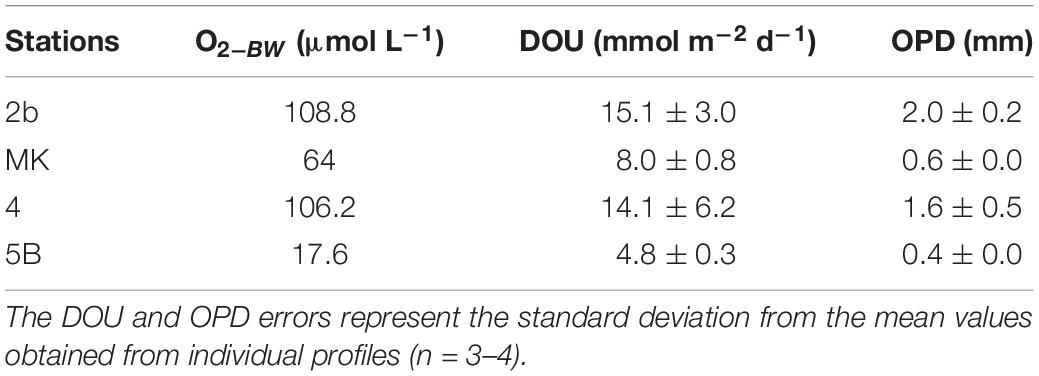
Table 2. Oxygen concentration in bottom water (O2BW), diffusive oxygen uptake (DOU), and oxygen penetration depth (OPD) at the Louisiana shelf in July-August 2017.
The in situ pHT microprofiles acquired using the benthic micro-profiler were characterized by large pH decreases below the SWI (Figure 5A). Two types of profiles were observed. At the shelf stations (4, MK, and 5B), pH showed a large decrease in the oxic zone (a few millimeters) and stabilized around 6.8–7.0 at depth. On the contrary, pH profiles at the river mouth station (St. 2b) showed a less intense decrease across the oxic-anoxic interface, a rebound below the OPD, followed by a secondary decrease to reach a minimum value around 7.4 ± 0.1 at depth (Figure 5). The pH stabilized within 2 cm below the SWI in all profiles.
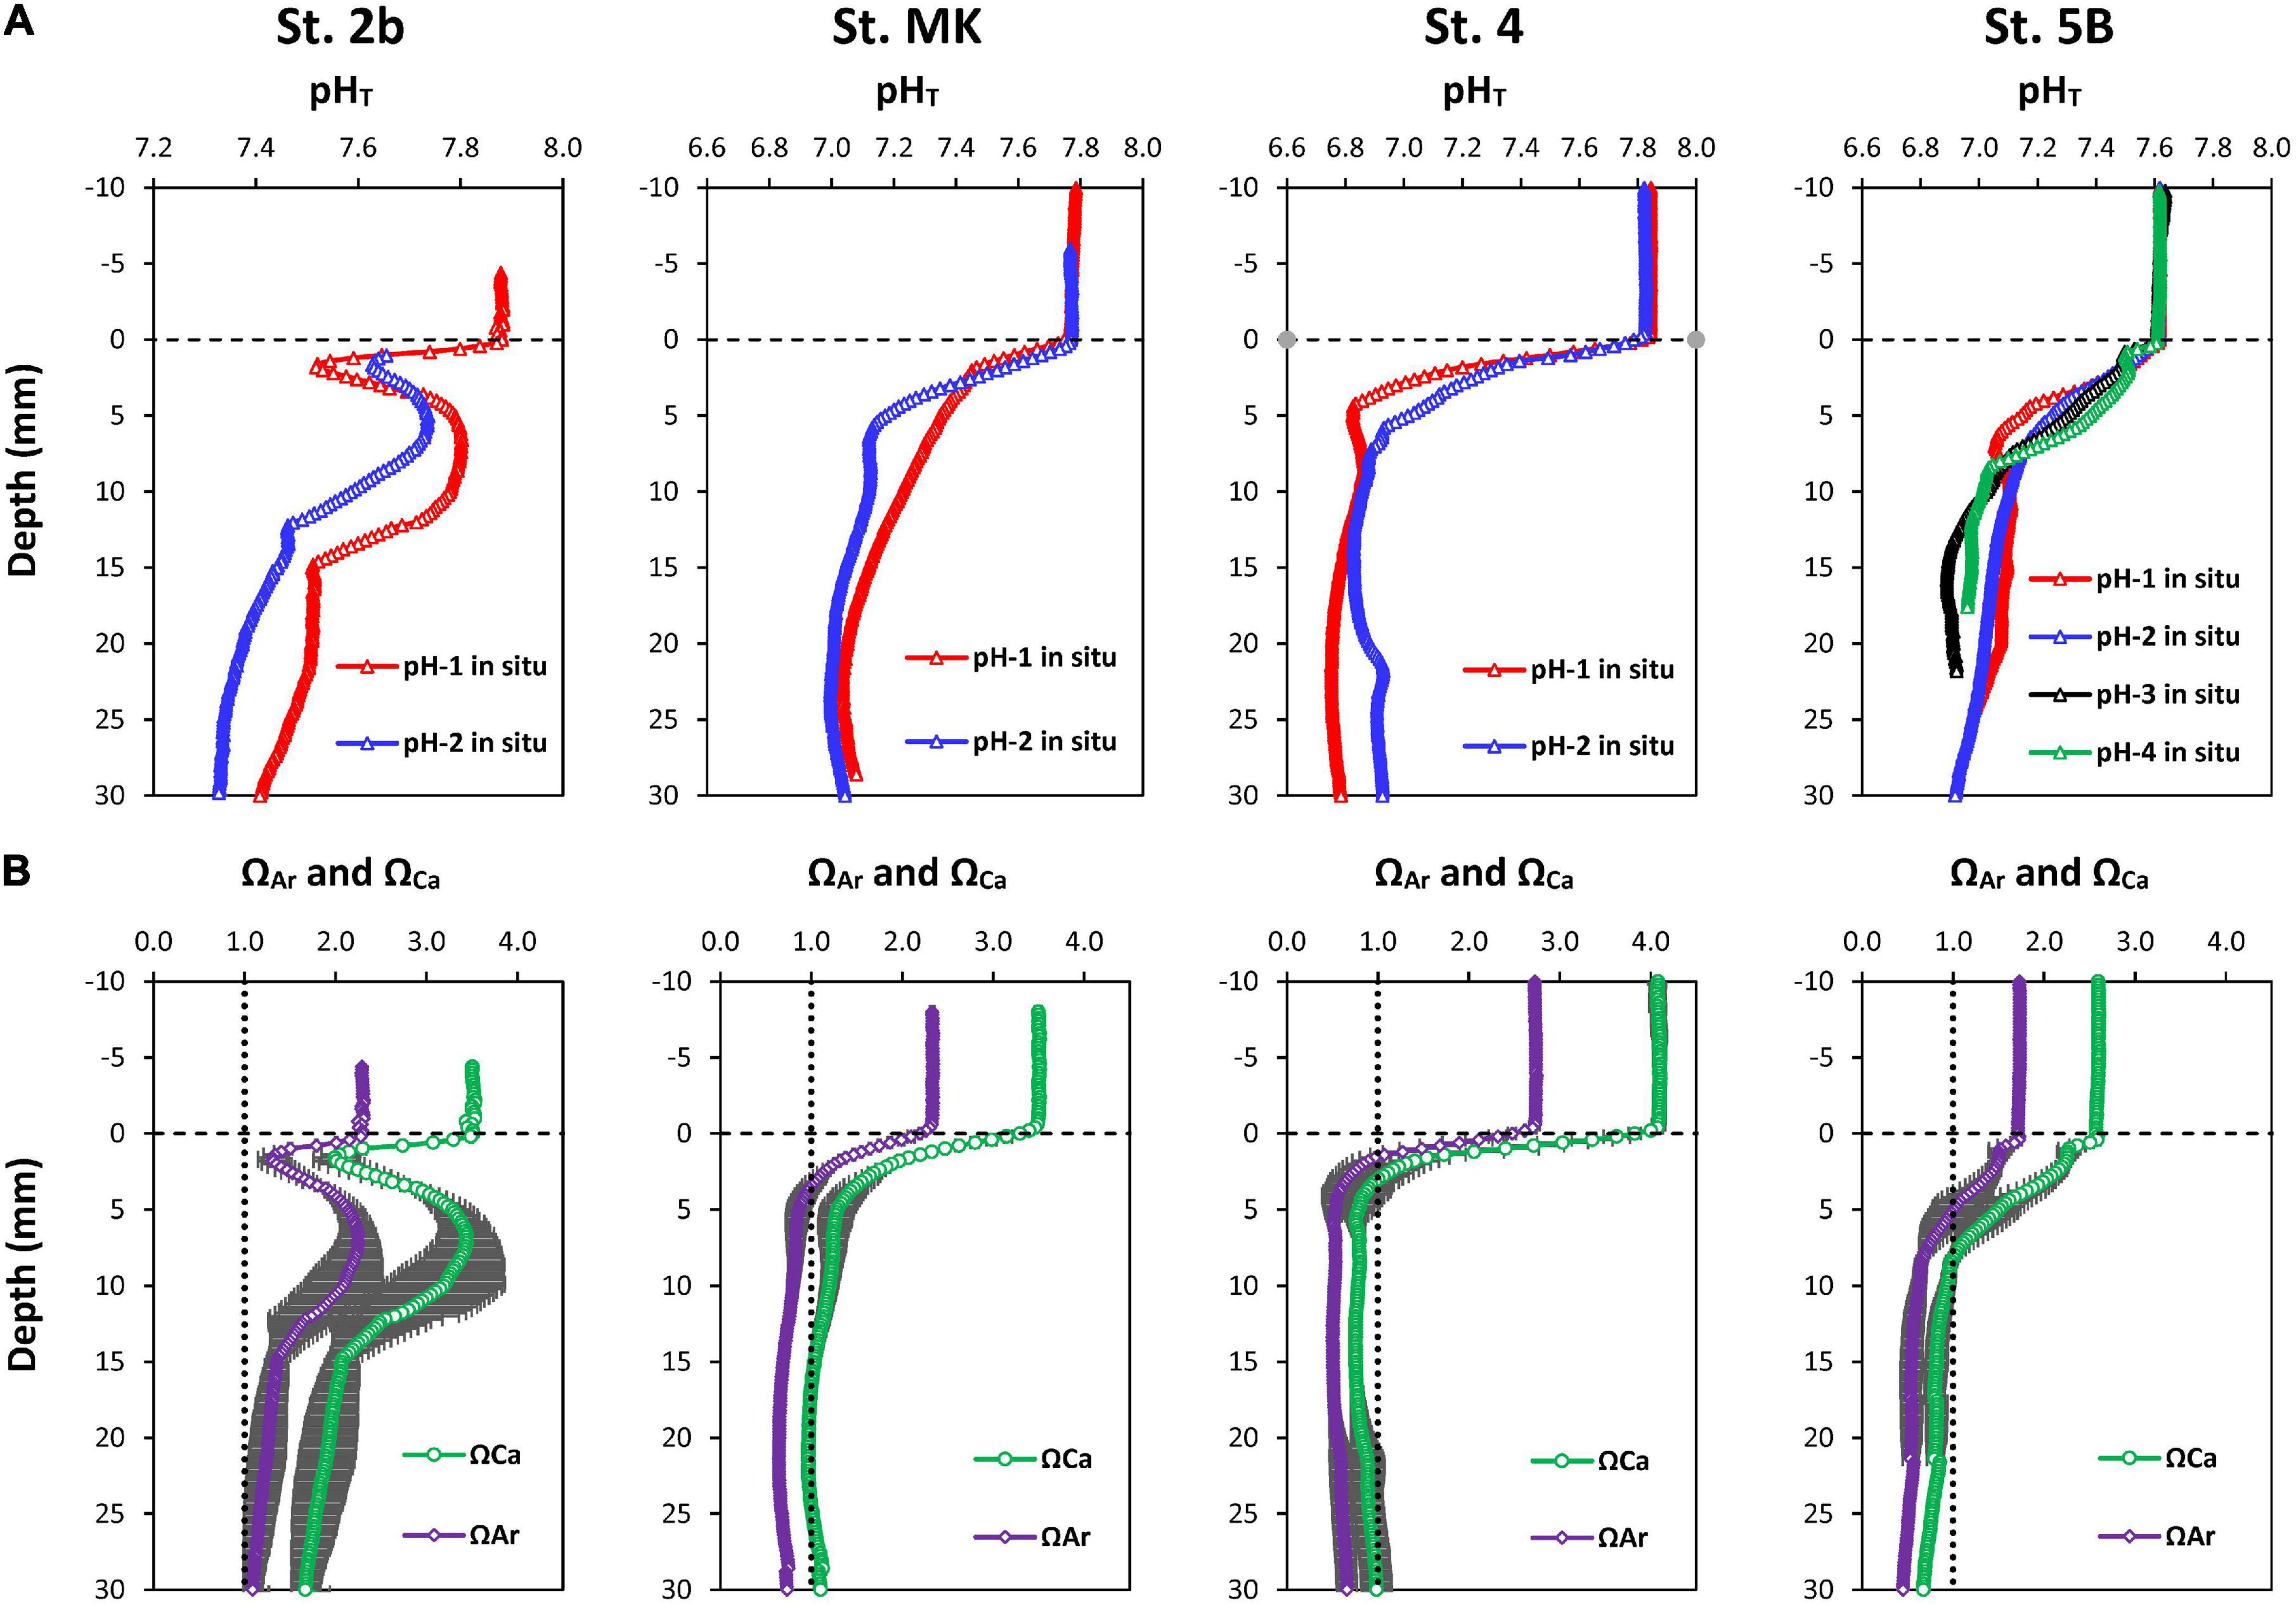
Figure 5. (A) Replicate pH micro-profiles obtained in situ at the sediment-water interface of the Louisiana shelf in July-August 2017. (B) Calcium carbonate saturation state with respect to calcite and aragonite with their uncertainties calculated for each station from the average pH micro-profile and interpolated TA profile using the CO2SYS program (see text for details). The vertical dashed line represents saturation with calcite or aragonite.
In bottom waters, ΩCa and ΩAr showed oversaturation with respect to calcite and aragonite. They ranged between 2.5 and 4 for calcite and between 1.7 and 2.6 for aragonite, with maximal values at St. 4 and minimal values at St. 5B (Figure 5B). At St. 2b, the pore water saturation state decreased with depth across the oxycline. Although pore waters remained oversaturated with respect to calcite (ΩCa > 1), pore waters reached aragonite saturation (ΩAr = 1) at the OPD at this station. As the pH rebounded deeper in the sediment, the pore waters returned to oversaturation with respect to both calcite and aragonite and decreased again during anoxic diagenesis. Similarly, at St. 4, MK, and 5B, ΩCa and ΩAr both decreased across the SWI from above saturation in the overlying waters to near saturation or undersaturation at the OPD. However, whereas ΩCa remained close to one at all stations by 3 cm depth, ΩAr showed clear undersaturation below the SWI reaching values as low as 0.50, 0.64, and 0.45 at depth at St. 4, MK, and 5B. Thus, dissolution of aragonite likely occurs in these sediments bathed with hypoxic and acidified waters, whereas calcite dissolution appears to be limited in surface sediments.
Pore Water Profiles and DET Distributions
Pore water profiles showed diagenetic footprints with generally increasing DIC, TA, NH4+, and DIP concentrations downcore (Figure 6). However, pore water profiles were characterized by contrasting signatures depending on their location: St. 2b displayed large DIC and TA production in pore waters with deeper concentrations greater than 10 mmol kg–1, accompanied by a large SO42– concentration decrease of around 10 mM. The production of DIC was correlated with an increase of up to 1 mM NH4+ and 300 μM DIP. Nitrate concentration showed a rapid decrease from the bottom water and stabilization at depth to low values (2–3 μM). Dissolved Mn and Fe showed large and similar increases in the first centimeters below the SWI (up to 300 μM) and a slow decrease with depth. It is noteworthy that Fe3+ dominated dissolved iron speciation (Figure 6). On the contrary, the diagenetic signatures at all other stations (St. 4, MK, and 5B) were different: they were characterized by slight increases in DIC and TA (2–3 mmol kg–1), with occasional decrease at depth such as observed at St. MK or 5B (Figure 6). Limited decreases in SO42– (<2 mM) were visible on profiles, and small increases of NH4+ and DIP concentration (<250 μM and <100 μM respectively) were also observed. Dissolved Fe and Mn showed subsurface peaks of smaller amplitude than St. 2b (around 50 μM Mn and 100 μM Fe) except at St. 5B where the dissolved Mn subsurface peak reached 300 μM.
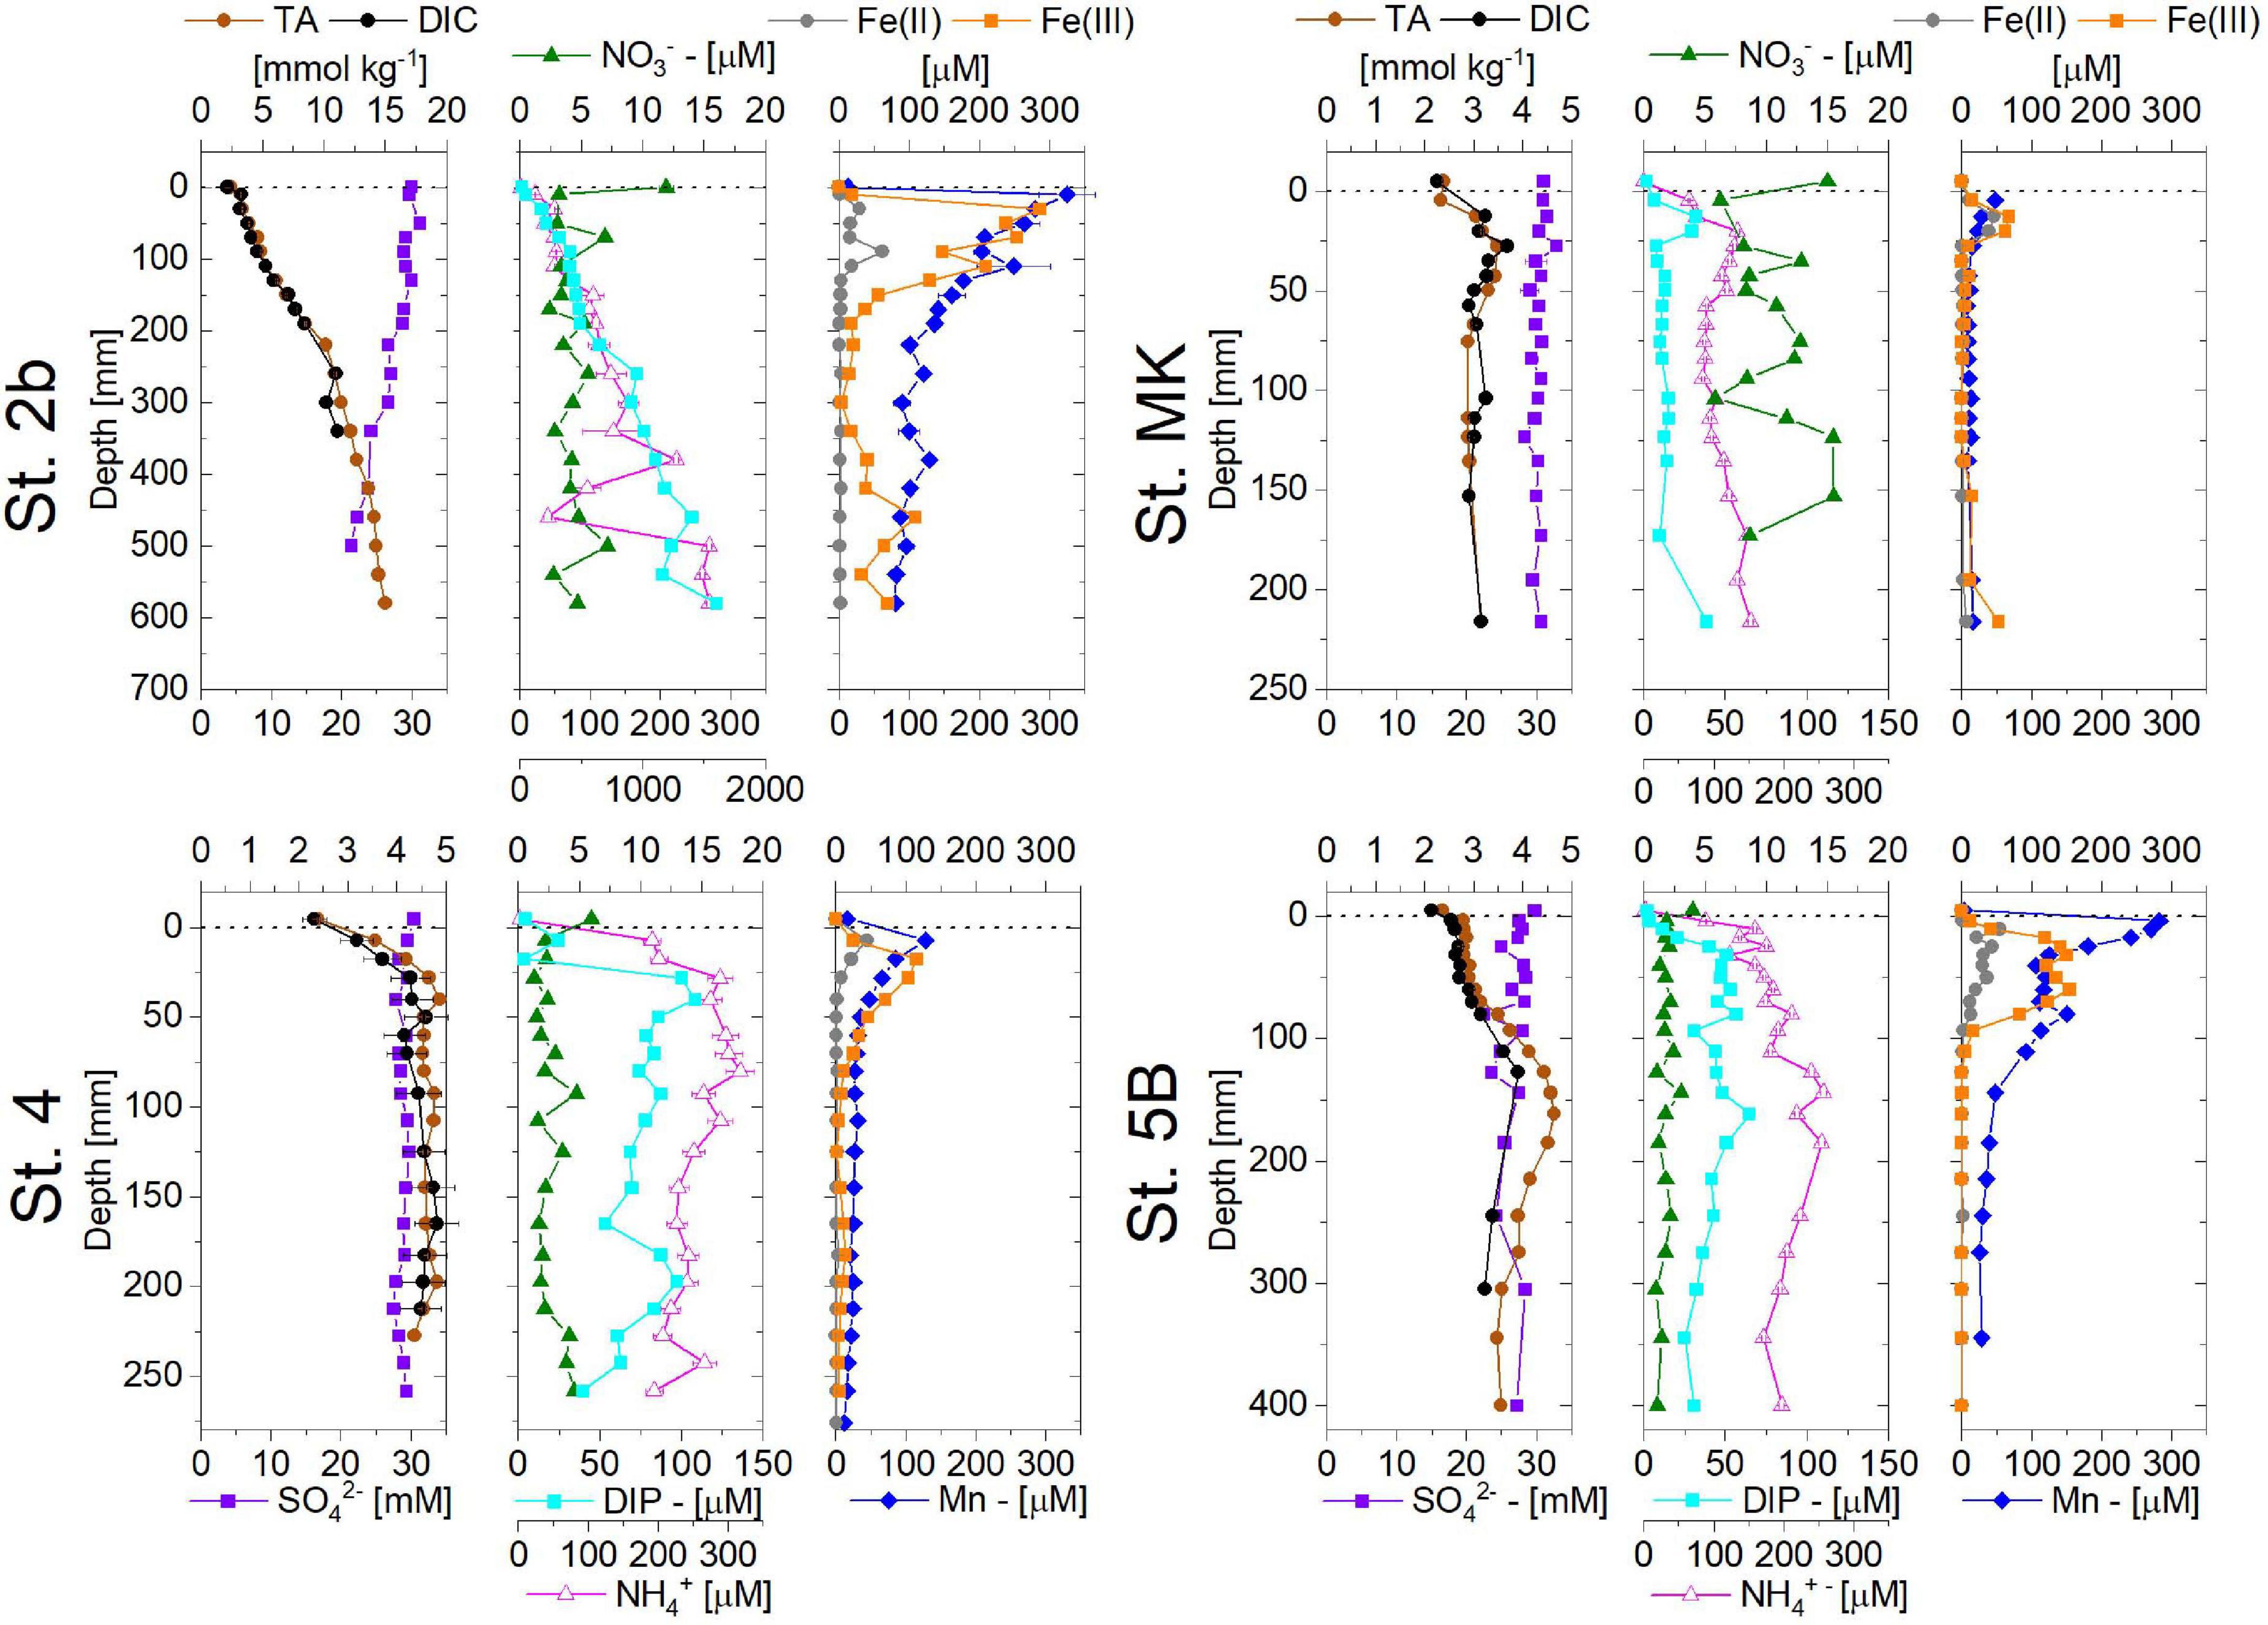
Figure 6. Pore water profiles of TA, DIC, SO42–, NO3–, NH4+, DIP, and dissolved Mn, dissolved Fe(II), and Fe(III) obtained at the four stations on the Louisiana shelf in July-August 2017. The dashed line shows the location of the sediment-water interface. Note that Station 2b has a different depth axis (down to 700 mm).
The 2D distribution of dissolved iron obtained with the DET probe revealed little lateral variability except at the onset of dissolved iron production (Figure 7). In particular, no sign of large disturbance by burrows or other biogenic structures were observed on 2D images except at St. 2b. This is confirmed by the small standard deviation of the pixel lines on the gel image as calculated in the 1-D profiles (black lines). Dissolved iron concentrations from extracted pore waters (red dots) and gel bands averaged over the same depth interval (black dots) were in a good agreement except for St. 2b where the dissolved iron peak in extracted pore waters were about 300 μM and located at 1 cm depth. Such variability between cores suggests heterogeneity at this station, which is the closest to the river delta. Dissolved iron was not detected above 0.5 cm depth at all stations except for St. 4, which showed a single enriched zone at the SWI. At St. 2b, dissolved iron appeared at 2 cm depth, reached 150 μM at 3 cm, and remained stable further down in contrast to the extracted pore water profile. At St. 4 and MK, dissolved iron was present just below the SWI and reached a maximum concentration of about 100 and 70 μM, respectively, near 2 cm depth. Below, dissolved iron concentration slowly decreased to 50 and 30 μM at 8 cm depth, respectively. Station 5B showed the highest Fed concentration in the DET, with 200 μM at 2.5 cm depth.
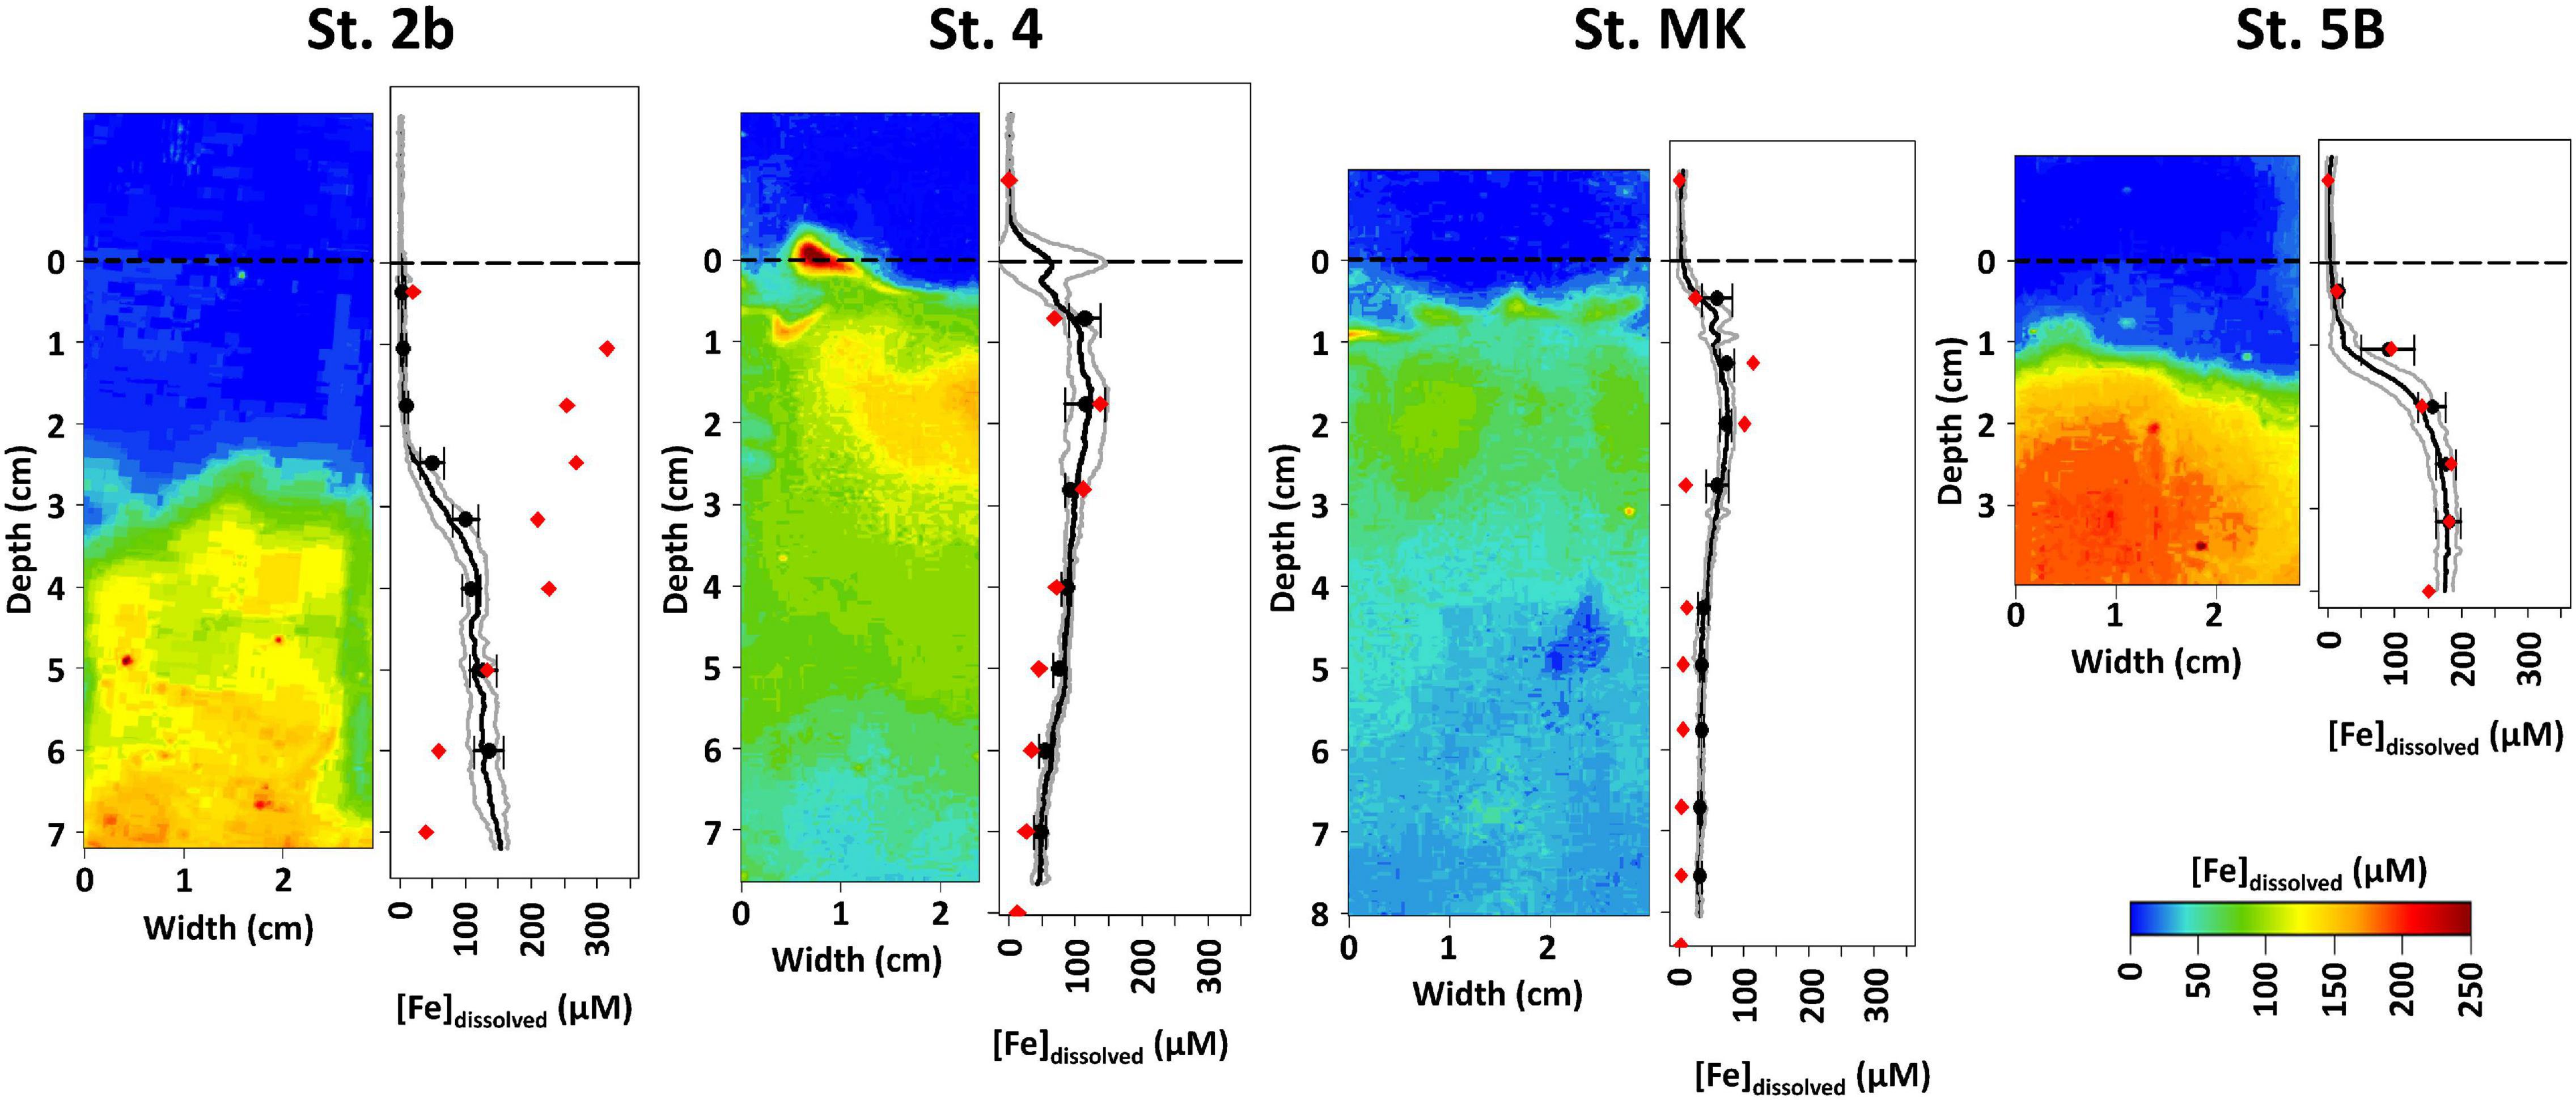
Figure 7. Dissolved iron (Fedissolved) spatial distribution obtained by diffusive equilibrium in thin films (2D-DET) (colored panel) and dissolved Fe averaged profiles obtained from DET (black dots and line) compared to extracted pore water profiles (red dots) at the four stations on the Louisiana shelf in July-August 2017. Gray contours represent 1σ of the distribution of dissolved Fe for each line of pixel.
Voltammetric Profiles
Voltammetric microprofiles measured immediately after sediment core collection revealed that metal reduction occurred at all stations albeit with different intensities (Figure 8). At St. 2b, dissolved Mn2+ showed a pronounced peak up to 1,000 μM at 5 cm with lower values in deeper layers, while dissolved iron showed a coinciding peak in org-Fe(III) rather than Fe2+ concentrations at 5 cm depth. At the other stations the dissolved metal signals were much lower except at St. 5B, which showed Mn2+ and Fe2+ peaks of 250 and 750 μM and pervasive occurrence of org-Fe(III) complexes in much larger current intensities. The large concentrations of dissolved Fe at St. 2b and 5B were also visible in the pore water extraction (Figure 6) and 2-D DET profiles (Figure 7).
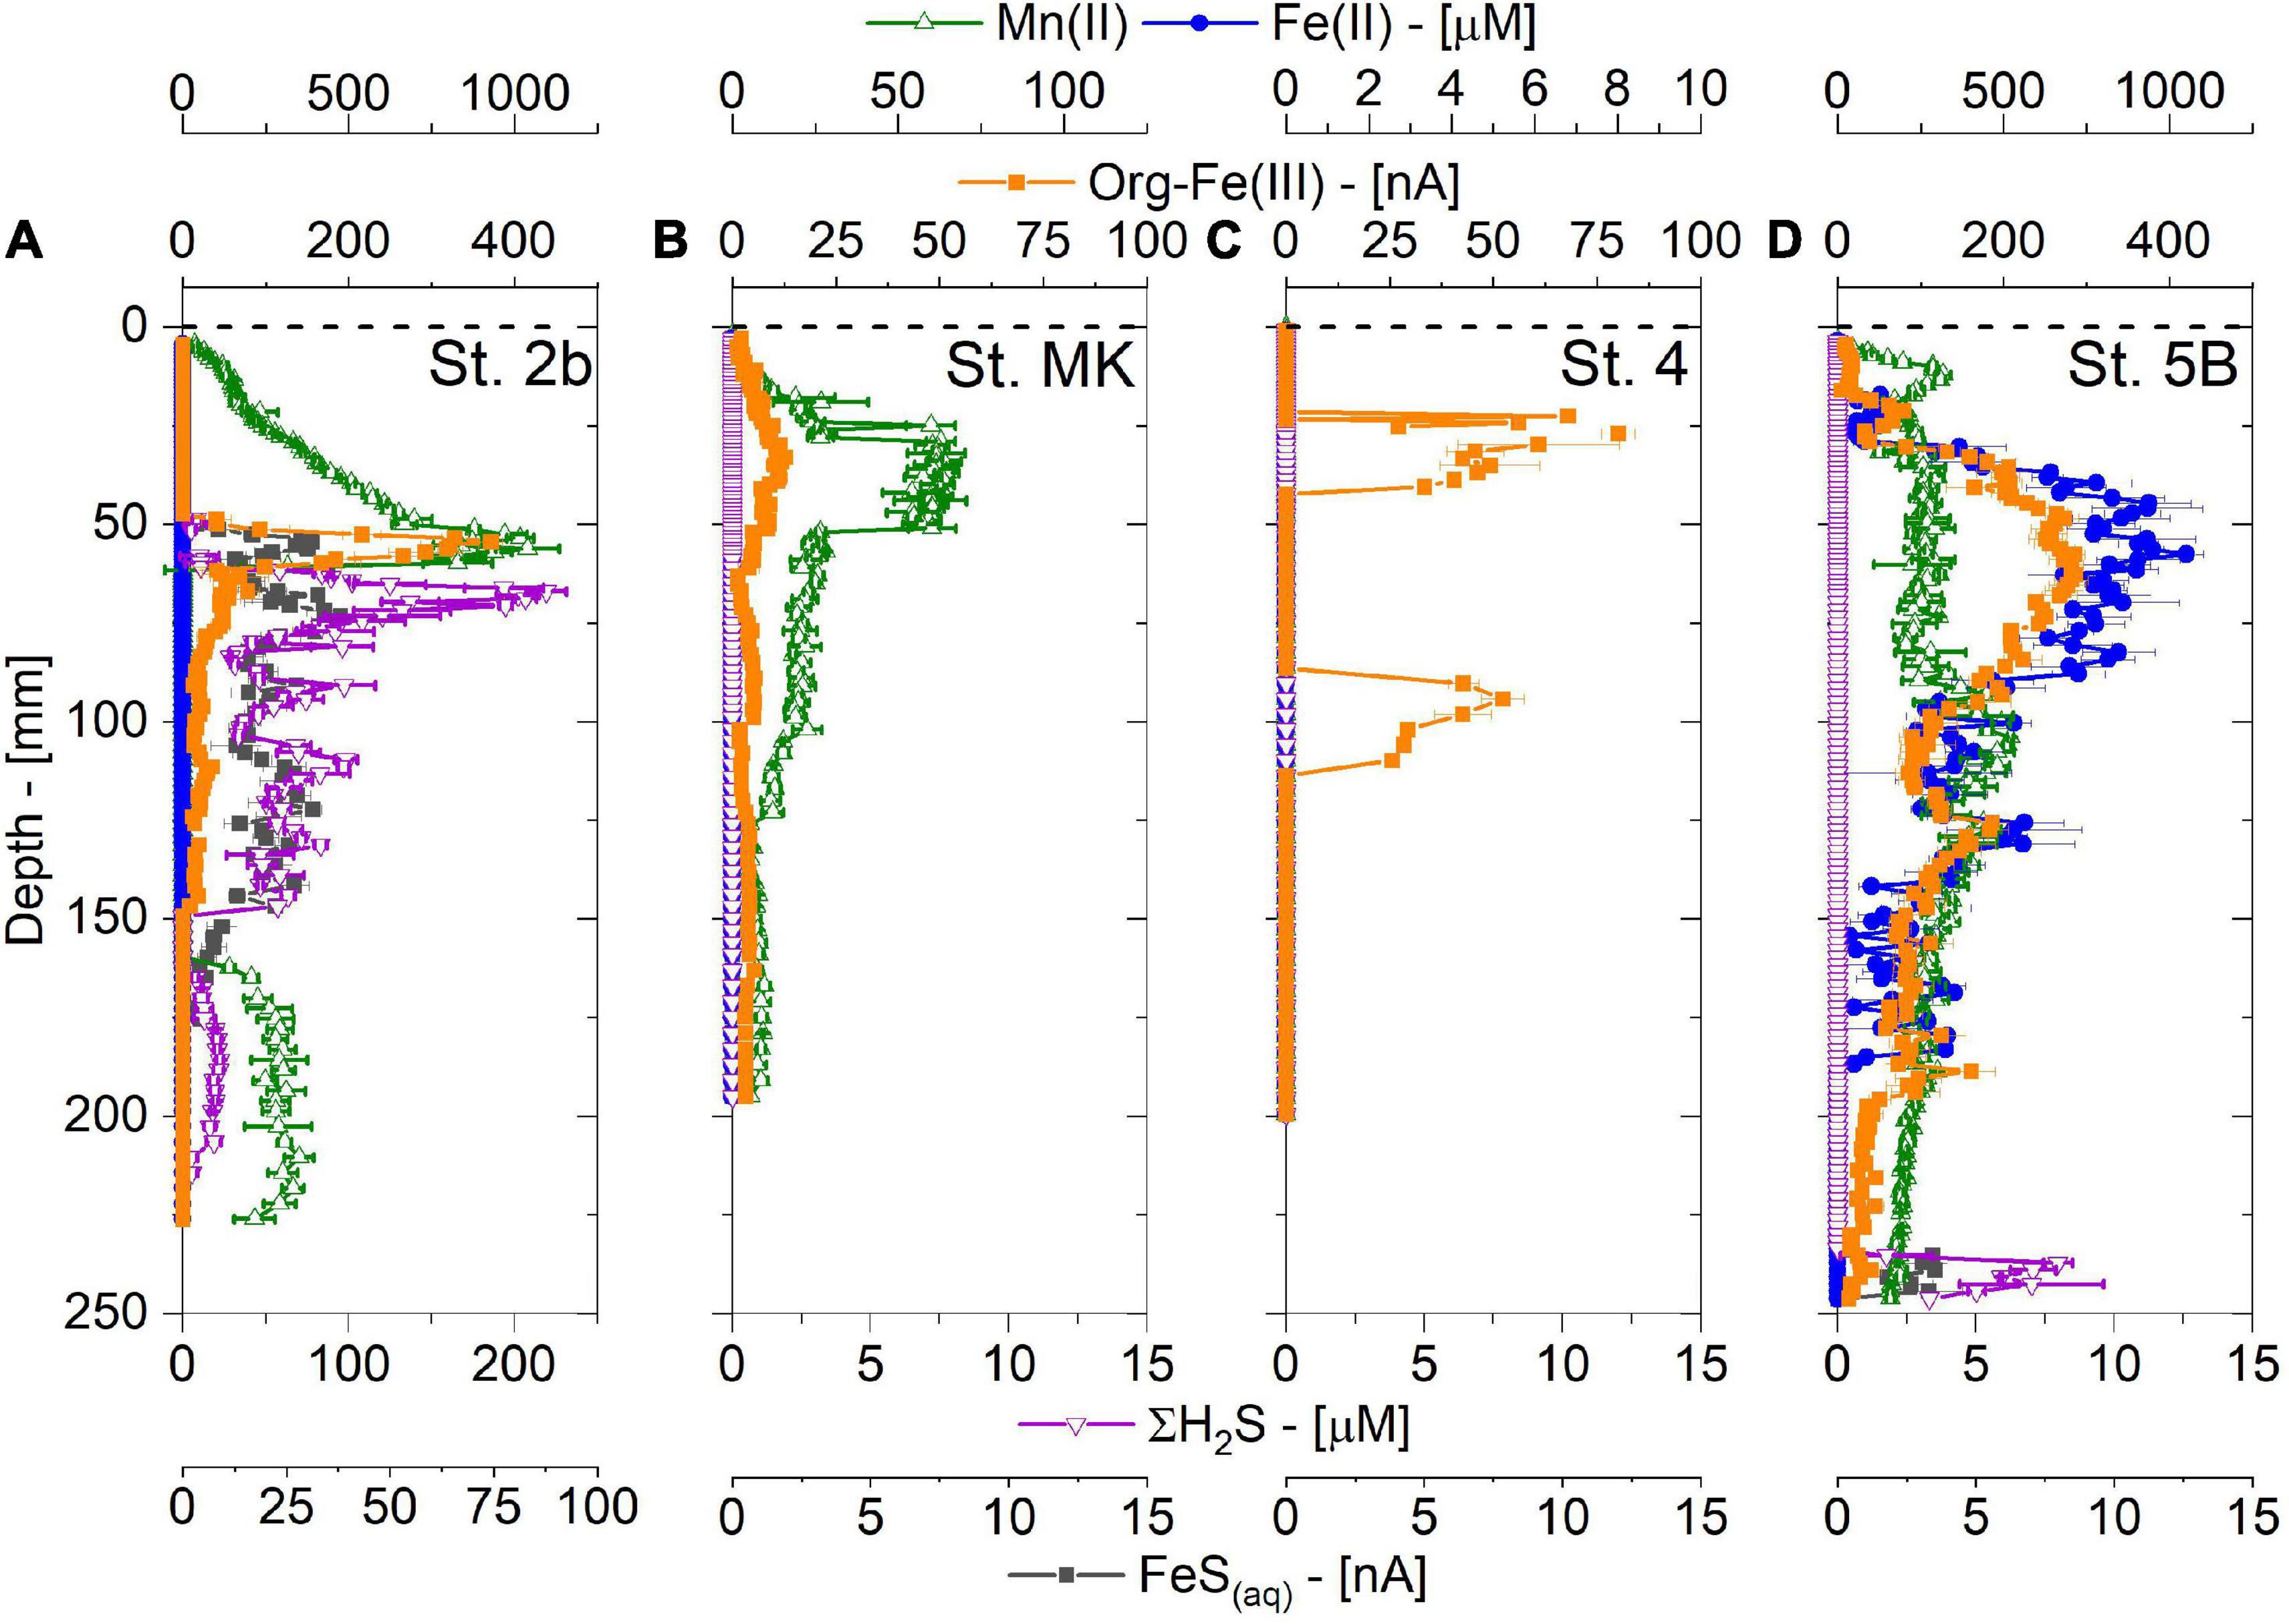
Figure 8. Depth profiles of dissolved Mn2+, Fe2+, organic-Fe (III), ΣH2S, and FeS(aq) obtained by Au/Hg voltammetric microelectrodes at the four stations (A–D for stations 2b, MK, 4 and 5B respectively) on the Louisiana shelf (nGoM) in July-August 2017.
The most striking difference between St. 2b and the other shelf stations was revealed by the total dissolved sulfide (ΣH2S) and FeS(aq) depth profiles. A ΣH2S peak reaching 200 μM was detected between 5 and 15 cm with simultaneous production of FeS(aq) clusters over the same depth range, suggesting particulate FeS formation at St. 2b which was corroborated by solid phase data (Owings et al., 2021). In contrast, the other stations did not display any detectable dissolved sulfide (except < 10 μM at depth at St. 5B), nor FeS(aq) clusters throughout these cores.
Discussion
The Louisiana shelf undergoes seasonal hypoxia and acidification, as a result of the biogeochemical mineralization of organic matter and subsequent oxygen consumption and DIC production in the stratified water column. The shelf waters and biogeochemical condition are influenced by the discharge of the Mississippi Atchafalaya River system, increased primary production and thermal warming in spring and summer (Rabalais et al., 2002; Cai et al., 2011; Laurent et al., 2017; Fennel and Testa, 2019). In this discussion, the oxygen depletion in the water column and its dynamics are explored, the effect of diagenetic processes in generating or maintaining hypoxia and contributing to acidification on the shelf is discussed, including the diagenetic processes underlying this oxygen consumption, and a conceptual framework is presented that may explain both the present results and biogeochemical data obtained from previous studies.
High O2 Consumption in the Water Column and at the Sediment-Water Interface
Oxygen depletion was particularly developed in the summer 2017 (Rabalais and Turner, 2019). Hypoxia was present all over the Louisiana shelf, in a continuous band from the Mississippi River delta to the Texas shelf at depths between 10 and 20 m. In fact, the hypoxic zone reached its maximum area in 2017, based on a record dating back to 1985 (Rabalais and Turner, 2019).
The shelf water column measurements from the present study showed a gradient of oxygen depletion from oxic at St. 4, to nearly hypoxic at St. MK and hypoxic at St. 5B (Figure 3). The water column of all stations revealed both thermal and haline stratification, although the vertical salinity gradient due to seawater dilution in the Mississippi River plume (6–10 m thick at our stations) contributed mainly to this stratification. As the plume was turbid, primary production was limited and Chl-a never exceeded 5 mg m–3 at the surface in contrast to previous studies that demonstrated larger chlorophyll content in the distal plume in spring and summer (Dagg et al., 2008; Lohrenz et al., 2008). The presence of a significant concentration of Chla in bottom waters can probably be related to freshly settled detritus as previously suggested (Dortch et al., 1994). The bottom boundary layer was characterized by an increase in turbidity (St. 2b, MK, and 5B), which can be related to the nepheloid layer (Corbett et al., 2004, 2007). Oxygen concentrations were at or below the hypoxic level at stations MK and 5B, showing a clear sign of oxygen consumption in the shelf waters (Turner et al., 2008). It has been proposed that the “time to reach hypoxia” from oxic conditions could be around 1 month on the Louisiana shelf (ranging from a few weeks to 2 months; Chin-Leo and Benner, 1992; Dortch et al., 1994; Amon and Benner, 1998) as a result of the aerobic microbial degradation of organic matter and water temperature. Time series in bottom waters at St. C6C indicated that oxygen consumption leading to the hypoxic threshold can be even more rapid in summer, reaching a few days (Figure 2). As the oxygen consumption in the nGoM bottom waters is attributed to the excess organic matter linked to high primary production during spring algal bloom (Rabalais et al., 2002; Turner et al., 2008) and microbial activity is high in the water column (Dortch et al., 1994; Amon and Benner, 1998), it can be inferred that the observed rapid drop in bottom water oxygen concentration is related to the mineralization of a large quantity of labile organic matter.
In addition to the rapid consumption of oxygen by aerobic microbial respiration in the stratified bottom waters, the surface sediment also plays a prominent role in consuming dissolved oxygen. Large SOC, which represents the sum of DOU and the fauna-mediated O2 flux, have been already documented in the area (Rowe et al.; 2002; Murrell and Lehrter, 2011; Lehrter et al., 2012), indicating that SOC could significantly contribute to the oxygen drawdown in bottom waters (20–30%; Dortch et al., 1994; Murrell and Lehrter, 2011; Feist et al., 2016). The data presented in Figure 4, displaying low OPD in sediments, suggest large oxygen consumption possibly linked to the degradation by aerobic respiration of organic matter deposited at the SWI. Indeed, the DOU rates (Table 2) were high at St. 2b, 4, and MK (respectively, 15, 14, and 8 mmol m–2 d–1) where O2 concentrations were above hypoxic level. The DOU rate was lower at St. 5B (4.8 mmol m–2 d–1) limited by O2 concentration below the hypoxic threshold. DOU is most often lower than SOC because bioirrigation is not considered in DOU (Glud et al., 1998; Glud, 2008). Despite this difference, the DOU rates obtained in this study were comparable to the SOC values obtained by Lehrter et al. (2012); 5.2 ± 2.5 mmol m–2 d–1 for mid shelf stations), Murrell and Lehrter (2011); shelf average 11.6 ± 2.2 mmol m–2 d–1), Rowe et al. (2002); 13 ± 3 mmol m–2 d–1 at St. C6 close to C6C and St. MK), and Berelson et al. (2019); 4 and 12 mmol m–2 d–1 at St. 1 and 9; Figure 1). These high oxygen consumptions indicate that the sediment plays a significant role in controlling bottom water oxygen concentrations. As dissolved O2 was confined to a narrow layer at the top of the sediment column, where labile OM from the water column accumulates (OPD = 0.5–2 mm, Figure 4), the consumption of oxygen could largely be due to the mineralization of labile organic matter recently deposited at the SWI. Dissolved metal re-oxidation may also play a role in DOU rates, as diffusive flux calculations indicate that a maximum of 20% of oxygen uptake could be used for Mn re-oxidation at St. 5B. SOC would therefore participate in the overall oxic mineralization and O2 consumption in the bottom waters. It is noteworthy that this large oxic mineralization at the SWI would also contribute to the acidification of bottom waters, as aerobic respiration produces metabolic CO2 with negligible TA, therefore decreasing the bottom water pH. This is apparent on the gradient from St. 4 to St. 5B where bottom water pH drops by 0.2 units and O2 from 106 to 18 μmol L–1 (Table 1). The pH and O2 values measured in the bottom water are in good agreement with previous data reported for the Louisiana Shelf (see Annex 1; Cai et al., 2011).
Low Intensity of Early Diagenesis in Shelf Sediments
A close examination of the pore water profiles obtained from the Mississippi River delta (St. 2b) to the shelf reveals a contrasted situation. A large increase in metabolite concentrations was observed at St. 2b near the Mississippi River delta where previous papers have indicated high accumulation of terrestrial organic matter (Bianchi et al., 2002). DIC, NH4+, and DIP concentrations reach values of 10 mmol kg–1, 1.5 mM, and 200 μM, respectively (Figure 6), which together indicate a high mineralization activity in these sediments. At the same time dissolved iron and manganese peaked in surface pore waters with concentrations above 300 μM in the first few centimeters (Figures 6–8) indicating significant Fe and Mn reductions. Accompanied by the large decrease in SO42– (Figure 6) and the presence of dissolved sulfide and FeS(aq) (Figure 8), pore water data indicates active sulfate reduction at this station (St. 2b).
In contrast, metabolite concentration increases observed at the other shelf stations (4, MK, and 5B) were limited with maximum DIC concentrations of 5 mmol kg–1 (ΔDIC < 3 mmol kg–1), and low NH4+ production (<100 μM). At the same time, low SO42– decrease in pore waters (ΔSO4 < 2 mM) was observed at these three stations. The shelf pore water data are similar to other profiles obtained in the same area [St. C06 – Devereux et al. (2019); St. Z02 – Devereux et al. (2015) and Laurent et al. (2016)]. In shelf sediments other than St. 2b, sulfate reduction seemed to be minimal as shown by the absence of sulfide or FeS(aq) clusters in pore waters (Figure 8). Only metal diagenesis (Mn and Fe reduction) appeared to be active in shelf sediments. Both pore water extractions (Figure 6) and 2-D DET profiles (Figure 7) displayed remarkably similar dissolved Fe(II) profiles, which showed distinct and coherent peaks (80–300 μM) in subsurface sediments indicative of substantial iron reduction in these sediments. Dissolved Mn and Fe peaks were weaker at St. 4 and MK than at St. 5B. This latter station is located westward under the direct influence of the Atchafalaya River, which delivers Mn- and Fe-rich detrital particles to fuel the sedimentary Mn and Fe cycles. It is noteworthy that St. 2b shows similar enhanced Fe and Mn diagenesis probably due to similar inputs of detrital material by the Mississippi River (Owings et al., 2021). Sulfate reduction generally constitutes a major diagenetic pathway in coastal marine sediments which receive significant organic matter inputs (Canfield et al., 1993). The low decrease of SO42– in pore water profiles at St. 4, MK, and 5B is clearly indicative that early diagenesis in Louisiana shelf sediments is not intense compared to Station 2b.
In order to quantify the organic carbon mineralization in these shelf sediments, the PROFILE software (Berg et al., 1998) was used and fitted to the DIC profiles of the four investigated stations. As bioirrigation is a major control on benthic fluxes in coastal areas (Glud et al., 1998) and some profiles show a double-bend pattern typical of irrigated profiles (e.g., the DIC profile at St. 2b), different bioirrigation rate constants (α in y–1) were used to calculate integrated DIC production rates in these sediments. In each case, the best fit of the PROFILE model to the data is displayed in Table 3.
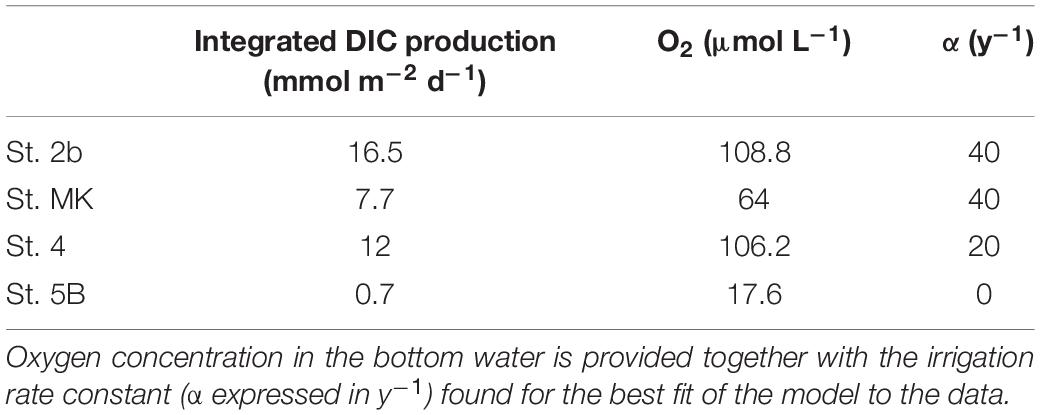
Table 3. Integrated DIC production (in mmol m–2 d–1) for the station studied in 2017.
Integrated DIC production calculated using the PROFILE model at the River delta station 2b matched the carbon remineralization (16.5 mmol m–2 d–1) rate calculated for the same station from a complete diagenetic model run at steady-state (Owings et al., 2021). Integrated DIC production rates revealed that the mineralization rate at this station (St. 2b) is greater than the average mineralization rate at the other stations on the Louisiana shelf (St. 4, MK, and 5B), even though mineralization rates are highly variable with a strong positive link to bottom water oxygen levels (Table 3). The large DIC production rate at St. 2b is accompanied by a large SO42– decrease which indicates prevalent sulfate reduction in sediments near the Mississippi River delta. In contrast, lower DIC productions at St. 4, MK, and 5B (average 6.8 ± 5 mmol m–2 d–1) were related to limited SO42– decreases indicating low sulfate reduction rates. These findings indicate that anoxic diagenesis was not favored in the nearly-hypoxic (MK) and hypoxic (5B) zones of the Louisiana shelf. These results rather suggest that manganese and iron reduction were the most active pathways and produced the majority of DIC at these two stations, while sulfate reduction was negligible.
Integrated DIC production rates from the present study on the Louisiana shelf (0.7–12 mmol m–2 d–1) can be compared to benthic DIC fluxes at steady-state. They fall in the lower range of core incubations measurements (averages 15.2 ± 2.1 mmol m–2 d–1 for shelf stations; Lehrter et al., 2012) and are lower than in situ benthic DIC fluxes measured in August 2011 (18–59 mmol m–2 d–1; Berelson et al., 2019). In the case of the Lehrter et al. (2012) study, interannual and seasonal variability may explain the observed difference as half of the measurements were conducted during spring, before deposition of the spring bloom to the sediment. Nevertheless, the benthic DIC fluxes measured at station Z02-Z03 (equivalent to station MK and 5B) were approximately double (or triple) the integrated DIC production rates calculated in the present study. The largest benthic DIC flux (59 mmol m–2 d–1; Station 9) in Berelson’s study could be attributed to a diagenetic hot spot, as the other fluxes (stations 1 and 8) hovered around 18–19 mmol m–2 d–1, in the upper range of Lehrter’s values. Thus, benthic DIC fluxes, either obtained by in situ measurements or ex situ sediment incubations, showed values that were approximately two to three times larger than the internal production of DIC calculated in the present study using DIC depth profiles and bioirrigation. One possible bias of this comparison is the fact that fluxes and integrated DIC production rates were obtained from different years and seasons. Indeed, although previously published DIC fluxes cover a large range, their average shows a clear difference by a factor of two to three with the integrated DIC production rate calculated in this study.
We can thus hypothesize that such differences could be related to the efficient mineralization of organic matter at the SWI, which is not captured by standard centimeter-scale pore water profiles used for PROFILE calculations. In this hypothesis, oxic mineralization and metabolic CO2 production at the SWI could be a major component of DIC fluxes measured by whole core incubations despite not being detected in pore water profiles due to the low vertical resolution. Calcium carbonate dissolution near the SWI is another potential process that may increase DIC fluxes (Rao et al., 2014). The surface sediment (Figure 5B) showed near-saturation with respect to calcite (ΩCa = 0.8–1) and undersaturation with respect to aragonite (ΩAr = 0.5). Although carbonate minerals in these sediments probably consist of detritic calcite and foraminifera shells (calcite), to the best of our knowledge, the type of calcium carbonate present in the Louisiana shelf sediments is not known. More importantly, the CaCO3 content of these sediments is apparently low, with an average 0.5% inorganic carbon by weight (Gordon and Goni, 2004). As the calcium carbonate content is low, with an even lower proportion of aragonite, and porewaters were saturated with calcite in surface sediments, it is reasonable to assume that carbonate dissolution is limited and does not contribute significantly to the DIC flux.
Accordingly, if benthic DIC fluxes based on core incubations or benthic chamber measurements (18–19 mmol m–2 d–1; Berelson et al., 2019; 15.2 mmol m–2 d–1; Lehrter et al., 2012) were two to three times larger than internal sediment production of DIC based on depth profiles (6.8 ± 5 mmol m–2 d–1 for station 4, MK, and 5B), the present hypothesis implies that a significant proportion of the benthic DIC production could take place at the SWI by deposition and rapid remineralization of organic matter. The proportion of “surface mineralization” could be even greater for station 5B where less mineralization was calculated from the depth profiles (Table 3). This hypothesis clearly requires field-based measurements of concomitant DIC fluxes and concentration profiles for testing (e.g., Rassmann et al., 2020).
Overall, the findings of the present study based on oxygen time series in the water column, DOU calculations, and DIC flux discrepancy between benthic exchange fluxes and integrated rates suggest that consumption of organic matter at stations 4, MK, and 5B on the Louisiana shelf was intense in the water column and at the SWI (first few millimeters), but that recycling of organic matter was limited in deeper sediments (2–20 cm).
Proposed Mechanism: Dysfunction of Bioturbation During Hypoxic Stages
Numerous publications have described the life conditions of demersal and benthic fauna in the context of hypoxia (Rabalais et al., 2001a, b, 2002; Levin et al., 2009; Middelburg and Levin, 2009; Briggs et al., 2015; Devereux et al., 2019; Rabalais and Baustian, 2020). Hypoxic areas are known as “Dead Zones” due to the scarcity of fishable species that leave the area when oxygen is below the hypoxic threshold of 63 μmol L–1 (Rabalais et al., 2001b). Below this threshold, burrowing invertebrates are stressed and ultimately die as oxygen levels decrease and persist over time (Rabalais et al., 2002; Levin et al., 2009; Middelburg and Levin, 2009; Metzger et al., 2014; Riedel et al., 2014). It can thus be hypothesized that the bioturbation function of the ecosystem, which relies on macrofaunal invertebrates’ activity, is largely affected by hypoxia. Yet, bioturbation, when active, is the major transport of organic substrate to deeper sediment layers and thus fuels microbial activity at depth (Burdige, 2006). Information on bioturbation or bioirrigation during the summer hypoxic phases in the Louisiana shelf is scarce. Briggs et al. (2015) used sediment profiling imagery (SPI), X-rays, and radionuclides to investigate biogenic structures and bioturbation activity on the Louisiana shelf in spring and late summer (September) and concluded that sites with a high exposure to seasonal hypoxia (75%) displayed smaller biogenic structures at a lower density than less impacted sites. At these stations located on the fringes of hypoxia (Rabalais and Baustian, 2020), they showed that bioturbation recovered rapidly in September, after an oxygen intrusion event in the bottom waters. A similar observation was made by Devereux et al. (2019) in late September, with oxic waters and active bioturbation in the sediment of seasonally hypoxic zones. Baustian and Rabalais (2009) and Rabalais and Baustian (2020) indicated that sediments in area of the northern GoM severely impacted by seasonal hypoxia contain smaller, less diverse infauna with lower biomass that are primarily opportunists and either surface deposit feeders or subsurface deposit feeders in the upper centimeter of the sediments, where the organic matter is deposited. They also indicated that macrofaunal density drops during hypoxic phases (Baustian and Rabalais, 2009) from low to even lower abundances. Most benthic infauna in the nGoM hypoxic zone during spring 1990 through fall 1991 were located within the upper 2 cm of the sediments (Rabalais et al., 2001b).
Visual inspection of sediment cores indicated minimal burrowing infauna. The lack of benthic biogenic structures at stations 4, MK, and 5B is corroborated by the 2D-DET images of dissolved iron (Figure 7) which showed little horizontal heterogeneity, contrarily to typical observation in coastal bioturbated sediments. Several studies showed that iron is sensitive to bioturbation with complete depletion within burrows when bio-irrigation is active. Abandoned burrows also affect pore water chemistry by generating iron-enriched environments within their walls (e.g., Robertson et al., 2009; Thibault de Chanvalon et al., 2017; Aller et al., 2019). The lack of structures on 2D-DET observations indicate that bioactivity was sparse and probably absent at the time of sampling at these shelf stations.
Interestingly, a generally low bioturbation intensity throughout the year, that is further depressed during hypoxic and anoxic conditions, could explain the suggested disconnect between the intense carbon mineralization in the bottom waters and sediment interior (Figure 9). Bottom waters and surface sediments probably show large mineralization activity, as evidenced by the rapid (Figures 3, 4) O2 consumption related to the large quantities of labile organic matter raining from surface waters during the spring/summer. Conversely, labile substrate availability is probably restricted in the deeper sediments as a result of the low bioturbation year-round because of the dominance of surface deposit feeders (Figure 9). In this scenario, oxygen consumption and DIC production at the SWI would be strengthened during the summer period, as long as oxygen remains near the hypoxic threshold, due to the deposition of labile organic matter at the sediment surface (Figure 9). In this case, oxygen consumption at the SWI may increase acidification of bottom waters as a result of the DIC produced during oxic degradation (Supplementary Figure 1). A powerful counteracting mechanism would rely on alkalinity production during anoxic mineralization. Indeed, in these sediments, metal reduction (Mn and Fe) is active, which may produce significant alkalinity concentration. However, reoxidation of these dissolved reduced metals with oxygen at the SWI generally consumes most of the alkalinity produced by these reduction reactions (Hu and Cai, 2011). This produces limited net TA fluxes and limits acidification mitigation by benthic alkalinity production. Compounded by the lack of sulfate reduction as a result of the decrease in labile organic inputs in the sediment interior, net alkalinity-generating processes such as FeS production and burial following sulfate reduction (Hu and Cai, 2011; Rassmann et al., 2020), which mitigate acidification in the coastal ocean, are most probably limited at the investigated stations.
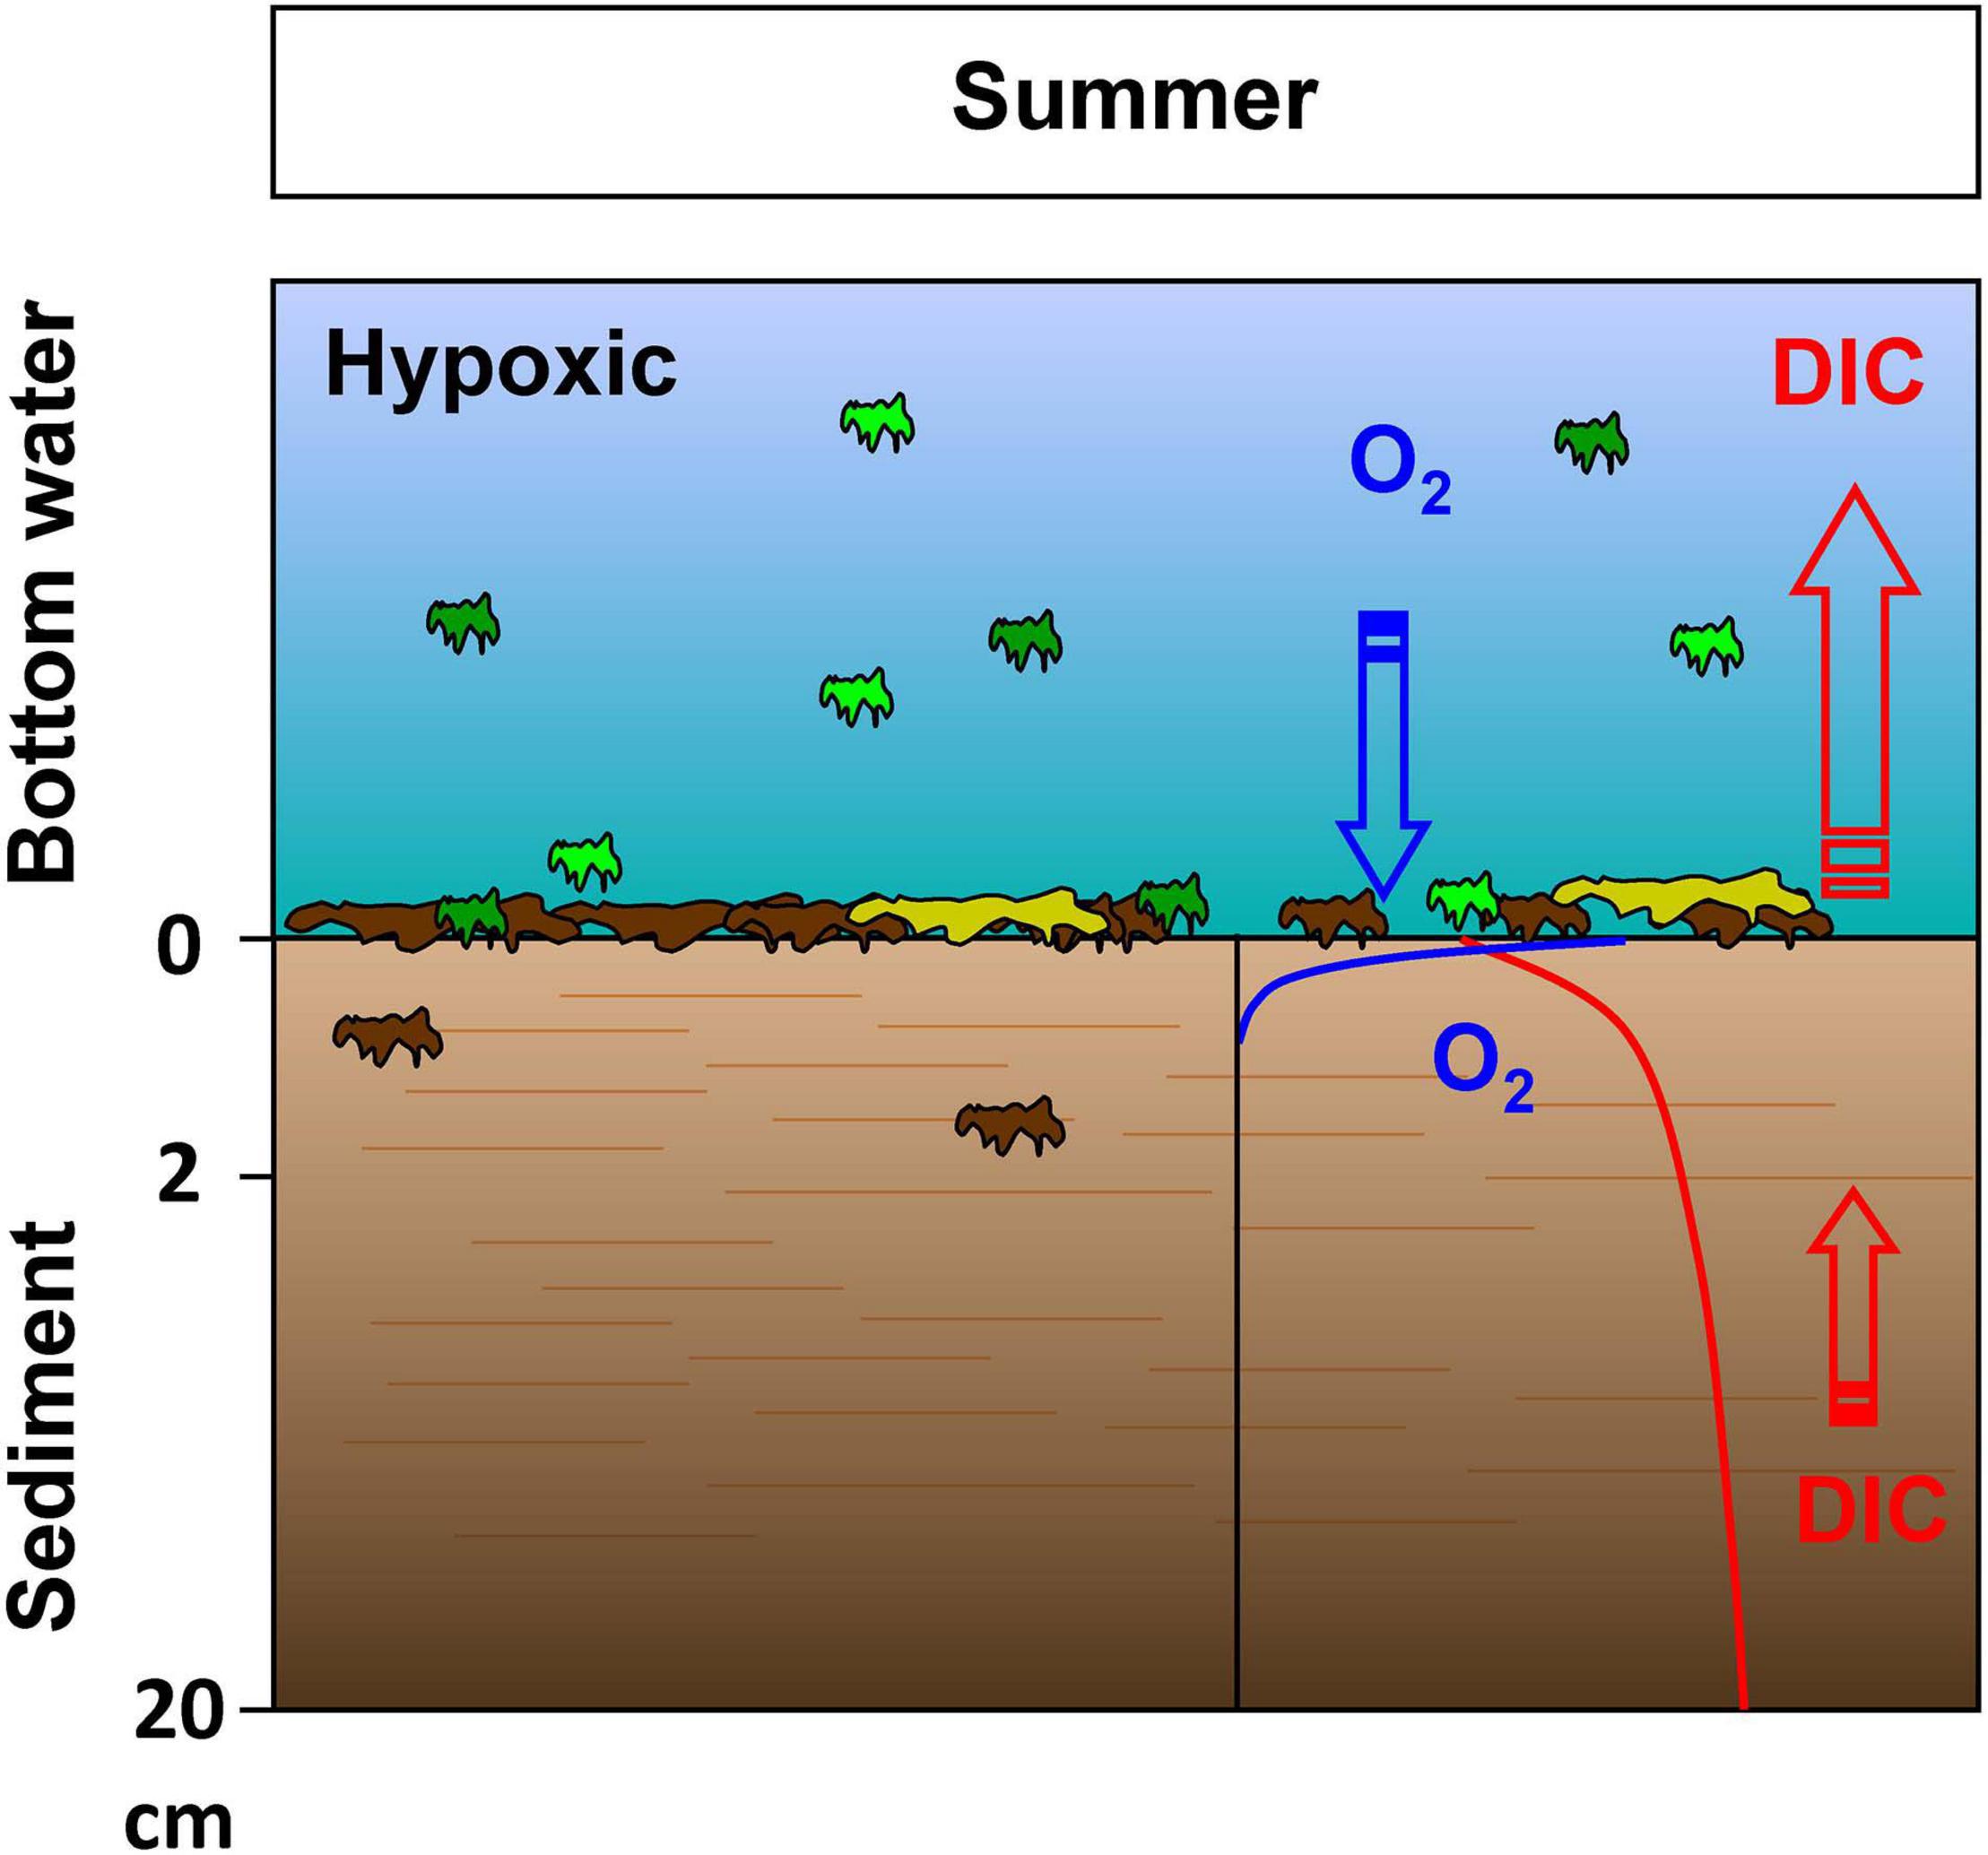
Figure 9. Proposed conceptual model for the summer period: The generally low bioturbation throughout the year and its decrease in summer, concomitantly with the increase in organic matter deposition from the water column, limits organic matter penetration into the sediment by reducing the mixing of new particles with the deeper sediments (horizontal red bars indicate horizontally-layered structure with limited transport). The transport of reactive organic matter is thus limited throughout the year and especially in summer during hypoxic periods, therefore generating a biogeochemically inactive sediment interior (small red arrow in the sediment indicating low DIC internal production) and an active sediment-water interface with important mineralization (large red arrow for total DIC flux).
Conclusion
This study investigated early diagenesis in Louisiana shelf sediments using high resolution techniques near the SWI (amperometric, voltammetric, and potentiometric microelectrodes; DET) and state-of-the-art pore water extractions. A spring to fall time series of bottom water oxygen concentration was also used to investigate hypoxia generation and the biogeochemical dynamics of oxygen consumption in the water column.
From these data, it was possible to conclude that organic matter recycling in the water column near the SWI is disconnected from diagenesis in the sediment interior. Indeed, oxygen consumption was particularly active in the water column during summer as a result of the warm temperature and availability of labile organic matter. Dissolved oxygen was rapidly depleted in the water column, and prolonged periods of hypoxia existed during the summer stratification, therefore attesting the intensity of organic matter mineralization and the lability of the organic substrates. The onset of hypoxia was accompanied by large recycling of organic matter at the SWI as evidenced by dissolved oxygen microprofiles and DOU rates. In contrast, early diagenesis in the shelf sediment interior (St. 4, MK, and 5B) was not intense as revealed by the limited increase in pore water metabolites (DIC, NH4+, and DIP), little decrease in SO42– concentration and small DIC production rates in the sediment interior. This leads to the conclusion that hypoxia does not favor anoxic diagenesis on the Louisiana shelf, at least at the investigated stations.
The lack of connectivity between surface and subsurface sediments was attributed to the lack of bioturbation year-round and especially in summer, when fresh labile organic matter is deposited at the sediment surface. Hypoxic conditions, starting at the end of the spring prevent benthic macrofauna from burying fresh organic matter within the sediment, therefore limiting substrate availability in the deeper sediment layers (2–20 cm). This lack of organic matter entrainment to the sediment interior may have a profound effect on the onset and maintenance of hypoxia and acidification in bottom waters. Indeed, aerobic processes at the SWI consume oxygen and produce DIC without alkalinity, which favor hypoxia and acidifies the bottom waters without any “temporary storage” typically associated with mixing by bioturbation in the deeper sediment layers and slow diffusion in the pore waters. In addition, alkalinity-producing processes linked to anoxic diagenesis (production and burial of FeS) are absent in these hypoxic sediments, thus preventing mitigation of overlying water acidification.
Data Availability Statement
The datasets presented in this study can be found in the SEANOE online repository: https://www.seanoe.org/data/00630/74215/.
Author Contributions
CR and BL wrote the first draft of the manuscript. SO, BB, EM, JR, EE, AB, JB, MT, and CR participated to the cruise, collected the samples, and, with the addition of BL, performed the analysis. NR provided oxygen time series data. All authors contributed to the manuscript by text writing, editions and comments.
Funding
Funding was provided by INSU-EC2CO/LEFE MissRhoDia project to the French groups (LSCE and BIAF), NSF to the Georgia Tech group (OCE-1438648), National Academies of Science, Engineering, and Medicine Gulf Research Program (Early Career Grant 2000007281) to JB, and the Chateaubriand Fellowship of the Office for Science and Technology of the Embassy of France in the United States (MOPGA program) awarded to SO, support from the United States National Oceanic and Atmospheric Administration (NA16OAR4320199) and the National Science Foundation (OCE-1559312) to NR.
Conflict of Interest
The authors declare that the research was conducted in the absence of any commercial or financial relationships that could be construed as a potential conflict of interest.
Acknowledgments
We would like to thank the captain and crew of the RV Savannah for their help with the operations at sea. We acknowledge the help of L. Brethous, B. P. Fields, E. Buckley, and A. Stancil for the work at sea and further analysis in the laboratory. DIC and TA measurements in the water column were performed at SNAPO-CO2 in Paris (France). Figure 7 was created using R software (R Core Team, 2017). This is LSCE contribution number 7501.
Supplementary Material
The Supplementary Material for this article can be found online at: https://www.frontiersin.org/articles/10.3389/fmars.2021.604330/full#supplementary-material
References
Aller, R. C., Aller, J. Y., Zhu, Q., Heilbrun, C., Klingensmith, I., and Kaushik, A. (2019). Worm tubes as conduits for the electrogenic microbial grid in marine sediments. Sci. Adv. 5:eaaw3651. doi: 10.1126/sciadv.aaw3651
Amon, R. M. W., and Benner, R. (1998). Seasonal patterns of bacterial abundance and production in the Mississippi River plume and their importance for the fate of enhanced primary production. Microb. Ecol. 35, 289–300. doi: 10.1007/s002489900084
Baustian, M. M., and Rabalais, N. N. (2009). Seasonal composition of benthic macroinfauna exposed to hypoxia in the northern Gulf of Mexico. Est. Coast 32, 975–983. doi: 10.1007/s12237-009-9187-3
Beckler, J. S., Nuzzio, D. B., and Taillefert, M. (2014). Development of single-step liquid chromatography methods with ultraviolet detection for the measurement of inorganic anions in marine waters. Limnol. Oceanogr. Meth. 12, 563–576. doi: 10.4319/lom.2014.12.563
Berelson, W., McManus, J., Severmann, S., and Rollin, N. (2019). Benthic fluxes from hypoxia-influenced Gulf of Mexico sediments: Impact on bottom water acidification. Mar. Chem. 209, 94–106. doi: 10.1016/j.marchem.2019.01.004
Berg, P., Risgaard-Petersen, N., and Rysgaard, S. (1998). Interpretation of measured concentration profiles in sediment pore water. Lirnnol. Oceanogr. 437, 1500–1510. doi: 10.4319/lo.1998.43.7.1500
Bianchi, S. T., DiMarco, S., Cowan, J. H. Jr., Hetland, R. D., Chapman, P., Day, J. W., et al. (2010). The science of hypoxia in the Northern Gulf of Mexico: A review. Sci. Tot. Environ. 408, 1471–1484. doi: 10.1016/j.scitotenv.2009.11.047
Bianchi, S. T., Goni, M. A., Allison, M. A., Chen, M. A., and McKee, B. A. (2014). “Sedimentary carbon dynamics of the Atchafalaya and Mississippi River delta system and associated margin,” in Biogeochemical dynamics at major river-coastal interfaces: linkages with global change, eds S. T. Bianchi, M. A. Allison, and W. J. Cai (New York: Cambridge University Press), 473–502. doi: 10.1017/CBO9781139136853.024
Bianchi, T. S., Allison, M. A., Canuel, E. A., Corbett, D. R., McKee, B. A., Sampere, T. P., et al. (2006). Rapid Export of Organic Matter to the Mississippi Canyon. Eos 87, 565–573. doi: 10.1029/2006EO500002
Bianchi, T. S., Mitra, S., and McKee, B. A. (2002). Sources of terrestrially-derived organic carbon in lower Mississippi River and Louisiana shelf sediments: implications for differential sedimentation and transport at the coastal margin. Mar. Chem. 77, 211–223. doi: 10.1016/S0304-4203(01)00088-3
Breitburg, D., Levin, L. A., Oschlies, A., Grégoire, M., Chavez, F. P., Conley, D. J., et al. (2018). Declining oxygen in the global ocean and coastal waters. Science 359:aam7240. doi: 10.1126/science.aam7240
Brendel, P. J., and Luther, G. W. III (1995). Development of a gold amalgam voltammetric microelectrode for the determination of dissolved Fe, Mn, O2, and S(-II) in porewaters of marine and freshwater sediments. Environ. Sci. Tech. 29, 751–761. doi: 10.1021/es00003a024
Briggs, K. B., Hartmann, V. A., Yeager, K. M., Shivarudrappa, S., Diaz, R. J., Osterman, L. E., et al. (2015). Influence of hypoxia on biogenic structure in sediments on the Louisiana continental shelf. Estuar. Coast. Shelf Sci. 164:147e160. doi: 10.1016/j.ecss.2015.07.019
Broecker, W. S., and Peng, T. H. (1974). Gas exchange rates between air and sea. Tellus 26, 21–35. doi: 10.3402/tellusa.v26i1-2.9733
Cai, W.-J., Hu, X., Huang, W.-J., Murrell, M. C., Lehrter, J. C., Lohrenz, S. E., et al. (2011). Acidification of subsurface coastal waters enhanced by eutrophication. Nat. Geosci. 4, 766–770. doi: 10.1038/ngeo1297
Canfield, D. E., Jorgensen, B. B., Fossing, H., Glud, R., Gundersen, J., Ramsing, N. B., et al. (1993). Pathways of organic carbon oxidation in three continental margin sediments. Mar. Geol. 113, 27–40. doi: 10.1016/0025-3227(93)90147-N
Capet, A., Cook, P., Garcia-Robledo, E., Hoogakker, B., Paulmier, A., Rabouille, C., et al. (2020). Facing Marine Deoxygenation. Front. Mar. Sci. 7:46. doi: 10.3389/fmars.2020.00046
Cathalot, C., Rabouille, C., Pastor, L., Deflandre, B., Viollier, E., Buscail, R., et al. (2010). Temporal variability of carbon recycling in coastal sediments influenced by rivers: assessing the impact of flood inputs in the Rhone River prodelta. Biogeosciences 7, 1187–1205. doi: 10.5194/bg-7-1187-2010
Cesbron, F., Metzger, E., Launeau, P., Deflandre, B., Delgard, M.-L., and Thibault, et al. (2014). Simultaneous 2D Imaging of Dissolved Iron and Reactive Phosphorus in Sediment Porewaters by Thin-Film and Hyperspectral Methods. Environ. Sci. Technol. 48, 2816–2826. doi: 10.1021/es404724r
Chin-Leo, G., and Benner, R. (1992). Enhanced bacterioplankton production and respiration at intermediate salinities in the Mississippi River plume. Mar. Ecol. Prog. Ser. 82, 87–103. doi: 10.3354/meps087087
Clayton, T. D., and Byrne, R. H. (1993). Spectrophotometric seawater pH measurements: total hydrogen ion concentration scale calibration of m-cresol purple and at-sea results. Deep Sea Res. 40, 2115–2129. doi: 10.1016/0967-0637(93)90048-8
Corbett, D. R., Dail, M., and McKee, B. A. (2007). High-frequency time-series of the dynamic sedimentation processes on the western shelf of the Mississippi River Delta. Contin. Shelf Res. 27, 1600–1615. doi: 10.1016/j.csr.2007.01.025
Corbett, D. R., McKee, B. A., and Allison, M. (2006). Nature of decadal-scale sediment accumulation on the western shelf of the Mississippi River delta. Continent. Shelf Res. 26, 2125–2140. doi: 10.1016/j.csr.2006.07.012
Corbett, D. R., McKee, B. A., and Duncan, D. (2004). An evaluation of mobile mud dynamics in the Mississippi River deltaic region. Mar. Geol. 209, 91–112. doi: 10.1016/j.margeo.2004.05.028
Dagg, M. J., Bianchi, T. S., McKee, B. A., and Powell, R. (2008). Fates of dissolved and particulate materials from the Mississippi river immediately after discharge into the northern Gulf of Mexico, USA, during a period of low wind stress. Contin. Shelf Res. 28, 1443–1450. doi: 10.1016/j.csr.2006.12.009
Devereux, R., Lehrter, J. C., Beddick, D. L. J., Yates, D. F., and Jarvis, B. M. (2015). Manganese, iron, and sulfur cycling in Louisiana continental shelf sediments. Contin. Shelf Res. 99, 46–56. doi: 10.1016/j.csr.2015.03.008
Devereux, R., Lehrter, J., Cicchetti, G., Beddick, D. L. J., Yates, D. F., Jarvis, B. M., et al. (2019). Spatially variable bioturbation and physical mixing drive the sedimentary biogeochemical seascape in the Louisiana continental shelf hypoxic zone. Biogeochem 143, 151–169. doi: 10.1007/s10533-019-00539-8
Diaz, R. J., and Rosenberg, R. (2008). Spreading Dead Zones and Consequences for Marine Ecosystems. Science 321, 926–929. doi: 10.1126/science.1156401
Dickson, A. G., Sabine, C. L., and Christian, J. R. (Eds.) (2007). Guide to Best Practices for Ocean CO2 Measurements. Sidney, BC: PICES Special Publication.
DOE (1994). “Handbook of methods for the analysis of the various parameters of the carbon dioxide system in sea water. Version 2,” in ORNL/CDIAC-74, eds A. G. Dickson and C. Goyet (Washington, D.C: DOE).
Dortch, Q., Rabalais, N. N., Turner, R. E., and Rowe, G. T. (1994). Respiration rates and hypoxia on the Louisiana shelf. Estuaries 17, 862–872. doi: 10.2307/1352754
Feist, T. J., Pauer, J. J., Melendez, W., Lehrter, J., DePetro, P. A., Rygwelski, K. R., et al. (2016). Modeling the relative importance of nutrient and carbon loads, boundary fluxes, and sediment fluxes on Gulf of Mexico hypoxia. Envir. Sci. Technol. 50, 8713–8721. doi: 10.1021/acs.est.6b01684
Fennel, K., and Testa, J. M. (2019). Biogeochemical controls on coastal hypoxia. Annu. Rev. Mar. Sci. 11, 4.1–4.26. doi: 10.1146/annurev-marine-010318-095138
Fennel, K., Hu, J. T., Laurent, A., Marta-Almeida, M., and Hetland, R. D. (2013). Sensitivity of hypoxia predictions for the northern Gulf of Mexico to sediment oxygen consumption and model nesting. J. Geophys. Res. 118, 990–1002. doi: 10.1002/jgrc.20077
Gilbert, D., Rabalais, N. N., Díaz, R. J., and Zhang, J. (2010). Evidence for greater oxygen decline rates in the coastal ocean than in the open ocean. Biogeosciences 7, 2283–2296. doi: 10.5194/bg-7-2283-2010
Glud, R. N. (2008). Oxygen dynamics of marine sediments. Mar. Biol. Res. 4, 243–289. doi: 10.1080/17451000801888726
Glud, R. N., Holby, O., Hoffmann, F., and Canfield, D. E. (1998). Benthic mineralization and exchange in Arctic sediments (Svalbard, Norway). Mar. Ecol. Prog. Ser. 173, 237–251. doi: 10.3354/meps173237
Goñi, M. A., Ruttenberg, K. C., and Eglinton T. I. (1997). Sources and contribution of terrigenous organic carbon to surface sediments in the Gulf of Mexico, Nature 389, 275–278. doi: 10.1038/38477
Gordon, E. S., and Goni, M. A. (2004). Controls on the distribution and accumulation of terrigenous organic matter in sediments from the Mississippi and Atchafalaya River margin. Mar. Chem. 92, 331–352. doi: 10.1016/j.marchem.2004.06.035
Hall, P. J., and Aller, R. C. (1992). Rapid, small-volume, flow injection analysis for SCO2, and NH4+ in marine and freshwaters. Limnol. Oceanogr. 37, 1113–1119. doi: 10.4319/lo.1992.37.5.1113
Hetland, R. D., and DiMarco, S. F. (2008). How does the character of oxygen demand control the structure of hypoxia on the Texas-Louisiana continental shelf? J. Mar. Syst. 70, 49–62. doi: 10.1016/j.jmarsys.2007.1003.1002
Hu, X. P., and Cai, W. J. (2011). An assessment of ocean margin anaerobic processes on oceanic alkalinity budget. Glob. Biogeochem. Cycles 21:GB3003. doi: 10.1029/2010GB003859
Hu, X. P., Li, Q., Huang, W. J., Chen, B. S., Cai, W. J., Rabalais, N. N., et al. (2017). Effects of eutrophication and benthic respiration on water column carbonate chemistry in a traditional hypoxic zone in the northern Gulf of Mexico. Mar. Chem. 194, 33–42. doi: 10.1016/j.marchem.2017.04.004
Jézéquel, D., Brayner, R., Metzger, E., Viollier, E., Prévot, F., and Fiévet, F. (2007). Two-dimensional determination of dissolved iron and sulfur species in marine sediment pore-waters by thin-film based imaging. Thau lagoon (France). Estuar. Coast. Shelf Sci. 72, 420–431. doi: 10.1016/j.ecss.2006.11.031
Krumins, V., Gehlen, M., Arndt, S., Van Cappellen, P., and Regnier, P. A. G. (2013). Dissolved inorganic carbon and alkalinity fluxes from coastal marine sediments: model estimates for different shelf environments and sensitivity to global change. Biogeosci 10, 371–398. doi: 10.5194/bg-10-371-2013
Laurent, A., Fennel, K., Cai, W. J., Huang, W. J., Barbero, L., and Wanninkhof, R. (2017). Eutrophication-induced acidification of coastal waters in the northern Gulf of Mexico: Insights into origin and processes from a coupled physical biogeochemical model. Geophys. Res. Let. 44:2016GL071881. doi: 10.1002/2016GL071881
Laurent, A., Fennel, K., Wilson, R., Lehrter, J., and Devereux, R. (2016). Parameterization of biogeochemical sediment–water fluxes using in situ measurements and a diagenetic model. Depart. Oceanogr. 13, 77–94. doi: 0.5194/bg-13-77-2016
Lehrter, J. C., Beddick, D. L. J., Devereux, R., Yates, D. F., and Murrell, M. C. (2012). Sediment-water fluxes of dissolved inorganic carbon, O2, nutrients, and N2 from the hypoxic region of the Louisiana continental shelf. Biogeochem 109, 233–252. doi: 10.1007/s10533-011-9623-x
Levin, L. A., Ekau, W., Gooday, A. J., Jorissen, F. J., Middelburg, J. J., Naqvi, W. A., et al. (2009). Effects of natural and human-induced hypoxia on coastal benthos. Biogeosc 6, 2063–2098. doi: 10.5194/bg-6-2063-2009
Lin, S., and Morse, J. W. (1991). Sulfate reduction and iron sulfide mineral formation in Gulf of Mexico anoxic sediments. Amer. J. Sci. 201, 55–89. doi: 10.2475/ajs.291.1.55
Lohrenz, S. E., Redalje, D. G., Cai, W. J., Acker, J., and Dagg, M. J. (2008). A retrospective analysis of nutrients and phytoplankton productivity in the Mississippi River plume. Contin. Shelf Res. 28, 1466–1475. doi: 10.1016/j.csr.2007.06.019
Lueker, T. J., Dickson, A. G., and Keeling, C. D. (2000). Ocean pCO2 calculated from dissolved inorganic carbon, alkalinity, and equations for K1 and K2: validation based on laboratory measurements of CO2 in gas and seawater at equilibrium. Mar. Chem. 70, 105–119. doi: 10.1016/S0304-4203(00)00022-0
Luther, G. W., Glazer, B., Ma, S., Trouwborst, R., Moore, T., Metzger, E., et al. (2008). Use of voltammetric solid-state (micro)electrodes for studying biogeochemical processes: Laboratory measurements to real time measurements with an in situ electrochemical analyzer (ISEA). Mar. Chem. 108, 221–235. doi: 10.1016/j.marchem.2007.03.002
Madison, A. S., Tebo, B. M., and Luther, G. W. III (2011). Simultaneous determination of soluble manganese(III), manganese(II) and total manganese in natural (pore)waters. Talanta 84, 374–381. doi: 10.1016/j.talanta.2011.01.025
McKee, B. A., Aller, R. C., Allison, M. A., Bianchi, T. S., and Kineke, G. C. (2004). Transport and transformation of dissolved and particulate materials on continental margins influenced by major rivers: benthic boundary layer and seabed processes. Contin. Shelf Res. 24, 899–926. doi: 10.1016/j.csr.2004.02.009
Meiggs, D., and Taillefert, M. (2011). The effect of riverine discharge on biogeochemical processes in estuarine sediments. Limnol. Oceanogr. 56, 1797–1810. doi: 10.4319/lo.2011.56.5.1797
Metzger, E., Langlet, D., Viollier, E., Koron, N., Riedel, B., Stachowitsch, M., et al. (2014). Artificially induced migration of redox layers in a coastal sediment from the Northern Adriatic. Biogeosc 11, 2211–2224. doi: 10.5194/bg-11-2211-2014
Middelburg, J. J., and Levin, L. A. (2009). Coastal hypoxia and sediment biogeochemistry. Biogeosci 6, 1273–1293. doi: 10.5194/bg-6-1273-2009
Moriarty, J. M., Harris, C. K., Friedrichs, M. A. M., Fennel, K., and Xu, K. H. (2018). Impact of seabed resuspension on oxygen and nitrogen dynamics in the northern Gulf of Mexico: A numerical modeling study. J. Geophys. Res. 123, 7237–7263. doi: 10.1029/2018JC013950
Morse, J. W., and Eldridge, P. M. (2007). A non-steady state diagenetic model for changes in sediment biogeochemistry in response to seasonally hypoxic/anoxic conditions in the “dead zone” of the Louisiana shelf. Mar. Chem. 106, 239–255. doi: 10.1016/j.marchem.2006.02.003
Morse, J. W., and Rowe, G. T. (1999). Benthic biogeochemistry beneath the Mississippi river plume. Estuaries 22, 206–214. doi: 10.2307/1352977
Murphy, J., and Riley, J. P. (1962). A modified single solution method for the determination of phosphate in natural waters. Analyt. Chim. Acta 27, 31–36. doi: 10.1016/S0003-2670(00)88444-5
Murrell, M. C., Aukamp, J. R., Beddick, D. L. J., Devereux, R., Greene, R. M., Hagy, J. D. I., et al. (2013). Gulf of Mexico hypoxia research program data report: 2002-2007. Washington, DC: U. S. Environmental Protection Agency.
Murrell, M., and Lehrter, J. (2011). Sediment and lower water column oxygen consumption in the seasonally hypoxic region of the Louisiana continental shelf. Estuar. Coasts 34, 912–924. doi: 10.1007/s12237-010-9351-9
Pörtner, H.-O., Roberts, D. C., Masson-Delmotte, V., Zhai, P., Tignor, M., Poloczanska, E., et al., (eds.) (In press). IPCC Special Report on the Ocean and Cryosphere in a Changing Climate.
Orr, J. C., Epitalon, J. M., and Gattuso, J. P. (2015). Comparison of ten packages that compute ocean carbonate chemistry. Biogeosciences 12, 1483–1510. doi: 10.5194/bg-12-1483-2015
Orr, J. C., Fabry, V. J., Aumont, O., Bopp, L., Doney, S. C., and Feely, R. A. et al. (2005). Anthropogenic ocean acidification over the twenty-first century and its impact on calcifying organisms. Nature 437, 681–686. doi: 10.1038/nature04095
Owings, S., Brethous, L., Eitel, E. M., Fields, B. P., Boever, A., Beckler, J., et al. (2021). Differential manganese and iron recycling and transport in continental margin sediments of the Northern Gulf of Mexico. Mar. Chem. 229:103908. doi: 10.1016/j.marchem.2020.103908
Pierrot, D., Lewis, E., and Wallace, D. W. R. (2006). MS Excel Program Developed for CO2 System Calculations.. ORNL/CDIAC-105a. Tennessee: Carbon Dioxide Information Analysis Center.
R Core Team (2017). R: A Language and Environment for Statistical Computing. Vienna: RFoundation for Statistical Computing. Available online at: http://www.R-project.org/
Rabalais, N. N., and Baustian, M. M. (2020). Historical shifts in benthic infaunal diversity in the northern Gulf of Mexico since the appearance of seasonally severe hypoxia. Divers 12:49. doi: 10.3390/d12020049
Rabalais, N. N., and Turner, R. E. (2019). Gulf of Mexico Hypoxia: Past, Present, and Future. Limnol. Oceanogr. Bull. 28, 117–124. doi: 10.1002/lob.10351
Rabalais, N. N., Cai, W. J., Cartensen, J., Conley, D. J., Fry, B., Hu, X., et al. (2014). Eutrophication-driven deoxygenation in the coastal ocean. Oceanography 27, 172–183. doi: 10.5670/oceanog.2014.21
Rabalais, N. N., Harper, D. E. J., and Turner, R. E. (2001a). “Responses of nekton and demersal and benthic fauna to decreasing oxygen concentrations,” in Coastal hypoxia: consequences for living resources and ecosystems. Coastal and estuarine studies, eds N. N. Rabalais and R. E. Turner (Washington, D.C: American Geophysical Union), 115–128. doi: 10.1029/CE058p0115
Rabalais, N. N., Smith, L. E., Harper, D. E. J., and Justic, D. (2001b). “Effects of seasonal hypoxia on continental shelf benthos,” in Coastal hypoxia: consequences for living resources and ecosystems. Coastal and estuarine studies, eds N. N. Rabalais and R. E. Turner (Washington, D.C: American Geophysical Union), 211–240. doi: 10.1029/CE058p0211
Rabalais, N. N., Turner, R. E., and Wiseman, W. J. (2002). Gulf of Mexico hypoxia, a.k.a. “the dead zone”. Ann. Rev. Ecol. Syst. 33, 235–263. doi: 10.1146/annurev.ecolsys.33.010802.150513
Rabalais, N. N., Turner, R. E., Sen Gupta, B. K., Boesch, D. F., Chapman, P., and Murrell, M. C. (2007). Hypoxia in the northern Gulf of Mexico: does the science support the plan to reduce, mitigate, and control hypoxia? Estuar. Coast. 30, 753–772. doi: 10.1007/BF02841332
Rabouille, C., and Gaillard, J. F. (1991). A coupled model representing the deep-sea organic carbon mineralization and oxygen-consumption in surficial sediments. J. Geophys. Res. Oceans 96, 2761–2776. doi: 10.1029/90jc02332
Rabouille, C., Conley, D. J., Dai, M. H., Cai, W. J., Chen, C. T. A., Lansard, B., et al. (2008). Comparison of hypoxia among four river-dominated ocean margins: The Changjiang (Yangtze), Mississippi, Pearl, and Rhone rivers. Contin. Shelf Res. 28, 1527–1537. doi: 10.1016/j.csr.2008.01.020
Rao, A. M. F., Malkin, S. Y., Montserrat, F., and Meysman, F. J. R. (2014). Alkalinity production in intertidal sands intensified by lugworm bioirrigation. Estuar. Coast. Shelf Sci. 148, 36–47. doi: 10.1016/j.ecss.2014.06.006
Rassmann, J., Eitel, E., Cathalot, C., Brandily, C., Lansard, B., Taillefert, M., et al. (2020). Benthic alkalinity and DIC fluxes in the Rhône River prodelta generated by decoupled aerobic and anaerobic processes. Biogeosciences 17, 13–33. doi: 10.5194/bg-17-13-2020
Rassmann, J., Lansard, B., Pozzato, L., and Rabouille, C. (2016). Carbonate chemistry in sediment porewaters of the Rhône River delta driven by early diagenesis (northwestern Mediterranean). Biogeosciences 13, 5379–5394. doi: 10.5194/bg-13-5379-2016
Redalje, D. G., Lohrenz, S. E., and Fahnenstiel, G. L. (1994). The relationship between primary production and the vertical export of particulate organic matter in a river-impacted coastal ecosystem. Estuar 17, 829–838. doi: 10.2307/1352751
Riedel, B., Pados, T., Pretterebner, K., Schiemer, L., Steckbauer, A., Haselmair, A., et al. (2014). Effect of hypoxia and anoxia on invertebrate behaviour: ecological perspectives from species to community level. Biogeosc 11, 1491–1518. doi: 10.5194/bg-11-1491-2014
Robertson, D., Welsh, D. T., and Teasdale, P. R. (2009). Investigating biogenic heterogeneity in coastal sediments with two-dimensional measurements of iron(II) and sulfide. Environ. Chem. 6, 60–69. doi: 10.1071/EN08059
Rowe, G. T., Kaegi, M. E. C., Morse, J. W., Boland, G. S., and Briones, E. G. E. (2002). Sediment community metabolism associated with continental shelf hypoxia, Northern Gulf of Mexico. Estuaries 25, 1097–1106. doi: 10.1007/BF02692207
Stookey, L. L. (1970). Ferrozine- A New Spectrophotometric Reagent for Iron. Anal. Chem. 42, 779–781. doi: 10.1021/ac60289a016
Strickland, J. D. H., and Parsons, T. R. (1972). A practical handbook of sea-water analysis. Ottawa: Fisheries Research Board of Canada, 167.
Taillefert, M., Bono, A. B., and Luther, G. W. (2000). Reactivity of Freshly Formed Fe(III) in Synthetic Solutions and (Pore)Waters: Voltammetric Evidence of an Aging Process. Environ. Sci. Technol. 34, 2169–2177. doi: 10.1021/es990120a
Theberge, S. M., and Luther, G. W. (1997). Determination of the Electrochemical Properties of a Soluble Aqueous FeS Species Present in Sulfidic Solutions. Aquat. Geochem. 3, 191–211. doi: 10.1023/A:1009648026806
Thibault de Chanvalon, A., Metzger, E., Mouret, A., Knoery, J., Geslin, E., et al. (2017). Two-dimensional mapping of iron release in marine sediments at submillimetre scale. Mar. Chem. 191, 34–49. doi: 10.1016/j.marchem.2016.04.003
Turner, R. E., Rabalais, N. N., and Justic, D. (2006). Predicting summer hypoxia in the northern Gulf of Mexico: Riverine N, P, and Si loading. Mar. Poll. Bull. 52, 139–148. doi: 10.1016/j.marpolbul.2005.08.012
Turner, R. E., Rabalais, N. N., and Justic, D. (2008). Gulf of Mexico hypoxia: Alternate states and a legacy. Envir. Sci. Technol. 42, 2323–2327. doi: 10.1021/es071617k
Uppström, L. R. (1974). The Boron/Chlorinity Ratio of Deep-Sea Water from the Pacific Ocean. Deep Sea Res. Oceanogr. 21, 161–162. doi: 10.1016/0011-7471(74)90074-6
Viollier, E., Inglett, P. W., Hunter, K., Roychoudhury, A. N., and Van Cappellen, P. (2000). The ferrozine method revisited: Fe(II)/Fe(III) determination in natural waters. Appl. Geochem. 15, 785–790. doi: 10.1016/S0883-2927(99)00097-9
Wang, H. J., Hu, X. P., Rabalais, N. N., and Brandes, J. (2018). Drivers of oxygen consumption in the northern Gulf of Mexico hypoxic waters—A stable carbon isotope perspective. Geophys. Res. Let. 45, 10528–10538. doi: 10.1029/2018GL078571
Waterson, E. J., and Canuel, E. A. (2008). Sources of sedimentary organic matter in the Mississippi River and adjacent Gulf of Mexico as revealed by lipid biomarker and 13CTOC analyses. Org. Geochem. 39, 422–439. doi: 10.1016/j.orggeochem.2008.01.011
Wiseman, W. J., Rabalais, N. N., Turner, R. E., Dinnel, S. P., and MacNaughton, A. (1997). Seasonal and interannual variability within the Louisiana coastal current: stratification and hypoxia. J. Mar. Syst. 12, 237–248. doi: 10.1016/S0924-7963(96)00100-5
Keywords: diagenesis, hypoxia, acidification, organic matter, continental shelf, oxygen, sediments, RiOMar
Citation: Rabouille C, Lansard B, Owings SM, Rabalais NN, Bombled B, Metzger E, Richirt J, Eitel EM, Boever AD, Beckler JS and Taillefert M (2021) Early Diagenesis in the Hypoxic and Acidified Zone of the Northern Gulf of Mexico: Is Organic Matter Recycling in Sediments Disconnected From the Water Column? Front. Mar. Sci. 8:604330. doi: 10.3389/fmars.2021.604330
Received: 09 September 2020; Accepted: 16 February 2021;
Published: 18 March 2021.
Edited by:
Arnaud Laurent, Dalhousie University, CanadaReviewed by:
Mathilde Hagens, Wageningen University and Research, NetherlandsGerdhard L. Jessen, Universidad Austral de Chile, Chile
Copyright © 2021 Rabouille, Lansard, Owings, Rabalais, Bombled, Metzger, Richirt, Eitel, Boever, Beckler and Taillefert. This is an open-access article distributed under the terms of the Creative Commons Attribution License (CC BY). The use, distribution or reproduction in other forums is permitted, provided the original author(s) and the copyright owner(s) are credited and that the original publication in this journal is cited, in accordance with accepted academic practice. No use, distribution or reproduction is permitted which does not comply with these terms.
*Correspondence: Christophe Rabouille, rabouill@lsce.ipsl.fr; orcid.org/0000-0003-1211-717X