Life History and Ecology of Bluenose Warehou (Hyperoglyphe antarctica, Centrolophidae) in the Southern Atlantic
 James B. Bell1*
  Vladimir Laptikhovsky1
  David K. A. Barnes2
  Ramon Benedet1
  Amelia E. Bridges1,2,3 James Glass4 Warren Glass4 Rodney Green4
  Simon A. Morley2 Simon Robertson5 Georgia R. Robson1 Harry Stanton6
  Freja Azzopardi6
  Clive N. Trueman6 Oliver Yates1
  Martin A. Collins1,2
- 1Centre for Environment, Fisheries and Aquaculture Science, Lowestoft, United Kingdom
- 2British Antarctic Survey, Cambridge, United Kingdom
- 3School of Biological and Marine Sciences, University of Plymouth, Plymouth, United Kingdom
- 4Department of Fisheries, Tristan da Cunha Government, Edinburgh of the Seven Seas, Tristan da Cunha
- 5Fish Ageing Services, Portarlington, VIC, Australia
- 6School of Ocean and Earth Sciences, University of Southampton, Southampton, United Kingdom
Bluenose warehou (Hyperoglyphe antarctica) is a popular commercial fish in Australia and New Zealand, but its biology and ecology are very poorly known in other regions where it is found. We present here the first life history data for this species from the south Atlantic, focusing upon the exclusive economic zone (EEZ) of the United Kingdom Overseas Territory (UKOT) of Tristan da Cunha (TdC). Here, bluenose is known from several seamounts and island margins, typically occurring in waters between 200 and 1,000 m depth and is the target species of trawl and longline fishery operating since 1997. We use a suite of methods to describe important life history parameters, including length-weight and age-length relationships and size at recruitment, as well as examining commercial longline survey data to uncover habitat preferences of bluenose. This work has formed an important part of the United Kingdom government’s Blue Belt Program in TdC. It has underpinned the development of the first stock assessment for this species in the Atlantic, as well as a range of improved conservation measures for some of the more vulnerable species that occur in these areas, including seabirds and cold-water corals.
Introduction
Bluenose warehou (Hyperoglyphe antarctica, Carmichael, 1819), hereafter bluenose, is a large demersal finfish (Osteichthyes: Centrolophidae) that occurs in deep-water throughout the temperate Southern Hemisphere except the SW Atlantic (Kailola et al., 1993; Piotrovsky, 1994; Froese and Pauly, 2019). Juveniles are thought to associate with drifting debris in the top 100 m of the water column (Last et al., 1993; Duffy et al., 2000) until they reach a total length of approximately 30–40 cm (rarely up to 50 cm). At full size, they recruit to the demersal habitat of adults and sub-adults (Horn, 1988; Duffy et al., 2000). Adult bluenose tend to associate with steep, rocky areas on seamounts or continental slopes between 100 and 1,000 m, where they are closer to the seabed during the day (Kailola et al., 1993; Armitage et al., 1994). As is common with other demersal scavenging fish species, larger individuals tend to be found in deeper waters (Collins et al., 2005; Cordue and Pomaréde, 2012). Longevity is poorly understood; estimates from New Zealand stocks range from 25 to 76 years (Annala, 1994; Horn et al., 2010) but longevity and life-history of the south Atlantic stock is unknown. The main prey species for bluenose are pelagic cephalopods, demersal and pelagic fishes, and crustaceans (Horn and Massey, 1989; Piotrovsky, 1994; Laptikhovsky et al., 2019).
Tristan da Cunha (TdC) is a remote archipelago comprised of four islands and several large, shallow seamounts and guyots in the temperate south-east Atlantic, which forms part of the United Kingdom Overseas Territory (UKOT) of Ascension, St Helena, and Tristan da Cunha. Tristan Island, in the north of the exclusive economic zone (EEZ) is the only inhabited island and is the most remote permanently inhabited island on the planet, with approximately 260 residents. There is very limited land area suitable for agriculture and so consequently, much of the island’s gross domestic product (ca. 85–90%) and food security are derived from marine resources. The majority of this value comes from an inshore pot fishery for Tristan Lobster (Jasus paulensis) but there has also been a seasonal longline and trawl fishery operating at the four largest seamounts. The fishery has targeted demersal species such as bluenose, jacopever (Helicolenus mouchezi), and splendid alfonsino (Beryx splendens). This fishery has operated intermittently since 1997, during which time landings of bluenose have ranged between 0 and 782 tons per year in the TdC waters, or 0–29% of the global annual landings for this species (Figure 1). Bluenose fisheries in other areas have been characterized by a vulnerability to sustained, high-intensity fishing. For instance, total allowable catch (TAC) in New Zealand waters was reduced by 60% in 2011, from levels of around 2,300 to 920 tons per year (Cordue and Pomaréde, 2012). The TdC EEZ is surrounded by the South-East Atlantic Fisheries Organization (SEAFO) convention area, which manages demersal fisheries in the wider area. SEAFO does not currently set catch limits for bluenose as bluenose is not a common bycatch species, so the distribution and demographic structure of bluenose from the wider area is unknown.
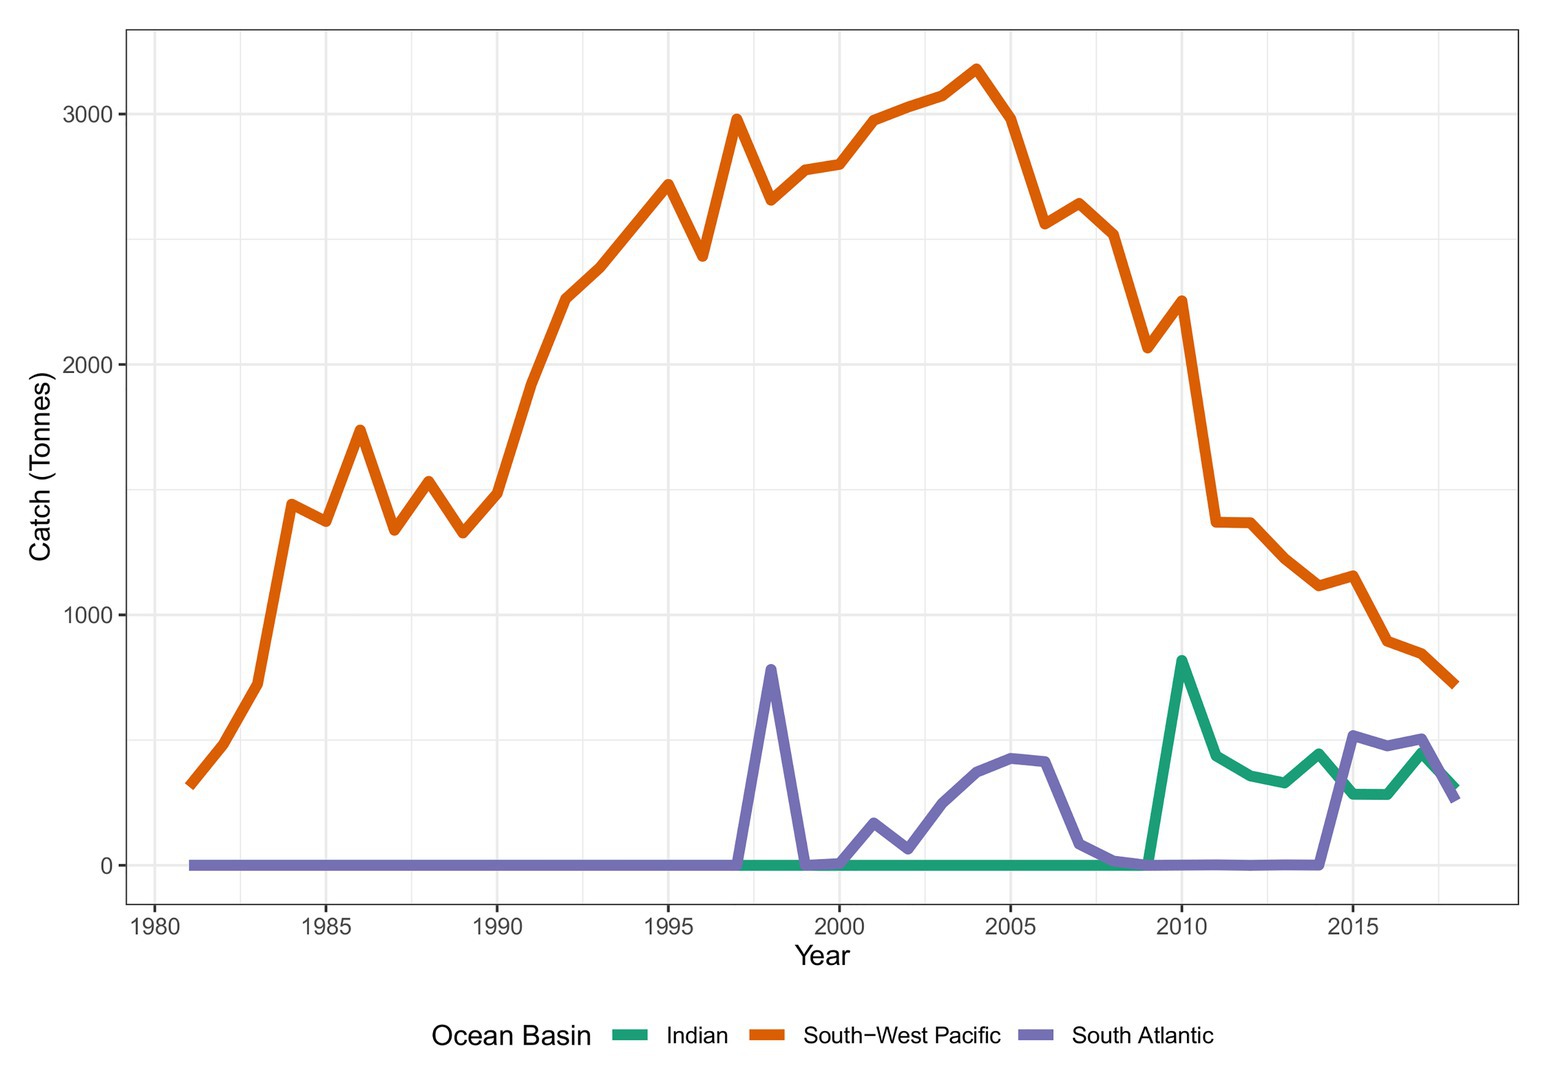
Figure 1. Global catch (tons) of bluenose warehou (FAO 3-alpha code: BWA). Source: FAO and Tristan da Cunha Fisheries Department. N.B. FAO 1994 value for south-west Pacific missing from FAO data and interpolated value presented.
Prior to 2017, there had been no dedicated survey and very little data collection for the bluenose fishery in TdC, owing to the intermittent nature of the fishery and the limited opportunities for islanders to conduct research. No commercial fishing, except for lobster, is currently permitted within 50 nautical miles of any of the islands, meaning that this fishery is confined to remote, offshore grounds in the central and eastern reaches of the TdC EEZ. Islanders and vessel crew catch bluenose around the northern islands and at Gough Island as part of a small subsistence fishery only. In 2016, the UK Government announced a commitment to improving marine protection in five of its overseas territories, of which the territory of Ascension, St Helena, and Tristan da Cunha is one. This has greatly enhanced research effort targeting this fishery through the dedicated “Blue Belt” program and other official development assistance funding streams that support TdC work by the British Antarctic Survey and the Royal Society for the Protection of Birds. In this paper, we report novel data on life history and habitat use by bluenose in TdC waters. Specifically, we test the following null hypotheses for bluenose in the TdC EEZ: (1) bluenose does not exhibit significant sexual dimorphism; (2) bluenose life history parameters are similar between each of the seamounts, and (3) there is no seasonal maturation pattern in bluenose.
Materials and Methods
Sites
We report biological data from two fishery surveys and seven commercial fishing trips (Figure 2) between November 2017 and February 2019 on the longliner, MFV Edinburgh, and the trawler, FV Argos Vigo. Commercial longline fishing has occurred on the Crawford, Yakhont, McNish, and RSA seamounts, with a few survey lines around the Gough Island. Each of these seamounts are broadly characterized by a relatively flat “guyot”-style plateau, at depths of between 150–550 m, surrounded by steep flanks which descend to the surrounding seafloor at a depth of approximately 3,000–3,200 m. The Gough Island margin is similar in the latter respect but, of course, lacks the subsurface plateau area and the associated pelagic habitats.
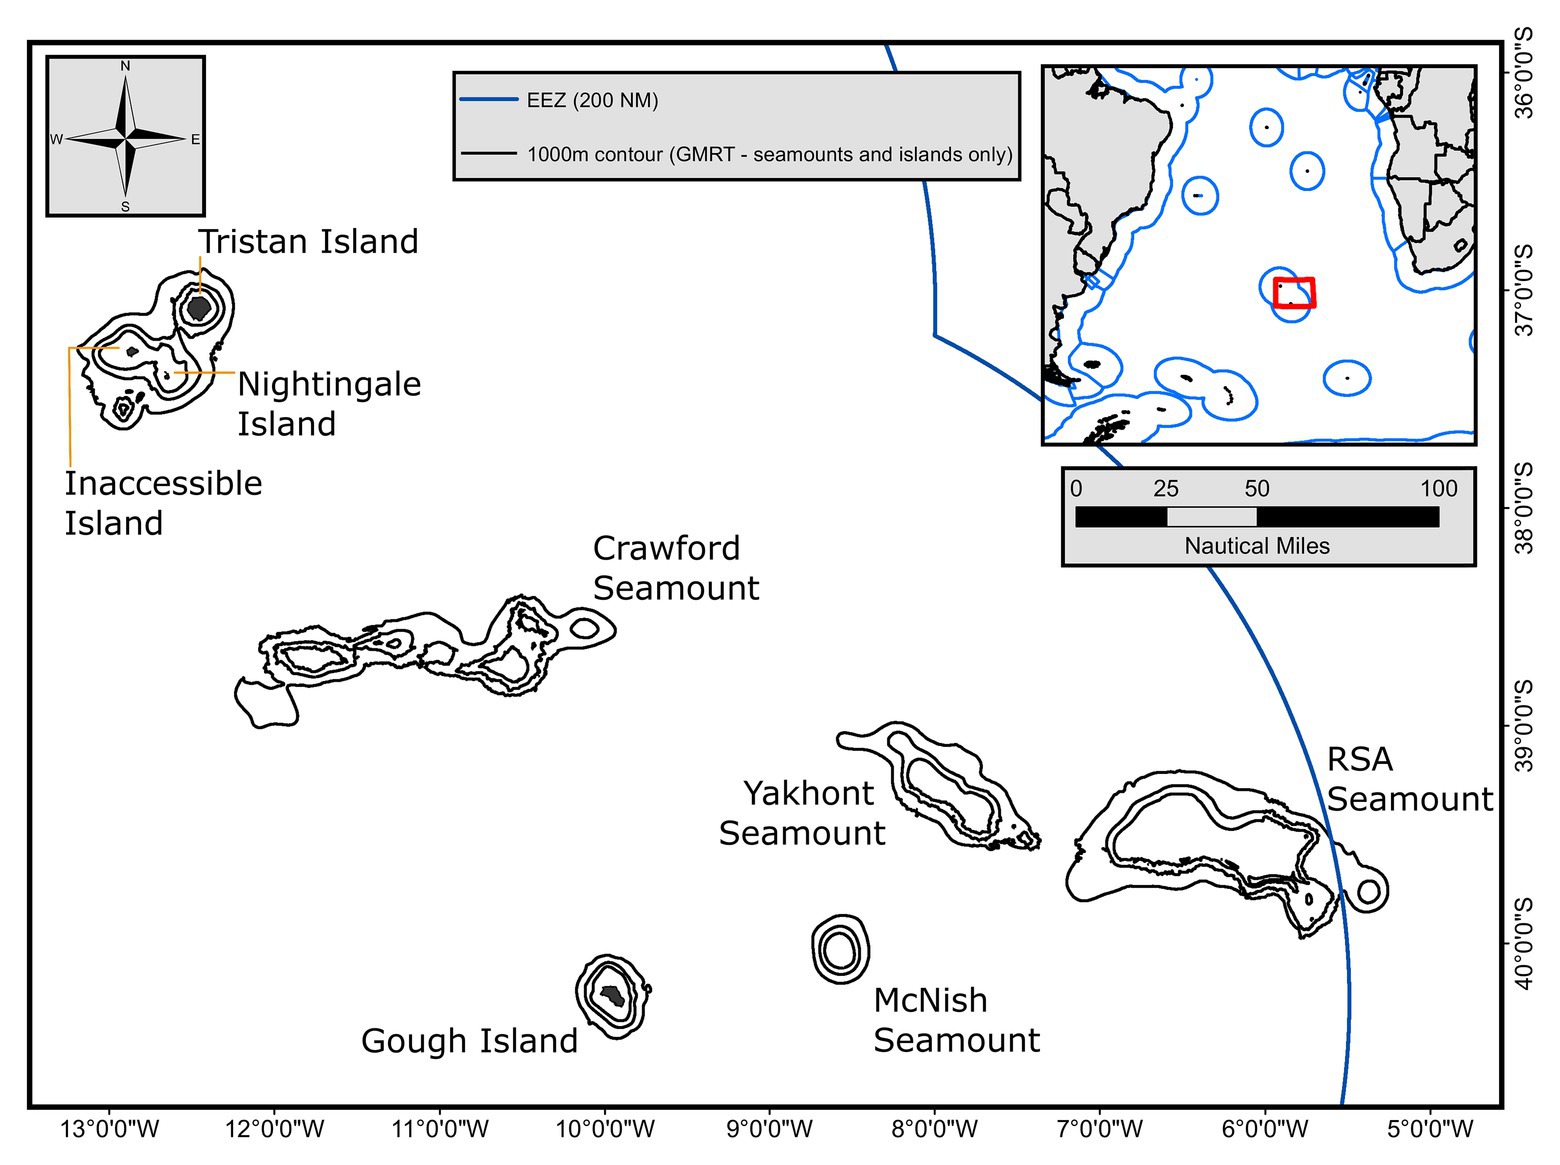
Figure 2. Map of the Tristan da Cunha (TdC) Exclusive Economic Zone (EEZ) highlighting the island groups (Tristan and Gough) and the seamounts that comprise the commercial fishing grounds. One, two, and three thousand meters contours derived from the GMRT v3.1 database and subset for the features of interest here.
Trawls were predominately at Yakhont and McNish seamounts, with a small number of trawls at RSA. The data presented here consists largely of opportunistic sampling on board commercial vessels, often in topographically complex areas, and, as such, does not conform to a standardized spatial distribution (e.g., stratified by depth). This is largely unavoidable, given the operational limitations of working in such a remote location, but for the purposes of determining ecological and life history strategies of bluenose, is nonetheless reliable.
In addition to observations of commercial fishing, two research fishing surveys were also completed. The first of these targeted the RSA Seamount in November 2017, and the second, the McNish Seamount and the Gough Island margin in April 2018 (Table 1). The Gough Island margin has never been subject to commercial fishing, and only a limited amount of subsistence fishing has ever occurred there, so was selected as a proximal baseline for examining demographic structure and catch rates in a putatively unimpacted stock. The island margin remains closed to commercial fishing.
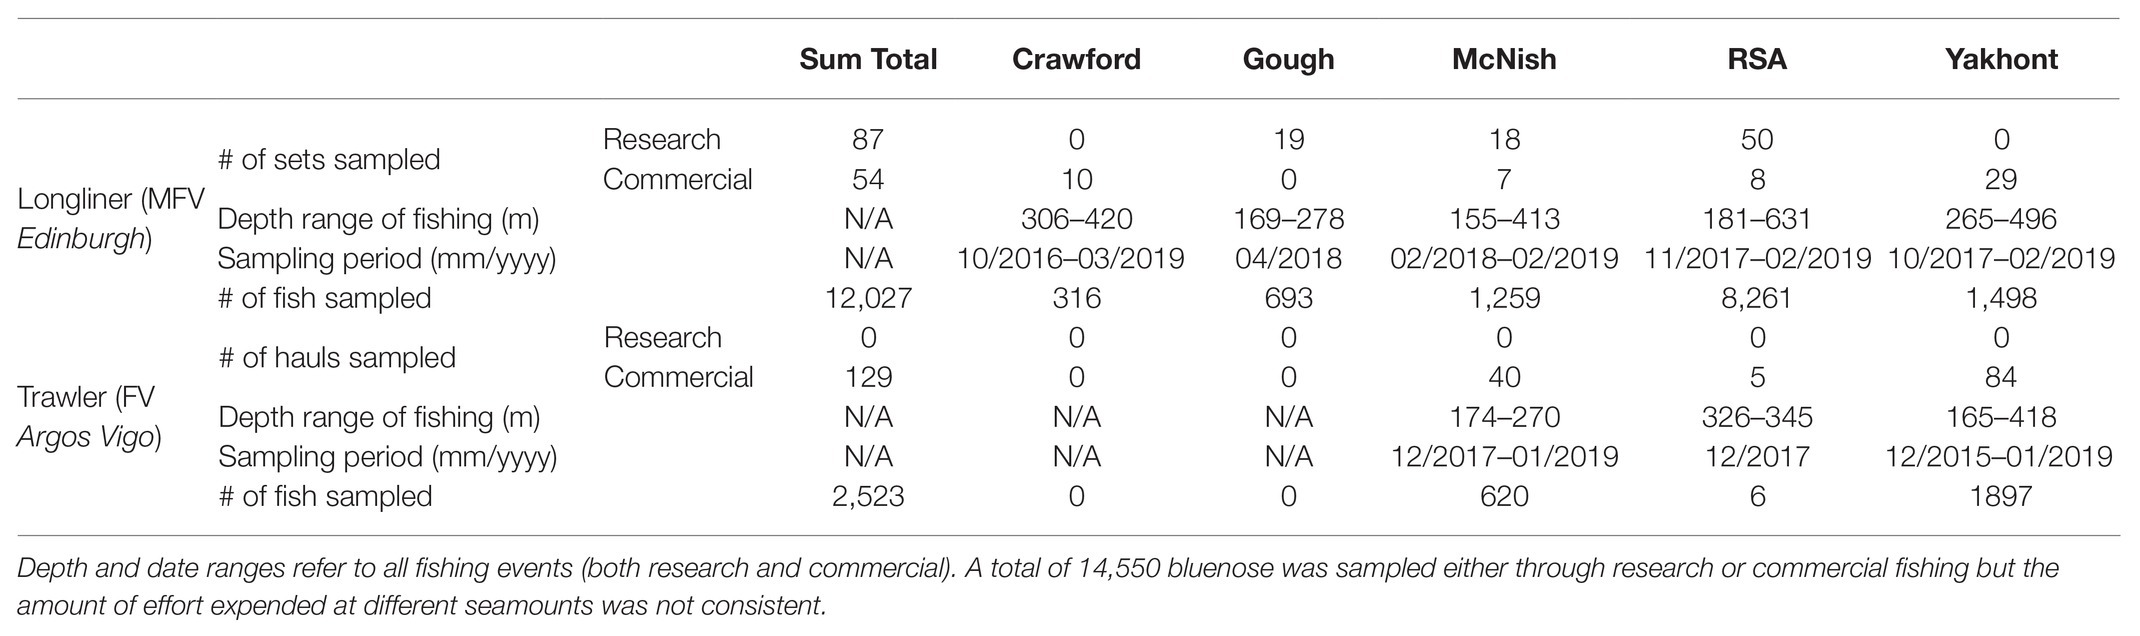
Table 1. Summary of sampling conducted as part of this study.
Further to this, two dedicated research surveys, on board the RRS James Clark Ross in March 2018 and the RRS Discovery in March 2019, were conducted and focused on the habitats and species composition of the four seamounts where commercial fisheries for bluenose have operated (Morley et al., 2018; Whomersley et al., 2019). During these surveys, swath bathymetric and oceanographic data were collected and used to inform a model of habitat preferences. The swath data were used to compute derived topographic products (bathymetric position index, rugosity, slope, and aspect) using the “terrain” function in the “raster” library in R (Hijmans, 2019).
Gear Descriptions
The MFV Edinburgh used a Spanish double longline system. Five research lines of 1,026 hooks were set every night, each with one anchor (>40 kg) and one beacon on a balloon float attached to the main line. During the commercial fishery, overnight, the vessel set two lines of 5,400 hooks supported by two anchors and two sets of balloon floats. Each commercial line was observed for at least 40% of hooks but up to 100% where observer staffing was available. The main line was 16 mm polypropylene rope and the fishing line was 6 mm polypropylene. Hook snoods were attached at 1.7 m intervals and were made of 1.2 mm monofilament line with 13/0 circle hooks attached and baited with Pacific Saury (Cololabis saira). The line weights were 4.6–6.2 kg (mean 5.4 kg). Distance between the line weights was 91 m.
The FV Argos Vigo used two demersal trawl nets equipped with 2 ton trawl doors, 21–24″ rubber rockhoppers, and steel bobbins. Hauls were directed on the seamount plateaus (120–448 m), with haul durations of 15–195 min. Data were collected from 119 hauls over 21 days, with a minimum of 100 individuals per haul.
Fisheries Data Collection
At least 100 bluenose warehou (all if less captured) were sampled, per set or haul, for biological analyses. This included measurement of the total length (TL), individual mass within 10 g, and assigning maturity stage, following Baelde (1996) scale for this species (Table 2).
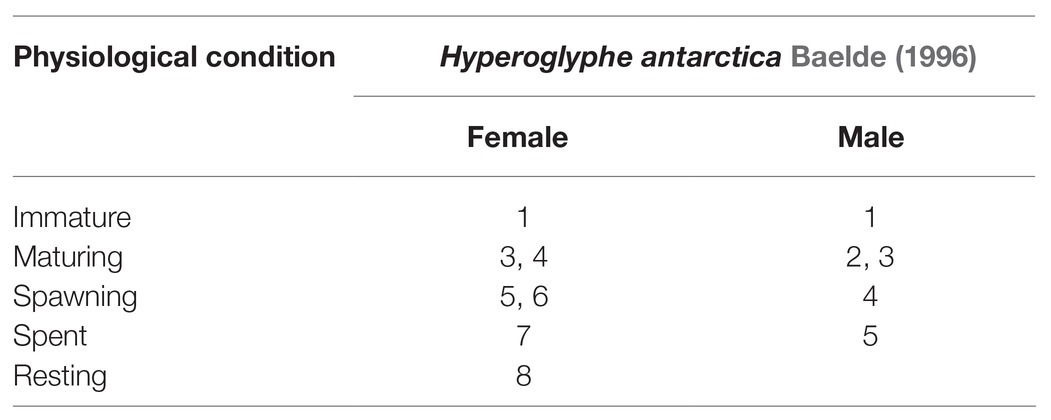
Table 2. Comparative characteristics of maturity scales in bluenose warehou used by Tristanian fishery observers.
Conversion factors of bluenose were measured on board the Argos Vigo in December–January 2017–2018, and on the MFV Edinburgh in April 2018. The ratio of green-processed weight of headed and gutted fish was 1.62 (n = 24; ±0.03). The ratio of green-processed weight of gilled and gutted fish was 1.18 (n = 376; ±0.03). A single observation of headed, gutted, and tail removed was also made, with a conversion factor of 1.67.
Otolith Readings
In total, 650 sagittal otolith pairs, collected during the 2017–2018 fishing season, were sent to Fish Aging Services for reading. The otoliths were embedded, in two rows of between two and four (depending on the size of the otolith) in blocks of Polyplex Clear Ortho Casting Resin ensuring that the primordium of each otolith was aligned. This allowed up to four otoliths to be sectioned in one cut. Four sections, approximately 300 μm thick, were cut through the otolith with at least one of the sections containing the primordium. Sections were taken using a modified high-speed gem-cutting saw with a 250 μm thick diamond impregnated blade. The four sections from each row of samples were cleaned, dried, and mounted on clear glass microscope slides (50 × 76 mm). The coverslip was affixed using the same embedding media.
Annual age estimates were made using a Leica dissecting microscope. The age of a sample was determined by counting the sequence of alternating translucent and opaque zones from the primordium to the otolith edge. To avoid the introduction of bias, the magnification at which otoliths were read remained consistent at 20x; on occasion, the magnification was increased to resolve fine increments close to the edge of the section in older fish.
A customized image analysis system was used to age sections. The system counts and measures manually marked increments and collects an image from each sample aged. A charge-coupled device (CCD) digital camera is mounted onto the dissecting microscope (Leica MZ80), and a live image is displayed on the monitor. Using the image analysis system, a transect is drawn on the otolith image from the primordium to the edge of the sample on the dorsal side of the sulcus (viewed in vivo). The positions of the opaque increments along this transect and the otolith edge were marked with a screen cursor. The numbers of zones marked, the measurements from the primordium to each subsequent mark along the transect, and observations on each sample were exported to a Microsoft database.
To avoid the potential for biasing age estimates, all counts were made without knowledge of fish size, sex, and location. Once age estimates are completed, the aging data was combined with the biological and capture data for subsequent analyses.
Statistics
Statistical tests were conducted in the R statistical environment. Length-weight relationships were compared using a multivariate ANOVA. Length at maturity was calculated using a generalized linear model (GLM; distribution family: binominal). Relationships between length and depth were tested using a GLM that allowed for random effects from sex and seamount.
Bluenose habitat preferences were described with a generalized additive model (R package MGCV) using a number of geomorphological factors (depth, slope, aspect, terrain ruggedness, and topographic position index), with survey catch per unit effort (CPUE) as a response variable.
Life history parameters (Von Bertalanffy growth curves) were estimated for females and males using a non-linear least squares model and bootstrapped (1,000 iterations) using the “Stats” and “FSA” packages in R (Ogle et al., 2020).
Stable Isotope Analysis
Eye lens proteins were targeted to recover life history records of stable isotope compositions from individual fish (Wallace et al., 2014; Quaeck-Davies et al., 2018). Frozen eye lenses were selected from 11 bluenose individuals, from a set of 65 individuals sampled on board the Argos Vigo, in January 2018 from the McNish and Yakhont seamounts. The relationship between external lens diameter and fish body length was determined to allow subsequent estimates of fish length associated with lens diameter. Sequential layers of lens protein tissue were removed using a scalpel and tweezers under a binocular dissecting microscope until the solid core of the lens was reached resulting in approximately 10–23 layers per lens, depending on size. Samples were freeze dried and then ground into a powder. Individual samples, of 0.6–0.8 mg, were weighed into tin boats prior to isotopic analysis.
The stable isotope composition of carbon and nitrogen in eye lens protein samples was determined in the SEAPORT stable isotope facility at the University of Southampton. A Vario ISOTOPE select elemental analyzer coupled with an Isoprime 100 isotope ratio mass spectrometer (IRMS) was used to measure isotope ratios.
Laboratory standards Acetanilide (ACET), glutamic acid, and fish muscle protein were used for quality control. USGS40 (L-Glutamic Acid) was used as an internal reference material. Data were reported via the standard notation, δ values per thousand units (per-mille, ‰) relative to international standards Pee Dee Belemnite for δ13C and nitrogen in air (N2) for δ15N. The long-term precision for determination of protein δ13C and δ15N values in the Seaport facility estimated from the SD of repeated measures of laboratory internal standards is under 0.2 ‰ for both isotopes.
A single pair of lenses from both eyes of one fish was analyzed to establish sampling precision. Isotope ratios were closely correlated between the two eyes. For a given lens diameter, stable isotope delta values differed between approximately 0.02 and 0.25 ‰ for δ13C ratios and between 0.1 and 1.5 ‰ for δ15N. The greatest differences were associated with a period of marked reduction in isotopic ratios of both carbon and nitrogen, between 6 and 10 mm lens diameter (estimated fork length of 30–45 cm), and offsets between lenses indicate errors in estimating lens diameter during sequential sampling.
Results
Seafloor Topography and Survey Catch Rates
There were no significant differences in bluenose CPUE between any of the areas surveyed during research fishing longline sets (kg per 1,000 hooks; the Gough Island and the McNish and RSA seamounts; ANOVA: F = 2.27, p = 0.11, Tukey’ test pairwise p: 0.13–0.95).
The strongest drivers of differences in standardized survey CPUE (Figure 3) were time of the year and aspect, together with the effects of depth and distance to slope break within individual seamounts. Survey CPUE was generally the highest in depths of 350–550 m, corresponding to a bottom temperature of 6–8°C. Other factors had varying, typically non-linear relationships with CPUE which were likely to some degree indicative of the influence of the conditions upon vessel efficiency (e.g., highest seafloor roughness generally predicted lower CPUE, but it was not clear whether this was a product of bluenose habitat preference, or the difficulties of fishing particularly rough grounds). Nautical area scattering coefficient (NASC; Campanella et al., submitted, this issue), a measure of mesopelagic biomass density, was strongly autocorrelated with spatial CPUE trends at McNish but low acoustic survey coverage at RSA prevented broader comparisons. NASC was however predominantly a product of depth and aspect (e.g., strongest NASC was on the SW flank of McNish in waters 200–400 m deep).
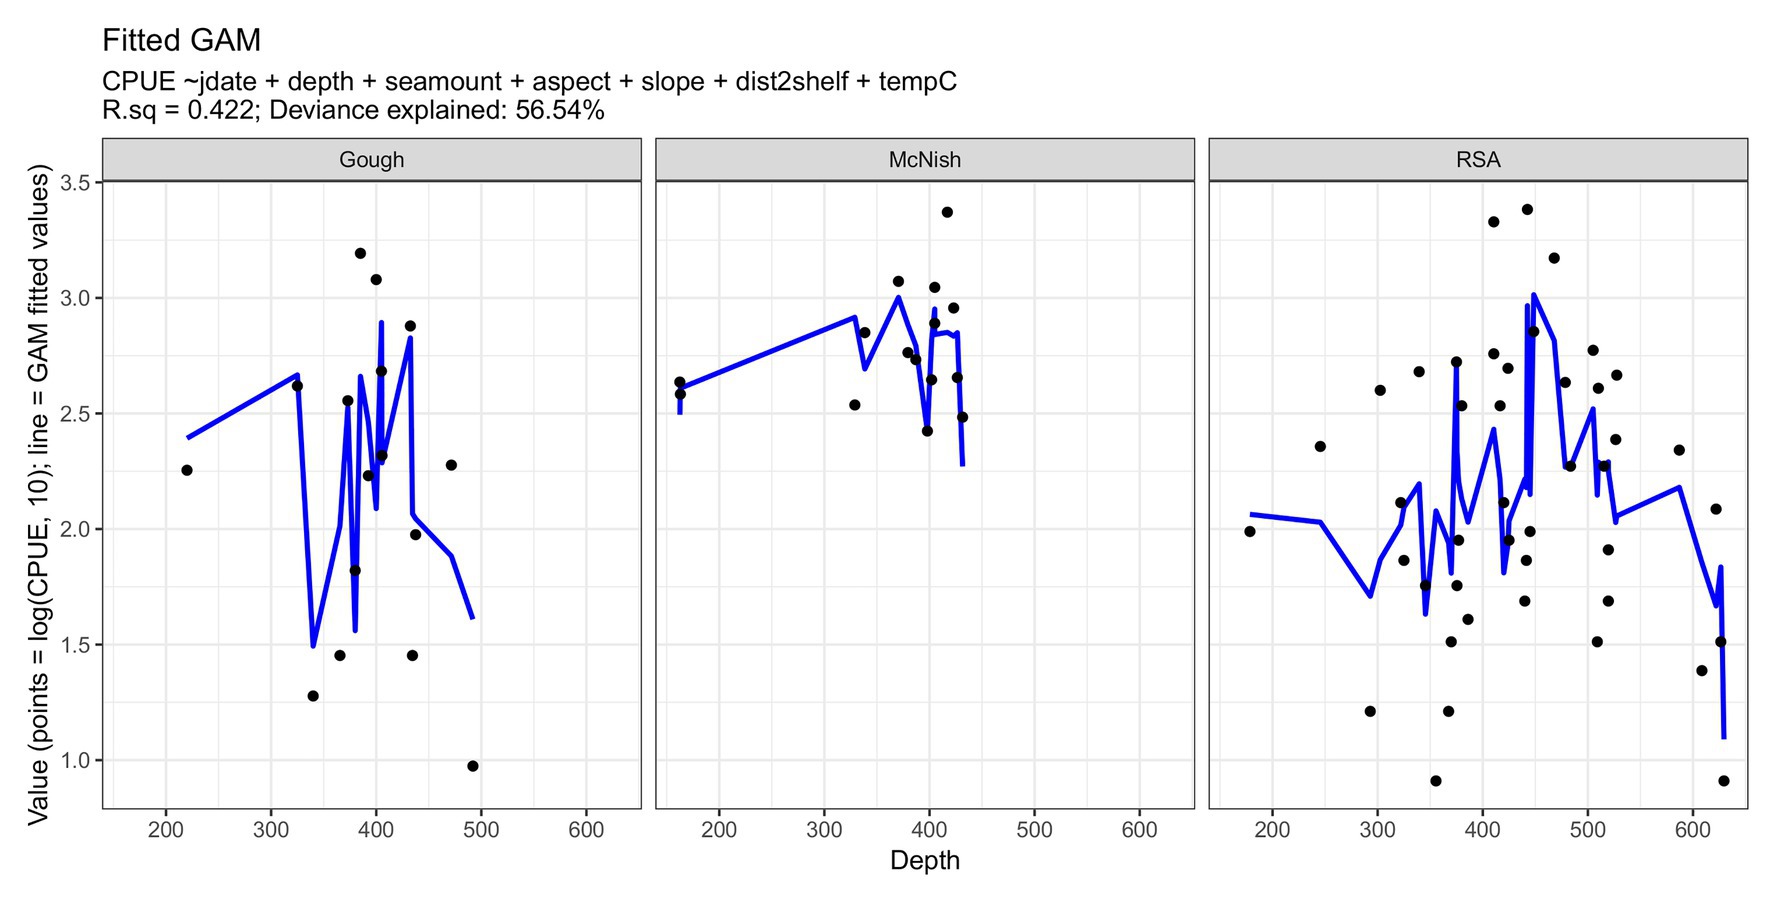
Figure 3. Comparison of standardized research fishing surveys at Gough, McNish, and RSA in the 2017–2018 fishing season (Spanish line set up only, and no commercial fishing data included). CPUE (points) and fitted values (lines). Jdate = julian day; dist2shelf = linear distance from shelf break (given as 400 m contour) and tempC = Temperature (°C).
Bluenose Biology
The sex ratio of male to female bluenose sampled was 0.80:1 (n = 5,957: 7,484). There was a significant difference in the length-weight relationship between sexes and all seamounts (MANOVA: Fseamount = 719.7 and Fsex = 1286.0; p < 0.001), but the effect size was small (Figure 4). Females ranged in total length between 51 and 130 cm (mean = 87 cm) and weight between 1.7 and 35.2 kg (mean = 11.1 kg). Males were slightly smaller, with a length range of 51–122 cm (mean = 81 cm) and a weight range of 1.2–33.0 kg (mean = 8.6 kg). The oldest individual observed was a 117 cm long female, estimated at 44 years of age, but the majority of individuals were under 10 years old (355 of 650 individuals, compared with only 32 older than 30 years).
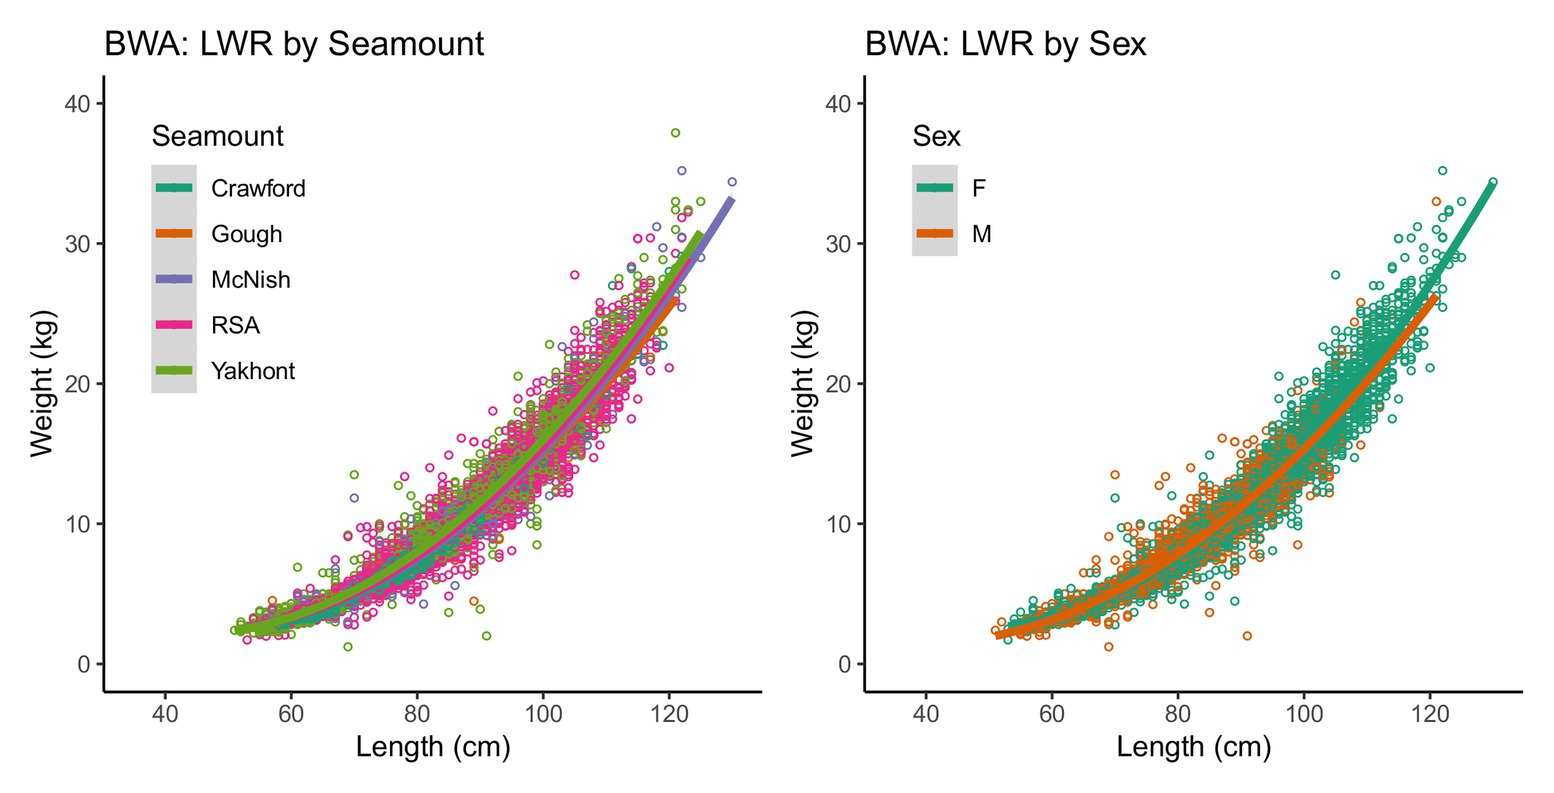
Figure 4. Length-weight relationships (LWR) for sampled bluenose (BWA) by seamount and by sex (14,550 individuals).
At the RSA seamount, post-spawning (resting) females and males were commonly observed between November and April, indicating that there is likely a protracted spawning period spread over most of the austral spring and summer (Figure 5). There were insufficient data to examine whether the seasonal pattern is spatially explicit to individual seamounts, since no seamounts were sampled in all months. Males matured at smaller sizes than females (Figure 6; Table 3). The proportion of mature female fish declined above total lengths of above 115 cm.
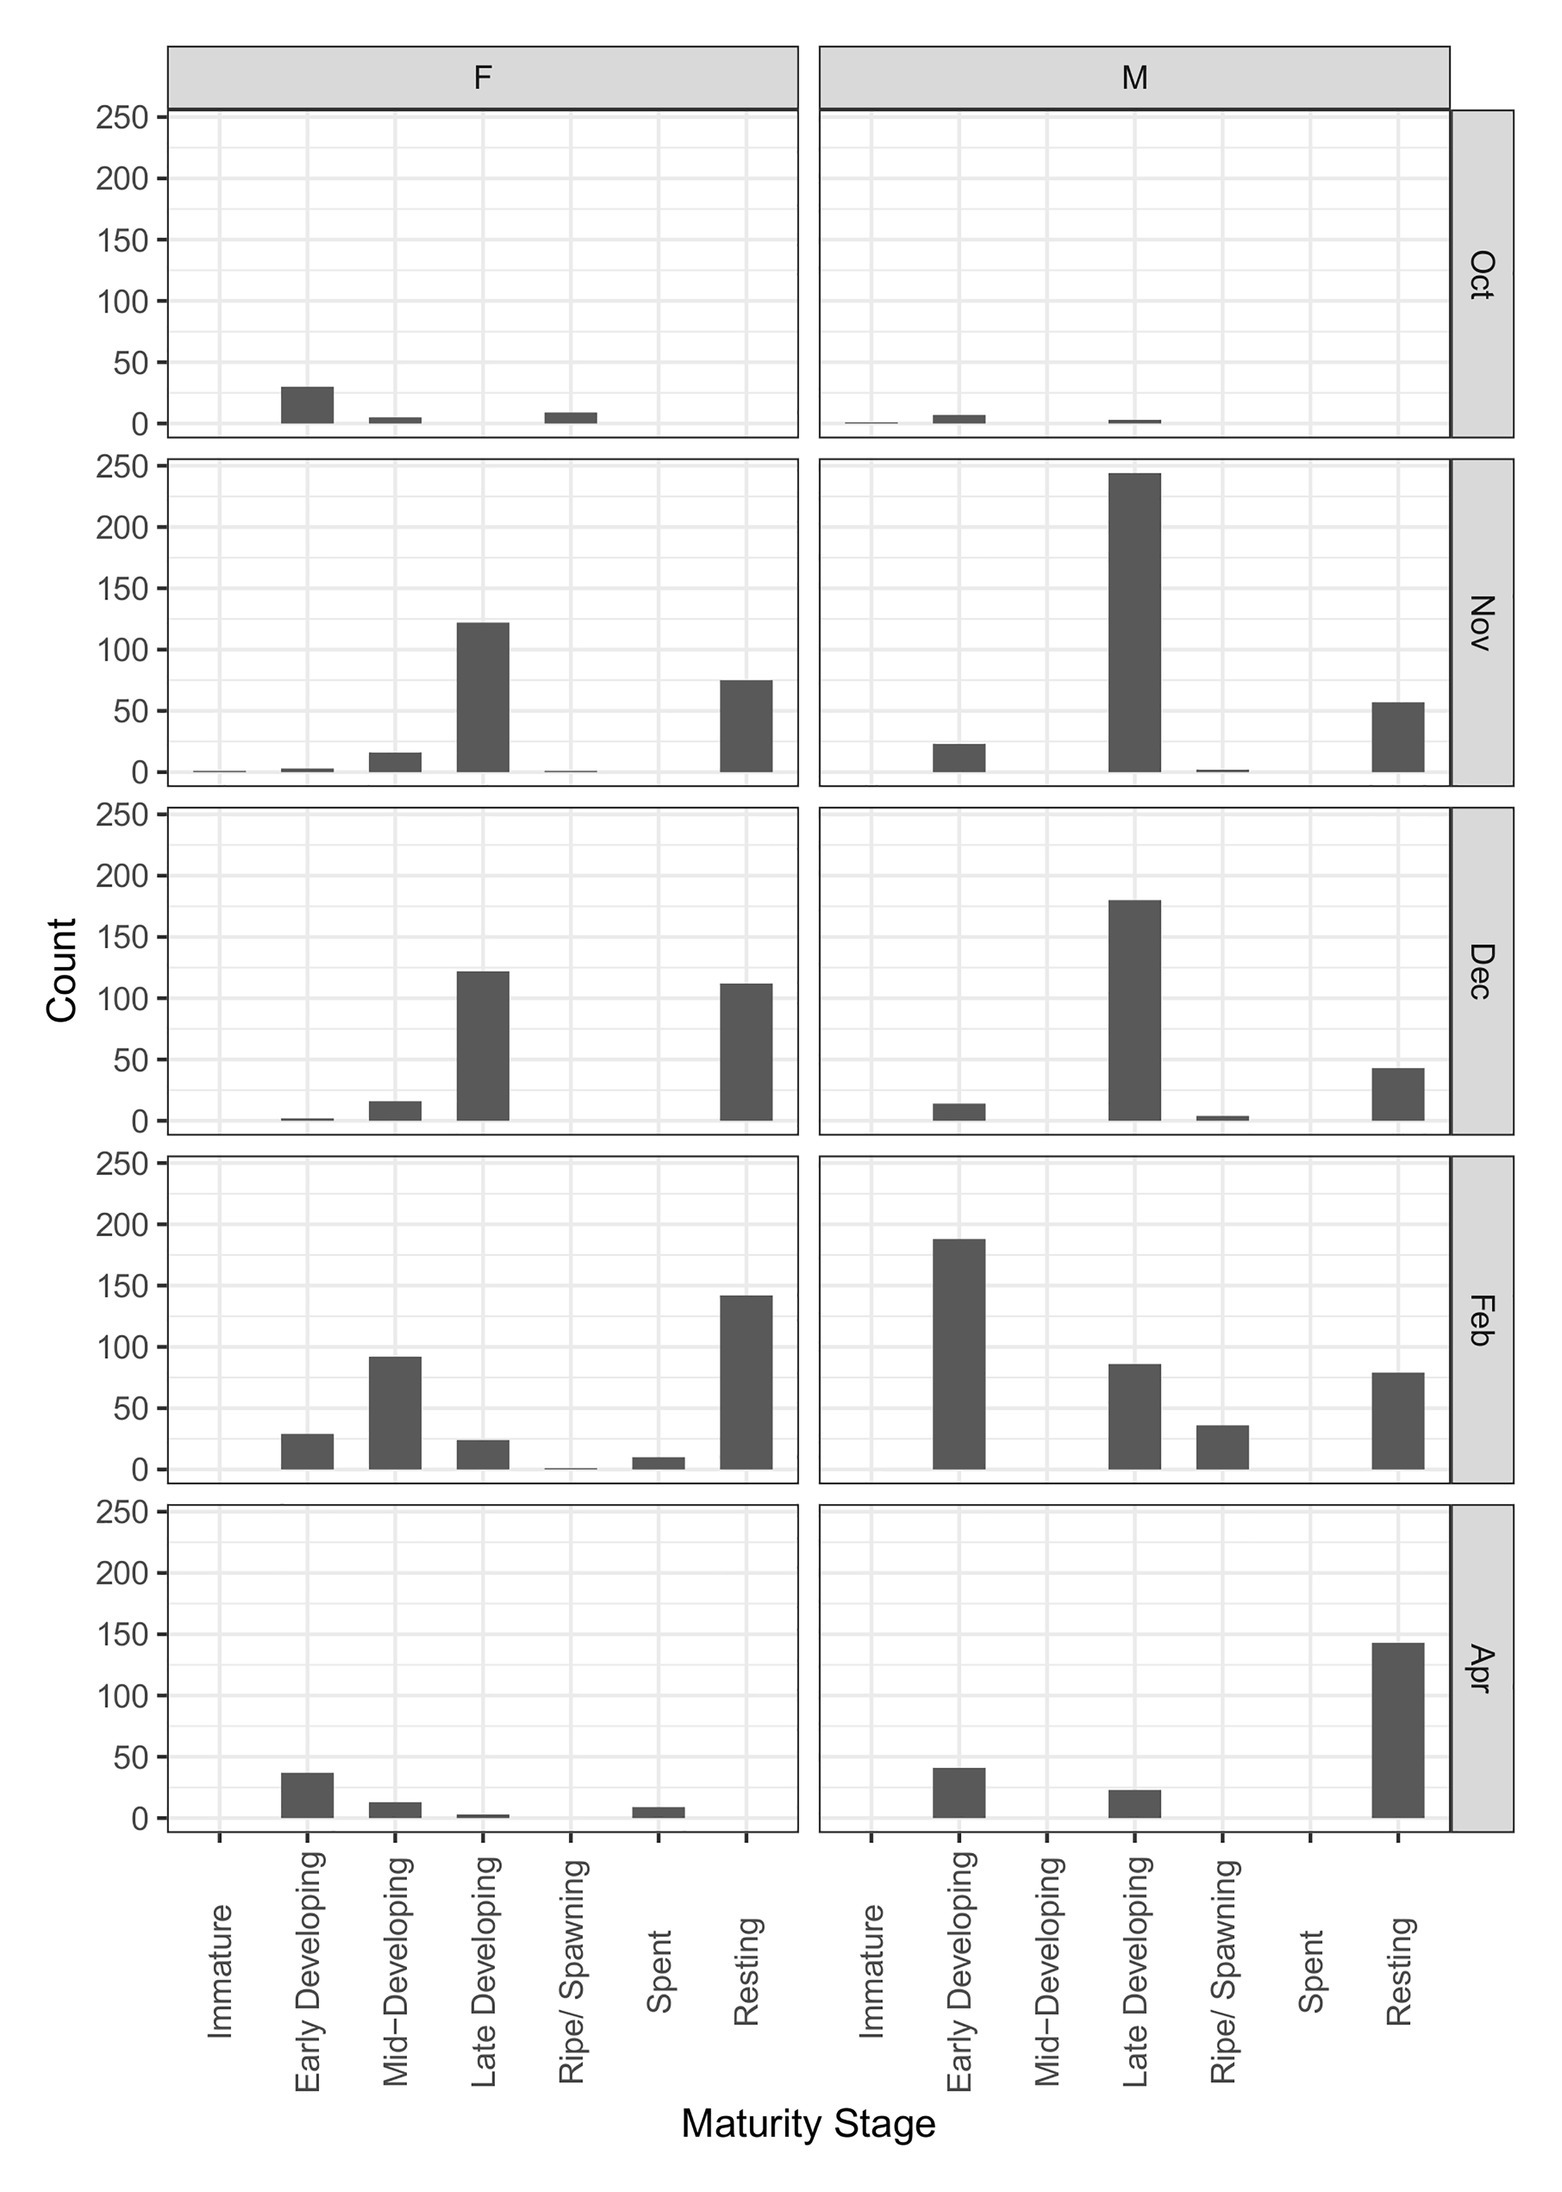
Figure 5. Change in female and male maturity stages by month (RSA seamount only). Observations cover two fishing seasons; October 2017 to February 2019. N = 2,819.
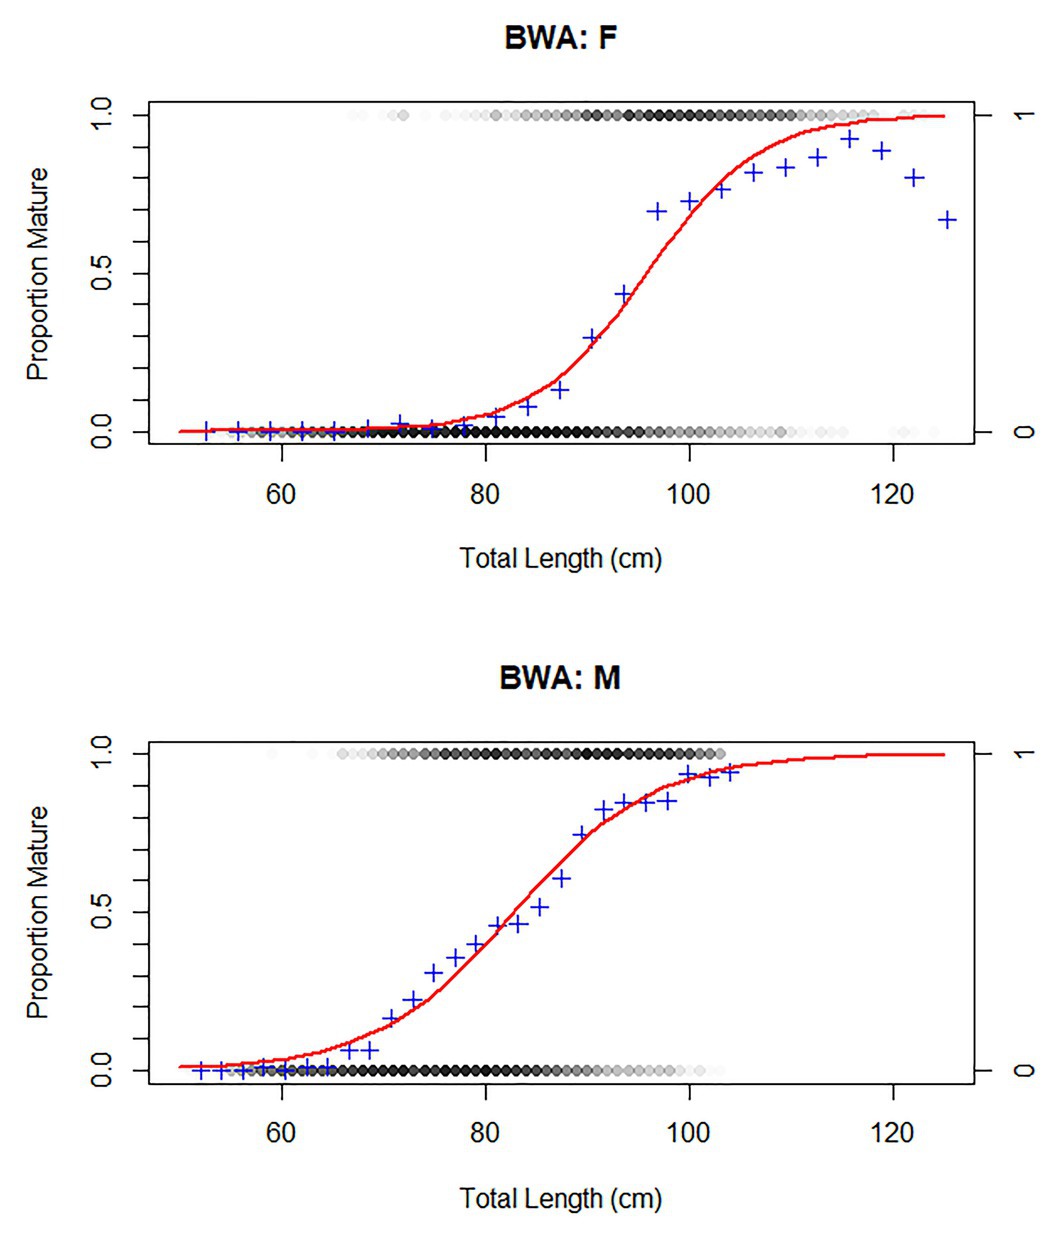
Figure 6. Size at maturity of bluenose males and females. Individuals included that had at least a classified maturity stage of “early maturing” (Table 1). Red curve represents a generalized linear model (family: binomial) to estimate proportion of individuals, within 2 cm TL bins, that were of this maturity stage or higher (blue cross). BWA = FAO code for bluenose warehou.
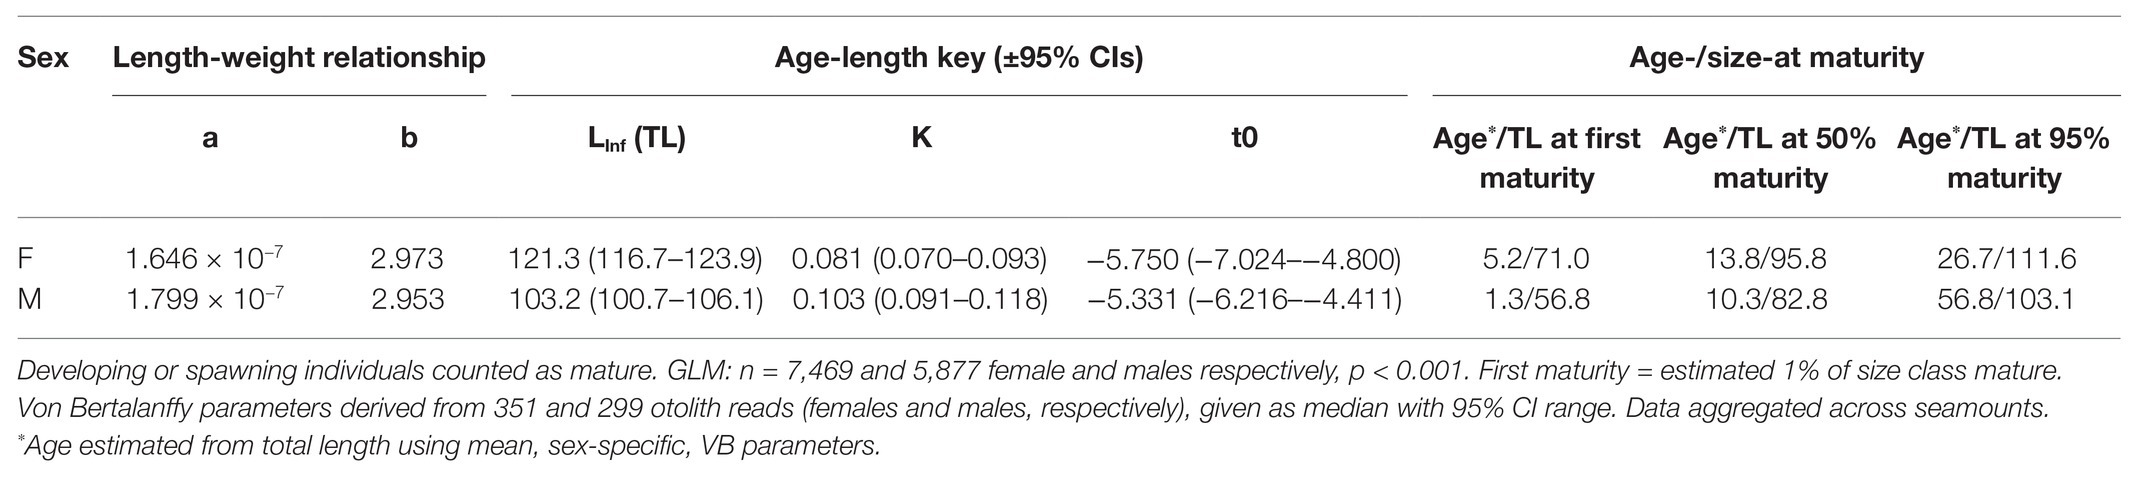
Table 3. Life history parameters and age (years) and total length (cm; TL) at first (1% of population), 50 and 95% maturity in female and male bluenose.
Aged fish spanned a range of 53–128 cm total length and 2–44 years of age. Females typically had LInf (maximum total length) values of around 18 cm greater than males (121 and 103 cm TL, respectively; Figure 4; Table 2).
Stable isotope compositions of bluenose eye lenses generally varied with size, with minimal sex-specific differences (Figure 7). Both δ13C and δ15N values generally increased with body size, but a marked perturbation in the overall increasing trend was observed for both between approximately 30 and 45 cm TL. The magnitude and width of these transition zones differed slightly between sexes, but isotope ratios were correlated throughout life for both females and males (Pearson correlation coefficients; 0.73 and 0.54, respectively). Among-individual variance in δ13C and δ15N values was greatest toward the lens core, representing the earliest juvenile life stages.
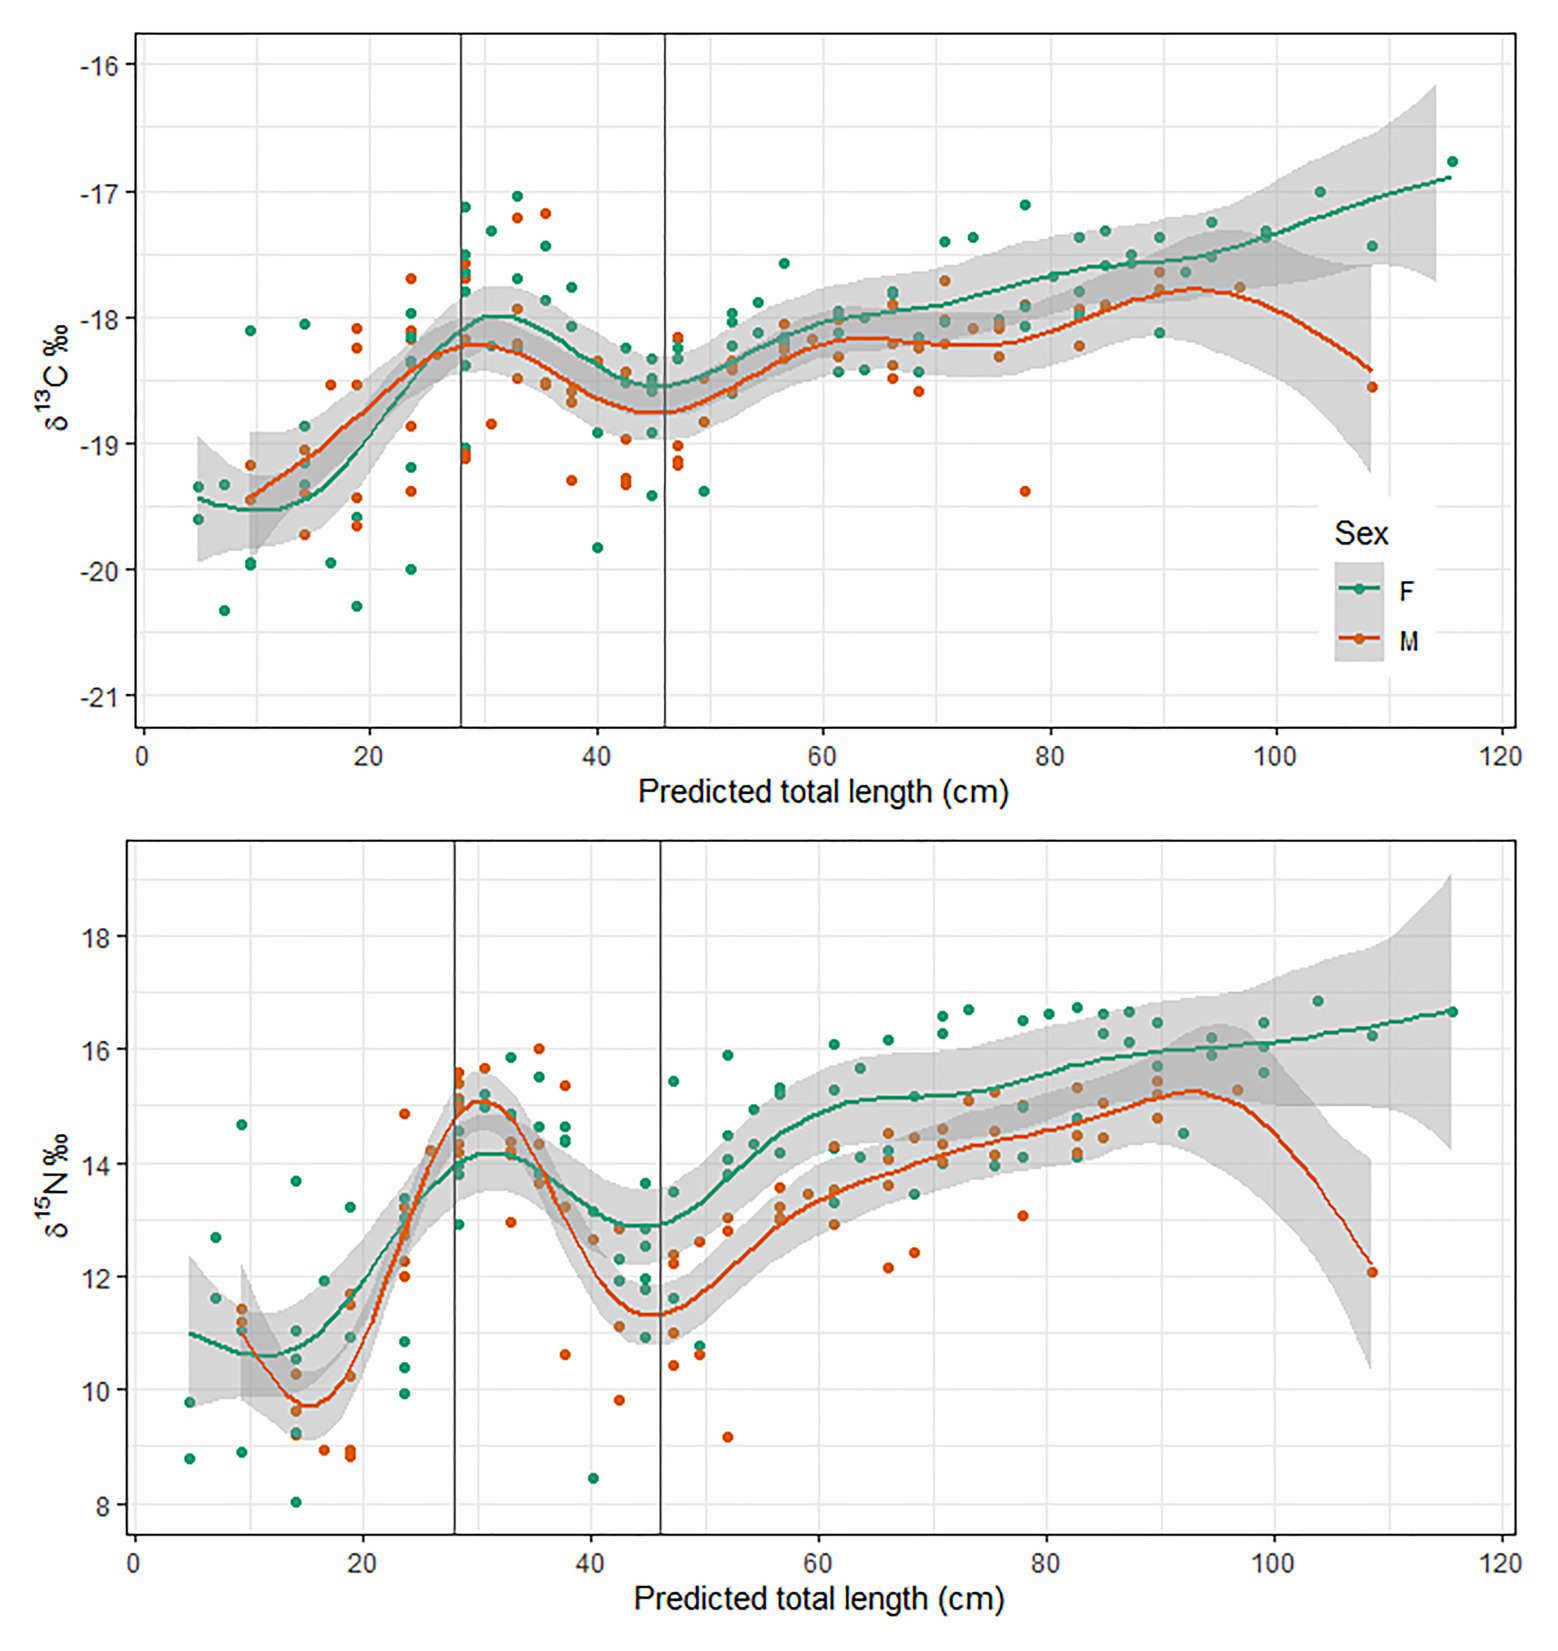
Figure 7. Sex disaggregated stable isotope chronologies of eye lenses from 11 bluenose sampled from the McNish and Yakhont seamounts in 2018. Fitted line = generalized additive model.
Across all seamounts bluenose female average total length increased marginally with depth (GLM: F = 9.38, R2 < 0.01, p < 0.01) from 94.4 cm (±9.3) in the shallowest depth range (150–200 m) to 104.7 cm (±7.2) in samples from deeper than 550 m (Figure 8). However, the effect size in females was slight (10 cm TL over 400 m) and potentially skewed by the deepest samples, of which there were few replicates. Male average size did not change significantly across the depth range (84.5 ± 13.7 cm at 150–200 m, compared with 81.6 ± 15.4 cm at 500–550 m). At RSA, the seamount sampled across the broadest depth range, mean length increased from 83.6 cm (±22.0 cm) to 105.5 cm (±6.1 cm) in females (150–200 and 600–650 m, respectively). Male size at depth had non-significant variation even within RSA.
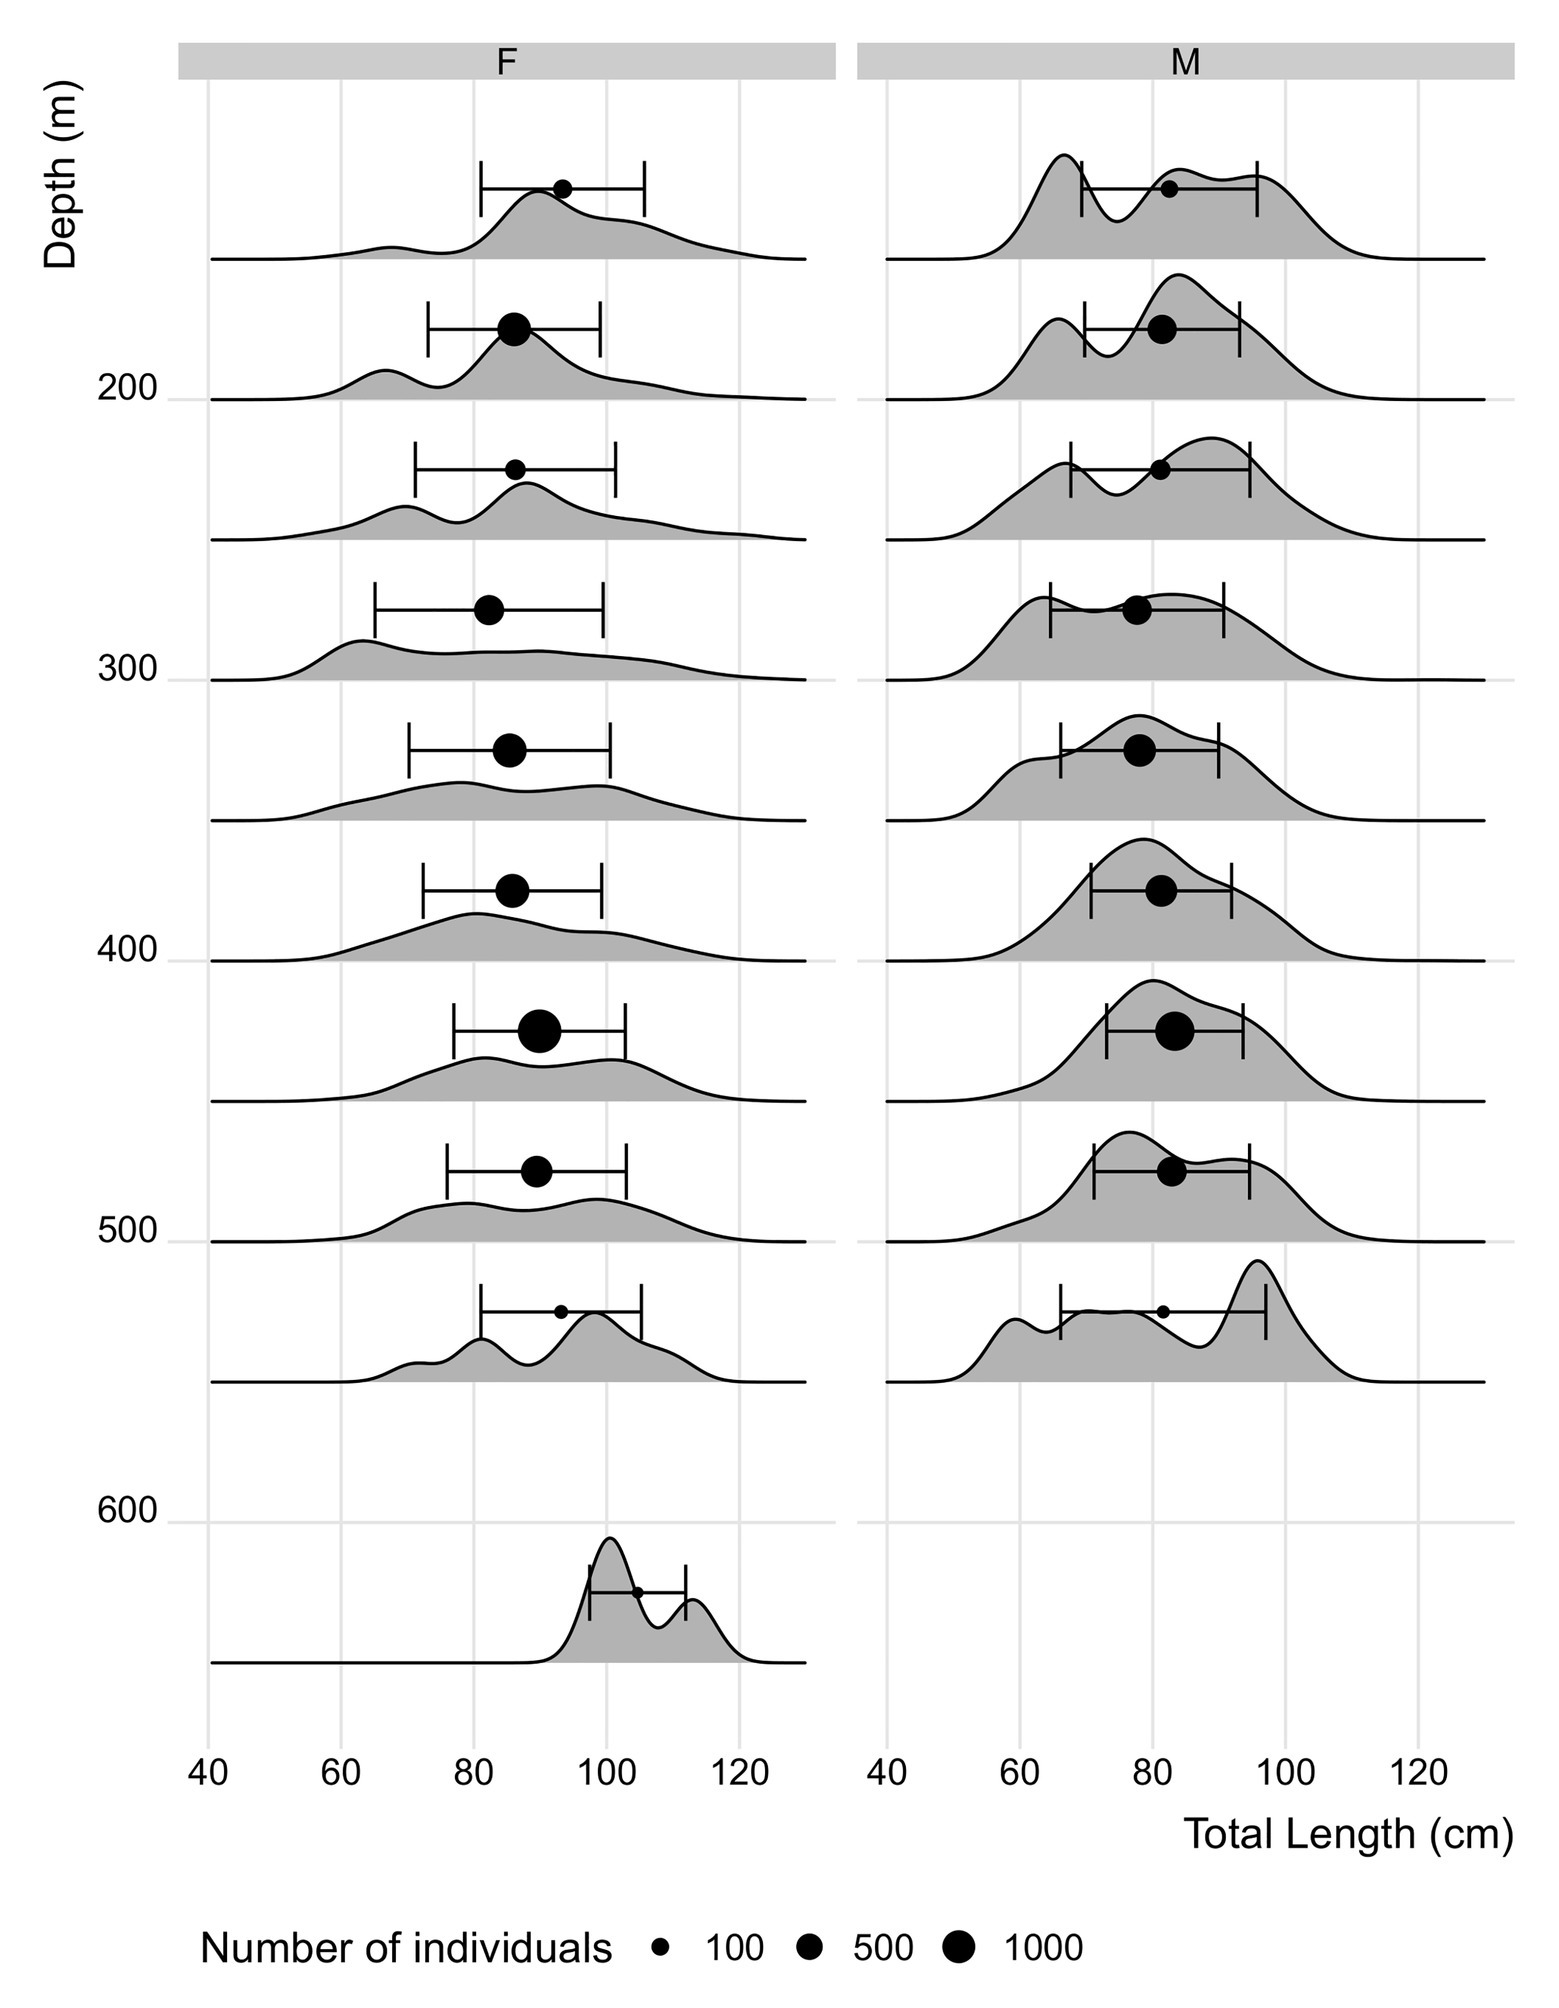
Figure 8. Length distribution at depth (50 m depth bin) in bluenose aggregated across all seamounts (data from individuals caught by longline only to reduce influence of bias in size selectivity between different gears). Points = mean length in depth class ± SD. Point size = number of observations within each depth bin.
Discussion
Survey Catch Rates and Habitat Availability
Survey catch rates of bluenose in the 2017–2018 fishing season were similar between Gough Island and McNish and RSA seamounts, in spite of the lack of previous commercial fishing around Gough (excepting a small amount of intermittent recreational catch during lobster fishing operations). This strongly suggests that the island margin has a lower inherent carrying capacity for bluenose than do the seamounts. It is also possible that differences in local current dynamics meant that the area of attraction was smaller and that areas not well represented by the survey lines (typically the steeper areas) have much higher densities of bluenose. Other species commonly caught around the Gough Island were typically those also represented in survey and commercial catch from elsewhere in TdC, predominately jacopevers (H. mouchezi), rockfishes (Sebastes spp.), and snoek (Thyristes atun). The survey at the Gough Island was intended to provide an indication of the capacity of the island margins, around which commercial fishing for bluenose is prohibited, to support the commercially exploited stocks on the four seamounts. The low catch rates, in spite of the lack of historic fishing, suggest that the islands have a lower carrying capacity and therefore provide more limited support to regional recruitment than might otherwise have been predicted.
The largest seamounts in the TdC EEZ are guyots, characterized by large, flat plateaus, surrounded by steep flanks that descend to more than 3,000 m. These plateaus occur at depths of between 160 m (McNish) to 550 m (Crawford) and the plateaux constitute a disproportionate amount of the total seamount footprint; RSA has a total footprint (to 3,000 m contour) size of approximately 7,530 km2, around 20% of which is comprised of the top plateau (between approximately 350 and 500 m depth). The island margins have similarly steep flanks but no comparable area of submarine plateau. This, we suggest, results in different oceanographic regimes between seamounts and islands that impact the amount of prey and habitat available for demersal species such as bluenose. The waters over the shallowest areas of the Yakhont, McNish, and Crawford seamounts host large aggregations of mesopelagic fish (mostly Maurolicus inventionis; Sternoptychidae; Parin and Kobyliansky, 1996; Morley et al., 2018; Whomersley et al., 2019; Campanella et al., submitted, this issue), an important diet species for bluenose and their prey (Laptikhovsky et al., 2019). At McNish, mesopelagic biomass and CPUE trends showed similar patterns in spatial heterogeneity, and it is likely that variability in both is driven by spatial trends in productivity, which in turn is underpinned by local-scale hydrodynamic force. At McNish Seamount, measures of nautical area scattering coefficient were the highest around the shelf break of the south-west flank (Campanella et al., submitted, this issue; Whomersley et al., 2019), corresponding to the region of the highest CPUE and biomass distribution (interpolated standardized CPUE). These areas in the waters above the seamount features provide important habitat for enhancing local productivity, habitat that is otherwise absent around the islands (Hosegood et al., 2019).
It is possible that island margin topography places constraints upon lateral circulation that limit the horizontal distribution of odor trails, thereby confining the area from which a given line attracts fish to a greater extent than on the seamounts. Variability within seamounts (interpolated CPUE) at McNish and RSA showed similar levels of variation at Gough. At both Gough and McNish, the survey CPUE was highest on the south-west margin, and spatially correlated with indices of mesopelagic biomass (Campanella et al., submitted, this issue).
Life History of Bluenose
We present here the first results on the life history of bluenose from the south Atlantic. Our results confirm findings from elsewhere that bluenose do not typically have strong sex-specific differences in life history parameters (Williams et al., 2017), except in maximum size (Horn et al., 2010). It is not clear, however, to what extent these results were biased by the lack of sampling from deeper water, that is favored by larger individuals. This size-depth relationship however was not apparent in the data from TdC bluenose (Figure 8). Some differences in life history were apparent; females had a greater maximum size (Median LInf was 18 cm larger for females; Table 2) and generally matured later. Similarly, while the oldest fish observed was 44 years old, the history of commercial fishing and the limited sampling in deeper water meant that maximum longevity could be well in excess of this figure for south Atlantic bluenose and comparable to the largest estimates from elsewhere (76 years; Horn et al., 2010). Catches of bluenose in the TdC zone have historically been comprised of a high proportion of young, relatively immature fish (median catch-at-length = 81 cm for males and 87 cm for females). The impact of these removals upon future recruitment trends may however be mitigated by the minimal exploitation on the island margins, or in deeper waters (>600 m) though, as previously stated, there is only very limited information from these areas at present, and less still to suggest that these represent very substantial reserves of biomass.
Ontogenetic variations in stable isotope compositions from eye lens proteins generally co-varied consistently with body size, with close agreement among the 11 sampled individuals. In all sampled fish, δ13C and δ15N values show a marked isotopic perturbation between around 30 and 45 cm TL (Figure 7). We infer that this phase reflects a period of transition from the pelagic environment to the demersal habitat favored by adult fish. These data subsequently helped inform recruitment parameters for the assessment of these stocks and provided an important, fishery-independent measure of minimum recruitment size (i.e., free from factors relating to selectivity of different gears). Recruitment to demersal habitat at around 30-45 cm TL is consistent with observations from other areas where bluenose has been studied (Horn, 1988; Duffy et al., 2000; Fisheries New Zealand, 2018), and with data from fisheries observers (individuals <30 cm TL very rarely observed in catch). There is very limited available information regarding local isotopic baselines from which to infer further on behavioral changes during this period, and diet information exists only for larger fish (Laptikhovsky et al., 2019). Juveniles of other centrolophid species in the Mediterranean largely consumed gelatinous zooplankton and chaetognaths (Battaglia et al., 2014), which are also a common dietary component of adult bluenose around TdC (Laptikhovsky et al., 2019). Distribution and life history of bluenose, and of centrolophids generally, remain very poorly known (Kailola et al., 1993; Williams et al., 2017). The combination of pelagic and demersal ontogenetic phases makes bluenose an interesting, though challenging subject. In related work, we explored the potential for modeling larval dispersal of this species from TdC but concluded that the paucity of information on life-history (e.g., transition between planktonic and nektonic phases, or behavior during nektonic phase) meant that any dispersal model would be too uncertain to be informative for stock management (Heyworth et al., submitted, this issue).
Relationships Between Size and Depth
In other areas where bluenose occurs, there is an observed increase in length with depth (Kailola et al., 1993; Cordue and Pomaréde, 2012). Over the depth range (ca. 150–650 m), we were able to sample on TdC seamounts, there was only a very slight increase in mean size, and only in females. This may be as a result of limited sampling across depths from all seamounts (only RSA was sampled across the full depth range and the change in length over depth was greater than the global average at this seamount). Further, sampling in depths >600 m are important for future efforts to understand and manage this species, which is known from TdC and elsewhere to occur deeper than 1,000 m (TdC Fisheries Dept., commercial fisheries data; Cordue and Pomaréde, 2012).
Conclusion
We present the first life history data of bluenose warehou from the south Atlantic, complementing recent work on diet and as part of a broad effort to better understand and manage the fisheries for this species in TdC. The data presented have been of fundamental importance for developing the stock assessment and management of bluenose. Through the work of TdC Government, the UK Blue Belt Program, and their partners, this fishery is now subject to a raft of conservation measures and catch limits, including the prohibition of demersal trawling and the creation of no take zones, to help protect vulnerable species such as cold water corals, deep-sea sharks, and seabirds.
Data Availability Statement
The raw data supporting the conclusions of this article will be made available by the authors, without undue reservation.
Ethics Statement
Ethical review and approval was not required for the animal study because all data and samples are from commercial and survey fishing activities, licensed by Tristan da Cunha Government.
Author Contributions
RB, GR, WG, JG, OY, and VL collected data while observing on board the fishing vessels. JB, DB, SM, VL, and MC collected data on board the research surveys. Commercial fisheries data were provided by JG. AB provided the bottom temperature model. HS and CT collected eye lens data. SR conducted the otolith reads. JB, VL, and OY prepared the manuscript. JB and VL conducted the analyses. CT, FA, and HS conducted otolith sampling and laboratory analysis. All authors contributed to the article and approved the submitted version.
Funding
This work was funded jointly by the UK Foreign and Commonwealth Development Office “Blue Belt” Program, and the British Antarctic Survey National Capability Program, under the UK’s Official Development Assistance Provisions (NERC grant NE/R000107/1).
Conflict of Interest
The authors declare that the research was conducted in the absence of any commercial or financial relationships that could be construed as a potential conflict of interest.
Acknowledgments
We are grateful to the masters and crew of the research and fishing vessels upon which scientific data were collected, to the Master of the MFV Edinburgh for their cooperation during the fisheries surveys, and to Tristan da Cunha Government for their support during this research. These data are the property of Tristan da Cunha Government and can be made available upon request.
References
Annala, J. H. (1994). Report from the Fishery Assessment Plenary, May 1994: stock assessments and yield estimates. Wellington: MAF Fisheries Greta Point Library, 242.
Armitage, R. O., Payne, D. A., Lockley, G. J., Currie, H. M., Colban, R. L., Lamb, B. G., et al. (1994). Guide book to New Zealand commercial fish species. Revised Edn. Wellington, New Zealand: New Zealand Fishing Industry Board, 216.
Baelde, P. (1996). Biology and dynamics of the reproduction of blue-eye trevalla, Hyperoglyphe antarctica (Centrolophidae) off Tasmania, southern Australia. Fish. Bull. 94, 199–211.
Battaglia, P., Musolino, S., Esposito, V., Ammendolia, G., Consoli, P., Andaloro, F., et al. (2014). Feeding habits of juvenile fishes belonging to three medusivorous species (Centrolophidae and Nomeidae) from the strait of Messina (Central Mediterranean Sea). Mar. Biol. Res. 10, 927–933.
Collins, M. A., Bailey, D. M., Ruxton, G. D., and Priede, I. G. (2005). Trends in body size across an environmental gradient: a differential response in scavenging and non-scavenging demersal deep-sea fish. Proc. R. Soc. B Biol. Sci. 272, 2051–2057. doi: 10.1098/rspb.2005.3189
Cordue, P. L., and Pomaréde, M. (2012). A 2011 stock assessment of bluenose (Hyperoglyphe antarctica). New Zealand Fisheries Assessment Report 2012/06, 56.
Duffy, C. A. J., Stewart, A. L., and Yarrall, R. (2000). First record of pre-settlement juvenile bluenose, Hyperoglyphe antarctica, from New Zealand. N. Z. J. Mar. Freshwater Res. 34, 353–558.
Fisheries New Zealand (2018). Fisheries Assessment Plenary, May 2018: stock assessments and stock status. Volume 1: Introductory section to Groper. Ministry for Primary Industries, 511. Available at: https://www.mpi.govt.nz/dmsdocument/26332/direct
Froese, R., and Pauly, D. (2019). Hyperoglyphe antarctica. FishBase World Wide Web electronic publication. Available at: https://www.fishbase.se/search.php (Accessed May 03, 2020).
Hijmans, R. J. (2019). Raster: geographic data analysis and modeling. R package version 3.0–7. Available at: https://CRAN.R-project.org/package=raster (Accessed April 01, 2020).
Horn, P. L. (1988). Age and growth of bluenose, Hyperoglyphe antarctica (Pisces: Stromatoeidei) from the lower east coast, North Island, New Zealand. N. Z. J. Mar. Freshw. Res. 22, 369–678.
Horn, P. L., and Massey, B. R. (1989). Biology and abundance of alfonsino and bluenose off the lower east coast North Island, New Zealand. N.Z. Fish. Tech. Rep. 15:32.
Horn, P. L., Neil, H. L., Paul, L. J., and Marriott, P. M. (2010). Age validation for bluenose (Hyperoglyphe antarctica) using the bomb chronometer method of radiocarbon ageing. J. Fish Biol. 77, 1552–1563. doi: 10.1111/j.1095-8649.2010.02787.x
Hosegood, P. J., Nimmo-Smith, W. A. M., Proud, R., Adams, K., and Brierly, A. S. (2019). Internal lee waves and baroclinic bores over a tropical seamount shark ‘hot-spot’. Prog. Oceanogr. 172, 34–50.
Kailola, P. J., Williams, M. J., Stewart, P. C., Reichelt, R. E., McNee, A., and Grieve, C. (1993). Australian fisheries resources. Canberra, Australia: Bureau of Resource Science and Fisheries Research and Development Corporation, 422.
Laptikhovsky, V., Bell, J. B., Glass, J., Green, R., Glass, W., Benedet, R., et al. (2019). Feeding habits of bluenose warehou, Hyperoglyphe antarctica (Carmichael, 1819) (Centrolophidae) at seamounts of the southern mid-Atlantic ridge. Deep-Sea Res. I 156:103182. doi: 10.1016/j.dsr.2019.103182
Morley, S. A., Collins, M. A., Barnes, D. K. A., Sands, C., Bell, J. B., Walmsley, S., et al. (2018). Helping Tristan da Cunha and St Helena manage their marine environments. Report of James Clark Ross cruise 17–004. BODC cruise reports, 166.
Ogle, D. H., Wheeler, P., and Dinno, A. (2020). FSA: Fisheries stock analysis. R package version 0.8.27. Available at: https://derekogle.com/FSA/ (Accessed July 01, 2020).
Parin, N. V., and Kobyliansky, S. G. (1996). Diagnoses and distribution of fifteen species recognized in genus Maurolicus, Cocco (Sternoptychidae, Stomiiformes) with a key to their identification. Cybium 20, 185–195.
Piotrovsky, A. S. (1994). Stromateoidei in the southern part of Africa and adjacent areas (distribution, biology and fisheries). Main results of YugNIRO complex research in Azov-black seas region and the World Ocean in 1993. Proc. South. Sci. Res. Inst. Mar. Fish. Ocean. 40, 69–77.
Quaeck-Davies, K., Bendall, V. A., Mackenzie, K., Hetherington, S., Newton, J., and Trueman, C. N. (2018). Teleost and elasmobranch eye lenses as a target for life-history stable isotope analyses. PeerJ 6:e4883. doi: 10.7717/peerj.4883
Wallace, A. A., Hollander, D. J., and Peebles, E. B. (2014). Stable isotopes in fish eye lenses as potential recorders of trophic and geographic history. PLoS One 9:e108935. doi: 10.1371/journal.pone.0108935
Whomersley, P., Morley, S., Bell, J., Collins, S., Pettafor, A., Campanella, F., et al. (2019). Blue Belt Programme: RRS Discovery DY100 survey report.
Keywords: fisheries, seamount, United Kingdom Overseas Territory, Tristan da Cunha, Blue Belt, deep-sea
Citation: Bell JB, Laptikhovsky V, Barnes DKA, Benedet R, Bridges AE, Glass J, Glass W, Green R, Morley SA, Robertson S, Robson GR, Stanton H, Azzopardi F, Trueman CN, Yates O and Collins MA (2021) Life History and Ecology of Bluenose Warehou (Hyperoglyphe antarctica, Centrolophidae) in the Southern Atlantic. Front. Mar. Sci. 8:610172. doi: 10.3389/fmars.2021.610172
Edited by:
Wen-Cheng Wang, National Taiwan Normal University, TaiwanReviewed by:
Alan Williams, Oceans and Atmosphere (CSIRO), AustraliaRoberto Carlucci, University of Bari Aldo Moro, Italy
Copyright © 2021 Bell, Laptikhovsky, Barnes, Benedet, Bridges, Glass, Glass, Green, Morley, Robertson, Robson, Stanton, Azzopardi, Trueman, Yates and Collins. This is an open-access article distributed under the terms of the Creative Commons Attribution License (CC BY). The use, distribution or reproduction in other forums is permitted, provided the original author(s) and the copyright owner(s) are credited and that the original publication in this journal is cited, in accordance with accepted academic practice. No use, distribution or reproduction is permitted which does not comply with these terms.
*Correspondence: James B. Bell, james.bell@cefas.co.uk