Survival Rates and Capture Heterogeneity of Bottlenose Dolphins (Tursiops truncatus) in the Shannon Estuary, Ireland
 Kim E. Ludwig
 Mags Daly
 Stephanie Levesque
 Simon D. Berrow
- 1Marine and Freshwater Research Centre, Galway-Mayo Institute of Technology, Galway, Ireland
- 2Irish Whale and Dolphin Group, Kilrush, Ireland
Adult survival is arguably the most important demographic parameter for long-lived species as it has a large impact on population growth, and it can be estimated for cetacean populations using natural markings and mark-recapture (MR) modelling. Here we describe a 26-year study of a genetically discrete, resident population of bottlenose dolphins in the Shannon Estuary, Ireland, conducted by an NGO using multiple platforms. We estimated survival rates (SRs) using Cormack-Jolly-Seber models and explored the effects of variable survey effort, multiple researchers, and changes in camera equipment as well as capture heterogeneity induced by changes in marks and site fidelity variation, all common issues affecting longitudinal dolphin studies. The mean adult SR was 0.94 (±0.001 SD) and thus comparable to the estimates reported for other bottlenose dolphin populations. Capture heterogeneity through variation in mark severity was confirmed, with higher capture probabilities for well-marked individuals than for poorly marked individuals and a “transience” effect being detected for less well-marked individuals with 43% only recorded once. Likewise, both SR and capture probabilities were comparatively low for individuals with low site fidelity to the Shannon Estuary, and SR of these individuals additionally decreased even further toward the end of the study, reflecting a terminal bias. This bias was attributed to non-random temporal migration, and, together with high encounter rates in Brandon Bay, supported the hypothesis of range expansion. Our results highlight the importance of consistent and geographically homogenous survey effort and support the differentiation of individuals according to their distinctiveness to avoid biased survival estimates.
Introduction
For effective conservation of animal populations, regular assessment of demographic parameters such as population size and life history traits is essential (Berrow et al., 2012; Arso Civil et al., 2019). Population size over time is arguably the most frequently and relatively routine parameter assessed and can be used to detect trends in population status. However, to understand the underlying cause for any changes, information about those parameters driving population size are required (Lindberg and Rexstad, 2002; Arso Civil et al., 2019; Schleimer et al., 2019).
For long-lived species, adult survival in particular greatly influences population growth rates (Prévot-Julliard et al., 1998; Fletcher et al., 2012). In cetaceans, which are highly mobile and elusive animals (Pace et al., 2017), mark-recapture (MR) modelling has become well-established as tool to assess survival rates (SRs) (Currey et al., 2009; Pace et al., 2017; Bertulli et al., 2018; Arso Civil et al., 2019). After the reconstruction of encounter histories of individuals over time, MR-models allow for the estimation of both survival and capture probabilities through maximum likelihood approaches (Lebreton et al., 1992; Corkrey et al., 2008; Cooch and White, 2019a).
One frequently used model is the Cormack-Jolly-Seber (CJS) open-population model that allows for the addition of individuals to the population over time as well as the removal of individuals through death and permanent emigration (Cormack, 1964; Jolly, 1965; Seber, 1965; Hammond et al., 1990; Currey et al., 2009; Bertulli et al., 2018). However, because CJS models estimate capture and survival probabilities across all individuals, accuracy is conditional on a set of assumptions, namely that each individual (1) is uniquely marked and (2) is identified correctly during sampling occasions; (3) no change or loss of marks occurs and (4) all individuals have the same capture probability within a sampling occasion (Lindberg and Rexstad, 2002; Urian et al., 2015).
The use of natural marks for the identification of individual cetaceans is well established (Würsig and Würsig, 1977; Hammond et al., 1990; Gowans and Whitehead, 2001; Auger-Méthé et al., 2010). The most common type of marks used in MR-studies are profile-changing injuries to the dorsal fin, including nicks and notches, which are persistent and visible from either side of the fin. Yet, the use of natural markings and photo-ID also does have limitations, which can lead to the violation of CJS model assumptions.
Correct identification depends on two factors: mark severity (i.e., the degree of “uniqueness” of the marking pattern) and photographic quality of the image (Urian et al., 2015; Blázquez et al., 2020). A poorly marked individual, or several individuals that share similar marking patterns, have a higher risk of being misidentified than a highly and uniquely marked individual (e.g., Whitehead and Wimmer, 2005). Likewise, equal capture probability (assumption 4) is rarely the case in cetaceans as they are highly mobile, with individuals transiting or migrating from one population, or area, to another (Speakman et al., 2010; Pace et al., 2017; Bertulli et al., 2018). CJS models make no distinction between mortality and permanent emigration, meaning that survival estimates actually reflect “apparent survival” (i.e., survival and stay in the study area). In populations where transience or migration occurs, failure to account for it will lead to negatively biased survival estimates, as migrating individuals have lower capture probabilities than truly residential individuals (Kendall et al., 1997; Pradel et al., 1997; Fletcher et al., 2012). Different approaches have been suggested to incorporate variation in identifiability and migration as sources of heterogeneity into MR-models. Stratification by mark severity and image quality is routine now in cetacean photo-ID catalogues (Urian et al., 2015). To address migration, individuals may be differentiated into groups corresponding to their site fidelity, which is especially useful in populations where some individuals have home ranges that exceed the study area (Schleimer et al., 2019).
The Shannon Estuary is the largest estuarine system in Ireland and designated as Special Area of Conservation (SAC) under the EU Habitats Directive (Council Directive 92/43/EEC) (European Council, 1992) to protect a resident and genetically distinct population of bottlenose dolphins (Berrow et al., 1996; Mirimin et al., 2011, NPWS, 2013). The population is relatively small (139 individuals, 95% CI: 121–160; Rogan et al., 2018) and regular monitoring is crucial to early detection of potential negative trends (Blázquez et al., 2020). A MR study, funded by the National Parks and Wildlife Service (NPWS), is carried out about every 2 years to fulfil EU reporting obligations, but focusses entirely on estimating abundance (Englund et al., 2007, 2008; Berrow et al., 2012; Rogan et al., 2015, 2018). The only available mortality estimate was carried out by Baker et al. (2018a), using an approach which made assumptions about death rates based on the absence of sightings of individuals over a given number of years (see also Wells and Scott, 1990). This approach, however, is only valid where individuals show high site fidelity and have a high capture probability, which is not entirely the case for the Shannon population.
The longest running photo-ID catalogue for the Shannon dolphin population was established in 1993 by the Irish Whale and Dolphin Group (IWDG), which has since conducted annual photo-identification surveys (Berrow et al., 1996, 2012; Berrow, 2009; Foley et al., 2010; Baker, 2017). From 2000 onward, data collection has been facilitated by the use of dolphin watching tour boats as regular platforms of opportunity (Berrow and Holmes, 1999). However, survey effort and data quality have varied greatly between years with the availability of funding, equipment, and personnel. In 2005, the IWDG also established the Irish Coastal Bottlenose Dolphin Catalogue (ICBDC) with data collected from outside the estuary, largely by volunteers through opportunistic sightings (O’Brien et al., 2009; Vialcho Miranda, 2017).
Since 2008, surveys have been carried out in Brandon and Tralee Bays adjacent to the Shannon Estuary, which are part of the home range of some Shannon dolphins (Ryan and Berrow, 2013; Levesque et al., 2016). To obtain reliable survival estimates for this population, it is therefore necessary to account for variations in individual capture availability in the Shannon Estuary and the possibility of migration. In this study, we estimate SRs for the Shannon bottlenose dolphin population for the period 1993 to 2018, using the IWDG photo-ID catalogues and MR-modelling.
Materials and Methods
Study Area
The Shannon Estuary on the west coast of Ireland stretches about 100 km from the city of Limerick to Kerry Head, Co. Kerry, and Loop Head, Co. Clare, where the River Shannon enters the Atlantic Ocean (52° 30′ N and 9° 56′ W; Figure 1). It was designated as Lower River Shannon SAC (Site Code: 00216) in 2000 and lists six species as qualifying interests, including bottlenose dolphins (NPWS, 2013). Tralee and Brandon Bays, Co. Kerry, are adjacent to each other about 30 km south of the mouth of the Shannon.
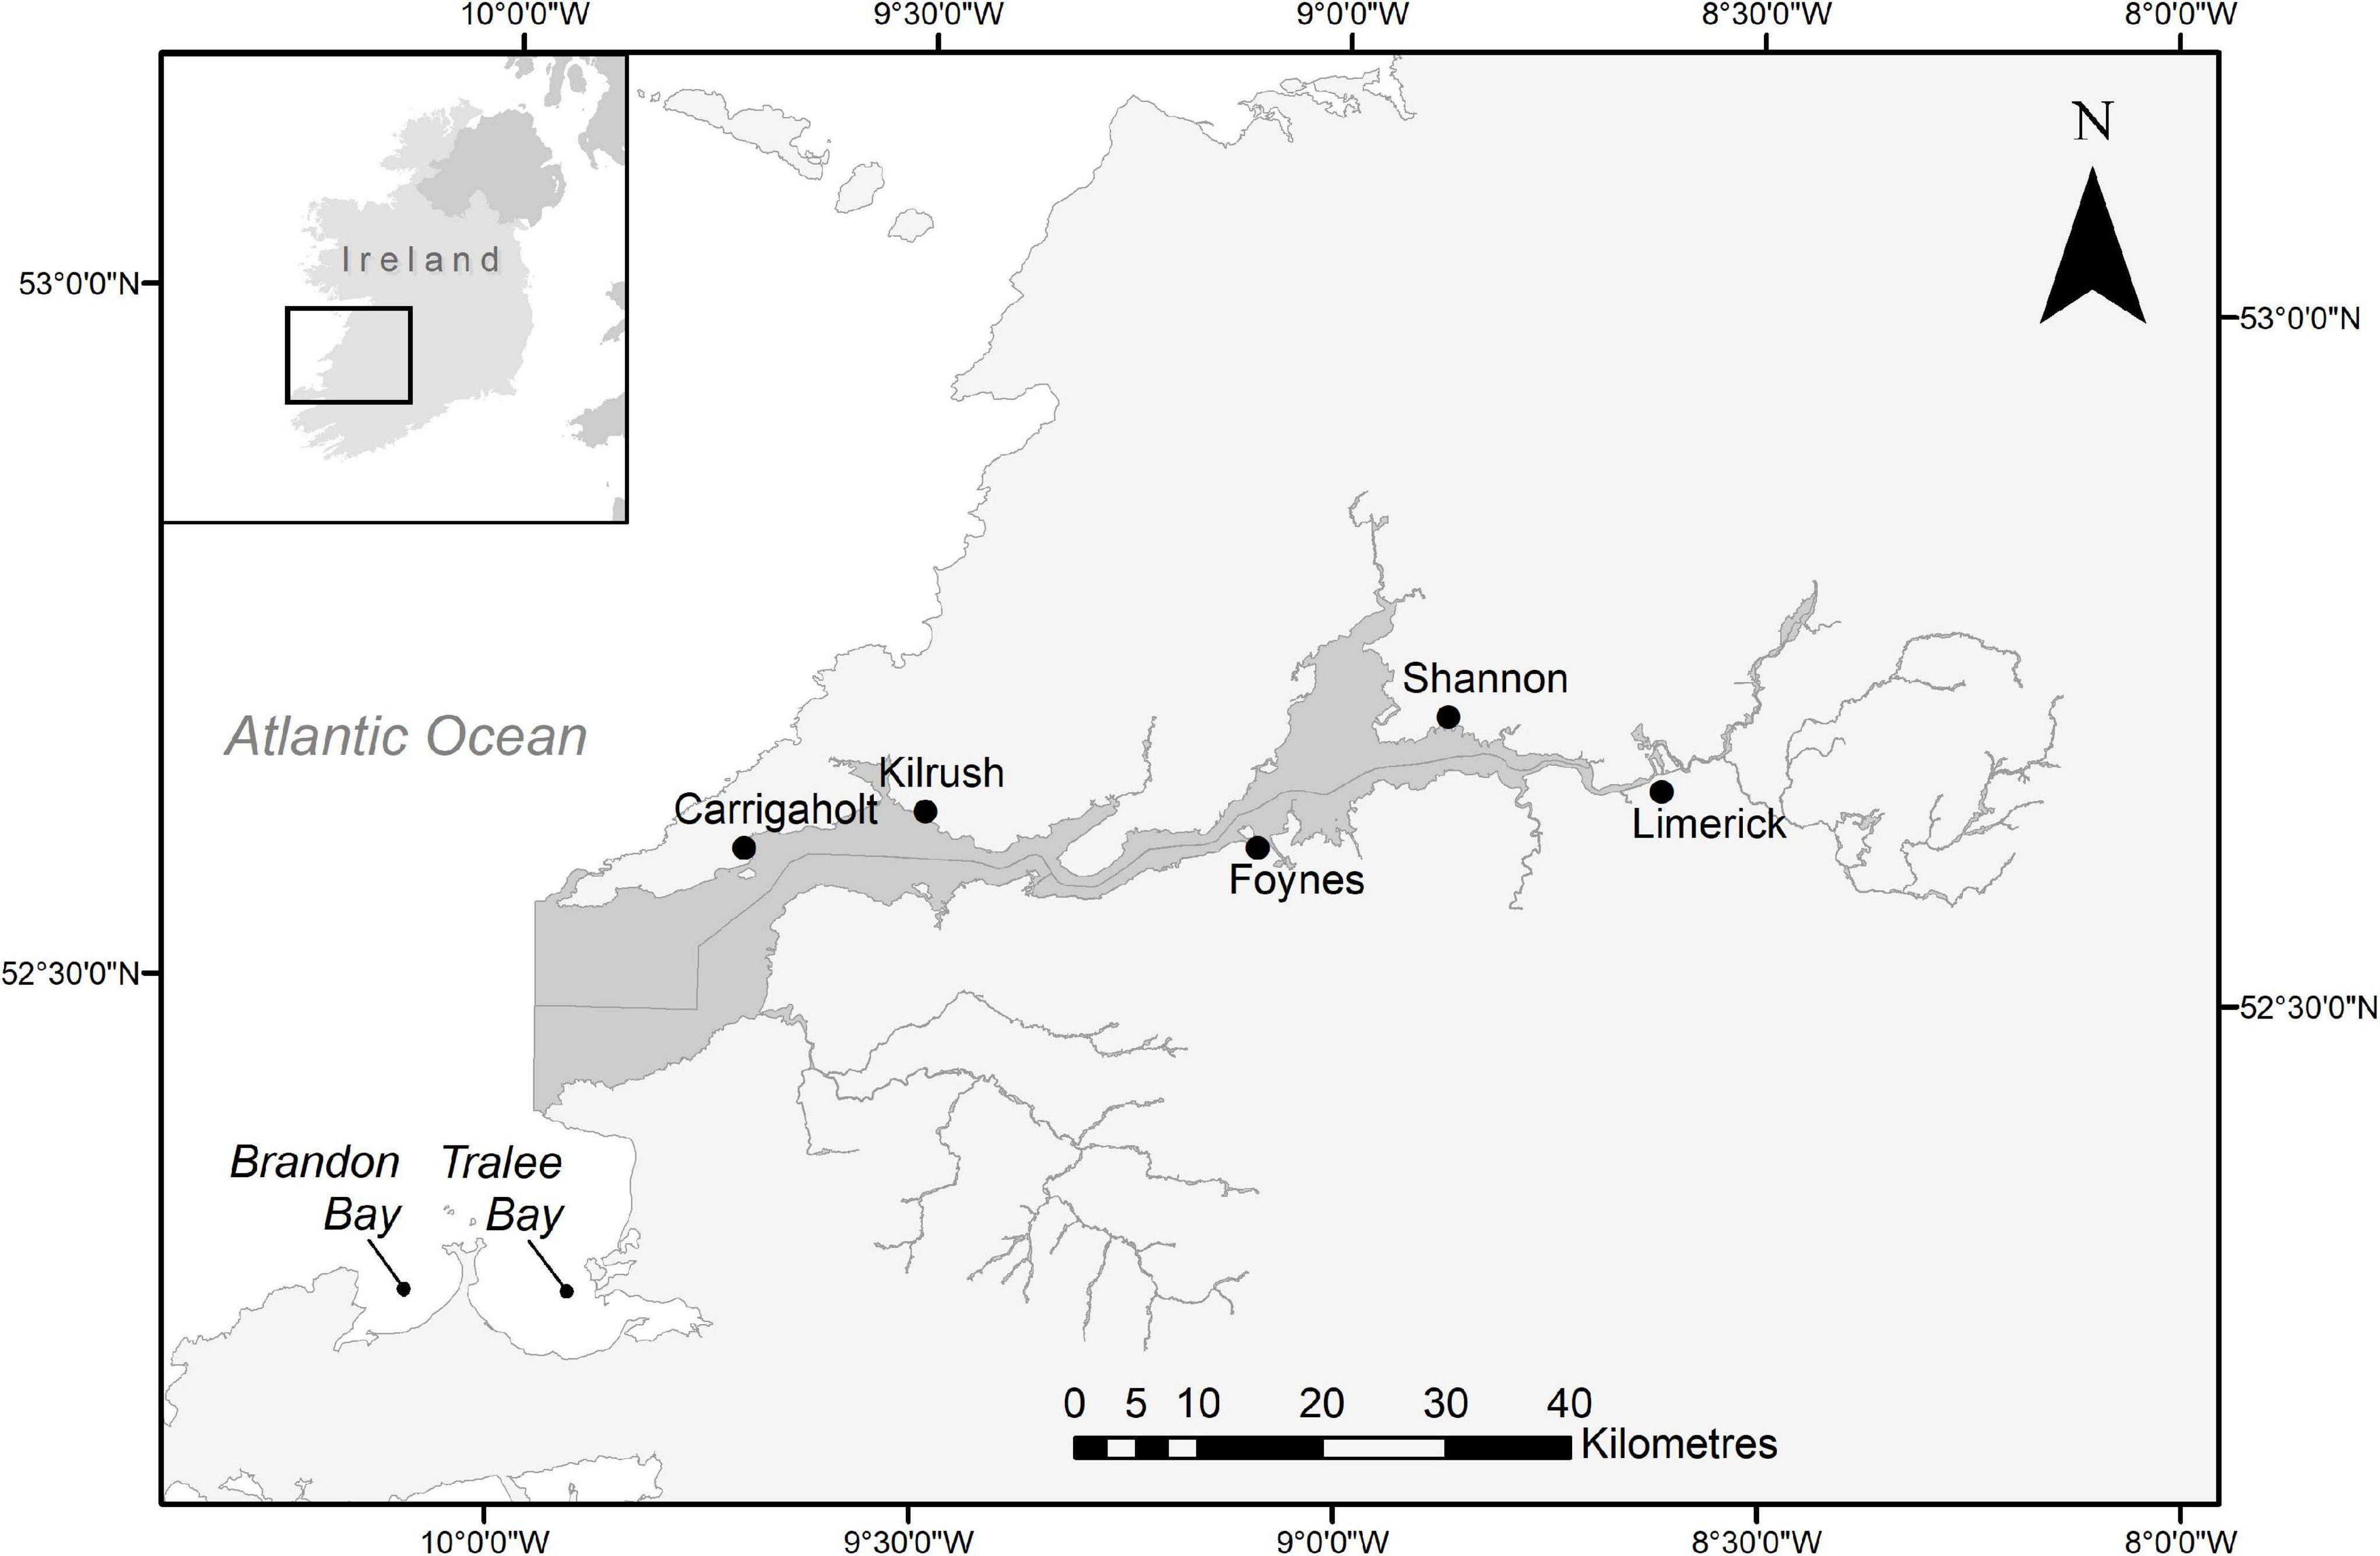
Figure 1. Map of the lower river shannon special area of conservation (dark grey). The line dividing the estuary horizontally marks the county border between Co. Clare (North) and Co. Kerry (South). Tralee- and Brandon Bays are indicated to the southwest. Geospatial Data Sources: Ireland Ordnance Survey (Settlements Data), DIVA-GIS (Country Boundary Data), National Parks and Wildlife Service (SAC Boundary Data).
Photo-ID Surveys
Data were collected between 1993 and 2018, by the IWDG (Berrow et al., 1996; Berrow, 2009; Foley et al., 2010; Baker, 2015, 2017; Barker and Berrow, 2016; Levesque et al., 2016; Baker et al., 2018a, b) as well as the NPWS in 2010, 2015, and 2018 (Berrow et al., 2012; Rogan et al., 2015, 2018). Except for 1995 and 1996, dedicated research surveys were conducted annually by the IWDG using a 6 m rigid-hulled inflatable boat (RIB). Images were taken from a perpendicular angle to each animal in order to capture the lateral (left or right) side of the dorsal fin (e.g., Baker et al., 2018a). The exact effort in terms of number of trips, spatial and temporal extent and the time of year of surveys depended on the specific research objectives, sea-state and weather conditions, available funding and resources (personnel and equipment). Therefore, survey effort varied over the years. Since 2000, dolphin watching tour boats have provided platforms of opportunity between May and September, with two operators visiting different stretches of the estuary and therefore resulting in a good spatial coverage (Berrow and Holmes, 1999; Berrow and Ryan, 2009).
In Brandon and Tralee Bays (abbreviated in further text as “Brandon”), photo-ID data was collected in the years 2008, 2009, and 2015 during opportunistic sightings. In 2013, the first dedicated surveys were conducted in the area (Levesque et al., 2016), and few dedicated surveys have been carried out each year since 2016 by the IWDG. The ICBDC was established in 2005 (O’Brien et al., 2009) with images acquired every year since. Photographs and data were predominantly (∼95%) collected by citizen scientists during opportunistic sightings. All information was validated before including it in the catalogue and database (Vialcho Miranda, 2017).
Between 1993 and 2005, analogue cameras of the models Canon EOS 50 SLR and Canon EOS RT were used for photo-ID work, with images being printed on film and slides (Berrow et al., 1996; Berrow, 2009). In 2005, the transition to digital photography was made and since then SLR Canon cameras including EOS 20D, 50D, 7Dii, 5D have been used for photo-ID (Baker et al., 2018b). Lenses varied between 200 and 500 mm auto-focus telephoto (Berrow, 2009), 70–200 mm f2.8USM and f3.0 300 mm (Berrow et al., 2012), 70–300 mm auto-focus and 200–500 mm lenses (Berrow et al., 1996; Baker et al., 2018b).
Data Management
Throughout the study period, matching of new images to the existing catalogues occurred immediately after data collection (Berrow et al., 1996, 2012, Baker et al., 2018a). Since 2013, validation of matches was carried out by two or three independent researchers (Baker et al., 2018a), however due to a high turnover rate of research assistants and catalogue curators, a comparatively high number of misidentifications occurred especially during the period from 2003 to 2009. The retrospective approach of this study allowed for the detection and correction of such cases.
Metadata on images from the initial years of the study period were often incomplete, motivating the choice of CJS over alternative models with higher data requirements. To obtain a homogenous dataset for MR modelling, encounter histories were reconstructed as presence/absence of individual dolphins per calendar year. Due to a relatively short sampling season per year (June–August), this approach allowed for sufficiently long inter-sampling intervals, and had been applied in comparable studies (Corkrey et al., 2008; Currey et al., 2009; Schleimer et al., 2019).
After validation, the best image per dolphin per year and area was selected as reference for the construction of encounter histories. Considering the assumption of equal identifiability of individuals in CJS-modelling, three classes of mark distinctness were defined (see also Ingram, 2000; Berrow et al., 2012; Urian et al., 2015; Sprogis et al., 2016; Bertulli et al., 2018). Due to the long-term nature of this study, we only considered permanent, profile-changing marks to the dorsal fin as qualifying mark types (Table 1). Images with dolphins classified as MQ-3 were excluded from the study, as the risk of misidentification was regarded too high.
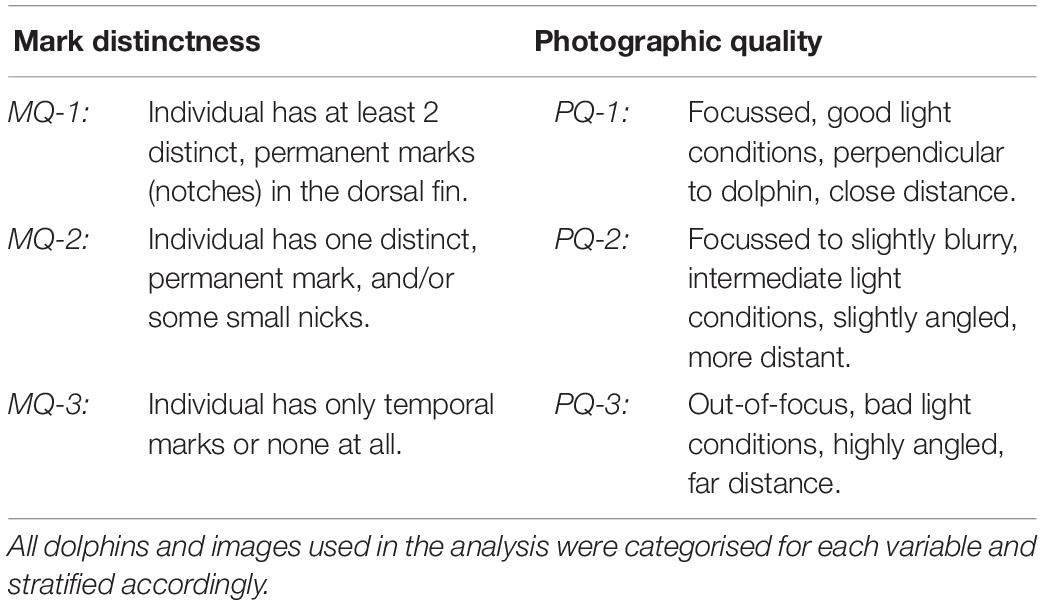
Table 1. Definitions of quality classes for mark distinctness (mark quality = “MQ”) and photographic quality (=“PQ”), reaching from high (=“1”) to low (=“3”).
Images were furthermore stratified based on their photographic quality (Table 1), as this factor can affect correct identification (Wilson et al., 1999; Urian et al., 2015). All PQ-3 images were excluded from the analysis. For highly marked dolphins, both high and medium quality images were used, while moderately marked dolphins were only confidently identifiable on PQ-1 images (see also Hupman et al., 2018). All qualifying images were used to reconstruct encounter histories for dolphins in the population, resulting in a binary dataset with “1” indicating presence and “0” indicating absence in a given year.
To address potential capture heterogeneity between highly and moderately marked individuals as well as between individuals using Brandon/Tralee Bays and those who stay within the Shannon Estuary, separate MR models with grouping variables for either mark severity (=Mark Severity model) or site fidelity (=Site Fidelity model) were fitted. The categorisation of individuals by mark severity was based on the severity state that they had been observed in for the majority of time since their first encounter (see Supplementary Material for details). Individuals that had spent equal amounts of time in each mark severity class were excluded from the Mark Severity model.
To create categories for site fidelity, the sighting rates of each individual in Brandon Bay, the Shannon Estuary and overall were calculated. Based on these sighting rates, an Agglomerative Hierarchical Cluster (AHC) analysis was performed in R (R Core Team, 2019), following Schleimer et al. (2019) and Zanardo et al. (2016) (details in Supplementary Material). The R packages dendextend (Galili, 2015), ggdendro (de Vries and Ripley, 2016), and plot3D (Soetaert, 2019) were used for visualisation of the dendrogram and the clustering along the sighting rate axes. To understand whether individuals were equally distributed across site fidelity and mark severity classes, a χ2-test of independence was conducted.
Survey effort was reconstructed as number of trips per year and area, which was considered to be the best available proxy, since the details recorded for each trip varied over the years. Due to large variation in annual survey effort, the number of photo-ID surveys was considered a potential covariate affecting capture probability over time. Likewise, the transition from analogue to digital photography with advances in storage capacity and image quality, as well as the extension of survey effort to Brandon and Tralee Bays were examined as covariates. The relationship between the number of surveys and number of individuals encountered was assessed by simple linear regression analysis. For incorporation into the MR models, the number of photo-ID trips was expressed as count variable effort while changes in photo-equipment (=photo) and years with/without Brandon surveys (=Brandon) were translated into binary variables (photo-equipment: analogue = “0,” digital = “1”; Brandon/Tralee surveys: none = “0,” one or more = “1”).
Mark-Recapture Modelling
The R package R2ucare (Gimenez et al., 2018b), an R-version of the software U-CARE (Choquet et al., 2009), was used to assess goodness-of-fit (GOF) of the data for a time-dependent CJS model. Lack of fit was indicated for the overall dataset by component Test 2.CT (χ2 = 36.34, df = 21, P = 0.02), pointing out trap dependence (Gimenez et al., 2018b). Accordingly, the starting model for overall survival assessment (Overall Survival model) was generalised by adding a time-varying trap-dependence covariate td for capture probability estimation (ϕt, pt^*td). This variable was computed by creating binary dummy variables for each individual per year, with “1” indicating capture of the individual at the previous sampling occasion and “0” indicating apparent absence of the individual in the previous year (Lebreton et al., 1992; Gimenez et al., 2018b; Cooch and White, 2019b; Laake and Rexstad, 2019, p. 1026; Schleimer et al., 2019). Additionally, GOF-component Test 3.SM was significant (χ2 = 41.65, df = 19, p = 0.002), and therefore the later fitted models were corrected for overdispersion.
During GOF-testing for the Mark Severity model, Test 3.SR for group MQ-1 could not be fitted without returning an error. This component indicates the presence of transience, and to account for a potentially undetected transience effect, an age model was fitted as starting model, with survival after initial sightings being separated from survival after subsequent sightings (ϕ t/t, p t) (Bertulli et al., 2018; Cooch and White, 2019c). Age, in this case, referred to “time since first encounter” rather than reflecting true age of animals. For the Site Fidelity groups, no lack of fit was detected by the GOF-test components. The results of the GOF-tests can be found in Supplementary Tables 1–3.
All MR models were fitted using the create.model.list() function of the R package RMark (Laake, 2013), which automatically creates and runs an exhaustive list of models based on the parameter definitions that are specified for ϕ (survival probability) and p (capture probability). For all three models (Overall Survival, Site Fidelity, Mark Severity), the survival parameter ϕ was defined as either staying constant over time (.), varying by sampling occasions (t) or following a temporal trend (T). The difference between t and T is that t considers each sampling occasion independent from the foregoing and following occasions, while T assumes a directional trend across all sampling occasions. In the Site Fidelity model, ϕ was additionally defined to vary by site fidelity group (Site), while in the Mark Severity model, both a mark severity group effect (MQ) and an age effect (t/t) were included. To assess the drivers of capture probabilities, p in all three models was defined as constant (.), varying by sampling occasion (t), or varying by the covariates effort, photo, or Brandon. Additionally, the trap dependence covariate (td) was included in the Overall Survival and Site Fidelity models in order to compare potential drivers of capture heterogeneity (true trap dependence or variation in site fidelity). The Mark Severity model was run on a reduced dataset due to categorisation issues with individuals of equal observation time in MQ-1 and MQ-2 state, and therefore a direct comparison with the other two models was not attempted. All possible combinations of additive and interaction effects between covariates were explored [e.g., (ϕ t + MQ) or (p td^*effort), with (+) indicating additive models and (∗) indicating interaction models] (see Supplementary Material for more detailed model descriptions).
To correct the Overall Survival models for overdispersion, the Variance Inflation Factor ĉ (sum of Pearson’s χ2-test statistics divided by the sum of their degrees of freedom) was adjusted using the adjust.chat() function in RMark. Standard errors and confidence intervals were also adjusted. Due to the resulting transformation of AICc’s into QAICc’s, the latter were used to identify the most parsimonious model, together with the QAIC weights, while the best fitting models for Site Fidelity and Mark Severity were determined based on AICc values and Akaike weights. For all three model sets, the three most parsimonious candidate models were identified and compared by calculating the evidence ratio, i.e., the ratio between the Akaike weights, indicating how much better one model explains the data compared to the other (Burnham and Anderson, 2002a).
The relative importance of each covariate in estimating ϕ and p was assessed for Overall Survival, Site Fidelity and Mark Severity models by summarising the Akaike weights of all candidate models in which the respective covariate was included (Burnham and Anderson, 2002b). Finally, the parameter estimates for ϕ and p were averaged to account for model selection uncertainty (Cooch and White, 2019b). Model averaged outcomes of all survival models were visualised using the packages ggplot2 (Wickham, 2016), and egg (Auguie, 2019) in R.
Results
Encounter histories of 141 individual bottlenose dolphins, all classified as either MQ-1 or MQ-2, were reconstructed to determine SRs for the Shannon population. Additional sighting information from Brandon/Tralee Bays and the ICBDC were used to address gaps in encounter histories. The number of surveys in the Shannon Estuary varied considerably between years ranging from only two RIB surveys in 2004 to a combined 102 surveys in 2016 from both research RIB and commercial dolphin watching vessels (Figure 2). The median annual effort was 40 surveys. In Brandon and Tralee Bays, photo-ID data collection from both opportunistic and dedicated opportunities was limited to the years 2008/2009, 2013, and 2015–2018 (Figure 2), however data from 2015 was not included in this study due to low photographic quality (all PQ-3). The highest number of dedicated surveys (eight) occurred in 2013, two surveys in 2017 and one each in 2016 and in 2018. In coastal waters, outside of both Shannon Estuary and Brandon, five opportunistic encounters with Shannon individuals were recorded; three encounters in 2017 and one encounter each in 2012 and 2018 (Figure 2). The total number of encounters with bottlenose dolphins in coastal waters in general between 2005 and 2018 was 225, with a median of 13.5 encounters per year (Range: 2–33 encounters).
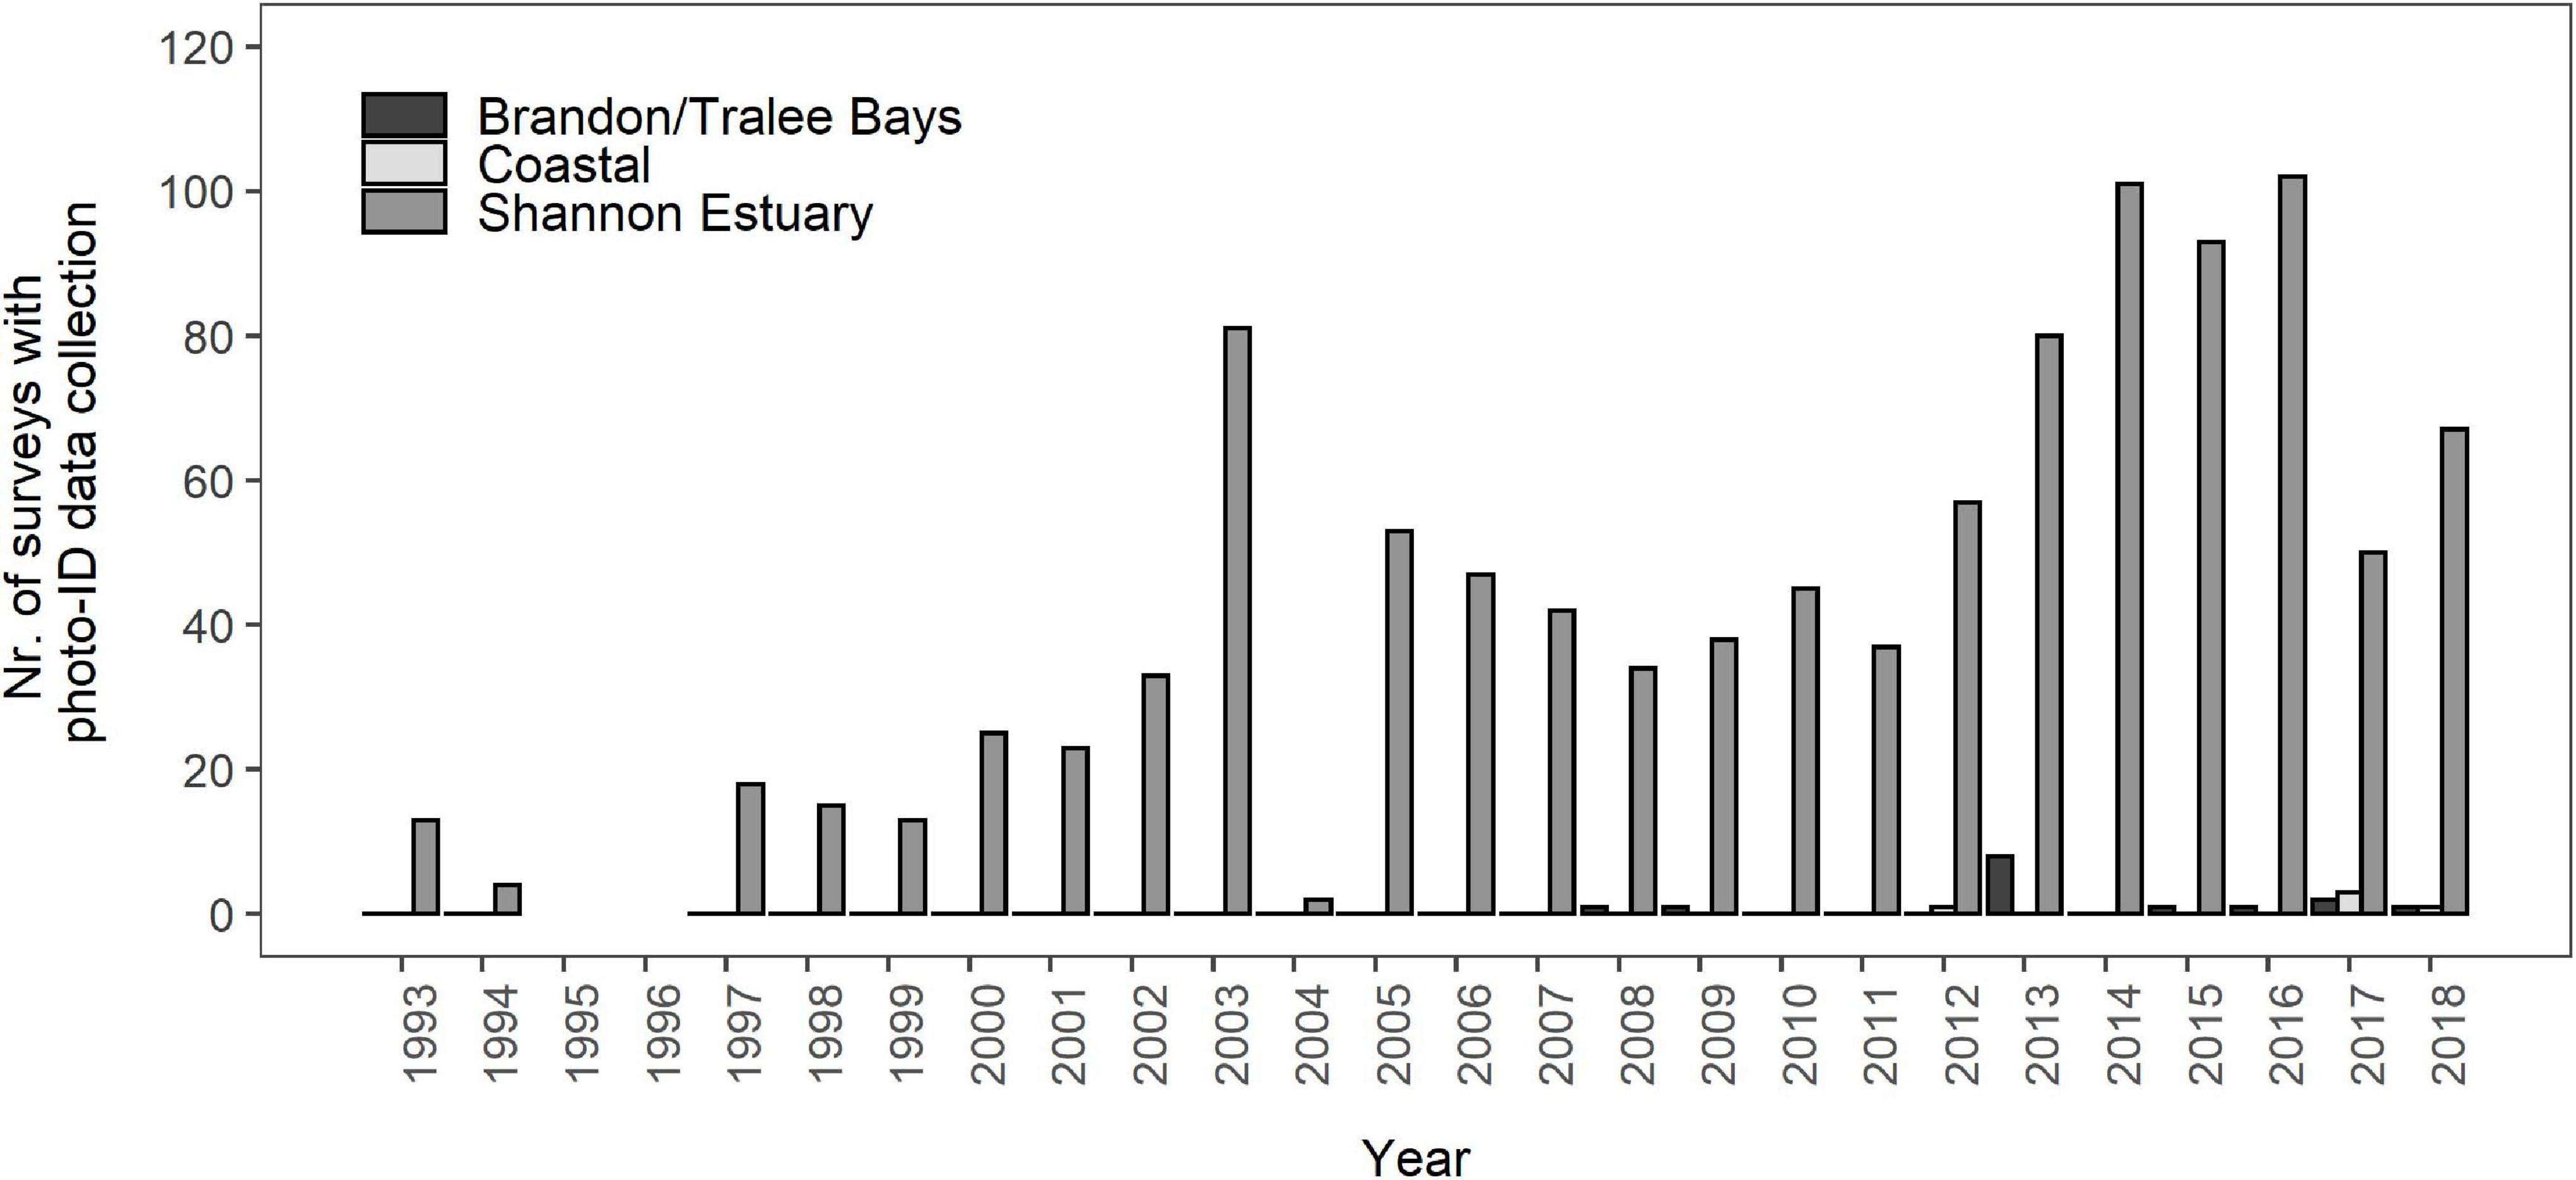
Figure 2. Number of surveys, both dedicated and opportunistic, with photo-ID data collection per annum and per area (Brandon/Tralee Bays, Coastal, Shannon Estuary). No surveys were conducted in 1995 and 1996, resulting in the complete absence of photo-ID data from these years. All encounters in Brandon Bay in 2008/2009 and 2015 were opportunistic. Coastal encounters were entirely opportunistic and only counted when Shannon dolphins were part of the encountered group.
Encounter Histories
For the reconstruction of encounter histories, 750 images were compiled: 682 (90.9%) from the Shannon Catalogue, 63 (8.4%) from Brandon/Tralee Bays and five (0.7%) from the ICBDC. Some individuals were sighted in more than one area in given years, however since our encounter history data did not capture this redundancy and only recorded “presence” in such a case, the final dataset included only 716 sightings across all sampling occasions, individuals and areas (Figure 3). Of these, 580 images (81%) were of significant fin marks (MQ-1) while 136 images (19%) depicted less significant mark patterns (MQ-2). The categorisation of individuals by mark distinctiveness resulted in 92 MQ-1 individuals and 47 MQ-2 individuals. The remaining two individuals could not be classified confidently, having been sighted two times each, the first time as MQ-2 and the second time as MQ-1. They were excluded from the dataset for the Mark Severity models. In total, 35 individuals with only one sighting over the whole period were recorded, 20 of which were MQ-2 and the remaining 15 MQ-1.
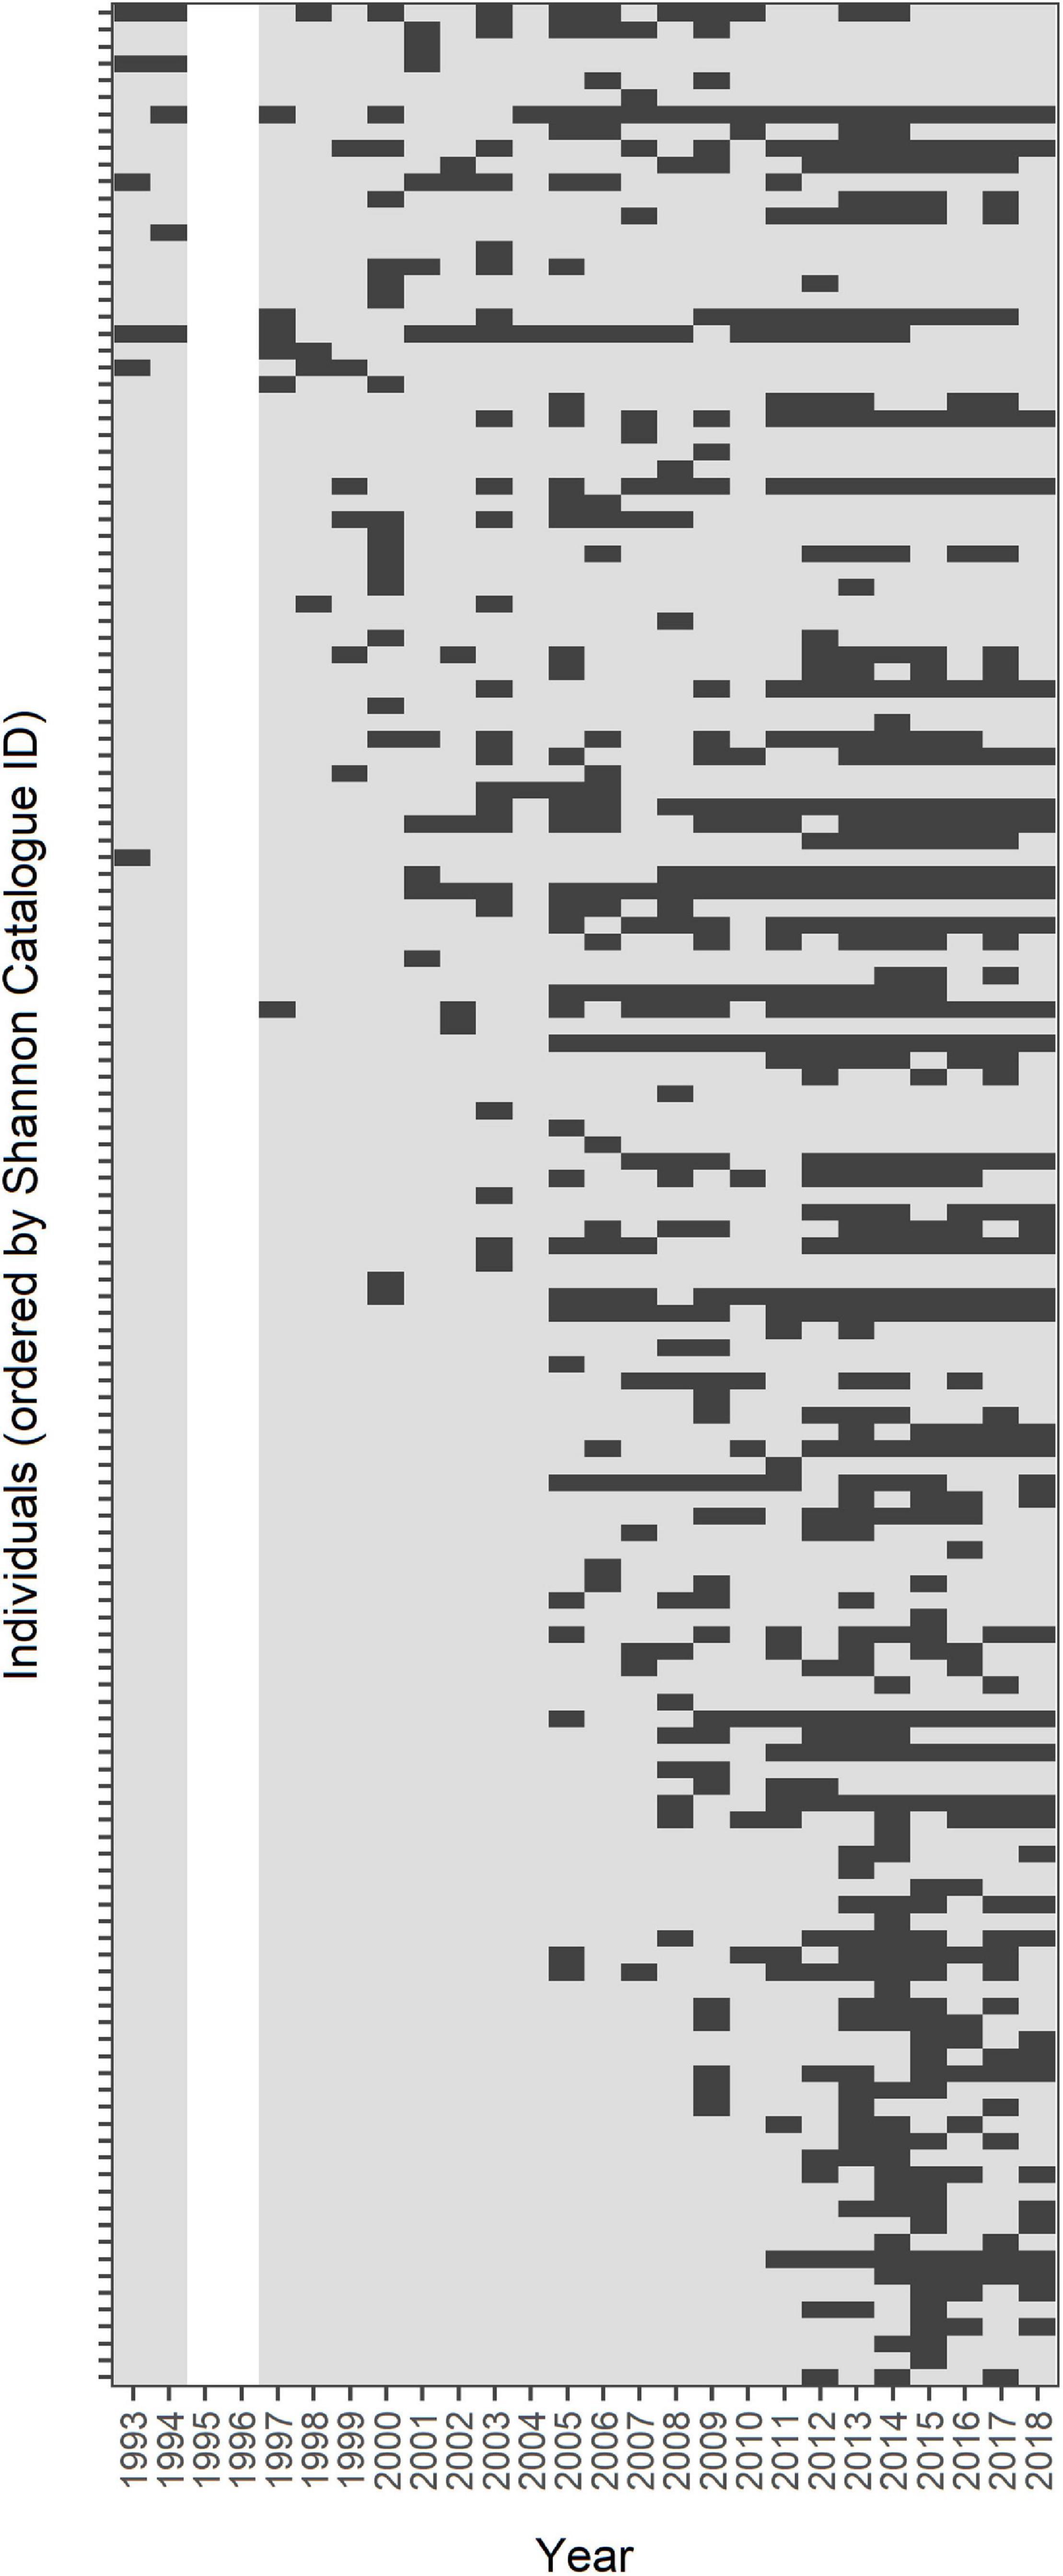
Figure 3. Encounter histories of 141 Shannon bottlenose dolphins, ordered by their ID-codes in the Shannon Catalogue. Each row represents the encounter history of one individual, dark-grey rectangles represent “presence” while light-grey rectangles represent “absence.” The blank cells for 1995/1996 indicate absence of data for these years.
A significant positive relationship (b = 0.628, t = 8.205, df = 22, p < 0.001) and regression function [F(1,22) = 67.33, p < 0.001; R2 = 0.754 (Supplementary Figure 1)] between the total number of individuals encountered each year and the number of dedicated and opportunistic sightings were found.
Site Fidelity AHC Analysis
The AHC analysis resulted in a dendrogram with a Cophenetic Correlation Coefficient (CCC) of 0.75, which was considered acceptable, as the clustering solution seemed reasonable for the classification of individuals by site fidelity. The most supported ideal number of clusters was three (Figure 4A) with one cluster (n = 13, “Brandon frequent”) comprising individuals with comparatively high sighting rates in Brandon Bay, a second cluster (n = 78, “Few sightings”) including individuals with few total sightings (max. number of sightings = 8) and the third cluster (n = 50, “Shannon frequent”) containing individuals with a high sighting rate in the Shannon Estuary and none or few sightings in Brandon Bay (Figure 4B).
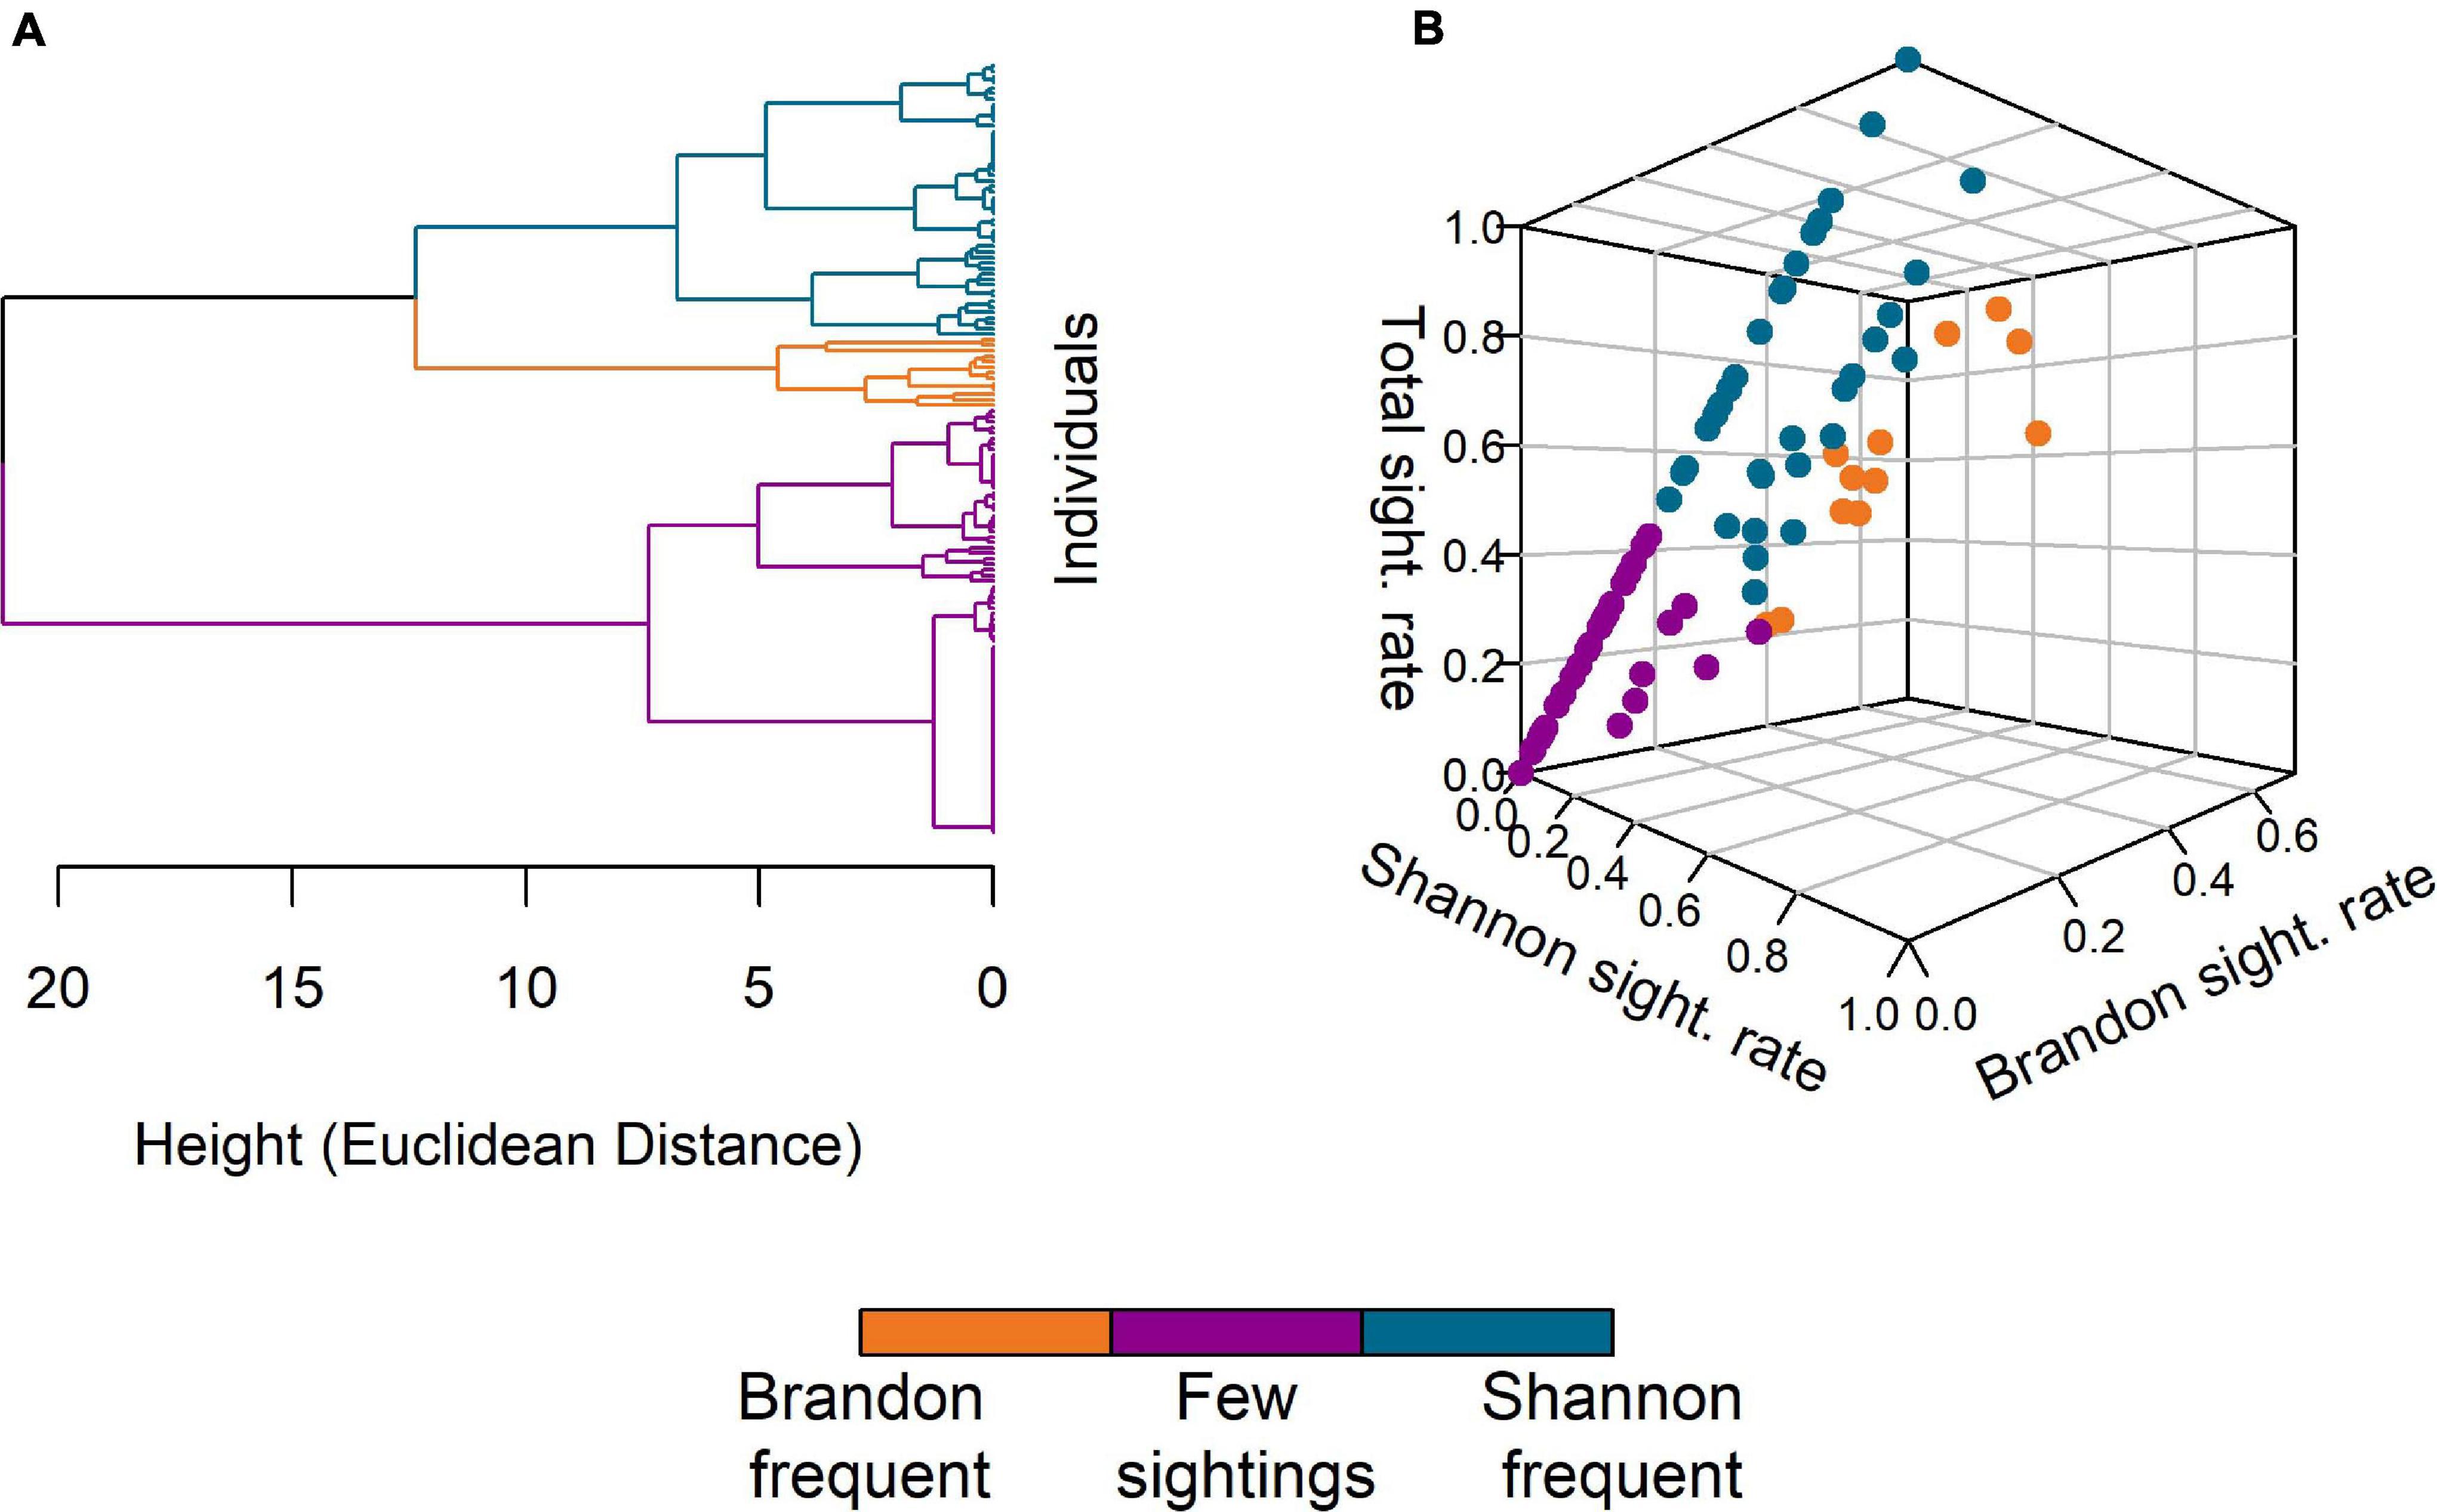
Figure 4. Results of the agglomerative hierarchical cluster analysis. (A) The dendrogram of individual dolphins as obtained based on their sighting rates in Brandon/Tralee Bays, the Shannon Estuary and overall sightings. Euclidean distance was used as measure for the distance between individuals. (B) 3D-visualisation of the three clusters obtained after truncation of the dendrogram. The axes represent the three sighting rates (Shannon, Brandon, and Total). The groups identified are “Brandon frequent” (orange, n = 13), “Few sightings” (purple, n = 78), and “Shannon frequent” (blue, n = 50).
Cormack-Jolly-Seber Models
In total, 78 candidate models were run for the Overall Survival model, 120 candidate models were fitted for the Site Fidelity model and 210 candidate models were compared for the Mark Severity model. The most parsimonious model for Overall Survival suggested that survival was constant over time, while capture probability varied in response to an additive effect of trap dependence and time (Table 2 and Supplementary Table 4). The Akaike weight was 0.731 out of 1, thus the probability that this model was the best one out of the candidate model list was high (Wagenmakers and Farrell, 2004). The evidence ratio was 2.9 between first and second most parsimonious model, making the most parsimonious model almost three times as likely to be the best fit than the second model in the ranking.
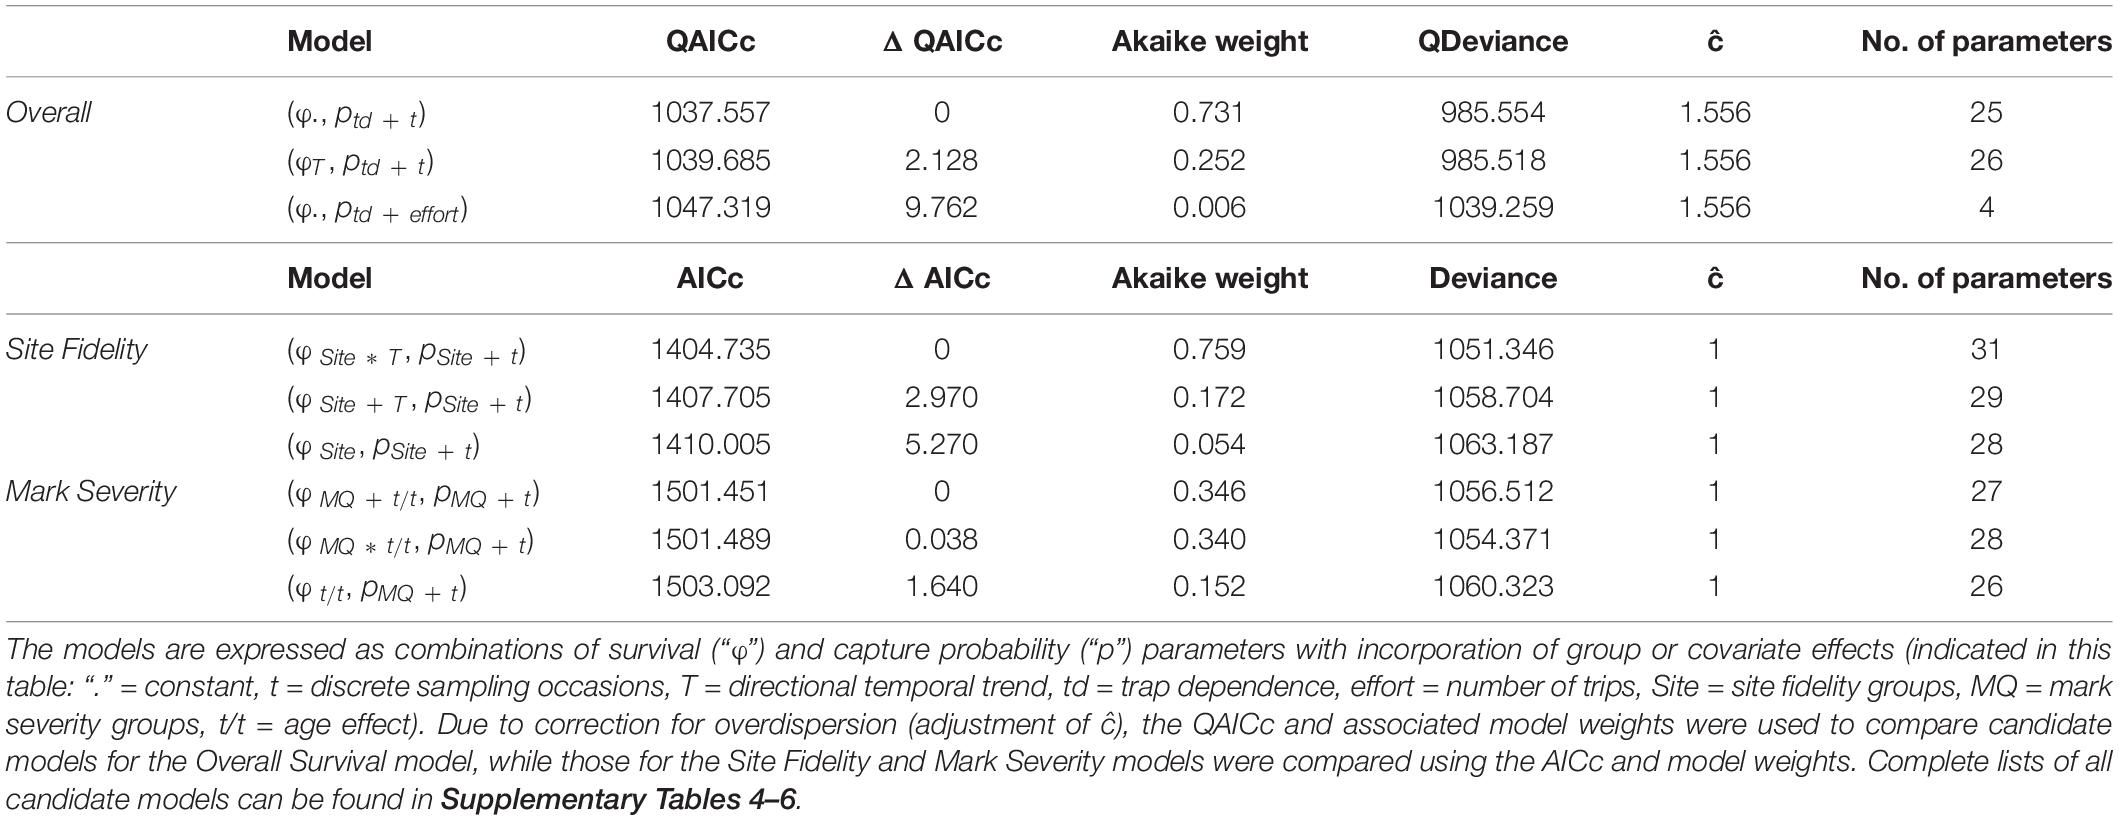
Table 2. Summary of the first three most parsimonious candidate models as obtained for each of the three modelling approaches, ranked by (Q)AICc.
Among the candidate models for Site Fidelity, the most parsimonious model incorporated an interaction between site fidelity and a temporal trend on survival (Site∗T), meaning that survival trends differed between the three groups (Table 2). Capture probability varied with an additive effect of site fidelity and sampling occasion (t), with each of the groups having different capture probabilities while the overall variation across time was parallel between the groups. This model, which had a conditional probability of 0.76, was the best model among the candidates and had an evidence ratio as high as 4.4, making it more than four times as likely to be the best model than the second one in the ranking. All other candidate models had a lower likelihood (Supplementary Table 5).
For Mark Severity, the comparison between candidate models was less conclusive (Table 2). Between first and second most parsimonious model, which had identical covariates and only differed in one addition/interaction term (MQ + t/t vs. MQ ∗ t/t), the evidence ratio was 1.02. Capture probability in both models was explained by the additive effect of mark severity and time (MQ + t), showing a parallel variation between the two mark severity groups over time, while survival was affected by mark severity (MQ) and age class (t/t). Only the relationship between mark severity and age class was additive in one model and interactive in the other. The evidence ratios between the first and second compared to the third model were 2.28 and 2.24, respectively, indicating that each of the models was more than twice as likely as the third model, and all other candidate models had a lower likelihood (Supplementary Table 6).
Overall Survival
Following an information theoretic approach, the relative importance of each covariate in influencing the estimation of survival (ϕ) and encounter (p) parameters was assessed (Table 3 and Supplementary Table 7). For the Overall Survival model, the most supported influencing factor was constancy over time (sum of Akaike weights (Ak) = 0.743), while, for capture probability, trap dependence (td) and time (t) were almost equally well supported (Ak = 0.993 and 0.987, respectively). Also, the additive effect of these two factors had the strongest support among all possible relationships of all included covariates (Ak = 0.983). The three covariates effort, photographic equipment change (photo), and years with/without Brandon Bay surveys (Brandon) contributed little to capture probability estimation (Ak = 0.014, 0.003, and 0.002, resp.).
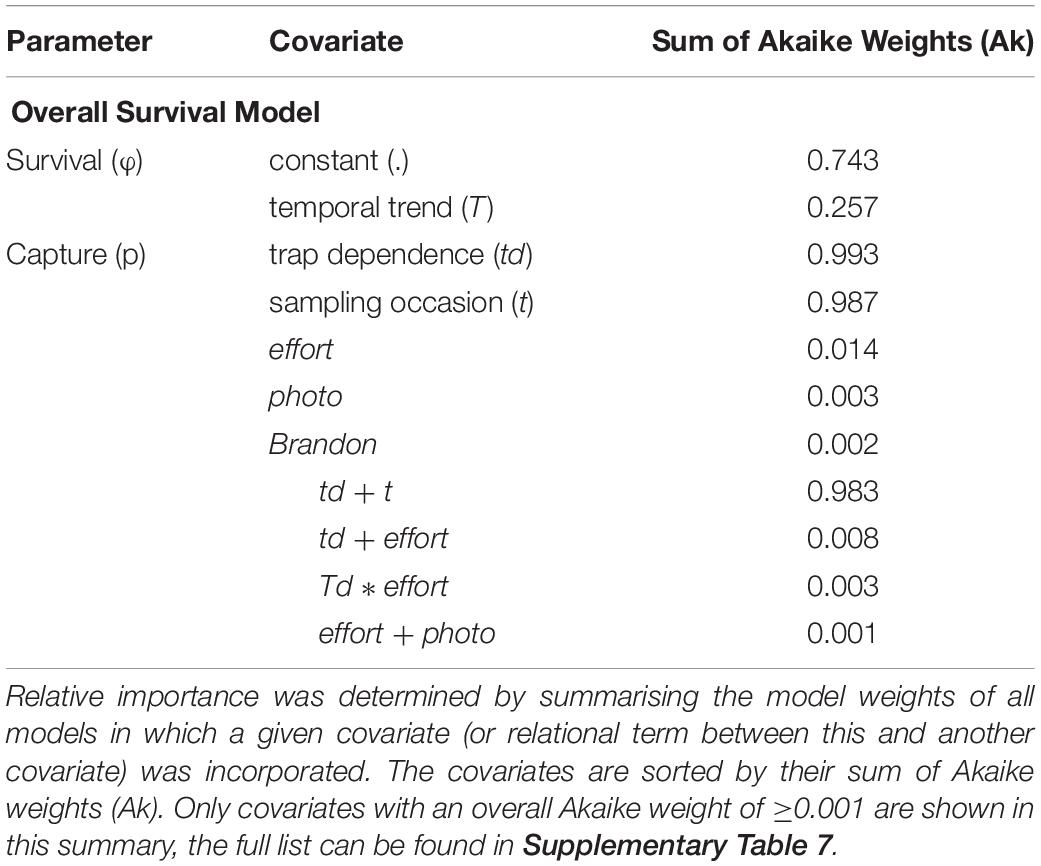
Table 3. Summary of the relative importance of each covariate incorporated into the Overall Survival model.
The estimated apparent SRs showed slight variation over time despite strong support for constancy (Figure 5A), varying between 0.938 (95% CI: 0.887–0.967) in 1993/1994 and 0.941 (95% CI: 0.785–0.986) in 2017/2018. The mean across all 23 available estimates was 0.94 (±0.001 SD). Estimates for capture probability showed strong variation over time (Figure 5B), with the lowest estimate in 2004 (=0.056, 95% CI: 0.013–0.218) and the highest in 2013 (=0.903, 95% CI: 0.732–0.969). Median capture probability across all sample occasions was 0.359, meaning that in 50% of the study period 36% or less of the marked population were recorded. Both apparent survival and capture probability estimates showed a similar pattern with regards to precision.
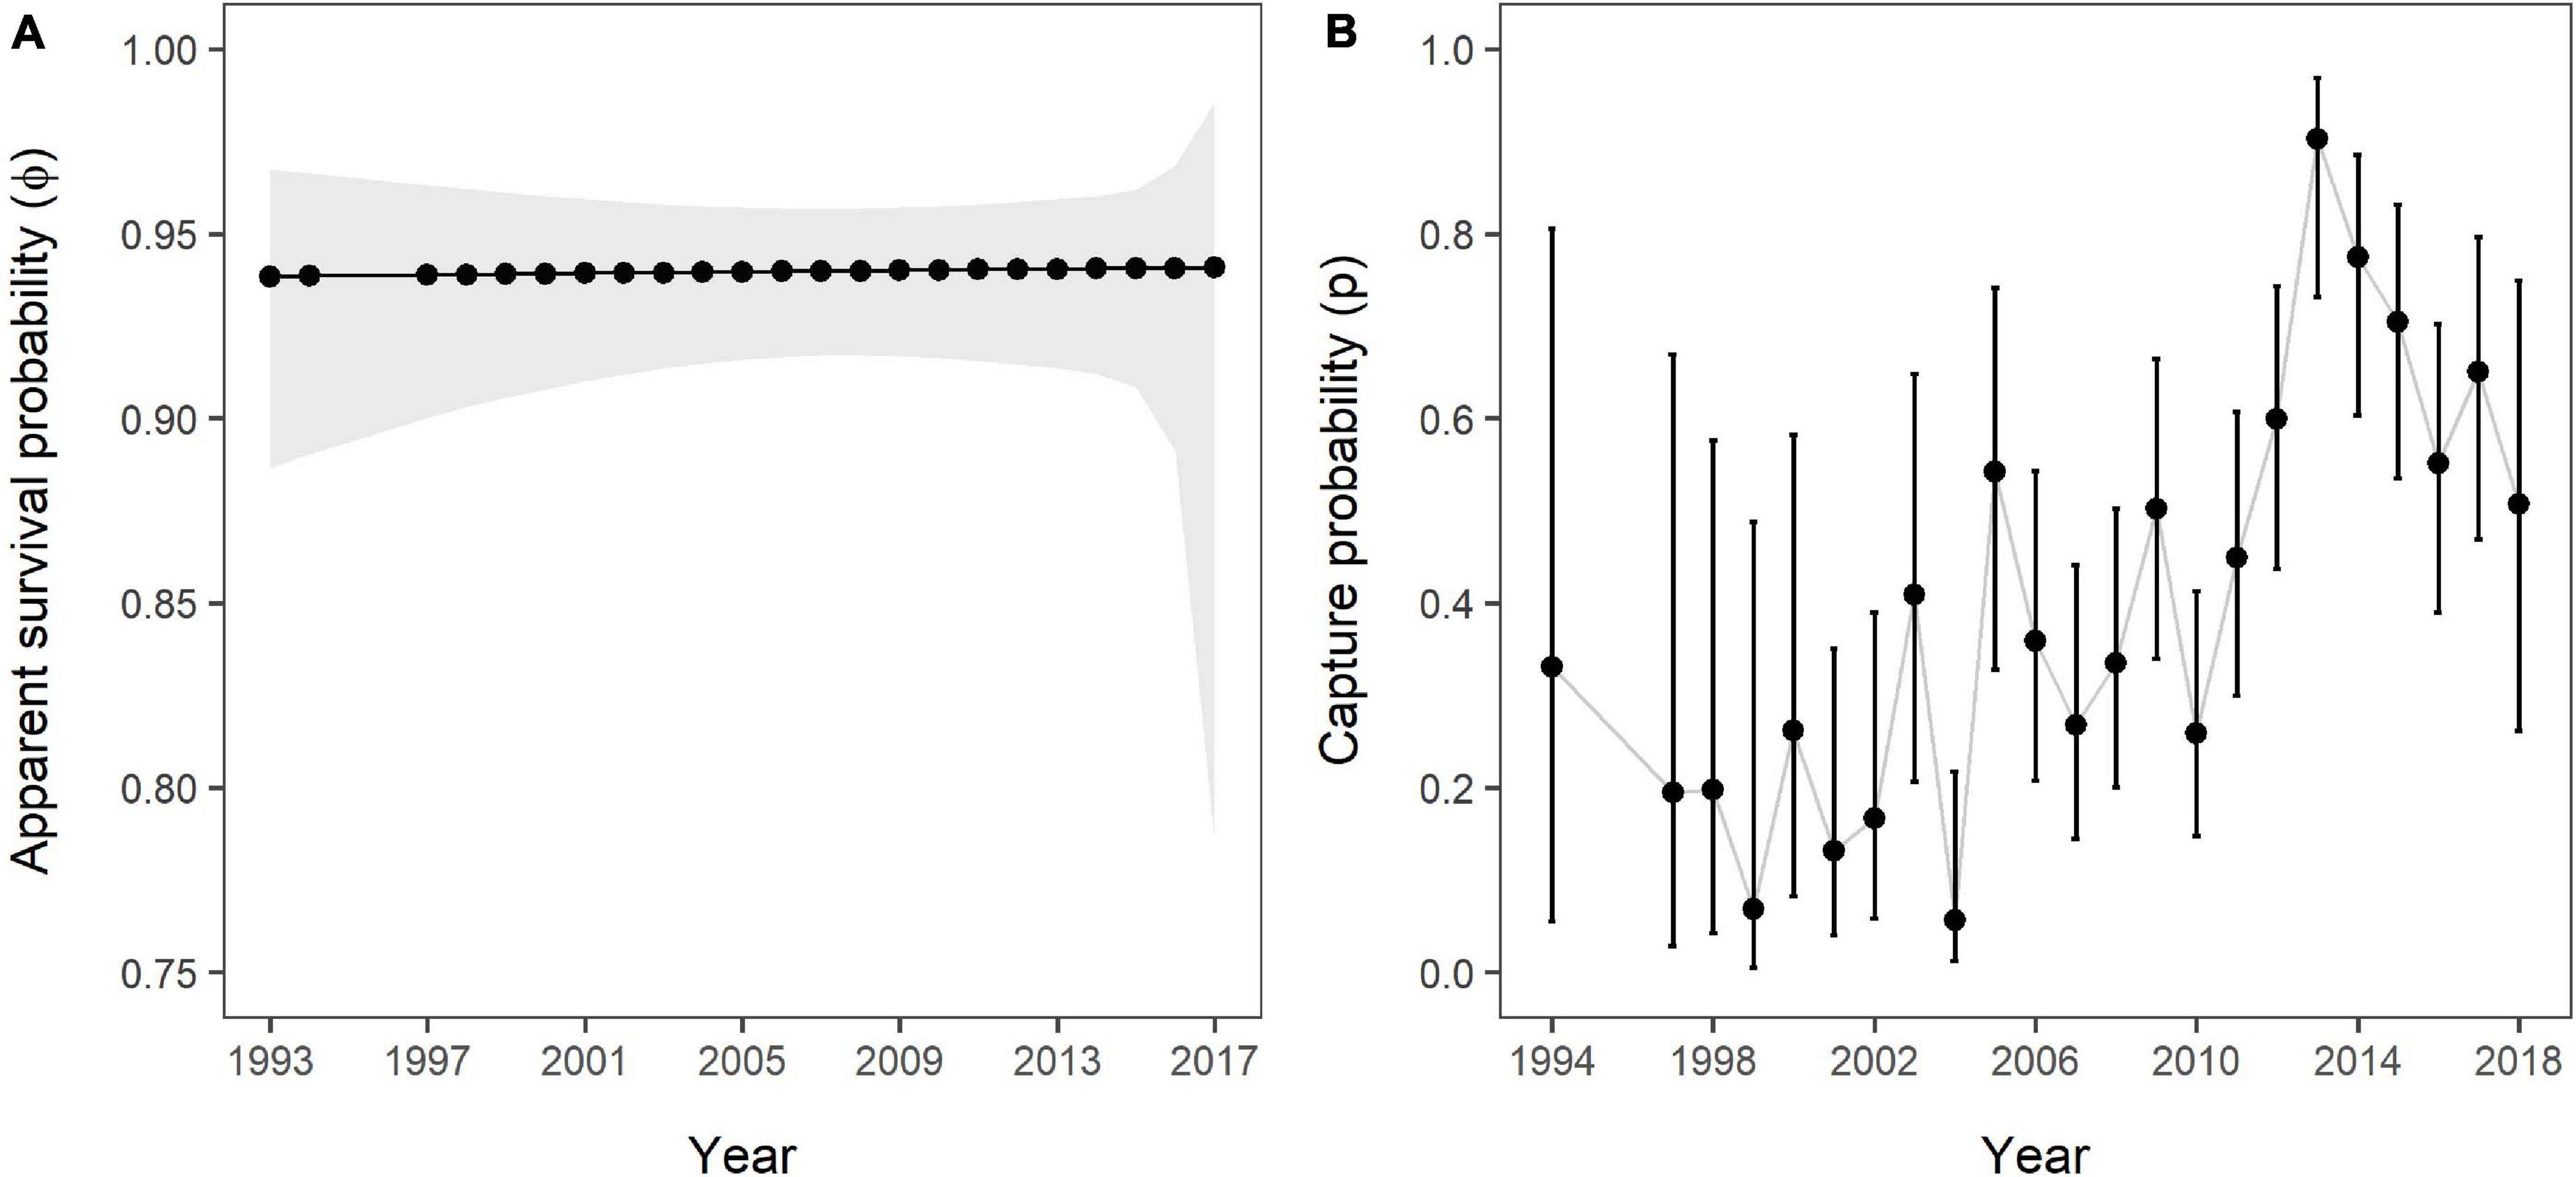
Figure 5. (A) Apparent survival and (B) capture probabilities over the study period as estimated by the Overall Survival model, including all 141 individuals and no grouping variable. The grey polygon (A) and error bars (B) represent 95% confidence intervals. No estimates were obtained for 1995 and 1996 due to a lack of data.
Site Fidelity
The relative importance of covariates in the Site Fidelity model was in line with the most parsimonious model (Table 4 and Supplementary Table 8). Site fidelity group effect (Site) was strongly supported (Ak = 1), and support for a temporal trend (T), thus a directional trend in SR over time, was almost equally strong (Ak = 0.932). The interaction term between the two factors received greater support than an additive effect (Ak = 0.76 and 0.172, resp.). For capture probability, an additive effect between Site and t was most supported (Ak = 0.999), while each of the factors on itself had an Ak = 1 (see Table 4). Trap dependence (td) as an alternative explanatory variable received virtually no support (Ak < 0.001), neither did the variables effort, photo, and Brandon (Supplementary Table 8).
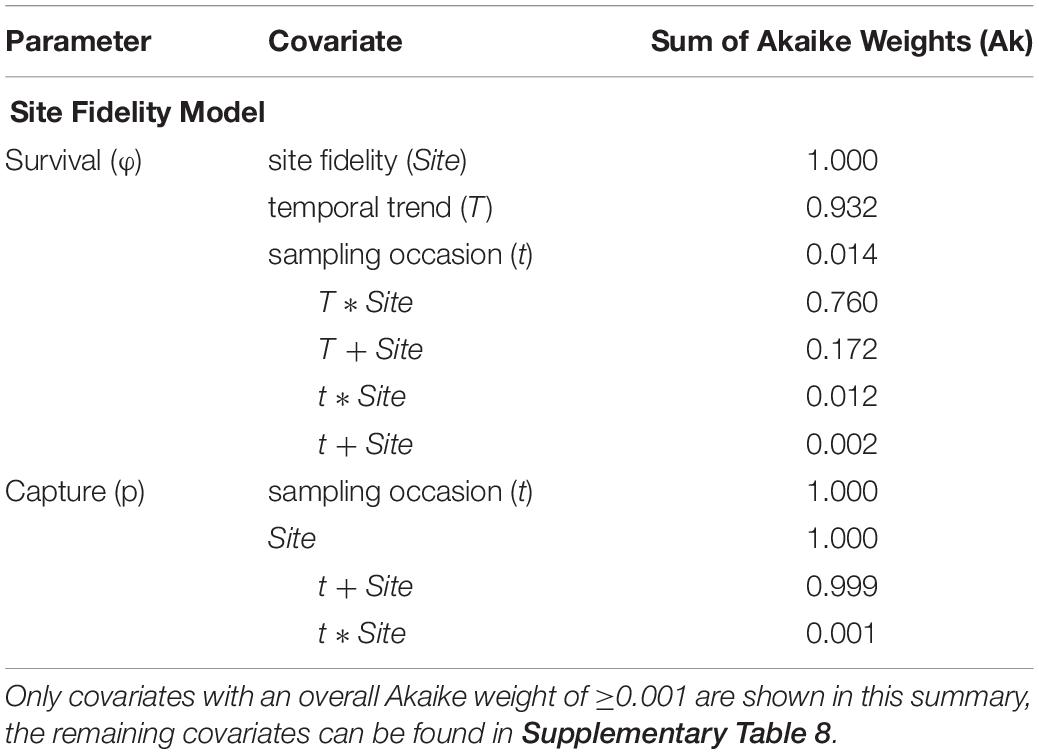
Table 4. Summary of the covariates included in the Site Fidelity candidate models, sorted by their respective sum of Akaike weights (Ak) which reflect their relative importance across all candidate models.
The model-averaged apparent survival estimates of “Brandon frequent” and “Shannon frequent” individuals were significantly higher than those of individuals with few sightings during the period 2009 to 2015 (“Shannon frequent”) and 2010 to 2013 (“Brandon frequent”) (Figure 6A). No significant difference was found in apparent SRs between “Shannon frequent” and “Brandon frequent.” Between 1993 and 2017, apparent SRs declined from 0.999 (95% CI: 0.629–1) to 0.836 (95% CI: 0.354–0.979) for “Brandon frequent” individuals. They decreased from 0.944 (95% CI: 0.833–0.982) to 0.783 (95% CI: 0.637–0.881) for individuals with “Few sightings” and from 0.9997 (95% CI: 0.461–1) to 0.941 (95% CI: 0.658–0.992) for “Shannon frequent” individuals. However, while the decline was relatively linear for “Few sightings” individuals, survival was stable and close to 1 in the other two groups until 2008 (“Brandon frequent”) and 2012 (“Shannon frequent”), before starting to decline. The negative trend indicated by the most parsimonious model was not significant in any of the three groups (Figure 6A).
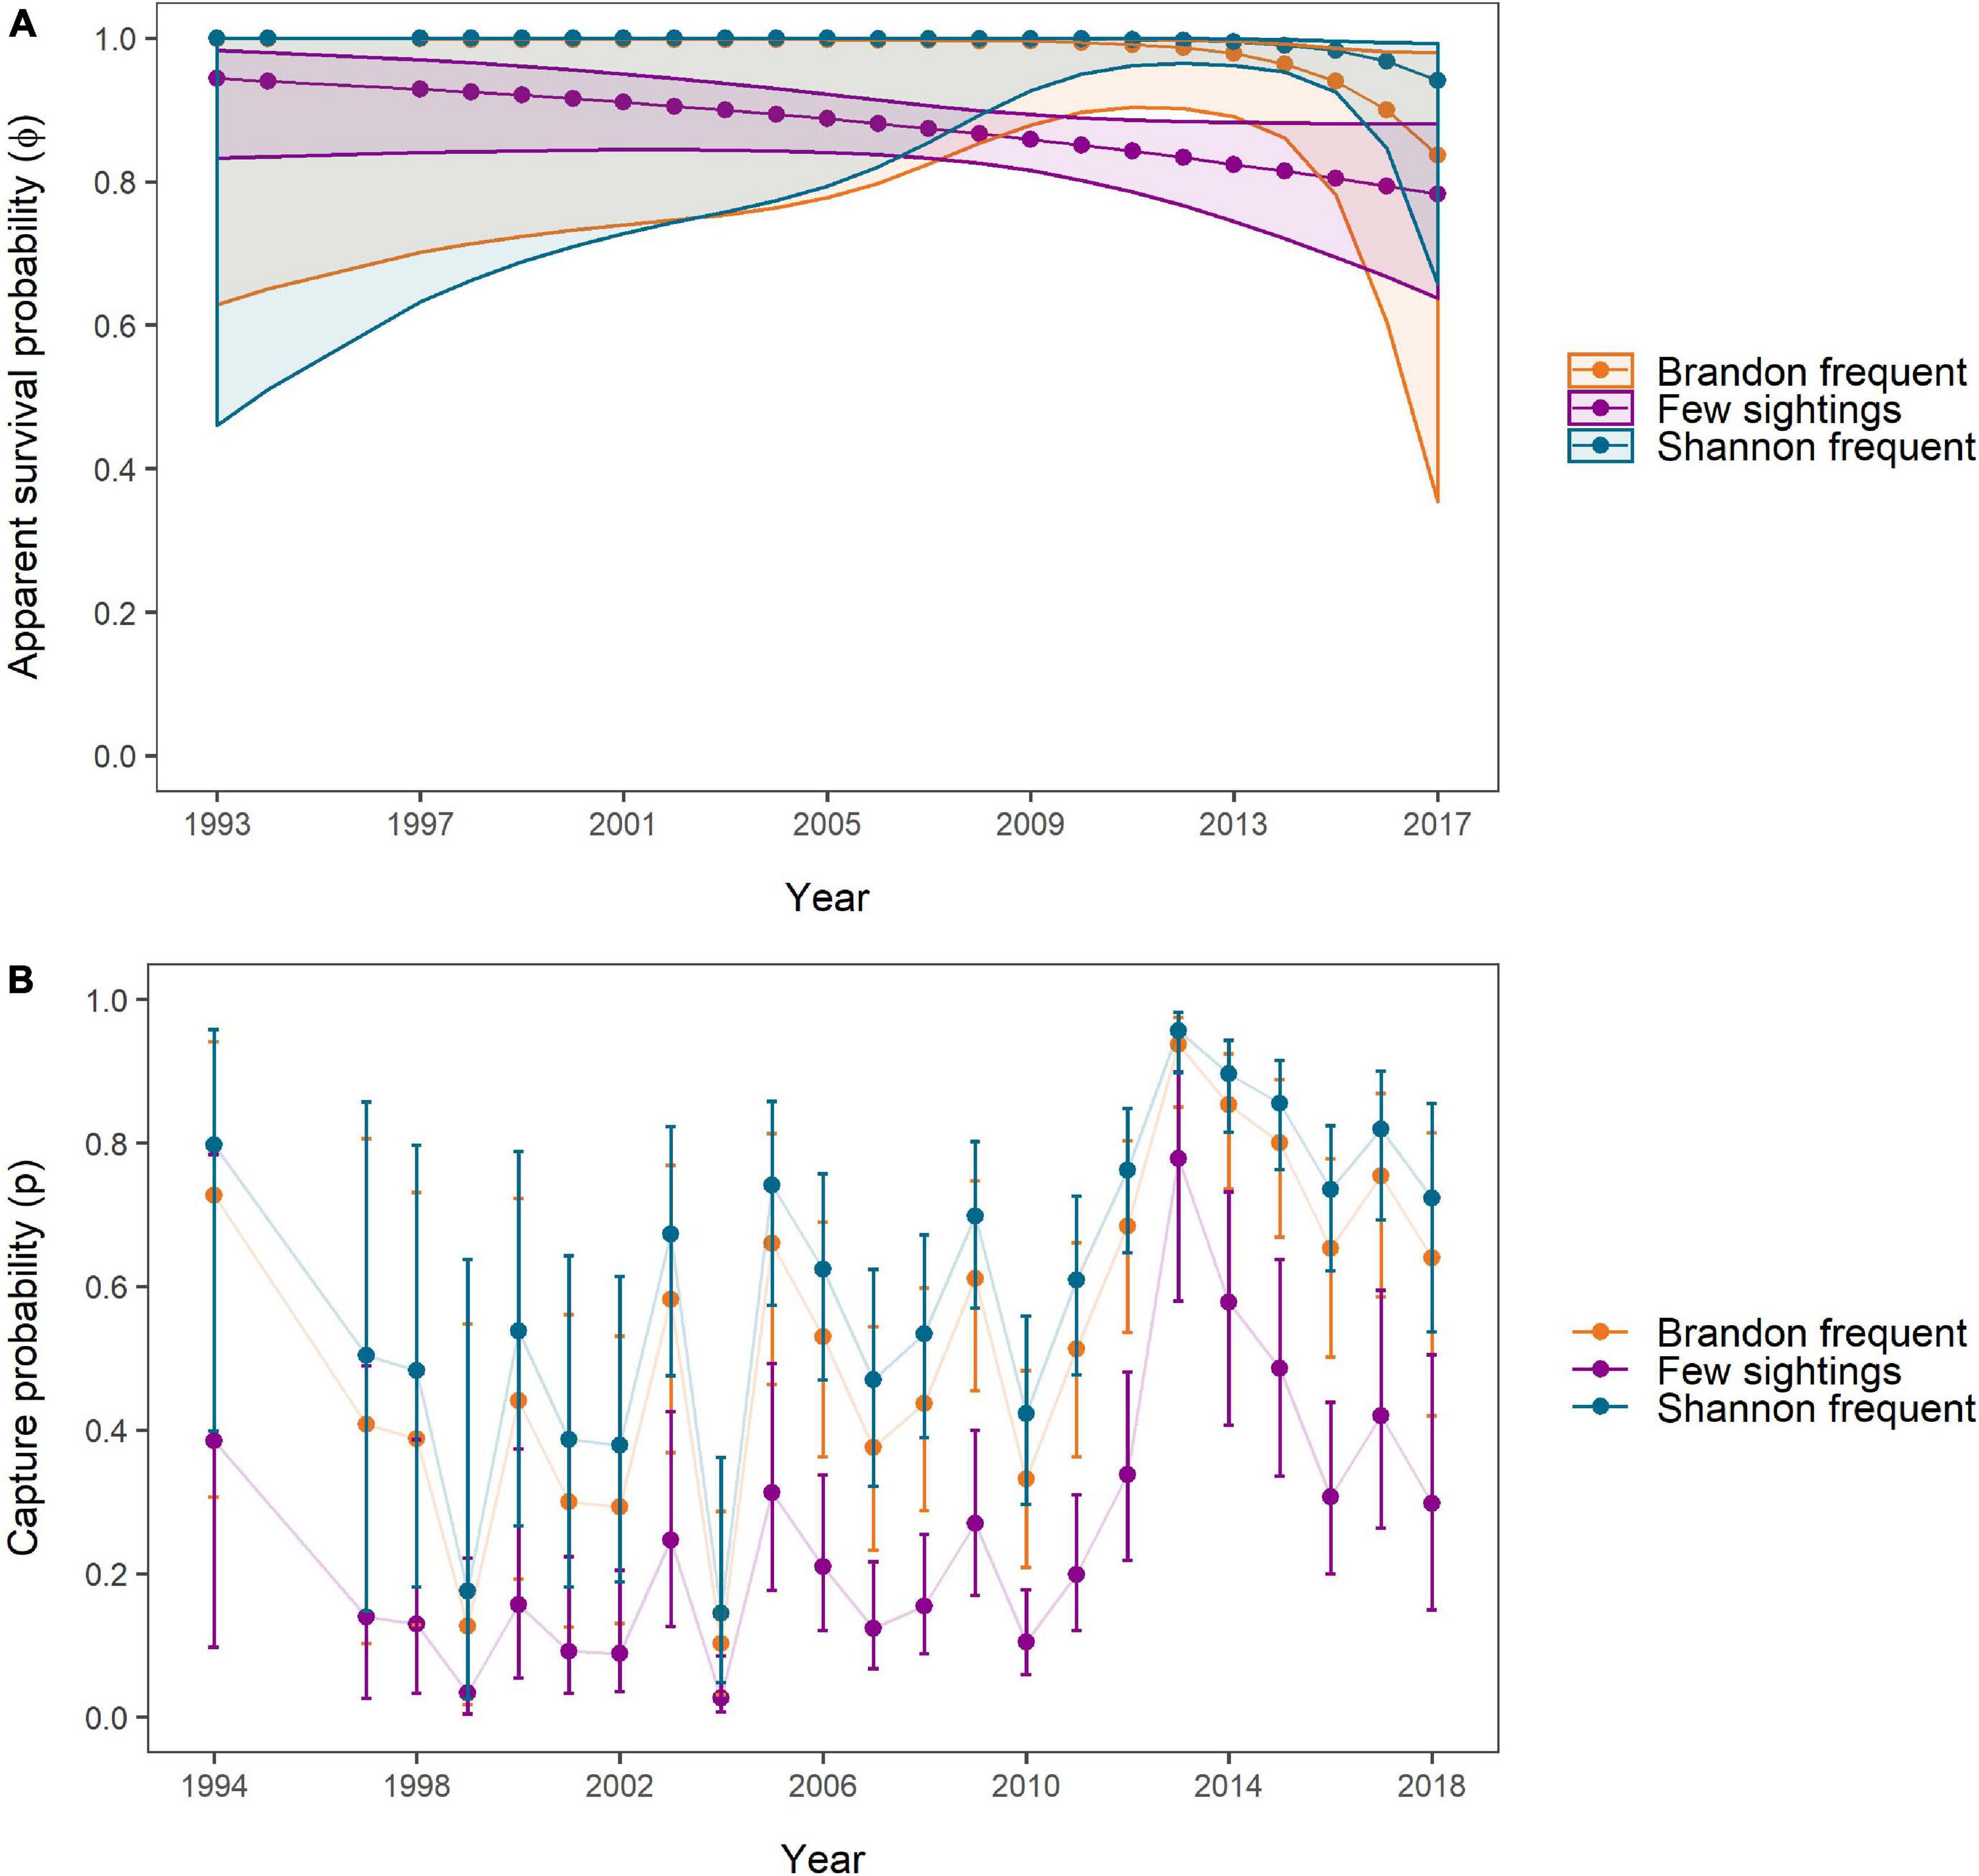
Figure 6. (A) Apparent survival and (B) capture probabilities over the study period as estimated by and averaged for all Site Fidelity CJS models. Estimates were obtained for individuals frequently sighted in Brandon Bay (n = 13, orange), individuals with few overall sightings (n = 78, purple), and individuals frequently and almost exclusively sighted in the Shannon Estuary (n = 50, blue). The correspondingly coloured polygons (A) and error bars (B) represent 95% confidence intervals around the estimates. No estimates for 1995/1996 were obtained due to lacking data.
The highest capture probabilities for all groups were achieved in 2013 [“Brandon frequent” = 0.937 (95% CI: 0.851–0.975); “Few sightings = 0.778 (95% CI: 0.58–0.899); “Shannon frequent” = 0.957 (95% CI: 0.898–0.982)], which coincided with one of the years with high survey effort (Figure 6B). The lowest estimates for all groups were obtained for 2004, when only two surveys were carried out, with 0.103 (95% CI: 0.012–0.287) for “Brandon frequent,” 0.026 (95% CI: 0.008–0.085) for “Few sightings” and 0.144 (95% CI: 0.048–0.361) for “Shannon frequent.”
Mark Severity
For the Mark Severity model, an age effect was included, after the GOF component TEST 3.SR (=test for a transience effect) had not delivered a clear result. The Ak suggested that both mark severity (MQ) and age class (t/t) were the most important covariates influencing survival parameters (Ak = 0.729 and 0.94, respectively) (Table 5 and Supplementary Table 9). A temporal trend (T) received little support (Ak = 0.12), and indeed, within the groups of age class and mark severity, SRs showed very little variation over time (Figures 7A,B). Ambiguity was found to exist about the relationship between age class and mark severity, as both an additive and interaction term received almost equal support (Ak = 0.346 and 0.340, resp.). The difference between the MQ classes was greater for age class “0” than for all “older” individuals, pointing toward an interaction effect.
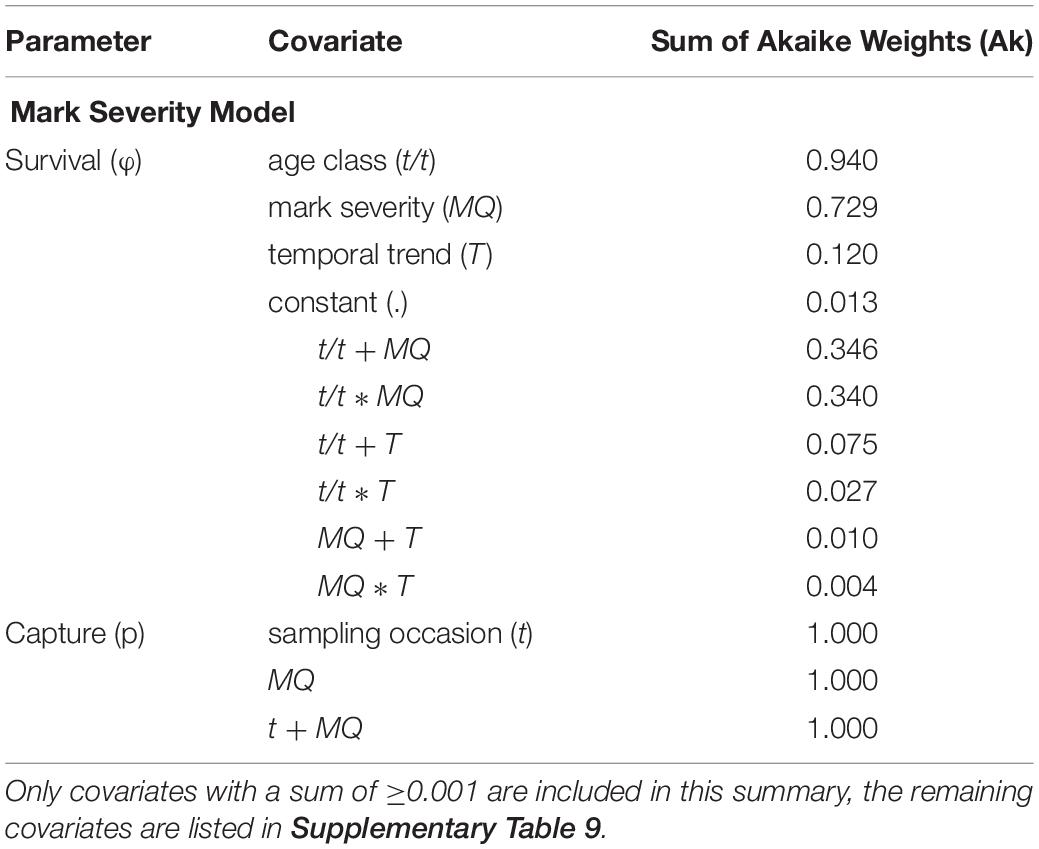
Table 5. Summary of the covariates included in the Mark Severity candidate models, sorted by their respective sum of Akaike weights (Ak) which reflect their relative importance across all candidate models.
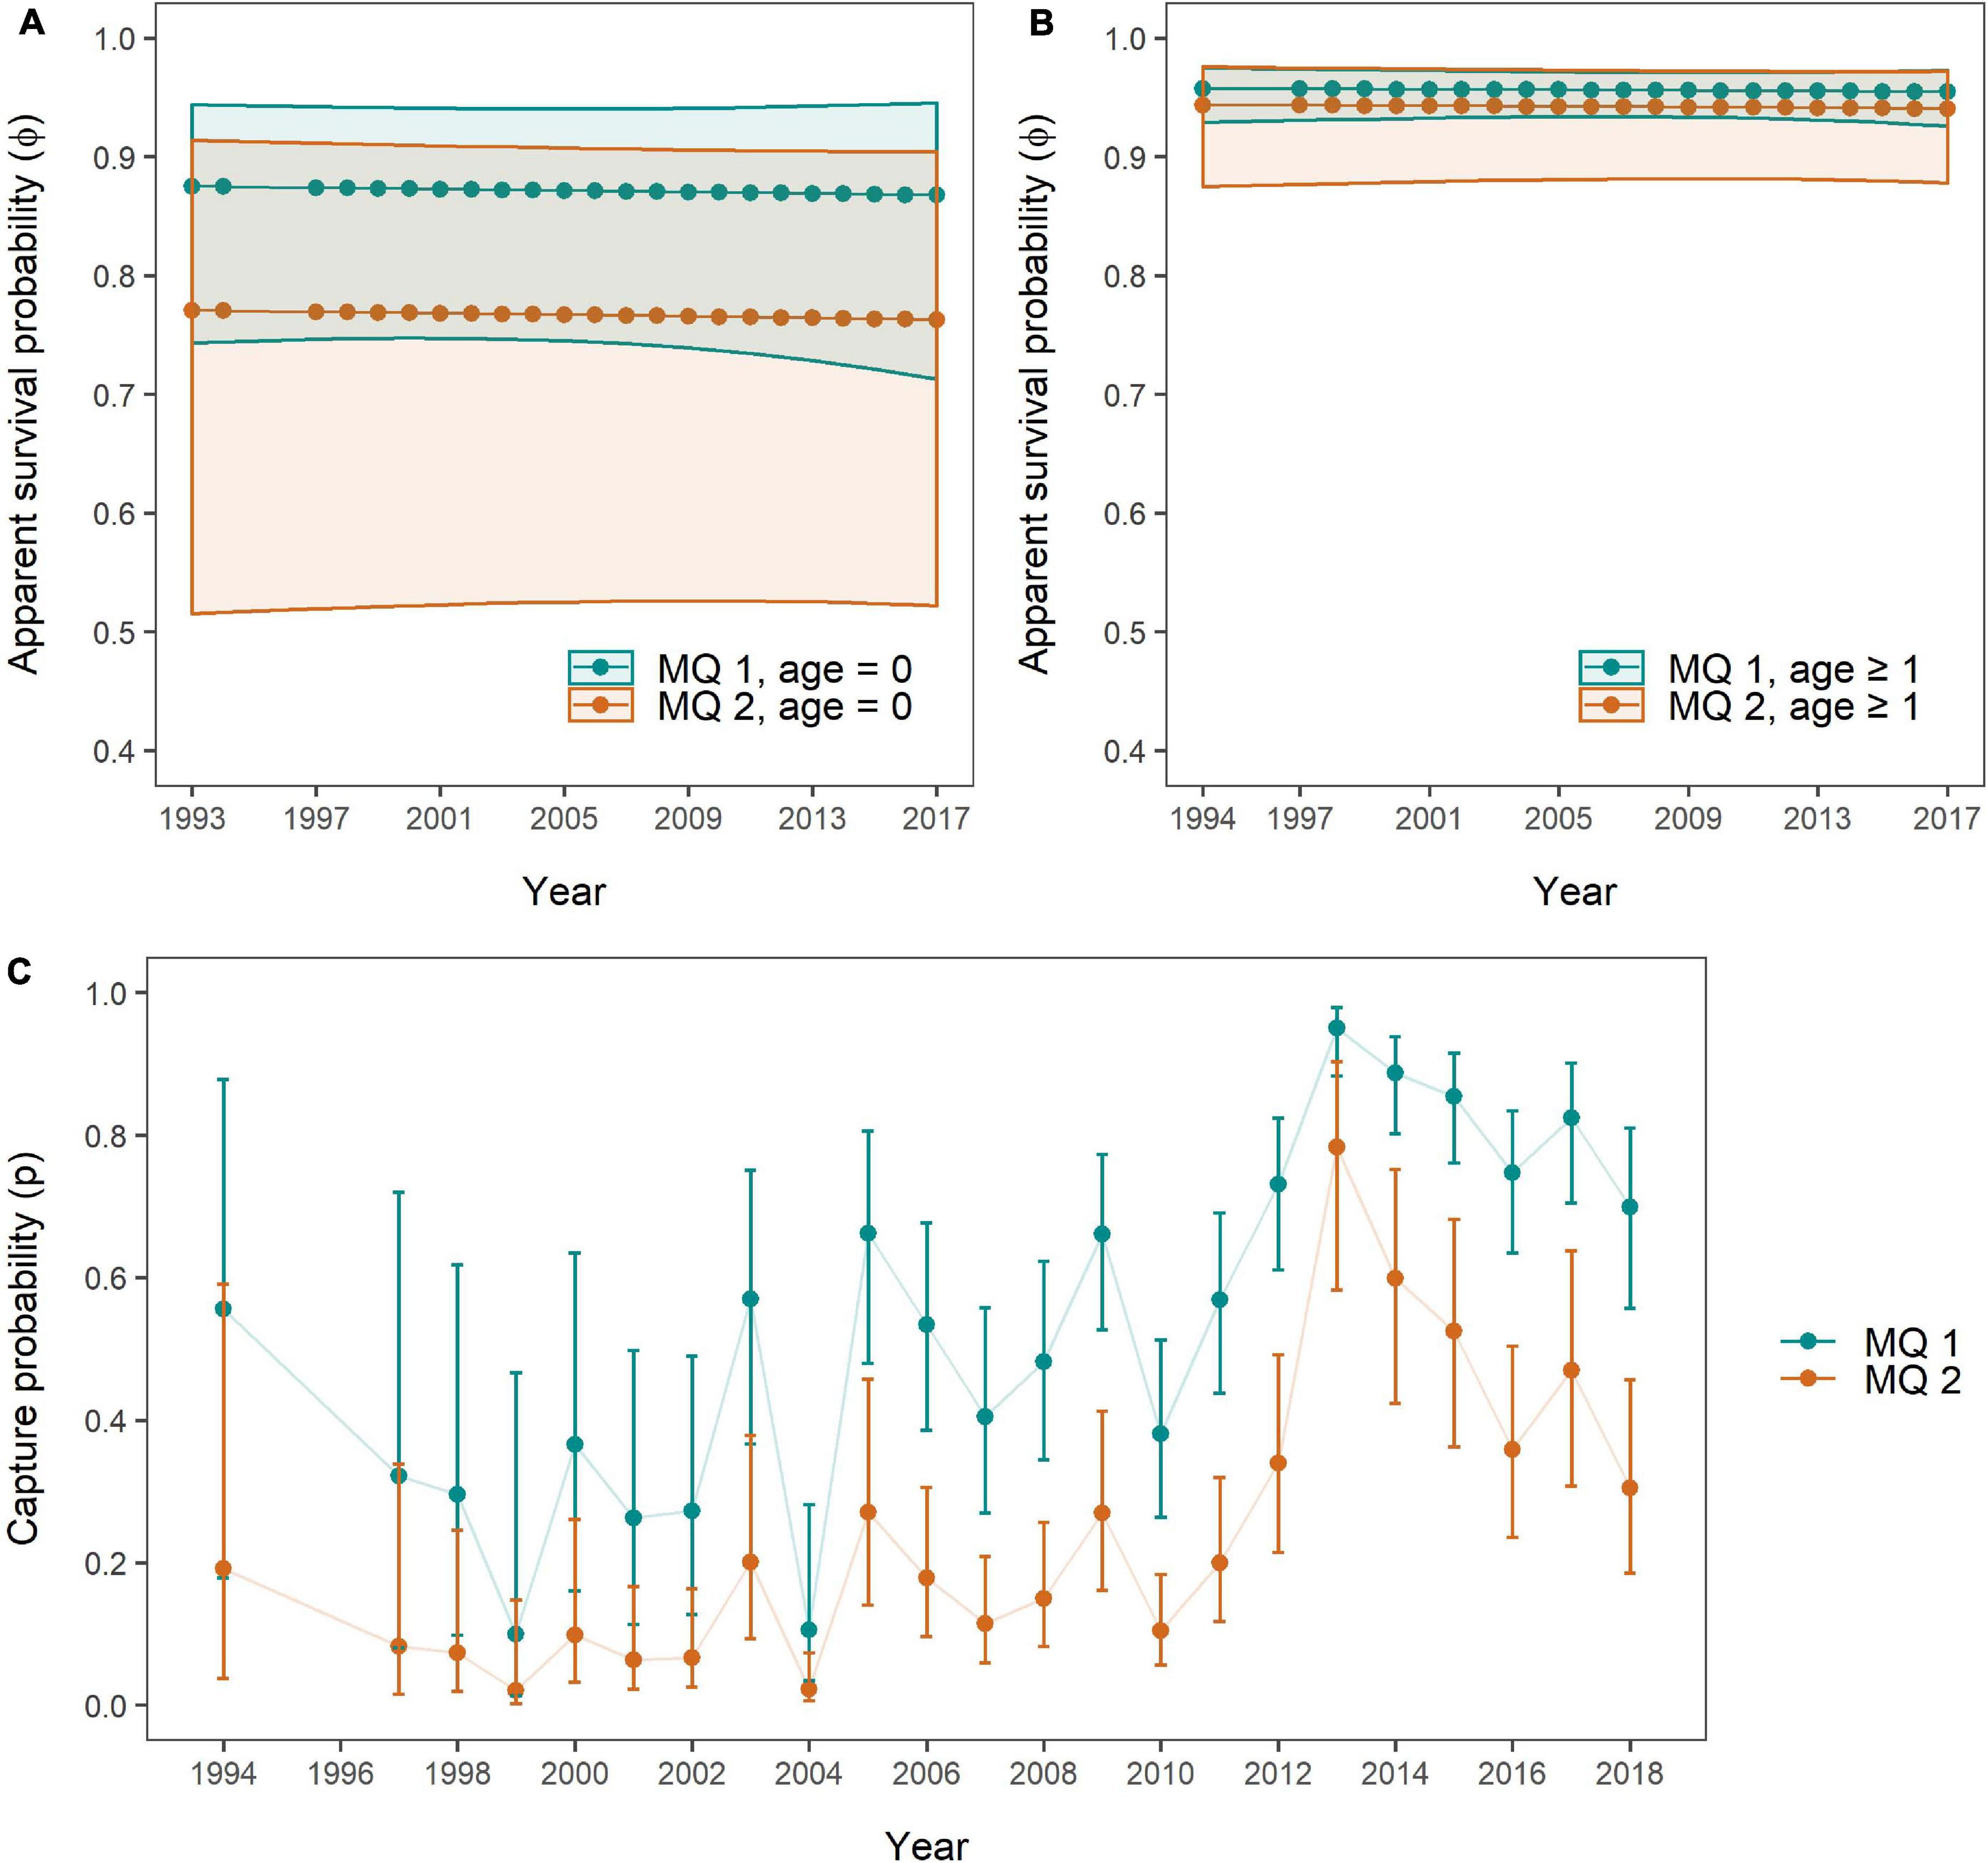
Figure 7. Apparent survival probabilities of MQ-1 (n = 92, turquoise) and MQ-2 individuals (n = 47, orange) for (A) age class “0” and (B) age class “1 or older,” as well as (C) capture probabilities per mark severity group as obtained through the Mark Severity model. 95% confidence intervals are presented as polygons (A,B) and error bars (C) in the respective colours.
Overall, SRs were constant for all age and mark severity classes with lower survival estimates and larger confidence intervals for age class “0” compared to age class “one or older.” The mean apparent SRs for age class “0” over the 23 years were 0.871 (±0.003 SD) for MQ-1 and 0.767 (±0.003 SD) for MQ-2, while for age class “one or older” they were 0.956 (±0.001 SD) for MQ-1 and 0.942 (±0.001 SD) for MQ-2. SRs were higher for MQ-1 individuals than for MQ-2 individuals in both age classes, however, this disparity was very small in the “older” age class (Figure 7B), and for both age classes the confidence intervals were so wide that no significant difference in survival could be detected between mark severity groups. Only between “older” MQ-1 individuals and “young” MQ-2 individuals, SRs of the former were significantly higher than for the latter group, across all years.
Capture probabilities, like in the Site Fidelity models, responded primarily to an additive effect of time (t) and group (here mark severity, Table 5 and Supplementary Table 9). These two factors, and their additive relationship, received virtually all support from the candidate models (all Ak = 1). The lowest capture probabilities for both MQ-1 and MQ-2 individuals were estimated for the year 1999, with 0.099 (95% CI: 0.014–0.467) and 0.021 (95% CI: 0.003–0.148), respectively, while the highest capture probabilities were obtained for 2013, with 0.95 (95% CI: 0.884–0.98) for MQ-1 and 0.783 (95% CI: 0.583–0.903) for MQ-2 dolphins (Figure 7C).
To investigate the distribution of individuals over mark severity and site fidelity classes a posteriori, a χ2-test of independence was conducted and was highly significant (χ2 = 21.126, df = 2, p < 0.001), indicating that individuals were not equally distributed across the categories of the two variables. “Few sightings” included equal numbers of MQ-1 and MQ-2 individuals (38 each), while “Brandon frequent” encompassed no MQ-2 and 13 MQ-1 individuals, and “Shannon frequent” included nine MQ-2 and 41 MQ-1 individuals.
Discussion
Long-term data are required to estimate survival and mortality of long-lived species. This study used one of the longest-running photo-ID datasets for bottlenose dolphins in Europe, which now spans almost 27 years (Berrow et al., 1996). The data were collected by an NGO which relies heavily on volunteers and platforms of opportunity, and which has had very limited funding most years for this monitoring.
Such limitations are typical for long-term monitoring projects worldwide which do not have government or academic support, but they can compromise survey effort and the quality of data collection. Impacts can include high variability in survey effort, variability in data quality due to variation in photographic skills between volunteers or camera equipment as well as misidentifications in the photo-ID catalogue during matching. Misidentifications were found mostly during the period between 2005 and 2009, which was characterised by several short-term projects that included the collection and processing of photo-ID data by a range of researchers (Leeney et al., 2007; Berrow, 2009; Foley et al., 2010). The number of misidentifications decreased when the catalogue was curated by a single person between 2008 and 2016 (Baker et al., 2018a). This indicates that observer bias influenced the matching process. The current protocol involves the validation of matched images by two independent researchers and the head researcher in order to be accepted into the catalogue, and only the best images of each survey are included (Baker, 2015). By maintaining this protocol, the occurrence of matching errors in the future is expected to remain low.
Regression analysis showed a positive relationship between the number of individuals encountered and the number of surveys conducted, and capture probabilities were comparatively higher in the years of higher survey effort (2012–2018) than in years of lower effort, yet no relationship between effort and capture probabilities was detected by any of the three CJS models. This appears paradoxical, but survey effort is not a constant entity as it can vary due to observer skills and experience (Lusseau and Slooten, 2002), sea state (Stern et al., 1990), available equipment (Urian et al., 2015), and the platform used. Tour boats, for instance, can greatly augment survey numbers as platforms of opportunity, and in the Shannon Estuary, dolphin watching tour boat platforms are higher above sea-level than a RIB, which may enable a dolphin to be observed before it surfaces, and thus to obtain better images (Berrow and Holmes, 1999; Bertulli et al., 2018). However, tour boats often have fixed routes, which results in unequal coverage of the survey area and lower effectiveness (Berrow and Holmes, 1999; Corkrey et al., 2008; Bertulli et al., 2018). They also spend less time on individual groups than a dedicated platform resulting in not all the individuals in a group being photographed. In the present study, all these factors were subject to changes over time. Therefore, survey numbers are too simplistic to grasp the complexity of survey-related factors influencing capture probability (e.g., Corkrey et al., 2008; Silva et al., 2009). The same applies to photographic equipment and years with/without Brandon surveys, which were crude binary variables.
Choice of Models
Both the Overall Survival model and the Mark Severity model suggested constant SRs over time. The Site Fidelity model suggested a negative temporal trend in all three groups with the patterns of decline varying between groups. Capture probabilities showed the same patterns in all three models, with the highest capture probabilities for all groups estimated in 2013. Significantly higher capture probabilities of “Shannon/Brandon frequent” compared to “Few sightings,” and of MQ-1 compared to MQ-2 individuals, were repeatedly the case between 2003 and 2018. Variations in capture probability, however, were not found to be the direct consequence of effort or any other factor related to survey approaches (photographic equipment, coverage of Brandon Bay), and were better explained by temporal variation in combination with individual heterogeneity (trap dependence and site fidelity/mark severity groups). Overall, large error margins at the beginning and end of the study period made inference of precise estimates challenging, for both survival and capture probabilities. This was especially pronounced in the Overall Survival and Site Fidelity model, while precision in the Mark Severity model was constant and only low for age class “0.”
Other MR-model types rather than CJS may have been more suitable to estimate survival for a population where temporal migration was assumed to occur, like Pollock’s Robust Design or a multi-state model (Pollock, 1982; Lebreton and Pradel, 2002; Arso Civil et al., 2019). However, the Robust Design model requires sightings data to be divided into primary and secondary sampling occasions and therefore needs more precise information for the secondary sampling occasions than was available (Pollock, 1982). Likewise, the use of multistate models was rejected because sightings of the same individuals in both the Shannon and Brandon in the same year would have complicated encounter histories. Also, there were too few transitions in mark severity from MQ-2 to MQ-1 to calculate these rates reliably (e.g., Lindberg and Rexstad, 2002). Therefore, an extension of the CJS model was selected instead. Half of the individuals in the “few sightings” group were MQ-2 individuals, and their lower level of identifiability was at least partly responsible for their low sighting rates, rather than migration. All dolphins assigned to “Brandon frequent” were well-marked individuals, probably because assignment to this group was conditional on a relatively high overall sighting rate, which less well-identifiable MQ-2 individuals generally did not have. If this study were to be repeated, the exclusion of less well-marked individuals from the analysis could result in more representative site fidelity groups, although this would lead to reduction of the effective sample size.
Capture heterogeneity among individuals of the Shannon population occurred but this is common in wild animal populations and can have different explanations (Pledger and Efford, 1998; Gimenez et al., 2018a), including indication of non-random temporal migration. Trap dependence assumes that some individuals avoid observers and others are more “trap-happy,” whereas non-random temporal migration indicates that some individuals are less available for capture because they periodically leave the study area altogether (Schleimer et al., 2019). From the Mark Severity model, higher capture probabilities for more distinctive individuals were confirmed and attributed to the restrictions in quality of MQ-2 images in the dataset to maximise available data without compromising identifiability (Whitehead and Wimmer, 2005). Lower sighting rates of less identifiable MQ-2 individuals may also explain the significantly lower survival and capture probabilities of “few sightings” individuals of the Site Fidelity model. However, 50% of these individuals were distinctly marked and fifteen of them had only been sighted once over the course of the study period. This indicates that mark severity is not the only factor causing individual heterogeneity in capture probabilities. Another explanation is habitat partitioning with some dolphins using less frequently surveyed areas and are thus rarely sighted (Ingram and Rogan, 2002; Baker et al., 2018b). Variation in site fidelity between individuals has been observed in bottlenose dolphins (Speakman et al., 2010; Zanardo et al., 2016), with explanations including sex-specific migration between areas (Wells and Scott, 1990) and specialisation on different prey, or competition between individuals/groups within the same population (Wilson et al., 1997). Given that groups of Shannon individuals typically include both males and females (Baker et al., 2020), sex-specific differentiation seems unlikely. Competition or variation in prey preferences, however, could be potential drivers, as the Shannon Estuary is known to offer special types of prey to dolphins, including Atlantic salmon (O’Brien et al., 2014; Hernandez-Milian et al., 2015).
Brandon Bay and Coastal Area Encounters
A total of 40 out of 141 marked individuals from the Shannon Catalogue have been sighted at least once in Brandon and Tralee Bays across all years, and 16% of the marked population were sighted exclusively in the area in at least 1 year, one individual in as many as 4 years. The largest number of encounters coincided with the year of highest survey effort (2013) in Brandon/Tralee Bays, with 25 individuals recorded. When considering encounter histories for individual dolphins in this study, exclusive Brandon sightings accounted for 33 data-points that otherwise would have been recorded as absence. For ten individuals, encounters in Brandon Bay occurred after their last sighting in the Shannon Estuary, and four individuals have been exclusively sighted in Brandon Bay since 2008, providing evidence for migration rather than mortality. For now, temporal migration of these individuals stays a hypothesis.
Essentially, “Brandon frequent” and “Shannon frequent” individuals had the same capture probabilities, and most “Brandon frequent” individuals also had relatively high sighting rates in the Shannon Estuary, with sightings in both areas often occurring within the same year or alternating between years. Individuals recorded in Brandon must be regularly travelling between sites in order to have high sighting rates in both study areas. Hastie et al. (2004) and Wilson et al. (2004) suggested prey abundance and distribution was the main driver for similar behaviour in Scotland, with the availability of alternative prey species in Brandon and Tralee Bays being a potential reason for temporary occupancy by bottlenose dolphins. The ICBDC comprised 192 individuals, but only one individual was exclusively observed outside of both Shannon Estuary and Brandon Bay in any 1 year. These observations suggest that emigration beyond Brandon is currently rare. However, the apparent “emigration effect” from the Shannon Estuary to Brandon Bay has implications for future monitoring and conservation plans. Some individuals might have permanently emigrated to Brandon/Tralee Bays, thus showing a “range shift” rather than mere “expansion” and future survey effort in Brandon and Tralee Bays is needed to explore this through a more balanced, continuous monitoring effort.
Survival Rates
The average SR across all individuals and years was 0.94 (±0.001 SD), with strong support for constancy of survival over time. The Mark Severity model also suggested constant survival, with rates being slightly higher than in the Overall Survival model after individuals with only one sighting (“transients”) had been filtered out through age dependence [0.956 (±0.001 SD) for MQ-1 and 0.942 (±0.001 SD) for MQ-2]. The inclusion of age dependence was strongly supported by the Mark Severity model. Likewise, lower initial than subsequent SRs are a typical observation when a transient effect is the case, and this pattern was observed from the Mark Severity model, although it was not significant within mark severity groups (Pradel et al., 1997; Silva et al., 2009). “Transient” individuals with an effective SR of zero after their only sighting can introduce a considerable negative bias if they are too prominently represented in a dataset, especially when the discrepancy to individuals with high sighting rates is large (Pradel et al., 1997; Prévot-Julliard et al., 1998; Fletcher et al., 2012). As almost half of all MQ-2 individuals were only recorded once over the study period, they are probably the reason behind the strong support for an age model. In this case, low identifiability rather than true transience was likely the factor responsible for the effect.
Both the Mark Severity and Overall Survival models favoured constant SRs. These results are supported by the outcomes of abundance assessments which have been repeatedly performed by independent research groups since 2007 and which have indicated a stable population size over the years, confirming the assumption of a healthy population (Rogan et al., 2000, 2018; Englund et al., 2008; Berrow et al., 2012; Baker et al., 2018a; Blázquez et al., 2020). Considering these findings, the downward survival trends proposed by the Site Fidelity model are assumed not to represent true effects. Rather, they are a consequence of the classification scheme for site fidelity groups. The “Few sightings” group had both lower capture and survival probabilities than the other two groups and showed a steady downward trend in survival from 0.944 (95% CI: 0.833–0.982) to 0.783 (95% CI: 0.637–0.881) between 1993 and 2017. Given the reported stability of abundance and the constancy of survival in the other two models, the negative temporal trend could be the consequence of accumulating individuals with low capture probability and high uncertainty of fate over time (Hwang and Chao, 1995; Prévot-Julliard et al., 1998; Fletcher et al., 2012), similar to what is observed in a “temporal bias” (Langtimm, 2009; Schleimer et al., 2019), rather than reflecting a true effect.
To have high sighting rates, individuals have to have been alive and regularly recorded for a certain number of years, which explains that SRs obtained for “Shannon/Brandon frequent” were close to one for most of the study period. Toward the end of the study period, once this pre-condition was met and became irrelevant, SRs for “Shannon frequent” decreased to a similar level as indicated by the Overall Survival model by 2017 (0.941, 95% CI: 0.658–0.992). For “Brandon frequent” individuals, the decline toward the end of the study was stronger but not significant, with a final survival estimate of 0.836 (95% CI: 0.354–0.979) in 2017. This observation is typical for a terminal bias, which occurs when individuals had left the study area by the end of the study period and have not returned by the last survey (Langtimm, 2009; Peñaloza et al., 2014; Schleimer et al., 2019). To avoid temporal bias when assessing population trends, the use of auxiliary sighting data and an increase in effort toward the end of a given study are recommended (Peñaloza et al., 2014).
The overall adult SR for the Shannon population (0.94 ± 0.001 SD) is comparable to those reported from other bottlenose dolphin populations in temperate regions. In the Moray Firth (Scotland), bottlenose dolphin survival was initially estimated to be 0.93 (±0.029 SD) (Corkrey et al., 2008) but a recent update has indicated an increase in SRs from 0.931 (95% CI: 0.886–0.958) to 0.960 (95% CI: 0.932–0.977) between 1990 and 2015 (Arso Civil et al., 2019). Comparable survival estimates were obtained for the bottlenose population in Doubtful Sound (New Zealand), at the southern edge of the species’ range. Here, adult survival was constant at 0.937 (95% CI = 0.917–0.953) for the period between 1990 and 2008, and it was suggested that long lifespans of these animals acted as a sort of “buffer” that stabilised adult SRs despite changes in the environment (Currey et al., 2009). This might explain why SRs in the Shannon Estuary also appear stable over time. A former attempt to assess mortality in the Shannon population, using photo-ID data between 2008 and 2016, had resulted in a mean annual maximum mortality rate of 0.038, suggesting an annual SR of 0.962 (Baker et al., 2018a). This is higher than found for the overall population in the present study, but in some cases comparable to SRs of bottlenose dolphin populations living at lower latitudes [0.97 ± 0.029 SE in the Azores archipelago (Silva et al., 2009) and 0.951 (95% CI: 0.882–1.00) in Charleston, SC, United States (Speakman et al., 2010)]. The maximum annual mortality rate calculated by Wells and Scott (1990) for the bottlenose dolphin population in Sarasota Bay, FL, United States was 0.038 (±0.0076 SD) and therefore identical with the value obtained by Baker et al. (2018a). Currey et al. (2009) have suggested that populations at lower latitudes have higher SRs due to ecological differences between temperate and tropical seas, which would support that the true SR was closer to 0.94 than 0.96.
Recommendations for Monitoring and Future Research
This study has important implications for future monitoring. Heterogeneity in capture probabilities was not explained exclusively through mark severity patterns or variation in the number of surveys, and a degree of habitat partitioning was a potential explanation. In order to minimise bias caused by range heterogeneity the full study area should be covered within a sampling occasion and all individuals that are encountered should be captured (Evans and Hammond, 2004). The limited range of dolphin watching tour vessels in the estuary should be compensated for by an enhancement of dedicated research surveys to achieve good coverage of the area. Furthermore, current monitoring efforts should be extended to Brandon and Tralee Bays. The Lower River Shannon SAC is designated to protect a unique Irish bottlenose dolphin population, but if its home range extends beyond the SAC boundaries and the population declined, even the most rigorous conservation measures may not be successful because the protected proportion of the population is effectively smaller than assumed (Wilson et al., 2004). For instance, the presence of different fisheries in Brandon/Tralee Bays, including trawling activities (Fahy and Carroll, 2009) forms a potential source of pressure on the conservation of the Shannon bottlenose dolphins. It is therefore important to identify the spatial limits of the population, as well as investigating variations in seasonal habitat use and movement patterns between the areas. So far, the triennial monitoring plan of the NPWS is spatially constrained to only some parts of the Lower River Shannon SAC. Given the objective is to maintain a Favourable Conservation Status (FCS) of this population, the collection of additional data in Brandon/Tralee Bays might support an extension to the SAC boundary as previously recommended (Ryan and Berrow, 2013; Levesque et al., 2016). Ideally, future abundance estimate surveys should include a simultaneous assessment of SRs, which is common practice (Silva et al., 2009; Speakman et al., 2010; Nicholson et al., 2012; Sprogis et al., 2016; Bertulli et al., 2018; Arso Civil et al., 2019) and which provides a useful parameter to draw comparisons with other populations.
Abundance estimation is typically carried out over a short time frame, enabling researchers to use temporal marks for identification. For survival estimation individuals must be reliably identifiable over long periods, which are only possible with permanent marks meaning that either only very well-marked individuals should be included, which reduces the effective sample size, or that additional data has to be collected for the intermediate period. An annual survey effort with a high number of surveys would be ideal, as it would minimise the chance of losing individuals through severe change of markings (Englund et al., 2008). However, this is very hard to achieve without the necessary resources.
The latest population viability- and sensitivity analyses on this population by Blázquez et al. (2020), using the maximum mortality rate by Baker et al. (2018a), suggested the population has an increased risk of extinction if adult female mortality doubled. Given that the adult SRs estimated in this study were lower than indicated by Baker et al. (2018a), it is recommended to conduct these analyses with updated values, as the true risk of extinction might be higher than previously assumed. Several studies on SRs in cetaceans have identified age- and sex-specific differences in survival probabilities (Stolen and Barlow, 2003; Currey et al., 2009; Arso Civil et al., 2019). Arso Civil et al. (2019) showed that SRs for new-born calves were lower than for juvenile and adult bottlenose dolphins in the Moray Firth population, following a “fish-hook”-shaped distribution of mortality rates over age classes which has been found for many mammal species (Caughley, 1966). Also in the Shannon population, first year calf mortality was estimated to be higher than adult mortality (0.11 vs. 0.038) (Baker et al., 2018a). Currey et al. (2009) showed that high calf mortality can drive a bottlenose dolphin population toward a decline. To obtain a holistic picture of population dynamics, regular assessment of calf, juvenile and adult survival is recommended as well as periodical assessment of fecundity (see Baker et al., 2018a).
Adult survival should furthermore be assessed for each sex separately, since they often differ as a consequence of behavioural variation between the sexes (Sprogis et al., 2016; Arso Civil et al., 2019). Sex-specific SRs have not been assessed in the present study, because information on gender is still limited for the Shannon dolphins (e.g., Blázquez et al., 2020). Because bottlenose dolphins do not show sexual dimorphism, the determination of gender requires biopsy data or inspection of the genital slit. Mother-calf associations can be used as a proxy, identifying an adult as a female (Gibson and Mann, 2008; Baker et al., 2018a). The challenge of sex determination can additionally introduce bias into a dataset, because the opportunity to observe genital slits or to observe a female with a calf is higher for individuals that are more frequently encountered (Currey et al., 2009). To facilitate sex- and age-specific survival estimation in the future, an effort should be undertaken to gather this information for all individuals encountered in both the Shannon Estuary and Brandon Bay. Any subsequent MR modelling approach of survival should include these covariates, especially given the higher sensitivity to changes in female compared to male survival (Blázquez et al., 2020).
This study demonstrates the importance of long-term studies to determine important life-history parameters. It also demonstrates the impact of multiple platforms, researchers and variable resources, all of which can have a potential negative impact on data quality. While it is inevitable that long-term monitoring programmes maintained over many decades will be affected by these factors, they greatly aid the determination of critical parameters such as survival and emigration, thereby making a significant contribution to conservation management plans.
Data Availability Statement
The raw data supporting the conclusions of this article will be made available by the authors, without undue reservation.
Ethics Statement
Ethical review and approval was not required for the animal study because non-invasive monitoring using photo-id and no handling involved.
Author Contributions
KL organised and evaluated data for this study, designed and carried out the analysis, and wrote the first draft of the manuscript. MD and SL carried out fieldwork and established and curated photo-ID databases. SL digitised early photo-ID images. SB revised and edited the manuscript, oversaw and carried out fieldwork, and curated the photo-ID catalogue in the early phase of the project. All authors contributed to the article and approved the submitted version.
Conflict of Interest
The authors declare that the research was conducted in the absence of any commercial or financial relationships that could be construed as a potential conflict of interest.
Acknowledgments
We would like to thank Gerald and Geraldine Griffin of Scattery Island Ferries, Geoff and Sue Magee of Dolphinwatch Carrigaholt for providing platforms for photo-ID and John Quinlivan of Shannon Development for chairing the Shannon Dolphin and Wildlife Foundation in the early years. Data collection carried out by researchers and volunteers that have been with the organisation over time, and we therefore want to thank Sarah Ferriss, Lisa Groth, Sheila Downes, Joanne O’Brien, Andrew Young, Conor Ryan, Randall Counihan, Janelle Atkinson, Przemek Zielinski, Aoife Foley, Paddy O’Dwyer, Sarah Blennerhassett, Enda McKeogh, Isabel and John Baker, Clowie Russell, Bekka Treacy, Mick Marrinan, Stephanie Levesque, Kerstin Voight, Florence Erbs, Chantelle Barry, Stefanie Rowland, Katherina Reusch, Mark Hosford, Victoria Odynsky, Gary Robinson, Lonneke Ijsseldijk, Meadhbh Quinn, Jamie Nicol, Andrew Shine, Elisa Keeling-Hemphill, Joel Vikberg Wernstrom, Stephanie Linehan, Emer Keaveney, Gary Kett, Jamie Phillips, Mags Daly, Claire Kelly, Claudia Pich, Séan O’Callaghan, Chris Sharples, Luana Jungmann, and Karen Van Dorp for their efforts. With regards to mark-recapture modelling, we want to thank Prof. Dr. Philip Hammond from the Sea Mammal Research Unit at the University of St. Andrews (Scotland), for providing suggestions on how to address differentiated capture availabilities in relation to potential emigration. A more extended version of this manuscript has been presented to an examination board of the International Master of Science in Marine Biological Resources (IMBRSea) as a master thesis. It will shortly be published online in a list of thesis projects on the programme’s website (imbrsea.eu).
Supplementary Material
The Supplementary Material for this article can be found online at: https://www.frontiersin.org/articles/10.3389/fmars.2021.611219/full#supplementary-material
References
Arso Civil, M., Cheney, B., Quick, N. J., Islas-Villanueva, V., Graves, J. A., Janik, V. M., et al. (2019). Variations in age- and sex-specific survival rates help explain population trend in a discrete marine mammal population. Ecol. Evol. 9, 533–544. doi: 10.1002/ece3.4772
Auger-Méthé, M., Marcoux, M., and Whitehead, H. (2010). Nicks and notches of the dorsal ridge: promising mark types for the photo-identification of narwhals. Mar. Mamm. Sci. 26, 663–678.
Auguie, B. (2019). egg: Extensions for “ggplot2”: Custom Geom, Custom Themes, Plot Alignment, Labelled Panels, Symmetric Scales, and Fixed Panel Size. Available online at: https://cran.r-project.org/package=egg [accessed April 27, 2020].
Baker, I. (2015). Researcher’s Guide to Protocols for Fieldwork and Data Entry. Kilrush, Co: Shannon Dolphin and Wildlife Foundation.
Baker, I. (2017). Life History, Behaviour and Social Structure of Bottlenose Dolphins (Tursiops truncatus) in the Shannon Estuary, Ireland. PhD dissertation, Galway-Mayo Institute of Technology, Ireland
Baker, I., O’Brien, J., McHugh, K., and Berrow, S. (2018a). Female reproductive parameters and population demographics of bottlenose dolphins (Tursiops truncatus) in the Shannon Estuary, Ireland. Mar. Biol. 165:15.
Baker, I., O’Brien, J., McHugh, K., and Berrow, S. (2020). Fine-scale sociality reveals female–male affiliations and absence of male alliances in bottlenose dolphins (Tursiops truncatus) in the Shannon Estuary, Ireland. Mar. Mamm. Sci. 36, 66–88. doi: 10.1111/mms.12631
Baker, I., O’Brien, J., McHugh, K., Ingram, S., and Berrow, S. (2018b). Bottlenose dolphin (Tursiops truncatus) social structure in the Shannon Estuary, Ireland, is distinguished by age- and area-related associations. Mar. Mamm. Sci. 34, 458–487. doi: 10.1111/mms.12462
Barker, J., and Berrow, S. (2016). Temporal and spatial variation in group size of bottlenose dolphins (Tursiops truncatus) in the Shannon Estuary, Ireland. Biol. Environ. 116, 63–70. doi: 10.3318/bioe.2016.5
Berrow, S. D. (2009). Winter distribution of Bottle-nosed Dolphins (Tursiops truncatus (Montagu)) in the inner Shannon Estuary. Ir. Nat. J. 30, 35–39.
Berrow, S. D., and Holmes, B. (1999). Tour boats and dolphins: a note on quantifying the activities of whalewatching boats in the Shannon estuary, Ireland. J. Cetacean Res. Manag. 1, 199–204.
Berrow, S. D., Holmes, B., and Kiely, O. R. (1996). Distribution and abundance of bottle-nosed Dolphins Tursiops truncatus (Montagu) in the Shannon Estuary. Biol. Environ. 96B, 1–9.
Berrow, S., and Ryan, C. (2009). Shannon Dolphin Tour Boat Monitoring Report 2009. Kilrush, Co: Shannon Dolphin and Wildlife Foundation.
Berrow, S., O’Brien, J., Groth, L., Foley, A., and Voigt, K. (2012). Abundance estimate of bottlenose dolphins (Tursiops truncatus) in the lower river shannon candidate special area of conservation, Ireland. Aquat. Mamm. 38, 136–144. doi: 10.1578/am.38.2.2012.136
Bertulli, C. G., Guéry, L., McGinty, N., Suzuki, A., Brannan, N., Marques, T., et al. (2018). Capture-recapture abundance and survival estimates of three cetacean species in Icelandic coastal waters using trained scientist-volunteers. J. Sea Res. 131, 22–31. doi: 10.1016/j.seares.2017.10.001
Blázquez, M., Baker, I., O’Brien, J., and Berrow, S. D. (2020). Population viability analysis and comparison of two monitoring strategies for bottlenose dolphins (Tursiops truncatus) in the Shannon Estuary, Ireland, to inform management. Aquat. Mamm. 46, 307–325. doi: 10.1578/am.46.3.2020.307
Burnham, K. P., and Anderson, D. R. (2002a). “Evidence ratios,” in Model Selection and Multimodel Inference - a Practical Information-Theoretic Approach, 2nd Edn, eds K. P. Burnham and D. R. Anderson (New York, NY: Springer), 77–79.
Burnham, K. P., and Anderson, D. R. (2002b). “Formal inference from more than one model: multimodel inference (MMI),” in Model Selection and Multimodel Inference - a Practical Information-Theoretic Approach, 2nd Edn, eds K. P. Burnham and D. R. Anderson (New York, NY: Springer), 149–205. doi: 10.1007/978-0-387-22456-5_4
Choquet, R., Lebreton, J.-D., Gimenez, O., Reboulet, A. M., and Pradel, R. (2009). U-CARE: utilities for performing goodness of fit tests and manipulating CApture-REcapture data. Ecography 32, 1071–1074. doi: 10.1111/j.1600-0587.2009.05968.x
Cooch, E. G., and White, G. C. (2019a). “Chapter 1: first steps,” in Program MARK - A Gentle Introduction, 19th Edn, eds E. G. Cooch and G. C. White (Fort Collins: Colorado State University), 18–40.
Cooch, E. G., and White, G. C. (2019b). “Chapter 4: building & comparing models,” in Program MARK - a Gentle Introduction, 19th Edn, eds E. G. Cooch and G. C. White (Fort Collins: Colorado State University), 83–164.
Cooch, E. G., and White, G. C. (2019c). “Chapter 5: goodness-of-fit testing,” in Program MARK - a Gentle Introduction, 19th Edn, eds E. G. Cooch and G. C. White (Fort Collins: Colorado State University), 165–204.
R Core Team (2019). R: a Language and Environment for Statistical Computing. Vienna: R Foundation for Statistical Computing.
Corkrey, R., Brooks, S., Lusseau, D., Parsons, K., Durban, J. W., Hammond, P. S., et al. (2008). A bayesian capture-recapture population model with simultaneous estimation of heterogeneity. J. Am. Stat. Assoc. 103, 948–960. doi: 10.1198/016214507000001256
Cormack, R. M. (1964). Estimates of survival from the sighting of marked animals. Biometrika 51, 429–438. doi: 10.2307/2334149
Currey, R. J. C., Dawson, S. M., Slooten, E., Schneider, K., Lusseau, D., Boisseau, O. J., et al. (2009). Survival rates for a declining population of bottlenose dolphins in Doubtful Sound, New Zealand: an information theoretic approach to assessing the role of human impacts. Aquat. Conserv. 19, 658–670. doi: 10.1002/aqc.1015
de Vries, A., and Ripley, B. D. (2016). Ggdendro: Create Dendrograms and Tree Diagrams Using “ggplot2”. Available online at: https://cran.r-project.org/package=ggdendro [accessed April 17, 2020].
Englund, A., Ingram, S., and Rogan, E. (2007). Population Status Report for Bottlenose Dolphins using the Lower River Shannon SAC, 2006 – 2007. Final report to the national parks and wildlife service. Cork: University College Cork, 35.
Englund, A., Ingram, S., and Rogan, E. (2008). An Updated Population Status Report for Bottlenose Dolphins Using the Lower River Shannon SAC in 2008. Final report to the national parks and wildlife service. Cork: University College Cork, 36.
European Council (1992). Council directive 92/43/EEC of 21 May 1992 on the conservation of natural habitats and of wild fauna and flora. OJEC L 35, 7–50.
Evans, P. G. H., and Hammond, P. S. (2004). Monitoring cetaceans in European waters. Mamm. Rev. 34, 131–156. doi: 10.1046/j.0305-1838.2003.00027.x
Fahy, E., and Carroll, J. (2009). Vulnerability of male spider crab Maja brachydactyla (Brachyura: Majidae) to a pot fishery in south-west Ireland. J. Mar. Biol. Assoc. U.K. 89, 1353–1366. doi: 10.1017/s0025315409000083
Fletcher, D., Lebreton, J.-D., Marescot, L., Schaub, M., Gimenez, O., Dawson, S., et al. (2012). Bias in estimation of adult survival and asymptotic population growth rate caused by undetected capture heterogeneity. Methods Ecol. Evol. 3, 206–216. doi: 10.1111/j.2041-210x.2011.00137.x
Foley, A., McGrath, D., Berrow, S. D., and Gerritsen, H. (2010). Social structure within the bottlenose dolphin (Tursiops truncatus) population in the shannon Estuary, Ireland. Aquat. Mamm. 36, 372–381. doi: 10.1578/am.36.4.2010.372
Galili, T. (2015). dendextend: an R package for visualizing, adjusting, and comparing trees of hierarchical clustering. Bioinformatics 31, 3718–3720. doi: 10.1093/bioinformatics/btv428
Gibson, Q. A., and Mann, J. (2008). Early social development in wild bottlenose dolphins: sex differences, individual variation and maternal influence. Anim. Behav. 76, 375–387. doi: 10.1016/j.anbehav.2008.01.021
Gimenez, O., Cam, E., and Gaillard, J. M. (2018a). Individual heterogeneity and capture–recapture models: what, why and how? Oikos 127, 664–686. doi: 10.1111/oik.04532
Gimenez, O., Lebreton, J.-D., Choquet, R., and Pradel, R. (2018b). R2ucare: an r package to perform goodness-of-fit tests for capture–recapture models. Methods Ecol. Evol. 9, 1749–1754. doi: 10.1111/2041-210x.13014
Gowans, S., and Whitehead, H. (2001). Photographic identification of northern bottlenose whales (Hyperoodon ampullatus): sources of heterogeneity from natural marks. Mar. Mamm. Sci. 17, 76–93. doi: 10.1111/j.1748-7692.2001.tb00981.x
Hammond, P. S., Mizroch, S. A., and Donovan, G. P. (1990). Individual Recognition of Cetaceans: Use of Photo-Identification and Other Techniques to Estimate Population Parameters. Report of the International Whaling Commission, Special Issue 12. Cambridge, UK: International Whaling Commission.
Hastie, G. D., Wilson, B., Wilson, L. J., Parsons, K. M., and Thompson, P. M. (2004). Functional mechanisms underlying cetacean distribution patterns: hotspots for bottlenose dolphins are linked to foraging. Mar. Biol. 144, 397–403. doi: 10.1007/s00227-003-1195-4
Hernandez-Milian, G., Berrow, S., Begoña Santos, M., Reid, D., and Rogan, E. (2015). Insights into the trophic ecology of bottlenose dolphins (Tursiops truncatus) in Irish waters. Aquat. Mamm. 41, 226–239. doi: 10.1578/am.41.2.2015.226
Hupman, K., Stockin, K. A., Pollock, K., Pawley, M. D. M., Dwyer, S. L., Lea, C., et al. (2018). Challenges of implementing mark-recapture studies on poorly marked gregarious delphinids. PLoS One 13:e0203356. doi: 10.1371/journal.pone.0203356
Hwang, W.-H., and Chao, A. (1995). Quantifying the effects of unequal catchabilities on jolly-seber estimators via sample coverage. Biometrics 51, 128–141. doi: 10.2307/2533320
Ingram, S. N. (2000). The Ecology and Conservation of Bottlenose Dolphins in the Shannon Estuary, Ireland. PhD dissertation, University College Cork, Cork, Co.
Ingram, S. N., and Rogan, E. (2002). Identifying critical areas and habitat preferences of bottlenose dolphins Tursiops truncatus. Mar. Ecol. Prog. Ser. 244, 247–255. doi: 10.3354/meps244247
Jolly, G. M. (1965). Explicit estimates from capture-recapture data with both death and immigration- stochastic model. Biometrika 52, 225–247. doi: 10.2307/2333826
Kendall, W. L., Nichols, J. D., and Hines, J. E. (1997). Estimating temporary emigration using capture-recapture data with Pollock’s robust design. Ecology 78, 563–578. doi: 10.1890/0012-9658(1997)078[0563:eteucr]2.0.co;2
Laake, J. L. (2013). RMark: an R Interface for Analysis of Capture-Recapture Data with MARK. AFSC Processed Report 2013-01. Washington, DC: NOAA.
Laake, J., and Rexstad, E. (2019). ““RMark - an alternative approach to building linear models in MARK,”,” in Program MARK - a Gentle Introduction, 19th Edn, eds E. G. Cooch and G. C. White (Fort Collins: Colorado State University), 952–1062.
Langtimm, C. A. (2009). “Non-random temporary emigration and the robust design: conditions for bias at the end of a time series,” in Modeling Demographic Processes in Marked Populations, Vol. 3, eds D. L. Thompson, E. G. Cooch, and M. J. Conroy (Boston, MA: Springer), 745–761. doi: 10.1007/978-0-387-78151-8_34
Lebreton, J.-D., and Pradel, R. (2002). Multistate recapture models: modelling incomplete individual histories. J. Appl. Stat. 29, 353–369. doi: 10.1080/02664760120108638
Lebreton, J.-D., Burnham, K. P., Clobert, J., and Anderson, D. R. (1992). Modeling survival and testing biological hypotheses using marked animals: a unified approach with case studies. Ecol. Monogr. 62, 67–118. doi: 10.2307/2937171
Leeney, R. H., Berrow, S., McGrath, D., O’Brien, J., Cosgrove, R., and Godley, B. J. (2007). Effects of pingers on the behaviour of bottlenose dolphins. J. Mar. Biol. Assoc. U.K. 87, 129–133. doi: 10.1017/s0025315407054677
Levesque, S., Reusch, K., Baker, I., O’Brien, J., and Berrow, S. (2016). Photo-identification of bottlenose dolphins (Tursiops truncatus) in Tralee Bay and Brandon Bay, Co. Kerry: a case for SAC boundary extension. Biol. Environ. 116B, 109–118. doi: 10.3318/bioe.2016.11
Lindberg, M., and Rexstad, E. (2002). ““Capture-recapture sampling designs,”,” in Encyclopedia of Environmetrics, Vol. 1, eds A. H. El-Shaarawi and W. W. Piegorsch (Chichester: John Wiley & Sons), 251–262.
Lusseau, D., and Slooten, E. (2002). Cetacean sightings off the Fiordland coastline - Analysis of commercial marine mammal viewing data 1996-99. Sci. Conserv. 187, 5–42.
Mirimin, L., Miller, R., Dillane, E., Berrow, S., Ingram, S., Cross, T. F., et al. (2011). Fine-scale population genetic structuring of bottlenose dolphins in Irish coastal waters. Anim. Conserv. 14, 342–353. doi: 10.1111/j.1469-1795.2010.00432.x
Nicholson, K., Bejder, L., Allen, S. J., Krützen, M., and Pollock, K. H. (2012). Abundance, survival and temporary emigration of bottlenose dolphins (Tursiops sp.) off Useless Loop in the western gulf of Shark Bay, Western Australia. Mar. Freshw. Res. 63, 1059–1068. doi: 10.1071/mf12210
O’Brien, J., Baker, I., Barker, J., Berrow, S. D., Ryan, C., O’Connell, M., et al. (2014). The first confirmed successful refloat of a stranded bottlenose dolphin (Tursiops truncatus) in Ireland and Subsequent Resighting with a Neonate. Aquat. Mamm. 40, 191–194. doi: 10.1578/am.40.2.2014.191
O’Brien, J., Berrow, S., Ryan, C., Mcgrath, D., O’Connor, I., Pesante, G., et al. (2009). A note on long-distance matches of bottlenose dolphins (Tursiops truncatus) around the Irish coast using photo-identification. J. Cetacean Res. Manag. 11, 71–76.
Pace, R. M., Corkeron, P. J., and Kraus, S. D. (2017). State-space mark-recapture estimates reveal a recent decline in abundance of North Atlantic right whales. Ecol. Evol. 7, 8730–8741. doi: 10.1002/ece3.3406
Peñaloza, C. L., Kendall, W. L., and Langtimm, C. A. (2014). Reducing bias in survival under nonrandom temporary emigration. Ecol. Appl. 24, 1155–1166. doi: 10.1890/13-0558.1
Pledger, S., and Efford, M. (1998). Correction of bias due to heterogeneous capture probability in capture-recapture studies of open populations. Biometrics 54, 888–898. doi: 10.2307/2533843
Pollock, K. H. (1982). A capture-recapture design robust to unequal probability of capture. J. Wildl. Manag. 46, 752–757. doi: 10.2307/3808568
Pradel, R., Hines, J. E., Lebreton, J.-D., and Nichols, J. D. (1997). Capture-recapture survival models taking account of transients. Biometrics 53, 60–72. doi: 10.2307/2533097
Prévot-Julliard, A.-C., Lebreton, J.-D., and Pradel, R. (1998). Re-evaluation of adult survival of black-headed gulls (Larus ridibundus) in presence of recapture heterogeneity. Auk 115, 85–95. doi: 10.2307/4089114
Rogan, E., Garagouni, M., Nykänen, M., Whitaker, A., and Ingram, S. N. (2018). Bottlenose Dolphin Survey in the Lower River Shannon SAC, 2018. Report to the National Parks and Wildlife Service, Department of Culture, Heritage and the Gaeltacht. Cork, Co: University College Cork, 19.
Rogan, E., Ingram, S., Holmes, B., and O’Flanagan, C. (2000). A Survey of Bottlenose Dolphins (Tursiops truncatus) in the Shannon Estuary. Oranmore, Co: Marine Institute, 49.
Rogan, E., Nykänen, M., Garagouni, M., and Ingram, S. (2015). Bottlenose Dolphin Surveys in the Lower River Shannon SAC, 2015. Report to the National Parks and Wildlife Service, Department of Culture, Heritage and the Gaeltacht. Cork, Co: University College Cork.
Ryan, C., and Berrow, S. (2013). An extension to the known range of shannon estuary bottlenose dolphins (Tursiops truncatus (Montagu, 1821)). Ir. Nat. J. 32, 77–78.
Schleimer, A., Ramp, C., Delarue, J., Carpentier, A., Bérubé, M., Palsbøll, P. J., et al. (2019). Decline in abundance and apparent survival rates of fin whales (Balaenoptera physalus) in the northern Gulf of St. Lawrence. Ecol. Evol. 9, 4231–4244. doi: 10.1002/ece3.5055
Seber, G. A. F. (1965). A note on the multiple-recapture census. Biometrika 52, 249–259. doi: 10.1093/biomet/52.1-2.249
Silva, M. A., Magalhães, S., Prieto, R., Santos, R. S., and Hammond, P. S. (2009). Estimating survival and abundance in a bottlenose dolphin population taking into account transience and temporary emigration. Mar. Ecol. Prog. Ser. 392, 263–276. doi: 10.3354/meps08233
Soetaert, K. (2019). plot3D: Plotting Multi-Dimensional Data. Available online at: https://cran.r-project.org/web/packages/plot3D/plot3D.pdf [accessed April 17, 2020].
Speakman, T. R., Lane, S. M., Schwacke, L. H., Fair, P. A., and Zolman, E. S. (2010). Mark-recapture estimates of seasonal abundance and survivorship for bottlenose dolphins (Tursiops truncatus) near Charleston, South Carolina, USA. J. Cetacean Res. Manag. 11, 153–162.
Sprogis, K. R., Pollock, K. H., Raudino, H. C., Allen, S. J., Kopps, A. M., Manlik, O., et al. (2016). Sex-specific patterns in abundance, temporary emigration and survival of indo-pacific bottlenose dolphins (Tursiops aduncus) in Coastal and Estuarine Waters. Front. Mar. Sci. 3:12.
Stern, J. S., Dorsey, E. M., and Case, V. L. (1990). Photographic catchability of individually identified minke whales (Balaenoptera acutorostrata) of the San Juan Islands, Washington and the Monterey Bay Area, California. Rep. Int. Whal. Comm. Special Issue 12, 127–133.
Stolen, M. K., and Barlow, J. (2003). A model life table for bottlenose dolphins (Tursiops truncatus) from the Indian River Lagoon System, Florida, U.S.A. Mar. Mamm. Sci. 19, 630–649. doi: 10.1111/j.1748-7692.2003.tb01121.x
Urian, K., Gorgone, A., Read, A., Balmer, B., Wells, R. S., Berggren, P., et al. (2015). Recommendations for photo-identification methods used in capture-recapture models with cetaceans. Mar. Mamm. Sci. 31, 298–321. doi: 10.1111/mms.12141
Vialcho Miranda, C. (2017). Distribution and Abundance of the Coastal Population of Bottlenose Dolphins (Tursiops truncatus) in Ireland. MS thesis, Galway-Mayo Institute of Technology, Galway, Co
Wagenmakers, E. J., and Farrell, S. (2004). AIC model selection using Akaike weights. Psychon. Bull. Rev. 11, 192–196. doi: 10.3758/bf03206482
Wells, R. S., and Scott, M. D. (1990). Estimating bottlenose dolphin population parameters from individual identification and capture-release techniques. Rep. Int. Whal. Comm. Special Issue 12, 407–415.
Whitehead, H., and Wimmer, T. (2005). Heterogeneity and the mark-recapture assessment of the scotian shelf population of northern bottlenose whales (Hyperoodon ampullatus). Can. J. Fish. Aquat. Sci. 62, 2573–2585. doi: 10.1139/f05-178
Wilson, B., Hammond, P. S., and Thompson, P. M. (1999). Estimating size and assessing trends in a coastal bottlenose dolphin population. Ecol. Appl. 9, 288–300. doi: 10.1890/1051-0761(1999)009[0288:esaati]2.0.co;2
Wilson, B., Reid, R. J., Grellier, K., Thompson, P. M., and Hammond, P. S. (2004). Considering the temporal when managing the spatial: a population range expansion impacts protected areas-based management for bottlenose dolphins. Anim. Conserv. 7, 331–338. doi: 10.1017/s1367943004001581
Wilson, B., Thompson, P. M., and Hammond, P. S. (1997). Habitat use by bottlenose dolphins: seasonal distribution and stratified movement patterns in the moray firth. Scotland. J. Appl. Ecol. 34, 1365–1374. doi: 10.2307/2405254
Würsig, B., and Würsig, M. (1977). The photographic determination of group size, composition, and stability of coastal porpoises (Tursiops truncatus). Science 198, 755–756. doi: 10.1126/science.198.4318.755
Keywords: bottlenose dolphin (Tursiops truncatus), photo-identification, Cormack-Jolly-Seber models, survival rate, capture heterogeneity, non-random temporal migration, site fidelity
Citation: Ludwig KE, Daly M, Levesque S and Berrow SD (2021) Survival Rates and Capture Heterogeneity of Bottlenose Dolphins (Tursiops truncatus) in the Shannon Estuary, Ireland. Front. Mar. Sci. 8:611219. doi: 10.3389/fmars.2021.611219
Received: 28 September 2020; Accepted: 08 March 2021;
Published: 30 March 2021.
Edited by:
Mark Meekan, Australian Institute of Marine Science (AIMS), AustraliaReviewed by:
Vinay Udyawer, Australian Institute of Marine Science (AIMS), AustraliaDelphine Brigitte Hélène Chabanne, Murdoch University, Australia
Copyright © 2021 Ludwig, Daly, Levesque and Berrow. This is an open-access article distributed under the terms of the Creative Commons Attribution License (CC BY). The use, distribution or reproduction in other forums is permitted, provided the original author(s) and the copyright owner(s) are credited and that the original publication in this journal is cited, in accordance with accepted academic practice. No use, distribution or reproduction is permitted which does not comply with these terms.
*Correspondence: Kim E. Ludwig, kim.ludwig@thuenen.de; kimellen.ludwig@imbrsea.eu
†Present address: Kim E. Ludwig Thünen Institute for Sea Fisheries, Bremerhaven, Germany