Reconciling Behavioural, Bioenergetic, and Oceanographic Views of Bowhead Whale Predation on Overwintering Copepods at an Arctic Hotspot (Disko Bay, Greenland)
 Neil S. Banas1*
  Eva Friis Møller2
  Kristin L. Laidre3
  Malene Simon4
  Ingrid H. Ellingsen5
  Torkel Gissel Nielsen6
- 1Department of Mathematics and Statistics, University of Strathclyde, Glasgow, United Kingdom
- 2Arctic Research Center, Department of Bioscience, Aarhus University, Roskilde, Denmark
- 3Polar Science Center, Applied Physics Laboratory, University of Washington, Seattle, WA, United States
- 4Greenland Climate Research Centre, Greenland Institute of Natural Resources, Nuuk, Greenland
- 5SINTEF Ocean, Trondheim, Norway
- 6National Institute of Aquatic Resources, Technical University of Denmark, Lyngby, Denmark
Bowhead whales (Balaena mysticetus) visit Disko Bay, West Greenland in winter and early spring to feed on Calanus spp., at a time of year when the copepods are still mostly in diapause and concentrated in near-bottom patches. Combining past observations of copepod abundance and distribution with detailed observations of bowhead whale foraging behaviour from telemetry suggests that if the whales target the highest-density patches, they likely consume 26–75% of the Calanus standing stock annually. A parallel bioenergetic calculation further suggests that the whales' patch selection must be close to optimally efficient at finding hotspots of high density copepods near the sea floor in order for foraging in Disko Bay to be a net energetic gain. Annual Calanus consumption by bowhead whales is similar to median estimates of consumption by each of three zooplankton taxa (jellies, chaetognaths, and predatory copepods), and much greater than the median estimate of consumption by fish larvae, as derived from seasonal abundance and specific ingestion rates from the literature. The copepods' self-concentration during diapause, far from providing a refuge from predation, is the behaviour that makes this strong trophic link possible. Because the grazing impact of the whales comes 6–10 months later than the annual peak in primary production, and because Disko Bay sits at the end of rapid advective pathways (here delineated by a simple numerical particle-tracking experiment), it is likely that these Calanus populations act in part as a long-distance energetic bridge between the whales and primary production hundreds or thousands of km away.
1. Introduction
Calanus spp. and other calanoid copepods are a crucial link in mid- and high-latitude marine food webs, often dominating the biomass of primary consumers that transfer primary production to predators like fish, seabirds, and marine mammals (Falk-Petersen et al., 2007; Aarflot et al., 2017; Kimmel et al., 2017; Møller and Nielsen, 2020). These copepods might be thought of as the smallest members of the “wasp waist” (Hunt and McKinnell, 2006), the commonly observed trophic bottleneck at which the individual and population biology of a handful of species comes to have ecosystem-level consequences. Large-scale syntheses have suggested that the Arctic as a whole is a net sink for Calanus (Wassmann et al., 2015) and have begun to quantify the energy and carbon flux associated with the advective flux of Calanus spp. through the Arctic gateways (Basedow et al., 2018; Wassmann et al., 2019); but it is difficult to focus this general or bulk-biomass understanding down to the specifics of predation in particular hotspots. Calanus spp. have many predators, both they and their predators have patchy distributions and complex patterns of behaviour and selectivity, and it is possible that there is no system where the data exist to properly, empirically close the Calanus carbon budget.
Often this problem is dealt with using inverse food web models or other mass-balance approaches (Vézina and Platt, 1988; Aydin et al., 2002; Heath, 2012), which by definition harmonise incomplete and mismatched information into a smooth, best-guess picture. It is difficult, however, to make room in these approaches for the biology of particular predator species, or for that matter the biology of the prey. In this Brief Report we describe an alternate approach, intended to clarify the questions raised by past observations of a distinctive, particularly short Arctic food chain, from phytoplankton to copepods to bowhead whales, the largest Arctic marine mammal (Laidre et al., 2007; Simon et al., 2009; Moore, 2016).
After almost a century of absence, bowhead whales started to reappear in Disko Bay around 2000, and increased through the mid to late 2000s (Reeves and Heide Jørgensen, 1996; Heide-Jørgensen et al., 2007; Rekdal et al., 2014). These whales are part of the Eastern Canada-West Greenland stock that migrates in concert with annual sea-ice formation and break-up in the Canadian Arctic and along the west coast of Greenland (Eschricht and Reinhardt, 1861; Ferguson et al., 2010). Telemetry from 39 whales tagged in Disko Bay shows that these whales have high plasticity in their use of foraging areas in Baffin Bay and surrounding waters (Nielsen et al., 2015), but Disko Bay stands out in these behavioural data as a particular focus of foraging activity. In Disko Bay, they are typically found southwest of Disko Island (Eschricht and Reinhardt, 1861), an area thought to be a mating ground, based upon acoustic studies of singing whales (Stafford et al., 2008; Tervo et al., 2009), and the fact that few subadult whales or calves are observed there (Heide-Jørgensen et al., 2007, 2010).
The aggregation of bowhead whales in Disko Bay takes place earlier in the annual cycle than the appearance of capelin and other mobile predators that come to Disko Bay to feed on active Calanus in the surface layer. Studies of the whales' feeding behaviour have shown that mean dive depths are 50–100 m but also reach depths of >400 m. Most dives in winter and early spring target the bottom of the bay, with dive durations up to 40 min or even longer (Laidre et al., 2007). These patterns, along with analysis of stomach contents (Norden Andersen et al., 2014), support the idea that the whales are foraging on copepods that are still in diapause and aggregated at the bottom (Simon et al., 2009). Acoustic surveys (Laidre et al., 2007; Heide-Jørgensen et al., 2013) have shown that this copepod biomass is concentrated in a very dense near-bottom layer, and that whale dives matched the depth of this layer. The Disko Bay copepod community is dominated, in biomass terms, by three congeners, C. finmarchicus, C. glacialis, and C. hyperboreus (Swalethorp et al., 2011). Late spring sampling for Calanus in 13 years between 1992 and 2018 (Møller and Nielsen, 2020) has shown that the biomass of C. finmarchicus is correlated with the fraction of Atlantic water in deep Disko Bay, and accordingly is trending upward. The spring biomass of C. glacialis and C. hyperboreus, meanwhile, is correlated with ice cover, a relationship which might reflect either local growth conditions or variability in the intrusion of cold Baffin Bay water.
In this study, we synthesise the existing patchwork of observations (copepod and planktivore abundance patterns; bowhead whale foraging behaviour; bioenergetic parameters) and a simple numerical model experiment to address a pair of questions: first, what role does bowhead whale foraging on dormant Calanus have in the ecology of these copepod populations, compared with the role of their classical predators (macrozooplankton and fish larvae)? Second, what role does it play in the annual routine of the whales? These are as much questions of spatiotemporal scale as of energy or carbon budgets.
2. Methods
2.1. Bowhead Whale Foraging Calculations
The magnitude of annual bowhead whale predation on copepods in Disko Bay was estimated by two semi-independent calculations, the first based on information in the literature about whale diving and foraging behaviour from telemetry, the second based on bioenergetics, following Laidre et al. (2007). Quantities used in these calculations are summarised in Table 1.
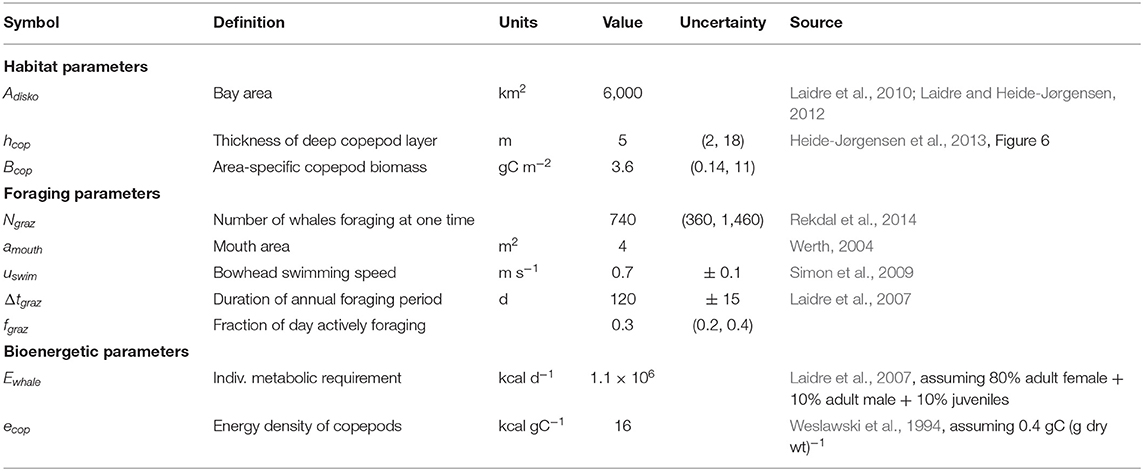
Table 1. Quantities used in estimation of bowhead whale foraging on copepods. Uncertainty is reported either as ± standard deviation or as (5th, 95th percentiles).
The annual clearance capacity of the bowhead whale population (in m3 of prey per year) can be written as
The number of whales foraging in Disko Bay at any one time, Ngraz, was taken from a snapshot aerial-survey estimate by Rekdal et al. (2014): 740 whales, 95% CI = 360–1,460. The foraging season was estimated as Feb–May (a duration Δtgraz = 120 d), although whales may arrive up to 2 weeks earlier or depart up to 2 weeks later in any given year (Laidre and Heide-Jørgensen, 2012). The fraction of time that an individual whale spends actively feeding during that period was estimated, based on visual observation of whales in the field, to be between 5 and 10 h per day (fgraz = 0.3 ± 0.1). Whale kinematics during foraging dives were described in detail by Simon et al. (2009) using data from digital tags with three-axis accelerometers. Based on these observations, we assume that at the bottom of a U-shaped foraging dive, whale swimming speed uswim is 0.7 m s−1, corresponding to a filtration rate of 2.8 m3 s−1 whale−1 for a mouth area of 4 m2 (Werth, 2004).
The grazing rate G (in gC of prey per year) corresponding to the clearance rate C can be written
where hcop is the thickness of the deep layer of overwintering copepods, and is the areal prey density (gC m−2) in the patches where bowhead whales feed. is presumably greater than or equal to Bcop, the bay-wide average. The fraction of bay-total standing stock (AdiskoBcop) consumed by the whale population in each foraging season is then
where Adisko is the area of the bay. Subscripts on F below denote particular estimates under contrasting sets of assumptions, whereas F by itself denotes the true value.
We estimated hcop by digitising Figure 6 in Heide-Jørgensen et al. (2013), which gives detailed echosounder data from a survey on 6 May 2009 (evenly spaced image measurements, n = 43, ± 4dB from peak backscatter, digitisation error < 1%). The area-specific copepod biomass Bcop was estimated from data on Calanus spp. biomass in the upper 250 m of an approximately 300 m water column from April and May 1997–2012 at 69° 14' N, 53° 23' W (n = 63; Møller and Nielsen, 2020). Samples in 2016–2018 spanning only the upper 100 m (Møller and Nielsen, 2020) were excluded, although we expect that most of the Calanus biomass is in the upper water column during these months (Madsen et al., 2001; Swalethorp et al., 2011). Møller and Nielsen (2020) found no long-term trend in Calanus biomass in Disko Bay (although the C. finmarchicus fraction has increased), and so the lack of recent years in the Bcop calculation is unlikely to be a major source of bias. Prosome length was measured for 10 individuals in each species/stage group, and the biomass was calculated using length:C-weight regressions from the literature (Hirche and Mumm, 1992; Madsen et al., 2001). These observations suggest an absolute density of animals within the near-bottom layer, in an order-of-magnitude sense, ~ 104 ind m−3 (calculated coarsely as Bcop / hcop / 300 μgC ind−1), consistent with a number of past studies that have also observed extremely dense near-bottom concentrations of copepods, up to 65,000 ind m−3(Hirche et al., 2016).
The ratio is a measure of the whales' patch selectivity in an areal sense, which we bracket with a pair of estimates that provide lower and upper bounds on F. A simple lower bound could be determined by setting , a scenario in which the whales choose foraging areas at random (while still optimising their position in the vertical):
This lower bound can be refined by dividing by a factor (1 − F) to account for the fact that the net samples from which we estimated Bcop were taken at the end of the whale foraging period:
A complementary upper bound can be determined as the point at which equals the average over percentiles (1 − F) · 100–100% of copepod areal densities in our net-sample data, i.e., a scenario in which the whales choose the highest-density patches available (assuming that areal variance in copepod density is comparable to the temporal variance across our 63 samples at one station over multiple years). is awkward to write algebraically but straightforward to calculate numerically.
Finally, F can also be estimated via bioenergetic considerations. An alternate lower bound is the break-even point at which the total energy content of ingested prey, G ecop, balances the metabolic costs of the foraging population during the foraging period:
(see Table 1). This criterion is equivalent to
Median estimates and confidence limits on these calculations were determined by a Monte Carlo procedure (n = 100,000) in which the six key parameters were represented as distributions (Table 1). Bootstrap statistics were used for hcop and Bcop (i.e., resampling with replacement of individual observations, n = 43 and n = 63, respectively); a lognormal distribution was assumed for Ngraz; and normal distributions were used for uswim Δtgraz, and fgraz. This approach to uncertainty is a compromise between simply writing out the arithmetic in the equations above on the back of an envelope, and giving up entirely on quantifying this trophic link because of data limitations.
2.2. Foraging by Other Predators
For comparison, potential consumption of copepods by four other taxa was estimated using abundance estimates from monthly sampling during 1996–97 and weekly to bi-weekly sampling April–June 2008 (Swalethorp et al., 2011). Sampling in 1996–97 was carried out with a WP-2 net (200 μm mesh size) or with a submersible pump (3,000 l min−1) equipped with a conical net (50 μm mesh size). Additional hauls were conducted with a Hensen net (50 μm mesh size) in order to sample nauplii. All sampling devices were equipped with a flowmeter (Madsen et al., 2001). Sampling in 2008 was with a 50 μm Hydrobios Multinet. Associated length measurements were converted to individual biomass using literature relationships (fish larvae, Froese, 2006; the jelly Aglantha digitale, Matthews and Hestad, 1977; the chaetognath Sagitta elegans, Conway and Robins, 1991; the predatory copepod Paraeuchaeta spp., Tönnesson et al., 2006). Amphipods and krill, other potential predators, are not included in this analysis because the sampling net used does not reliably collect the large individuals that prey on Calanus spp.
Individual biomass was used to estimate total daily ingestion capacity per predator taxon using allometric relationships at 0°C from Kiørboe and Hirst (2014). For simplicity, these were not corrected for temperature. Abundance measurements and the corresponding ingestion estimates were categorised into three seasons—“winter” (November to mid-April, 165 d), “bloom” (mid-April to end of May, 45 d), and “summer/autumn” (June to October, 155 d)—in order to scale up, coarsely, to an estimate of annual copepod consumption per predator type (Table 2). Estimates of annual consumption were determined by a Monte Carlo procedure, using bootstrapping for abundance and assuming normal distributions for the mean and intercept of log individual ingestion rates (Table 1 in Kiørboe and Hirst, 2014). These are necessarily high per-taxon estimates, since they assume prey-saturated ingestion 24 h per day.
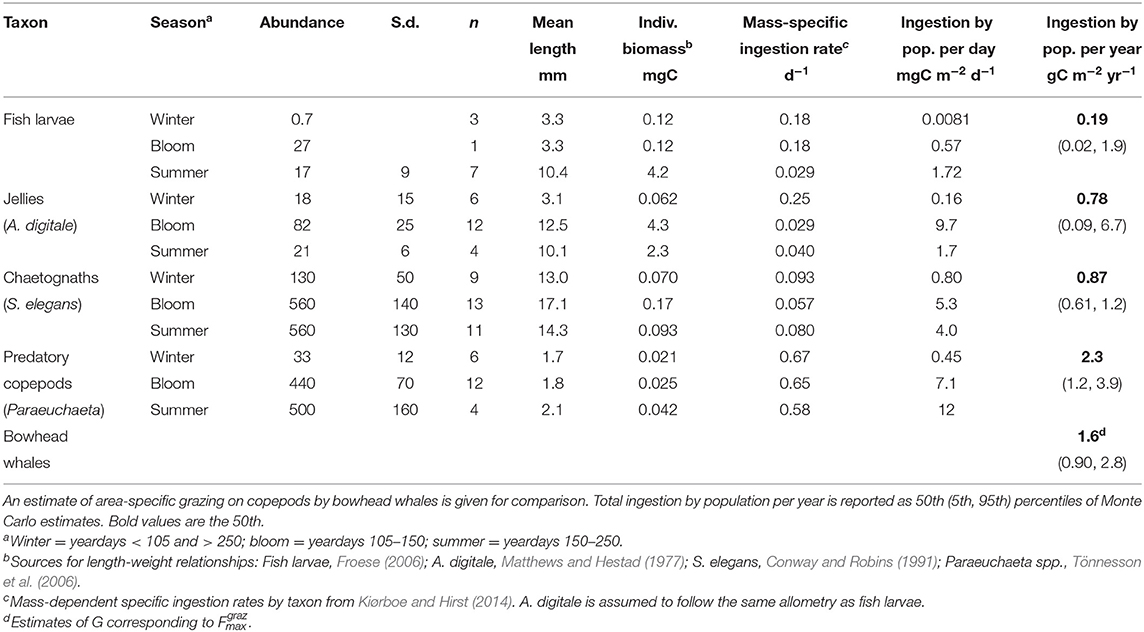
Table 2. Measurements of abundance and individual size, and estimates of individual biomass and ingestion capacity for four taxa of predators on copepods.
2.3. Large-Scale Transport and Connectivity
Parallel to these energetic calculations, we used a simple numerical particle-tracking experiment to estimate the potential area of ocean from which the copepods ingested by bowhead whales in Disko Bay might be derived. Virtual particles were tracked in a 10-year hindcast (2008–2017) of the pan-Arctic SINMOD model run at 20 km horizontal resolution (Slagstad et al., 2015; Armstrong et al., 2019). Particles were tracked from 1 Apr of each year until 1 Apr of the next, using 0–150 m average currents to mimic shelf-depth transport during the copepods' likely active period (1 Apr–30 Sep), followed by slope-depth currents (150–500 m) during the likely diapause period (1 Oct–1 Apr). In reality, copepod behaviour interacts with velocity shear in ways we have not attempted to model here (although a sensitivity experiment suggests that this interaction has only a secondary effect on the scale of transport in this robust boundary-current system). Likewise the physical dynamics of the entrance sill itself are beyond the reach of available circulation models.
3. Results
The lower bound on bowhead whale ingestion was estimated to fall between 0.08 and 0.39 (95% c.l.s), with a median value of 0.17, and the corresponding upper bound was found to fall between 0.26 and 0.75, with a median estimate of 0.44 (Figure 2). The ratio of these median estimates is 2.6, implying that despite the huge observed variance in copepod biomass, lateral patch selectivity can at most increase the whales' prey intake by less than a factor of three (In contrast, vertical selectivity, foraging within the deep overwintering layer, is crucial: if the whales' prey were spread over a layer 50 m thick instead of approximately 5 m, F and G would drop by factor of 10). corresponds to a median estimate of G, annual consumption of Calanus by bowhead whales in Disko Bay, of 1.6 gC m−2 yr−1 (c.l.s 0.90, 2.8).
The alternate lower bound derived from bioenergetic considerations, , is 0.28 (c.l.s 0.15, 0.54: Figure 2). This estimate is only slightly lower than , suggesting that patch selectivity by the whales is likely quite high, and in fact necessary if Disko Bay spring foraging is to provide a net benefit to them energetically. Of the three variants of the F estimation, is thus the most plausible biologically. A more involved estimation of F, based on the joint probability that a given value is greater than and and less than , gives very similar confidence limits.
To summarise, one can construct a consistent picture of predator and prey abundance patterns, foraging kinematics, and whale bioenergetics if the aggregation of whales in Disko Bay consumes 26–75% of the standing stock of copepods each winter/spring. This level of annual grazing is equivalent to 0.90–2.8 g C m−2 yr−1.
Estimates of grazing by other taxa (Table 2) are extremely variable, in part because of the sparsity of abundance observations relative to their natural patchiness, but even moreso because of uncertainty in lab-based estimates of specific ingestion rates (Kiørboe and Hirst, 2014). Our estimate of annualised bowhead whale grazing is comparable to the median estimates of consumption by jellies, chaetognaths, and predatory copepods, and an order of magnitude greater than the median estimate of consumption by fish larvae, although we cannot rank these consumption levels with any confidence. This comparison rather serves as a consistency check. As shown above, bowhead whale grazing appears to be a first-order process relative to copepod standing stock, and here we confirm that there is no reason to believe it is not first-order in comparison with other predators. Note again that the simple assumptions behind the zooplankton- and fish larvae estimates (no correction for prey selectivity, or vertical or temporal predator-prey overlap) almost certainly bias these estimates high.
Particle tracking (Figure 1) suggests the distances over which an advected Calanus community found in the vicinity of the Egedesminde Dyb entrance sill might have travelled in 12 months. The envelope of these trajectories encompasses northeastern Baffin Bay and the Greenland shelf and slope as far eastward as Fram Strait, as well as a portion of the Irminger Current in deeper waters southeast of Greenland: up to 3,700 km of transport. Note that in reality, smaller-scale circulation patterns and interactions between vertical migration and current shear might well reduce, or even increase, this net transport.
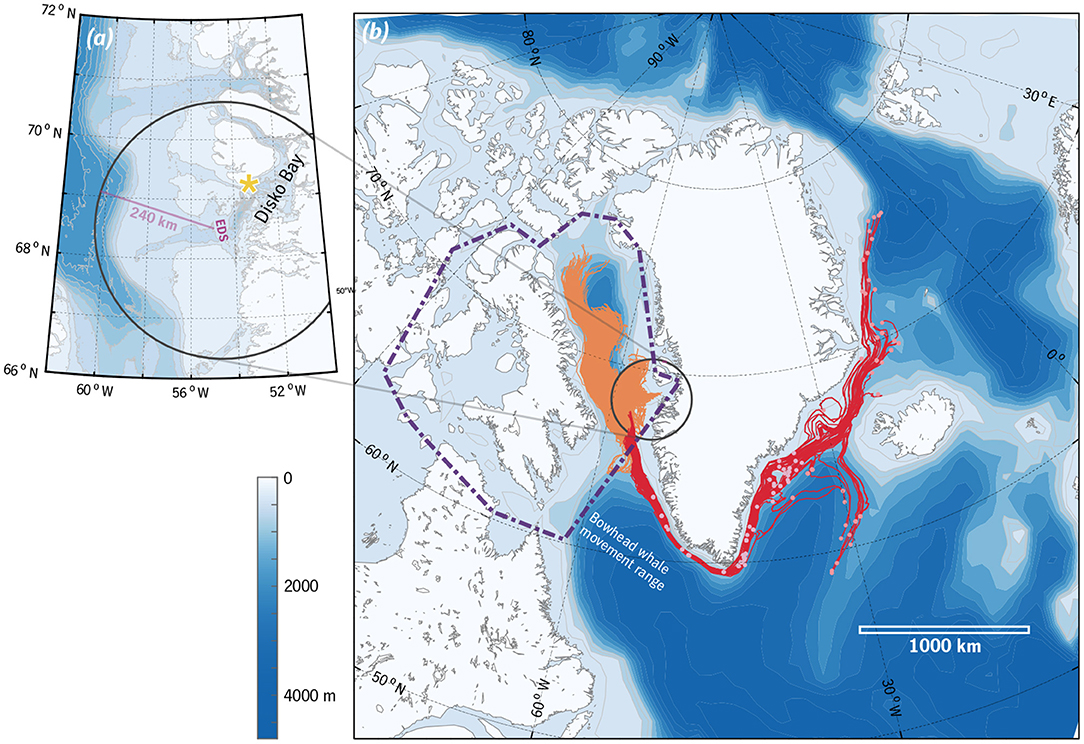
Figure 1. (a) Disko Bay and environs. The Egedesminde Dyb entrance sill is marked (“EDS”), along with the zooplankton sampling location (yellow star; section 2.1) and a range ring of radius 240 km. (b) Modelled particle trajectories that end within the range ring after 1 year of transport, 1 Apr–1 Apr (see section 2). Trajectories that originate east of 45°W are shown in red with starting locations marked, while trajectories that originate west of 45°W are in orange (starting locations omitted for clarity). The approximate area over which Nielsen et al. (2015) observed movements of 39 bowhead whales tagged in Disko Bay is also marked (purple dot-dashed line).
4. Discussion
4.1. Implications for the Bowhead Whale Population
Comparison of two independent estimates of bowhead whale grazing ( vs. , Figure 2) indicates that bowhead whales must be extremely efficient at finding hotspots of high density copepods near the sea floor in order for foraging in Disko Bay to be a net energetic gain. They must target the right depths and at the same time be in the right areal patches in order to be effective. It is unknown how bowhead whales locate the hot spots of high-density prey. There may be some local memory involved, bathymetric features that signal good areas for foraging, or potentially, as has been suggested for other species, visual cues (Cronin et al., 2017; Fasick et al., 2017). Bowhead whales likely rely on their extreme blubber layer, the largest of any marine mammal, as a buffer against the extreme patchiness and episodic accessibility of their prey, allowing them to go for long periods without foraging. At the same time, the provisional calculations above indicate that there is not an unlimited amount of copepods in Disko Bay for a growing bowhead aggregation, which may thus be prey-limited. The whales already consume a first-order fraction of what is available, using near-optimal patch selection in both the horizontal and the vertical. Accordingly, it is likely that any future substantial increases in the size of this population of whales or the density of animals foraging in West Greenland in spring would require the whales to expand to other foraging grounds.
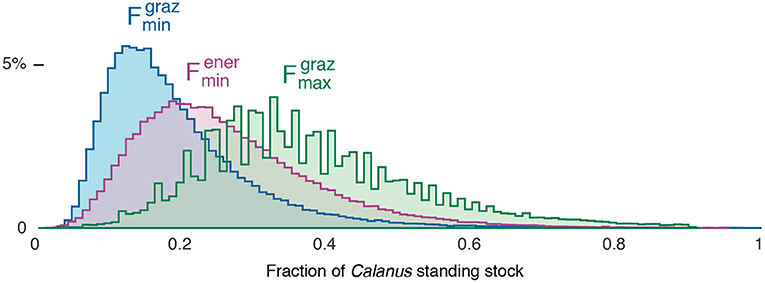
Figure 2. Distribution of estimates of F, the fraction of Calanus standing stock in Disko Bay grazed by bowhead whales annually. Three calculations are represented: , in which whales are assumed to choose prey patches optimally in the vertical but randomly in an areal sense; , in which the areal selection of prey patches is also optimal; and , the break-even point at which foraging in Disko Bay is bioenergetically neutral. and are lower bounds and an upper bound on the true value of F.
4.2. Implications for Calanus Populations
If the “classical” view of marine food chains focuses on predatory zooplankton and fish larvae as consumers of Calanus, then the trophic link to bowhead whales fails to conform to the classical picture in at least two ways. Bowhead whales are big, violating the rules-of-thumb of predator-prey size ratios, and they graze on Calanus in Disko Bay not during but earlier in the year than the period of significant primary and secondary production. This raises the possibility that their ingestion of Calanus in Disko Bay is significantly decoupled from the production of Calanus in space and not merely in time.
C. finmarchicus in this region have a typical generation length of 1 year, C. hyperboreus in Disko Bay appear to have a 2-year cycle, and C. glacialis might follow either pattern (Madsen et al., 2001; Daase et al., 2013; Banas et al., 2016). If a cohort of C. finmarchicus grew in summer of 1 year and then were consumed by bowhead whales late the following winter, then the temporal separation between the phytoplankton–copepod and copepod–whale trophic links is 7–11 months. For a Calanus cohort with a multi-year life cycle, the temporal lag between growth on phytoplankton to consumption by bowhead whales might be a full year longer. The particle-tracking experiment shown in Figure 1 for illustrative purposes spans 12 months, a middle value among these life-cycle-dependent temporal lags.
Whatever fraction of the late-winter Calanus population has arrived via the annual winter overturning of the deep layer (Gladish et al., 2015) is likely to have travelled hundreds or thousands of km (Figure 1) during that lag. We do not know what fraction of the population this is, but given that subarctic C. finmarchicus have increased in concert with the Atlantification of Disko Bay's physical water properties over the past decades (Møller and Nielsen, 2020), there is no reason to think that it is small. There is no continuous path into the Disko Bay deep basins except across ~200 km of shallower habitat, and so whether one imagines the C. finmarchicus and C. hyperboreus found in the basins at the end of winter to have travelled throughout the winter at shelf depth, to have appeared recently from deep Baffin Bay, or to represent local production that avoided the winter flushing, one is faced with a transport puzzle, a behavioural puzzle, or both. Clarifying this picture will require well-coordinated biophysical observations and modelling; it is not simply a matter of improving circulation models.
Laidre et al. (2010) found extremely low correlation between local satellite-derived chlorophyll estimates and the location and timing of bowhead whale foraging in Disko Bay, and in light of the results above, this is not surprising: not merely because detecting correlations in a patchy, undersampled ocean is difficult, but because it seems likely that Disko Bay itself is only one of several regional seas in which one needs to look for the phytoplankton that feed Disko Bay's copepods and whales. If so, then Disko Bay joins a provocatively long list of case studies in which high-latitude bowhead and right whales have been found to forage on mesozooplankton prey advected from elsewhere (Rogachev et al., 2008; Ashjian et al., 2010; Walkusz et al., 2012; Boertmann et al., 2015; Brennan et al., 2018).
4.3. Is Diapause Maladaptive in Disko Bay?
Instead of analyzing this and similar situations in terms of advection of biomass and energy (the source–sink framework), it might be useful to analyze them in terms of advection of traits and strategies. A few trait-based model studies have considered balances between trait advection and local selection in phytoplankton (Clayton et al., 2013), but these frameworks have not been extended to long-lived mesozooplankton. In particular, it is not clear whether diapause, or remaining in diapause into Feb–Apr, can be said to provide any benefit to Calanus spp. in Disko Bay.
Diapause in copepods is usually explained in terms of three advantages that it confers: (i) reduction of energetic losses through partial metabolic shutdown, (ii) reduction of energetic losses through cold water temperature, and (iii) reduction of predation losses. Explanation (ii) does not apply in Disko Bay, because the influence of ice and the west Greenland current means that bottom water is not generally colder than surface water (Hansen et al., 2012; Gladish et al., 2015). Explanation (i) is more difficult to evaluate, but Swalethorp et al. (2011) found that all three species of Calanus in Disko Bay have ample storage lipids remaining at the end of winter (wax esters 35–70% of total body carbon in late March 2008). This suggests that these populations are well above the threshold of winter starvation, such that the timing of exit from diapause in spring has at most an indirect effect on their population viability. Finally, our results show that explanation (iii) fails to hold in Disko Bay: predation by whales during diapause is intense, and it is specifically the concentration of the copepods in a near-bottom layer that makes it possible.
It is likely, however, that the adaptive value of diapause is very different in Baffin Bay and along the larger-scale advective pathways to which Disko Bay connects. Bottom depth is one crucial factor: in the East Greenland Sea, for example, C. hyperboreus overwinters at 2300–2500 m (Hirche et al., 2006), far below the diving range of bowhead whales. C. glacialis is generally regarded as a shelf species, but C. finmarchicus and C. hyperboreus in Disko Bay can perhaps be thought of as trapped in a relatively shallow environment where the deep (> 500 m) winter habitat they are typically associated with is unavailable (Kvile et al., 2019).
5. Summary
To review, the most self-consistent picture we can construct, from many lines of fragmentary evidence, is that bowhead whales consume between 26–75% of the spring standing stock of Calanus in Disko Bay, despite this consumption taking place during copepod diapause, which is often assumed to be a predation refuge. This is also a time of year at which many of the Calanus being consumed are likely to have been recently advected into Disko Bay with the deep overturning circulation. These dynamics create the possibility of a strange symmetry in which a significant fraction of the whales' copepod prey arrive in Disko Bay at the same time that the whales arrive to eat them, having traversed similar distances over their annual routine (Figure 1b).
The information demands for fully tracing such long-distance energy flows are high, spanning multiple scales of physical oceanography as well as many trophic levels, from foraging behaviour and diet preferences to abundance patterns, transport speeds, and changes in lower-trophic production in advectively upstream regions. However, it may prove that relatively small, tenuous amounts of information on all these scales are enough to establish which species, processes, and ocean regions are leading elements of the story linking climate change to a particular predator population. Our calculations above illustrate the idea that triangulating among several independent, competing estimates of a trophic link (Figure 2) can yield a coherent picture even when it is impossible to properly close mass balances. In this case, the results highlight a need to expand our perspective on Calanus predation along the predator size spectrum and across the map.
Data Availability Statement
The data analyzed in this study is subject to the following licenses/restrictions: Our analysis consists of re-analysis and integration of observational and numerical data previously described in the peer-reviewed literature. Requests to access these datasets should be directed to Neil Banas, neil.banas@strath.ac.uk.
Author Contributions
NB, TN, and EM conceived the study, and together with KL and MS compiled data and performed the foraging calculations. NB and IE performed the circulation model analysis. All authors contributed to the interpretation of results and the writing of the manuscript.
Funding
This work was supported by grant PLR-1417365 from the US National Science Foundation to University of Washington and grant NE/P005985/1 from the UK Natural Environment Research Council to University of Strathclyde (the DIAPOD project, part of the Changing Arctic Ocean program). EM was also supported by The Danish Environmental Protection Agency (MST-422 113-00095).
Conflict of Interest
The authors declare that the research was conducted in the absence of any commercial or financial relationships that could be construed as a potential conflict of interest.
Acknowledgments
NB thanks Beth Curry, Ricardo González Gil, Fabian Große, and Euan McRae for helpful discussions and comments on the manuscript.
References
Aarflot, J. M., Skjoldal, H. R., Dalpadado, P., and Skern-Mauritzen, M. (2017). Contribution of Calanus species to the mesozooplankton biomass in the Barents Sea. ICES J. Mar. Sci. 75, 2342–2354. doi: 10.1093/icesjms/fsx221
Armstrong, C. W., Foley, N. S., Slagstad, D., Chierici, M., Ellingsen, I., and Reigstad, M. (2019). Valuing blue carbon changes in the Arctic ocean. Front. Mar. Sci. 6:331. doi: 10.3389/fmars.2019.00331
Ashjian, C. J., Braund, S. R., Campbell, R. G., George, J. C., Kruse, J., Maslowski, W., et al. (2010). Climate variability, oceanography, bowhead whale distribution, and Iñupiat subsistence whaling near Barrow, Alaska. Arctic 68, 179–194. doi: 10.14430/arctic973
Aydin, K. Y., Lapko, V., Radchenko, V., and Livingston, P. (2002). A Comparison of the Eastern Bering and Western Bering Sea Shelf and Slope Ecosystems Through the Use of Mass-Balance Food Web Models. NOAA Technical Memorandum NMFS-AFSC.
Banas, N. S., Møller, E. F., Nielsen, T. G., and Eisner, L. B. (2016). Copepod life strategy and population viability in response to prey timing and temperature: testing a new model across latitude, time, and the size spectrum. Front. Mar. Sci. 3:225. doi: 10.3389/fmars.2016.00225
Basedow, S. L., Sundfjord, A., von Appen, W.-J., Halvorsen, E., Kwasniewski, S., and Reigstad, M. (2018). Seasonal variation in transport of zooplankton into the arctic basin through the atlantic gateway, fram strait. Front. Mar. Sci. 5:194. doi: 10.3389/fmars.2018.00194
Boertmann, D., Kyhn, L. A., Witting, L., and Heide-Jørgensen, M. P. (2015). A hidden getaway for bowhead whales in the Greenland Sea. Polar Biol. 38, 1–5. doi: 10.1007/s00300-015-1695-y
Brennan, C. E., Maps, F., Gentleman, W. C., Plourde, S., Lavoie, D., Chassé, J., et al. (2018). How transport shapes copepod distributions in relation to whale feeding habitat: demonstration of a new modelling framework. Prog. Oceanogr. 171, 1–21. doi: 10.1016/j.pocean.2018.12.005
Clayton, S., Dutkiewicz, S., Jahn, O., and Follows, M. J. (2013). Dispersal, eddies, and the diversity of marine phytoplankton. Limnol. Oceanogr. Fluids Environ. 3, 182–197. doi: 10.1215/21573689-2373515
Conway, D., and Robins, D. B. (1991). “Collection and chemical analysis of chaetognaths and changes due to preservation,” in The Biology of Chaetognaths, eds Q. Bone, H. Kapp, and A. Pierrot-Bults (Oxford: Oxford University Press), 137–146.
Cronin, T. W., Fasick, J. I., Schweikert, L. E., Johnsen, S., Kezmoh, L. J., and Baumgartner, M. F. (2017). Coping with copepods: do right whales (Eubalaena glacialis) forage visually in dark waters? Philos. Trans. R. Soc. B 372:20160067. doi: 10.1098/rstb.2016.0067
Daase, M., Falk-Petersen, S., Varpe, Ø., Darnis, G., Søreide, J. E., Wold, A., et al. (2013). Timing of reproductive events in the marine copepod Calanus glacialis: a pan-Arctic perspective. Can. J. Fisher. Aquat. Sci. 70, 871–884. doi: 10.1139/cjfas-2012-0401
Eschricht, D., and Reinhardt, J. (1861). Om nordhvalen (Balaena mysticetus L.) navnlig med hensyn til dens udbredning i fortiden og nutiden og til dens ydre og indre sarkjender. Det Kongelige Danske Videnskapernes Selskabs Skrifter, naturvidenskabelig og mathematisk Afdeling 5:158.
Falk-Petersen, S., Pavlov, V., Timofeev, S., and Sargent, J. R. (2007). “Climatevariability and possible effects on arctic food chains: the role of Calanus,” in Arctic Alpine Ecosystems and People in a Changing Environment, eds J. B. Ørbaek, R. Kallenborn, I. Tombre, E. N. Hegseth, S. Falk-Petersen, A. H. Hoel 147–166. doi: 10.1007/978-3-540-48514-8_9. Available online at: https://www.google.co.uk/books/edition/_/d-KDr0JlE6IC?hl=en&gbpv=0
Fasick, J. I., Baumgartner, M. F, Cronin, T. W., Nickle, B., and Kezmoh, L. J. (2017). Visual predation during springtime foraging of the North Atlantic right whale (Eubalaena glacialis). Mar. Mammal Sci. 33, 991–1013. doi: 10.1111/mms.12417
Ferguson, S., Dueck, L., Loseto, L., and Luque, S. (2010). Bowhead whale Balaena mysticetus seasonal selection of sea ice. Mar. Ecol. Prog. Ser. 411, 285–297. doi: 10.3354/meps08652
Froese, R. (2006). Cube law, condition factor and weight-length relationships: history, meta-analysis and recommendations. J. Appl. Ichthyol. 22, 241–253. doi: 10.1111/j.1439-0426.2006.00805.x
Gladish, C. V., Holland, D. M., and Lee, C. M. (2015). Oceanic boundary conditions for Jakobshavn Glacier. Part II: provenance and sources of variability of Disko Bay and Ilulissat icefjord waters, 1990-2011. J. Phys. Oceanogr. 45, 33–63. doi: 10.1175/JPO-D-14-0045.1
Hansen, M., Nielsen, T., Stedmon, C., and Munk, P. (2012). Oceanographic regime shift during 1997 in Disko Bay, Western Greenland. Limnol. Oceanogr. 57, 634–644. doi: 10.4319/lo.2012.57.2.0634
Heath, M. R. (2012). Ecosystem limits to food web fluxes and fisheries yields in the north sea simulated with an end-to-end food web model. Prog. Oceanogr. 102, 42–66. doi: 10.1016/j.pocean.2012.03.004
Heide-Jørgensen, M., Laidre, K., Wiig, Ø., Postma, L., Dueck, L., and Bachmann, L. (2010). Large-scale sexual segregation of bowhead whales. Endang. Species Res. 13, 73–78. doi: 10.3354/esr00315
Heide-Jørgensen, M. P., Laidre, K. L., Borchers, D., Samarra, F., and Stern, H. (2007). Increasing abundance of bowhead whales in West Greenland. Biol. Lett. 3, 577–580. doi: 10.1098/rsbl.2007.0310
Heide-Jørgensen, M. P., Laidre, K. L., Nielsen, N. H., Hansen, R. G., and Røstad, A. (2013). Winter and spring diving behavior of bowhead whales relative to prey. Anim. Telemetry 1:15. doi: 10.1186/2050-3385-1-15
Hirche, H.-J., Laudien, J., and Buchholz, F. (2016). Near-bottom zooplankton aggregations in Kongsfjorden: implications for Pelago-Benthic coupling. Polar Biol. 39, 1897–1912. doi: 10.1007/s00300-015-1799-4
Hirche, H.-J., and Mumm, N. (1992). Distribution of dominant copepods in the Nansen Basin, Arctic Ocean, in summer. Deep Sea Res. A 39, S485–S505. doi: 10.1016/S0198-0149(06)80017-8
Hirche, H.-J., Muyakshin, S., Klages, M., and Auel, H. (2006). Aggregation of the Arctic copepod Calanus hyperboreus over the ocean floor of the Greenland Sea. Deep Sea Res. I 53, 310–320. doi: 10.1016/j.dsr.2005.08.005
Hunt, G. L., and McKinnell, S. (2006). Interplay between top-down, bottom-up, and wasp-waist control in marine ecosystems. Prog. Oceanogr. 68, 115–124. doi: 10.1016/j.pocean.2006.02.008
Kimmel, D. G., Eisner, L. B., Wilson, M. T., and Duffy-Anderson, J. T. (2017). Copepod dynamics across warm and cold periods in the eastern Bering Sea: implications for walleye pollock (Gadus chalcogrammus) and the oscillating control hypothesis. Fish. Oceanogr. 27, 143–158. doi: 10.1111/fog.12241
Kiørboe, T., and Hirst, A. G. (2014). Shifts in mass scaling of respiration, feeding, and growth rates across life-form transitions in marine pelagic organisms. Am. Natural 183, E118–E130. doi: 10.1086/675241
Kvile, K. Ø., Ashjian, C., and Ji, R. (2019). Pan-arctic depth distribution of diapausing Calanus copepods. Biol. Bull. 237, 76–89. doi: 10.1086/704694
Laidre, K. L., and Heide-Jørgensen, M. P. (2012). Spring partitioning of Disko Bay, West Greenland, by Arctic and Subarctic baleen whales. ICES J. Mar. Sci. 69, 1226–1233. doi: 10.1093/icesjms/fss095
Laidre, K. L., Heide-Jørgensen, M. P., Logsdon, M. L., Delwiche, L., and Nielsen, T. G. (2010). A whale of an opportunity: examining the vertical structure of chlorophyll-a in high Arctic waters using instrumented marine predators. Mar. Biol. Res. 6, 519–529. doi: 10.1080/17451000903505616
Laidre, K. L., Heide-Jørgensen, M. P., and Nielsen, T. G. (2007). Role of the bowhead whale as a predator in West Greenland. Mar. Ecol. Prog. Ser. 346, 285–297. doi: 10.3354/meps06995
Madsen, S. D., Hansen, B. W., and Nielsen, T. G. (2001). Annual population development and production by Calanus finmarchicus, C. glacialis and C. hyperboreus in Disko Bay, western Greenland. Mar. Biol. 139, 75–83. doi: 10.1007/s002270100552
Matthews, J., and Hestad, L. (1977). Ecological studies on the deep-water pelagic community of Korsfjorden, western Norway. Sarsia 63, 57–63. doi: 10.1080/00364827.1977.10411322
Møller, E. F., and Nielsen, T. G. (2020). Borealization of Arctic zooplankton–smaller and less fat zooplankton in Disko Bay, western Greenland. Limol. Oceanogr. 65, 1175–1188. doi: 10.1002/lno.11380
Moore, S. E. (2016). Is it ‘boom times’ for baleen whales in the Pacific Arctic region? Biol. Lett. 12:20160251. doi: 10.1098/rsbl.2016.0251
Nielsen, N. H., Laidre, K. L., Larsen, R. S., and Heide-Jørgensen, M. P. (2015). Identification of potential foraging areas for bowhead whales in Baffin Bay and adjacent waters. Arctic 68, 169–111. doi: 10.14430/arctic4488
Norden Andersen, O., Laidre, K. L., and Heide-Jørgensen, M. P. (2014). Benthopelagic shrimp and associated pelagic and benthopelagic fauna on a bowhead whale foraging ground in Disko Bay, West Greenland. Mar. Sci. 4, 10–20. doi: 10.5923/j.ms.20140401.02
Reeves, R., and Heide-Jørgensen, M. (1996). Recent status of bowhead whales, Balaena mysticetus, in the wintering grounds off West Greenland. Polar Res. 15, 115–125. doi: 10.3402/polar.v15i2.6641
Rekdal, S. L., Hansen, R. G., Borchers, D., Bachmann, L., Laidre, K. L., Wiig, Ø., et al. (2014). Trends in bowhead whales in West Greenland: aerial surveys vs. genetic capture-recapture analyses. Mar. Mammal Sci. 31, 133–154. doi: 10.1111/mms.12150
Rogachev, K. A., Carmack, E. C., and Foreman, M. G. G. (2008). Bowhead whales feed on plankton concentrated by estuarine and tidal currents in Academy Bay, Sea of Okhotsk. Continent. Shelf Res. 28, 1811–1826. doi: 10.1016/j.csr.2008.04.014
Simon, M., Johnson, M., Tyack, P., and Madsen, P. T. (2009). Behaviour and kinematics of continuous ram filtration in bowhead whales (Balaena mysticetus). Philos. Trans. R. Soc. Lond. Ser. B Biol. Sci. 276, 3819–3828. doi: 10.1098/rspb.2009.1135
Slagstad, D., Wassmann, P. F. J., and Ellingsen, I. (2015). Physical constrains and productivity in the future Arctic Ocean. Front. Mar. Sci. 2:85. doi: 10.3389/fmars.2015.00085
Stafford, K., Moore, S., Laidre, K., and Heide-Jorgensen, M. (2008). Bowhead whale springtime song off West Greenland. J. Acoust. Soc. Am. 124, 3315–3323. doi: 10.1121/1.2980443
Swalethorp, R., Kjellerup, S., Dünweber, M., Nielsen, T. G., Møller, E. F., Rysgaard, S., et al. (2011). Grazing, egg production, and biochemical evidence of differences in the life strategies of Calanus finmarchicus, C. glacialis and C. hyperboreus in Disko Bay, western Greenland. Mar. Ecol. Prog. Ser. 429, 125–144. doi: 10.3354/meps09065
Tervo, O., Parks, S., and Miller, L. (2009). Seasonal changes in the vocal behavior of bowhead whales (Balaena mysticetus) in Disko Bay, Western-Greenland. J. Acoust. Soc. Am. 126, 1570–1580. doi: 10.1121/1.3158941
Tönnesson, K., Nielsen, T., and Tiselius, P. (2006). Feeding and production of the carnivorous copepod Pareuchaeta norvegica in the Skagerrak. Mar. Ecol. Prog. Ser. 314, 213–225. doi: 10.3354/meps314213
Vézina, A. F., and Platt, T. (1988). Food web dynamics in the ocean. 1. Best-estimates of flow networks using inverse methods. Mar. Ecol. Prog. Ser. 42, 269–287. doi: 10.3354/meps042269
Walkusz, W., Williams, W. J., Harwood, L. A., Moore, S. E., Stewart, B. E., and Kwasniewski, S. (2012). Composition, biomass and energetic content of biota in the vicinity of feeding bowhead whales (Balaena mysticetus) in the Cape Bathurst upwelling region (south eastern Beaufort Sea). Deep Sea Res. I 69, 25–35. doi: 10.1016/j.dsr.2012.05.016
Wassmann, P., Kosobokova, K., Slagstad, D., Drinkwater, K., Hopcroft, R., Moore, S., et al. (2015). The contiguous domains of Arctic Ocean advection: trails of life and death. Prog. Oceanogr. 139, 42–65. doi: 10.1016/j.pocean.2015.06.011
Wassmann, P., Slagstad, D., and Ellingsen, I. (2019). Advection of mesozooplankton into the northern Svalbard shelf region. Front. Mar. Sci. 6:458. doi: 10.3389/fmars.2019.00458
Werth, A. (2004). Models of hydrodynamic flow in the bowhead whale filter feeding apparatus. J. Exp. Biol. 207, 3569–3580. doi: 10.1242/jeb.01202
Keywords: Bowhead whale (Balaena mysticetus), Calanus, Arctic, optimal foraging, advection, zooplankton
Citation: Banas NS, Møller EF, Laidre KL, Simon M, Ellingsen IH and Nielsen TG (2021) Reconciling Behavioural, Bioenergetic, and Oceanographic Views of Bowhead Whale Predation on Overwintering Copepods at an Arctic Hotspot (Disko Bay, Greenland). Front. Mar. Sci. 8:614582. doi: 10.3389/fmars.2021.614582
Received: 06 October 2020; Accepted: 28 April 2021;
Published: 26 May 2021.
Edited by:
Michelle Jillian Devlin, Centre for Environment, Fisheries and Aquaculture Science (CEFAS), United KingdomReviewed by:
Corinne Pomerleau, Fisheries & Oceans Canada, CanadaJeff Higdon, Higdon Wildlife Consulting, Canada
Copyright © 2021 Banas, Møller, Laidre, Simon, Ellingsen and Nielsen. This is an open-access article distributed under the terms of the Creative Commons Attribution License (CC BY). The use, distribution or reproduction in other forums is permitted, provided the original author(s) and the copyright owner(s) are credited and that the original publication in this journal is cited, in accordance with accepted academic practice. No use, distribution or reproduction is permitted which does not comply with these terms.
*Correspondence: Neil S. Banas, neil.banas@strath.ac.uk