Erosion Dynamics of Cultivated Kelp, Saccharina latissima, and Implications for Environmental Management and Carbon Sequestration
 Reinhold Fieler
 Michael Greenacre
 Sanna Matsson1
  Silje Forbord
 Kasper Hancke
- 1Akvaplan-Niva, Tromsø, Norway
- 2Universitat Pompeu Fabra and Barcelona School of Management, Barcelona, Spain
- 3Seaweed Solutions AS, Trondheim, Norway
- 4SINTEF Ocean, Trondheim, Norway
- 5Norwegian Institute for Water Research (NIVA), Oslo, Norway
A growing trend of interest for the cultivation of kelp is driven by predictions for high global demands of important commodities, which require the development of alternative supplies of natural resources. In this study the dynamics of loss of biomass from cultivated Saccharina latissima were studied from February to August 2018 at two kelp farms in Northern (69°45.26′N/019°02.18′E) and in Mid-Norway (63°42.28′N/08°52.23′E). Kelp fronds at each farm were individually followed throughout the growing season. Sectional regression was applied for conversion of measured frond lengths to estimated dry weights. The study shows that between 40 and 100% of all individuals in the studied kelp population constantly eroded slightly from their distal ends. However, until June the accumulated loss was only 8% of produced dry weight. Due to dislodgement of whole sporophytes this picture changed in July and August to heavy losses in Mid-Norway. Thus, the overall losses of kelp in terms of accumulated dry weight were only 8–13% of the gross growth until harvest in June in Mid-Norway and August in Northern Norway. Losses increased significantly in Mid-Norway during July and reached 49.4% of the annual production in August. The rates of losses were separated into specific erosion and dislodgement rates. Erosion rates over the whole experimental period for the two sites were not significantly different, while differences in dislodgement rates between farm sites proved to be highly significant. The exported annual amount of carbon was estimated on the basis of lost and measured carbon content in the tissue. From these data a scenario was built for a commercial Norwegian kelp farm growing S. latissima showing a carbon export of 63–88 g C m–2y–1. This is eight times less than has been reported from scenarios for kelp farms in China. This study confirms that optimal timing of harvest is the most important management tool for avoidance of heavy losses from kelp farms. In conclusion, an industry with early harvest will likely have a low carbon export, while a late-harvested bulk production could export four to six times as much carbon with an increased potential for carbon sequestration.
Introduction
Globally, cultivation of seaweed is a fast-growing sector (FAO, 2020). The outlook for Norwegian seaweed farming is expected to be good (Broch et al., 2019) with projected production volumes of 4 million tons per year by 2030 and 20 million tons per year by 2050 (Olafsen et al., 2012). These projections are based on predictions for high global demands of important commodities which require the development of alternative supplies of natural resources. The development of kelp farming in Norway is also fuelled by the potential prospects of integrated multi-trophic aquaculture – IMTA (Soto, 2009; Chopin et al., 2010; Handå et al., 2013; Stévant et al., 2017), and might in the future have several useful applications.
Saccharina latissima (Linnaeus) Lane, Mayes, Druehl, and Saunders (Lane et al., 2006) is currently the most commonly and economically important cultivated species in Norway. S. latissima have sporophytes that can be divided into holdfast, stipe and a single lamina. Their blades have a stretched droplet shape with ruffled edges. The morphology of S. latissima has substantial phenotypical variation. Growth occurs in the meristematic region which is positioned in the intersection between the stipe and frond. Like in benthic sugar kelp the blade has a branched holdfast which in aquaculture is anchoring them to the rope. After 2 years of growth individual blades can under natural conditions become longer than 400 cm. The blades are usually harvested in Norwegian aquaculture after 4–7 months at a length between 60 and 100 cm.
Saccharina latissima serves as a model species for both IMTA and for processing in the food sector (Stévant et al., 2017). In 2018 a volume of 176 tons wet weight (WW) of cultivated kelp was harvested by Norwegian seaweed farmers, and the production had decreased to 111 tons WW by 2019, while the total value had increased significantly. There are presently 475 permits for macroalgal cultivation distributed over 97 locations along the Norwegian coast. The cultivation potential of S. latissima along the Norwegian coast was recently estimated to be 150–200 tons per hectare per year, and industrial kelp cultivation might utilize extensive areas in the marine environment (Broch et al., 2019), and introduce considerable new quantities of kelp detritus into the ecosystem. Until now, we have incomplete knowledge of the ecological footprint of this nascent industry.
Kelp detritus is produced from constantly eroding fronds, from the fragmentation of parts of the fronds or from the dislodgement of entire sporophytes (Pedersen et al., 2020). The rate of erosion and dislodgement of S. latissima sporophytes has been described, during some periods of the year, to surpass growth rates and the monthly estimates amount to as much as 40–70% loss of kelp fronds in natural kelp forests (Parke, 1948; Lüning, 1979; Sjøtun, 1993; Krumhansl and Scheibling, 2011). The loss of tissue from the distal part of the frond is a constantly ongoing process in several Laminarian species, which starts when the sporophyte is only few months old (Parke, 1948; Tala and Edding, 2005; Dean and Hurd, 2007; Nielsen et al., 2016a). The annual detrital production from the erosion of kelp forests in Nova Scotia and in Norway has been estimated to range from 150–513 g C m–2 year–1 and 478 ± 41 g C m–2 year–1, respectively (Krumhansl and Scheibling, 2011; Pedersen et al., 2020). Globally, in highly productive kelp forests, incremental erosion and fragmentation can amount to 2657 g C m–2 year–1 with an additional loss of whole fronds of up to 839 g C m–2 year–1 (Krumhansl and Scheibling, 2012). Dislodgement of large amounts of kelp biomass from aquaculture installations is thus considered likely to occur. The magnitude of rates in loss of biomass from kelp farms has only been documented in a few studies. A 19% loss of total harvested biomass in terms of carbon and 33% loss in terms of nitrogen was documented from mass cultivation of the kelp Undaria pinnatifida in Japan, during a normal production cycle (Yoshikawa et al., 2001). In the Japanese aquaculture of S. japonica, peak rates of erosion were estimated at 2.4–3.7 g wet weight day–1 which surpassed production rates at the end of the growth season (Suzuki et al., 2008). In experiments in Sungo Bay in China cultured S. japonica had carbon losses of up to 61% of the total seasonal gross production due to erosion (Zhang et al., 2012). Other studies from Norwegian waters have shown substantial loss of kelp biomass from farms in association with heavy biofouling only late in the season (Matsson et al., 2019; Forbord et al., 2020).
Cultivation of kelp may contribute with significant supplements of organic material to the surrounding marine environment, with possible implications for the ecosystem and carbon turnover (Duarte et al., 2017). If the organic material is deposited in large amounts underneath the farms, it could cause oxygen depletion from upscaled microbial turnover and lead to poor environmental conditions. If more widely distributed and dispersed, kelp organic matter could lead to stimulated benthos activity and change the natural biodiversity. Also, if not broken down or eaten by benthos, kelp organic matter would be buried in the seafloor and thereby stimulate elevated carbon sequestration in the seafloor. Further, big losses of kelp biomass represent a risk regarding profitability of the kelp cultivation business. Despite this potential for loss of kelp biomass, researchers who have studied the seafloor underneath kelp farms, have not found marked negative environmental effects from intensive kelp farming (Zhang et al., 2009, 2020; Liu et al., 2016). The question that therefore arises is whether the magnitude and fate of kelp detritus that is exported from kelp rigs has been estimated correctly or if the biomass is transported with the water currents away from the rigs, and is dispersed and deposited over large areas, as has been suggested by Wernberg and Filbee-Dexter (2018).
A review of 17 studies conducted on kelp showed that repeated measurements on individually marked sporophytes have not been used, and that erosion is referred to either in terms of loss of length or in weight, usually estimated from an equation using total length and total weight of the whole frond (e.g., Yoshikawa et al., 2001; Krumhansl and Scheibling, 2011; Zhang et al., 2012). In all reviewed growth- and erosion experiments the researchers measure growth by the punch-hole method (Parke, 1948). This assumes that the increment of the distance between a punched hole and the base of the kelp equals growth in length (Mann, 1973), but seaweed fronds can also elongate between punch-holes beyond the meristem (Bartsch et al., 2008; Suzuki et al., 2008). Thus, this common method could lead to both overestimation and underestimation of erosion from kelp rigs. In addition, the estimation of the weight or width of something that is lost and cannot be measured directly, could introduce significant errors into the transport equations for organic matter from kelp rigs to the benthic environment. Hence, employment of data with high resolution is a prerequisite for understanding kelp erosion and dislodgement dynamics and for quantifying loss of cultivated biomass to the surrounding environment.
As kelp cultivation is taking up large amounts of CO2 during growth, this fact has in recent years been increasingly highlighted as a contributing solution to climate change (Duarte et al., 2017). Climate mitigation through ocean and atmosphere carbon removal requires that the stored CO2 be permanently sequestered in the seabed or in the deep sea (Duarte and Cebrián, 1996; Trevathan-Tackett et al., 2015). Exported macroalgae biomass that is not consumed or microbially decomposed will sequester. For natural macroalgae ecosystems it has been suggested that 2–3% of the net production, or up to 15% of the exported biomass from kelp forests, is permanently sequestered in this manner (Krause-Jensen and Duarte, 2016). Assuming that this natural process is also relevant to cultivated kelp, it represents a nature-based solution for CO2 drawdown from the atmosphere, positioning kelp cultivation as a potential means of carbon sequestration instrument.
The aim of this study was to quantify the biomass loss from cultivated S. latissima in coastal kelp farming. Export of kelp detritus and its carbon and nitrogen content was quantified through field investigations and application of novel statistical analysis. Potential for ecosystem impacts and kelp carbon sequestration are discussed.
Materials and Methods
The Sites
This study was conducted from February to August 2018 at two sites 800 km apart, measured by air distance. Background values for physical and chemical variables were acquired from Forbord’s experiments in 2017 (Forbord et al., 2020) or from hydrographical measurements in previous years. The northernmost site (Figure 1) was located near Arctic Tromsø (69°45.259′ N/019°02.176′ E) and had a water depth of 15–20 m. It was assigned site number 9–69°N in Forbord’s study. The site was sheltered to wave exposure, but tidal forcing lead to well-mixed water masses. Current velocity was measured for 120 days at 12 m depth from March to July 2011 and was moderate with an average of 3.4 cm s–1 and a maximum of 22 cm s–1. The main current direction was toward the northwest. Conductivity, temperature, depth (CTD) profiles were taken for 13 months from the surface to the bottom in 2014 and 2015 and showed homogeneous water masses through the year. Salinity ranged from 33.0 to 33.7 psu, and water temperature ranged from 3.1°C in February to 9.5°C in August.
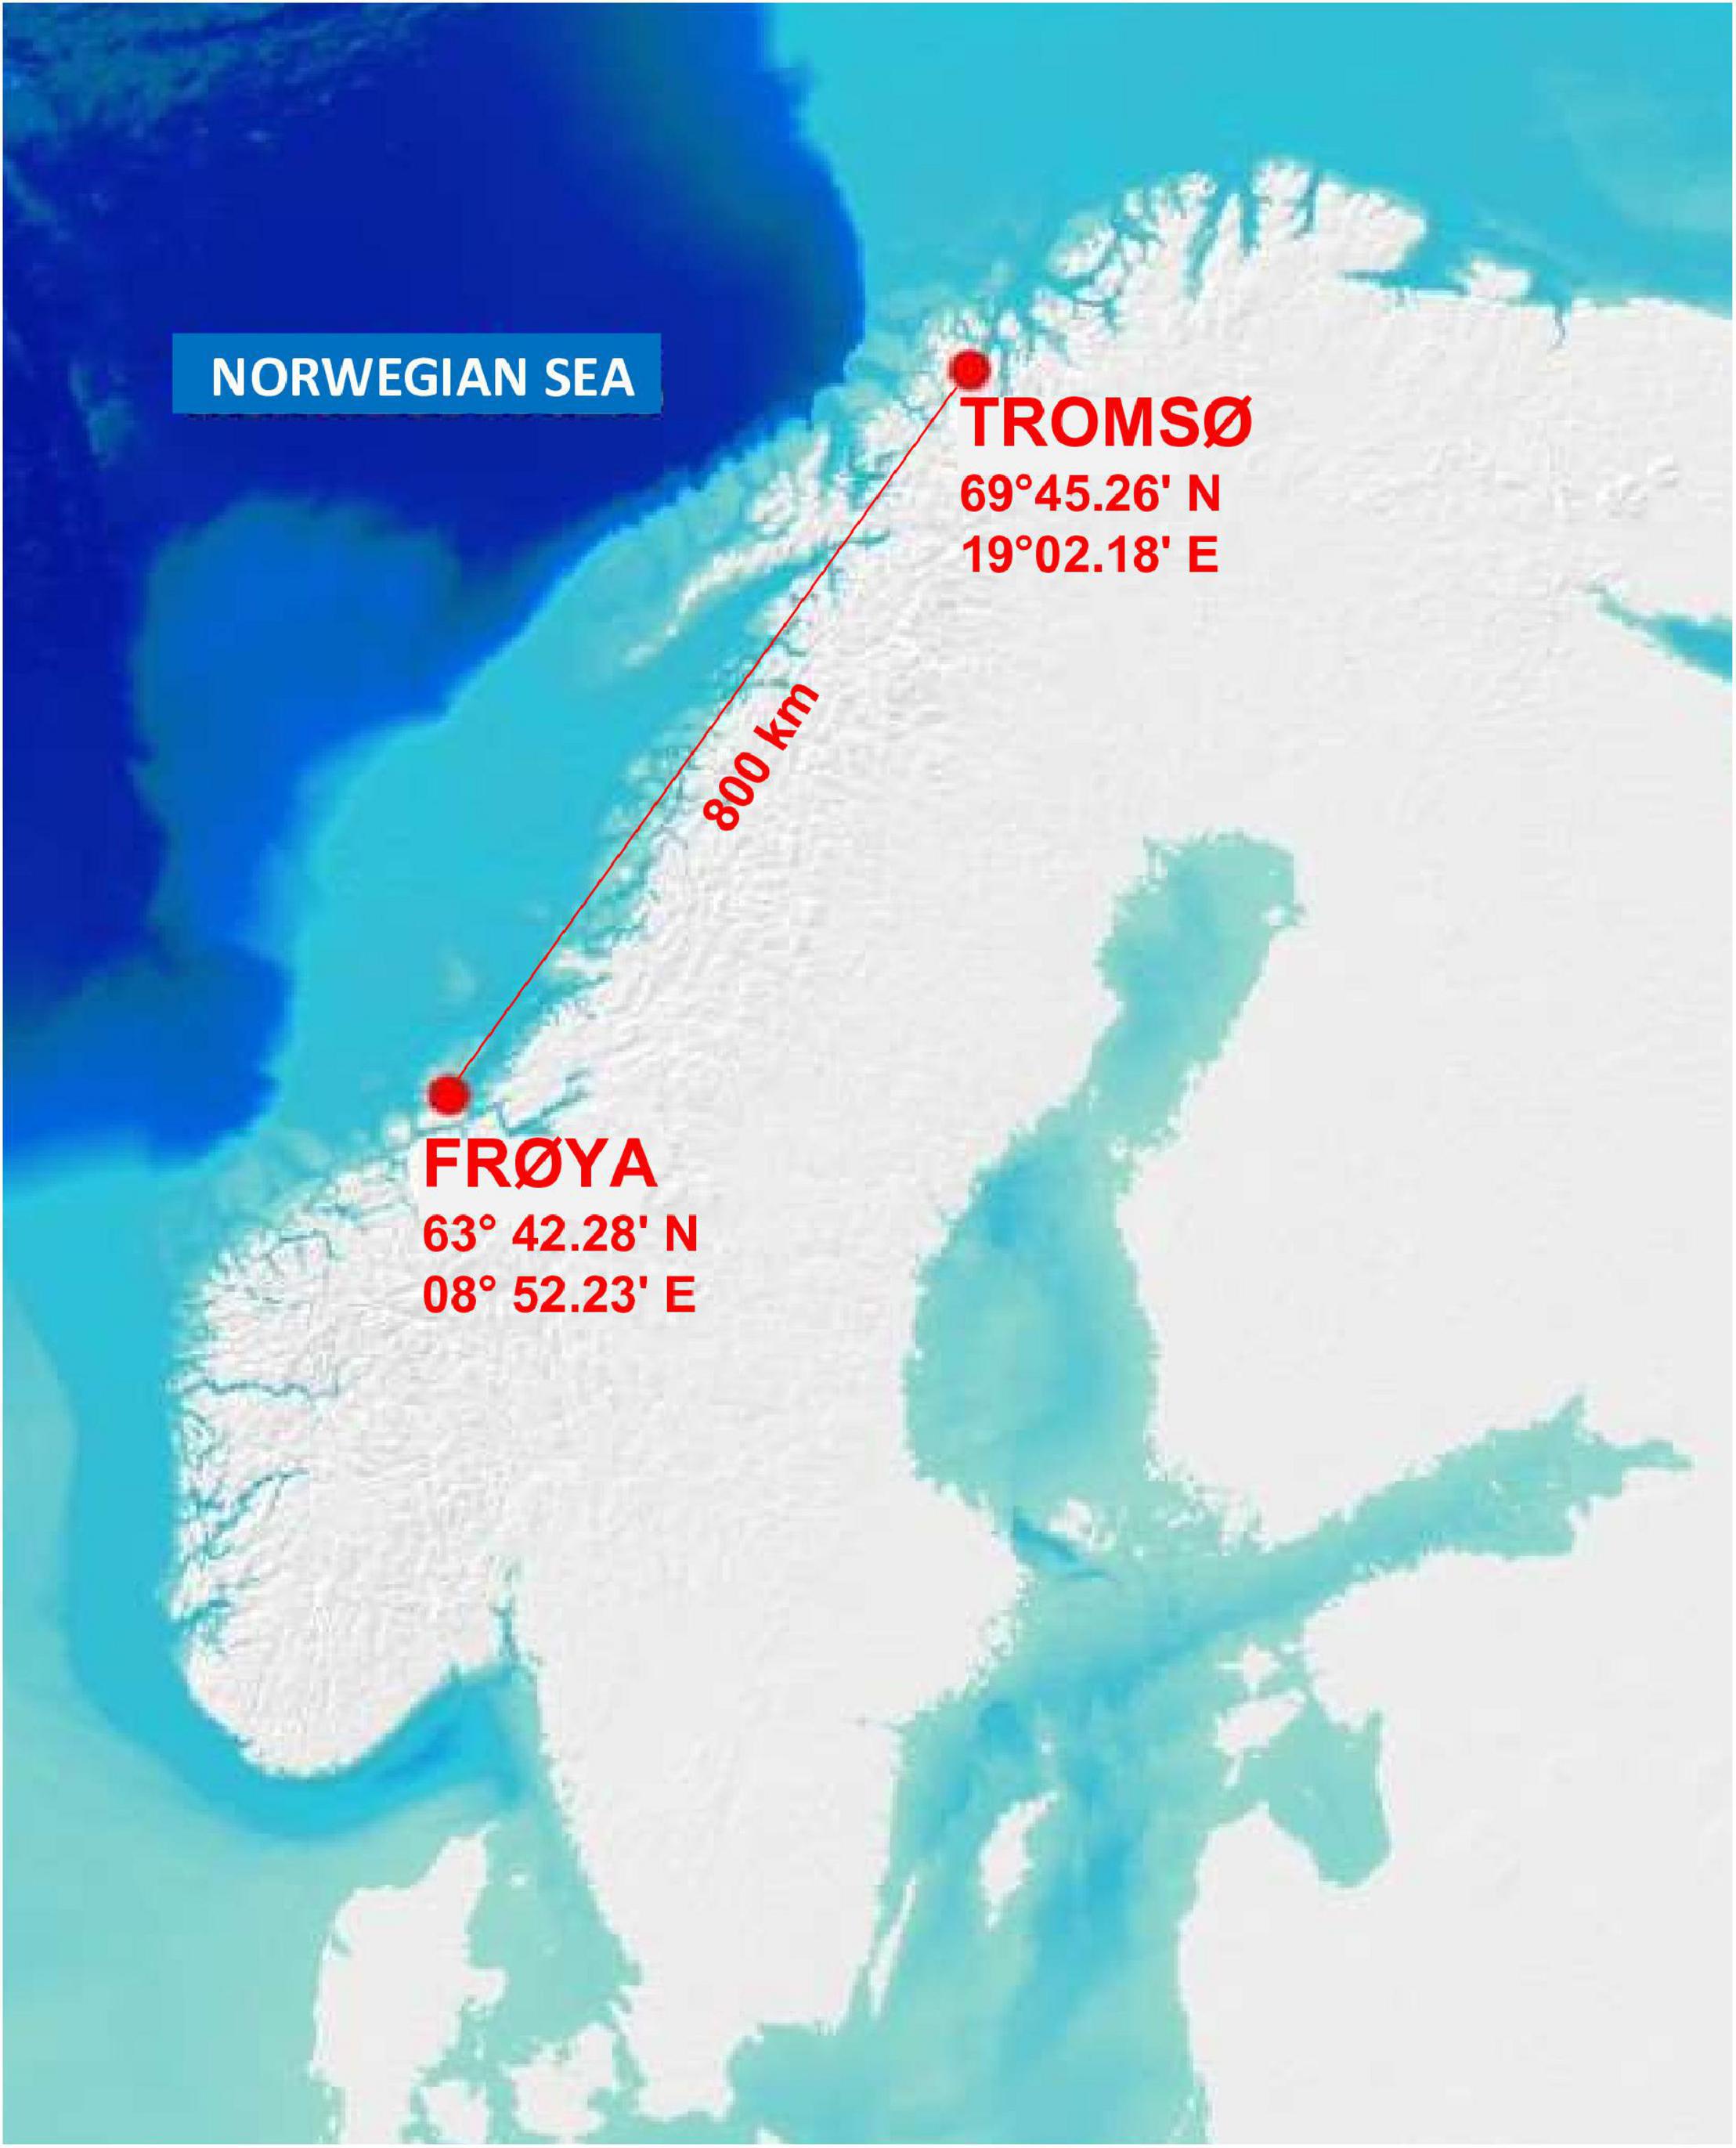
Figure 1. Location of experimental sites in Norway.
The site in Mid-Norway was off the east coast of the island of Frøya (63° 42.279′ N/08° 52.232′ E) and was identified as site number 6–63°N in Forbord’s study (Figure 1). It was semi-exposed with depths between 10 and 45 m, and with well mixed water masses. The current velocity was measured through a complete tidal cycle at different depths with an Acoustic Doppler Current Profiler (ADCP) in March 2012. At 6 m depth the average current was 9.4 cm s–1, with a maximum of 47.7 cm s–1. The main current direction was toward the northeast with a strong tidal signal resulting in conciliating currents in opposite direction. Nine series of monthly CTD measurements taken between April and November 2014 showed tendencies for the development of isoclines from mid-May to mid-August. The rest of the year the water mass was homogeneous. At six meters depth, water temperatures ranged from 7°C in April to 13°C in September 2014 and salinity ranged from 32.7 to 33.7 psu.
Monthly water temperatures at the sites for the year 2017 near Frøya and in Tromsø are shown in Supplementary Table 1. Median, minimum, and maximum temperatures were higher in Frøya than in Tromsø. Measurements showed that kelp cultivated at both sites has been well within the temperature tolerance range for S. latissima (Fortes and Lüning, 1980; Bolton and Lüning, 1982; Gerard and Du Bois, 1988; Andersen et al., 2013).
Experimental Set-Up
The experiment consisted of two different steps over the same approximate period.
Step 1 was concerned with establishing a relationship between dry weight (DW) and predictor variables length and width measured on the kelp, taking into account the different sections of the fronds. Step 1 was conducted in two experimental groups at the Tromsø and Frøya sites.
Step 2 was concerned with quantifying the gross growth, erosion and dislodgement rates, using the results of Step 1 to predict DW. Step 2 was conducted in two experimental groups at the Tromsø site and one in Frøya.
These steps used different data sets, obtained from the deployments listed in Table 1 with their corresponding deployment and termination dates, numbers of kelp fronds and numbers of samplings.
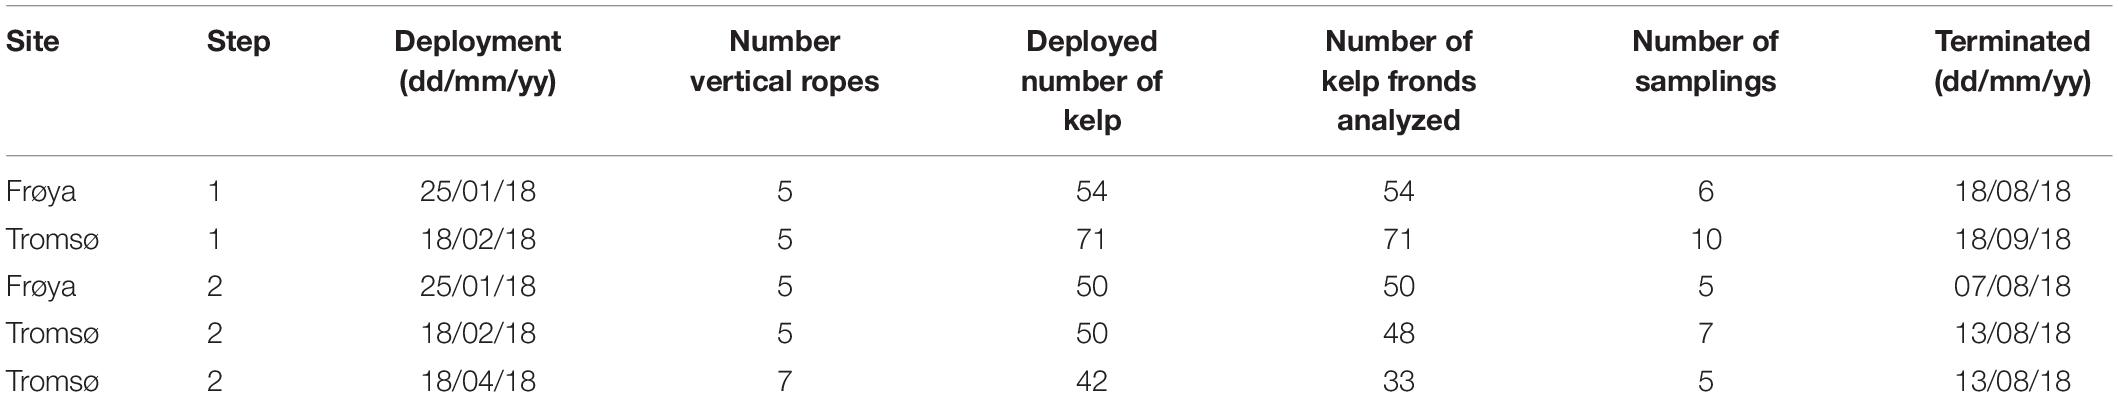
Table 1. Experimental groups, categorized according to date of deployment and sampling program.
Ropes with S. latissima seedlings, approximately 5–10 mm long (see Forbord et al., 2020), were hung vertically at the two sites from horizontal long lines on four different deployment dates (see Table 1). The seedlings were entwined onto carrier ropes between 1 and 2 m below the surface.
Data Collection
In Step 1 a total of 125 kelp fronds from Tromsø (n = 54) and Frøya (n = 71) were harvested at different sampling dates in 2018 in order to establish and validate a sectional model for predicting dry weight (DW). Between 3 and 13 specimens were harvested each time randomly from the same ropes and, after removal of the stipes, frozen in marked sealed polyethylene bags. Later these sporophytes were thawed, lengths and widths were measured after partitioning each frond into four sections (Figure 2). The length and width along each cutting line of each section were recorded. The 125 kelp fronds with four sections each resulted in 500 sections, which were dried at 60°C in a Termaks TS8056 laboratory drying oven on pre-weighed aluminum foils for 48 h until constant weight, and then weighed on a Mettler Toledo MS204TS analytical balance. The DW was calculated for each section.
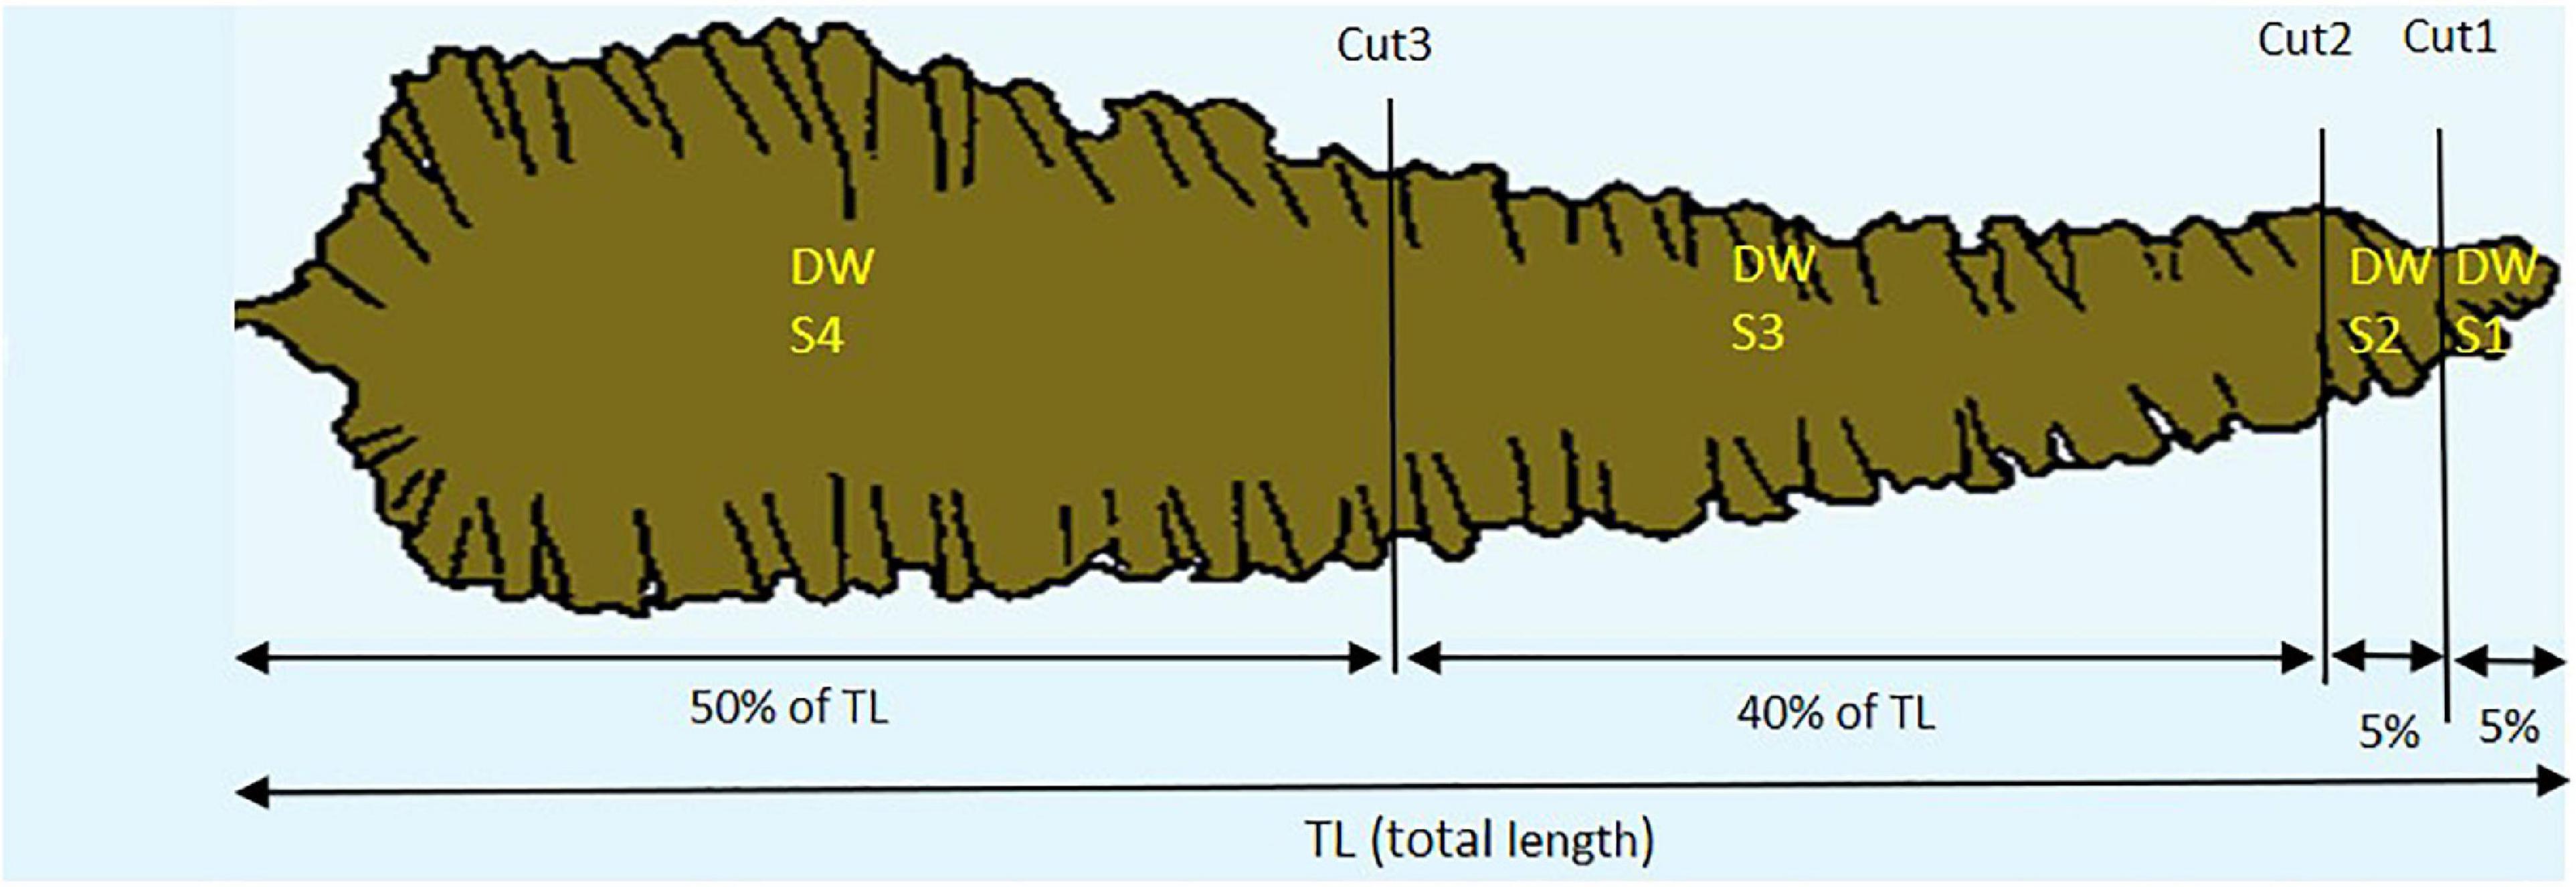
Figure 2. The four sections (S1, S2, S3, and S4) of kelp fronds, e.g., S4 is always 50% of total length (TL), S1 is always 5% of TL.
In Step 2 a total of 131 kelp fronds from the two Tromsø deployments in 2018 (n = 48 and n = 33) and the Frøya site (n = 50) were individually followed every 2–3 weeks throughout the growing season, using the punch-hole technique (Parke, 1948). At each time point, total frond length and width were measured as well as the distances between all punched holes. Due to the small size of the fronds at the start of the experiment the first hole was punched 5 cm from the holdfast for repeated in situ measurements on the same individuals over the experimental period. New punch-holes where made at each sampling date and the distance relative to the previous punch-hole, which represents length increment, was measured. Kelp fronds which were lost before the second sampling period were either excluded from further analysis or replaced with new individuals. Growth and erosion in terms of length were calculated as described by Lüning (1979), Tala and Edding (2005), and Dean and Hurd (2007). The distance between older holes from previous sampling dates was compared with the previously measured distance. Where an elongation between older holes of the frond was measured (Suzuki et al., 2008), this additional elongation was included in the length increment for the sampling period and was contrasted with the initial length increment between the two holes closest to the meristem.
All in situ measurements of total frond length and width and the changes in the distance between the punch-holes from the stipes and those between the holes following the previous sampling were registered in a database for each marked individual.
Complementary Data From 2017 and 2018
Additional data for whole kelp sporophytes were obtained for 2017 from Forbord et al. (2020), including tissue dry weight content (%DW of WW), tissue nitrogen content (QN, mg N g–1 DW), tissue carbon content (QC, mg C g–1 DW), QC/QN ratio (C/N ratio) and biofouling. For individuals seeded in February 2017 the mean maximum length was approximately 60 cm at Frøya and approximately 100 cm in Tromsø (Figure 2 in Forbord et al., 2020). At harvest the holdfast had a length of 9 and 17 cm, respectively, in Frøya and in Tromsø. The main fouling organisms were initially filamentous algae and thereafter the bryozoan Membranipora membranacea at Frøya, and initially filamentous algae followed by the hydroid Obelia geniculate and M. membranacea in Tromsø (Figures 8, 9 in Forbord et al., 2020). Additional data were obtained for Tromsø in 2018 from Matsson et al. (2021), for C/N ratios and biofouling. These data were used for interpretation of results and in calculations of carbon export following Step 2 of the analysis.
The relative tissue DW content for whole sporophytes in 2017 ranged from 13.9 to 23.6% of WW in Frøya and from 12.4 to 22.6% of WW in Tromsø (Supplementary Table 2). The highest values in Frøya were detected in the months June, July and August and may be caused by heavy biofouling in the late season. Also, these values were based on thawed material and therefore some water could be lost in the process compared to fresh material.
Carbon content (QC ± 95%ME) was 26.6 ± 0.9% and 23.8 ± 1.1% of dry matter, respectively, for kelp from Frøya and Tromsø, where 95%ME stands for the margin of error that is added and subtracted from the estimated mean to give a 95% confidence interval for the mean. The 95% confidence intervals in Supplementary Table 3 showed that QC did not vary significantly across the months.
The range of nitrogen content (QN ± 95%ME) was from 1.7 ± 0.3% in May to 4.0 ± 1.8% in August for Frøya, and from 1.6 ± 0.4% in August to 3.6 ± 0.3% in April for Tromsø (Supplementary Table 3). The highest QN value from August from Frøya was most probably the effect from heavy biofouling. The 95% confidence intervals in Supplementary Table 3 show that QN varied significantly between April and early May compared to the remaining months from Frøya, and from April and May compared to the remaining months from Tromsø.
The C/N ratio for Frøya (Supplementary Figure 1A) had a steep increase in May 2017 from just below 9 to over 14 by the middle of May, and was constantly that high until a decline in August which coincided with heavy biofouling and loss of sporophytes. In Tromsø the C/N ratio was not above 10 before the middle of June 2017 and June 2018 and increased to a maximum close to 16 in August 2017 and 38 in August 2018. In Tromsø the C/N ratio increased approximately 2 months later than in Frøya (Supplementary Figures 1C,E).
Percentage cover from biofouling (Supplementary Figure 1B) on kelp fronds increased rapidly in Frøya from below 5% in May to 40% by the end of June. After June, the fronds in Frøya were heavily damaged from biofouling and no further analysis could be conducted. In Tromsø the onset of biofouling in 2017 was one month later than in Frøya, and coverage was below or close to 5% of frond area until the middle of July. Even in August kelp fronds in Tromsø had a coverage just slightly above 20%. In 2018 biofouling is reported as number of epibionts m–2, and the numbers are not directly comparable to 2017. Nevertheless, the data for biofouling (Supplementary Figures 1D,F) show the same trend as in 2017 with a notable increase as late as in the middle of August.
Calculating Losses, Expected Increments, and Expected Length
In the case of the data for Step 2, suppose a particular kelp frond is sampled at times t0, t1,…, tk. The expected length increment of the frond between samplings at times ti–1 and ti, denoted by ΔLi, is the increment from the punch-hole closest to the base minus 5 cm, plus the additional elongation between all the older holes in the frond for that period. The observed length at time ti, denoted by OLi, is the measured length of the frond. The expected length at time ti, denoted by ELi, is calculated by adding the expected length increment to the observed length from the previously measured length:
Length loss at time ti, denoted by LLi, is computed by subtracting the observed length from the expected length, both at time ti:
The total expected length increment of the frond for the whole experiment is termed grown length and is the sum of all expected length increments:
Expected length increments, length losses and grown length were calculated for each individual kelp for each sampling period. Since erosion starts from the distal part of the frond it was possible to recalculate what percentage of the frond was eroded compared to the expected length. For each erosion event for all individual fronds during each sampling period, a classification was made of the involved sections S1 through S4 (Figure 2). When all four sections were lost, the loss was classified as dislodgement.
Statistical Analysis
The data from Step 1 were used to establish and validate sectional models for predicting DW, using regression analysis on each of the four sections. The aim was to find the best model for predicting erosion and dislodgement expressed as DW on the basis of available biometrical data (length and width) and the number of days since deployment in the sea. An important underlying consideration was that it was not possible to measure precise width data for each eroded part of the frond during each erosion event because sampling in the sea cannot be performed daily. However, based on the 500 dried sections from the complete sporophytes it was possible to simulate erosion and to investigate how much predictive power the regression model would gain or lose with or without width data.
For each of the two sites, four regression models were fitted on the sectional data, thus eight models in total, after log-transforming all the biometric variables DW, length and width, but leaving days untransformed. Furthermore, in each of the eight cases, an additional model was fitted excluding the variable width for the reason described above. The results from the regression analyses were inspected for interaction to check if data from Tromsø and Frøya and from different deployment dates could be pooled.
In order to gauge the additional benefit of including width as a predictor, a simulation exercise was conducted, where sections were randomly deleted, in order to simulate loss of plant sections. More specifically, of the 500 sections, 190 sections were randomly deleted to simulate loss: 30 of Section 1s, 50 of Section 2s (which implies 50 of Section 1s as well) and 20 of Section 3s (which implies 20 of Section 2s and 20 of Section 1s as well). Using the 310 simulated “retained” sections, the regression models were separately fitted again, and their results used to predict the DW of the “lost” sections, thus providing an estimate of “lost” DW which could be compared with the actual known DW of those “lost” sections. An estimate of relative error of prediction was obtained for this simulation by summing the DW predictions and comparing with the sum of the actual DW values, then expressing the relative error as a percentage:
This exercise was repeated 1000 times, each time deleting a different random subset of 190 sections, thus leading to 1000 estimates of the relative error. Doing this using all the predictors, length, width and days, and doing it again without the predictor width, gave an indication of how much predictive power was being lost by not taking width into account.
An important issue was that the log-transformed estimates for predicted DW needed to be back-transformed including the back-transformation correction for the lognormal distribution (Dambolena et al., 2009; Greenacre, 2016), using the antilog (exponential) of the mean plus half of the regression error variance s2 for each estimate. That is, if log(DW) was a predicted DW on a logarithmic scale for a particular section, then the estimated DW was back-transformed as:
In the case of Step 2, the respective models established in Step 1 above, using only length and days as predictors, were used to predict the various DWs of the 131 growing kelp fronds, based on the expected length estimates ELi and lost lengths LLi defined in Section “Complementary Data From 2017 and 2018.” This provided estimates of production, erosion and dislodgement over time, which also could be used to compute growth and erosion rates. All percentages of losses of DW here are referring to lost DW compared to produced DW.
The average individual rates can give results which might deviate from those estimated from the combined data for the whole stock. Therefore, the specific growth and erosion rates were calculated from the sum of stock data for each experimental group. The growth rate GRi was estimated as:
where EWi is the sum of expected DW for all the kelp at time ti, and OWi–1 is the sum of observed DW for all kelp at the previous time ti–1. The rates on a log-scale were back-transformed to compound rates as percentages to give a specific growth rate (SGR) per day:
The SGR divided by 100 is the equivalent of the compound rate p in the growth formula:
The specific erosion rate (SER) was calculated in a similar way:
Erosion rates are zero or negative and comprise only kelp fronds that have not dislodged.
The specific dislodgement rate (SDR) is the rate at which kelp biomass is lost due to dislodgement of whole kelp sporophytes. SDR is estimated for the whole stock at each sampling point as follows, where DWi is the DW of the dislodged kelp at time ti:
Notice that EWi includes all eroded and dislodged kelp at time ti.
To obtain a measure of variability in each of the above estimates, the individual data were bootstrapped 1000 times (i.e., sampled with replacement), leading each time to different values of EWi, OWi and DWi, and thus different values of the respective rates defined above. Confidence intervals could thus be established by identifying the 2.5 and 97.5% quantiles of the bootstrapped rates in each case.
Specific growth, erosion and dislodgement rates were also calculated for individual kelp in the same way.
Results
Sectional Regressions
For the 125 fronds that were sectioned and weighed (54 from Frøya and 71 from Tromsø), four regressions were performed separately for the two sampling areas, predicting mean log-DW from log-length and log-width for the four respective sections as well as days since deployment:
where the subindex Sj indicates section j (j = 1,…,4) − see Figure 2.
The whole exercise was repeated omitting log-width, using only log-length and Days as predictors.
There were significant differences between the Frøya and Tromsø models to keep them separate. In addition, there were also differences in the regression coefficients between sections, so it was decided to maintain four sectional regressions in each case.
The results of the simulation exercise in Step 1 and the relative errors of the predictions of total loss of DW for the 125 fronds are shown graphically in two different forms in Figures 3B, 4B, with or without log-width included as a predictor, as well as days since deployment in both cases.
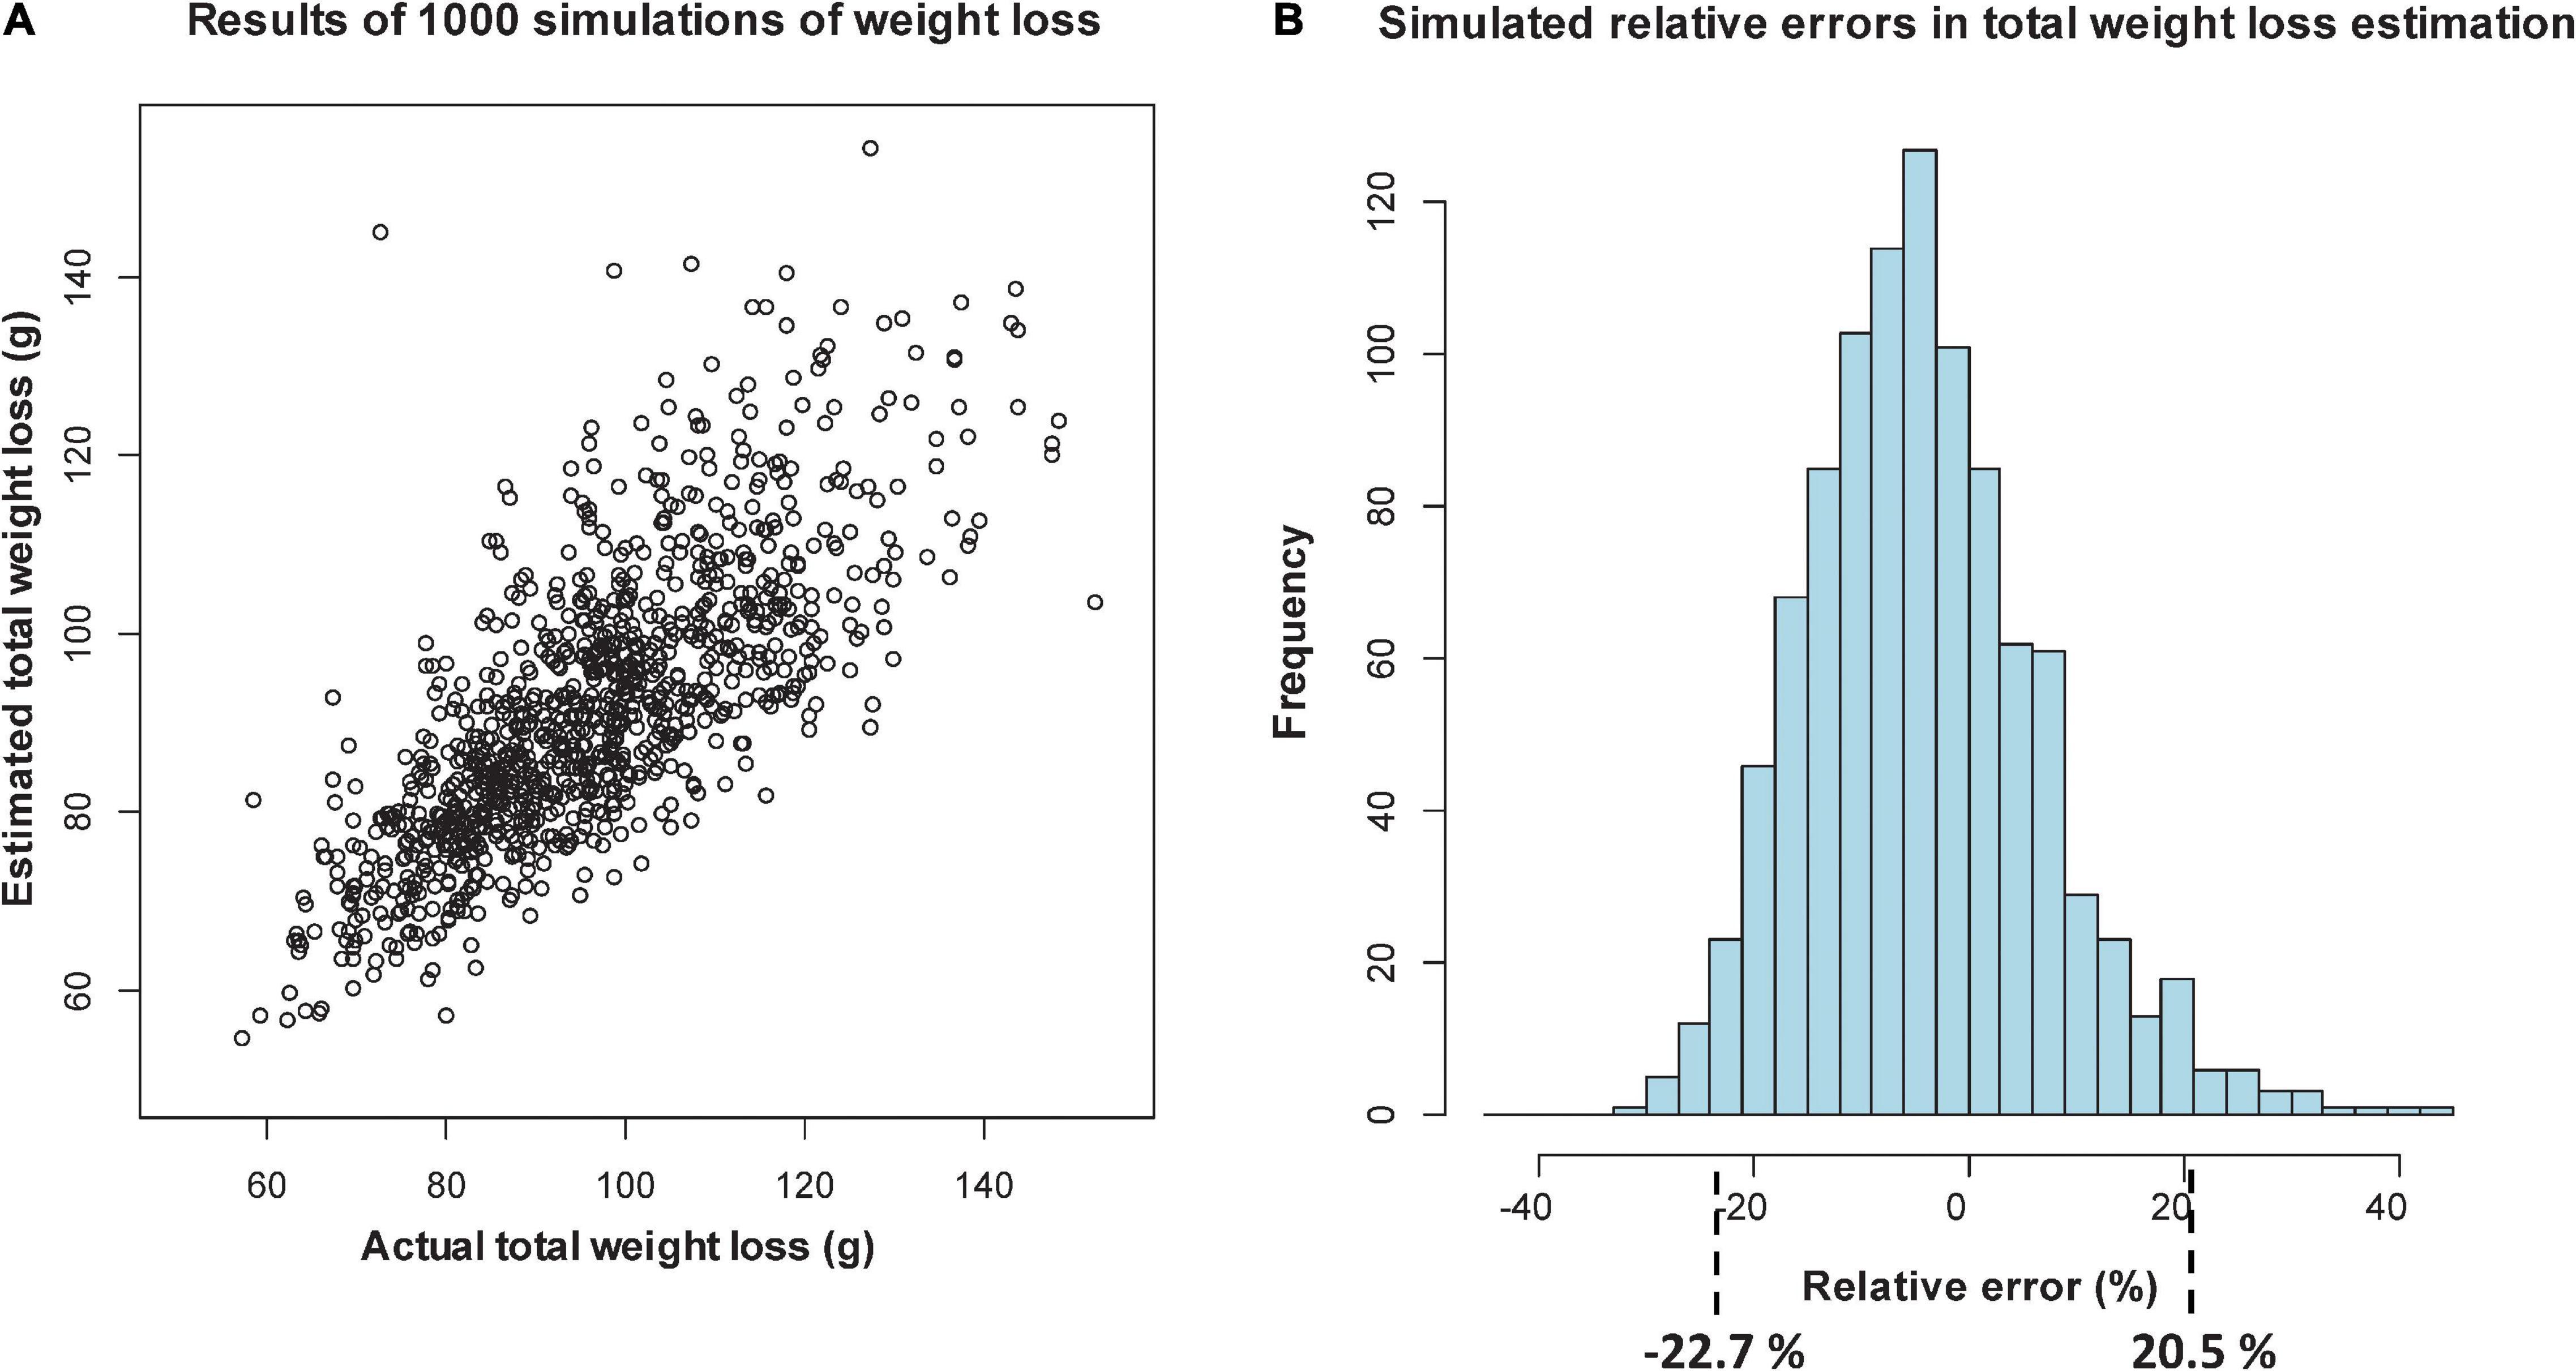
Figure 3. Simulation of relative percentage errors from 1000 simulations of loss, using sectional regression models with length, width data and days from deployment as predictors: scatterplot of estimated versus actual total weight loss (A), and histogram of the relative percentage errors, showing intervals that include 95% of the values (B).
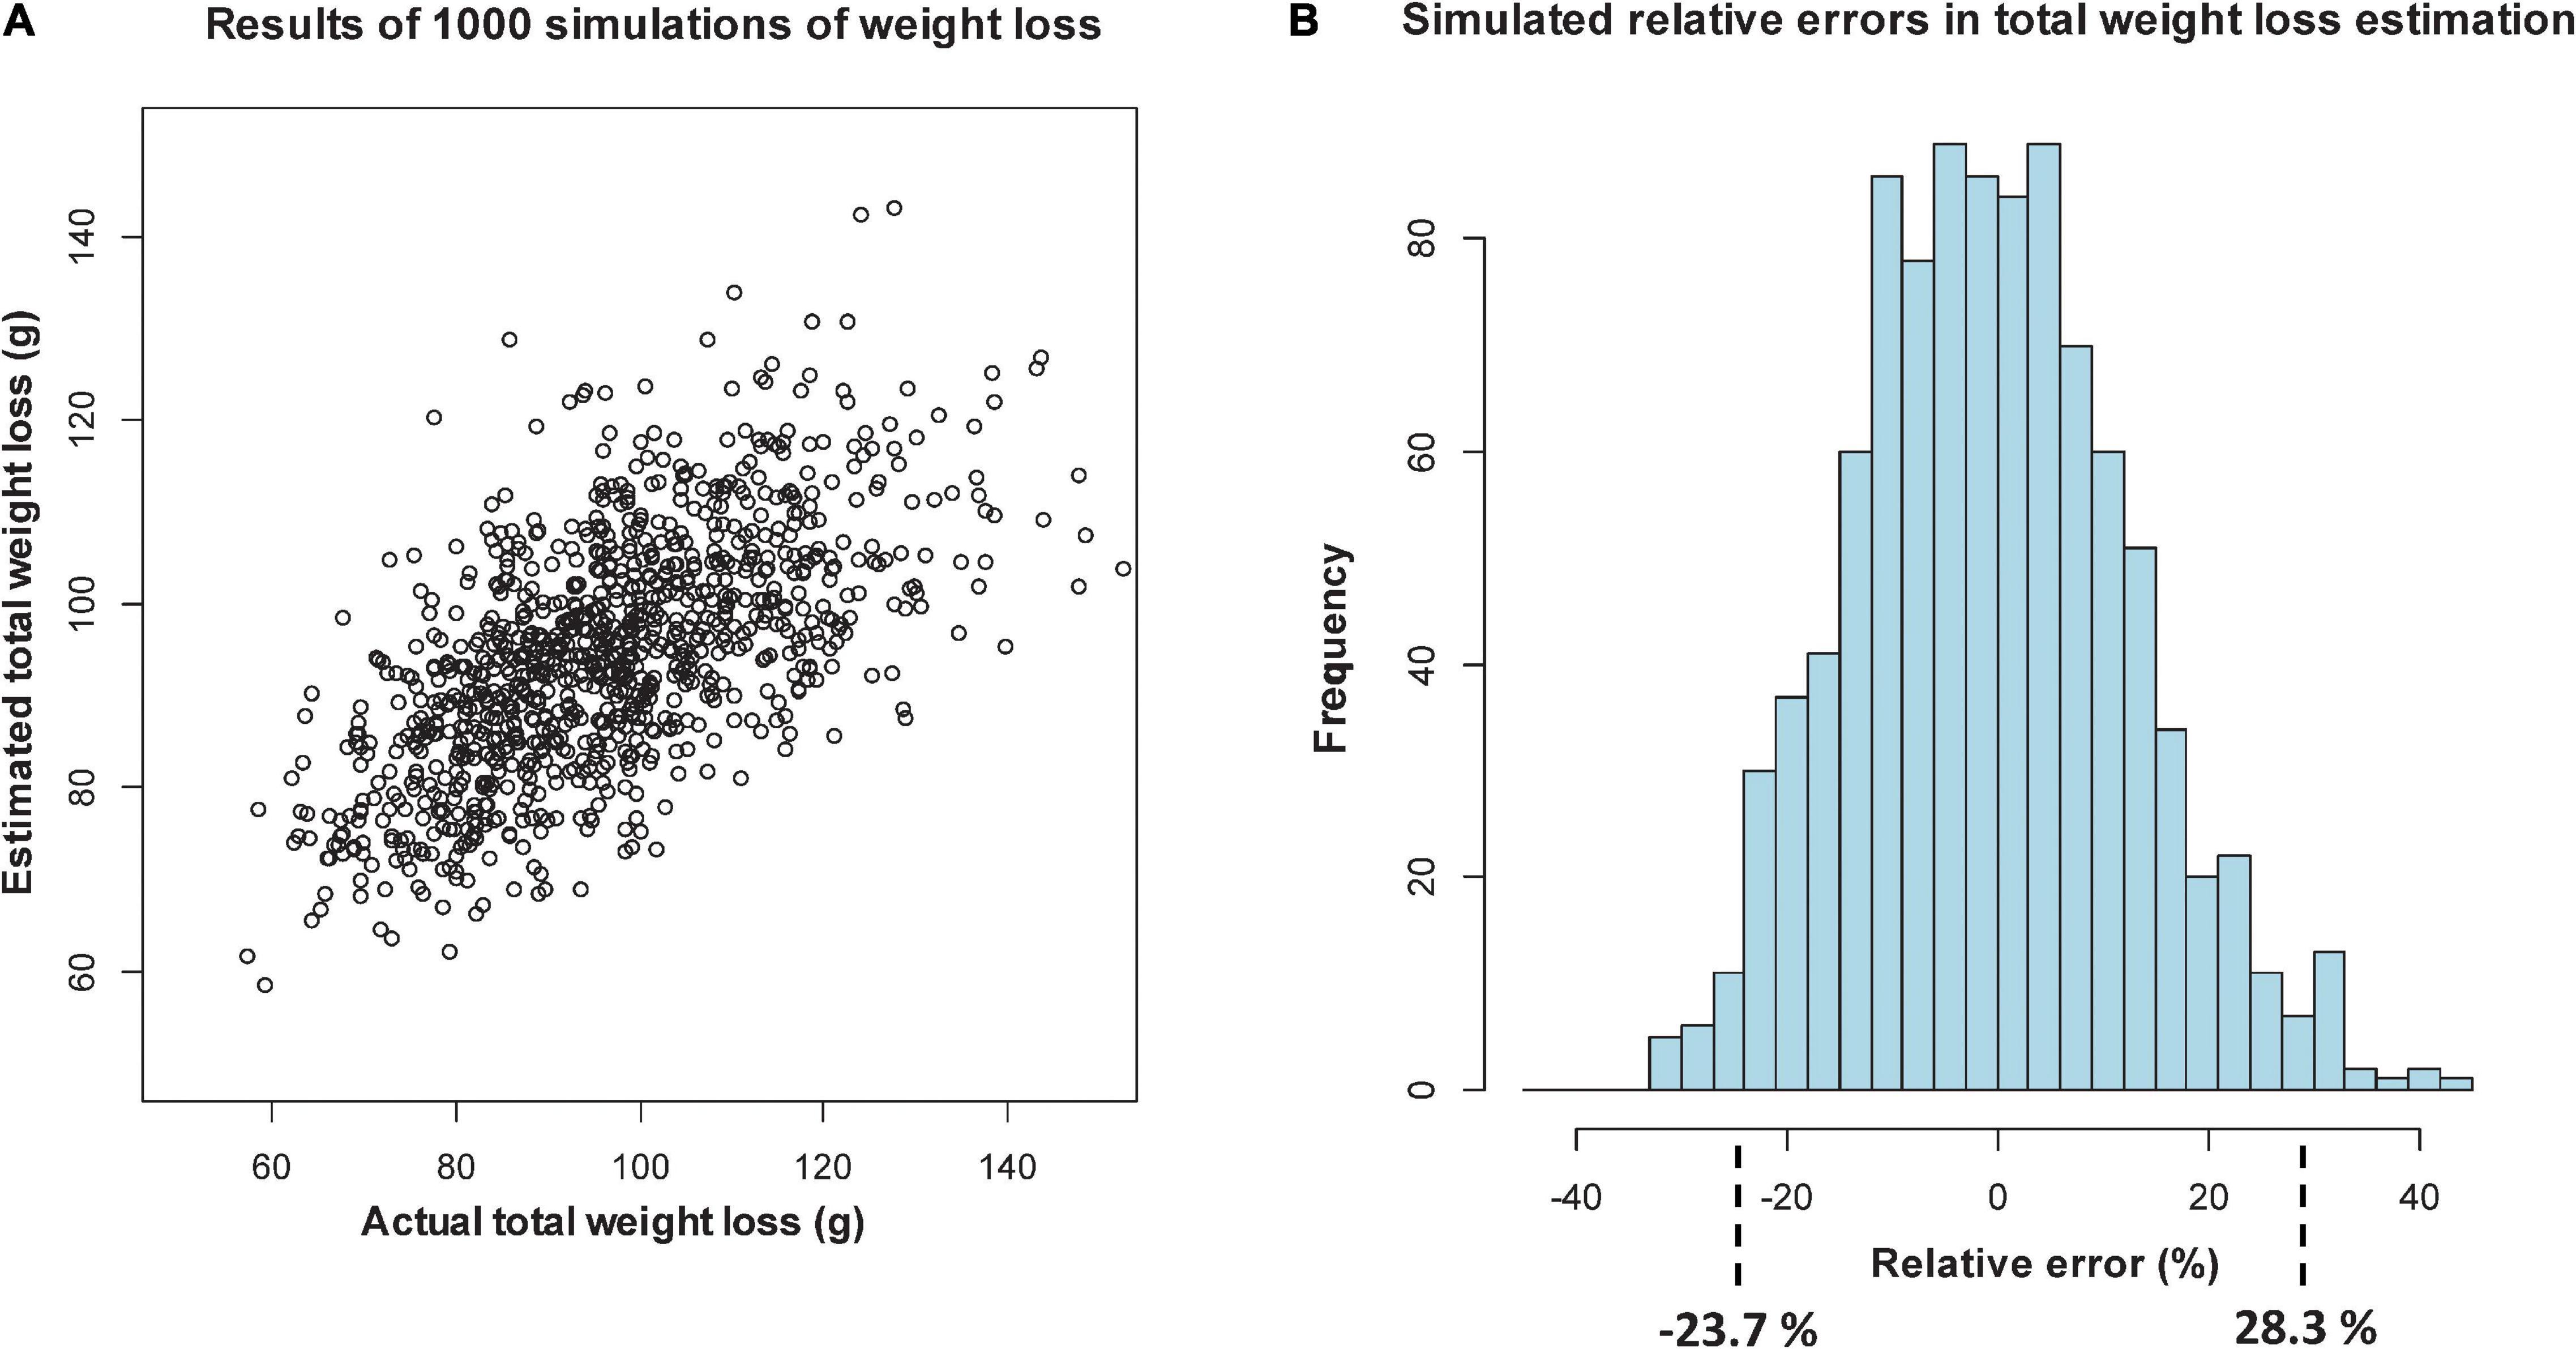
Figure 4. Simulation of relative percentage errors from 1000 simulations of loss, using sectional regression models with only length data and days from deployment as predictors: scatterplot of estimated versus actual total weight loss (A), and histogram of the relative percentage errors, showing intervals that include 95% of the values (B).
In Figure 3A, when log-width is included, the scatterplot shows more agreement between predicted and actual DWs at lower values, with the relative percentage errors over the 1000 simulations lying in an interval (of 95% of the errors) from -22.7% (over-predicted) to 20.5% (under-predicted). When log-width is excluded (Figure 4A), the scatterplot is more spread out at the lower values, and the corresponding interval is from -23.7 to 28.3%. Even though this represents an 8.8 percentage point worsening of the predictive quality, it is mostly due to the larger inaccuracies in smaller predictions, which give high relative errors. For Step 2 we will, in any case, only be able to take length into account, but the above exercise shows that being unable to use width is not a too serious drawback.
The regression models, including p-values, R2 (percentages of explained variance) and s2 (regression error variances, used in the back-transformation from means on log-scale to original scale of DW in g) were estimated as follows, now using the data for all 500 sections of the 125 fronds:
For Frøya:
For Tromsø:
The above set of eight equations are used to estimate DW in Step 2 where the evolution of 131 sporophytes at Frøya and Tromsø are followed over time using the punch-hole procedure.
Growth and Loss Measured by Dry Weight
Production, loss and standing biomass of DW increased at all sites during the growing season (Figure 5). Lost DW until the middle of June was approximately 8% of production in Frøya (Figure 5A) and for the February deployment in Tromsø (Figure 5B). Then, losses caused by dislodgement increased to 49.4% of produced kelp in Frøya, and by August the biomass did not increase, indicating that the production rate in July and August was equivalent to the loss rate. Furthermore, in Frøya a substantial fraction of the biomass in August comprised of epibiotic biofouling organisms (see Supplementary Figure 1B) and not only kelp tissue (Matsson et al., 2019; Forbord et al., 2020). Dislodgement of whole plants occurred both by holdfast loosening from the ropes and complete break-off close to the stipes.
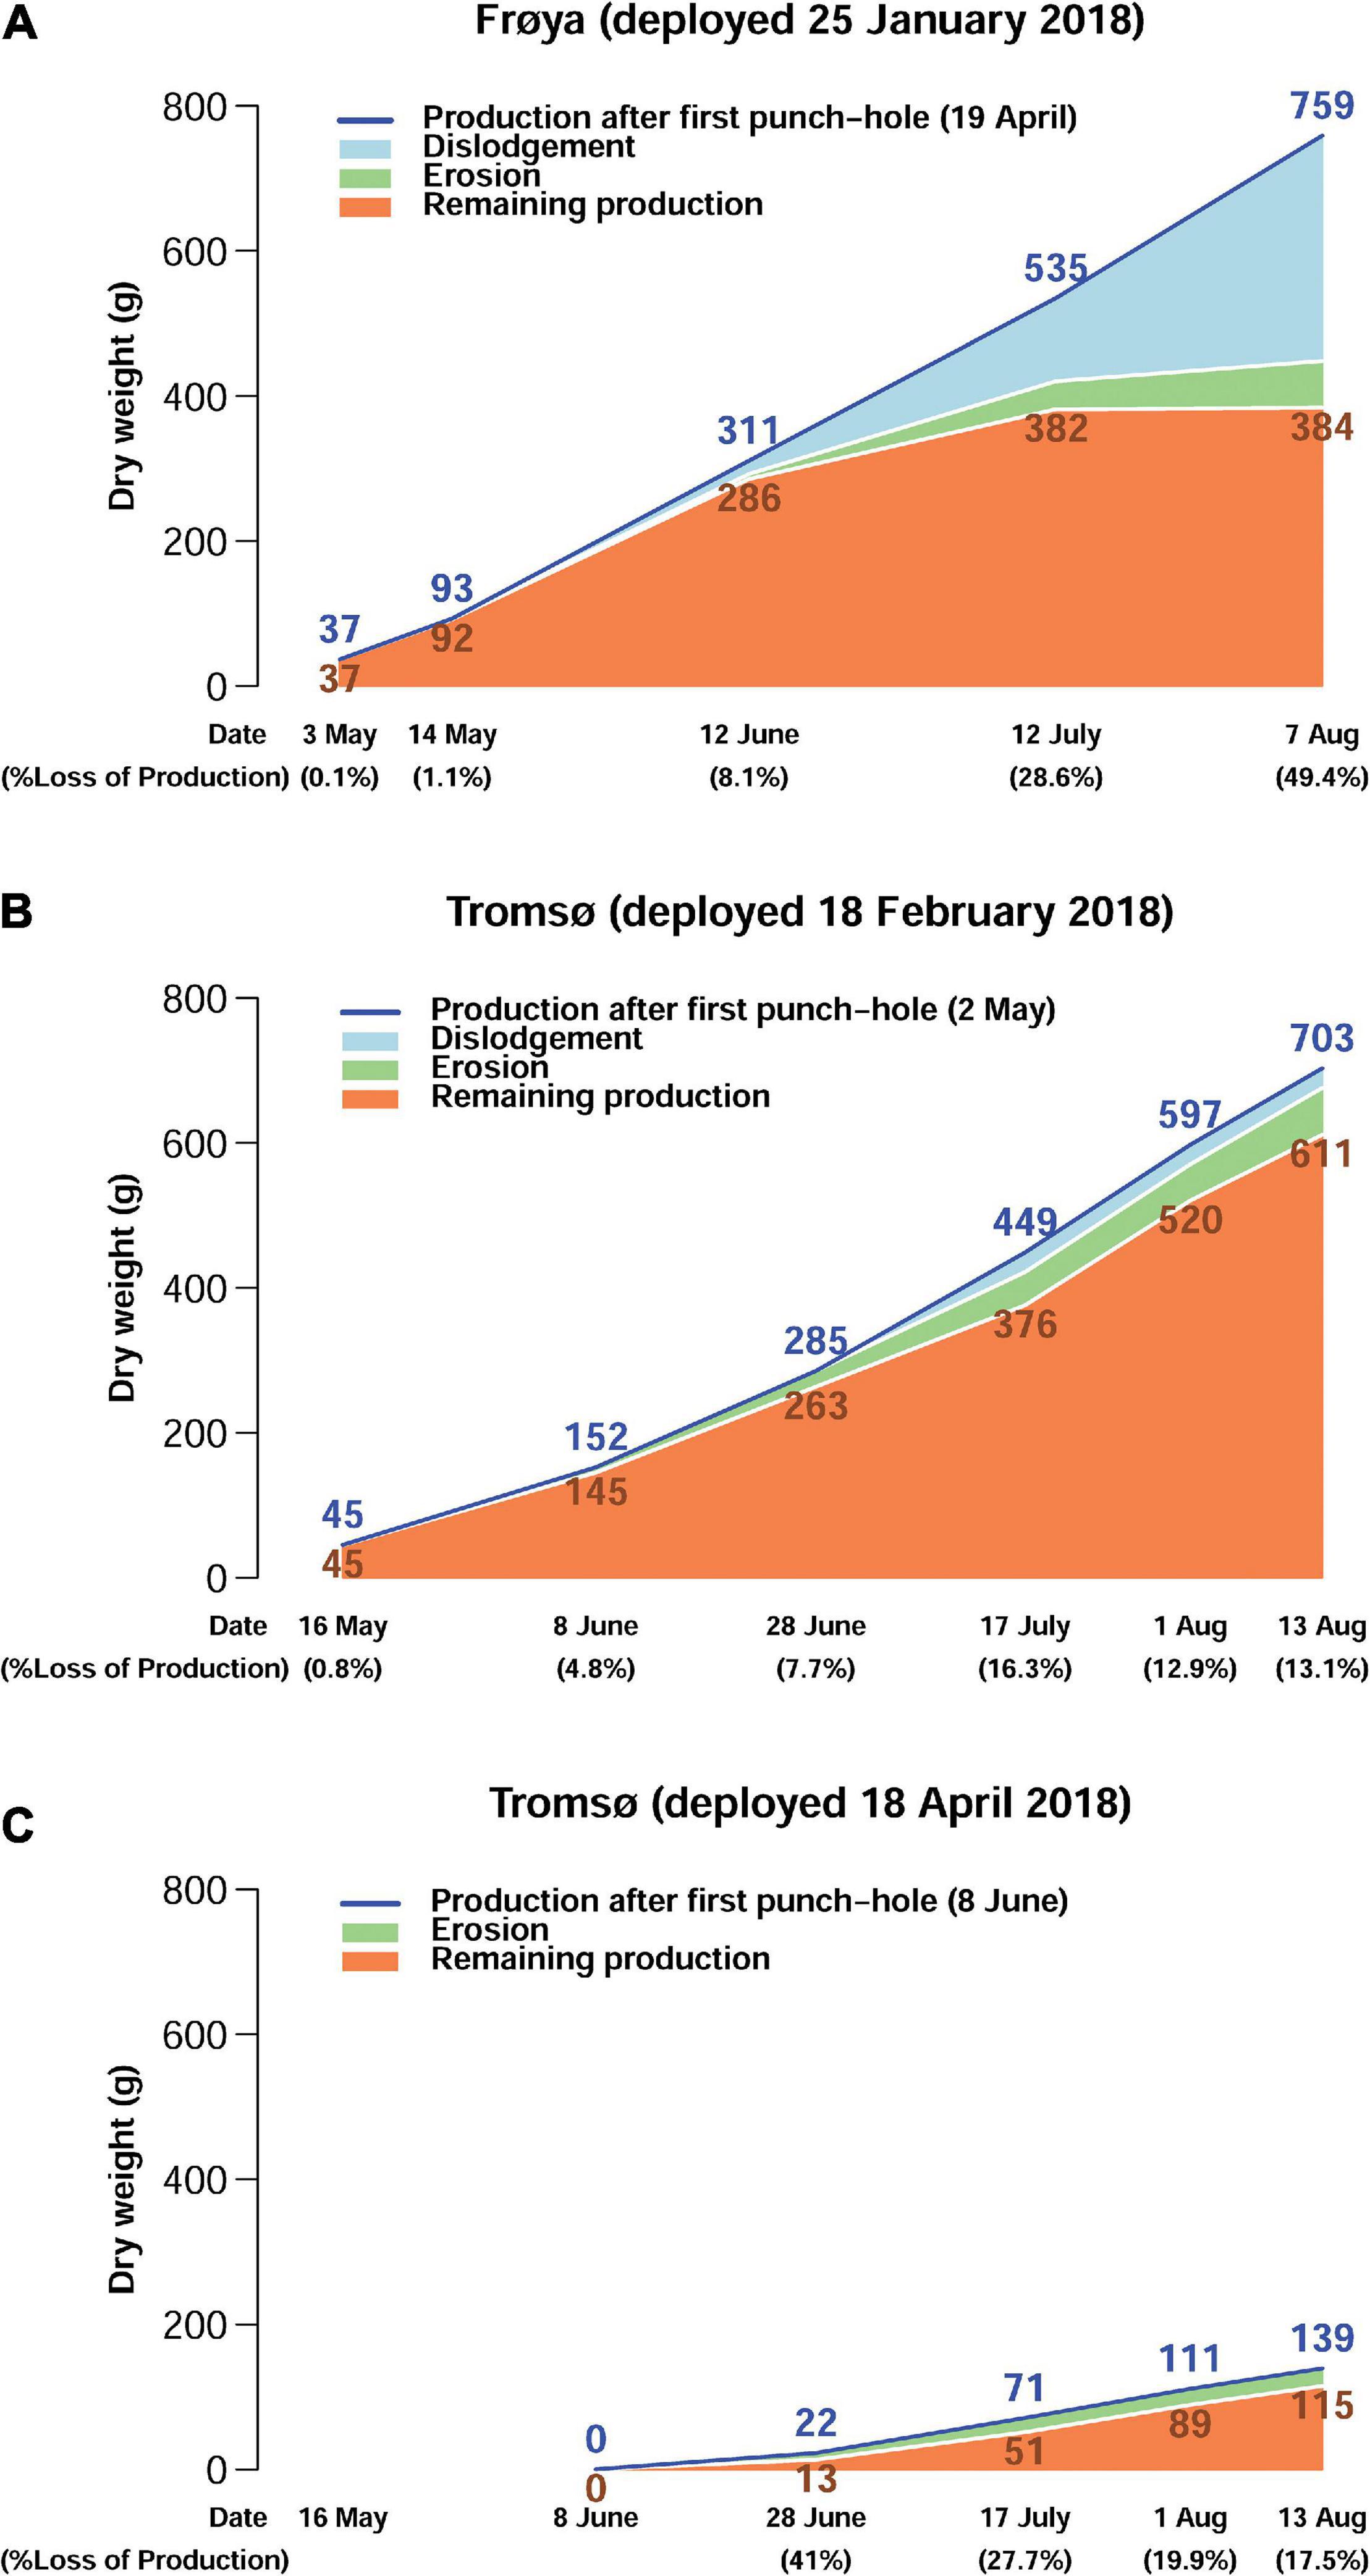
Figure 5. Estimated production, dislodgement, erosion, and remaining production on rigs for the whole experimental stock of kelp at different points of sampling (g DW) for Frøya (A), Tromsø February (B), and Tromsø April (C) deployment.
From the start of the experiments until the middle of August losses were below 18% in both Tromsø deployments. The data show that the produced DW in the later deployment in April was lower than for the February deployment.
For most months, Specific erosion rates were relatively similar between the deployments in Frøya and Tromsø February (Table 2). In August, the SDR increased sharply in Frøya and the data clearly showed that the heavy losses in Frøya were related to the dislodgement of whole sporophytes.
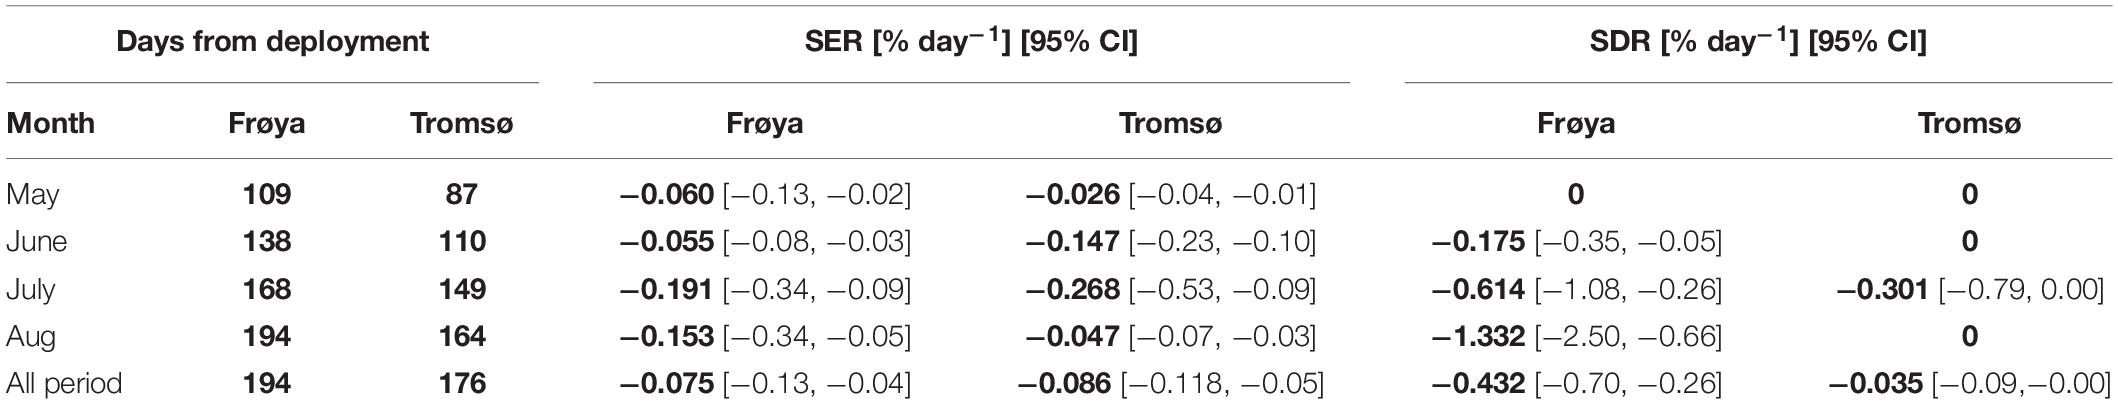
Table 2. Comparison of specific rate of erosion (SER) and dislodgement (SDR) between Frøya and Tromsø February deployment (for selected months), and for the whole experimental period.
The SERs and SDRs for the whole experimental period are also shown in Table 2. The overall SERs [mean (95% CI)] were −0.075 [−0.13, −0.04]% day–2 and −0.086 [−0.118, −0.05]% day–2 for Frøya and for Tromsø February deployment, respectively. The overall SDRs were −0.432 [−0.70, −0.26]% day–2 for Frøya, and −0.035 [−0.09,−0.00]% day–2 for Tromsø February deployment. By testing the differences between these rates for Frøya and Tromsø with bootstrapping tests it was shown that erosion rates were not significantly different (Figure 6A), while dislodgement rates were significantly different (p < 0.001) (Figure 6B).
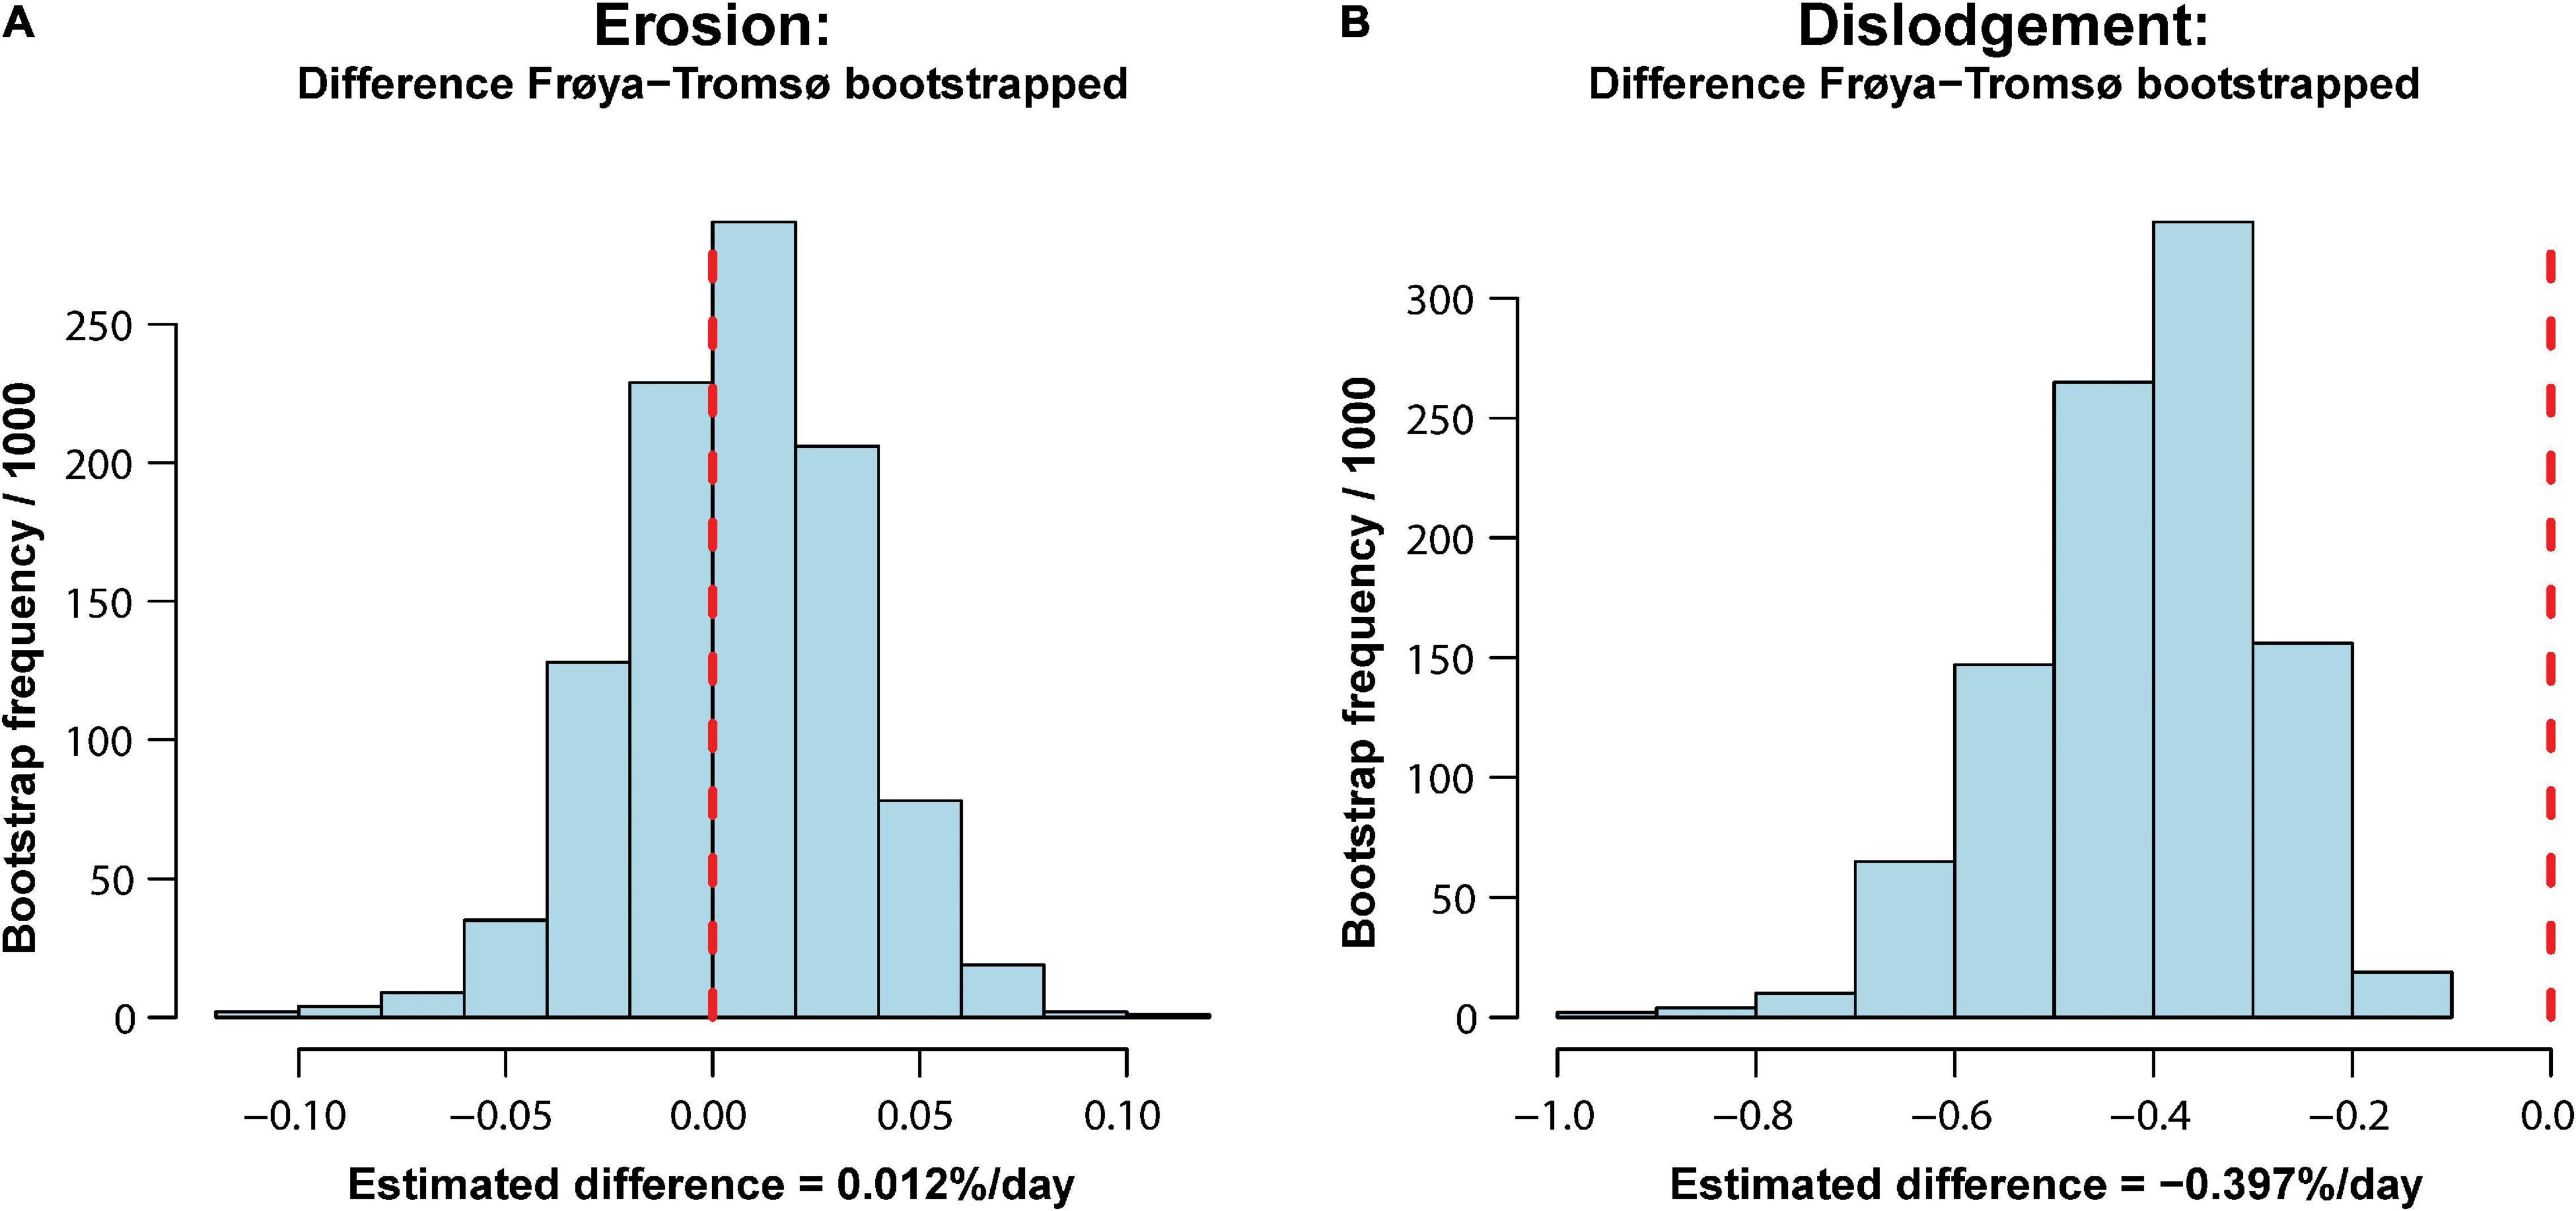
Figure 6. Histograms showing outcome from bootstrap tests of difference in erosion (A) and dislodgement (B) over the whole experimental period. The vertical dashed line shows the null hypothesis of no difference.
To make data from these sites comparable in an aquaculture perspective, erosion, growth, and production at the optimal time for harvest, e.g., June in Frøya and August in Tromsø should be compared. At the time of harvest in Frøya, the accumulated loss of DW was only 8% of total production (Table 3).
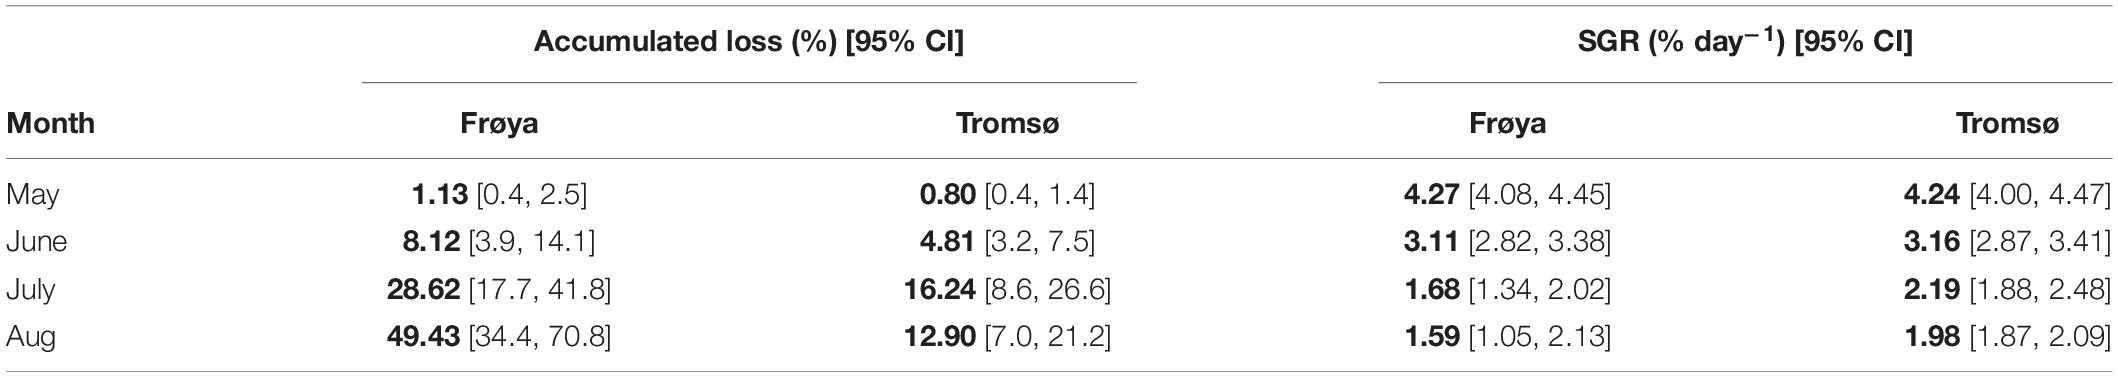
Table 3. Comparison of accumulated loss and SGR between Frøya and Tromsø February deployment for selected months and also showing 95% confidence intervals (CI) for the estimates.
When comparing the February and April deployments in Tromsø (Table 4), results show that the initial erosion rate was high in the April deployment but fell off to low similar levels as the February deployment. Growth rates and losses were of similar magnitude. For the April deployment no dislodgement occurred.
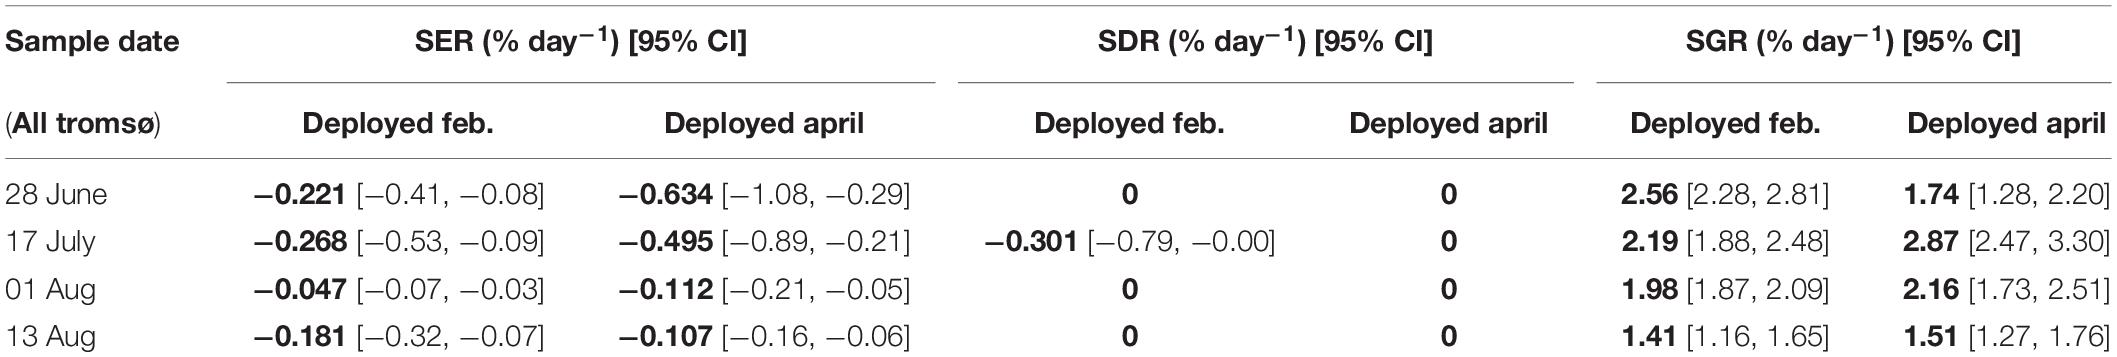
Table 4. Comparison of specific rates of erosion (SER), dislodgement (SDR), and growth (SGR) between Tromsø February and Tromsø April deployments.
Loss of Frond Sections and Dislodgement
In Figure 7 it is shown that 40–100% of the distal part of the kelp fronds were partially eroded between every sampling date, except for Frøya (A) in May. On 8 June all the fronds showed erosion in Tromsø’s February deployment. Still, the biomass effected here was very small because only 31% of the complete sections S2 (also including sections S1), and 34% of complete sections S1 had been lost. Another 35% of sections S1 were only slightly eroded.
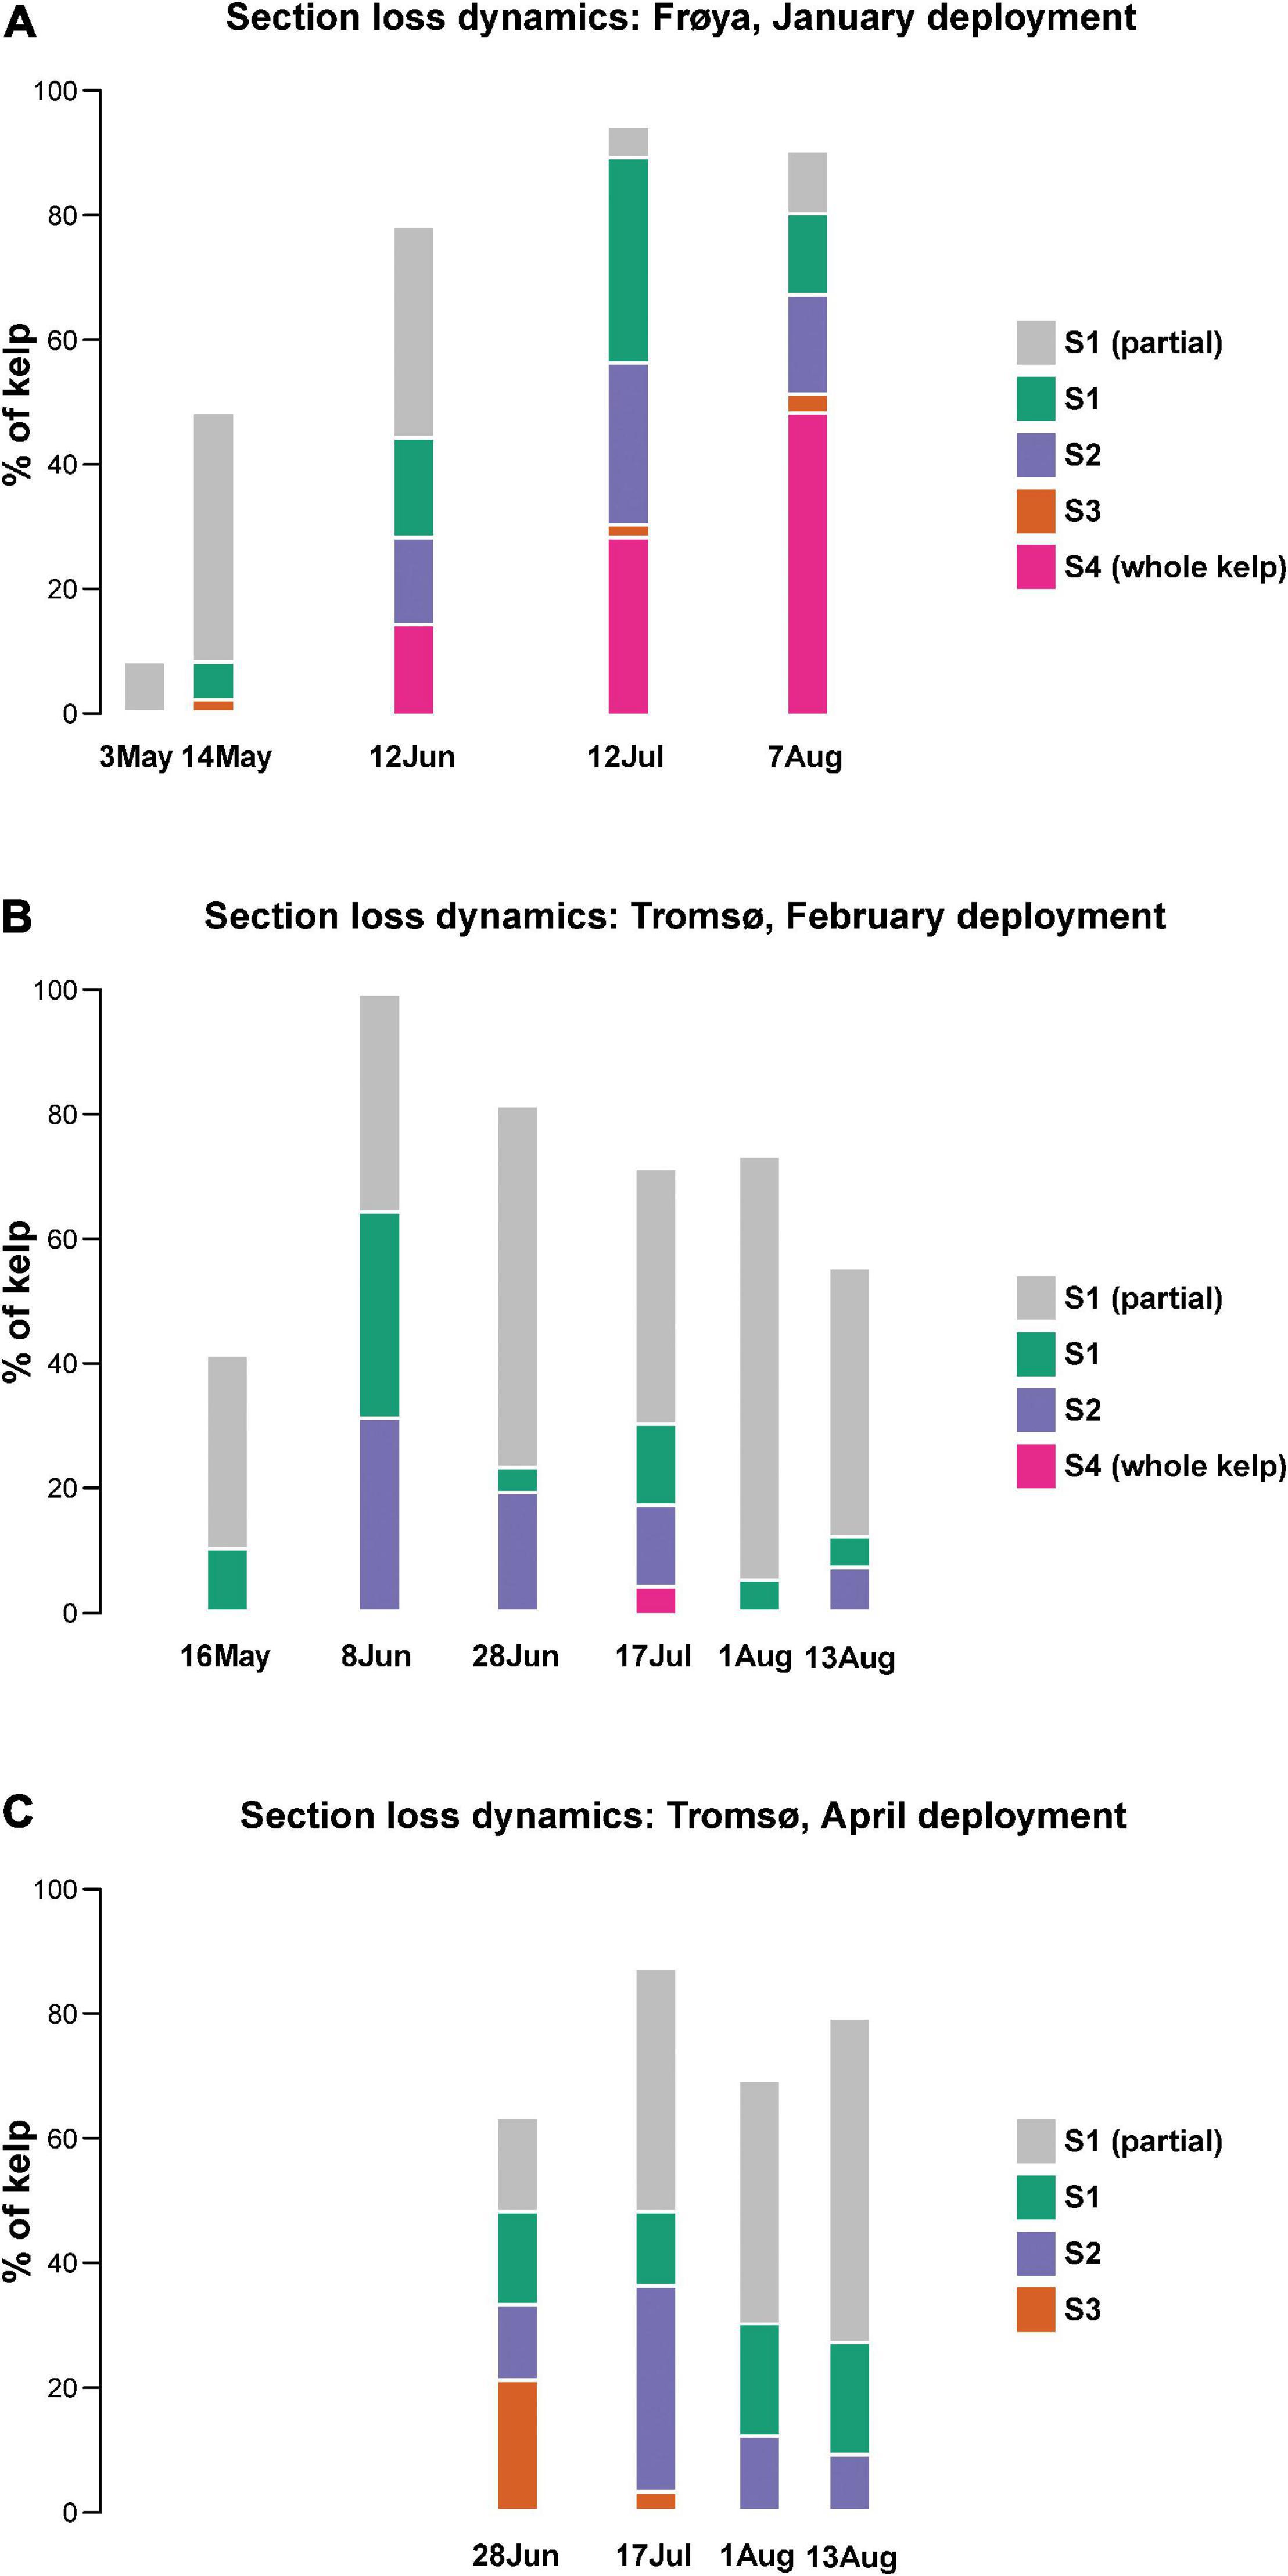
Figure 7. Loss of sections in (A) Frøya, (B) Tromsø, February deployment, and (C) Tromsø, April deployment.
The distal sections S1 and S2 together represent 10% of the length of any sampled frond. Generally, less than 30% of all sections S2 were eroded during each sampling period which gave rise to little erosion.
This pattern of tissue loss was consistent for all sites and sampling periods, except from Frøya. In Frøya, dislodgement rapidly increased to 14% in June, 28% in July and 48% in August (Figure 7A – Sections 4). These percentages refer to the standing stock at the beginning of each sampling period. Hence, the accumulated loss for these 2 months in Frøya was 68% of all sporophytes and was caused by dislodgement of complete fronds. In contrast, kelp deployed in Tromsø did not show any loss of the largest frond sections S3 and S4 for either June or August.
Increment of Length Between Punch-Holes
For sporophytes attached on the ropes throughout the whole experimental period, a significant increment of length between older punch-holes beyond the meristem was found in all data sets from 2018. However, these length increments mainly appeared between the newest and the previous punch-hole (Table 5). The reason for this could be that the newest hole was punched slightly inside the meristem and that growth occurred on both sides. Almost no additional increment was registered beyond the two holes closest to the meristem.
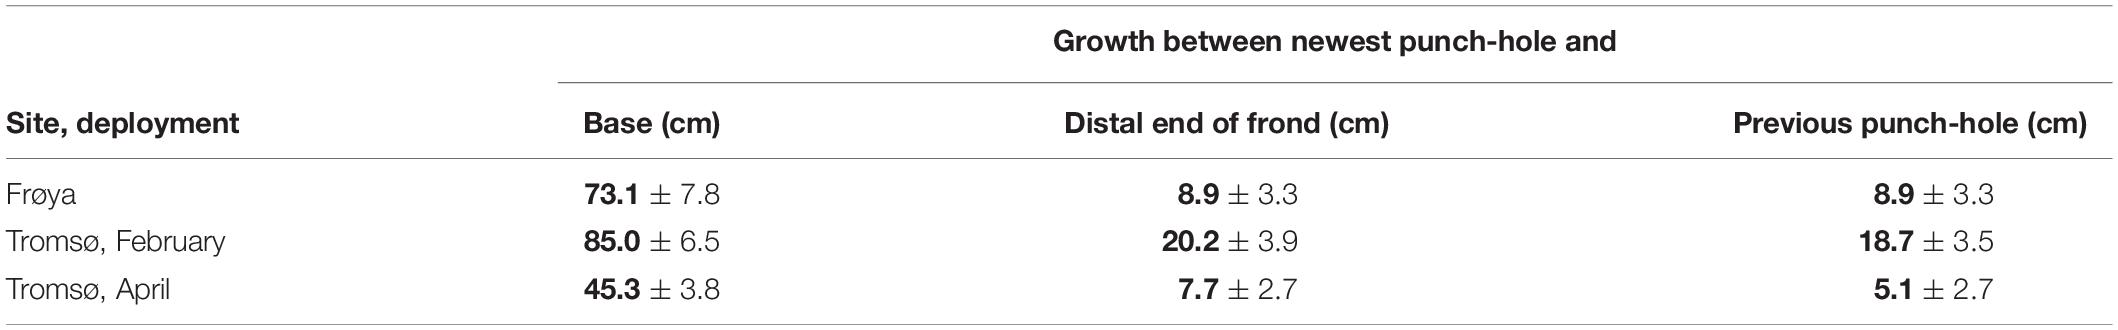
Table 5. Accumulated observed length increment (mean ± 95% ME) for non-dislodged kelp for the whole experimental period, means in bold.
Growth and Loss Measured by Changes in Length Increment
Analysis of length data revealed that sporophytes at the rigs in Frøya showed heavy losses after June (Table 6) while both Tromsø deployments were much less affected. If one uses the ratio of lost length (LL) over produced length (LGE) (last column in Table 6), Frøya showed higher length loss by August than total seasonal length production.
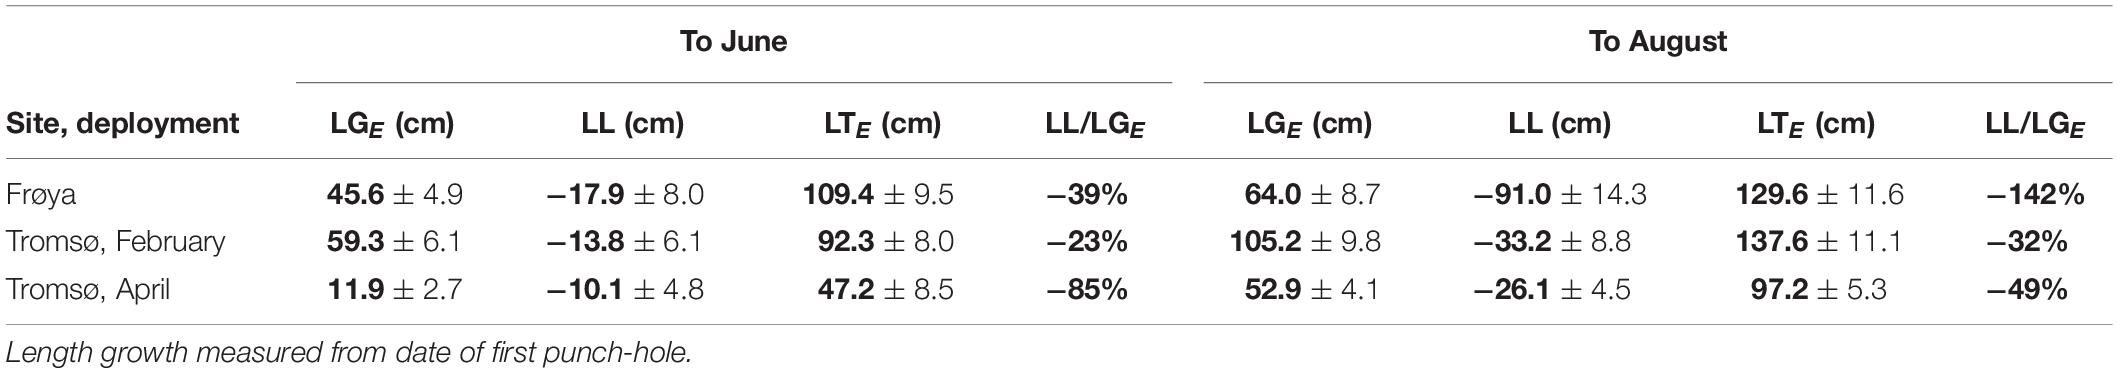
Table 6. Expected length growth (LGE), length loss (LL), total expected length (LTE) in cm (mean ± 95% ME), and loss as percent of expected length growth, means in bold.
The length loss for kelp fronds in Frøya was 142% of the gross length growth. Hence, some of the initial kelp from before application of the first punch-hole in May was lost. But in terms of DW Frøya lost 49.4 [34.4, 70.8]% of gross growth. Consequently, the interpretation of length data has limitations which the comparison from losses based on DW underlines.
Discussion
Dynamics of Loss and Production
Analyses of length data show that the losses observed in our experiments are mainly of two types, distal erosion, and dislodgement of whole sporophytes. Parts of seaweed fronds may also break off without complete dislodgement (Zhang et al., 2012), but this occurred only to a small extent in the present study. During the main growing season for kelp aquaculture production from February to June, the continuous partial erosion of the distal parts from most sporophytes included less than 10% of the total frond length with low DW. This resulted in low specific erosion rates (SER). The April deployment in Tromsø showed higher SERs in June but these were low again in August to levels around 0.1% day–1. For the kelp that was deployed early in the season, specific growth rates (SGR) largely exceeded the erosion rates during this period. High growth and low erosion rates ensured high production and a steady increase of standing biomass like in natural kelp forests (Dean and Hurd, 2007; Krumhansl and Scheibling, 2011; Nielsen et al., 2016b), and for aquaculture rigs (Yoshikawa et al., 2001; Zhang et al., 2012).
At the Frøya site, which is more than 800 km south of Tromsø, losses were from June on primarily due to the dislodgment of entire kelp fronds resulting in high specific dislodgement rates (SDR), but only a slightly increased specific erosion rate. In Tromsø, the SDR stayed low until the end of the growing season. These results are different from what Zhang et al. (2012) reported where erosion was the main cause for loss of biomass. The currents in Tromsø and Frøya are of moderate strength, and both sites are sheltered from wave exposure. Reported dislodgement velocity and dislodgement wave height for Saccharina sp. are higher than generally observed at these sites (Kawamata, 2001; Buck and Buchholz, 2005). Hence, one would not expect that hydrodynamic forces alone would lead to dislodgement of the sporophytes.
Given that the development regarding biofouling, temperature and C/N ratio in 2017 was similar as in 2018, temperature and the intensity of biofouling are expected to be lower in July and August in Tromsø than in Frøya. Also, the C/N ratio would increase 6 weeks later in Tromsø than at the site in Frøya. Biofouling has been recognized as a plausible cause for kelp loss (Scheibling and Gagnon, 2009; Andersen et al., 2011; Krumhansl and Scheibling, 2011). In our experiments the season for onset and increase of biofouling also coincided with the rise in kelp loss. Furthermore, S. latissima is a cold-water species, experiencing reduced tissue strength after exposure to 14°C for 3 weeks (Simonson et al., 2015). Temperatures at this level were never reached at the site in Tromsø during the experiment, while in Frøya median temperatures rose above 14°C in August 2017. A possible weakening of tissue in Frøya can act synergistically with biofouling and cause dislodgement. It has been suggested that seaweeds in general are more sensitive to environmental changes, like biofouling, when their intracellular nitrogen reserves are exhausted (Gerard, 1997; Gao et al., 2013). The nutritional history of the sporophytes is of great importance for their ability to take up available nutrients and sustain growth when the ambient nutrient concentration becomes limiting (Forbord et al., 2021), happening earlier in the south compared to the north of Norway due to the phytoplankton blooming in a south to north gradient (Broch et al., 2019). The weakening caused by these factors can increase losses due to mechanical stress from handling in kelp farms.
Increased SDR and SER in Frøya led to a loss of gross produced biomass of 49% by August, while the February deployment in Tromsø accounted for 13% loss of gross production. To avoid heavy losses and reduced quality of the kelp, the farmers in Frøya are usually harvesting the kelp before the middle of June. In Tromsø, loss due to erosion and dislodgement was moderate throughout the whole growing season and the farmers could harvest the biomass until August, allowing for an extended growing season which would increase total harvested yield. When comparing growth and production at the appropriate time for harvest which is before the middle of June in Frøya, the accumulated loss of dry weight was only 8% of total production.
Losses between 8 and 13% dry matter of annual production in aquaculture is a much lower figure than losses observed for natural kelp forests that often turn over most of its biomass yearly due to both frond erosion, dislodgement and lamina casts (Tala and Edding, 2005; Krumhansl and Scheibling, 2011; Nielsen et al., 2016b; Pedersen et al., 2020). However, these natural forests consist of kelp of all ages while cultivated kelp are all less than one year old. The relevant loss rates for the cultivated kelp fronds are the losses before harvesting. This can be influenced by the seaweed farmer who can initiate harvest before biofouling has reached destructive levels, and before the structures of sporophytes are weakened by either aging, high temperatures or low nitrogen levels, all of which can lead to lower resistance against mechanical stress during handling. If the kelp biomass is not harvested in due time, extremely high dislodgement rates can be observed. The specific rate of loss in Frøya in August was 1.55% day–1. With such losses one would lose close to 40% of the standing biomass within one month and over 75% within 3 months. In fact, losses of 100% have been observed when inspecting rigs later in the season.
When compared with other studies on cultivated kelp, the losses observed here are substantially lower. Losses of 43 and 58% of WW for June and July, respectively, have been reported before harvest for cultivated S. japonica (Zhang et al., 2012). Suzuki et al. (2008) refer to erosion rates (WW) with maximum losses between 2.4 and 3.7 g day–1. For kelp in our experiment, losses would not exceed 0.25 g day–1 in Frøya before the month of July and never got this high in Tromsø. For the culture of U. pinnatifida, 19% of produced tissue C and 33% of produced tissue N were lost before harvest (Yoshikawa et al., 2001). Both cited studies conclude that kelp aquaculture is releasing a substantial amount of organic matter to the environment.
Export of Dry Matter, Carbon, and Nitrogen From Kelp Rigs and Ecological Implications for Aquaculture
The detrital production from cultivated kelp can be calculated based on growth, erosion, and dislodgement rates, as presented in this study. The calculations presented here are scenarios for two typical cases of normal production for harvest in Frøya and Tromsø, and one worst-case scenario from Frøya where the rigs would be harvested as late as August. These cases are projected to commercial scale kelp farms. Optimal timing of harvest will depend on the market perspective but would biologically be in June in Frøya and in August in Tromsø. It would in the example we have chosen in our scenario, yield approximately 100 tons of harvestable dry matter of kelp per year which is equivalent to 652 tons wet kelp in Frøya and 765 tons wet kelp in Tromsø (Table 7). The measured average DW content in 2017 in Tromsø (15%) was lower than in Frøya (19%) and explains why more produced WW is incorporated in the equations for Tromsø. This difference is probably caused by the early onset of biofouling in Frøya. For the worst-case scenario, 98 tons out of 198 produced tons of dry matter could be lost in Frøya (Table 7).
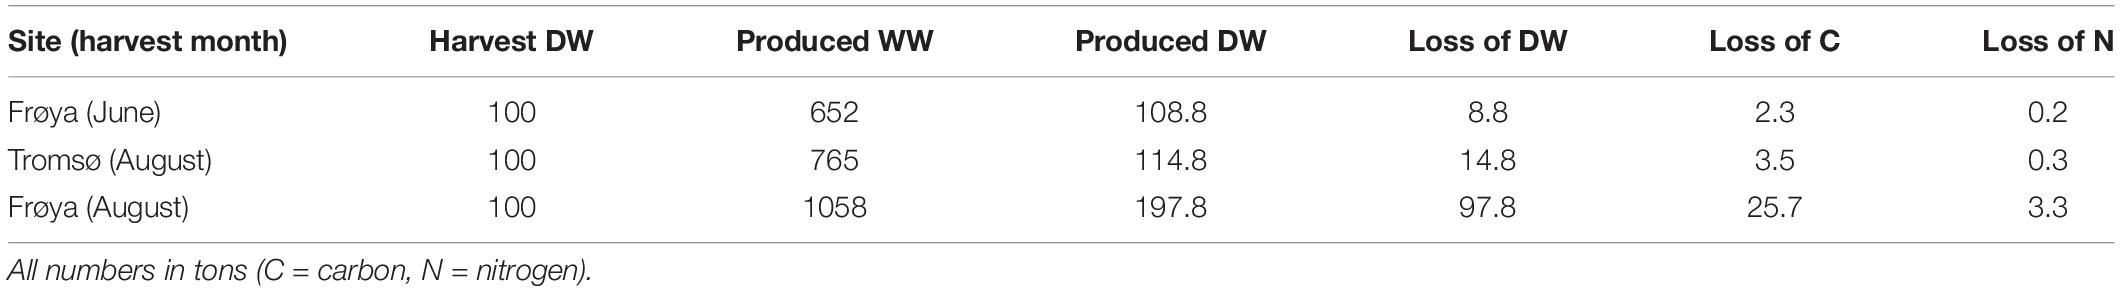
Table 7. Export scenarios from kelp rigs for 100 tons harvestable dry matter per production season.
A kelp farm covering an area of 4 hectares with rigs could produce the above-mentioned quantities of kelp biomass with a production of roughly 200 tons wet kelp per hectare (Broch et al., 2019). The annual detrital production from our scenarios would be between 63 and 88 g C m–2 and 5 and 8 g N m–2 of the area covered by the kelp farm. In the worst-case scenario, the losses would contribute with 643 g C m–2 and 83 g N m–2 of detritus in the production area. During normal production, these export figures are 5 to 8 times lower than detritus production from natural kelp forests of L. hyperborea with an estimated detrital production of 478 ± 41 g C m–2 year–1 in a dense forest outside Tromsø (Pedersen et al., 2020). Global estimates of detrital production from natural kelp forests are between 225 and 750 g C m–2 year–1 (Krumhansl and Scheibling, 2012). Kelp fragments have a low specific weight and can travel over long distances while slowly sinking toward the bottom (Wernberg and Filbee-Dexter, 2018). Hence, it is likely that sedimentation and thus the carbon input per square meter seafloor will be lower than the calculations above are suggesting. The heavy losses in July and August in Frøya, which are mainly due to dislodgement of whole fronds, will lead to detaching particles of larger size with different properties during the sedimentation processes than eroded tips from fronds. Our experiments also show that substantially lower export of carbon and nitrogen is possible from aquaculture to the environment, than previously published. Zhang et al. (2012) have reported an annual export of 500 g C m–2 detritus from culture of S. japonica in Sungo Bay. In Frøya the annual release of carbon would be 63 g C m–2 which is 12.6% of the value in Sungo Bay. One should here keep in mind that physical conditions, latitude, temperature, the nature of the cultured species, mass culture techniques and adjacent ecosystems are different between China and Norway.
In the same way as for salmon farming, our work illustrates that the export of organic matter from kelp aquaculture installations is highly dependent on its operational management (Carroll et al., 2003). Optimal timing of harvest in the context of market perspectives is the key factor for keeping erosion and dislodgement on lowest possible levels. Heavy losses from kelp farms and inferior quality due to biofouling have a negative effect on the economy and on the environment. The kelp farmers have different means for avoiding biofouling. In Asian aquaculture the farmers deploy summer seedlings in autumn, which allows for an early harvest in the grow-out season in the following year before the onset of biofouling (Lüning and Mortensen, 2015). While this method is used in Frøya, it would result in pure growth in Arctic Tromsø because of the lack of sunlight during the Polar Night. As an alternative, the farmers could keep close control on the coverage of organisms associated with biofouling (Matsson et al., 2019, 2021; Forbord et al., 2020). A high coverage with fouling organisms could in some cases be a warning for destructive biofouling and processes which weaken the tissue, and the harvest should be commenced as soon as possible. The percentage of cover would depend on the commercial interest, e.g., for use of kelp for human consumption, one would ideally want close to no fouling at all. The seaweed farmers have everything to win by choosing the optimal time for harvesting by employing methods for monitoring the extent of biofouling and the nutritional state of the kelp. For sites where the summer sporeling method is not available, an early warning system based on the monitored extent of biofouling and high C/N ratios in the kelp tissue could thus become the key to effective environmental management, maximal harvest yields and minimal environmental impact.
Recently, macroalgae cultivation has been suggested as a contributing solution to climate change mitigation and adaptation as it releases and exports carbon that eventually is buried in the seafloor or exported to the deep sea (Duarte et al., 2017). With an 8–13% loss of biomass as found in this study at early harvest (Figure 5), and cultivation volumes as of today in Norway and Europe (<2000 tons WW per year, FAO, 2020) the carbon release would be relatively small, and so would be the environmental footprint and the carbon sequestration potential. Nevertheless, the seaweed cultivation industry is rapidly expanding and Olafsen et al. (2012) projected that Norwegian kelp harvest alone can reach 4 mill tons per year by 2030. If harvested late in the season, which could be relevant for high-volume low-cost production of biomass for chemical components extraction (proteins, carbohydrates, metabolites), the carbon export would increase to 30–50% loss by the end of the growth season (Figure 5). Assuming a 30% loss of 4 mill tons harvested biomass the carbon export would be 53,000 tons C per year. For the carbon to be sequestered it needs to be permanently buried and made unavailable for turnover by the biosphere. In a global assessment of the fate of carbon from natural macroalgae forests, it appears that approximately 15% (0–36%) of the exported biomass from macroalgae beds is neither consumed nor decomposed and thus is permanently sequestered (Krause-Jensen and Duarte, 2016). Assuming that this applies to cultivated kelp it corresponds to 8,000 tons C sequestered each year, which again is equivalent to a mitigation potential of 29,000 tons CO2, or the annual emission of 2,900 average Norwegian citizens (SSB, 2018). If kelp is managed as a high-quality food product with harvest early in the growth cycle, the carbon export and sequestration potential is relatively small. But a late-harvested bulk industrial production could export four to six times as much carbon.
Thus, kelp cultivation represents a nature-based solution for CO2 drawdown from the atmosphere to be permanently sequestered in the ocean seafloor and provides a potential for using algae cultivation for climate mitigation. Depending on the time of harvest, this process will sequester carbon in amounts directly scalable to the harvested biomass and thereby provide an additional ecosystem service to kelp cultivation as mitigating climate warming. Current publications and scientific speculations suggest that seafloor carbon sequestration from macroalgae is increasingly pronounced at low water temperatures, which implies that the potential for kelp carbon sequestration increases with higher latitudes (Frigstad et al., 2021). This makes Norway in general and the Tromsø and Barents Sea region in Northern Norway especially interesting as an area for kelp cultivation for carbon sequestration. There are, however, still major uncertainties and knowledge gaps about the proportion of kelp carbon actually sequestrated at the seafloor and in the deep sea, including regional dependencies, the effect of species, the chemical composition of biomass, transport ways, and degradation time in the water column while sinking.
Methodological Findings and Recommendations
A significant increment of length between older punch-holes beyond the meristem was detected in our study. But our data showed that this additional increment mainly occurred between the newest and the second newest punch-hole. This additional increment might be caused by the newest hole being punched slightly inside the meristem, and growth could occur on both sides of the hole. By measuring the distance between all punch-holes, a correction for these increments was applied in this study. To correct for length increment beyond the newest punch-hole we recommend that the length increment between several of the older holes on the frond should also be measured.
The morphological plasticity of S. latissima is well known. The species show highly variable biometric traits of the frond which are influenced by the physical conditions of their habitat (Parke, 1948; Lüning, 1979; Gerard, 1987; Bartsch et al., 2008). Consequently, even when measuring the width of the frond along a line where erosion might have occurred, the biometry of lost parts of the fronds cannot be inferred and cannot be used reliably in the calculation of the area of lost dry matter. The only reliable measurement for erosion is the eroded length of the frond, calculated by the punch-hole method. The analysis of the DW of the sections of kelp fronds showed a significant difference in the length to DW relationship for different sections, depending on the distance from the stipes. The application of a general length to DW model (Zhang et al., 2012) or an area specific DW coefficient (Nielsen et al., 2016a), derived from the whole frond, could thus bias the conversion for the distal parts of the fronds of measured length data to DW. The conversion of length to DW for distal tissue described by Tala and Edding (2005) and Krumhansl and Scheibling (2011) is more precise but has the disadvantage of being destructive to the fronds and would rule out the possibility to follow the same individually marked frond through the entire experiment. By applying the sectional regression models presented here, it was possible to predict dry weight of the lost fronds with a relative error of −23.7 to +28.3% without being dependent on width data. Using a randomized loss simulation on our data set, where width along a line between sections was reliably measured, revealed that the relative error by excluding width data was increased by only 8.8% points. As width cannot be measured directly from the lost parts in field experiments, the application of this sectional regression method can be a valuable tool in future erosion experiments.
Our results do not support the observation that specific erosion rates depend on sporophyte size (Sjøtun, 1993) or on temperature (Suzuki et al., 2008). Specific daily dislodgement rates were, with one exception, zero until the middle of August, and specific erosion rates were below −0.27% throughout the experiment with kelp deployed in February in Tromsø. In Frøya, specific erosion and dislodgment rates were close to zero until May, increasing to −0.2% day–1 for erosion and −1.3% day–1 for dislodgement in August. Broch et al. (2013) discuss that their model was overestimating the size of sporophytes during the summer months and suggest that alternative parameters for erosion (Broch and Slagstad, 2012) should be included.
Conclusion
When compared with other studies on cultivated kelp, the losses observed in our experiments are substantially lower. Our work illustrates that the export of organic matter from kelp aquaculture installations is highly dependent on its operational management, e.g., timing of harvest. If the kelp industry is managed for a high-quality food commodity, the carbon export and sequestration potential is relatively small. In contrast, a late-harvested bulk industrial production could export four to six times as much carbon. Based on our data we suggest that regional, season-dependent specific erosion and dislodgment rates be implemented in production models, and that biofouling be included as a parameter in model equations.
Data Availability Statement
The raw data supporting the conclusions of this article will be made available by the authors, without undue reservation.
Author Contributions
RF contributed to all aspects and was the primary author. MG was responsible for statistical analysis and graphics and contributed to the text. SM was responsible for sampling and laboratory analysis, assisted with the original concept, and contributed to the text. KH assisted with the original concept and contributed to the text and was project leader of the main RCN funded project KelpPro. LN was responsible for sampling in Frøya and contributed to the text. SF contributed data from 2017 and contributed to the text. All authors contributed to the article and approved the submitted version.
Funding
This work was funded by the Research Council of Norway, project no. 267536 (KELPPRO, Kelp industrial production: Potential impacts on coastal ecosystems).
Conflict of Interest
The authors declare that the research was conducted in the absence of any commercial or financial relationships that could be construed as a potential conflict of interest.
Publisher’s Note
All claims expressed in this article are solely those of the authors and do not necessarily represent those of their affiliated organizations, or those of the publisher, the editors and the reviewers. Any product that may be evaluated in this article, or claim that may be made by its manufacturer, is not guaranteed or endorsed by the publisher.
Acknowledgments
We are grateful to Akvaplan-niva in Tromsø and Seaweed Solutions AS in Trondheim for contributing with infrastructure and co-financing.
Supplementary Material
The Supplementary Material for this article can be found online at: https://www.frontiersin.org/articles/10.3389/fmars.2021.632725/full#supplementary-material
References
Andersen, G. S., Pedersen, M. F., and Nielsen, S. L. (2013). Temperature acclimation and heat tolerance of photosynthesis in norwegian saccharina latissima (Laminariales. Phaeophyceae). J. Phycol. 49, 689–700. doi: 10.1111/jpy.12077
Andersen, G. S., Steen, H., Christie, H., Fredriksen, S., and Moy, F. E. (2011). Seasonal Patterns of Sporophyte Growth, fertility, fouling, and mortality of saccharina latissima in skagerrak, norway: implications for forest recovery. J. Mar. Biol. 2011:375. doi: 10.1155/2011/690375
Bartsch, I., Wiencke, C., Bischof, K., Buchholz, C. M., Buck, B. H., Eggert, A., et al. (2008). The genus Laminaria sensu lato: recent insights and developments. Eur. J. Phycol. 43, 1–86. doi: 10.1080/09670260701711376
Bolton, J. J., and Lüning, K. (1982). Optimal growth and maximal survival temperatures of Atlantic Laminaria species (Phaeophyta) in culture. Mar. Biol. 66, 89–94. doi: 10.1007/BF00397259
Broch, O. J., Alver, M. O., Bekkby, T., Gundersen, H., Forbord, S., Handå, A., et al. (2019). The kelp cultivation potential in coastal and offshore regions of norway. Front. Mar. Sci. 5:529. doi: 10.3389/fmars.2018.00529
Broch, O. J., and Slagstad, D. (2012). Modelling seasonal growth and composition of the kelp Saccharina latissima. J. Appl. Phycol. 24, 759–776. doi: 10.1007/s10811-011-9695-y
Broch, O. J., Ellingsen, I. H., Forbord, S., Wang, X., Volent, Z., Alver, M. O., et al. (2013). Modelling the cultivation and bioremediation potential of the kelp Saccharina latissima in close proximity to an exposed salmon farm in Norway. Aquacult. Environ. Interact. 4, 187–206. doi: 10.3354/aei00080
Buck, B. H., and Buchholz, C. M. (2005). Response of offshore cultivated Laminaria saccharina to hydrodynamic forcing in the North Sea. Aquaculture 250, 674–691. doi: 10.1016/j.aquaculture.2005.04.062
Carroll, M., Cochrane, S., Fieler, R., Velvin, R., and White, P. (2003). Organic enrichment of sediments from salmon farming in norway: environmental factors, management practices, and monitoring techniques. Aquaculture 226, 165–180. doi: 10.1016/S0044-8486(03)00475-7
Chopin, T., Troell, M., Reid, G. K., Knowler, D., Robinson, S. M. C., Neori, A., et al. (2010). Integrated Multi-Trophic Aquaculture. Part II. Increasing IMTA Adoption. Global Aquaculture Advocate. Portsmouth: Global Seafood Alliance.
Dambolena, I. G., Eriksen, S. E., and Kopcso, D. P. (2009). Logarithmic transformations in regression: do you transform back correctly? Primus 19, 280–295. doi: 10.1080/10511970802234976
Dean, P. R., and Hurd, C. L. (2007). Seasonal growth, erosion rates, and nitrogen and photosynthetic ecophysiology of Undaria pinnatifida (Heterokontophyta) in Southern New Zealand. J. Phycol. 43, 1138–1148. doi: 10.1111/j.1529-8817.2007.00416.x
Duarte, C. M., and Cebrián, J. (1996). The fate of marine autotrophic production. Limnol. Oceanogr. 41, 1758–1766. doi: 10.4319/lo.1996.41.8.1758
Duarte, C. M., Wu, J., Xiao, X., Bruhn, A., and Krause-Jensen, D. (2017). Can seaweed farming play a role in climate change mitigation and adaptation? Front. Mar. Sci. 4:100. doi: 10.3389/fmars.2017.00100
FAO (2020). The State of World Fisheries and Aquaculture 2020: Sustainability in Action. Rome: FAO. Available online at: https://doi.org/10.4060/ca9229en
Forbord, S., Etter, S. A., Broch, O. J., Dahlen, V. R., and Olsen, Y. (2021). Initial short-term nitrate uptake in juvenile, cultivated Saccharina latissima (Phaeophyceae) of variable nutritional state. Aquat. Bot. 168:103306. doi: 10.1016/j.aquabot.2020.103306
Forbord, S., Matsson, S., Brodahl, G. E., Bluhm, B. A., Broch, O. J., Handå, A., et al. (2020). Latitudinal, seasonal and depth-dependent variation in growth, chemical composition and biofouling of cultivated Saccharina latissima (Phaeophyceae) along the Norwegian coast. J. Appl. Phycol. 32, 2215–2232. doi: 10.1007/s10811-020-02038-y
Fortes, M. D., and Lüning, K. (1980). Growth rates of North Sea macroalgae in relation to temperature, irradiance and photoperiod. Helgol. Wiss. Meeresunters. 34, 15–29. doi: 10.1007/BF01983538
Frigstad, H., Gundersen, H., Andersen, G. S., Borgersen, G., Kvile, K. Ø, Krause-Jensen, D., et al. (2021). Blue Carbon – climate adaptation, CO2 uptake and sequestration of carbon in Nordic blue forests. Nordic Council Ministers Rep. Ser. 2020:541.
Gao, X., Endo, H., Taniguchi, K., and Agatsuma, Y. (2013). Combined effects of seawater temperature and nutrient condition on growth and survival of juvenile sporophytes of the kelp Undaria pinnatifida (Laminariales; Phaeophyta) cultivated in northern Honshu, Japan. J. Appl. Phycol. 25, 269–275. doi: 10.1007/s10811-012-9861-x
Gerard, V. A. (1987). Hydrodynamic streamlining of Laminaria saccharina Lamour. in response to mechanical stress. J. Exp. Mar. Biol. Ecol. 107, 237–244. doi: 10.1016/0022-0981(87)90040-2
Gerard, V. A. (1997). The role of nitrogen nutrition in high-temperature tolerance of the kelp, Laminaria saccharina (Chromophyta). J. Phycol. 33, 800–810. doi: 10.1111/j.0022-3646.1997.00800.x
Gerard, V. A., and Du Bois, K. R. (1988). Temperature ecotypes near the southern boundary of the kelp Laminaria saccharina. Mar. Biol. 97, 575–580. doi: 10.1007/BF00391054
Greenacre, M. (2016). Data reporting and visualization in ecology. Polar Biol. 39, 2189–2205. doi: 10.1007/s00300-016-2047-2
Handå, A., Forbord, S., Wang, X., Broch, O. J., Dahle, S. W., Størseth, T. R., et al. (2013). Seasonal- and depth-dependent growth of cultivated kelp (Saccharina latissima) in close proximity to salmon (Salmo salar) aquaculture in Norway. Aquaculture 41, 191–201. doi: 10.1016/j.aquaculture.2013.08.006
Kawamata, S. (2001). Adaptive mechanical tolerance and dislodgement velocity of the kelp Laminaria japonica in wave-induced water motion. Mar. Ecol. Prog. Ser. 211, 89–104. doi: 10.3354/meps211089
Krause-Jensen, D., and Duarte, C. M. (2016). Substantial role of macroalgae in marine carbon sequestration. Nat. Geosci. 9, 737–742.
Krumhansl, K. A., and Scheibling, R. E. (2011). Detrital production in Nova Scotian kelp beds: patterns and processes. Mar. Ecol. Prog. Ser. 421, 67–82. doi: 10.3354/meps08905
Krumhansl, K. A., and Scheibling, R. E. (2012). Production and fate of kelp detritus. Mar. Ecol. Prog. Ser. 467, 281–302. doi: 10.3354/meps09940
Lane, C. E., Mayes, C., Druehl, I. D., and Saunders, G. W. (2006). A multi–gene molecular investigation of the kelp (Laminariales, Phaeophyceae) supports substantial reorganisation. J. Phycol. 42, 493–512. doi: 10.1111/j.1529-8817.2006.00204.x
Liu, Y., Huang, H., Yan, L., Liu, X., and Zhang, Z. (2016). Influence of suspended kelp culture on seabed sediment composition in Heini Bay, China. Estuar. Coastal Shelf Sci. 181, 39–50. doi: 10.1016/j.ecss.2016.07.017
Lüning, K. (1979). Growth strategies of three Laminaria species (Phaeophyceae) inhabiting different depth zones in the sublittoral region of Helgoland (North Sea). Mar. Ecol. Prog. Ser. 1, 195–207. doi: 10.3354/meps001195
Lüning, K., and Mortensen, L. (2015). European aquaculture of sugar kelp (Saccharina latissima) for food industries: iodine content and epiphytic animals as major problems. Bot. Mar. 58, 449–455. doi: 10.1515/bot-2015-0036
Mann, K. H. (1973). Seaweeds: their productivity and strategy for growth. Science 182, 975–981. doi: 10.1126/science.182.4116.975
Matsson, S., Christie, H., and Fieler, R. (2019). Variation in biomass and biofouling of kelp, Saccharina latissima, cultivated in the Arctic, Norway. Aquaculture 506, 445–452. doi: 10.1016/j.aquaculture.2019.03.068
Matsson, S., Metaxas, A., Forbord, S., Kristiansen, S., Handå, A., and Bluhm, B. A. (2021). Effects of outplanting time on growth, shedding and quality of Saccharina latissima (Phaeophyceae) in its northern distribution range. J. Appl. Phycol. 33, 2415–2431. doi: 10.1007/s10811-021-02441-z
Nielsen, M. M., Krause-Jensen, D., Olesen, B., Thinggaard, R., Christensen, P. B., and Bruhn, A. (2016a). Growth dynamics of Saccharina latissima (Laminariales, Phaeophyceae) in Aarhus Bay, Denmark, and along the species’ distribution range. Mar. Biol. 161, 2011–2022. doi: 10.1007/s00227-014-2482-y
Nielsen, M. M., Paulino, C., Neiva, J., Krause-Jensen, D., Bruhn, A., and Serrão, E. A. (2016b). Genetic diversity of Saccharina latissima (Phaeophyceae) along a salinity gradient in the North Sea-Baltic Sea transition zone. J. Phycol. 28, 3071–3074.
Olafsen, T., Winther, U., Olsen, Y., and Skjermo, J. (2012). Value created from productive oceans in 2050. The Royal Norwegian Society of Sciences and letters and the Norwegian Academy of Technological Sciences.
Parke, M. (1948). Studies of british laminariaceae. I. growth in Laminaria saccharina (L.) Lamour. J. Mar. Biol. Assoc. 27, 651–709. doi: 10.1017/S0025315400056071
Pedersen, M. F., Filbee-Dexter, K., Norderhaug, K. M., Fredriksen, S., Frisk, N. L., Fagerli, C. W., et al. (2020). Detrital carbon production and export in high latitude kelp forests. Oecologia 192, 227–239. doi: 10.1007/s00442-019-04573-z
Scheibling, R. E., and Gagnon, P. (2009). Temperature-mediated outbreak dynamics of the invasive bryozoan Membranipora membranacea in Nova Scotian kelp beds. Mar. Ecol. Prog. Ser. 390, 1–13. doi: 10.3354/meps08207
Simonson, E., Scheibling, R., and Metaxas, A. (2015). Kelp in hot water: I. warming seawater temperature induces weakening and loss of kelp tissue. Mar. Ecol. Pro. Ser. 537, 89–104. doi: 10.3354/meps11438
Sjøtun, K. (1993). Seasonal lamina growth in two age groups of Laminaria saccharina (L.) Lamour in western Norway. Bot. Mar. 36, 433–441. doi: 10.1515/botm.1993.36.5.433
SSB (2018). Dette er Norge 2018. Available online at: https://www.ssb.no/befolkning/artikler-og-publikasjoner/dette-er-norge-2018
Stévant, P., Rebours, C., and Chapman, A. (2017). Seaweed aquaculture in Norway: recent industrial developments and future perspectives. Aquacult. Int. 25, 1373–1390. doi: 10.1007/s10499-017-0120-7
Suzuki, S., Furuya, K., Kawai, T., and Takeuchi, I. (2008). Effect of seawater temperature on the productivity of Laminaria japonica in the Uwa Sea, southern Japan. J. Appl. Phycol. 20, 833–844. doi: 10.1007/s10811-007-9283-3
Tala, F., and Edding, M. (2005). Growth and loss of distal tissue in blades of Lessonia nigrescens and Lessonia trabeculata (Laminariales). Aquat. Bot. 82, 39–54. doi: 10.1016/j.aquabot.2005.02.009
Trevathan-Tackett, S. M., Kelleway, J., Macreadie, P. I., Beardall, J., Ralph, P., and Bellgrove, A. (2015). Comparison of marine macrophytes for their contributions to blue carbon sequestration. Ecology 96, 3043–3057. doi: 10.1890/15-0149.1
Wernberg, T., and Filbee-Dexter, K. (2018). Grazers extend blue carbon transfer by slowing sinking speeds of kelp detritus. Sci. Rep. 8, 1–7. doi: 10.1038/s41598-018-34721-z
Yoshikawa, T., Takeuchi, I., and Furuya, K. (2001). Active erosion of Undaria pinnatifida suringar (Laminariales, Phaeophyceae) mass-cultured in Otsuchi Bay in northeastern Japan. J. Exp. Mar. Biol. Ecol. 266, 51–65. doi: 10.1016/S0022-0981(01)00346-X
Zhang, J., Fang, J., Wang, W., Du, M., Gao, Y., and Zhang, M. (2012). Growth and loss of mariculture kelp Saccharina japonica in Sungo Bay, China. J. Appl. Phycol. 24, 1209–1216. doi: 10.1007/s10811-011-9762-4
Zhang, J., Hansen, P. K., Wu, W., Liu, Y., Sun, K., Zhao, Y., et al. (2020). Sediment-focused environmental impact of long-term large- scale marine bivalve and seaweed farming in Sungo Bay, China. Aquaculture 528:735561. doi: 10.1016/j.aquaculture.2020.735561
Keywords: Saccharina latissima, macroalgae cultivation, kelp erosion, detritus, carbon sequestration, seaweed aquaculture, sectional regression
Citation: Fieler R, Greenacre M, Matsson S, Neves L, Forbord S and Hancke K (2021) Erosion Dynamics of Cultivated Kelp, Saccharina latissima, and Implications for Environmental Management and Carbon Sequestration. Front. Mar. Sci. 8:632725. doi: 10.3389/fmars.2021.632725
Received: 23 November 2020; Accepted: 04 October 2021;
Published: 28 October 2021.
Edited by:
Camila Fernandez, UMR 7621 Laboratoire d’Océanographie Microbienne (LOMIC), FranceReviewed by:
Nor Azman Kasan, University of Malaysia Terengganu, MalaysiaErasmo Macaya, University of Concepción, Chile
Copyright © 2021 Fieler, Greenacre, Matsson, Neves, Forbord and Hancke. This is an open-access article distributed under the terms of the Creative Commons Attribution License (CC BY). The use, distribution or reproduction in other forums is permitted, provided the original author(s) and the copyright owner(s) are credited and that the original publication in this journal is cited, in accordance with accepted academic practice. No use, distribution or reproduction is permitted which does not comply with these terms.
*Correspondence: Reinhold Fieler, ref@akvaplan.niva.no