Anomalous Reduction of the Total Suspended Matter During the COVID-19 Lockdown in the Hooghly Estuarine System
 Chiranjivi Jayaram1*
  Rajdeep Roy2
  Neethu Chacko1
  Debadatta Swain3
  Ramunaidu Punnana4 S. Bandyopadhyay1 S. B. Choudhury2 Dibyendu Dutta1
- 1Regional Remote Sensing Center–East, National Remote Sensing Centre, Indian Space Research Organisation (NRSC/ISRO), Kolkata, India
- 2National Remote Sensing Center, Indian Space Research Organisation (ISRO), Hyderabad, India
- 3School of Earth, Ocean and Climate Sciences, Indian Institute of Technology Bhubaneswar, Bhubaneswar, India
- 4Centre for Studies on Bay of Bengal, Andhra University, Visakhapatnam, India
The impact of the coronavirus disease 2019 (COVID-19) lockdown in the Hooghly estuarine region, India is assessed using the total suspended matter (TSM) concentration. The estimation of TSM is performed using Landsat-8/operational land imager (OLI), and an intercomparison of TSM load during the pre-lockdown and lockdown periods is done. It is observed that during the lockdown period, TSM reduced by 30–50%. This is a significant observation considering the ecological balance of the region and the fact that it is home to the largest mangroves in the world. This change in suspended matter presumably reflects the influence of reduction in anthropogenic activities owing to the COVID-19 lockdowns, such as industries, closure of shipping activities (through less dredging), and brick kilns (through less sediment removal), which are generally the primary contributors in this region. Even though these observed changes are representative of the positive influence of the COVID-19 lockdown, its implications in estuarine biogeochemistry still remain poorly quantified. The decrease in TSM content may increase light penetration, thereby increasing the primary productivity. In addition, low sediment load reaching the Bay of Bengal could influence the carbon export due to reduction in ballasting effect as reported from this region. In summary, the influence of the COVID-19 lockdown on the biogeochemistry of the aquatic ecosystem appears rather complex than thought earlier and may vary regionally based on local hydrodynamics. The analysis elucidates the complex interplay of regional lockdown and its implication in modulation of local biogeochemistry. However, the relative importance of each process in the Hooghly estuary remains to be fully evaluated.
Introduction
The precise estimation of sediment concentration in the estuaries is imperative to deduce pollution levels, ecological impacts, and erosion in the region. Extensive in situ sampling of the region or satellite-based estimation of the sediments is generally used for this. Remote sensing of total suspended matter (TSM) has gained special importance in coastal water quality-related studies due to the logistical constraints involved in regular in situ sampling of the sediments (Nechad et al., 2010). TSM estimation is carried out by using a variety of satellite sensors at different spatial and temporal resolutions (viz, SeaWiFS, MODIS, MERIS, and OCM) (McClain et al., 2004; Miller and McKee, 2004; Doerffer and Schiller, 2010; Shanthi et al., 2013). However, the data obtained from these sensors are relatively coarse (250 m−1 km) that hampers the estimation of TSM at finer spatial scale in the estuarine areas. Availability of sensors, such as the operational land imager (OLI) onboard Landsat-8, with higher signal to noise ratio, higher radiometric resolution (12-bit), and a spatial resolution of 30 m have provided suitable opportunities for resolving the nearshore sediment and chlorophyll concentration in the recent years (Vanhellemont and Ruddick, 2014; Trinh et al., 2017). These characteristics of Landsat-8 sensor also facilitate the elimination of aerosol contribution and atmospheric correction approach applicable to the global ocean color missions (Franz et al., 2015).
The recent outbreak of the coronavirus disease 2019 (COVID-19) pandemic enforced most countries to adopt lockdown measures to arrest the spread of the outbreak imposing severe restrictions on people’s movement, as well as industrial and other anthropogenic activities. The Government of India too implemented stringent lockdowns starting March 24, 2020 and then relaxing it in different phases from June 1, 2020. Most of the earliest impacts of the lockdowns were seen as positive effects on the environment in terms of significant improvement in air and water qualities in many major cities across the world (Dantas et al., 2020; Lian et al., 2020; Mahato et al., 2020; Selvam et al., 2020; Zambrano-Monserrate et al., 2020; Zangari et al., 2020). However, studies reporting the lockdown impact on the coastal water quality were rather limited (Depellegrin et al., 2020; Mishra et al., 2020; Yunus et al., 2020), even though the sudden nationwide lockdowns provided a unique opportunity to look at the sediment load and understand its implication on the biogeochemical dynamics of estuarine systems.
Anthropogenic activities have profound impact on the coastal waters due to increasing population and their needs, widespread industries, shipping, domestic sewage, and agricultural activities. The COVID-19 lockdown has provided an opportunity to assess the anthropogenic activities on the coastal water quality of the region. In the Indian subcontinent, studies by Garg et al. (2020) and Patel et al. (2020) analyzed the water quality of the Ganga and Yamuna rivers, respectively, during the COVID-19-related lockdown period using remote sensing and in situ observations. These regions are upstream of the Ganges catchment. They reported the suspended particulate matter and turbidity to have reduced considerably during the lockdown period. The present study aims at analyzing sediment concentration toward the downstream of the Ganges through the Hooghly River estuary during the lockdown period. In this regard, it is hypothesized that the COVID-19-induced lockdown will improve the water quality of the Hooghly estuary. Since it was not possible to carry out field data collection in the Hooghly estuary during the lockdown period, satellite-derived TSM from Landsat-8/OLI was utilized as proxy for water quality to understand the effect of the COVID-19 lockdown on the Hooghly estuarine system and discuss sediment load, its spatial distribution, and the possible implication on regional biogeochemistry as compared with the pre-lockdown conditions. As TSM is widely considered an important water quality parameter, the reduction in TSM in the study area could be inferred as the improvement in the water quality, which also quantifies the anthropogenic impact on the coastal water quality.
The Study Region section presents an overview of the study area. The “Data and Methods” section details the in situ data collected during earlier field campaigns and estimation of TSM using Landsat-8/OLI data for the study period. The results of intercomparison between in situ and satellite-derived TSM for winter monsoon of 2019 and TSM distribution during the pre-monsoon season (April) for 2016–2020 are presented in the “Results and Discussion” section. The significance of the anomalous reduction of TSM during April 2020 (lockdown) and its implications on the regional biogeochemistry were also discussed. The important conclusions and future scope are elucidated in the “Conclusion” section.
Study Region
Hooghly River estuary in the Indian subcontinent is the western boundary of the largest delta in the world that is formed by the distributaries of the Ganges and the Brahmaputra rivers (Figure 1). The lower section of the estuary stretches through the rich mangrove forests known as the Sundarbans and provides the primary shipping channel to the major port (Kolkata port trust) through Kolkata and Haldia docks in the upper and lower sections, respectively. This estuary is shallow, funnel shaped and is considered as a positive estuary that traces its path through the southern region of the state of West Bengal in India (Rakshit et al., 2014). The climate of the region could be categorized into pre-monsoon (March–May), monsoon (June–September), and post-monsoon (October–January). The pre-monsoon period is considered as the dry period with scanty or no rainfall, whereas the monsoon season accounts for the maximum rainfall, and lower precipitation is prevalent during the post-monsoon season (Khan, 1995; Rakshit et al., 2014). The highest river discharge (3,000 ± 1,000 m3 s–1) in the Hooghly estuary is observed during the monsoon season that reduces to the minimum (1,000 ± 80 m3 s–1) during the pre-monsoon season (Mukhopadhyay et al., 2006; Ray et al., 2015).
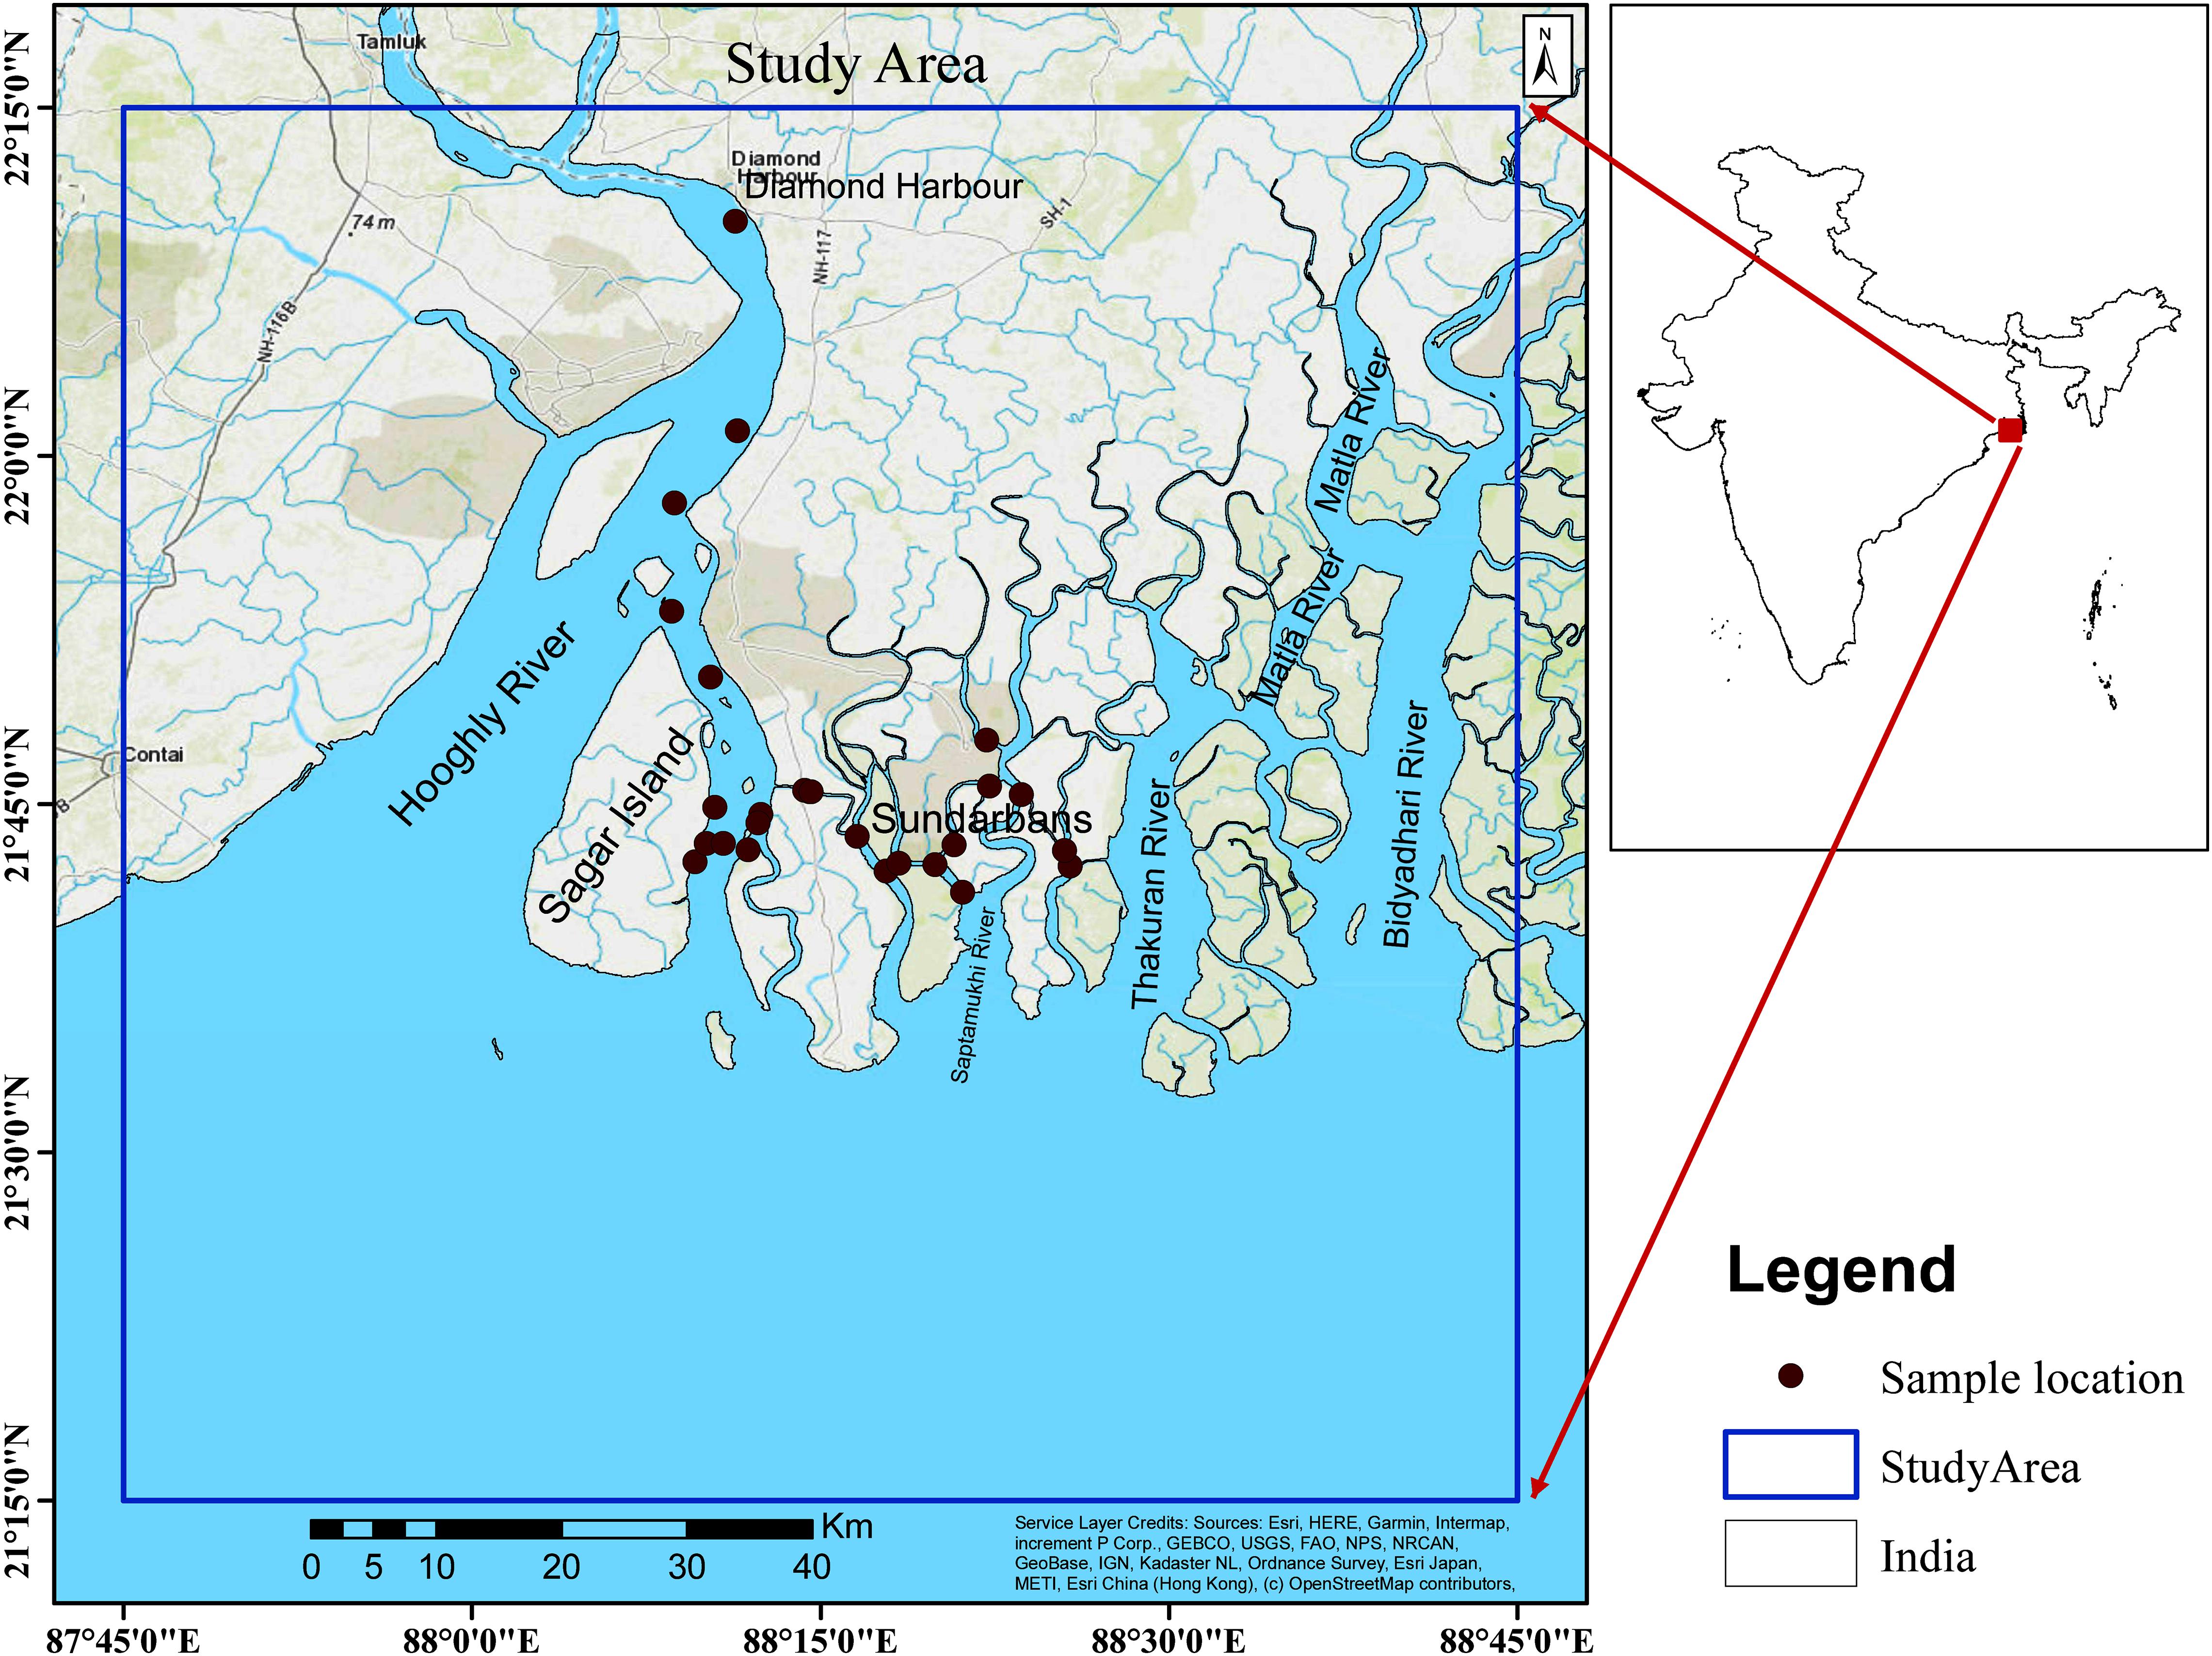
Figure 1. Map showing the location of the study region (inset) in the northern Bay of Bengal. Red dots indicate the locations of the in situ total suspended matter (TSM) observations during December 9–11, 2019.
Annual sediment load discharged by the Ganges into the Bengal fan is ∼324 × 106 tons that is approximately one-third of the total sediment load discharged by the Ganges–Brahmaputra River system (Ray et al., 2015; Khan et al., 2018). From the studies of Mouyen et al. (2018) on the annual sediment load of major rivers across the world, it was observed that the Ganges–Brahmaputra River system had the highest sediment load with 1,081 Mt year–1, followed by the Amazon (778 Mt year–1), the Changjiang (477 Mt year–1), and the Irrawaddy (333 Mt year–1). These values signify the sediment dynamics of the Hooghly estuarine system in the northern Bay of Bengal. Apart from the sediment discharge brought by the river runoff, anthropogenic activities, such as the operational maintenance dredging of the Kolkata port trust, contribute immensely to the sediment concentration apart from the numerous brick kilns and industries dotting on either side of the Hooghly River.
Chacko and Jayaram (2017) have reported the TSM concentrations variations to be highly dynamic, spatial, and temporal in the northern coastal Bay of Bengal comprising the Hooghly estuarine region. They observed the maximum TSM concentration in the summer monsoon season (June–September) and the minimum in the spring season (March–May). These were attributed to the monsoonal discharge through the Ganges–Hooghly River systems. Tremendous amounts of sediments get transported through river discharge and are deposited in the channel with the rest flushed into the Bay of Bengal. Anthropogenic activities, such as dredging the channel, greatly dominate the TSM concentration variability in the estuary. The complex shape of the estuary with activities, such as deepening and lengthening of the channel, resulting in bank erosion was observed to amplify the suspended sediment concentration further. In addition, tides are known to influence the total suspended load in the estuary region. The Hooghly estuary is a macrotidal estuary with tidal amplitudes approximating 6 m. The tides in the region are predominantly semidiurnal in nature with the neap tides during spring ranging from 1.8 to 5.2 m height and a velocity as high as 6 knots (Sadhuram et al., 2005). During peak tidal flows, sand is transported downstream by the tide on the seaward face and is returned to the estuary during ebb flow.
Furthermore, the Hooghly estuary receives approximately 13 m3/s of industrial effluent and urban wastewater (Sadhuram et al., 2005, and references therein) from densely populated and industrial cities, such as Kolkata and Haldia. All these make the Hooghly estuarine system highly vulnerable to anthropogenic perturbation and, hence, imperative to monitor its water quality regularly. Given the importance of the Hooghly estuary in terms of ecology and economy of the region, it is also an ideal estuarine system to study the impact of the COVID-19-induced lockdowns that resulted in the suspension of several anthropogenic activities for months.
Data and Methods
Hydrographic Sampling
An observational campaign was carried out in the Hooghly estuary and the adjoining western part of the Sundarbans region from December 9–11, 2019 during which water sampling was carried out at 29 stations (Figure 1) representing the pre-COVID-19 phase. As part of the campaign, a factory calibrated SeaBird Electronics (SBE) 9/11+ conductivity–temperature–depth profiler (CTD), optode oxygen electrode, and fluorescence sensors were used at all locations to record the physical and chlorophyll profiles from the surface to fairly close to the bottom depth. From the CTD profiles (Figure 2), it was observed that the water temperature at the upper end of the estuary was relatively cooler (by 0.8°C) than that at the lower region. The corresponding salinity values at the upper estuary ranged between 13 and 14 psu gradually increasing to 21 psu at the lower end, thereby suggesting intrusion of the Bay of Bengal coastal waters at these stations. The variability in the stations belonging to the Sundarbans region is not as dynamic as the Hooghly River estuary as the region is more tide dominant and less terrestrial runoff than the Hooghly River.
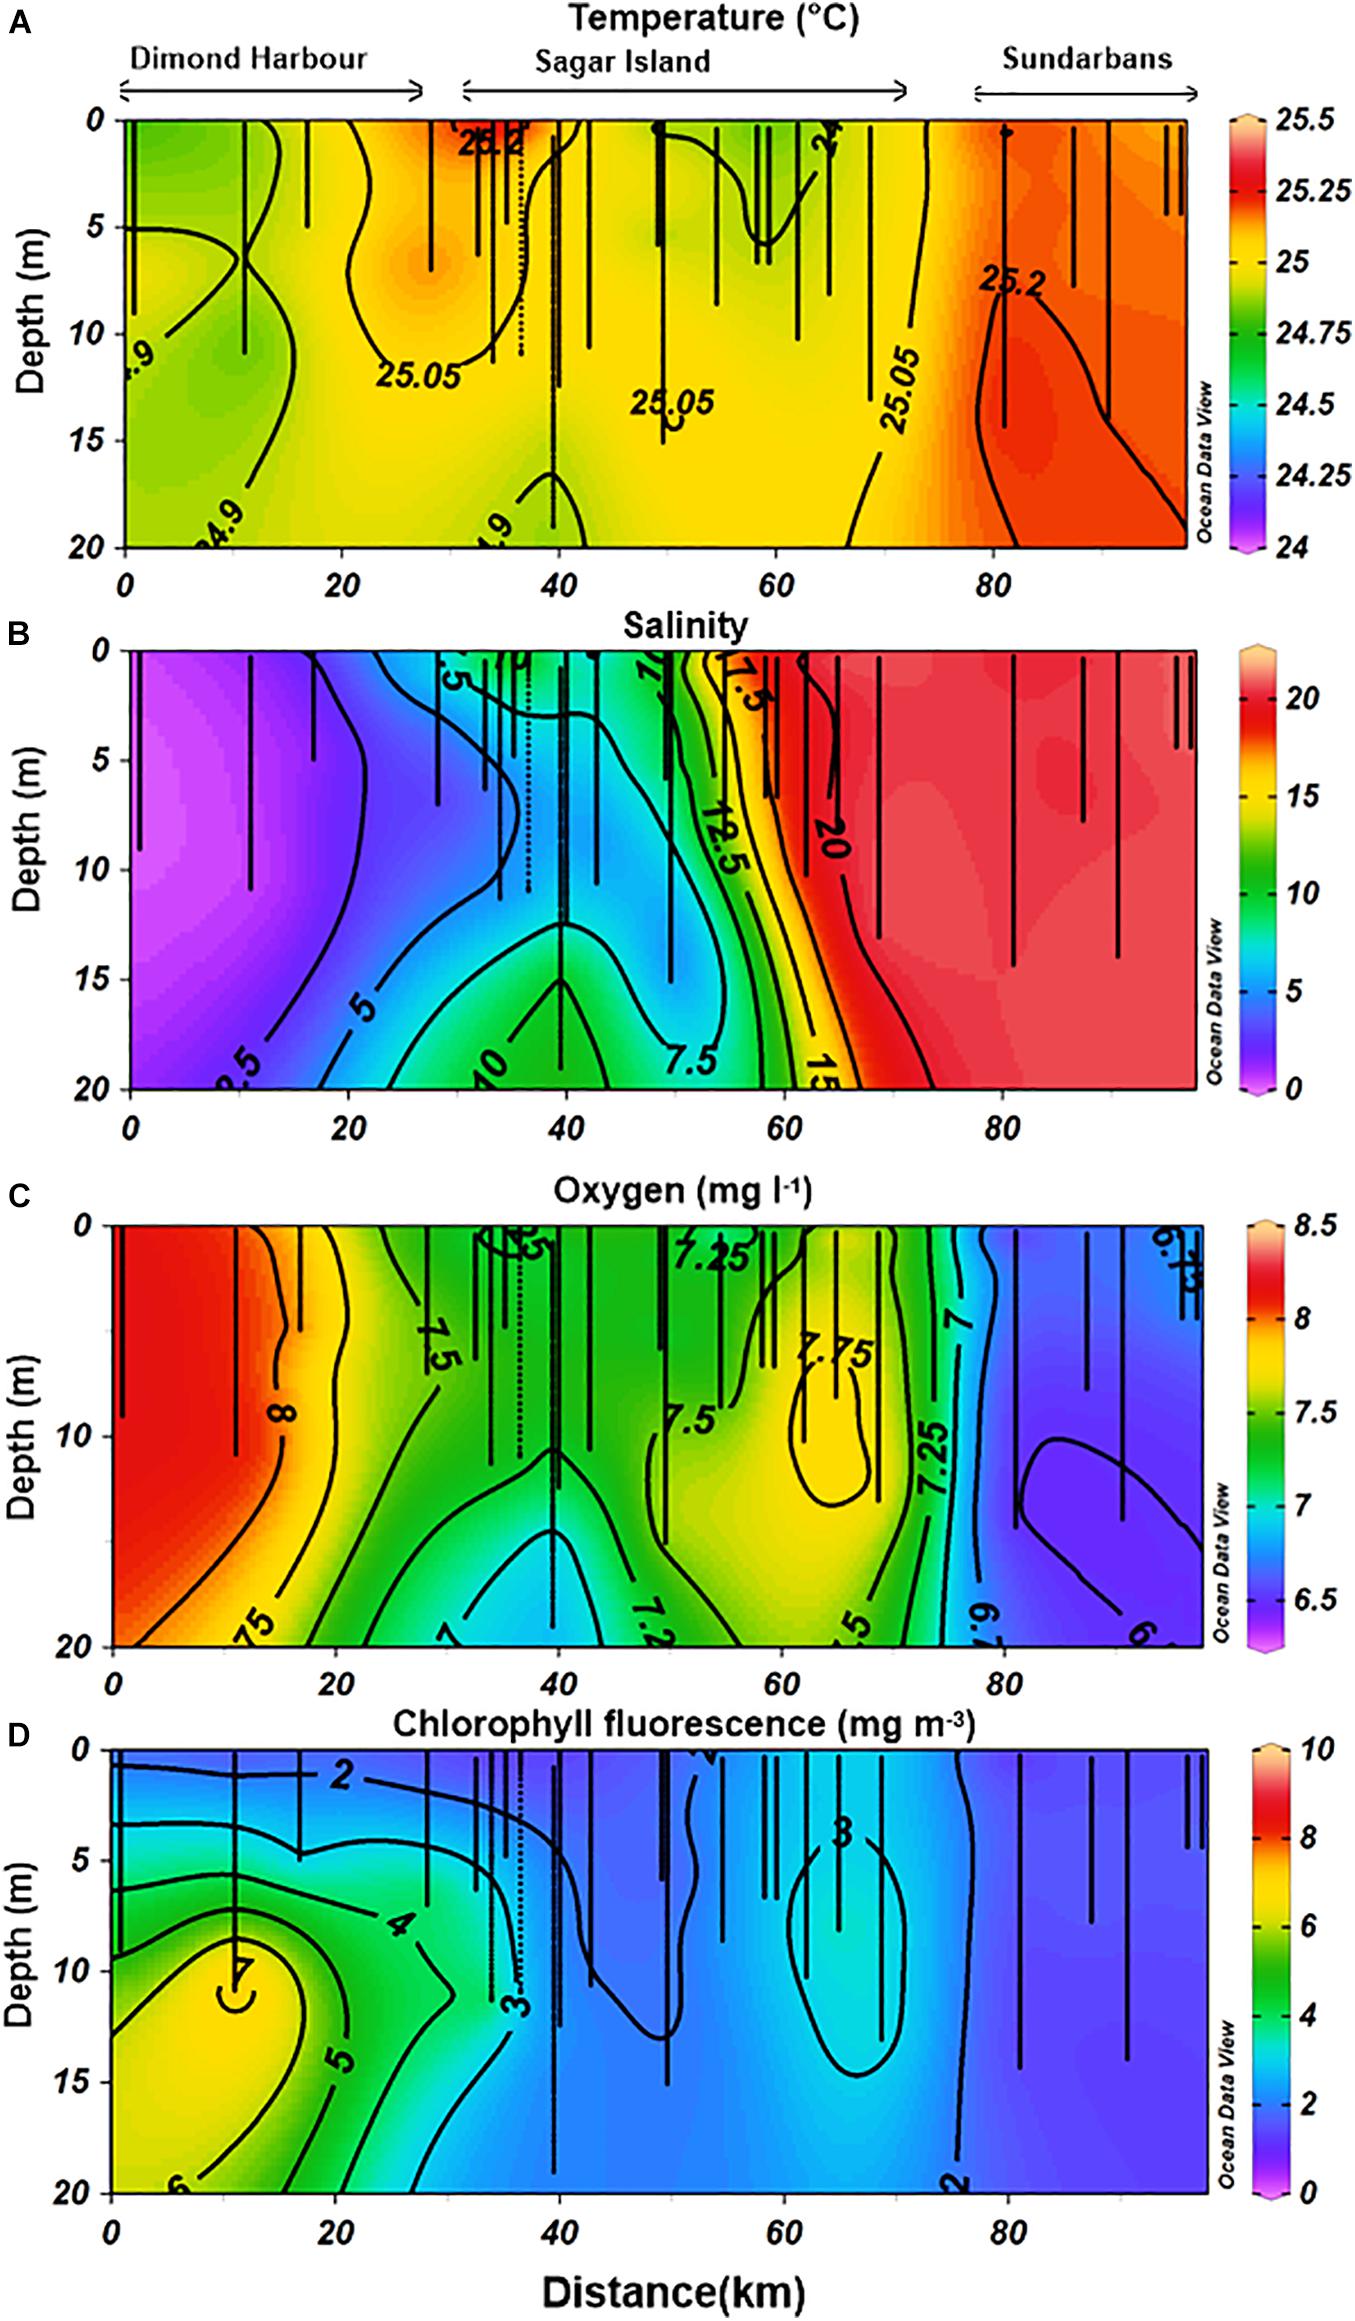
Figure 2. Vertical distribution of (A) temperature (°C), (B) salinity (psu), (C) oxygen (mg L–1), and (D) chlorophyll fluorescence (mg m–3) in the upper 20 m as observed at 29 stations of the Hooghly estuary (as shown in Figure 1). Depths of the conductivity–temperature–depth (CTD) lowered are indicated by the gray lines within the figures.
Several water samples were also simultaneously collected from 1 m below the surface with a Niskin sampler attached to a nylon rope on board fishing trawlers. Samples for dissolved inorganic carbon (DIC) were collected first, followed by pH, nutrients, and TSM. DIC and nutrient samples were poisoned with saturated mercury chloride (HgCl2) as per the standard oceanographic protocol (US JGOFS) (see Knap et al., 1996). The samples were then analyzed at the biological oceanography laboratory at the National Remote Sensing Centre (NRSC), without any pre-filtration and analyzed using a coulometer (model no. CM5015). DIC measurements were accurate to <2 μmol kg–1 with precision within 0.1% as relative standard deviation (RSD) based on replicate measurements of certified reference material (CRM) batch number 170 obtained from Dickenson Laboratory, Scripps Institute of Oceanography, San Diego, CA, United States. Furthermore, inorganic nutrients (nitrate and phosphate) were determined by standard spectrophotometric methods (Grasshoff et al., 1999) using the Skalar Autoanalyzer (San++) from Skalar Analytical B.V., Netherlands. The uncertainties determined from multiple measurements of replicate samples for nutrients were <±0.1 μmol L–1 based on the CRM 170. pH was measured using a Metrohm pH meter at an accuracy of ±0.002 units. Samples for TSM analyses were obtained by filtering <0.3 L of water through pre-combusted pre-weighed Whatman GF/F filters and were kept frozen at −4°C. To quantify TSM, the frozen filters were thawed and dried at 60°C for 72 h in a drying oven and weighed after recovering to room temperature in a desiccator. TSM concentration was determined by subtracting the weight of the filter before filtration from its dry weight after filtration of a known volume of water.
Satellite Data and Processing
Level-1C, Landsat-8/OLI data obtained from the US Geological Survey (USGS1) for the study period were used to derive the suspended sediment concentration in the Hooghly estuary. Landsat-8 has 11 bands at different spatial resolutions (8 multi-spectral bands at 30 m, 1 panchromatic band at 15 m, and two thermal bands at 100 m resolution) with a repeat period of 16 days. ACOLITE (Ver. 20190326.0), an image-based package specifically developed for marine, coastal, and inland waters by the Royal Belgian Institute of Natural Sciences (RBINS), was used to process the individual OLI scenes (Vanhellemont, 2019). Dark spectrum fitting (DSF) algorithm, which does not require any prior selection of the “BLACK” band but just an optimal band selection during the processing, was used for the atmospheric correction of the Landsat images (Vanhellemont and Ruddick, 2018; Vanhellemont, 2019). Furthermore, the aerosol model in this approach was selected based on the root mean square difference (RMSD) between the representative dark spectrum (ρdark) and the estimated path reflectance (ρpath). The RMSD was computed for each spectral band, and the combination with the lowest RMSD was selected for the final atmospheric correction of the corresponding scene/sub-scene (Vanhellemont, 2019). In the present study, the Maritime model (Model2) of the ACOLITE package was utilized as it resulted in the RMSD in the estimation of the “ρpath.” This method employs a robust automated band selection process, and aerosol correction accounts for the spatial variability of aerosols (both type and concentration) without affecting the noise level in the output product (Vanhellemont and Ruddick, 2018; Caballero et al., 2020). The glint correction performed for the imagery consists of the bands and pixels with the least estimate of aerosol optical thickness. This method allows the path reflectance that is insensitive to the sun glint (Vanhellemont, 2019).
Total suspended matter was then derived from the processed images by using the algorithm developed by Nechad et al. (2010) from the water leaving reflectance of red band (λ = 655 nm) following the expression:
Where ρw is the water leaving reflectance (655 nm), and A = 289.29 and C = 0.1686 are the empirical coefficients. The Nechad et al. (2010) algorithm has been applied successfully across various regions as it is tuned and developed based on the selection of two independent yet homogeneous datasets for calibration and validation (Dogliotti et al., 2015; Ciancia et al., 2020). The model configuration allows for the adjustment to different satellite sensors/bands (Odermatt et al., 2012). The TSM concentrations derived using the satellite observations were compared with in situ TSM observations carried out during December 9–11, 2019. The nearest possible OLI image for the study region was available for December 16, 2019, which was then used to derive TSM at the locations where in situ observations were carried out. The average of 3 × 3 pixels with in situ location as the center was considered as the spatial colocation criteria for intercomparison between in situ and satellite-derived TSM.
The 5-years mean (2016–2020) of TSM for the month of April (pre-monsoon) was computed with all the available cloud-free TSM imageries. The details of the Landsat-8/OLI data are provided in Table 1. In order to deduce the deviation from the mean during April of every year, the 5-years mean TSM for April is subtracted from the data for the corresponding year to arrive at TSM anomaly for that year.
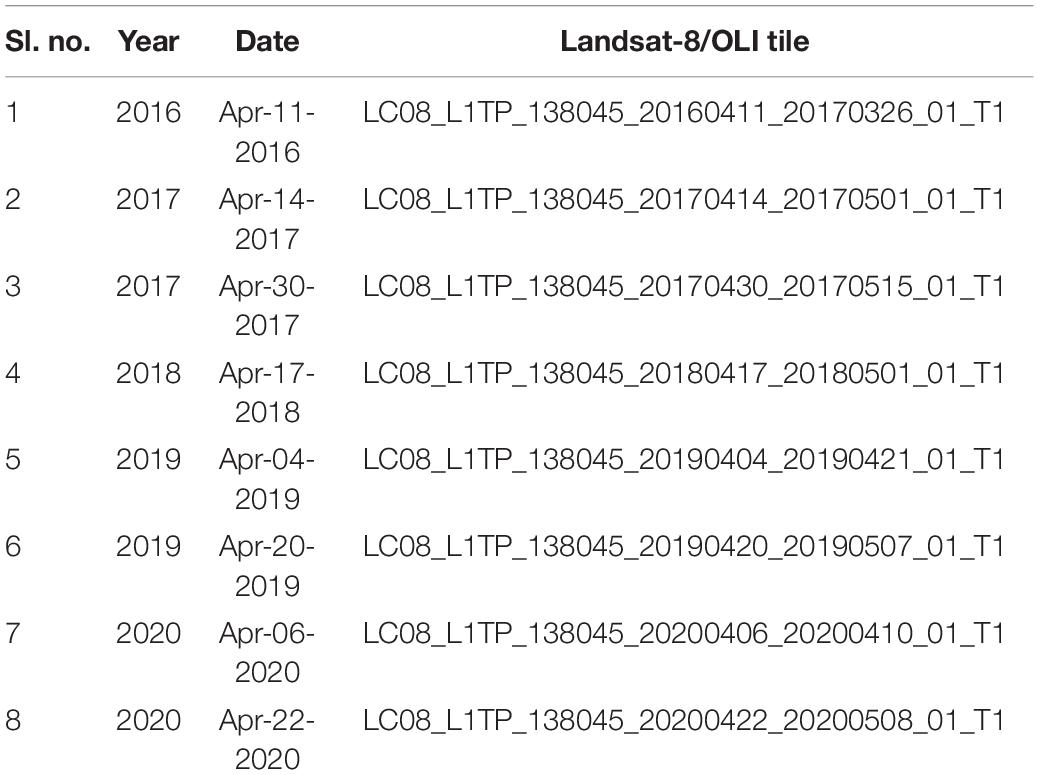
Table 1. Details of the Landsat-8 data used in the study.
Results and Discussion
In Situ TSM Load and Regional Hydrography Along the Hooghly Estuary
The hydrographic campaign conducted during December 2019 was used to characterize the pre-lockdown conditions of the Hooghly estuary and the western part of the Sundarbans region in terms of biogeochemical parameters. The physical characteristics of the surface waters sampled along with the other biogeochemical parameters are illustrated in Figure 2 and Table 2. In situ TSM load showed strong spatial variation from the upper end of the estuary (Diamond Harbor) to the lower end (Sagar Island and the adjoining Sundarbans region) along with a steep salinity gradient. The TSM load was greater than 100 g m–3 during December 2019 within the inner estuary. It decreased by ∼10 g m–3 within the middle of the estuary, but reaching a load of 60–80 g m–3 within the Sundarbans delta. During December 2019, the average value of TSM was 94 g m–3 within the Hooghly estuary with the lowest and the highest values ranging between 58 and 127 g m–3, respectively. The high TSM load within the upper estuary also coincides with low pH values (<7.900).
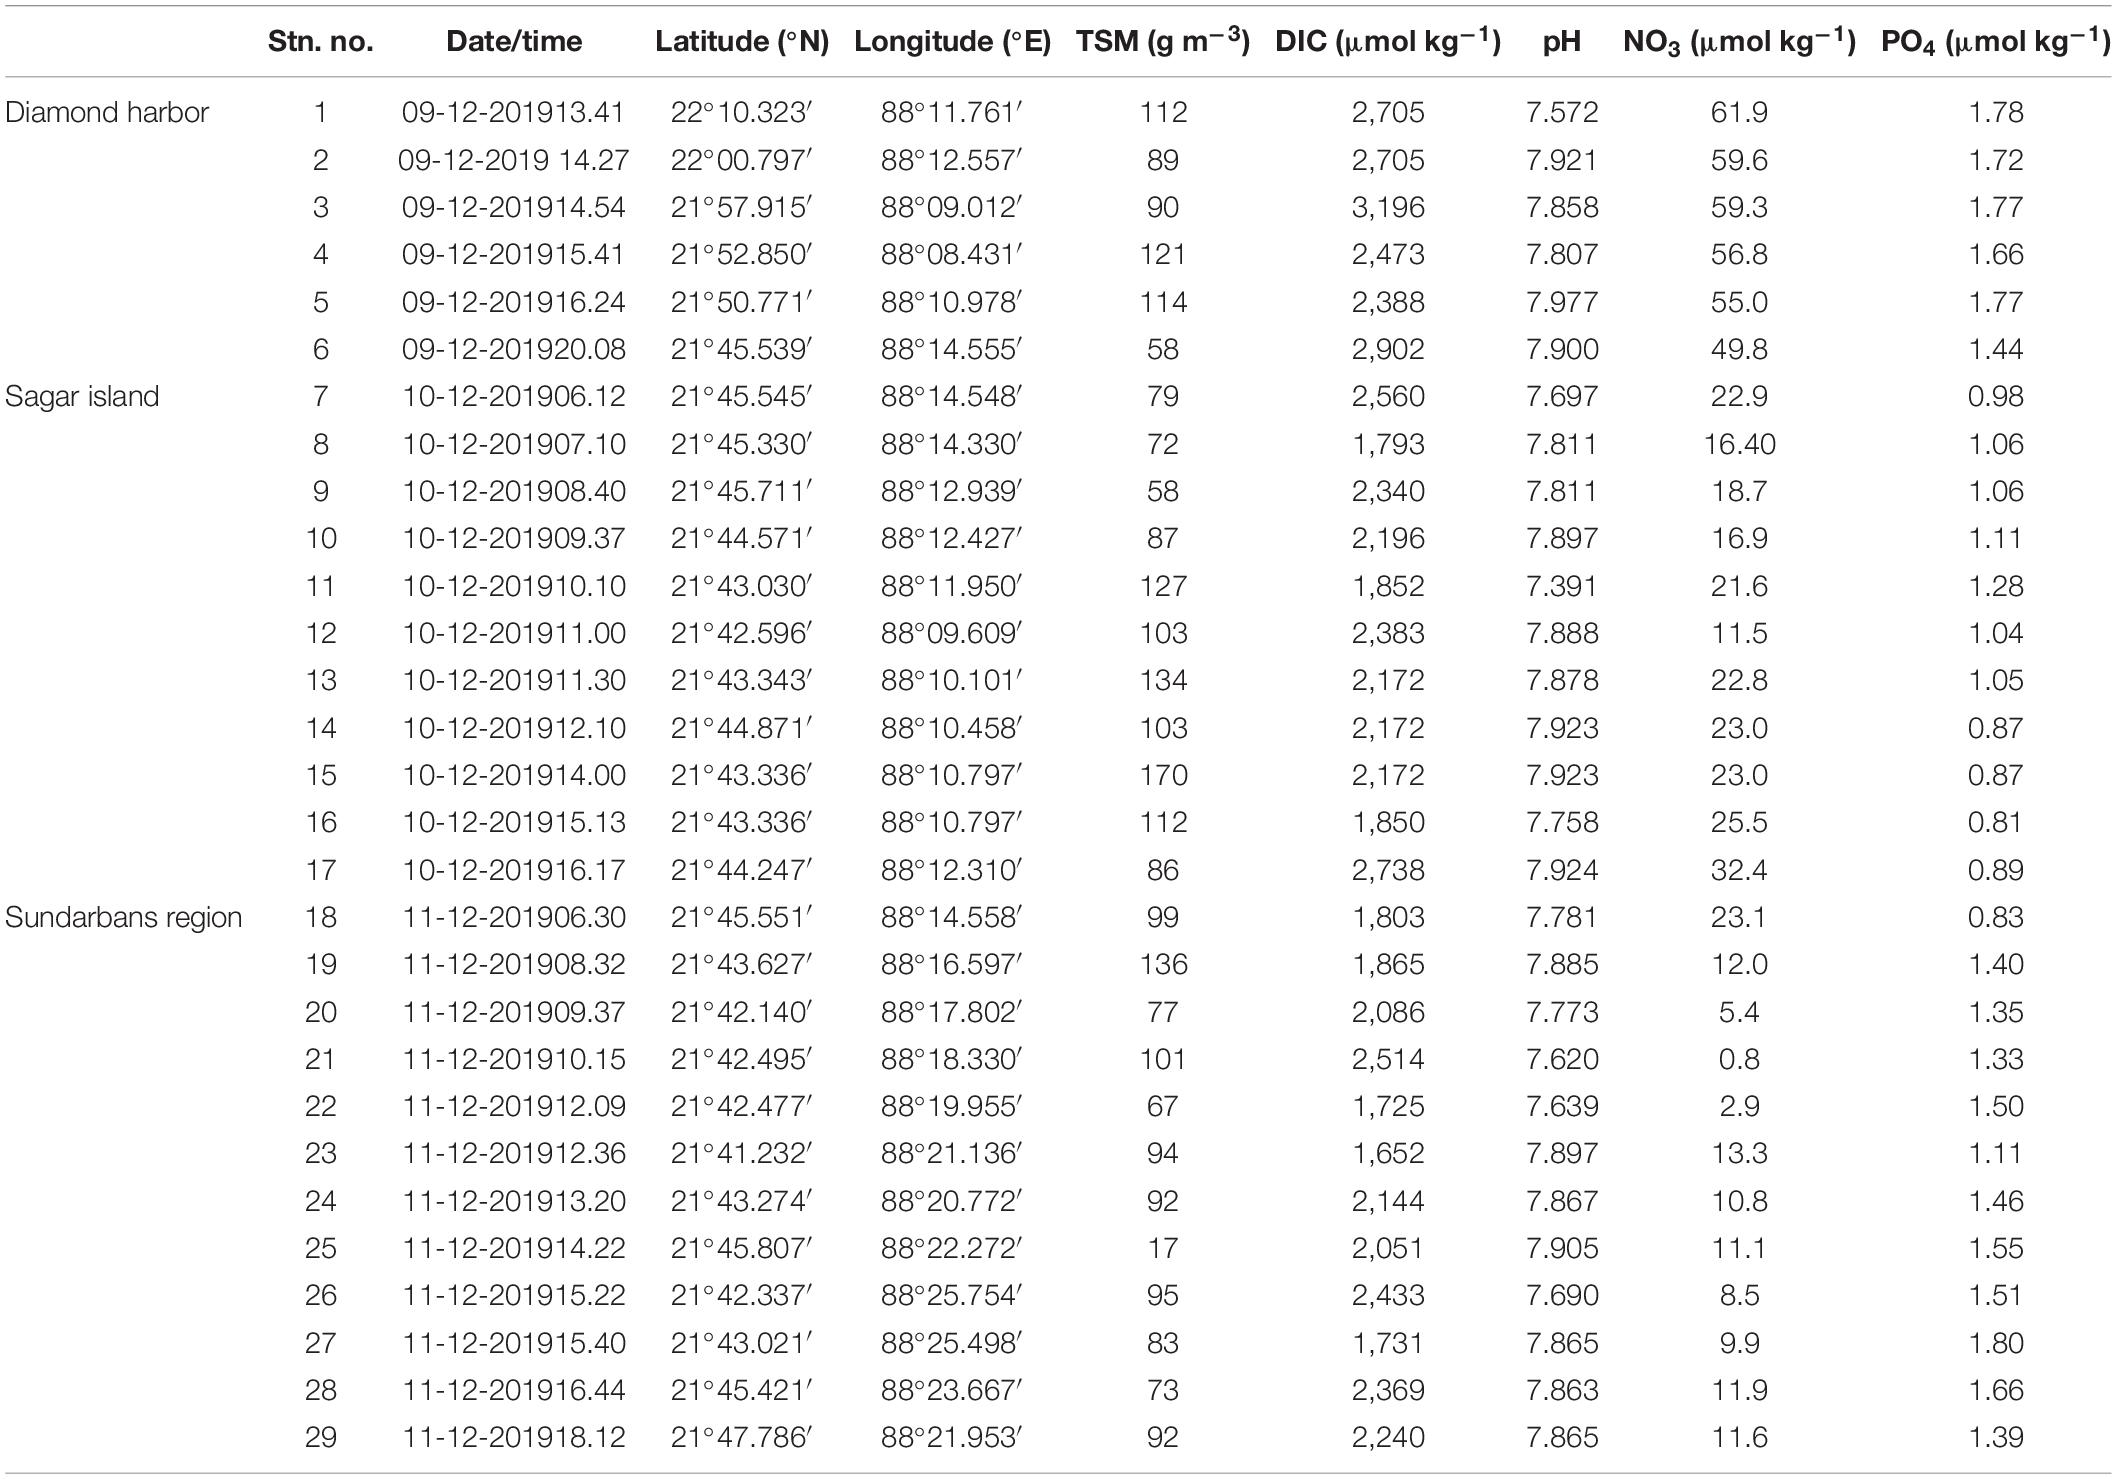
Table 2. Biogeochemical properties of surface waters along the salinity gradient of the estuary during December 2019 (north–east monsoon).
Furthermore, chlorophyll concentration in the middle of the estuary was higher by 1 mg m–3 than that in the upper and the lower estuary regions coinciding with increase in dissolved oxygen and decrease in surface turbidity. In general, the oxygen concentrations in the lower estuary decreased by 1 mg L–1 compared with the upper estuary. We believe that this decrease in oxygen is presumably due to large organic matter degradation at the lower end of the estuary associated with very shallow depths. Here, the depth ranged between 6 and 10 m, and the water column remained well mixed (Figure 2). Among the nutrients, nitrate showed a strong trend opposite to salinity gradient. The highest concentration of nitrate was associated with the upper estuary and decreased gradually toward the lower end (Sundarbans region). Nitrate ranged between <1 and 62 μmol kg–1, whereas phosphate varied between <1 and 1.78 μmol kg–1 during winter monsoon in the study domain. Phosphate concentrations in the upper estuary were higher than those in the middle estuary and showed an increasing trend within the Sundarbans region (lower estuary). Occasionally, lower concentrations of phosphate (<1 μmol kg–1) were also observed around the lower estuary. The lowest pH values (∼7.572) and DIC of 2,705 μmol kg–1 were observed in the surface waters at the Diamond Harbor. These values decreased further below 1,700 μmol kg–1 in the middle of the estuary, but again rising to ∼2,240 μmol kg–1 toward the Sundarbans region. The average value of DIC was found to be 2,248 μmol kg–1 and had a range between 1,652 and 3,196 μmol kg–1.
Comparison Between In Situ and Satellite-Derived TSM During December 2019
To assess the accuracy of the TSM derived from Landsat-8 observations using the generic single band algorithm proposed by Nechad et al. (2010), in situ TSM observations were compared with the satellite-derived TSM for December 2019. The root mean square error (RMSE) between the two datasets (no. of points = 27) is 10.89 g m–3, mean absolute error (MAE) is 30.21 g m–3, and correlation (R) is 0.3. The RMSE value of 10.89 g m–3 approximately matches the accuracy limits (±10 g m–3) specified by Nechad et al. (2010), thereby concurring with the in situ observations for further analysis. Relatively poor correlation could also result due to the temporal difference between the satellite and in situ observations used for intercomparison, but it is an acceptable limitation.
The spatial distribution of TSM in the study region before lockdown corresponding to December 2019 is shown in Figure 3. The TSM concentration is high in the Hooghly River and relatively less in the adjoining Indian portion of the Sundarbans Islands (Figure 3). This could be attributed to the runoff contributed by the catchment of the Hooghly River, whereas it is absent in the case of the inter-tidal riverine network prevalent in the Sundarbans region. This is evident from the salinity profile (Figure 2) where the salinity increased (>20 psu) toward Sagar Island and in the Sundarbans region. The satellite-derived TSM within the lower estuary ranged between 100 and 150 g m–3, almost equivalent to the concentrations of in situ TSM in the region.
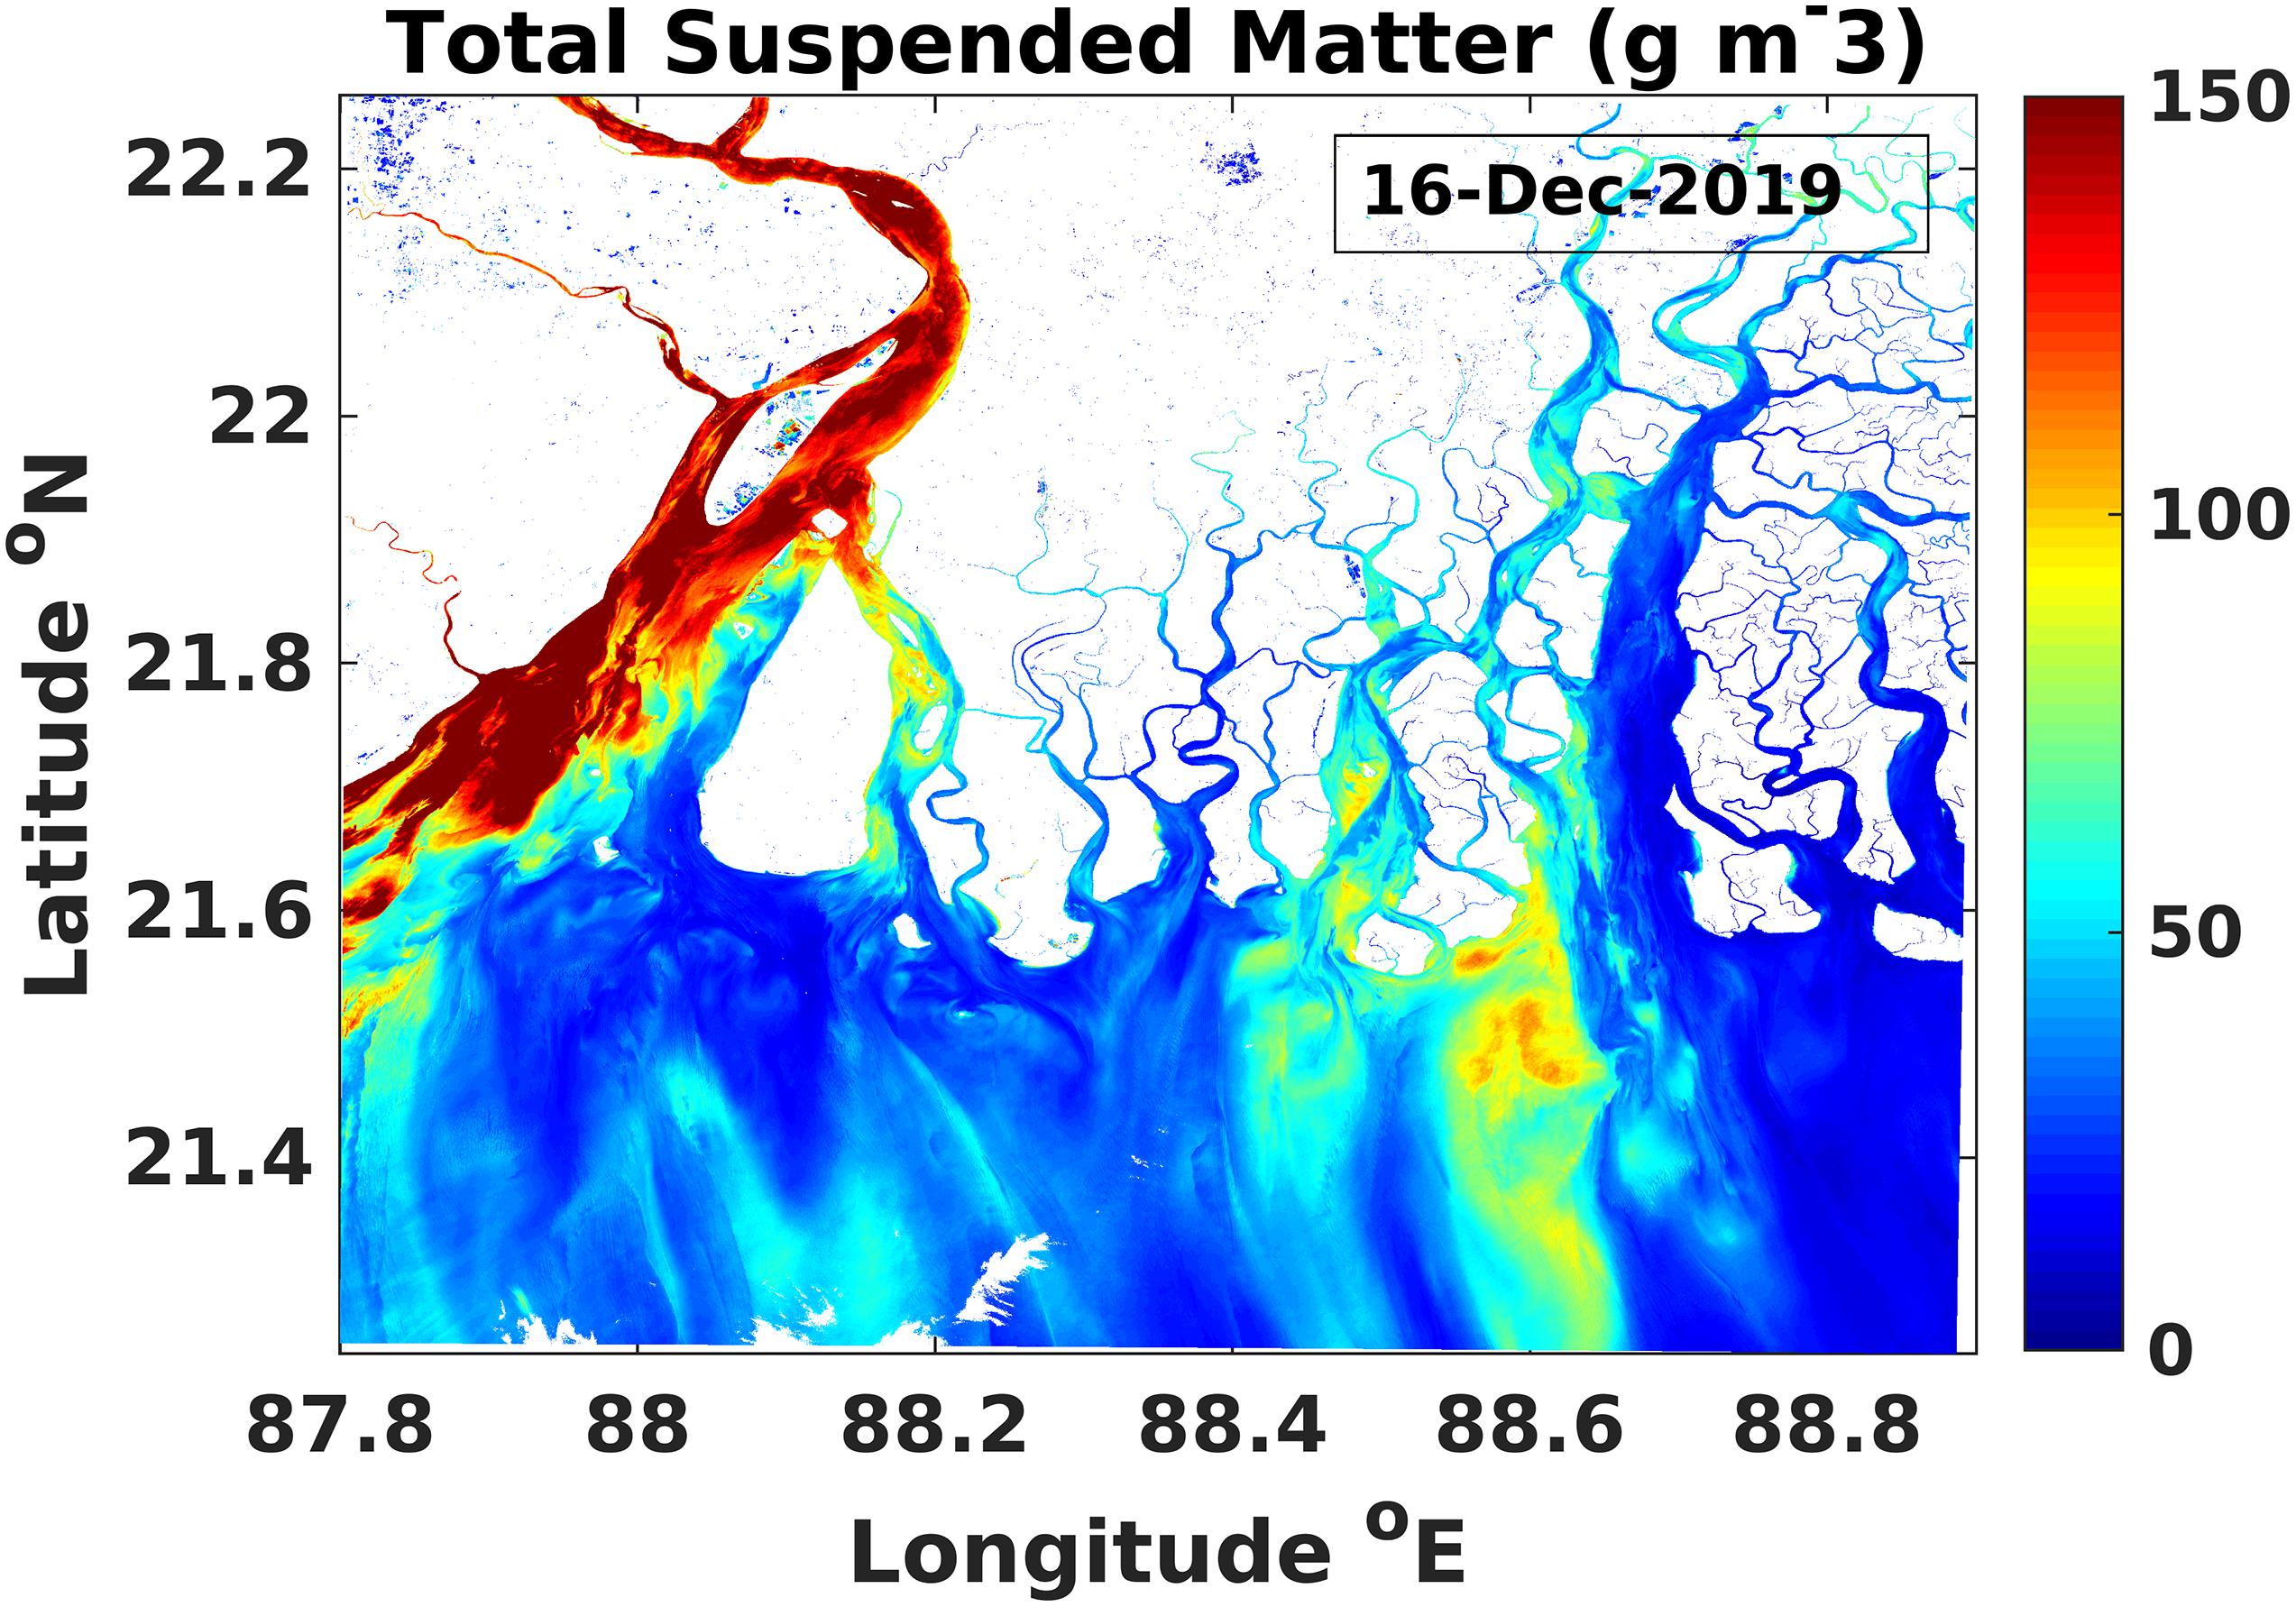
Figure 3. The TSM concentration derived from Landsat-8 data pertaining to December 16, 2019.
Total Suspended Matter Distribution for the Month of April (2016–2020)
The mean TSM concentration in the Hooghly estuary for the 5-years period 2016–2020 derived from the Landsat-8/OLI is shown in Figure 4. From the figure, the concentration of the mean TSM during April is observed to be relatively very less than that during the post-monsoon season (December 2019, Figure 3). The reduction in TSM concentration during April (pre-monsoon period) is attributed to the decrease in the river runoff and precipitation as expounded by Rudra (2014) and Chacko and Jayaram (2017). Furthermore, the annual cycle of TSM in the Hooghly estuary and the adjoining Sundarbans region showed the least concentration during the March–May period as observed from the studies of Jayaram et al. (2021). The variability of TSM anomaly for the month of April during 2016–2019 is shown in Figure 5. The spatial distribution pattern of the TSM anomaly shows that considerable year to year variability exists in these 4 years. The highest concentration of TSM occurred during April 2019, and the lowest TSM concentration occurred during April 2016. The TSM concentrations depicted a varied spatial distribution between the lower and upper regions in the Hooghly estuary. The anomaly maps demonstrate that while the major reduction in the TSM levels occurs in the upper estuary, the TSM concentration remained elevated throughout the years in the lower estuary. In the regions offshore, however, reduction in TSM concentration was observed in April 2019.
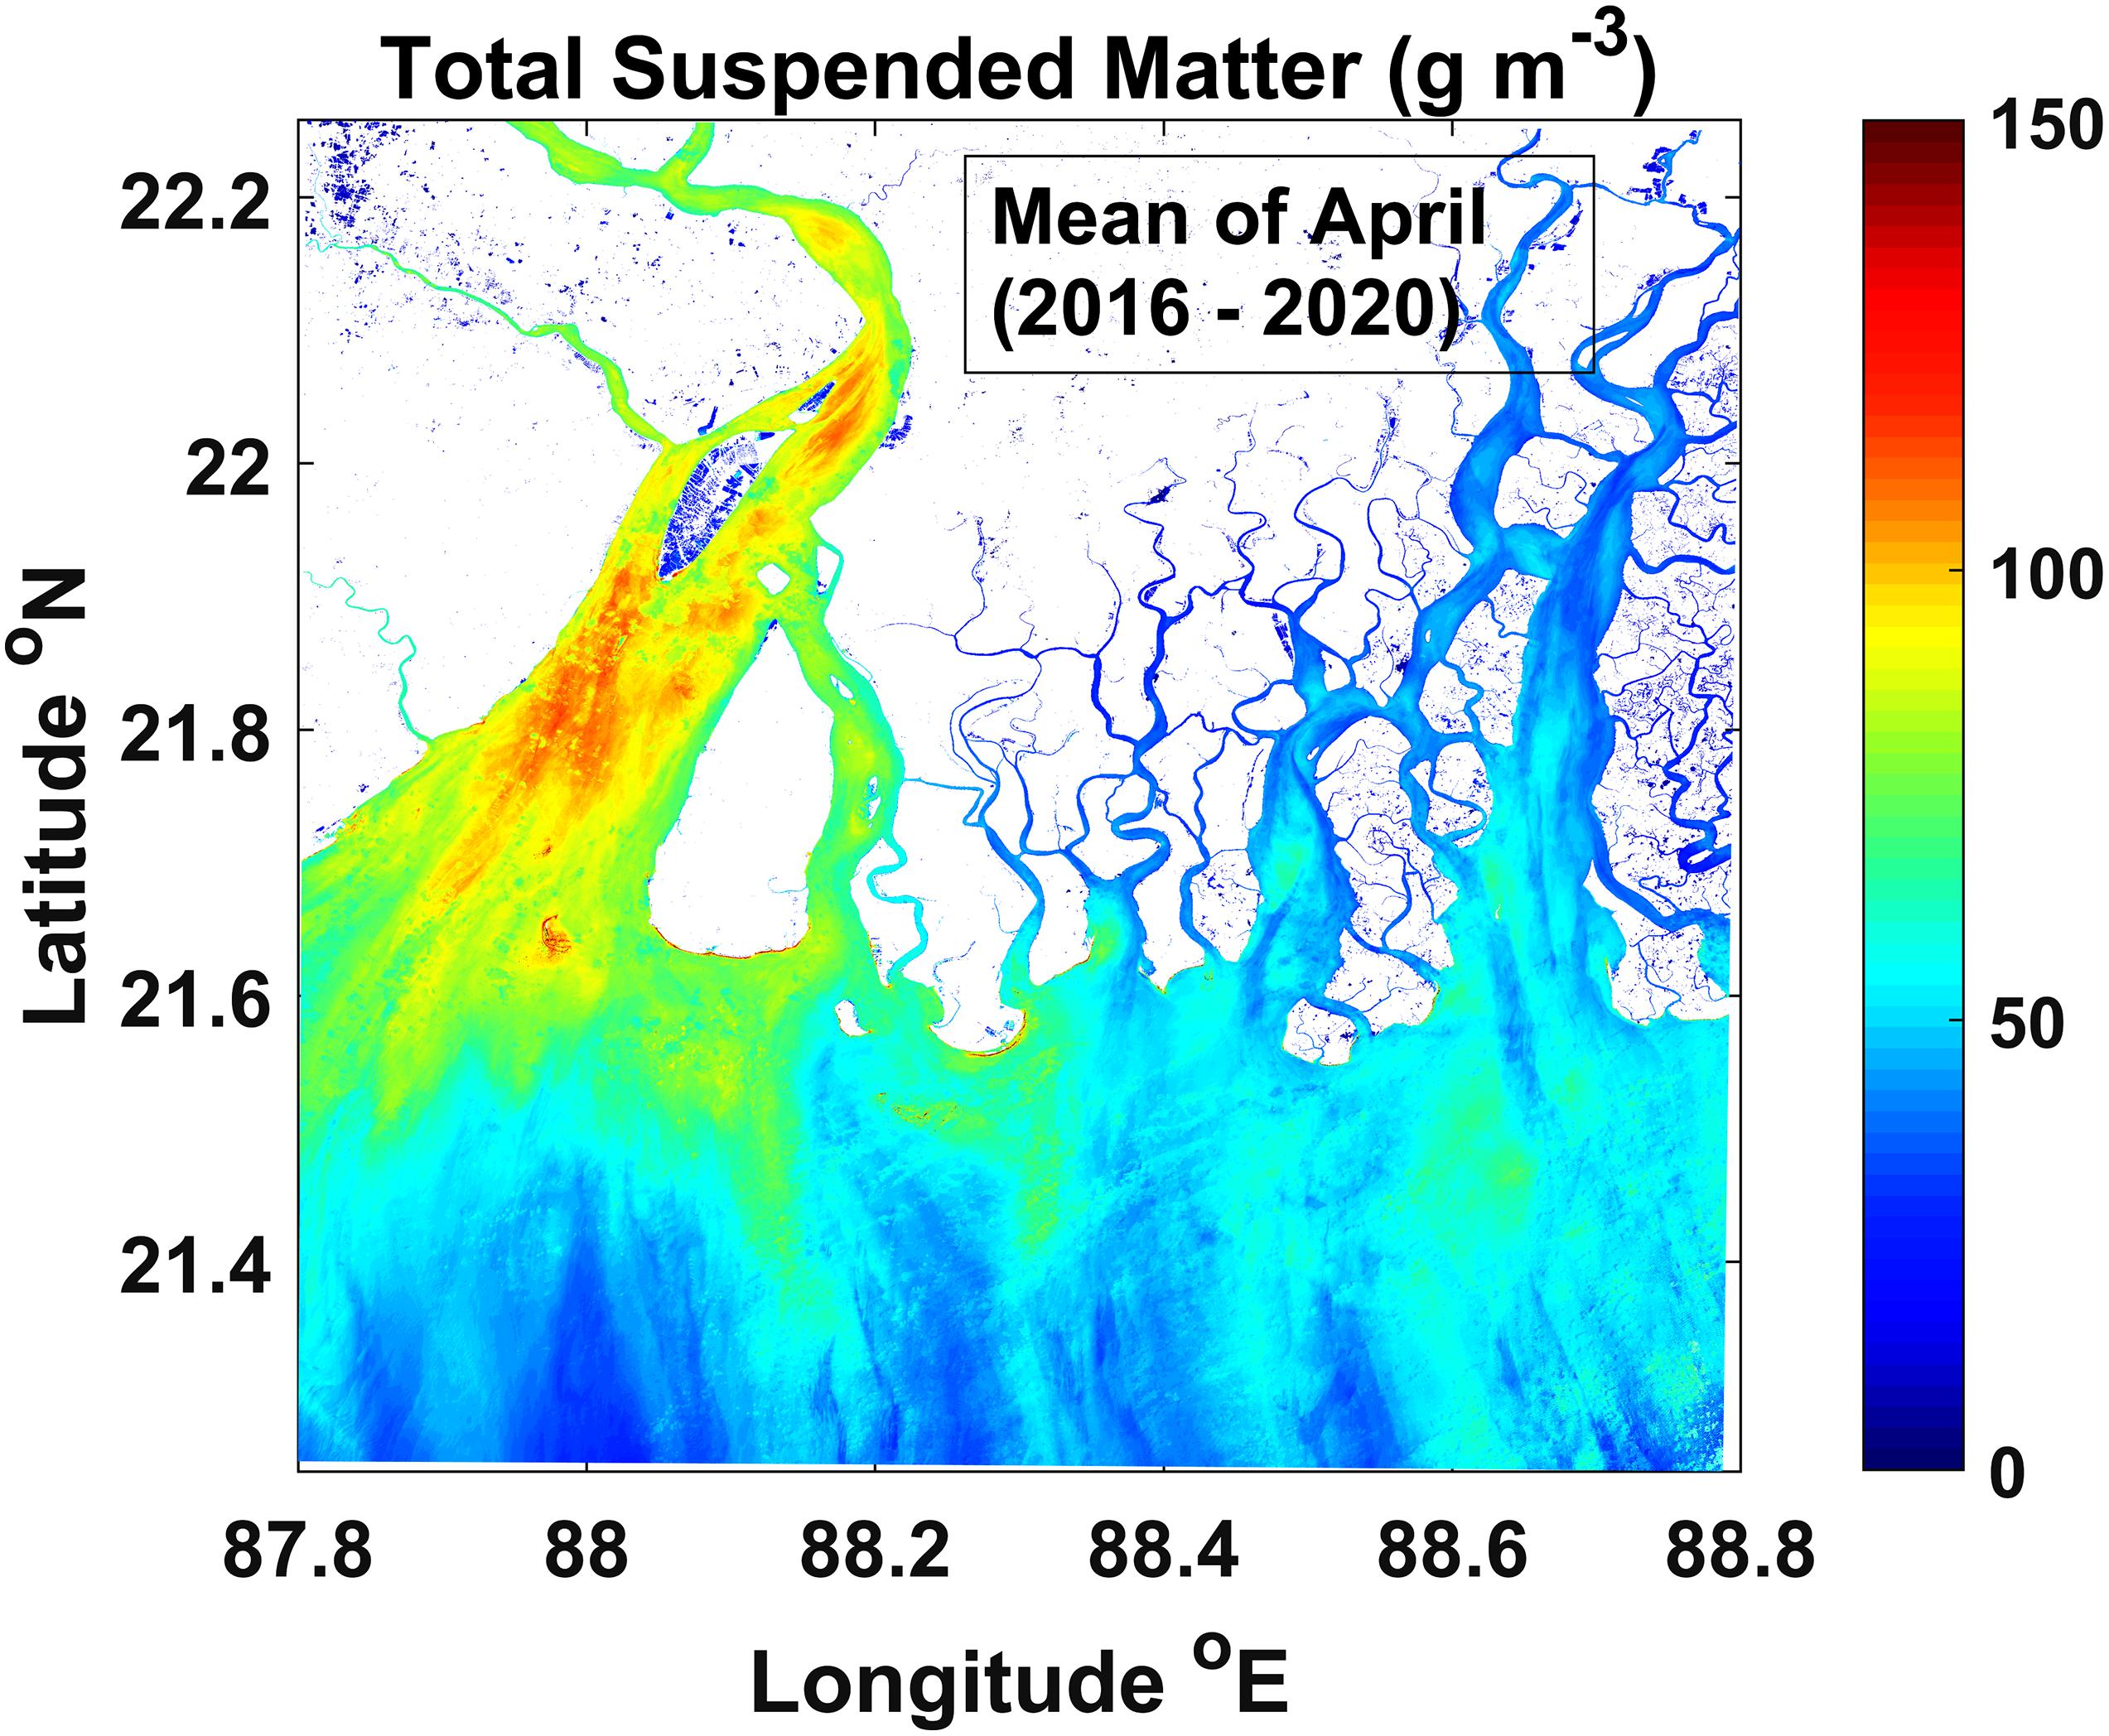
Figure 4. Mean TSM concentration during April for the period 2016–2020 derived from Landsat-8/OLI.
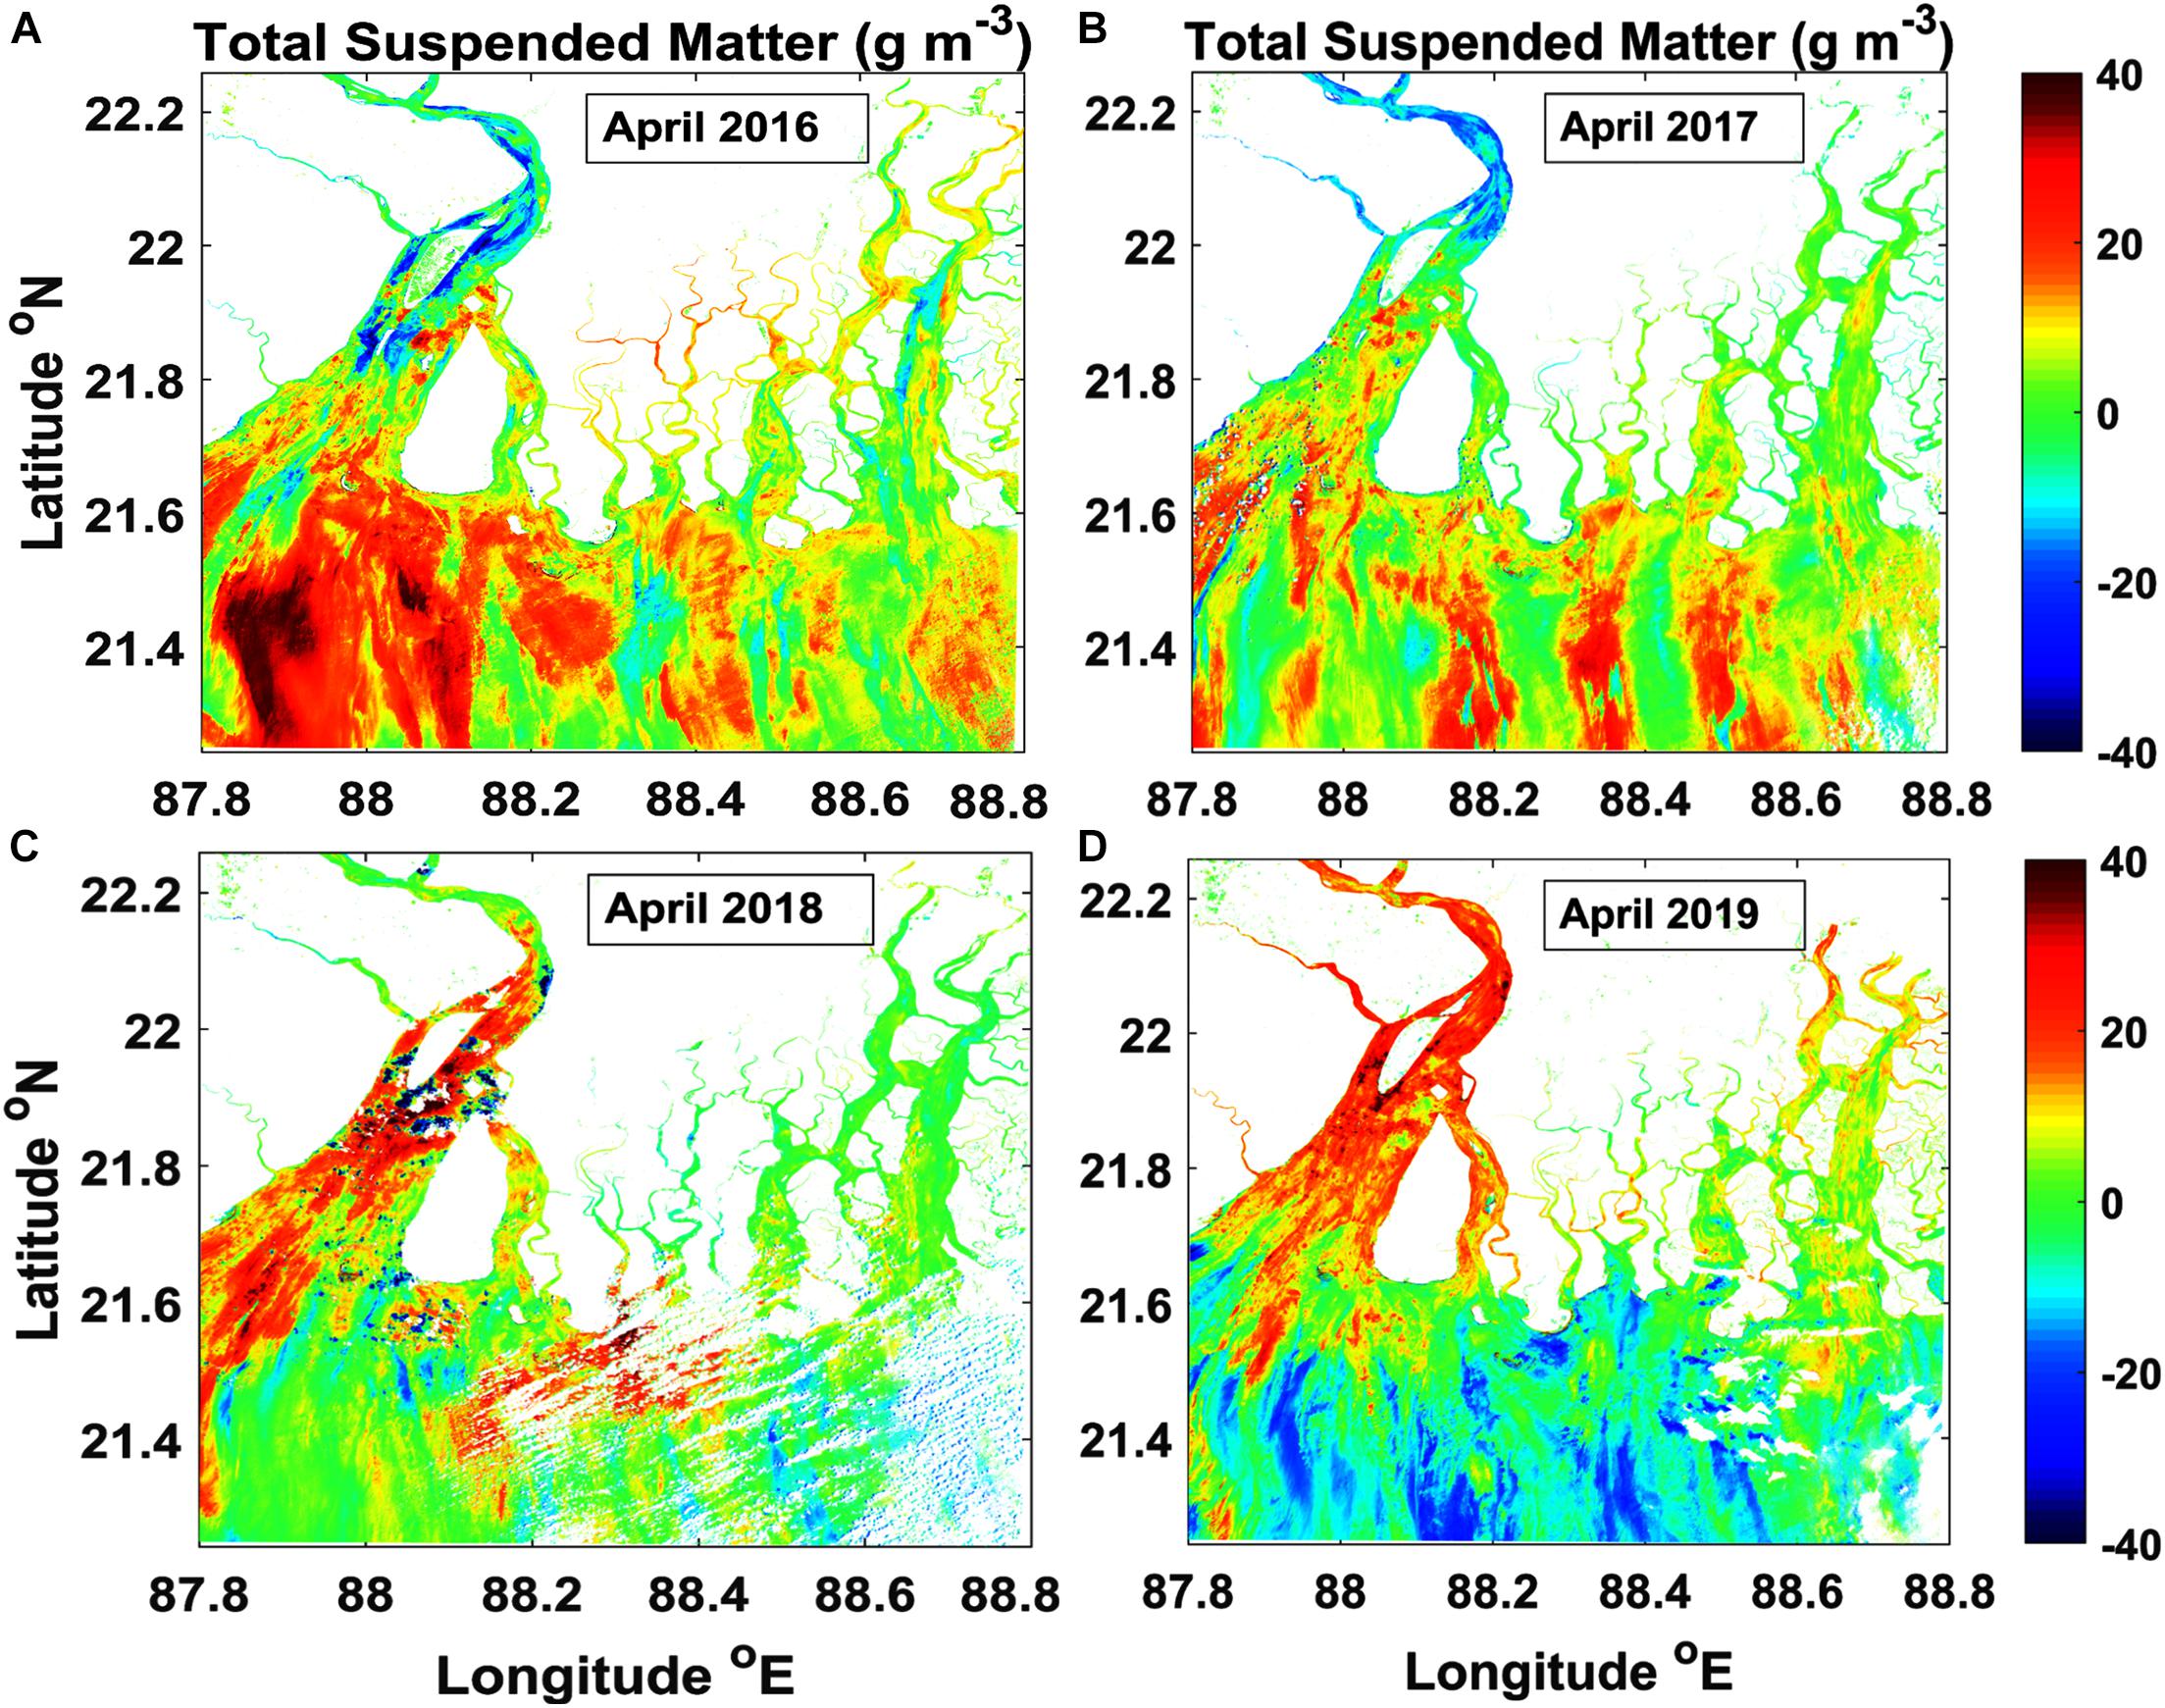
Figure 5. Anomaly of TSM concentration during April (A) 2016, (B) 2017, (C) 2018 and (D) 2019.
Total Suspended Matter Distribution During the COVID-19 Lockdown Period (April 2020) and Its Possible Biogeochemical Implications
Total suspended matter anomaly for April 2020 is computed by subtracting the 5-years mean TSM from the April 2020 data as shown in Figure 6A. From the figure, large negative anomaly (up to -40 g m–3) values were observed during April 2020 compared with the previous years (2016–2019) (Figure 5). The negative anomalies have progressively increased from the upper estuary (Diamond Harbor) (-10 g m–3) toward the lower estuary (Sagar Island) (−40 g m–3) and spread throughout the Sundarbans region. Figure 6 depicts the consistent increase in the percentage of TSM reduction from the upper to the lower estuary. It is evident that the upper estuary is punctuated by dense human settlements, which may contribute to the relatively lesser TSM reduction than the lower estuary. Since the study period reports TSM variability during the month of April, the impact of river discharge is considered to be negligible on the TSM distribution. This substantial reduction in TSM concentration during April 2020 coincided with the COVID-19 lockdown period. The reduction could be attributed to the suspension of several major anthropogenic activities during the lockdown period, such as closure of numerous brick kilns on either bank of the Hooghly River and closure of all the industrial units all along the river. Only very limited activities pertaining to ship traffic for emergency services, limited commercial fishing, and curtailed dredging activities were in progress during the lockdown period. The contrasts in the TSM values prevalent during the lockdown period as against the normal years could then be attributed to the contribution of sewage drained from the major metropolis of Kolkata and suburban regions, tides, and minimal river discharge.
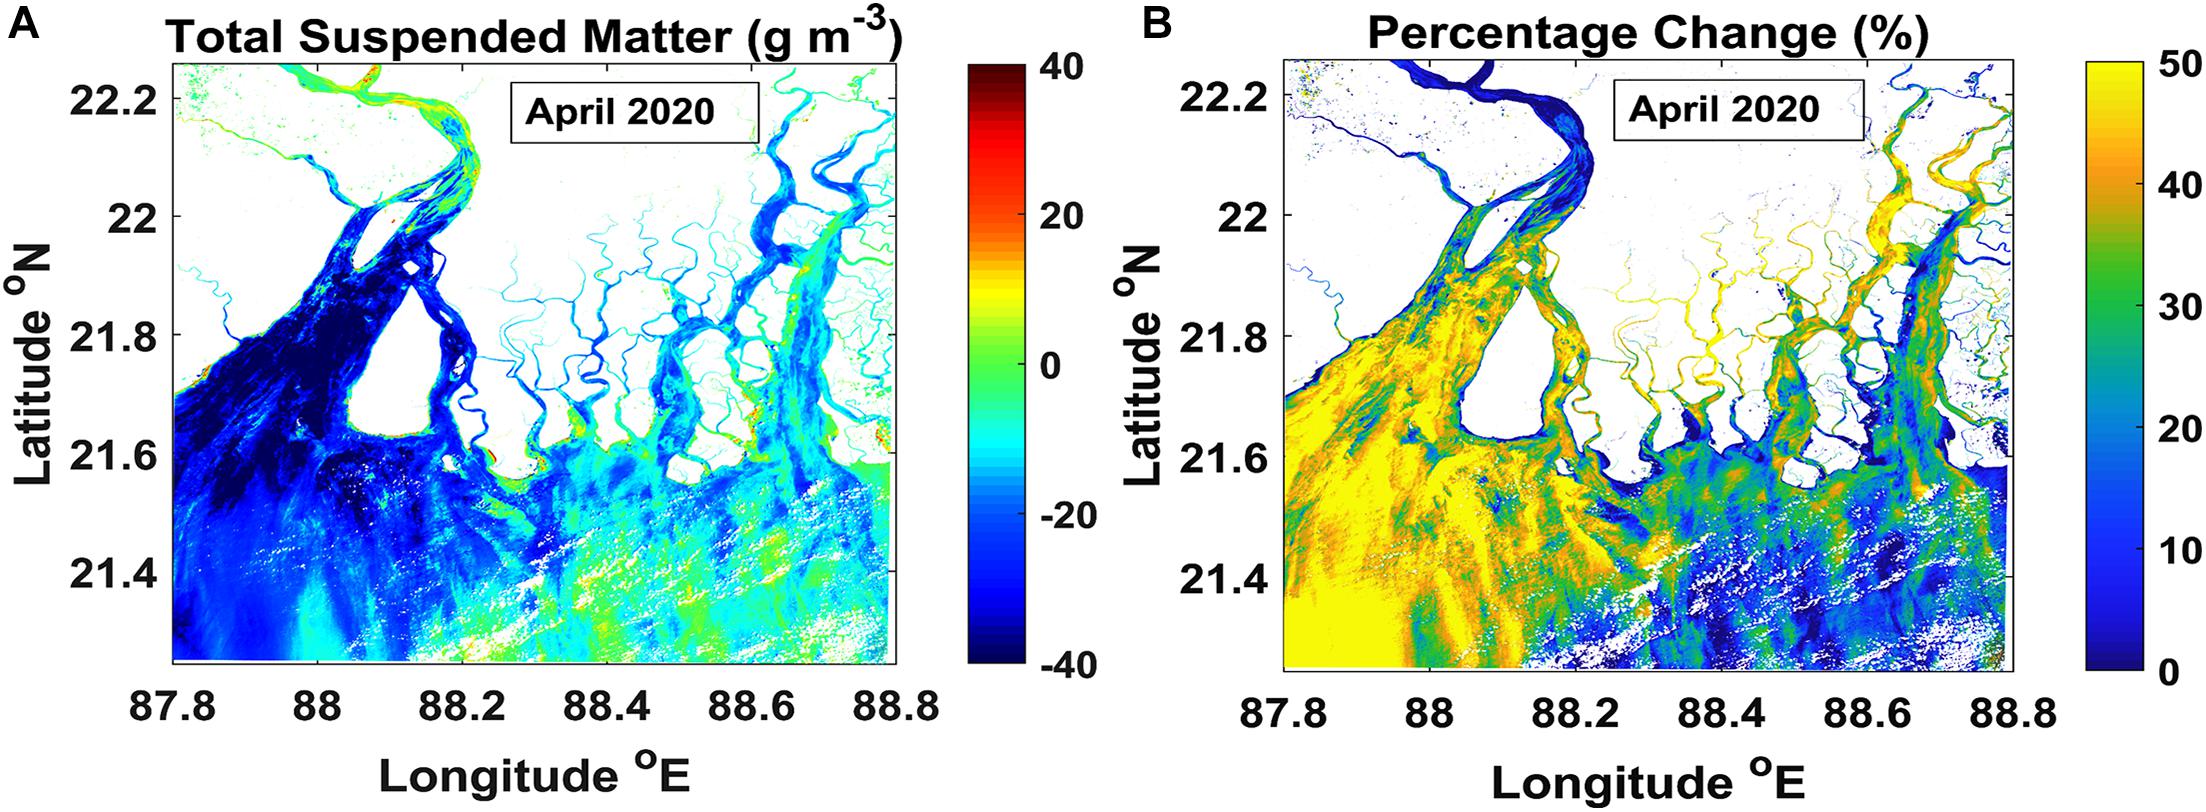
Figure 6. (A) Total suspended matter anomaly during April 2020. (B) Percentage decrease of TSM with respect to the 5-years mean.
To further quantify the reduction in TSM concentration during the lockdown period, the percentage reduction of TSM during April 2020 with respect to the 5-years mean TSM for the months of April was computed (Figure 6B). The reduction up to 30–50% of TSM compared with the 5-years mean presumably reflects the approximate contribution of industrial effluent discharge, shipping, and dredging activities on the water quality of the Hooghly estuary. The region is home to the largest mangrove forests and other flora and fauna that are dependent on the estuarine waters. Nutrient dynamics and DIC data highlight the modest reduction between Sagar Island and Sundarbans region during post-monsoon that presumably reflects some recycling within the upper estuary (Diamond Harbor region). Mukhopadhyay et al. (2006) estimated ∼7% loss in DIC and nutrients during estuarine transport to coastal ocean in this study region based on a model. High DIC values observed at the upper estuary near Diamond Harbor are consistent with the earlier reports (Mukhopadhyay et al., 2006; Samanta et al., 2015). Nearly 40–50% of the DIC is generated within the estuary, and annual DIC flux from the Hooghly estuary accounts for ∼1% of the global river DIC flux to the oceans (Samanta et al., 2015). Due to the stringent lockdown measures enforced during the COVID-19 pandemic, a reduction in the anthropogenic activities and sediment load in the estuarine region was imperative as observed in the study region in April 2020. This could lead to lesser DIC concentration during the lockdown period due to less organic load (for example, closing of tannery industries along the Ganges). Furthermore, lithogenic matter and high detritus inputs from the Gangetic Bay of Bengal were found to cause more ballast effect along with a higher share of the organic matter export from the euphotic zone to the deep sea in this region (Ittekot and Laane, 1991; Rao et al., 1994; Meybeck and Ragu, 1997; Gauns et al., 2005; Rixen et al., 2019). The presence of clay minerals/sediments in the Hooghly–Sundarbans region has been known to adsorb the nutrient particles, thus regulating their concentrations in the shallow waters (Lal, 1978; Vaithiyanathan et al., 1993). Although probable decrease in TSM content may increase the light penetration within the estuary, thereby increasing the primary production. However, low suspended sediments may also reduce the ballast effect offshore, thereby reducing the carbon export as reported earlier (Ittekot and Laane, 1991). A reduction in ∼50% load in TSM as observed from satellite data may presumably reduce the partial pressure of carbon dioxide in water (pCO2w) due to reduced turbidity and increase primary production within the surface waters. Furthermore, less sediment load may influence the heterotrophic activity due to availability of less organic matter. All these highlight the complex biogeochemical interaction between the river-derived inputs and carbon cycling as a result of the lockdown in the Hooghly estuarine region. However, to understand the wider implications on the estuarine ecology, further investigation with larger datasets is necessary.
Conclusion
Satellite-derived TSM data were analyzed for the Hooghly estuarine system during the COVID-19-induced lockdown period (April 2020) and compared with the previous years (2016–2019). The 5-years average of TSM during April (2016–2020) has shown that the TSM concentration is high in the upstream of the estuary with gradual reduction toward the mouth of the estuary and the adjoining Sundarbans region. The anomaly of TSM computed from the long-term mean for the month of April has shown that the TSM concentration is less by ∼30–40 g m–3, which approximates to 30–50%. This reduction in suspended matter presumably reflects the decrease in industrial contribution on the water quality of this estuary. Furthermore, closure of shipping activities in the shallow channel (through less dredging) and brick kilns (through less sediment removal) may have played a pivotal role. Although the observed changes represent the positive influence of the COVID-19 lockdown, its influence on biogeochemistry appears rather complex than said. We hypothesize that the decrease in TSM content in the estuarine regions may increase the light penetration, thereby increasing the primary productivity and carbon dioxide sequestration. However, less sediment load reaching the Bay of Bengal may have influenced the carbon export due to reduction in ballasting effect, thereby modulating the carbon cycle offshore. The above observations highlight the fact that the influence of the COVID-19 lockdown on the biogeochemistry of the aquatic ecosystem is complicated to delineate and may vary regionally based on local hydrodynamics and circulation pattern. This is significant in terms of the ecological balance of the study region that is home to the largest mangrove forests and other flora and fauna with a strong dependence on these estuarine waters. The present study emphasizes the role of anthropogenic impact on the fragile coastal ecosystems and advocates for the sustainable management of the coastal water quality for ecology and economy of the region.
Data Availability Statement
The original contributions presented in the study are included in the article/supplementary material, further inquiries can be directed to the corresponding author.
Author Contributions
CJ, RR, NC, and DS conceptualization. CJ, RR, RP, and NC data curation. CJ and RR formal analysis. SB, SC, and DD project administration. CJ, RR, and NC roles/writing and prepared the initial draft of the manuscript. All authors have participated in the review of the manuscript and writing – review and editing.
Funding
The field data were collected under the project “Ecological studies of Hooghly estuary and its environment using remote sensing, modeling, and in situ measurements” (LIC: 606901IW701), funded by the National Remote Sensing Center, Indian Space Research Organization.
Conflict of Interest
The authors declare that the research was conducted in the absence of any commercial or financial relationships that could be construed as a potential conflict of interest.
Acknowledgments
The authors thank USGS for making available the Landsat-8/OLI data. We place on record our gratitude to the crew and boat captain of M/s. Sundarban Safari for their support during the field campaign in the Hooghly estuary. The authors are also thankful to the Chief General Manager, RCs, Deputy Director, Earth and Climate Science Area, the Director, NRSC for their keen interest in our work and encouragement provided during our seasonal in situ data collection campaigns. The authorities at IIT Bhubaneswar are also acknowledged for facilitating the collaborative participation in the campaign with instrument support. The reviewers and the journal editorial board are acknowledged for their valuable comments and suggestions in improving the manuscript.
Footnotes
References
Caballero, I., Fernández, R., Escalante, O. M., Mamán, L., and Navarro, G. (2020). New capabilities of Sentinel – 2A/B satellites combined with in situ data for monitoring small harmful algal blooms in complex coastal waters. Sci. Rep. 10:8743. doi: 10.1038/s41598-020-65600-1
Chacko, N., and Jayaram, C. (2017). Variability of total suspended matter in the northern coastal Bay of Bengal as observed from satellite data. J. Indian Soc. Remote Sens. 45, 1077–1083. doi: 10.1007/s12524-016-0650-x
Ciancia, E., Campanelli, A., Lacava, T., Palombo, A., Pascucci, S., Pergola, N., et al. (2020). Modeling and multi-temporal characterization of total suspended matter by the combined use of Sentinel–2 MSI and Landsat 8–OLI data: the Pertusillo Lake case study (Italy). Remote Sens. 12:2147. doi: 10.3390/rs12132147
Dantas, G., Siciliano, B., França, B. B., da Silva, C. M., and Arbilla, G. (2020). The impact of COVID-19 partial lockdown on the air quality of the city of Rio de Janerio, Brazil. Sci. Total Environ. 729:139085. doi: 10.1016/j.scitotenv.2020.139085
Depellegrin, D., Bastianini, M., Fadini, A., and Menegon, S. (2020). The effects of COVID-19 induced lockdown measures on maritime settings of a coastal region. Sci. Total Environ. 740:140123. doi: 10.1016/j.scitotenv.2020.140123
Doerffer, R., and Schiller, H. (2010). The MERIS case 2 water algorithm. Int. J. Remote Sens. 28, 517–535. doi: 10.1080/01431160600821127
Dogliotti, A. I., Ruddick, K., Nechad, B., Doxaran, D., and Knaeps, E. (2015). A single algorithm to retrieve turbidity from remotely-sensed data in all coastal and estuarine waters. Remote Sens. Environ. 156, 157–168. doi: 10.1016/j.rse.2014.09.020
Franz, B. A., Bailey, S. W., Kuring, N., and Werdell, J. P. (2015). Ocean color measurements with the operational land imager on landsat-8: implementation and evaluation in SeaDAS. J. Appl. Remote Sens. 9:096070. doi: 10.1117/1.JRS.9.096070
Garg, V., Aggarwal, S. P., and Chauhan, P. (2020). Changes in turbidity along Ganga River using Sentinel–2 satellite data during lockdown associated with COVID–19. Geomatics Nat. Hazards Risk 11, 1175–1195. doi: 10.1080/19475705.2020.1782482
Gauns, M., Madhupratap, M., Ramaiah, N., Jyothibabu, R., Fernandes, V., Paul, J. T., et al. (2005). Comparative accounts of biological productivity characteristics and estimates of carbon fluxes in the Arabian Sea and the Bay of Bengal. Deep Sea Res. 2 Top. Stud. Oceanogr. 52, 2003–2017. doi: 10.1016/j.dsr2.2005.05.009
Grasshoff, K., Kremling, K., and Ehrhardt, M. (1999). Methods of Seawater Analysis. 3rd Edn. Weinheim: Wiley-VCH. 632.
Ittekot, V., and Laane, R. (1991). “Fate of riverine organic matter,” in Biogeochemistry of Major World Rivers, SCOPE 42 Edn, eds E. Degens, S. Kempe, and J. Richy (Hoboken, NJ: John Wiley).
Jayaram, C., Patidar, G., Swain, D., Chowdary, V. M., and Bandyopadhyay, S. (2021). Total suspended matter distribution in the Hooghly river estuary and the Sundarbans: a remote sensing approach. IEEE J. Sel. Top. Appl. Earth Obs. Remote Sens. (in press)
Khan, R. A. (1995). “Ecology of the Hugli-Matla estuarine system,” in Hugli-Matla, West Bengal, part 2. Estuarine Ecosystem Series, ed. A. K. Ghosh (Calcutta: Zoological Survey of India), 417–464.
Khan, S., Sinha, R., Whitehead, P., Sarkar, S., Jin, L., and Futter, M. N. (2018). Flows and sediment dynamics in the Ganga River under present and future climate scenarios. Hydrol. Sci. J. 63, 763–782. doi: 10.1080/02626667.2018.1447113
Knap, A. H., Michaels, A., Close, A. R., Ducklow, H., and Dickson, A. G. (1996). Protocols for the Joint Global Ocean Flux Study (JGOFS) Core Measurements. JGOFS Reprint of the IOC Manuals and Guides No. 29, UNESCO 1994, Vol. 19. Paris: UNESCO, 210.
Lal, D. (1978). “Transfer of chemical species through estuaries to oceans,” in Proceedings of UNESCO/SCOR Workshop on Biogeochemistry of Estuarine Sediments, (Melreus, Belgium), 166–170.
Lian, X., Huang, J., Huang, R., Liu, C., Wang, L., and Zhang, T. (2020). Impact of city lockdown on the air quality of COVID-19 hit of Wuhan city. Sci. Total Environ. 742:140556. doi: 10.1016/j.scitotenv.2020.140556
Mahato, S., Pal, S., and Ghosh, K. G. (2020). Effect of lockdown amid COVID-19 pandemic on the air quality of the megacity of Delhi. India. Sci. Total Environ. 730:139086. doi: 10.1016/j.scitotenv.2020.139086
McClain, C. R., Feldman, G. C., and Hooker, S. B. (2004). An overview of the SeaWiFS project and strategies for producing a climate research quality global ocean bio-optical time series. Deep Sea Res. 2 51, 5–42. doi: 10.1016/j.dsr2.2003.11.001
Meybeck, M., and Ragu, A. (1997). River Discharges to the Oceans: an Assessment of Suspended Solids, Major Ions and Nutrients, Vol. 245. Nairobi: UNEP.
Miller, R. L., and McKee, B. A. (2004). Using MODIS Terra 250 m imagery to map concentrations of total suspended matter in coastal waters. Remote Sens. Environ. 93, 259–266. doi: 10.1016/j.rse.2004.07.012
Mishra, D. R., Kumar, A., Muduli, P. R., Equeenuddin, Sk. Md., Rastogi, G., Acharyya, T., et al. (2020). Decline in Phytoplankton Biomass along Indian coastal waters due to COVID-19 lockdown. Remote Sens. 12:2584. doi: 10.3390/rs12162584
Mouyen, M., Longuevergne, L., Steer, P., Crave, A., Lemoine, J. M., Save, H., et al. (2018). Assessing modern river sediment discharge to the ocean using satellite gravimetry. Nat. Commun. 9:3384. doi: 10.1038/s41467-018-05921-y
Mukhopadhyay, S. K., Biswas, H., De, T. K., and Jana, T. K. (2006). Fluxes of nutrients from the tropical River Hooghly at the land-ocean boundary of Sundabans, NE Coast of Bay of Bengal, India. J. Mar. Syst. 62, 9–21. doi: 10.1016/j.jmarsys.2006.03.004
Nechad, B., Ruddick, K., and Park, Y. (2010). Calibration and validation of a generic multi-sensor algorithm for mapping of total suspended matter in turbid waters. Remote Sens. Environ. 114, 854–866. doi: 10.1016/j.rse.2009.11.022
Odermatt, D., Gitelson, A., Brando, V. E., and Schaepman, M. (2012). Review of constituent retrieval of optically deep and complex waters from satellite imagery. Remote Sens. Environ. 118, 116–126. doi: 10.1016/j.rse.2011.11.013
Patel, P. P., Mondal, S., and Ghosh, K. G. (2020). Some respite for India’s dirtiest river? Examining the Yamuna’s water quality at Delhi during the COVID-19 lockdown period. Sci. Total Environ. 744:140851. doi: 10.1016/j.scitotenv.2020.140851
Rakshit, D., Biswas, S. N., Sarkar, S. K., Bhattacharya, B. D., Godhantaraman, N., and Satpathy, K. K. (2014). Seasonal variations in species composition, abundance, biomass and production rate of tintinnids (Ciliata: Protozoa) along the Hooghly (Ganges) River estuary, India: a multivariate approach. Environ. Monitor. Assess. 186, 3063–3078. doi: 10.1007/s10661-013-3601-9
Rao, C. K., Naqvi, S. W. A., Dileep Kumar, M., Varaprasad, S. J. D., Jayakumar, J. A., George, M. D., et al. (1994). Hydrochemistry of the Bay of Bengal: possible reasons for a different water-column cycling of carbon and nitrogen from the Arabian Sea. Mar. Chem. 47, 279–290. doi: 10.1016/0304-4203(94)90026-4
Ray, R., Rixen, T., Baum, A., Malik, A., Gleixner, G., and Jana, T. K. (2015). Distribution, sources and biogeochemistry of organic matter in a mangrove dominated estuarine system (Indian Sundarabans) during the pre-monsoon. Estuar. Coast. Shelf Sci. 167, 404–413. doi: 10.1016/j.ecss.2015.10.017
Rixen, T., Birgit, G., Kay-Christian, E., and Ramaswamy, V. (2019). The ballast effect of lithogenic matter and its influences on the carbon fluxes in the Indian Ocean. Biogeosciences 16, 485–503. doi: 10.5194/bg-16-485-2019
Rudra, K. (2014). Changing river courses in the western part of the Ganga–Brahmaputra delta. Geomorphology 227, 87–100. doi: 10.1016/j.geomorph.2014.05.013
Sadhuram, Y., Sarma, V. V., Murthy, T. V. R., and Rao, B. P. (2005). Seasonal variability of physiochemical characteristics of the Haldia channel of Hooghly estuary, India. J. Earth Syst. Sci. 114, 37–49. doi: 10.1007/BF02702007
Samanta, S., Dalai, T. K., Pattanaik, J. K., Rai, S. K., and Mazumdar, A. (2015). Dissolved inorganic carbon (DIC) and its δ13C in the Ganga (Hooghly) River estuary, India: evidence of DIC generation via organic carbon degradation and carbonate dissolution. Geochem. Cosmochim. Acta 165, 226–248. doi: 10.1016/j.gca.2015.05.040
Selvam, S., Muthukumar, P., Venkatramanan, S., Roy, P. D., Bharath, K. M., and Jesuraja, K. (2020). SARS-CoV-2 pandemic lockdown: effects on air quality in the industrialized Gurjarat state of India. Sci. Total Environ. 737:140391. doi: 10.1016/j.scitotenv.2020.140391
Shanthi, R., Poornima, D., Raja, S., Sethubathi, G. V., Thangaradjou, T., Balasubramanian, T., et al. (2013). Validation of OCM-2 sensor performance in retrieving chlorophyll and TSM along the southwest Bay of Bengal coast. J. Earth Syst. Sci. 122, 479–489. doi: 10.1007/s12040-013-0286-y
Trinh, R. C., Fichot, C. G., Gierach, M. M., Holt, B., Malakar, N. K., Hulley, G., et al. (2017). Application of Landsat 8 for monitoring impacts of wastewater discharge on coastal water quality. Front. Mar. Sci. 4:329. doi: 10.3389/fmars.2017.00329
Vaithiyanathan, P., Jha, P. K., and Subramanian, V. (1993). Phosphorus distribution in the sediments of the Hooghly (Ganges) Estuary, India. Estuar. Coast. Shelf Sci. 37, 603–614. doi: 10.1006/ecss.1993.1076
Vanhellemont, Q., and Ruddick, K. (2014). Turbid wakes associated with offshore wind turbines observed with Landsat 8. Remote Sens. Environ. 145, 105–115. doi: 10.1016/j.rse.2014.01.009
Vanhellemont, Q. (2019). Adaptation of the dark spectrum fitting atmospheric correction for aquatic applications of the Landsat and Sentinel-2 archives. Remote Sens. Environ 225, 175–192. doi: 10.1016/j.rse.2019.03.010
Vanhellemont, Q., and Ruddick, K. (2018). Atmospheric correction of metre-scale optical satellite data for inland and coastal water applications. Remote Sens. Environ. 216, 586–597. doi: 10.1016/j.rse.2018.07.015
Yunus, A. P., Masago, Y., and Hijoka, Y. (2020). COVID-19 and surface water quality: improved lake water quality due to the lockdown. Sci. Total Environ. 731:13902. doi: 10.1016/j.scitotenv.2020.139012
Zambrano-Monserrate, M. A., Ruano, M. A., and Sanchez-Alcalde, L. (2020). Indirect effects of COVID-19 on the environment. Sci. Total Environ. 728:138813. doi: 10.1016/j.scitotenv.2020.138813
Keywords: COVID-19 lockdown, water quality, Hooghly estuary, total suspended matter concentration, remote sensing
Citation: Jayaram C, Roy R, Chacko N, Swain D, Punnana R, Bandyopadhyay S, Choudhury SB and Dutta D (2021) Anomalous Reduction of the Total Suspended Matter During the COVID-19 Lockdown in the Hooghly Estuarine System. Front. Mar. Sci. 8:633493. doi: 10.3389/fmars.2021.633493
Received: 25 November 2020; Accepted: 06 April 2021;
Published: 13 May 2021.
Edited by:
Raghab Ray, University of Tokyo, JapanReviewed by:
Frida Sidik, Ministry for Marine Affairs and Fisheries of the Republic of Indonesia, IndonesiaXiaoguang Ouyang, The Chinese University of Hong Kong, China
Copyright © 2021 Jayaram, Roy, Chacko, Swain, Punnana, Bandyopadhyay, Choudhury and Dutta. This is an open-access article distributed under the terms of the Creative Commons Attribution License (CC BY). The use, distribution or reproduction in other forums is permitted, provided the original author(s) and the copyright owner(s) are credited and that the original publication in this journal is cited, in accordance with accepted academic practice. No use, distribution or reproduction is permitted which does not comply with these terms.
*Correspondence: Chiranjivi Jayaram, chvchiranjivi@hotmail.com; jayaram_cv@nrsc.gov.in