Influences of Ocean Currents on the Diets of Demersal Fish Communities in the Western North Pacific Revealed by Their Muscle Carbon and Nitrogen Isotopic Compositions
 Naoto F. Ishikawa1*
  Nanako O. Ogawa1
  Yoshito Chikaraishi1,2 Moto-omi Yamaguchi3
  Katsunori Fujikura3 Yosuke Miyairi4
  Yusuke Yokoyama1,4
  Toshi Nagata4
  Naohiko Ohkouchi1
- 1Biogeochemistry Research Center, Japan Agency for Marine-Earth Science and Technology, Yokosuka, Japan
- 2Institute of Low Temperature Science, Hokkaido University, Sapporo, Japan
- 3Marine Biodiversity and Environmental Assessment Research Center, Japan Agency for Marine-Earth Science and Technology, Yokosuka, Japan
- 4Atmosphere and Ocean Research Institute, The University of Tokyo, Kashiwa, Japan
To study the influence of different ocean currents on the trophic spectra found in a sympatric fish community, we analyzed the radiocarbon contents (Δ14C) and stable carbon (δ13C) and nitrogen (δ15N) isotopic compositions in their bulk muscle tissues and the δ15N of individual amino acids in 26 species of demersal fish collected from off Tohoku (Pacific coast), northeastern Japan. The Δ14C values of the fish varied from –42 to +41‰, consistent with the Δ14C of the dissolved inorganic carbon in the cold Oyashio Current (typically about –50‰) and the warm Kuroshio Current (typically about +50‰). The trophic positions (TPs) of the fish estimated from the δ15N values of amino acids increased from 3.1 to 4.5 with increasing snout length. A negative correlation was observed between Δ14C and TP in gadiform fish and flatfish, suggesting that the Oyashio Current delivers a high TP diet to these fish groups. These results suggest that the trophic ecology of marine fish in the coastal western North Pacific is primarily controlled by the two major surface water currents, but is also significantly influenced by a combination of species-specific feeding and migration strategies.
Introduction
Surface ocean currents play an important role in controlling primary production, ecosystem structures, and fisheries resources (Ganachaud and Wunsch, 2000; Toggweiler and Russell, 2008). The interfrontal regions in which different currents meet and mix are important sites for local fishery grounds, because their high primary production is supported by different temperature, salinity, and nutrient profiles (Yatsu et al., 2013). The Sanriku region, in the western North Pacific, is one such region (Shiozaki et al., 2020), yielding the world’s largest fish catch of 22.4 million tons per year (FAO, 2018). In the Sanriku region, the cold Oyashio Current (of the northwestern subarctic gyre) meets the warm northward Kuroshio Current (of the western subtropical gyre) around middle latitudes. The warm Tsugaru Current, which originates in the Kuroshio Current, also contributes significantly to the water masses, especially nearshore on the Sanriku coast (Hanawa and Mitsudera, 1987; Itoh et al., 2016; Figure 1). Understanding ecosystem structures and functions is essential for sustainable fisheries and resource use, and yet fundamental information is still largely unavailable, including the sources of carbon and nitrogen in the benthic ecosystems off the Sanriku region.
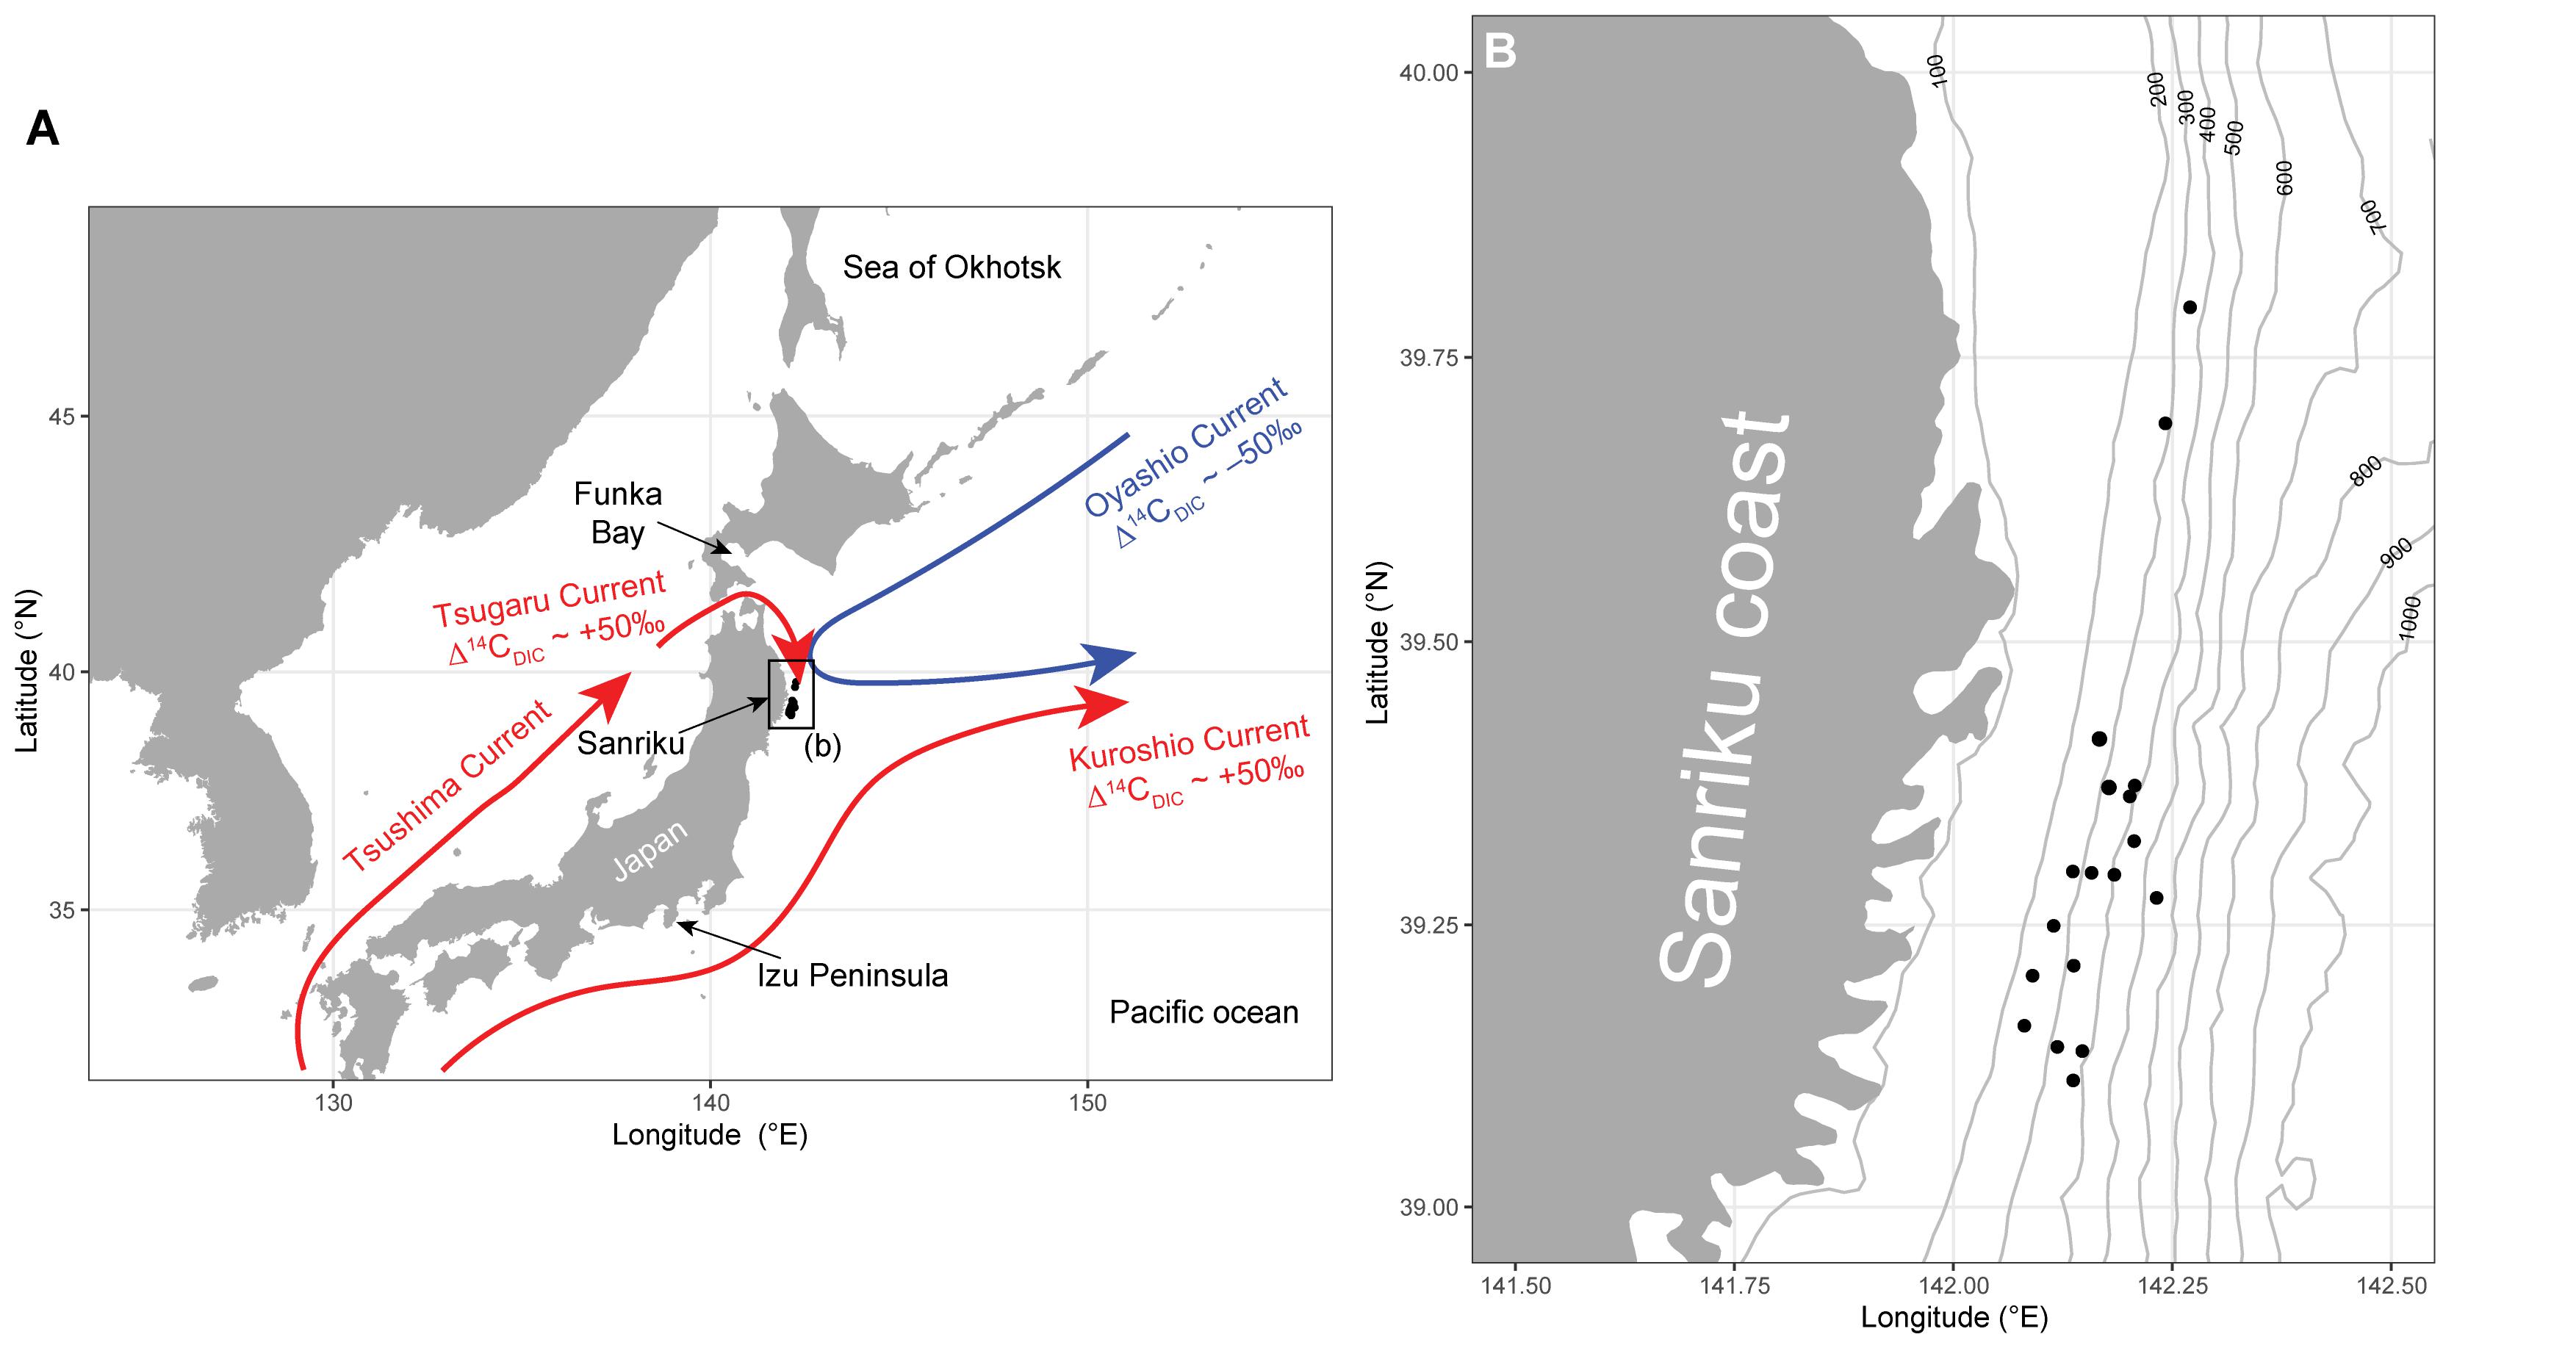
Figure 1. (A) Locations of the sampling sites (black circles) off the Pacific coast of Tohoku (Sanriku), Japan. Three major ocean currents (cold Oyashio Current in blue and warm Tsushima/Tsugaru and Kuroshio currents in red) are shown. (B) Sampling sites (black circles) at Sanriku. Contour lines denote water depth (m.b.s.l.).
Primary production in the surface ocean is supported by the uptake of dissolved inorganic carbon (DIC) and nitrogen by phytoplankton during their photosynthesis in the euphotic zone. Stable carbon (δ13C) and nitrogen (δ15N) isotopic compositions have been used as indicators of the diet sources and trophic positions (TPs), respectively, of marine organisms for the past four decades (e.g., Wada et al., 1987; Pinnegar and Polunin, 2000; Zintzen et al., 2013). Both the δ13C and δ15N values of primary producers, such as phytoplankton, are determined by the fractionations against 13C and 15N during the fixation from inorganic sources (Nakatsuka et al., 1992), and are primarily characterized by local productivity. From lower to higher TPs, the δ15N value increases while δ13C remains unchanged (Wada et al., 1987; Sweeting et al., 2007).
14C is the radioactive isotope of carbon with a half-life of 5,730 years. It is produced in the earth’s upper atmosphere by cosmogonic radiation. The 14C content (Δ14C) in the DIC of ocean water reflects the source and/or age of its carbon. The Oyashio Current (Δ14CDIC typically about –50‰) is influenced by convective mixing with subsurface waters in the subarctic Pacific. By contrast, the DIC in the Kuroshio Current and the downstream Tsugaru Current (Δ14CDIC typically about +50‰) is well equilibrated with the contemporary atmospheric CO2 (Kubota et al., 2018; Larsen et al., 2018; Satoh, 2020; Figure 1). Furthermore, warm and low-salinity water masses (e.g., Kuroshio Current) with higher Δ14CDIC dominate the surface layer, whereas cold and high-salinity water masses (e.g., Oyashio Current) with lower Δ14CDIC dominate the deep layer in the western North Pacific (Ding et al., 2018). The Δ14CDIC value in the surface water is transferred to photosynthetic phytoplankton, where Δ14C is corrected for isotopic fractionation associated with CO2 assimilation using δ13C, assuming a mass dependent fractionation relationship between δ13C and δ14C (Stuiver and Polach, 1977). Therefore, the Δ14C of fish should reflect the Δ14CDIC of the local seawater and the species-specific migration history, which integrates the various Δ14CDIC values of different oceans.
The compound-specific nitrogen isotope analysis of amino acids (CSIA-AA) is a tool that has emerged in recent years and offers a significant advantage over the conventional bulk isotope analysis. This is because the TPs of marine organisms can be determined by the difference in δ15N between glutamic acid (trophic amino acid) and phenylalanine (source amino acid), with no requirement to characterize the δ15N value of phytoplankton (Chikaraishi et al., 2009). Fish TPs can potentially be used to explore how the Δ14C diversity found in a sympatric fish community is integrated with trophic transfer, or conversely, how the ecological niche of a fish species controls its carbon sources and Δ14C. Several studies have also demonstrated that the δ15N value of phenylalanine is a more precise proxy for the nitrogen sources (i.e., inorganic nitrogen, such as nitrate) than the bulk δ15N value, and can be used as a tracer for migratory fish (Vokhshoori and McCarthy, 2014; Matsubayashi et al., 2020).
In the present study, we studied the trophic ecology of demersal fish in the north-west Pacific Ocean below 200 m. We focused specifically on determining the relationship between the mixing of different ocean currents and the trophic spectra found in the fish community off Sanriku. We hypothesized that Oyashio-dependent fish would show higher TP than Kuroshio-dependent fish because the former feeds on higher-TP foods sourced from the subarctic North Pacific (Matsubayashi et al., 2020). Demersal fish were targeted because they occupy a near-apical position in the hierarchy of the seafloor ecosystem, which integrates energy flow through the trophic pathway in the benthic food web. In addition to conventional bulk δ13C and δ15N analyses, we used Δ14C and amino acid δ15N values of fish to trace their carbon sources and TPs, respectively.
Materials and Methods
Study Sites
In collaboration with the Tohoku Ecosystem-Associated Marine Sciences (TEAMS), we collected a variety of demersal fish using a trawl net at water depths of 200–500 m off the Sanriku coast during the research cruise of R/V Iwate-maru in 2012 to 2014 (Figure 1). A detailed description of this sampling is provided in Ohkouchi et al. (2016).
Sample Collection
Detailed information on the fish samples is provided in Supplementary Table 1. In total, 53 individuals from 26 fish species were used in the analysis (Supplementary Table 1). After the snout length (SnL), which was expected to affect the type of foods consumed, was measured, a small piece of muscle near the dorsal fin was excised, freeze dried, and defatted with methanol and dichloromethane (Ohkouchi et al., 1997). It should be noted that some species had relatively high carbon to nitrogen ratios (g/g, >4.0), suggesting that our defatting procedure did not work for some of the samples (Supplementary Table 1). The samples were stored at –20°C until further processing.
Bulk Stable Isotope Measurements
We measured the carbon to nitrogen ratios (C/N, g/g) and the stable isotope ratios of carbon (δ13C) and nitrogen (δ15N) in the fish samples with a modified Flash EA1112 elemental analyzer connected to a Delta plus XP isotope ratio mass spectrometer with a Conflo III interface (Thermo Finnigan, Bremen, Germany) (Ogawa et al., 2010). The δ13C and δ15N values were reported relative to those of the Vienna Pee Dee Belemnite (VPDB) and atmospheric N2 (AIR), respectively, as follows:
The data were calibrated using three internal standards (BG-T: L-tyrosine, δ13CVPDB = –20.83‰, δ15NAIR = 8.74‰; BG-P: L-proline, δ13CVPDB = –10.27‰, δ15NAIR = 13.51‰; and CERKU-01: DL-alanine, δ13CVPDB = –25.36‰, δ15NAIR = –2.89‰; Tayasu et al., 2011). The analytical errors of the δ13C and δ15N measurements obtained by the repeated analysis of BG-T were less than ±0.3‰ for δ13C (n = 18, 1.6–75.2 μgC) and less than ±0.4‰ for δ15N (n = 17, 0.21–9.75 μgN).
Radiocarbon Measurements
The radiocarbon content (Δ14C) of the bulk fish muscle (approximately 4 mg dry weight) was measured with a single-stage accelerator mass spectrometry (AMS) equipped with an elemental analyzer at the Atmosphere and Ocean Research Institute, the University of Tokyo, with analytical errors typically smaller than 3‰ (Yokoyama et al., 2019). Δ14C values were reported after δ13C correction with the following equation (Stuiver and Polach, 1977):
where δ14C was defined as the 14C content of the sample relative to the international standard (HOx II oxalic acid) (Stuiver and Polach, 1977).
Amino Acid δ15N and TPs
The amino acids were extracted from the fish samples with HCl hydrolysis and then derivatized to N-pivaloyl-isopropyl esters (Pv/iPr) with the improved procedures described by Chikaraishi et al. (2010). In brief, the samples were hydrolyzed with 12 M HCl at 110°C for 12 h. Each hydrolysate was washed with n-hexane/dichloromethane (3/2, v/v) to remove any hydrophobic constituents (e.g., lipids). After the samples were defatted and dried under N2 gas flow, they were derivatized sequentially with thionyl chloride/2-propanol (1/4, v/v) and pivaloyl chloride/dichloromethane (1/4, v/v). The Pv/iPr derivatives of the amino acids were extracted from the final fraction with n-hexane/dichloromethane (3/2, v/v) before gas chromatographic separation.
The δ15N values of individual amino acids were determined with a Delta plus XP isotope ratio mass spectrometer, coupled to an Agilent 6890N, via a Conflo III interface with combustion (950°C) and reduction (550°C) furnaces (Thermo Finnigan). The Pv/iPr-derivatized amino acids were injected with a programmable-temperature vaporizing (PTV) injector (Gerstel, Germany). The PTV temperature was held at 50 °C (initial temperature) for 0.3 min, increased from 50 to 350°C at a rate of 600°C min−1, and held at 350°C for 10 min. The flow rate of the carrier gas (He) was controlled with a constant flow mode at 1.4 mL min−1. The gas chromatograph oven temperature was held at 40°C (initial temperature) for 3.0 min, increased at 15°C min−1 to 110°C, increased at 3°C min−1 to 150°C, increased at 6°C min−1 to 220°C, held at 260°C for 18 min, and held at the final temperature for 5 min. The amino acids were separated on a column (HP-Ultra 2, 0.32 mm × 50 m, film thickness 0.52 μm; Agilent Technologies) before they were introduced into the IRMS (Chikaraishi et al., 2010). An isotopic reference mixture of nine amino acids (i.e., alanine, glycine, leucine, norleucine, aspartic acid, methionine, glutamic acid, phenylalanine, and hydroxyproline), with δ15N values ranging from −26.6 to +45.6‰ (Indiana University, United States; SI Science, Japan), was analyzed every 5–6 injections to confirm the reproducibility of the isotope measurements. Three and two pulses of the reference cylinder N2 gas were measured for calibration at the beginning and end of each run, respectively. The δ15N values of all the samples (>0.5 nmol N) were corrected using the regression line between the published δ15N values and the measured δ15N values for our internal amino acid standards (i.e., the above nine amino acid mixture, Ohkouchi et al., 2017). The analytical errors (1σ) of the standards were smaller than 0.8‰.
The TPs of the fish were calculated as follows:
where δ15NGlu and δ15NPhe are the δ15N values for glutamic acid and phenylalanine in the samples, respectively; 3.4 is the initial offset (‰) of δ15NGlu and δ15NPhe found in phytoplankton; and 7.6 is the trophic discrimination factor offset (‰) between δ15NGlu (8.0 ± 1.2‰) and δ15NPhe (0.4 ± 0.5‰) (Chikaraishi et al., 2009). Thirty-five out of the 50 total TP data were published in our previous paper (Ohkouchi et al., 2016) (see Supplementary Table 1).
Database Search
We browsed the biogeographic data for the studied fish species (latitude, longitude, and depth at which catches were recorded) in the open-source database Biological Information System for Marine Life (BISMaL).1 The recorded latitude for each species was used to determine the distribution of the fish between the subarctic Oyashio Current (high latitude) and the subtropical Kuroshio Current (low latitude). The depth record of each fish species in BISMaL was used to examine the effect of water depth on the isotopic compositions of the fish.
Statistical Analysis
A regression analysis and the Welch’s two-sample t-test were used to examine the significance of differences among sampling locations (water depth, latitude, and longitude), SnL, bulk δ13C, δ15N, and Δ14C (δ13CBulk, δ15NBulk, and Δ14CBulk, respectively), δ15N of phenylalanine (δ15NPhe), and TPs for each fish sample. Some isotope data are not available (Supplementary Table 1). Based on the number of replicates available at the level of fish orders, we categorized the data into three groups: gadiform fish (the order Gadiformes); flatfish (the order Pleuronectiformes); and other demersal fish (the families Pterothrissidae, Synaphobranchidae, Sebastolobidae, Ereuniidae, Cottidae, Psychrolutidae, Agonidae, Liparidae, and Zoarcidae). All statistical analyses and graphing were performed with R 3.5.3 (R Development Core Team, 2019). Statistical significance was set at α = 0.05.
Results
Gadiform fish had significantly higher SnL than flatfish (Welch’s two-sample t-test, t = 3.06, df = 19.6, p = 0.006). We observed considerable variations in the bulk δ13C (δ13CBulk,–25.5‰ to –16.5‰, n = 49) and δ15N values (δ15NBulk, +10.4 to +15.3‰, n = 52) of the fish, indicating that their carbon and nitrogen sources and their trophic positions varied widely (Figures 2, 3). In particular, the δ13CBulk values of the gadiform fish (–19.9 ± 1.9‰, mean ± SD, n = 18) and other demersal fish (–18.9 ± 1.8‰, n = 20) were lower and more variable than those of the flatfish (–18.0 ± 0.9‰, n = 11). We found no significant relationship between sampling depth, latitude, or longitude and δ13CBulk (n ≥ 42, r2 < 0.02, p > 0.41) or δ15NBulk (n ≥ 44, r2 < 0.06, p > 0.10), except for the effect of longitude on δ15NBulk (n = 47, r2 = 0.11, p = 0.04). The SnL showed significantly negative and positive correlations with δ13CBulk (n = 48, r2 = 0.10, p = 0.03) and δ15NBulk (n = 51, r2 = 0.19, p = 0.001), respectively (Figure 3).
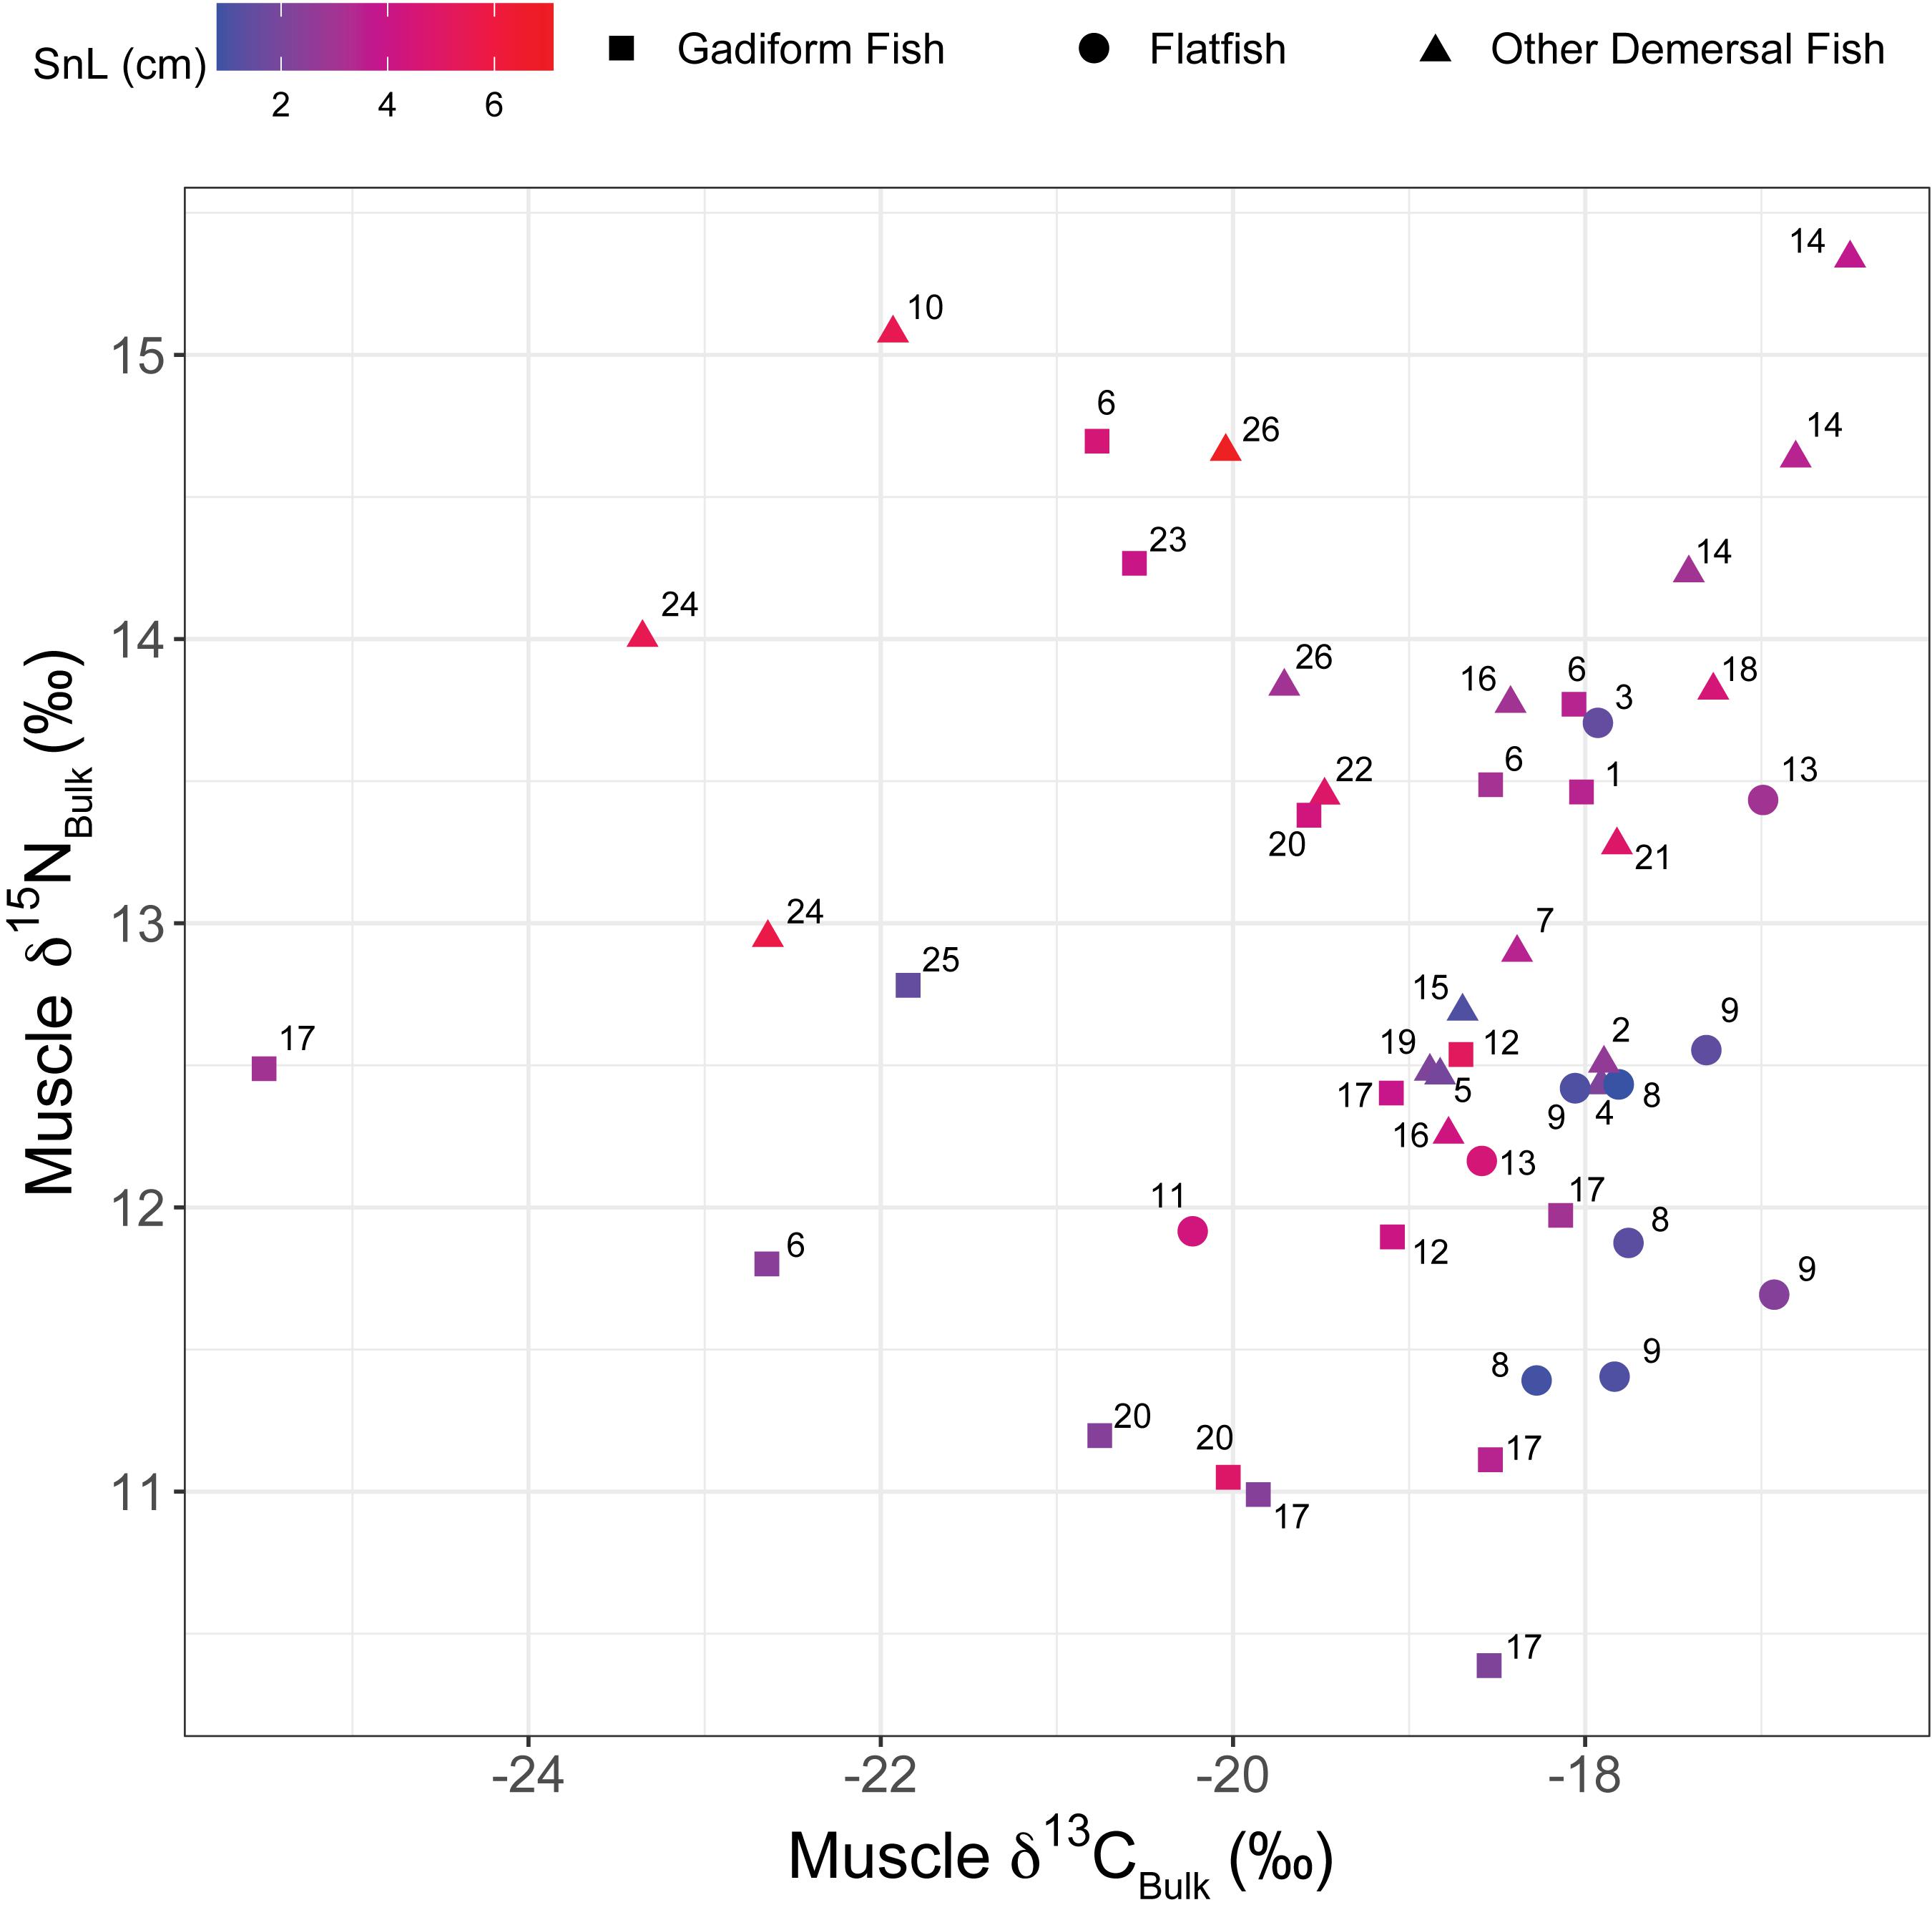
Figure 2. Plot of muscle δ15NBulk versus δ13CBulk. Colors denote the snout length (SnL). Numbers beside symbols indicate species: 1) short-tail grenadier Nezumia proxima; 2) deepsea bonefish Pterothrissus gissu; 3) slime flounder Microstomus achne; 4) Marukawichthys ambulator; 5) broadbanded thornyhead Sebastolobus macrochir; 6) Japanese codling Physiculus japonicus; 7) soft eelpout Bothrocara zestum; 8) Korean flounder Glyptocephalus stelleri; 9) Rikuzen sole Dexistes rikuzenius; 10) Ebinania vermiculata; 11) roughscale sole Clidoderma asperrimum; 12) Pacific cod Gadus macrocephalus; 13) flathead flounder Hippoglossoides dubius; 14) darkfin sculpin Malacocottus zonurus; 15) longnose poacher Sarritor leptorhynchus; 16) jelly eelpout Bothrocara tanakae; 17) walleye pollock Gadus chalcogrammus; 18) zoarcid Lycodes hubbsi; 19) snailfish Careproctus pellucidus; 20) threadfin hakeling Laemonema longipes; 21) elkhorn sculpin Alcichthys elongatus; 22) snail-fin poacher Podothecus sachi; 23) flat-nosed hake Antimora microlepis; 24) Kaup’s arrowtooth eel Synaphobranchus kaupii; 25) longarm grenadier Abyssicola macrochir; and 26) spinyhead sculpin Dasycottus setiger. Species #1–21 are listed in order of the southern limits of their biogeographical distributions, from low to high latitudes, based on BISMaL records.
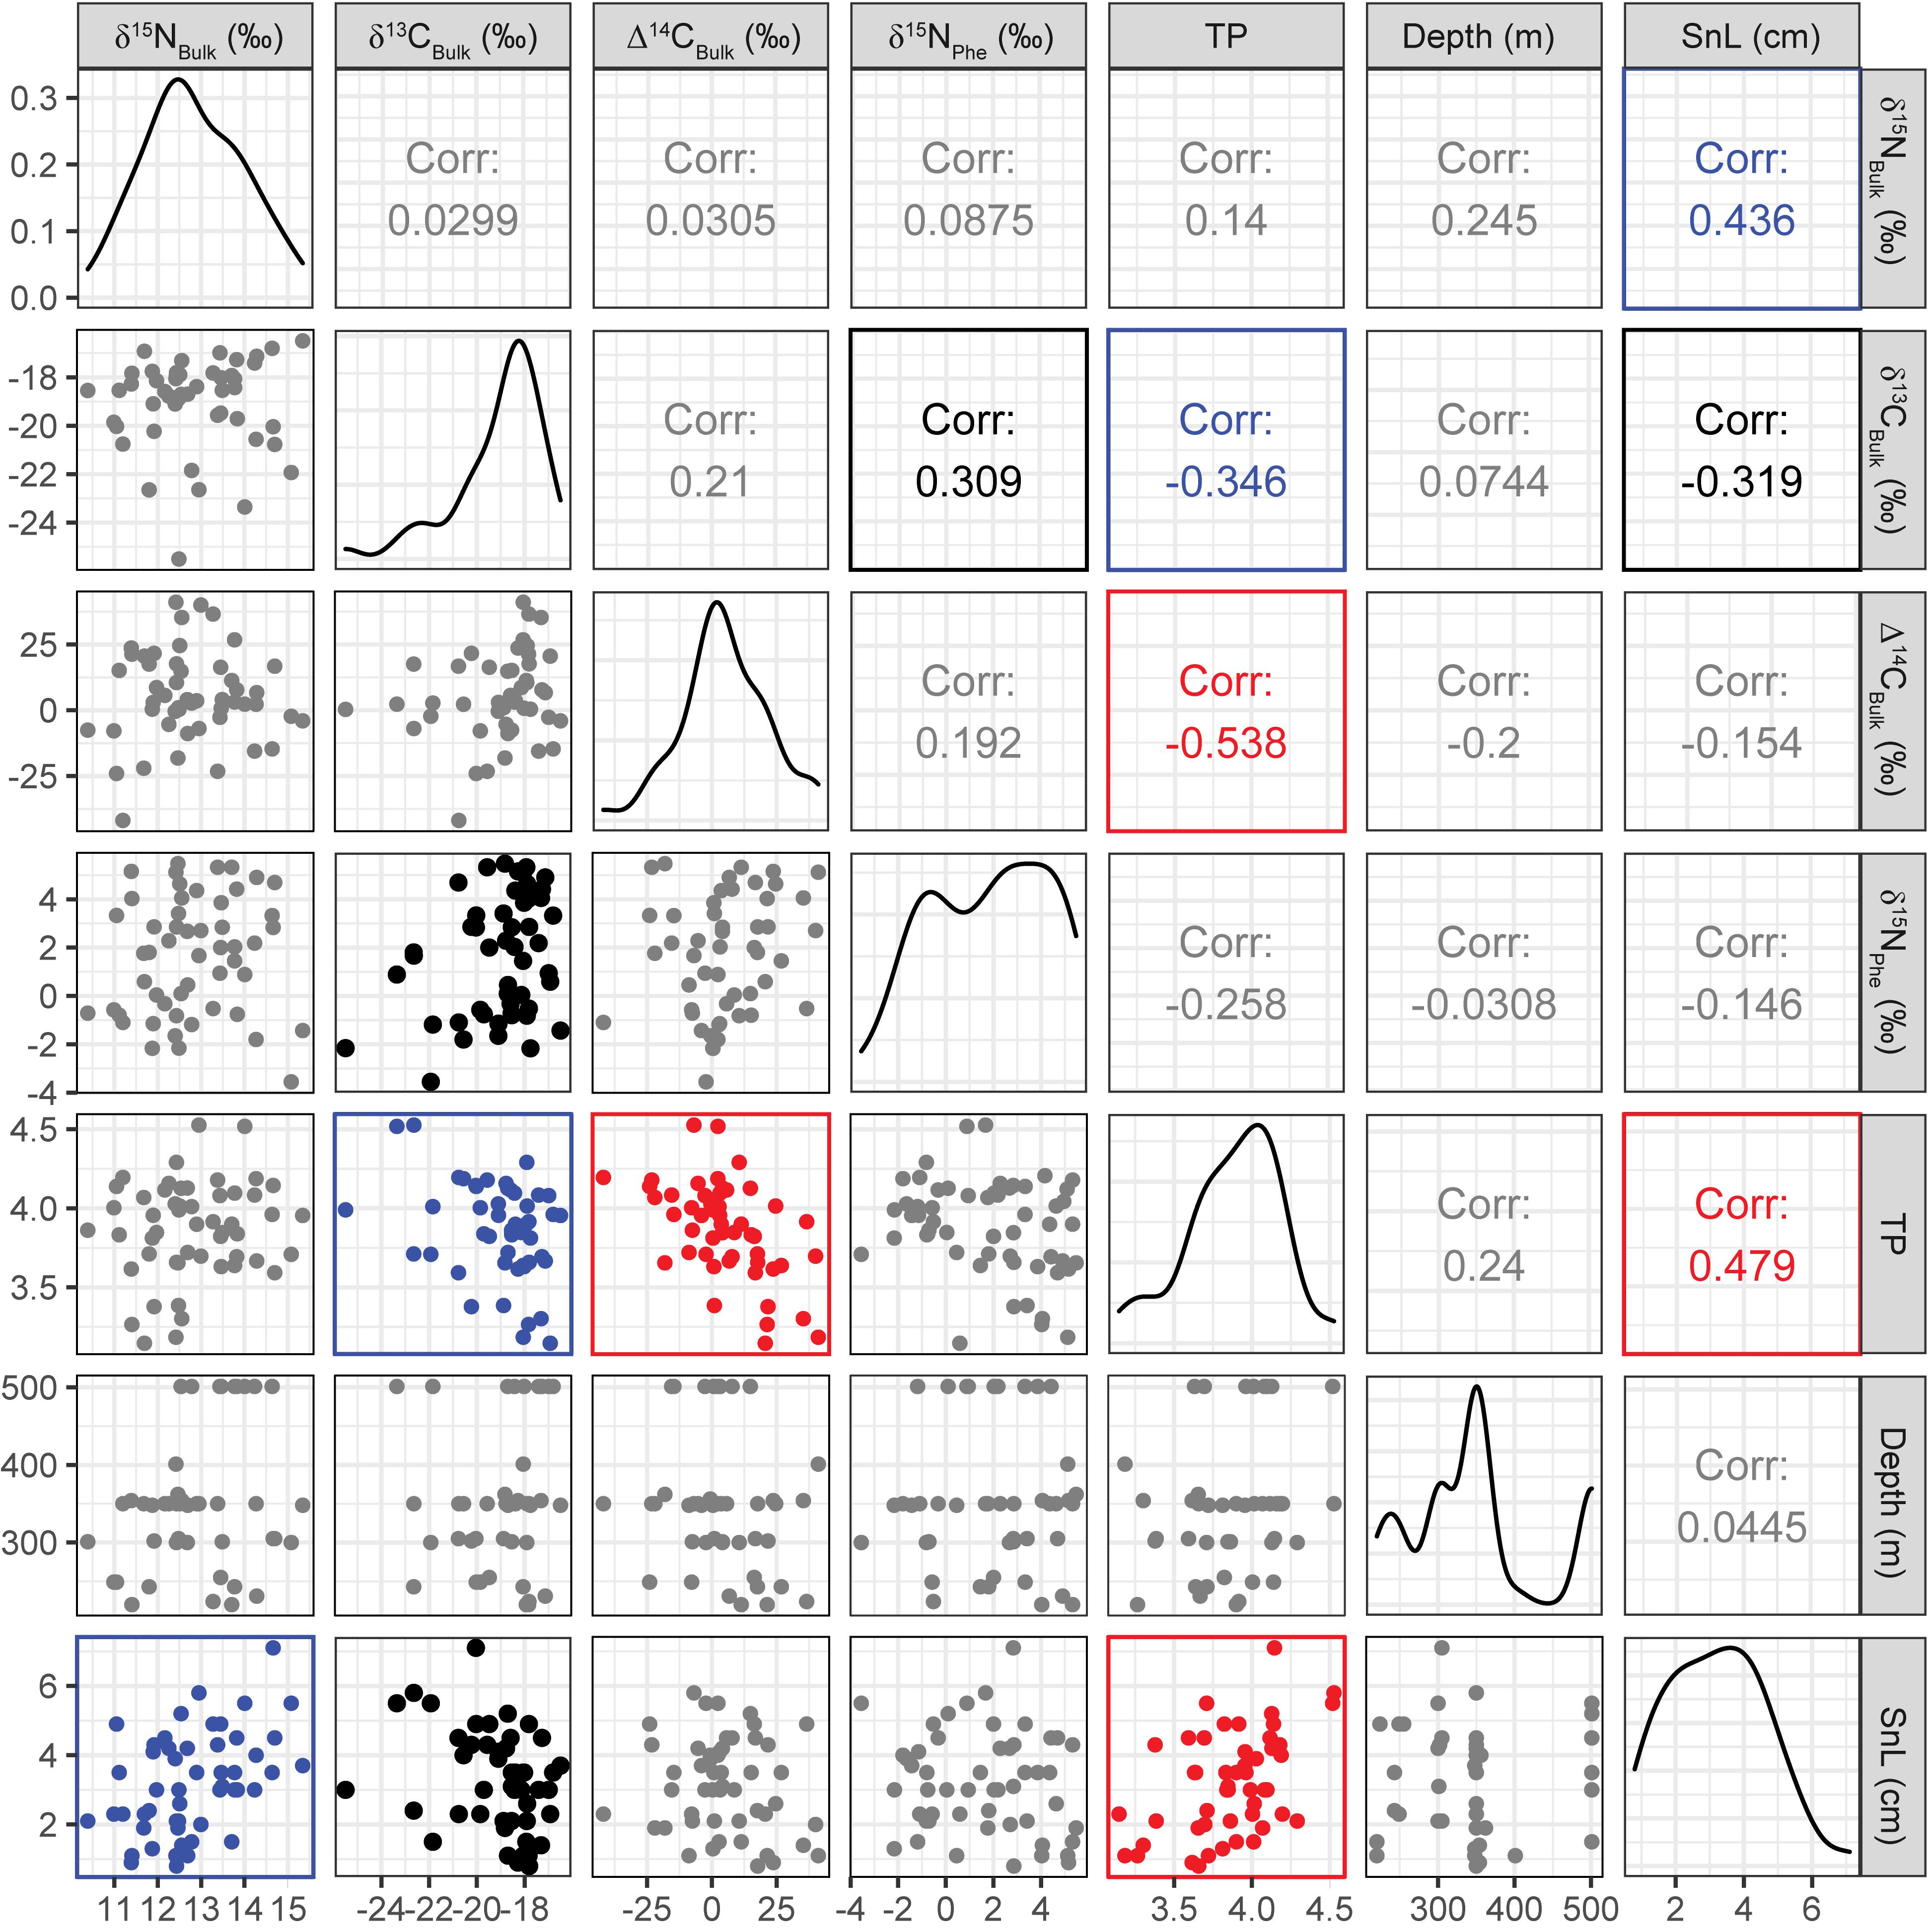
Figure 3. Correlation matrix plot for seven major variables. Scatter plots, correlation coefficients (i.e., r values), and data distributions are displayed on the bottom left, top right, and center, respectively. Plots and numbers shown in red (p < 0.001), blue (p < 0.01), and black (p < 0.05) indicate significant correlations, and those in gray indicate insignificant (p ≥ 0.05) correlations.
The Δ14CBulk values of the fish ranged from –42 to +41‰ (+5.2 ± 17‰, mean ± SD, n = 51) (Figures 3, 4) and were unrelated to SnL (n = 50, r2 = 0.02, p = 0.28). We found no significant effect of sampling depth, latitude, or longitude on Δ14CBulk (n ≥ 44, r2 < 0.04, p > 0.19). The correlations between Δ14CBulk and δ13CBulk (n = 47, r2 = 0.04, p = 0.16) and between Δ14CBulk and δ15NBulk (n = 50, r2 < 0.01, p = 0.83) were not significant (Figure 3). The lowest Δ14CBulk values were found in Laemonema longipes (gadiform fish, threadfin hakeling, –41 to –22‰, n = 4), whereas the highest Δ14CBulk values were found for Dexistes rikuzenius (flatfish, Rikuzen sole), Glyptocephalus stelleri (flatfish, Korean flounder), and Alcichthys elongatus (Elkhorn sculpin) (+35 to +41‰, n = 4) (Figure 4). Among the gadiform fish, the deep-layer-inhabiting L. longipes (n = 4) showed Δ14CBulk values 26.1–68.7‰ lower than those of the shallow-layer-inhabiting Physiculus japonicus (Japanese codling, n = 4) (Figure 4). Similarly, among the flatfish, the deep-layer-inhabiting Hippoglossoides dubius (flathead flounder, n = 2) showed Δ14CBulk values 14.9–44.4‰ lower than those of the shallow-layer-inhabiting D. rikuzenius (n = 4). We detected intraspecies variations in Δ14CBulk as large as 39.6‰ for G. stelleri (n = 4) and 20.5‰ for D. rikuzenius (n = 4) (Figure 4).
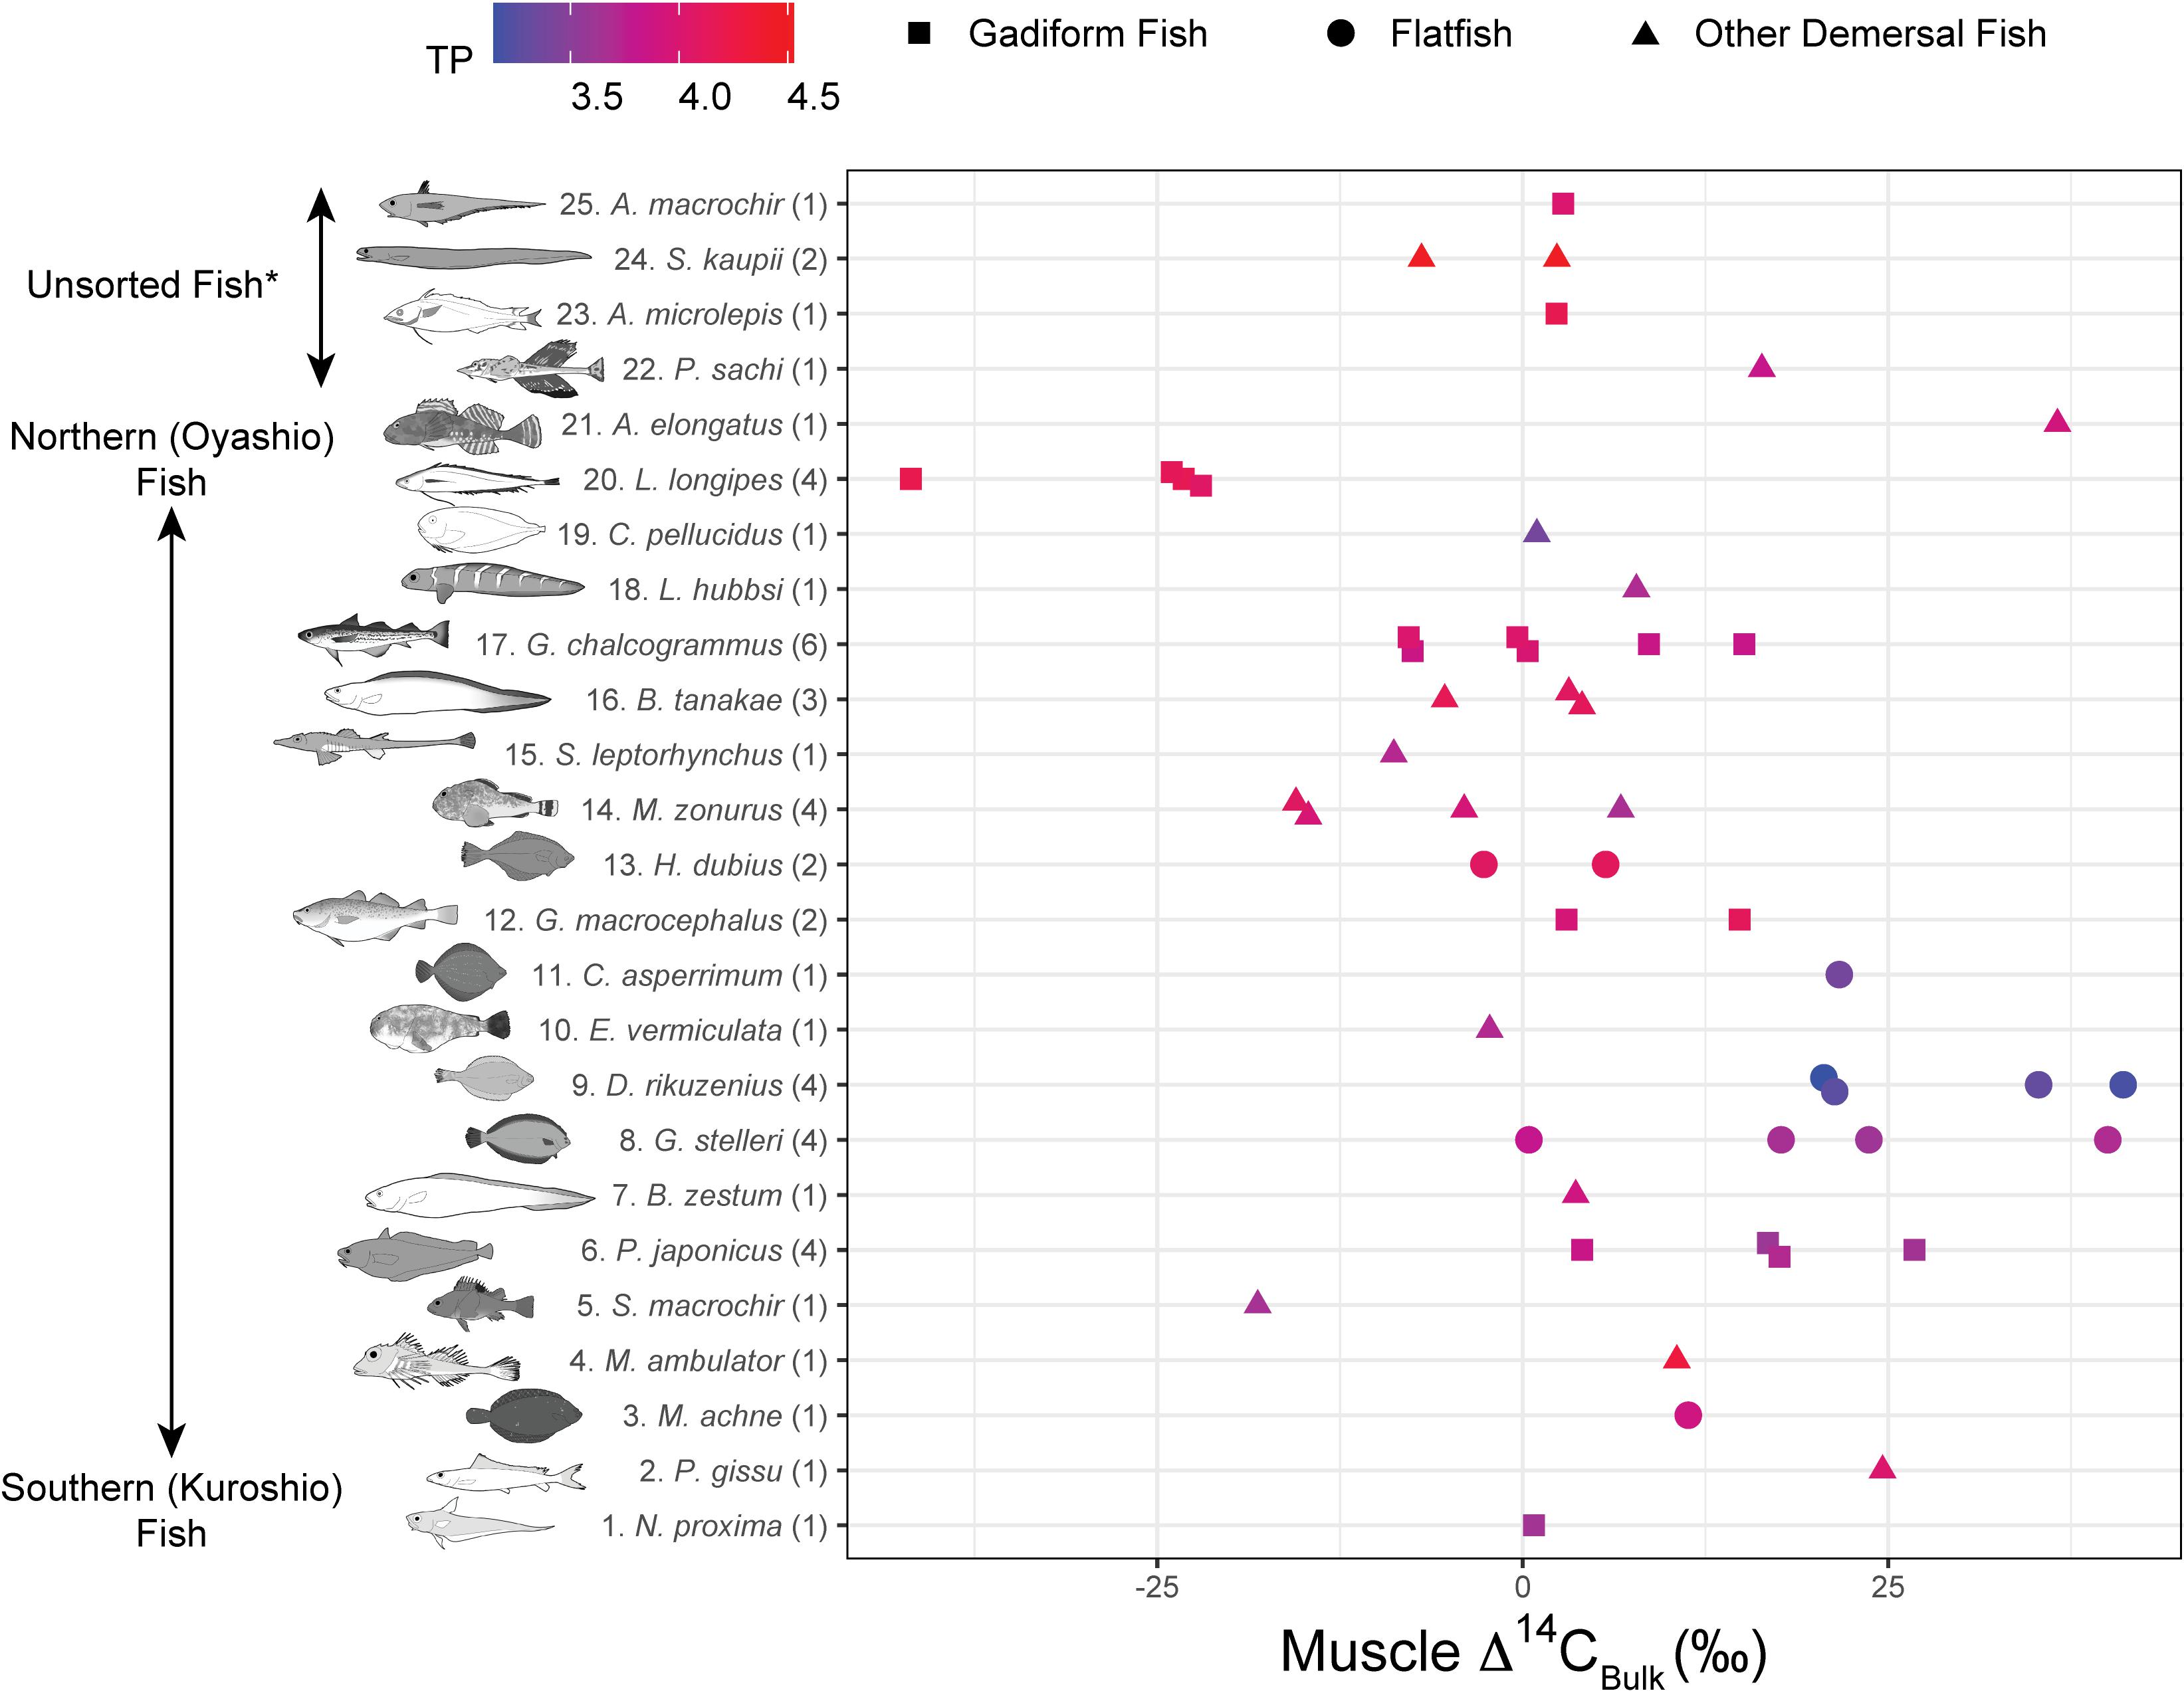
Figure 4. Muscle Δ14CBulk rank plotted against fish species. Numbers in parentheses indicate replicates. Colors denote trophic positions (TPs). For species #22–26 (*Unsorted Fish), either the biogeographic distribution is poorly known or not limited to the Pacific Ocean, or isotope data are lacking.
The fish δ15N values for glutamic acid (δ15NGlu) ranged from +20.3 to +32.9‰ (+27.1 ± 2.9‰, mean ± SD, n = 55), whereas those for phenylalanine (δ15NPhe) ranged from –3.6‰ to +5.5‰ (+1.8 ± 2.5‰, mean ± SD, n = 55) (Figure 5). δ15NPhe and TP correlated with the δ13CBulk values (δ15NPhe: n = 49, r2 = 0.10, p = 0.03; TP: n = 49, r2 = 0.12, p = 0.01), but not with the δ15NBulk values (n = 52, r2 < 0.02, p > 0.32) (Figure 3). A marginally significant negative correlation was observed between TP and δ15NPhe (n = 55, r2 = 0.07, p = 0.06) (Figure 3). We found no significant effects of sampling depth, latitude, or longitude on δ15NPhe (n ≥ 44, r2 < 0.05, p > 0.15) or TP (n ≥ 44, r2 < 0.07, p > 0.07). The TP of the fish ranged from 3.1 to 4.5 (3.8 ± 0.3, mean ± SD, n = 55) and correlated positively with SnL (n = 51, r2 = 0.23, p < 0.001) (Figure 3). Synaphobranchus kaupii (Kaup’s arrowtooth eel, TP: 4.5, n = 2) and D. rikuzenius (Rikuzen sole, TP: 3.1–3.3, n = 4) showed the highest and lowest TPs, respectively. The intraspecies variations in TP were smaller than 0.4 units, and occurred in species such as Malacocottus zonurus (darkfin sculpin, TP: 3.7–4.1, n = 4), P. japonicus (gadiform fish, TP: 3.6–3.9, n = 4), Gadus chalcogrammus (gadiform fish, walleye pollock, TP: 3.8–4.0, n = 6), and G. stelleri (flatfish, Rikuzen sole TP: 3.6–3.8, n = 4) (Figure 6). A significantly negative correlation between TP and Δ14CBulk was observed within the gadiform fish (n = 19, r2 = 0.46, p = 0.001) and flatfish (n = 12, r2 = 0.49, p = 0.01) (Figure 6).
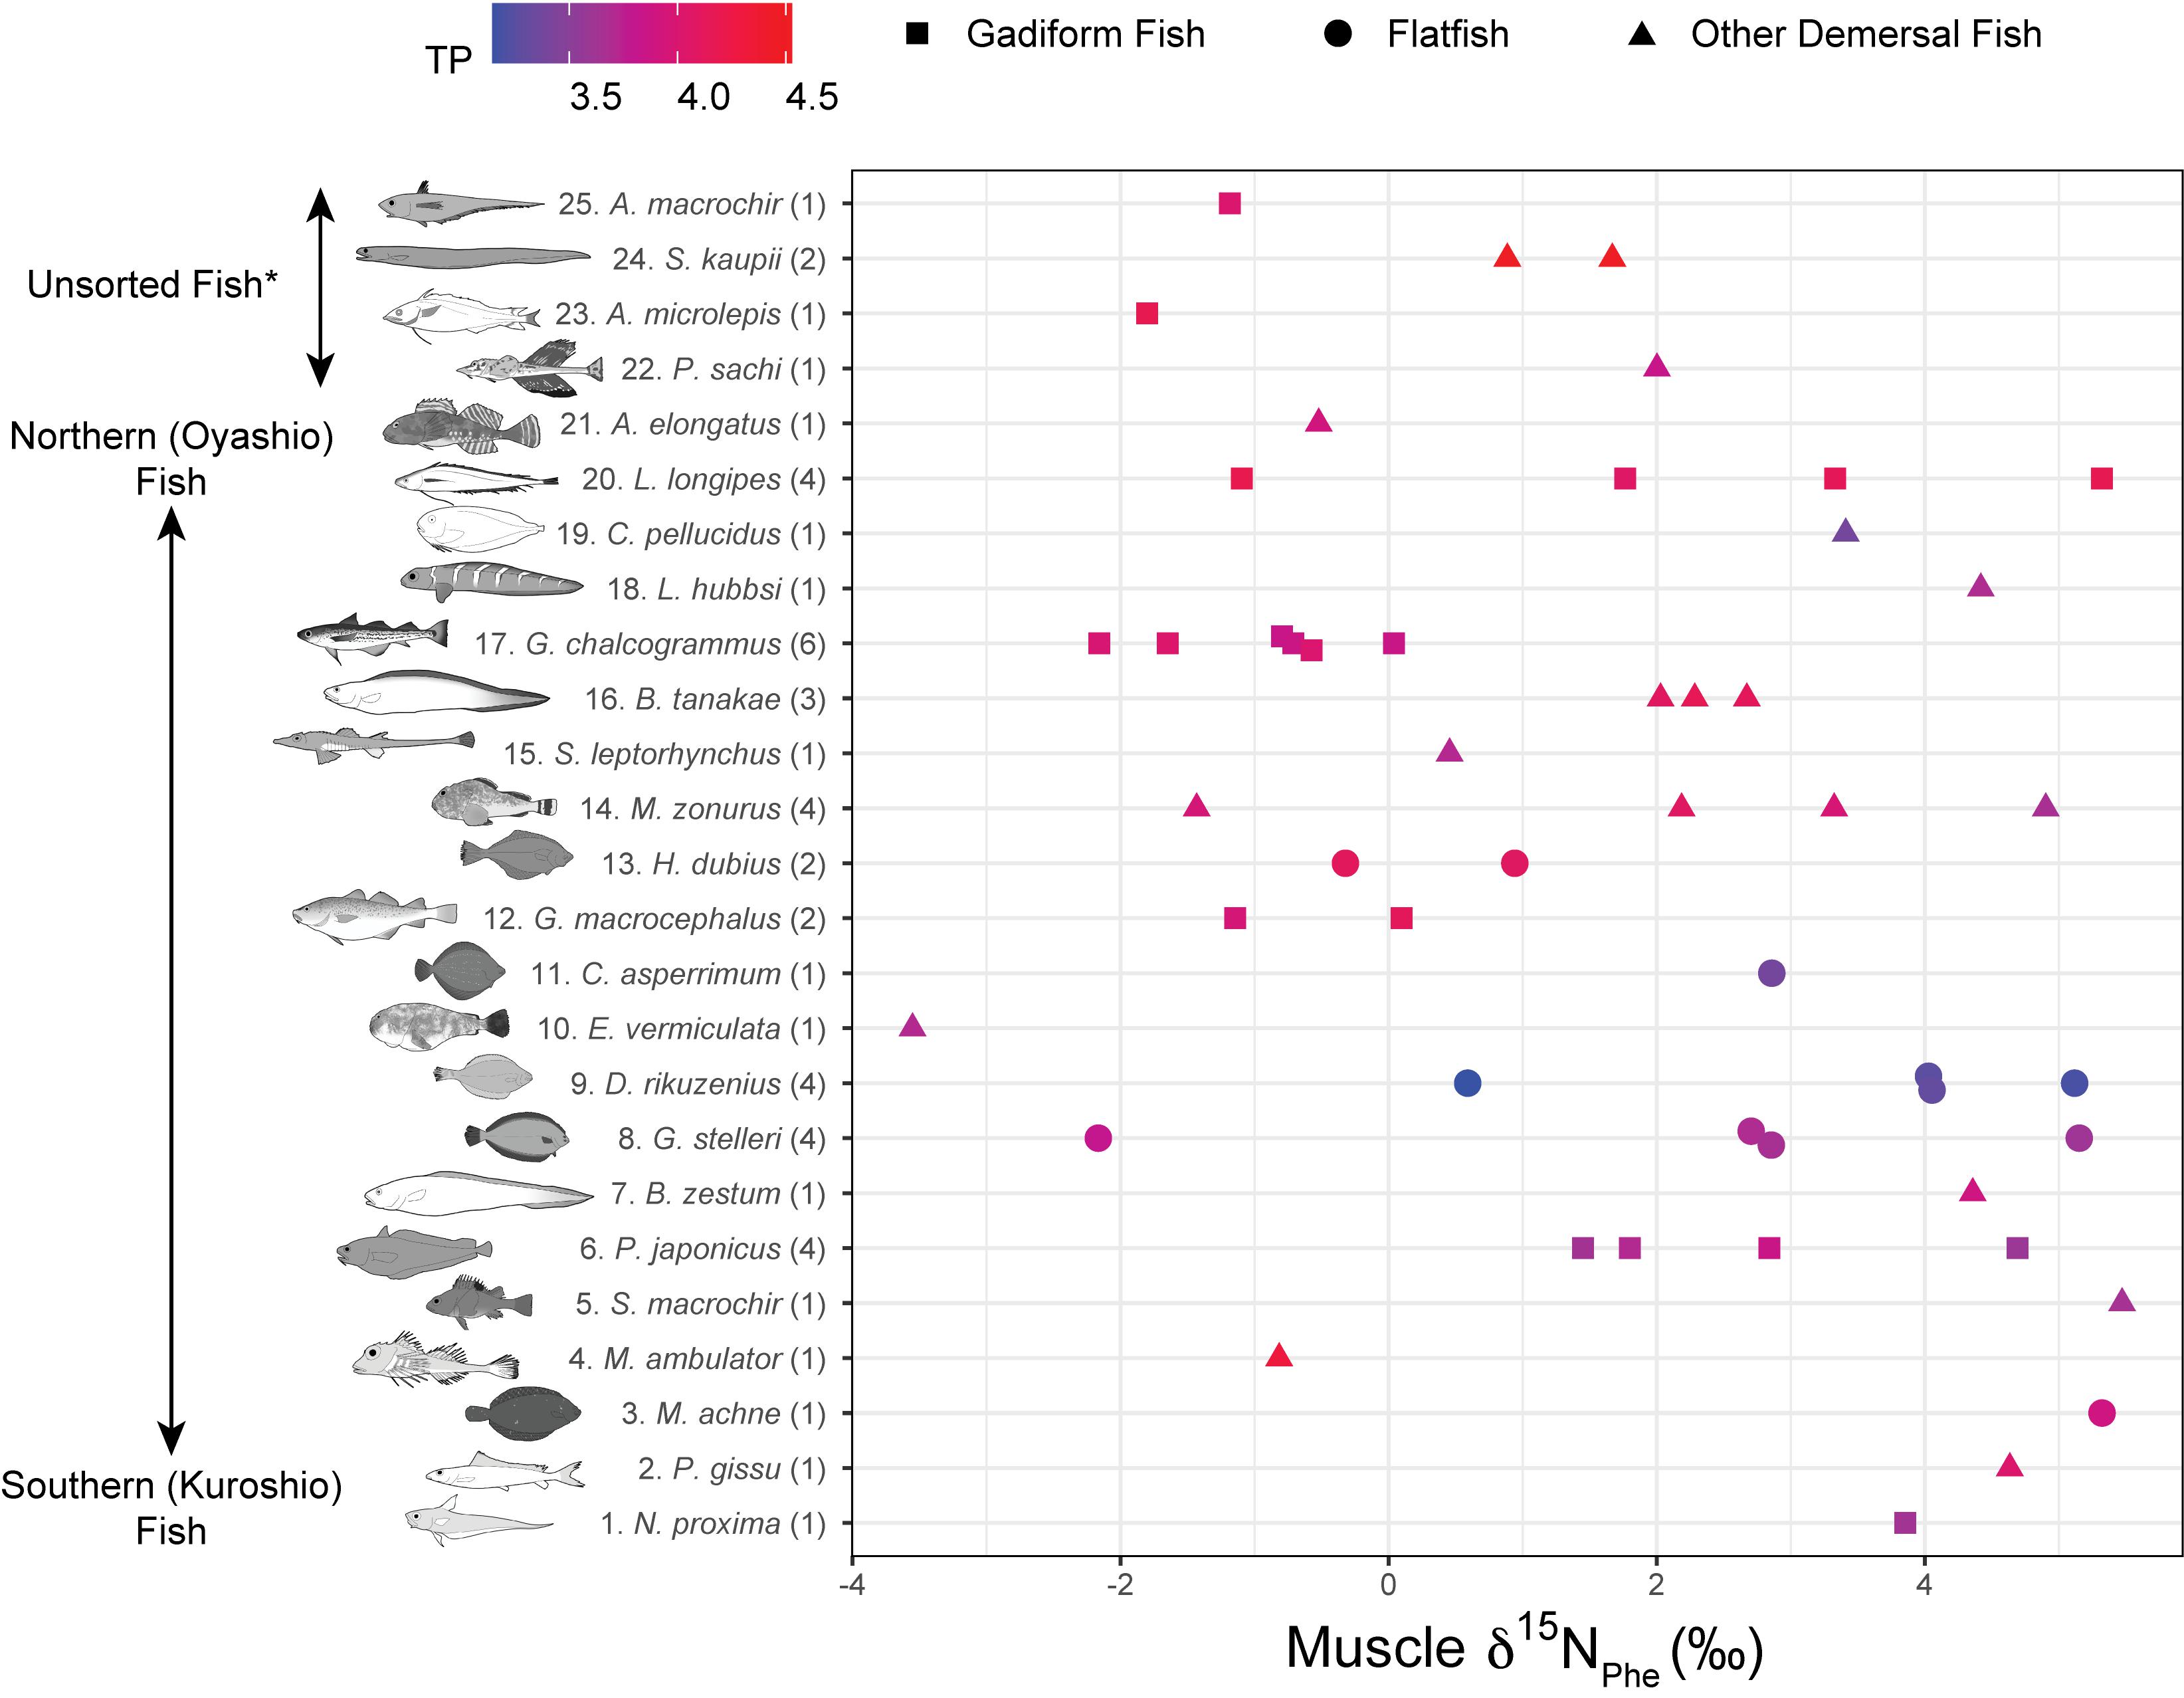
Figure 5. Muscle δ15NPhe rank plotted against fish species. Numbers in parentheses indicate replicates. Colors denote trophic positions (TPs). *Unsorted Fish: same as Figure 4.
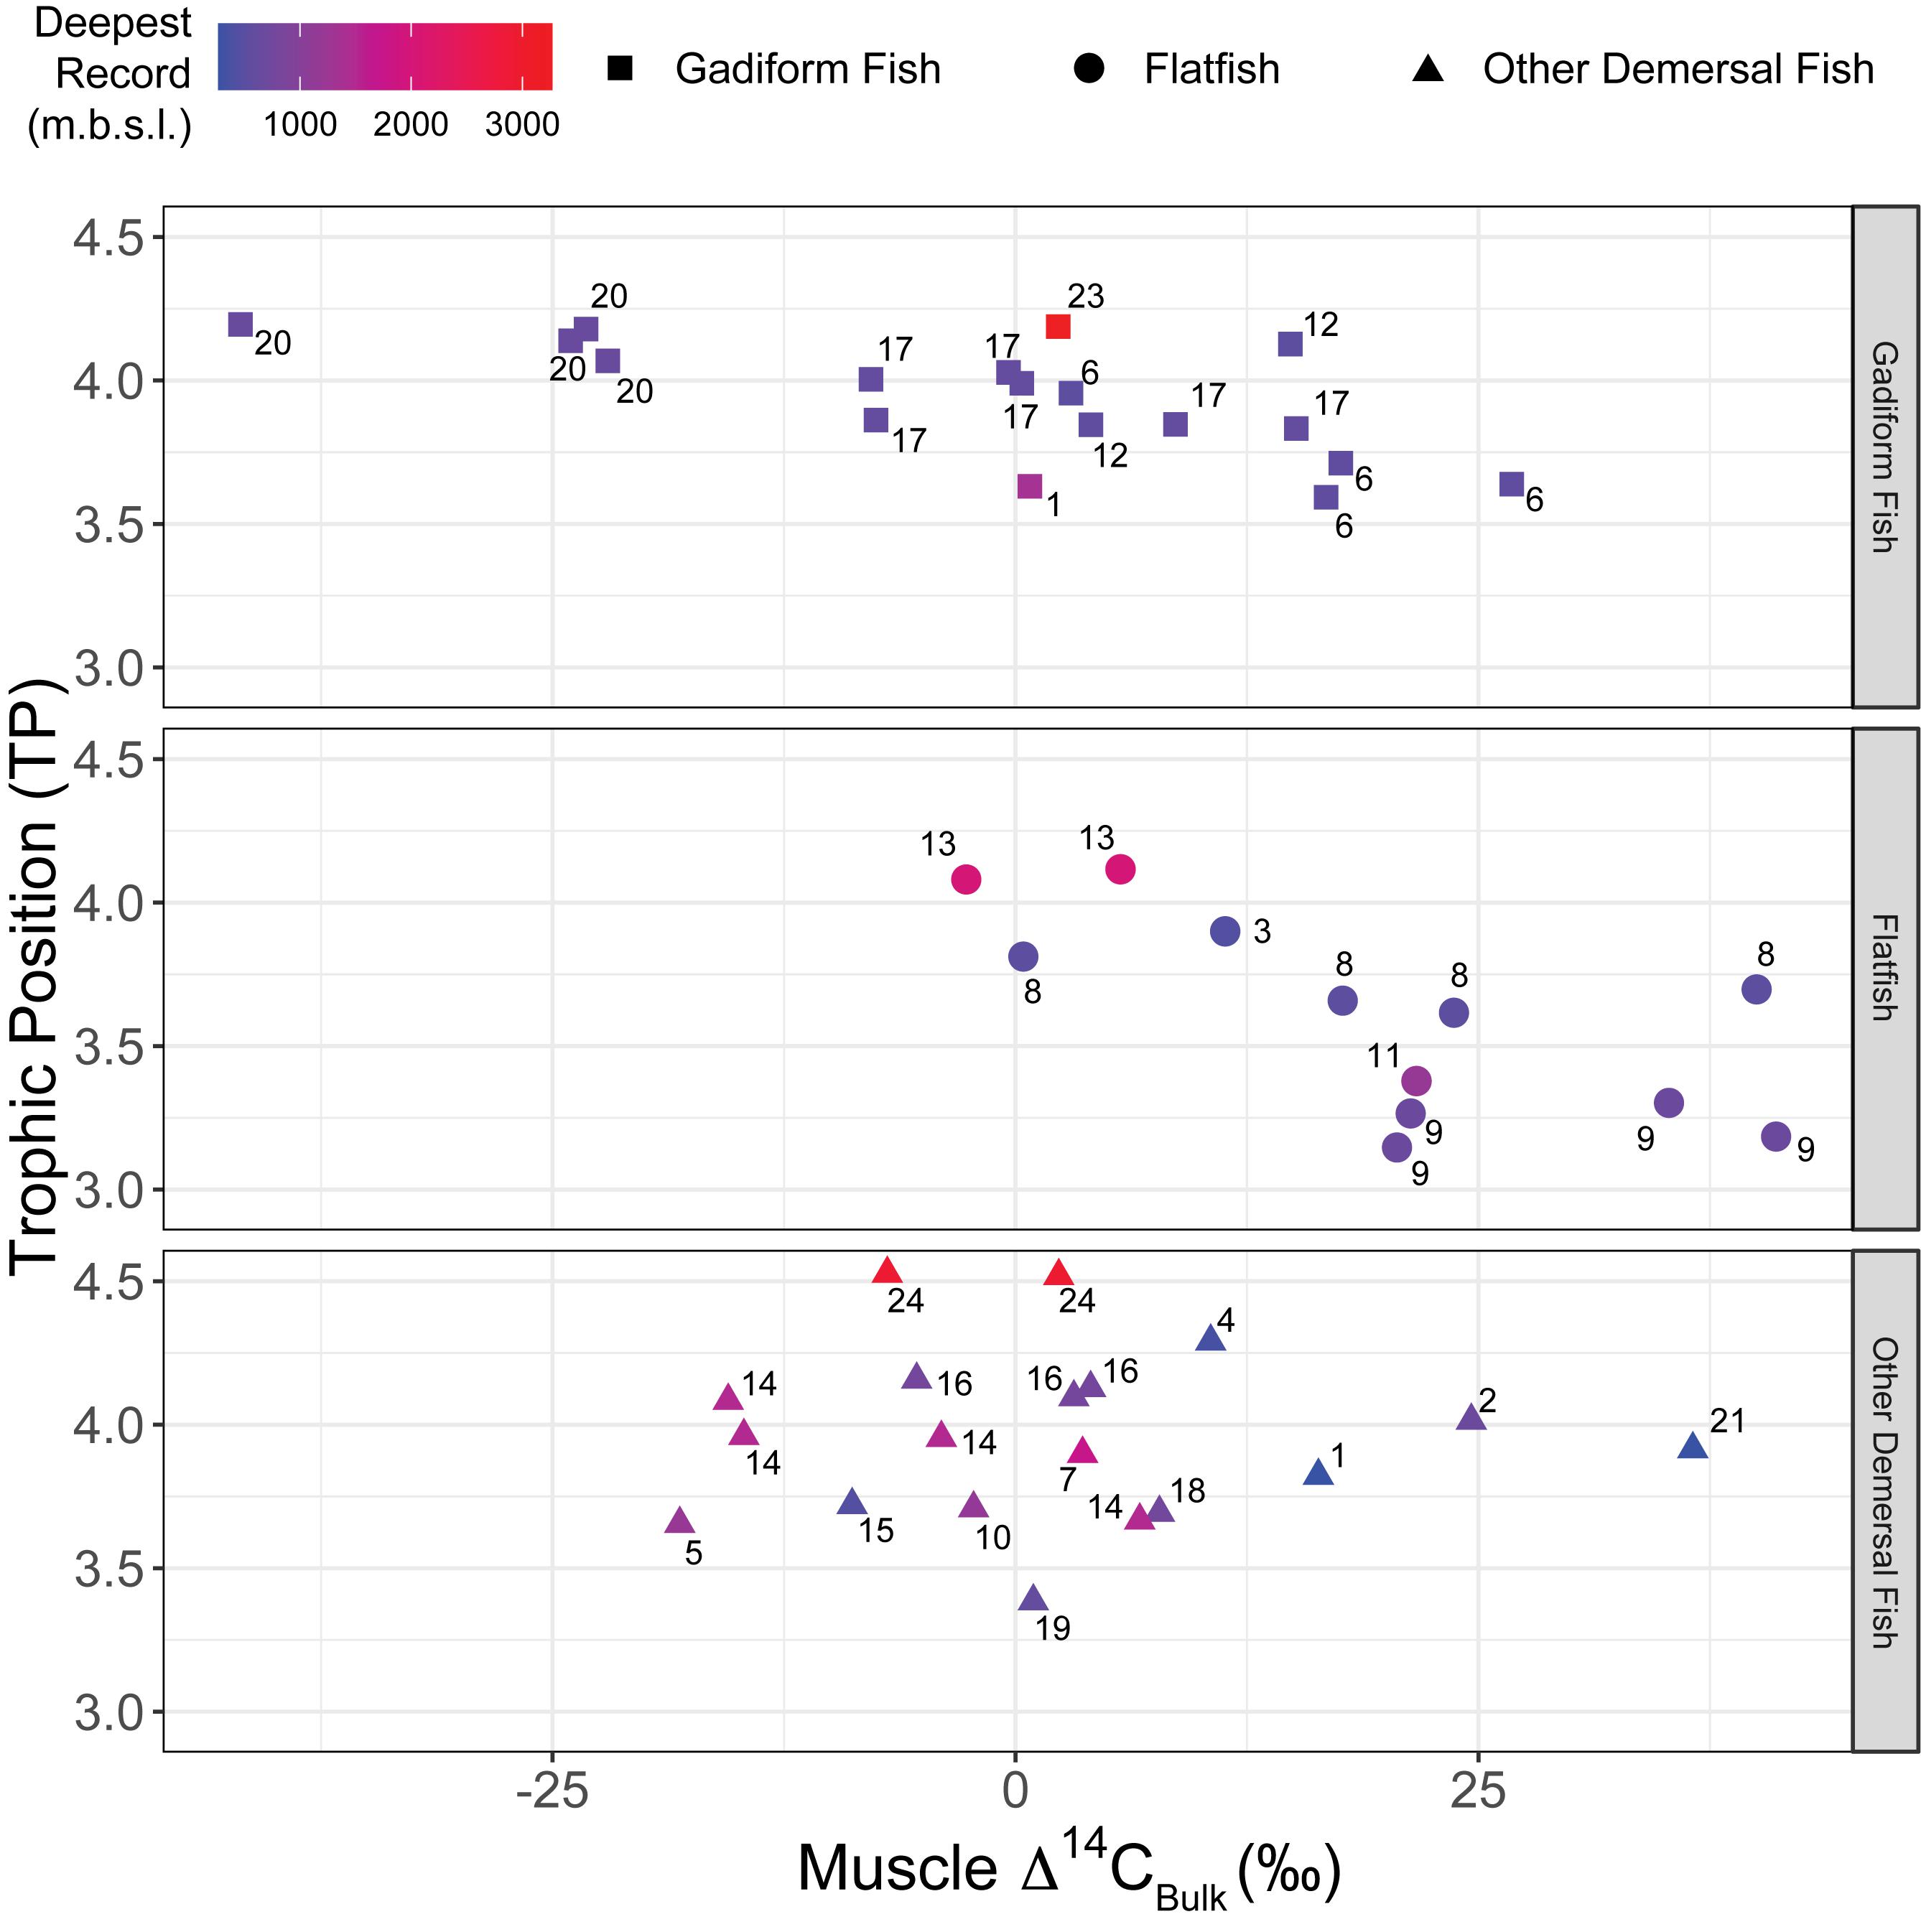
Figure 6. Relationship between TP and muscle Δ14CBulk of fish. Negative correlations were significant for gadiform fish (n = 19, r2 = 0.46, p = 0.001) and flatfish (n = 12, r2 = 0.49, p = 0.01) but not for other demersal fish (n = 19, r2 < 0.01, p > 0.99). Colors denote the deepest occurrences recorded for fish species (m.b.s.l.). Numbers beside symbols indicate species, as for Figure 2.
Discussion
Overview
Among the three fish groups investigated in this study (gadiform fish, flatfish, and other demersal fish), the flatfish had smaller SnL and showed lower TPs than the other groups. The relatively constant δ13CBulk values of the flatfish (–18 ± 0.9‰, n = 11) suggest that their low migration rates only allow flatfish to consume locally provided foods. By contrast, the δ13CBulk values of the gadiform fish and other demersal fish with higher migration rates deviated from –18‰, suggesting that their carbon is derived not from local sources but from somewhere else. Furthermore, the larger SnLs and higher TPs of the gadiform fish and other demersal fish suggest that they integrate autochthonous and allochthonous production in the benthic ecosystems off Sanriku. However, δ13C cannot be used to determine from where allochthonous food sources originate because the baseline δ13C value (in phytoplankton) is largely dependent on the isotopic fractionation associated with DIC uptake (Nakatsuka et al., 1992).
The Δ14C signature can be used to distinguish the two locally dominant water masses off Sanriku: the Oyashio Current (Δ14CDIC typically about –50‰) and the Tsugaru/Kuroshio Current (Δ14CDIC typically about +50‰) (Kubota et al., 2018; Satoh et al., 2019). Even within the local area off Sanriku, a difference of over 80‰ in the fish Δ14CBulk values was observed, and this variation is explained by the large Δ14CDIC difference between the Oyashio and Kuroshio currents. We have calculated the Oyashio contribution to fish muscle using a two-endmember mixing model using Δ14CDIC of the Oyashio (ca. –50‰) and Kuroshio (ca. +50‰) Currents (Supplementary Table 1). The Oyashio Current contributed to the southern (Kuroshio) fish (species 1–11) by 34 ± 15% (mean ± SD, n = 20), and to the northern (Oyashio) fish (species 12–25) by 52 ± 14% (mean ± SD, n = 31). These results suggest that the ocean off Sanriku is a unique region for fisheries, hosting the highly diverse fish community fueled by the Oyashio and Kuroshio Cuurents. However, the endmember values are not well constrained, because Δ14CDIC in modern surface seawater is a function of time.
We observed a relatively scattered distribution of fish δ15NPhe values along the Oyashio–Kuroshio transition, which correlated positively with the δ13CBulk values (r = 0.309; Figure 3). Because the δ15NPhe value reflects the δ15N value of nitrate in seawater (Matsubayashi et al., 2020), the variation in δ15NPhe of up to 9‰ among these fish is controlled by the regional oceanographic environment and the δ15N of nutrients and/or the isotopic fractionation by in situ phytoplanktonic photosynthesis. We also found a wide trophic spectrum (i.e., a TP range over 1.4 units) in the local fish community, which correlated significantly with the Δ14CBulk values of the gadiform fish and flatfish. We will get back to this point later in the section “Trophic Ecology of Fish Communities.”
One of the greatest advantages of this study is the Δ14CBulk and δ15NPhe values in fish muscle being used as indicators of their carbon and nitrogen sources, respectively, without the need for data on their potential diets such as benthic invertebrates. In the following sections, we discuss the patterns and factors controlling Δ14CBulk and TP in the fish in terms of their species-specific feeding and migration behavior.
Gadiform Fish
Laemonema longipes and P. japonicus have a similar life history: they spawn and hatch on the southeast coast of Japan (off the Izu Peninsula) and their larvae migrate northeast via the Kuroshio Current and settle along the Sanriku coast to grow (Kitagawa and Nagahora, 1983; Hattori et al., 2009a). However, our data show that their TPs and Δ14CBulk values are extremely different. The lower Δ14CBulk values of L. longipes are consistent with its preference for deep water (Yamamura and Nobetsu, 2012) (catch-record depth: 318–656 m; Supplementary Table 1), where the Oyashio Current conveys 14C-depleted food sources. By contrast, P. japonicus prefers shallower water (Kitagawa and Nagahora, 1983) (catch-record depth: 20–561 m; Supplementary Table 1). The high Δ14CBulk values of P. japonicus are attributable to the influence of the Tsugaru/Kuroshio Current, with 14C-enriched DIC in the Sanriku coastal seawater. G. chalcogrammus showed a wide range of Δ14CBulk values (–8 to +15‰, n = 6) among the gadiform fish, possibly reflecting their migration from their spawning/hatching region (Funka Bay, Figure 1) to off Sanriku (Sakurai, 2007; Funamoto et al., 2014). The Δ14CDIC value in Funka Bay was +40 to +50‰ in 1988 (Tsunogai et al., 1993). Although no data are available after that time, the Δ14CDIC in Funka Bay during our sampling period (2012–2014) is expected to have been much lower than that in 1988 (∼0‰) as a consequence of the continuous removal of bomb-produced 14C to the biosphere through photosynthesis and to the geosphere through sedimentation for the past half century (Druffel et al., 2016).
Laemonema longipes and P. japonicus also showed variable δ15NPhe values, supporting the speculation cited above that they had migrated from south of Sanriku where phytoplankton δ15N values vary up to 5‰ (Matsubayashi et al., 2020). The TP values of L. longipes were approximately 0.5 units higher than those of P. japonicus, possibly because L. longipes prefers to feed on squids and mesopelagic fish, whereas P. japonicus feeds on amphipods, small shrimps, and large zooplankton, such as Euphausia japonica and Neocalanus cristatus (Yamamura and Nobetsu, 2012). G. macrocephalus also showed a higher TP than other gadiform species, probably because it consumes a variety of food items, including squids, octopi, krills, crabs, and other fish, such as the juveniles of G. chalcogrammus, as well as practicing intraspecies cannibalism (Hashimoto, 1974; Fujita et al., 1995).
Flatfish
The less variable δ13CBulk values found in flatfish compared with the other fish suggest that their carbon sources are provided locally by small benthic animals on the seafloor, which is discussed later. Except for H. dubius, whose Δ14CBulk values (–2.7 and +5.7‰, n = 2) were the lowest of all flatfish, the flatfish analyzed in this study is restricted to live in shallow waters (Amaoka, 2016), where the Kuroshio Current dominates and is enriched in 14C in DIC (by about +50‰; Ding et al., 2018; Satoh, 2020). In other words, the δ13CBulk values indicate flatfish do not migrate greatly, and the Δ14CBulk values indicate flatfish rely on diets of organisms such as zooplankton and/or benthic animals that feed on phytoplankton with high Δ14C values. The large intraspecies variation in Δ14CBulk values detected in G. stelleri reflects its distribution at a wide range of water depths (catch-record depth: 125–540 m; Supplementary Table 1). Similarly, the low Δ14CBulk values of H. dubius relative to those of the other flatfish species may be attributable to their preference for deep water (catch-record depth: 201 to 2021 m; Supplementary Table 1).
The large intraspecies variation in the δ15NPhe values of G. stelleri is consistent with the pattern found in its Δ14C. By contrast, G. stelleri showed small variations in its TP (3.6–3.8, n = 4), suggesting that its diet does not change markedly (it is constantly benthic animals; Hayase and Hamai, 1974). The flatfish had smaller SnL and lower TP values than the gadiform fish, probably because the food items of flatfish are predominantly benthic animals (Amaoka, 2016). For example, it was reported that 85% of the gut contents of D. rikuzenius in Sanriku consisted of small crustaceans, polychaetes, and ophiuroids (Fujita et al., 1995). An exception is H. dubius, whose TP was as high as those of gadiform fish such as L. longipes. This observation is consistent with the previous report that H. dubius eats benthic animals as well as other fish, such as the juveniles of G. chalcogrammus (Hayase and Hamai, 1974).
Other Demersal Fish
The wide range in Δ14C values in M. zonurus may reflect its behavior, moving between various water depths (Shinohara et al., 1992) (catch-record depth: 50–1,497 m; Supplementary Table 1). Bothrocara tanakae and S. kaupii are bottom-dwelling fish species with Δ14CBulk values of ∼0‰, suggesting that their diets are ultimately derived from both the Oyashio and Tsugaru/Kuroshio currents. The Δ14CBulk value of A. elongatus, the highest among those of other demersal fish, may be explained by its habitat preference for relatively shallow water (Kitagawa, 1990; Fujita et al., 1995) (catch-record depth: 20–269 m; Supplementary Table 1), which is mainly affected by 14C-enriched DIC from the Tsugaru/Kuroshio Current. By contrast, the Δ14CBulk value of S. macrochir (–18.1‰, n = 1), the lowest among those of other demersal fish, may reflect its feeding preference for benthic animals (Hattori et al., 2009b), which originate in 14C-depleted DIC in deep waters.
M. zonurus displayed a relatively wide range of δ15NPhe and TP values, varying by up to 6‰ and 0.4 units, respectively, which is consistent with their large variation in Δ14CBulk. The TP of S. kaupii (TP = 4.52 and 4.53, n = 2), the highest among the fish studied, is consistent with the carnivorous behavior of this species (Gordon and Mauchline, 1996). In the other demersal fish, including deep-sea fish such as S. kaupii (catch-record depth: 250–2,935 m; Supplementary Table 1), B. zestum (catch-record depth: 0–1,728 m; Supplementary Table 1), and B. tanakae (catch-record depth: 300–789 m; Supplementary Table 1), there was no significant correlation between TP and Δ14CBulk. These results suggest that other factors integrate the variations in Δ14CBulk into intermediate values (–6.9 to +4.1‰) near the seafloor.
Trophic Ecology of Fish Communities
The gadiform fish and flatfish with higher TPs had lower Δ14CBulk. Within these two commercially important fish orders, the gadiform fish plotted in the high-TP/low-Δ14CBulk range, whereas the flatfish plotted in the low-TP/high-Δ14CBulk range. These results suggest that gadiform fish utilize carbon derived from phytoplankton in the Oyashio Current, where Δ14CDIC is generally restricted to the range of –78 to 0‰, whereas the carbon sources of the flatfish are derived from the Kuroshio Current, with high Δ14CDIC reaching +33‰ (Satoh, 2020; Figure 7). Furthermore, the diet consumed by gadiform fish from the Oyashio Current has a mean TP that is 0.34 units higher than that of the flatfish from the Kuroshio Current. This may be partly explained by the observation that the TPs of the large zooplankton (Neocalanus cristatus and Neocalanus flemingeri) dominant in the Oyashio region are high (2.6–2.7), whereas the TPs of the small zooplankton (Paracalanus aculeatus and Paracalanus parvus) dominant in the Kuroshio region are low (2.2–2.3) (Matsubayashi et al., 2020). Moreover, the δ13CBulk results show different migration rates for the gadiform fish and flatfish (Figure 7). These results collectively support our hypothesis that the Oyashio/bottom waters provide high-TP foods to the gadiform fish, whereas the Kuroshio/surface waters provide low-TP foods to the flatfish. It should be noted that Bradley et al. (2015) found that the trophic discrimination factor offset (‰) in equation 3 is lower than 7.6‰. However, they compared the offset against data from stomach content analysis. Therefore, their assessment would not be compatible with equation 3, because the TP value estimated by stomach contents is not necessarily consistent with that estimated by CSIA-AA (Ishikawa, 2018). If this was the case for the present study, our fish TP values might be lower than their functional TPs.
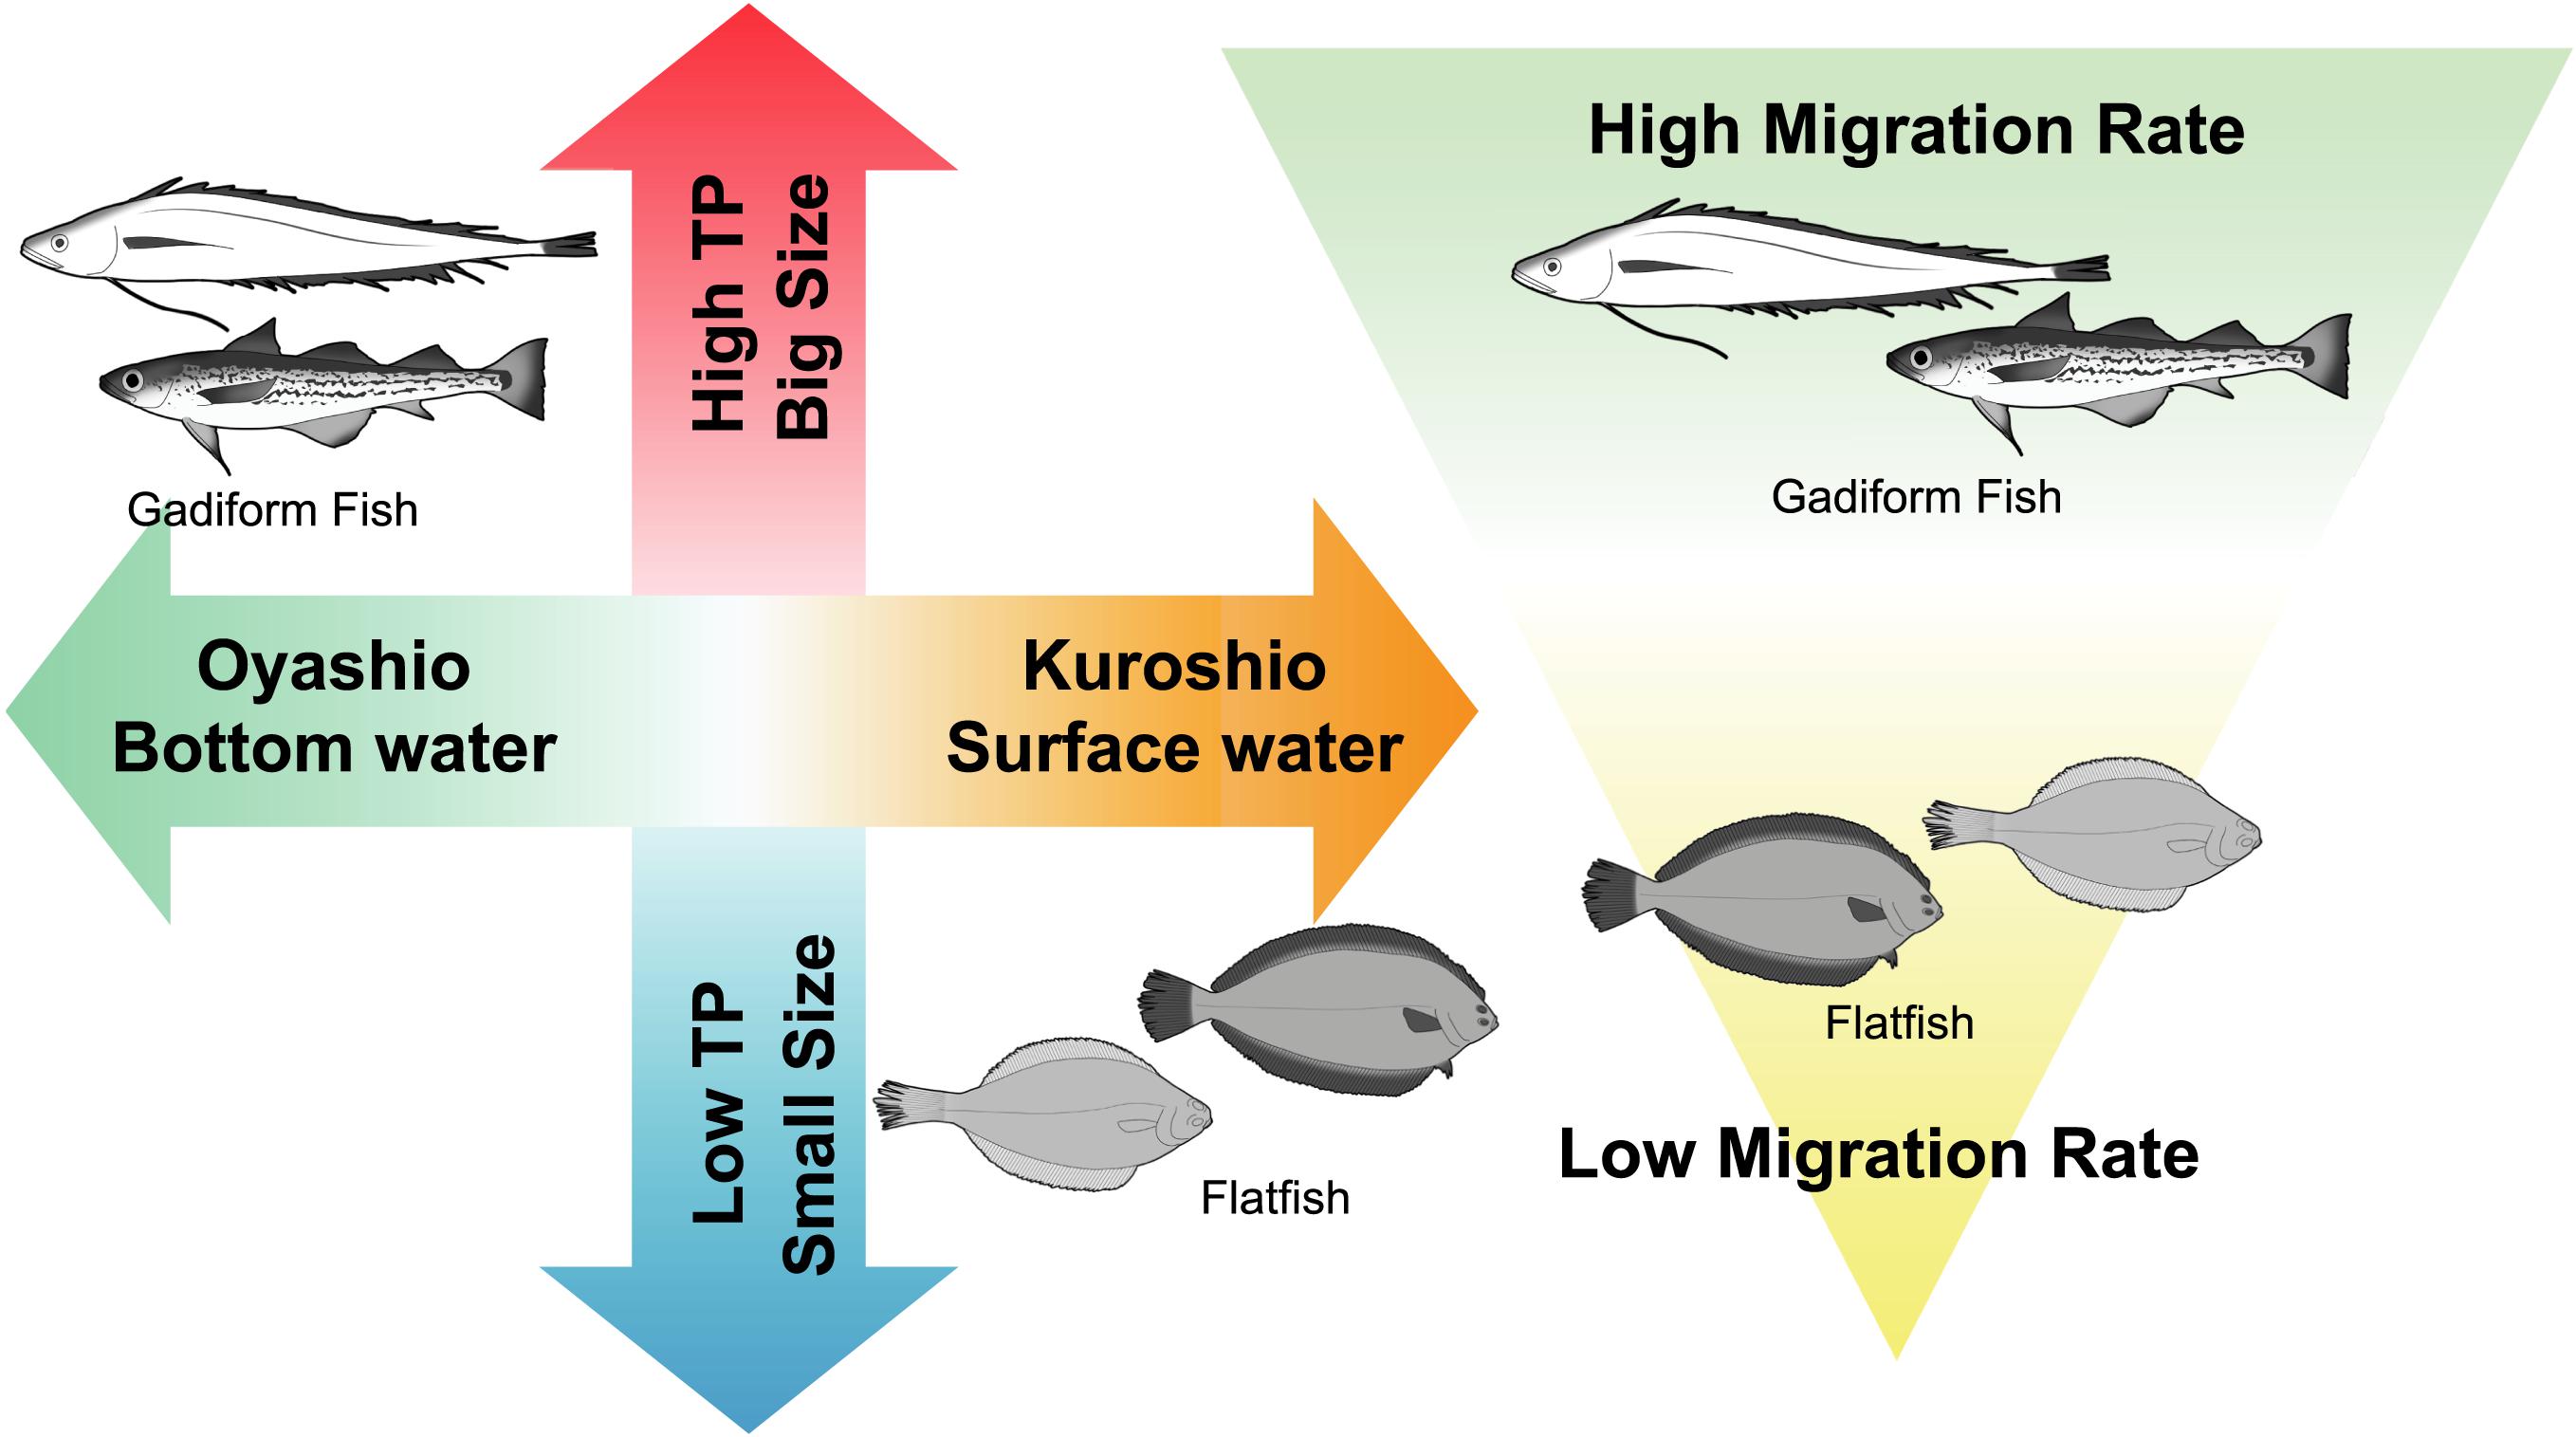
Figure 7. Trophic ecology of demersal fish in the Sanriku ecosystems inferred from the present study.
The interpretation of the Δ14CBulk values of demersal fish may be confounded by the possibility that some microbes are depleted in 14C (Δ14C ≤ –100‰) by the chemosynthetic assimilation of 14C-depleted DIC (Hansman et al., 2009) or by the heterotrophic assimilation of aged organic carbon (Cherrier et al., 1999; McCallister et al., 2004). These microbial activities can provide 14C-depleted organic carbon to organisms at higher TPs, although the degree to which these microbes contribute to the diets of demersal fish is poorly quantified. Furthermore, a significant perturbation of δ13CBulk and δ15NBulk values would be expected if this were the case. Therefore, in this study, we assumed that the demersal fish and their prey are primarily supported by fresh organic carbon derived from primary production in the surface current systems (via benthic–pelagic coupling; Purinton et al., 2008) and that the influence of 14C-depleted microbial biomass and aged organic carbon to the Δ14CBulk values of demersal fish is minimal.
Although our dataset is limited in terms of the number of replicates per species, we obtained several findings as mentioned above. Quantitative and intensive samplings and analyses are essential in future research to examine what controls the variations in Δ14CBulk and TP, from the individual scale to the community scale. No age information was available for the fish analyzed in this study. Given that the larger fish disperse more deeply (Macpherson and Duarte, 1991), a positive correlation between body size and Δ14CBulk within a single species can be expected. Furthermore, the turnover time of fish muscle should be taken into account to calibrate the ontogenetic dietary shift (Yamamura et al., 2002). It should also be noted that consumption of more migratory prey would affect fish predator isotope values even if the predators themselves have relatively limited movements. Understanding trophic structures (e.g., the biomass distribution along trophic spectra: Kato et al., 2018, and the integrated TPs of a community: Ishikawa et al., 2017) is fundamental to constraining the carrying capacity of ocean ecosystems because both the resource productivity and the trophic transfer efficiency are limited on this planet (Pauly and Christensen, 1995).
In the Atlantic Ocean, the population dynamics of demersal fish and benthic invertebrates are reversely synchronized, suggesting that the fisheries resources are strongly regulated by the trophic cascade (Frank et al., 2005). Furthermore, the benthic-pelagic coupling plays an important role in biological production on the continental shelf (Trueman et al., 2014). These studies suggest that fish migration history is quite important not only for fisheries management, but also for understanding of the trophic structure in the coastal ocean ecosystems. In this context, researchers have employed δ13C and δ15N analyses to draw “isoscapes” in the Atlantic, on which fish isotopic signatures are overlaid to track their migration history (e.g., Graham et al., 2010). Our results will contribute to this emerging research field by combining radiocarbon and CSIA-AA and applying their insights to ocean currents and fish trophic ecology in a variety of oceanographic settings.
The structure of the fish community off the Sanriku ecosystem, including the resource abundance, species composition, and TPs, has changed significantly during the last half century (Yonezaki et al., 2015). This change has been ascribed to the climatic and oceanographic regime shifts that have occurred multiple times in the North Pacific within this period (Hare and Mantua, 2000; Yatsu et al., 2008). The ecosystem dynamics are projected to fluctuate in response to the increasing variability in the global climate, especially in the coastal area, where most of the commercially important fish species spend at least part of their life histories (Attrill and Power, 2002). Our results strongly suggest that the fish migration rates off Sanriku are responsible for their reliance upon the Oyashio and Tsugaru/Kuroshio currents and for the wide range of the trophic spectra they display (Figure 7). This may be one reason that the Sanriku region is a hot spot for local fisheries (FAO, 2018). In other words, it is possible that these hot-spot ecosystems are vulnerable to environmental changes, including biodiversity loss through overfishing and ocean current modification through global warming. We conclude that isotopic evidence has significant potential utility in predicting of the distribution of fisheries resources in the ocean.
Data Availability Statement
The original contributions presented in the study are included in the article/Supplementary Material, further inquiries can be directed to the corresponding author/s.
Ethics Statement
The animal study was reviewed and approved by Tohoku Ecosystem-Associated Marine Sciences Project.
Author Contributions
NOg, YC, KF, YY, TN, and NOh designed the project. MY collected and identified the fish samples. NOg, YC, YM, and YY made the isotope measurements. NI analyzed the data and wrote the first draft. All authors participated in the discussion to finalize the manuscript.
Funding
This study was supported by the MEXT Tohoku Ecosystem-Associated Marine Sciences Project grant number JPMXD1111105260, Japan Science Technology Agency CREST grant number JPMJCR13A4, and the JSPS Grants-in-Aid for Scientific Research (18H02513).
Conflict of Interest
The authors declare that the research was conducted in the absence of any commercial or financial relationships that could be construed as a potential conflict of interest.
Acknowledgments
We thank the captain and crew in R/V Iwate-maru for fish sampling, A. Takanashi (Coastal Regional Development Bureau, Iwate Prefectural Office) for sample curation, Y. Sasaki and A. Toki for assistance with laboratory work, R. Nagoshi for illustrating the fish, T. Blattmann for the English language review, and H. Nomaki, N. Satoh, J. Matsubayashi, C. Yoshikawa, and M. Wakita for discussions. We are grateful to two reviewers for valuable comments on the manuscript.
Supplementary Material
The Supplementary Material for this article can be found online at: https://www.frontiersin.org/articles/10.3389/fmars.2021.641282/full#supplementary-material
Supplementary Figure 1 | Results of the two-endmember mixing model.
Footnotes
References
Amaoka, K. (2016). Flatfish of Japan (Citharidae, Paralichthyidae, Bothidae, Pleuronectidae, Poecilopsettidae, Samaridae). Tokyo: Tokai University Press. [in Japanese].
Attrill, M. J., and Power, M. (2002). Climatic influence on a marine fish assemblage. Nature 417, 275–278. doi: 10.1038/417275a
Bradley, C. J., Wallsgrove, N. J., Choy, C. A., Drazen, J. C., Hetherington, E. D., Hoen, D. K., et al. (2015). Trophic position estimates of marine teleosts using amino acid compound specific isotopic analysis. Limnol. Oceanogr. Methods 13, 476–493. doi: 10.1002/lom3.10041
Cherrier, J., Bauer, J. E., Druffel, E. R., Coffin, R. B., and Chanton, J. P. (1999). Radiocarbon in marine bacteria: evidence for the ages of assimilated carbon. Limnol. Oceanogr. 44, 730–736. doi: 10.4319/lo.1999.44.3.0730
Chikaraishi, Y., Ogawa, N. O., Kashiyama, Y., Takano, Y., Suga, H., Tomitani, A., et al. (2009). Determination of aquatic food-web structure based on compound-specific nitrogen isotopic composition of amino acids. Limnol. Oceanogr. Methods 7, 740–750. doi: 10.4319/lom.2009.7.740
Chikaraishi, Y., Takano, Y., Ogawa, N. O., and Ohkouchi, N. (2010). “Instrumental optimization of compound-specific isotope analysis of amino acids by gas chromatography/combustion/isotope ratio mass spectrometry,” in Earth, Life, and Isotopes, eds N. Ohkouchi, I. Tayasu, and K. Koba (Kyoto: Kyoto University Press), 367–386.
Ding, L., Ge, T., Gao, H., Luo, C., Xue, Y., Druffel, E. R., et al. (2018). Large variability of dissolved inorganic radiocarbon in the Kuroshio extension of the northwest North Pacific. Radiocarbon 60, 691–704. doi: 10.1017/rdc.2017.143
Druffel, E. R. M., Beaupré, S. R., and Ziolkowski, L. A. (2016). “Radiocarbon in the ocean,” in Radiocarbon and Climate Change: Mechanisms, Applications and Laboratory Techniques, eds E. A. G. Schuur, E. R. M. Druffel, and S. E. Trumbore (Berlin: Springer), 139–166.
FAO (2018). The State of World Fisheries and Aquaculture 2018 – Meeting the Sustainable Development Goals. Rome: FAO.
Frank, K. T., Petrie, B., Choi, J. S., and Leggett, W. C. (2005). Trophic cascades in a formerly cod-dominated ecosystem. Science 308, 1621–1623. doi: 10.1126/science.1113075
Fujita, T., Kitagawa, D., Okuyama, Y., Ishito, Y., Inada, T., and Jin, Y. (1995). Diets of the demersal fishes on the shelf off Iwate, northern Japan. Mar. Biol. 123, 219–233. doi: 10.1007/bf00353613
Funamoto, T., Yamamura, O., Shida, O., Itaya, K., Mori, K., Hiyama, Y., et al. (2014). Comparison of factors affecting recruitment variability of walleye pollock Theragra chalcogramma in the Pacific Ocean and the Sea of Japan off northern Japan. Fish. Sci. 80, 117–126. doi: 10.1007/s12562-014-0716-z
Ganachaud, A., and Wunsch, C. (2000). Improved estimates of global ocean circulation, heat transport and mixing from hydrographic data. Nature 408, 453–457. doi: 10.1038/35044048
Gordon, J. D. M., and Mauchline, J. (1996). The distribution and diet of the dominant, slope-dwelling eel, Synaphobranchus kaupi, of the Rockall Trough. J. Mar. Biol. Assoc. U. K. 76, 493–503. doi: 10.1017/s0025315400030691
Graham, B. S., Koch, P. L., Newsome, S. D., McMahon, K. W., and Aurioles, D. (2010). “Using isoscapes to trace the movements and foraging behavior of top predators in oceanic ecosystems,” in Isoscapes, eds J. West, G. Bowen, T. Dawson, and K. Tu (Dordrecht: Springer), 299–318. doi: 10.1007/978-90-481-3354-3_14
Hanawa, K., and Mitsudera, H. (1987). Variation of water system distribution in the Sanriku coastal area. J. Oceanogr. Soc. Jpn. 42, 435–446. doi: 10.1007/bf02110194
Hansman, R. L., Griffin, S., Watson, J. T., Druffel, E. R. M., Ingalls, A. E., Pearson, A., et al. (2009). The radiocarbon signature of microorganisms in the mesopelagic ocean. Proc. Natl. Acad. Sci. U.S.A. 106, 6513–6518. doi: 10.1073/pnas.0810871106
Hare, S. R., and Mantua, N. J. (2000). Empirical evidence for North Pacific regime shifts in 1977 and 1989. Prog. Oceanogr. 47, 103–145. doi: 10.1016/s0079-6611(00)00033-1
Hashimoto, R. (1974). Investigation of feeding habits and variation of inhabiting depth with cod (Gadus macrocephalus) distributed on the northeastern fishing ground in Japan. Bull. Tohoku. Reg. Fish. Res. Lab. 33, 51–67. [in Japanese],Google Scholar
Hattori, T., Narimatsu, Y., Nobetsu, T., and Ito, M. (2009a). Recruitment of threadfin hakeling Laemonema longipes off the Pacific coast of northern Honshu, Japan. Fish Sci. 75, 517–519. doi: 10.1007/s12562-008-0020-x
Hattori, T., Okuda, T., Narimatsu, Y., Ueda, Y., and Ito, M. (2009b). Spatiotemporal variations in nutritional status and feeding habits of immature female bighand thornyhead Sebastolobus macrochir off the Pacific coast of northern Honshu, Japan. Fish. Sci. 75, 611–618. doi: 10.1007/s12562-009-0080-6
Hayase, S., and Hamai, I. (1974). Studies on feeding habits of three flatfishes, Cleisthenes pinetorum herzensteini (Schmidt), Hippoglossoides dubius (Schmidt) and Glyptocephalus stelleri (Schmidt). Bull. Fac. Fish. Hokkaido Univ. 25, 82–99.
Ishikawa, N. F. (2018). Use of compound-specific nitrogen isotope analysis of amino acids in trophic ecology: assumptions, applications, and implications. Ecol. Res. 33, 825–837. doi: 10.1007/s11284-018-1616-y
Ishikawa, N. F., Chikaraishi, Y., Ohkouchi, N., Murakami, A. R., Tayasu, I., Togashi, H., et al. (2017). Integrated trophic position decreases in more diverse communities of stream food webs. Sci. Rep. 7:2130.
Itoh, S., Kaneko, H., Ishizu, M., Yanagimoto, D., Okunishi, T., Nishigaki, H., et al. (2016). Fine-scale structure and mixing across the front between the Tsugaru warm and Oyashio currents in summer along the Sanriku Coast, east of Japan. J. Oceanogr. 72, 23–37. doi: 10.1007/s10872-015-0320-6
Kato, Y., Kondoh, M., Ishikawa, N. F., Togashi, H., Kohmatsu, Y., Yoshimura, M., et al. (2018). Using food network unfolding to evaluate food-web complexity in terms of biodiversity: theory and applications. Ecol. Lett. 21, 1065–1074. doi: 10.1111/ele.12973
Kitagawa, D. (1990). Groundfish community in the coastal waters off Iwate prefecture. Bull. Tohoku. Natl. Fish. Res. Inst. 52, 45–63. [in Japanese], doi: 10.1016/j.ecss.2019.01.022
Kitagawa, D., and Nagahora, S. (1983). Estimation of the spawning season of the morid fish Physiculus maximowiczi collected from the coastal waters of Iwate prefecture, Japan. Bull. Jpn. Soc. Sci. Fish. 49, 1649–1654. doi: 10.2331/suisan.49.1649
Kubota, K., Shirai, K., Murakami-Sugihara, N., Seike, K., Minami, M., Nakamura, T., et al. (2018). Bomb-14C peak in the North Pacific recorded in long-lived bivalve shells (Mercenaria stimpsoni). J. Geophys. Res. Oceans 123, 2867–2881. doi: 10.1002/2017jc013678
Larsen, T., Yokoyama, Y., and Fernandes, R. (2018). Radiocarbon in ecology: Insights and perspectives from aquatic and terrestrial studies. Methods Ecol. Evol. 9, 181–190. doi: 10.1111/2041-210x.12851
Macpherson, E., and Duarte, C. M. (1991). Bathymetric trends in demersal fish size: is there a general relationship? Mar. Ecol. Prog. Ser. 71, 103–112. doi: 10.3354/meps071103
Matsubayashi, J., Osada, Y., Tadokoro, K., Abe, Y., Yamaguchi, A., Shirai, K., et al. (2020). Tracking long-distance migration of marine fishes using compound-specific stable isotope analysis of amino acids. Ecol. Lett. 23, 881–890. doi: 10.1111/ele.13496
McCallister, S. L., Bauer, J. E., Cherrier, J. E., and Ducklow, H. W. (2004). Assessing sources and ages of organic matter supporting river and bacterial production: a multiple-isotope (Δ14C, δ13C and δ15N) approach. Limnol. Oceanogr. 49, 1687–1702. doi: 10.4319/lo.2004.49.5.1687
Nakatsuka, T., Handa, N., Wada, E., and Wong, C. S. (1992). The dynamic changes of stable isotopic ratios of carbon and nitrogen in suspended and sedimented particulate organic matter during a phytoplankton bloom. J. Mar. Res. 50, 267–296. doi: 10.1357/002224092784797692
Ogawa, N. O., Nagata, T., Kitazato, H., and Ohkouchi, N. (2010). “Ultra-sensitive elemental analyzer/isotope ratio mass spectrometer for stable nitrogen and carbon isotope analyses,” in Earth, Life, and Isotopes, eds N. Ohkouchi, I. Tayasu, and K. Koba (Kyoto: Kyoto University Press), 339–353.
Ohkouchi, N., Kawamura, K., Kawahata, H., and Taira, A. (1997). Latitudinal distributions of terrestrial biomarkers in the sediments from the Central Pacific. Geochim. Cosmochim. Acta 61, 1911–1918. doi: 10.1016/s0016-7037(97)00040-9
Ohkouchi, N., Shibata, H., Chikaraishi, Y., Nomaki, H., Ogawa, N. O., Nagata, T., et al. (2016). A monitoring result of polychlorinated biphenyls (PCBs) in deep-sea organisms and sediments off Tohoku during 2012-2014: temporal variation and the relationship with the trophic position. J Oceanogr. 72, 629–639. doi: 10.1007/s10872-016-0359-z
Ohkouchi, N., Chikaraishi, Y., Close, H. G., Fry, B., Larsen, T., Madigan, D. J., et al. (2017). Advances in the application of amino acid nitrogen isotopic analysis in ecological and biogeochemical studies. Org. Geochem. 113, 150–174. doi: 10.1016/j.orggeochem.2017.07.009
Pauly, D., and Christensen, V. (1995). Primary production required to sustain global fisheries. Nature 374, 255–257. doi: 10.1038/374255a0
Pinnegar, J., and Polunin, N. (2000). Contributions of stable-isotope data to elucidating food webs of Mediterranean rocky littoral fishes. Oecologia 122, 399–409. doi: 10.1007/s004420050046
Purinton, B. L., DeMaster, D. J., Thomas, C. J., and Smith, C. R. (2008). 14C as a tracer of labile organic matter in Antarctic benthic food webs. Deep Sea Res. II 55, 2438–2450. doi: 10.1016/j.dsr2.2008.06.004
R Development Core Team (2019). R: A Language and Environment for Statistical Computing. Vienna: R Foundation for Statistical Computing.
Sakurai, Y. (2007). An overview of the Oyashio ecosystem. Deep Sea Res. II 54, 2526–2542. doi: 10.1016/j.dsr2.2007.02.007
Satoh, N. (2020). Analysis of Carbon Dynamics in the Sanriku Coastal Ecosystem Using Radiocarbon Isotopic Compositions. Doctoral Dissertation. Tokyo: The University of Tokyo.
Satoh, N., Fukuda, H., Miyairi, Y., Yokoyama, Y., and Nagata, T. (2019). Position-dependent radiocarbon content of the macroalgae Undaria pinnatifida as an indicator of oceanographic conditions during algal growth. J. Oceanogr. 75, 349–358. doi: 10.1007/s10872-019-00508-7
Shinohara, G., Yabe, M., Amaoka, K., and Meguro, T. (1992). A psychrolutid, Malacocottus gibber, collected from the mesopelagic zone of the Sea of Japan, with comments on its intraspecific variation. Jpn. J. Ichthyol. 38, 419–424.
Shiozaki, T., Tada, Y., Fukuda, H., Furuya, K., and Nagata, T. (2020). Primary production and nitrogen assimilation rates from bay to offshore waters in the Oyashio-Kuroshio-Tsugaru Warm Current interfrontal region of the northwestern north Pacific Ocean. Deep Sea Res. I 164:103304. doi: 10.1016/j.dsr.2020.103304
Stuiver, M., and Polach, H. A. (1977). Discussion: reporting of 14C data. Radiocarbon 19, 355–363. doi: 10.1017/s0033822200003672
Sweeting, C. J., Barry, J. T., Polunin, N. V. C., and Jennings, S. (2007). Effects of body size and environment on diet-tissue δ13C fractionation in fishes. J. Exp. Mar. Biol. Ecol. 352, 165–176. doi: 10.1016/j.jembe.2007.07.007
Tayasu, I., Hirasawa, R., Ogawa, N. O., Ohkouchi, N., and Yamada, K. (2011). New organic reference materials for carbon-and nitrogen-stable isotope ratio measurements provided by center for ecological research, Kyoto University, and institute of biogeosciences, Japan agency for marine-earth science and technology. Limnology 12, 261–266. doi: 10.1007/s10201-011-0345-5
Toggweiler, J. R., and Russell, J. (2008). Ocean circulation in a warming climate. Nature 451, 286–288. doi: 10.1038/nature06590
Trueman, C. N., Johnston, G., O’hea, B., and MacKenzie, K. M. (2014). Trophic interactions of fish communities at midwater depths enhance long-term carbon storage and benthic production on continental slopes. Proc. Biol. Sci 281:20140669. doi: 10.1098/rspb.2014.0669
Tsunogai, S., Tsuzuki, M., Watanate, S., and Yoshida, N. (1993). Radiocarbon anomaly found in aquicultural scallops suspended in coastal sea. J. Oceanogr. 49, 31–37. doi: 10.1007/bf02234006
Vokhshoori, N. L., and McCarthy, M. D. (2014). Compound-specific δ15N amino acid measurements in littoral mussels in the California upwelling ecosystem: a new approach to generating baseline δ15N isoscapes for coastal ecosystems. PLoS One 9:e98087. doi: 10.1371/journal.pone.0098087
Wada, E., Terazaki, M., Kabaya, Y., and Nemoto, T. (1987). 15N and 13C abundances in the Antarctic Ocean with emphasis on the biogeochemical structure of the food web. Deep Sea Res. A 34, 829–841. doi: 10.1016/0198-0149(87)90039-2
Yamamura, O., and Nobetsu, T. (2012). Food habits of threadfin hakeling Laemonema longipes along the Pacific coast of northern Japan. J. Mar. Biol. Assoc. U. K. 92, 613–621. doi: 10.1017/s0025315411000324
Yamamura, O., Honda, S., Shida, O., and Hamatsu, T. (2002). Diets of walleye pollock Theragra chalcogramma in the Doto area, northern Japan: ontogenetic and seasonal variations. Mar. Ecol. Prog. Ser. 238, 187–198. doi: 10.3354/meps238187
Yatsu, A., Aydin, K. Y., King, J. R., McFarlane, G. A., Chiba, S., Tadokoro, K., et al. (2008). Elucidating dynamic responses of North Pacific fish populations to climatic forcing: influence of life-history strategy. Prog. Oceanogr. 77, 252–268. doi: 10.1016/j.pocean.2008.03.009
Yatsu, A., Chiba, S., Yamanaka, Y., Ito, S. I., Shimizu, Y., Kaeriyama, M., et al. (2013). Climate forcing and the Kuroshio/Oyashio ecosystem. ICES J. Mar. Sci. 70, 922–933. doi: 10.1093/icesjms/fst084
Yokoyama, Y., Miyairi, Y., Aze, T., Yamane, M., Sawada, C., Ando, Y., et al. (2019). A single stage accelerator mass spectrometry at the atmosphere and ocean research institute, The University of Tokyo. Nucl. Instrum. Methods Phys. Res. B 455, 311–316. doi: 10.1016/j.nimb.2019.01.055
Yonezaki, S., Kiyota, M., and Okamura, H. (2015). Long-term ecosystem change in the western North Pacific inferred from commercial fisheries and top predator diet. Deep Sea Res. II 113, 91–101. doi: 10.1016/j.dsr2.2014.10.027
Keywords: deep sea, demersal fish, off Sanriku, Oyashio–Kuroshio transition, trophic position, migration, amino acid nitrogen isotopic composition, radiocarbon
Citation: Ishikawa NF, Ogawa NO, Chikaraishi Y, Yamaguchi M, Fujikura K, Miyairi Y, Yokoyama Y, Nagata T and Ohkouchi N (2021) Influences of Ocean Currents on the Diets of Demersal Fish Communities in the Western North Pacific Revealed by Their Muscle Carbon and Nitrogen Isotopic Compositions. Front. Mar. Sci. 8:641282. doi: 10.3389/fmars.2021.641282
Received: 14 December 2020; Accepted: 08 April 2021;
Published: 05 May 2021.
Edited by:
Sanjeev Kumar, Physical Research Laboratory, IndiaReviewed by:
Yves Cherel, UMR 7372 Centre d’études biologiques de Chizé (CEBC), FranceAmzad Hussain Laskar, Physical Research Laboratory, India
Copyright © 2021 Ishikawa, Ogawa, Chikaraishi, Yamaguchi, Fujikura, Miyairi, Yokoyama, Nagata and Ohkouchi. This is an open-access article distributed under the terms of the Creative Commons Attribution License (CC BY). The use, distribution or reproduction in other forums is permitted, provided the original author(s) and the copyright owner(s) are credited and that the original publication in this journal is cited, in accordance with accepted academic practice. No use, distribution or reproduction is permitted which does not comply with these terms.
*Correspondence: Naoto F. Ishikawa, ishikawan@jamstec.go.jp