Storm Gloria: Sea State Evolution Based on in situ Measurements and Modeled Data and Its Impact on Extreme Values
 Marta de Alfonso1*
  Jue Lin-Ye1,2
  José M. García-Valdecasas1
  Susana Pérez-Rubio1
  M. Yolanda Luna3 Daniel Santos-Muñoz4 M. Isabel Ruiz1
  Begoña Pérez-Gómez1
  Enrique Álvarez-Fanjul1
- 1Puertos del Estado, Madrid, Spain
- 2Laboratorio de Ingeniería Marítima (LIM), Universitat Politècnica de Catalunya, Barcelona, Spain
- 3Agencia Estatal de Meteorología, Madrid, Spain
- 4Danish Meteorological Institute, Copenhagen, Denmark
Storm Gloria, generated on January 17th, 2020 in the Eastern North Atlantic, crossed the Iberian Peninsula and impacted the Western Mediterranean during the following days. The event produced relevant damages on the coast and the infrastructures at the Catalan-Balearic Sea, due to extraordinary wind and wave fields, concomitant with anomalously intense rain and ocean currents. Puertos del Estado (the Spanish holding of harbors) has developed and operates a complex monitoring and forecasting system (PORTUS System), in collaboration with the Spanish Met Office (AEMET). The present work shows how Gloria was correctly forecasted by this system, alerts were properly issued (with special focus to the ports), and the buoys were able to monitor the sea state conditions during the event, measuring several new records of significant wave height and exceptional high mean wave periods. The paper describes, in detail, the dynamic evolution of the atmospheric conditions, and the sea state during the storm. It is by means of the study of both in situ and modeled PORTUS data, in combination with the AEMET weather forecast system results. The analysis also serves to place this storm in a historical context, showing the exceptional nature of the event, and to identify the specific reasons why its impact was particularly severe. The work also demonstrates the relevance of the PORTUS System to warn, in advance, the main Spanish Ports. It prevents accidents that could result in fatal casualties. To do so, the wave forecast warning performance is analyzed, making special focus on the skill score for the different horizons. Furthermore, it is demonstrated how a storm of this nature results in the need of changes on the extreme wave analysis for the area. It impacts all sorts of design activities at the coastline. The paper studies both how this storm fits into existing extreme analysis and how these should be modified in the light of this particular single event. This work is the first of a series of papers to be published on this issue. They analyze, in detail, other aspects of the event, including evolution of sea level and description of coastal damages.
Introduction
Wave storms strongly hamper the activities in harbors. These extreme phenomena drive complex hydrodynamic processes, whose understanding is paramount for proper infrastructure management, design, and maintenance (Goda, 2010). The Spanish Mediterranean coast registers about an average of 8 storms per year (Puertos del Estado, 2017). One of the most recent and most severe events, since buoy records started in 1985, occurred in November of 2001 (Gómez et al., 2002). The coastal buoy of Tarragona, located at the entrance of the Tarragona Harbor, measured a maximum hourly significant wave height of 3.46 m. However, Storm Gloria, which took place in January of 2020, surpassed this event with unprecedented wave heights, wave periods, and storm duration. It toppled all present understanding of the wave climate in the Spanish Mediterranean. Any future decisions would require a further understanding of what happened, as well as a robust early warning system.
The Storm Gloria was formed in the North Atlantic, during mid-January 2020 (Lopez-Bustins and Martin-Vide, 2020). It was driven by a strong North–South atmospheric pressure gradient, which was linked to a record breaking high atmospheric pressure system, of 1,050 hPa, over the British Islands. Exceptional Eastern winds originated in the Ligurian Sea and drove right into the Eastern coast of the Iberian Peninsula. It passed over Northern Spain and stalled in the western Mediterranean for several days, with high winds and heavy rainfall. From January 19th to 24th, the whole eastern part of the Iberian Peninsula suffered intense precipitation (up to 400 mm per day), accompanied by strong winds (mean values of 54 km/h and wind gusts of up to 140 km/h), a pronounced increase in the sea level (up to 0.6 m), record wave height that surpassed 8 m (ICM-CSIC, 2020), and unusual wave mean periods (over 9 s).
Significant damage was caused to the coasts of the Balearic Islands and the Mediterranean coast of the Iberian Peninsula (Pérez-Gómez et al., unpublished). According to a statement released by the Spanish Council of Ministers, on January 28th of 2020, the combination of strong winds and heavy rain caused storm surge, inland flooding, and mudslides across the country, leaving 14 casualties and 3 missing people. The Copernicus Emergency Management Service (EMS)1 reported that Gandia and Valencia Harbors were closed to shipping traffic, that the storm surge swept 3 km inland, destroying rice paddies and coastal features in the Ebro river delta, and that major damages were caused to beaches in the Barcelona and Valencia areas.
The Ebro river delta is characterized by a delicate ecosystem, which was already vulnerable to any major wave storm, before Gloria (Sánchez-Arcilla et al., 2016). Storm Gloria was probably worsened by the density of infrastructure at a short distance from the coastline. Near the coast, the erosion and flooding that affected the region were further aggravated by the record wave heights. Furthermore, Amores et al. (2020) demonstrated that wave overtopping was the main source of damages at the Balearic Islands.
Projections on Climate Change foresee a future with higher mean sea level (Qin et al., 2014) and a greater frequency of extreme events (Mitchell et al., 2006; Stott, 2016). In combination, these have a multiplicative effect (Folt et al., 1999), exacerbating both the floods and the destruction by extreme waves. It is essential to have a multi-decadal-long and accurate observation of the sea state, as well as to redesign the probability distribution function of extreme wave heights, in the area. It urges to determine the correct return period of extreme wave heights, in order to forecast them more accurately.
Moreover, the harbor authorities often need to make arrangements, several days in advance. It is fundamental to check how the forecast system and the alerts worked during this extreme event. The PORTUS System had been developed by PdE, in collaboration with AEMET. It has been in operation, with a downstream service, to alert the port authorities in case of risk, for the last decade. Its ability to forecast the precise moment of maximum wave heights, with a variety of horizons, would help harbor authorities take vital decisions.
The present work intends to describe the synoptic conditions and the wave conditions, to assess the forecast by this system, the alerts (with special focus to the ports), and the performance of the buoys that monitored the sea state conditions during the event. The buoy in situ measurements and the reanalysis model outputs also serve to place this storm in a historical context, showing the exceptional nature of the event and identifying the specific reasons why its impact was particularly severe. Moreover, an extreme value analysis is carried out. The paper attempts to include this storm into the existing extreme analysis, then goes on to modify the latter, in the light of this particular single event.
This paper is part of an issue of a multiparametric study of Storm Gloria on the Spanish Mediterranean coast. It only analyzes the atmospheric wave conditions. For a more in-depth study of the associated surge or the surface dynamics, please refer to Pérez-Gómez et al. (unpublished) and Sotillo et al. (2021), respectively. With respect to the coastal impacts, especially on the Ebro Delta region (Figure 1), please refer to Lorente et al. (2021). The manuscript is structured as follows: Section 2 outlines the materials and the methods employed in this study, Section 3 shows the results, and Section 4 discusses the intricacies of the results, as well as stating the conclusions for the study.
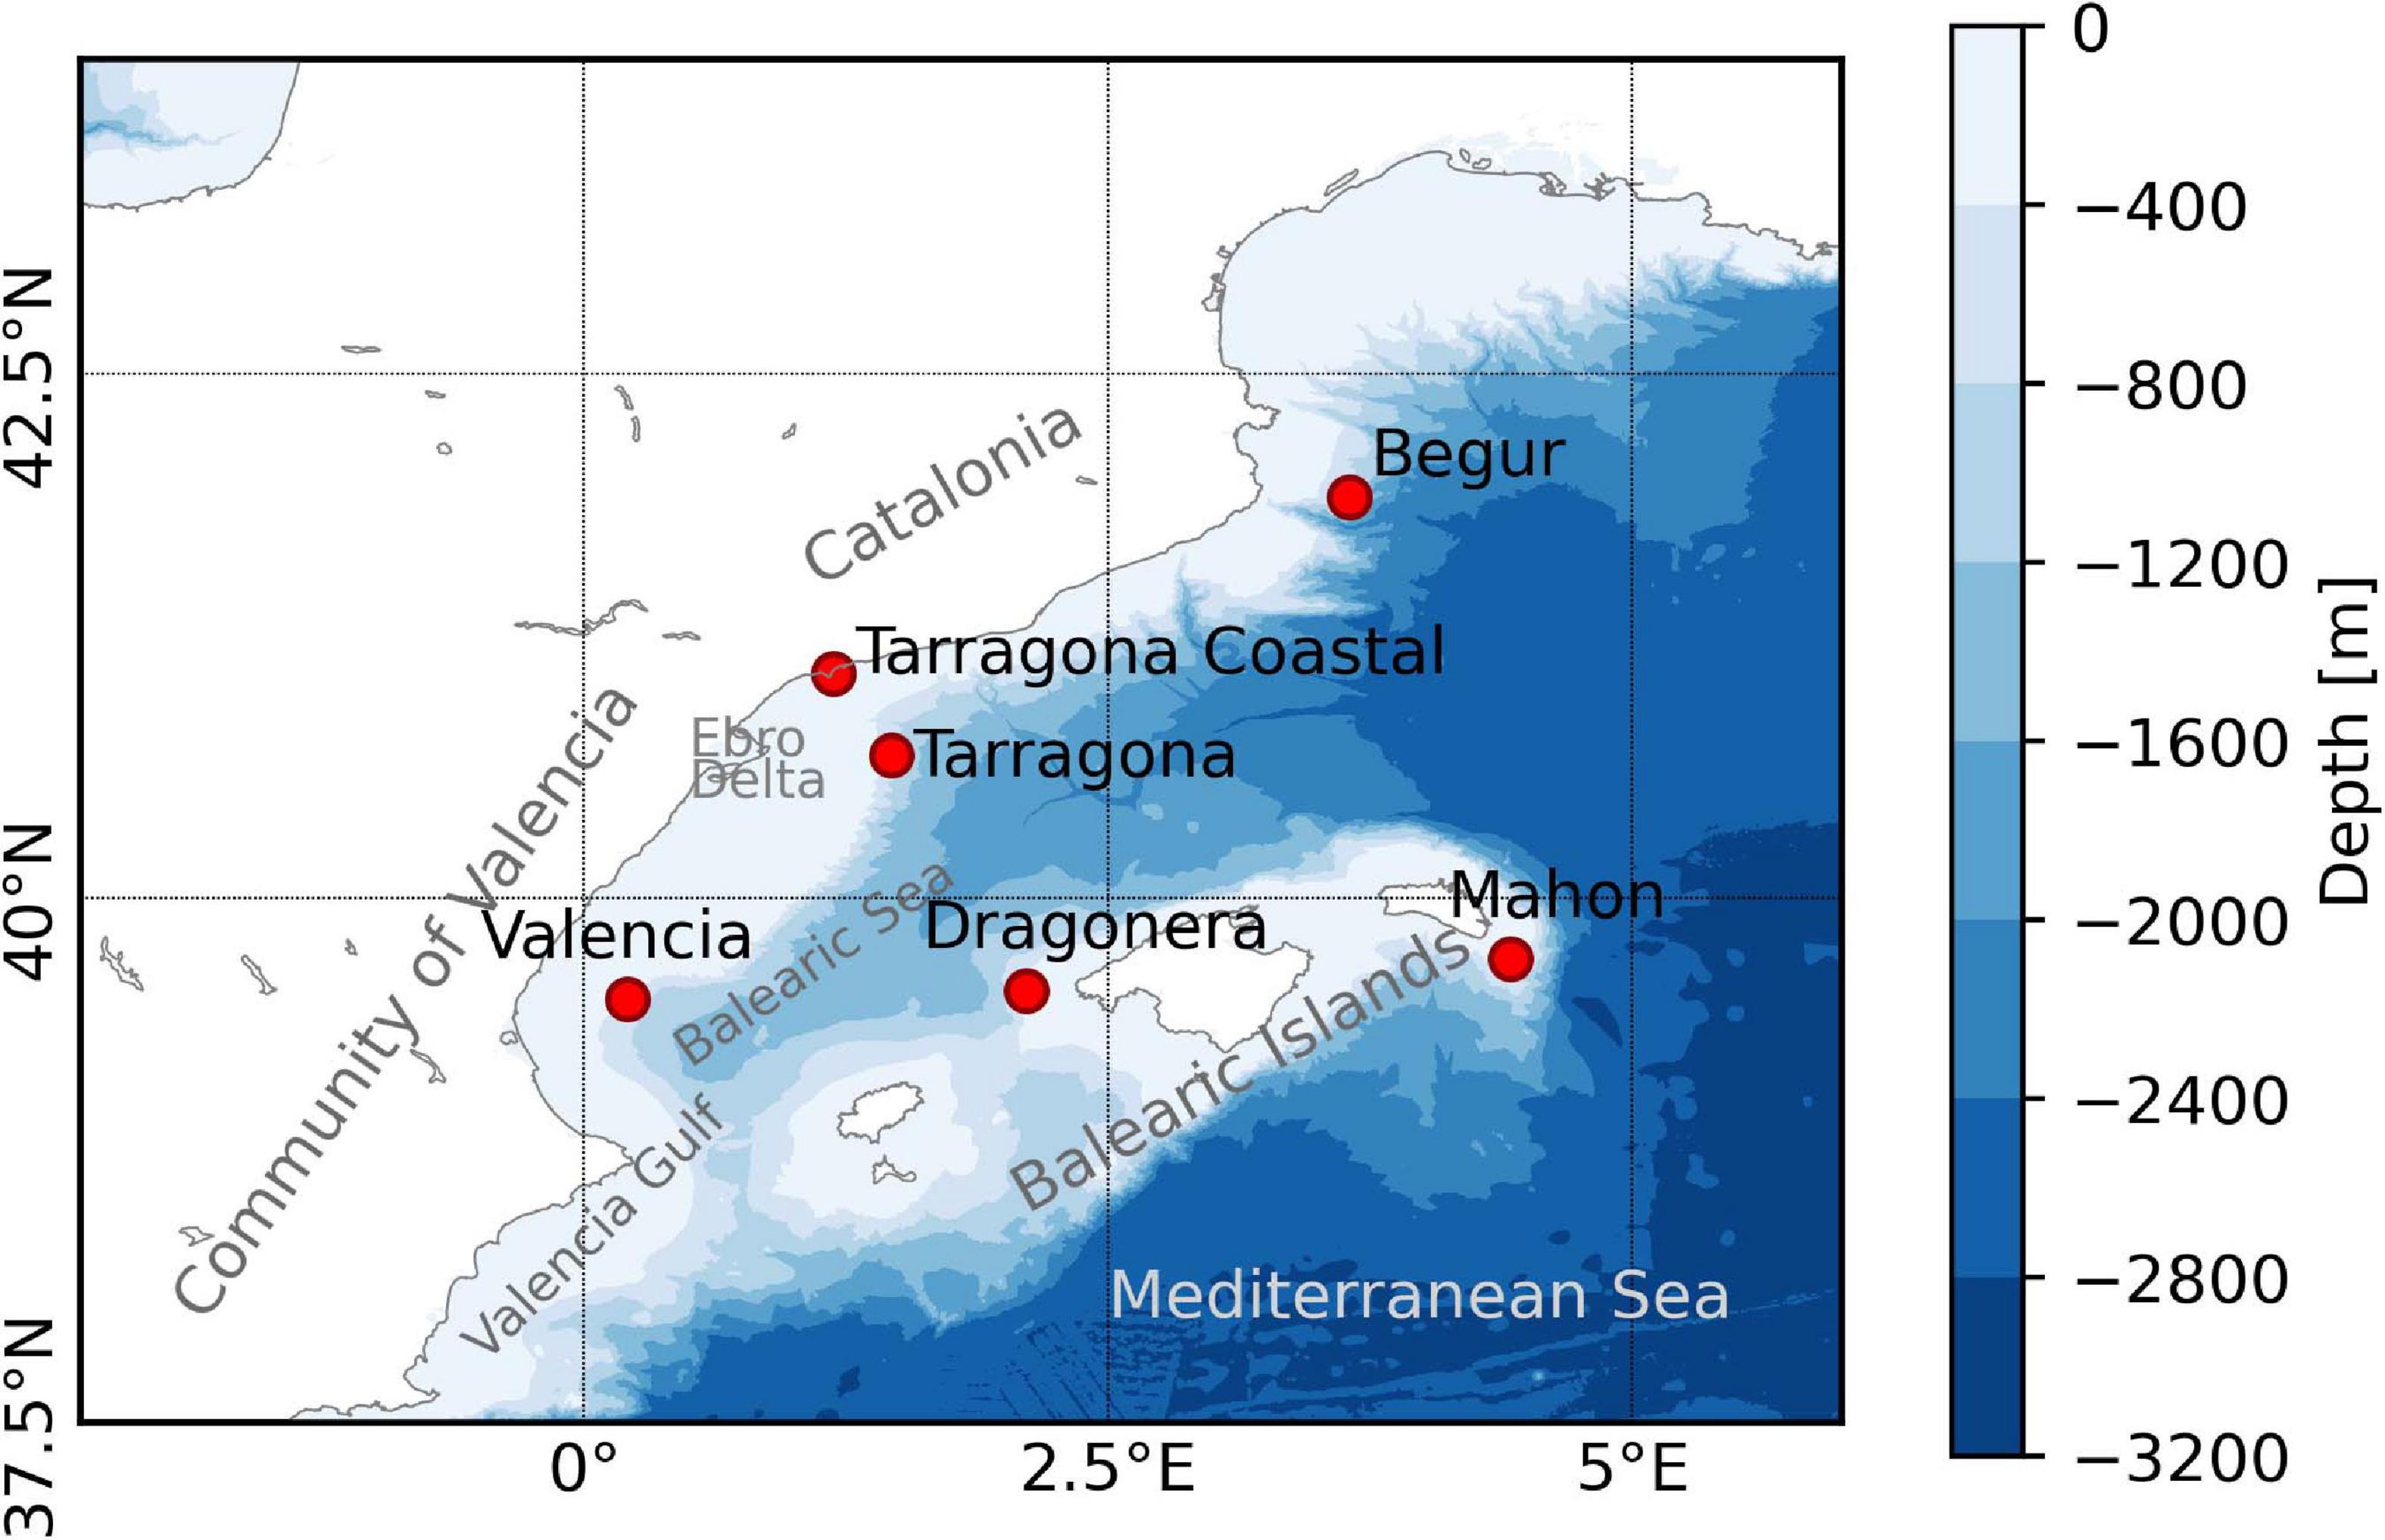
Figure 1. Map of the Spanish Mediterranean coast. It shows the location of the six buoys of PdE that provide the observations for Storm Gloria.
Materials and Methods
Forecast and Observations of the Atmospheric Conditions During Storm Gloria
The global atmospheric conditions of Storm Gloria were provided by the European Center for Medium Range Weather Forecasts (ECMWF). The forecast system relies on the cy46r1 ECMWF Integrated Forecasting System (IFS) global model (ECMWF, 2019). The horizon of prediction can be up to 72 h. The exhaustive description of this model is out of the scope of this work. HARMONIE-AROME is one downstream model to ECMWF and is used to forecast winds on a finer mesh, over the Iberian Peninsula and the Spanish Isles. Its horizon of prediction can be up to 48 h. Therefore, for the horizon of prediction of 72 h, the wind forcings of the ECMWF are employed, despite having a lower resolution than HARMONIE-AROME. During Storm Gloria, the results of the HARMONIE-AROME forecast system did not differ significantly from the results from ECMWF. Therefore, the former was used to produce the forecasts for wave conditions, along with the output by ECMWF, but is not described again. Moreover, observed rain conditions are provided by the meteorological stations of AEMET.
AEMET uses the HARMONIE-AROME model (Bengtsson et al., 2017), operationally, to elaborate 48-h mesoscale predictions with the 3-h analysis cycling. This Limited Area Model (LAM) runs over two areas. One is centered over the Iberian Peninsula and Balearic Islands. Another one is centered over Canary Islands. In this study, only the Iberian domain has been taken. It is formed by 1,152 × 864 grid points, and it has a 2.5-km horizontal resolution, 65 vertical levels, and a 60-s time step. The model initial conditions are obtained through a 3D-VAR upper air assimilation. It uses conventional observations, as well as the SYNOP, AIRCRAFT, SHIP, DRIBU, TEMP, AMSU-A, AMSU-B, MHS, and GNSS satellite information. The surface model, SURFEX (Masson et al., 2013), uses optimal interpolation-based methodology to generate the analyzed fields. The boundary conditions are extracted from the cy46r1 ECMWF Integrated Forecasting System (IFS) global model predictions. These are provided to the LAM model, every 3 h.
AEMET runs the cy40h1.1 version, operationally, when Storm Gloria affected the Iberian Peninsula. This model version includes several improvements, which are described, in detail, in Bengtsson et al. (2017).
Forecast and Observations and of the Wave Conditions During Storm Gloria
Storm Gloria is described with the help of the forecast and observations. PdE manages a complex oceanographic observing system along the Spanish Coast. This system includes different networks: deep water buoys, coastal buoys, tide gauges, and HF radars. It maintains additional observing stations, as well as a multifaceted database where all the information is saved, conforming the PORTUS System (Álvarez-Fanjul et al., 2018). The two observation systems that provide data for this study are the Deep Water Buoy Network and the Coastal Buoy Network.
The Spanish Deep Water Buoy Network is composed by 15 measuring positions in open waters. It is moored in depths between 400 and 2,000 m. These buoys transmit in real time, by satellite. They are multiparametric platforms, which provide, since the mid 1990s, directional waves (height, period, and direction), meteorological parameters (air temperature, atmospheric pressure, and wind speed and direction), and oceanographic parameters (sea temperature, salinity, current speed, and direction) (Álvarez-Fanjul et al., 2003). The Spanish Coastal Buoy Network started in the early 80 s, with 9 measurement positions, close to the coast. These coastal buoys measure directional waves and sea temperature and transmit them by radio, in real time. Two of these stations measure, in addition, meteorological parameters.
Data from both networks are being distributed through the PORTUS System2, as well as the Copernicus Marine Environment Monitoring Service (CMEMS) in situ products3. Additional statistical information is published in the network-consolidated reports. A total of six buoys were considered in this study. All of those moored between the Iberia Mediterranean coast and the Balearic Islands were included (Figure 1). That is, those in the region that was most affected by storm Gloria: Valencia, Tarragona, Cabo Begur, Dragonera, Mahon, and Tarragona-coastal.
PdE provides an operational wave forecast for Spanish Port Authorities. It is called the PORTUS-wana wave forecast model. The forecasting horizon is 72 h, and the forecast is run twice a day. The system is driven by wind fields provided by AEMET and ECMWF, from the HARMONIE-AROME model and the ECMWF IFS model. This operational wave forecasting system is split in two different systems, one for the ocean scale and another one for the coastal/local scale. The ocean system covers the North Atlantic Ocean and the Mediterranean Sea, where waves that propagate to the coastal Spanish areas are generated. At the same time, the coastal and local scales cover multiple nested applications, which simulate the propagation and generation of waves, near and inside the harbors.
The ocean system is run with an implementation of the WAM model (WAMDI Group, 1988; Günther et al., 1992). It is based on WAM Cycle 4.5.4, a third-generation wave model. This system is formed by a four-step nesting scheme going from 1/4° in deep water to 1/36° spatial resolution near the continental shelf. The system, in the first two domains, is driven by the ECMWF HRES model (0.1° horizontal resolution). The third nesting step is split in two domains, one covering the Iberian Peninsula and the Balearic Islands and the second one covering the Canary Islands. These domains are driven by the HARMONIE model, for the first 48 h of forecast, and by the ECMWF HRES model, for the last 24 h of forecast. Nested to the Iberian Peninsula domain, two specific domains are thus nested in the fourth step of the wave train. These domains cover the Balearic Islands and the Strait of Gibraltar, with resolutions of 1.4 km and 700 m, respectively. At all cases, directional wave spectra are discretized in 30 frequencies and 36 directions.
The coastal and local systems require the SWAN model (Booij et al., 1999) in multiple domains, which cover the coastal areas, near the Spanish harbors. These applications provide wave information near the harbors, as well as boundary conditions for specific wave agitation inside the port applications. This system has a spatial resolution between 400 and 100 meters, depending on the specific domain. Wave spectra are discretized with 35 frequencies and 72 directions. SWAN considers wind wave growth and quadruplet and triad wave–wave interactions plus depth-induced breaking. The operational setup uses Janssen (1991) formulation for the wind wave growth, while non-linear wave interactions are parameterized through the DIA scheme (Hasselmann et al., 1985) and the LTA method (Eldeberky, 1996) at deep and intermediate waters, respectively. Regarding sink terms, white-capping dissipation corresponds to the Komen et al. (1984) formula and bottom friction dissipation from the JONSWAP results (Hasselmann et al., 1973). Finally, depth-induced breaking is triggered through the Battjes and Janssen (1978) bore-based model.
Three statistical tools are used to evaluate the goodness of the forecasting model of PdE. The first one is the scatter index. Another one is a skill score based on the mean square deviation (Murphy, 1988). A third one is a skill score based on the Hanna–Heinold indicator (Mentaschi et al., 2013). The Hanna–Heinold indicator is an improvement over the scatter index and the conventional skill score. It is unaffected by bias. The scatter index and the conventional skill score are smaller for models with negative bias, so they can exaggerate the goodness of the model, in these cases.
The PORTUS-wana wave forecast model can be run with a reanalyzed wind to obtain reanalyzed wave conditions. In this case, it is referred to as the PORTUS-wana reanalysis model. These are the time series that are represented alongside the observations.
The study site for the forecast of the overtopping is a breakwater in Nova Bocana (New Mouth), Barcelona Harbor (Catalonia, Spain). Specifically, it is the track with a vertical section. The height from the base is 8 m. A local wave prediction, with a resolution of 1 h, is implemented in this harbor. It is called SAPO, and it forecasts with a horizon of 72 h. This forecast system has two modules: one on the outside of the harbor and one on the inside. The outside module covers an area of 25 km × 25 km, and it is nestled within the PORTUS-wana forecast system. The heights of the forecasted waves that directly impact against the breakwater are used to compute the overtopping, with the formula presented in Franco and Franco (1999). The sea-level height, forecasted with the same horizon, is considered, as well. The threshold for the overtopping at the selected section is 10–4 m3/s/linear meter.
A PdE downstream service, called CMA (Cuadro de Mando Ambiental) includes an early warning system that is triggered when the forecasted value of a series of oceanographic parameters exceed predefined threshold values. It is implemented in almost every state-owned port of Spain (Álvarez-Fanjul et al., 2018). The local wave forecast application, which is implemented for the Barcelona Harbor, includes the evaluation of wave overtopping for the different breakwaters, specifically for the vertical wall in Nova Bocana. The forecast is compared to observations by a webcam installed in Barcelona Harbor, as well as to a reanalysis of the overtopping. The reanalysis is computed with reanalysis wave heights and sea levels.
Historical Performance of Several Reanalysis Models and Relevance of Storm Gloria
The historical performance of different reanalysis models is compared to each other, in order to assess the performance of the PORTUS-wana wave reanalysis model, as well as to see the suitability of each model to specific conditions. The features of each model are presented, and standard statistics (the root mean squared error, the scatter index, the results of the best linear fit, and the correlation coefficient) are given for 2006–2018. We have studied five possible reanalyses in the area: the CMEMS wave hindcast corresponding to Mediterranean Sea (MED)4 and Iberia–Biscay–Ireland (IBI)5 areas, the ERA5 (fifth major global reanalysis produced by ECMWF) wave reanalysis6, the wave model analysis data from the PORTUS reanalysis System (wana), and the new PORTUS reanalysis made recently by PdE, forced with ERA5 wind fields.
Moreover, despite that the buoys in the area have had high data coverage (about an average of 90%), even with proper maintenance, some data are lost every year, due to accidents, sensor malfunctions, or ordinary planned maintenance operations. Thus, observations have been compared with PORTUS-ERA5 model values, which cover the whole period and can fill in the gaps. It serves to verify the relevance of Storm Gloria.
Analysis of Extreme Wave Heights
It is aimed to assess the odds of this type of extreme wave heights. Hence, in the case it was necessary, it will proceed to redefine the return periods associated with the maximum wave heights in the study area. Analyses are carried out on two sets of data: (a) the time series that is available up to the year 2019 (before storm Gloria) and (b) a complete time series (including Gloria).
One of the main concerns on an extreme wave analysis is the choice of the threshold. The act of discerning a stormy period from a calm period can highly influence the number of extreme events within a sample. The threshold is empirically decided, upon a trade-off between statistical significance of the sample and the goodness of fit to a probability distribution function of extremes. Once a proper threshold is defined, these extreme values can be fit through a peak over threshold (POT) approach (Cañellas et al., 2007), along with the 3-parameter Weibull distribution to PdE-moored buoys. In literature, other methods had been proposed. For instance, monthly maxima of significant wave heights can also be modeled through a generalized extreme value (GEV) probability distribution function (Sartini et al., 2017). The advantage of the POT over the GEV is that more than one peak can be accounted per year in the former, whereas only one peak per year can usually be considered, in the latter. The 3-parameter Weibull distribution can help obtain a return period for each possible wave height.
Results
Synoptic Description of the Storm
Storm Gloria was a severe event that took place between January 18th and 23rd 2020, affecting areas of Spain and France. Its impacts were intense winds up to 140 km/h, extreme waves, and heavy precipitation and snow. It had a configuration of atmospheric pressures, with a high over the European continent and a small low over the South-Western Mediterranean. This situation is well described in the AEMET Report (2020).
On January 18th at 00UTC, at 500 hPa (Figure 2A), an intense upper-level trough could be observed in the North Atlantic, moving toward Europe. Another weak upper-level trough was situated in France, and a ridge was located in the middle. During January 19th, the intense upper-level trough moved toward the southeast and the upper-level ridge was intensified. At the same time, the upper-level trough over France was deepened and it moved toward the Iberian Peninsula. It eventually established itself over the Spanish Mediterranean coast (Figure 2B).
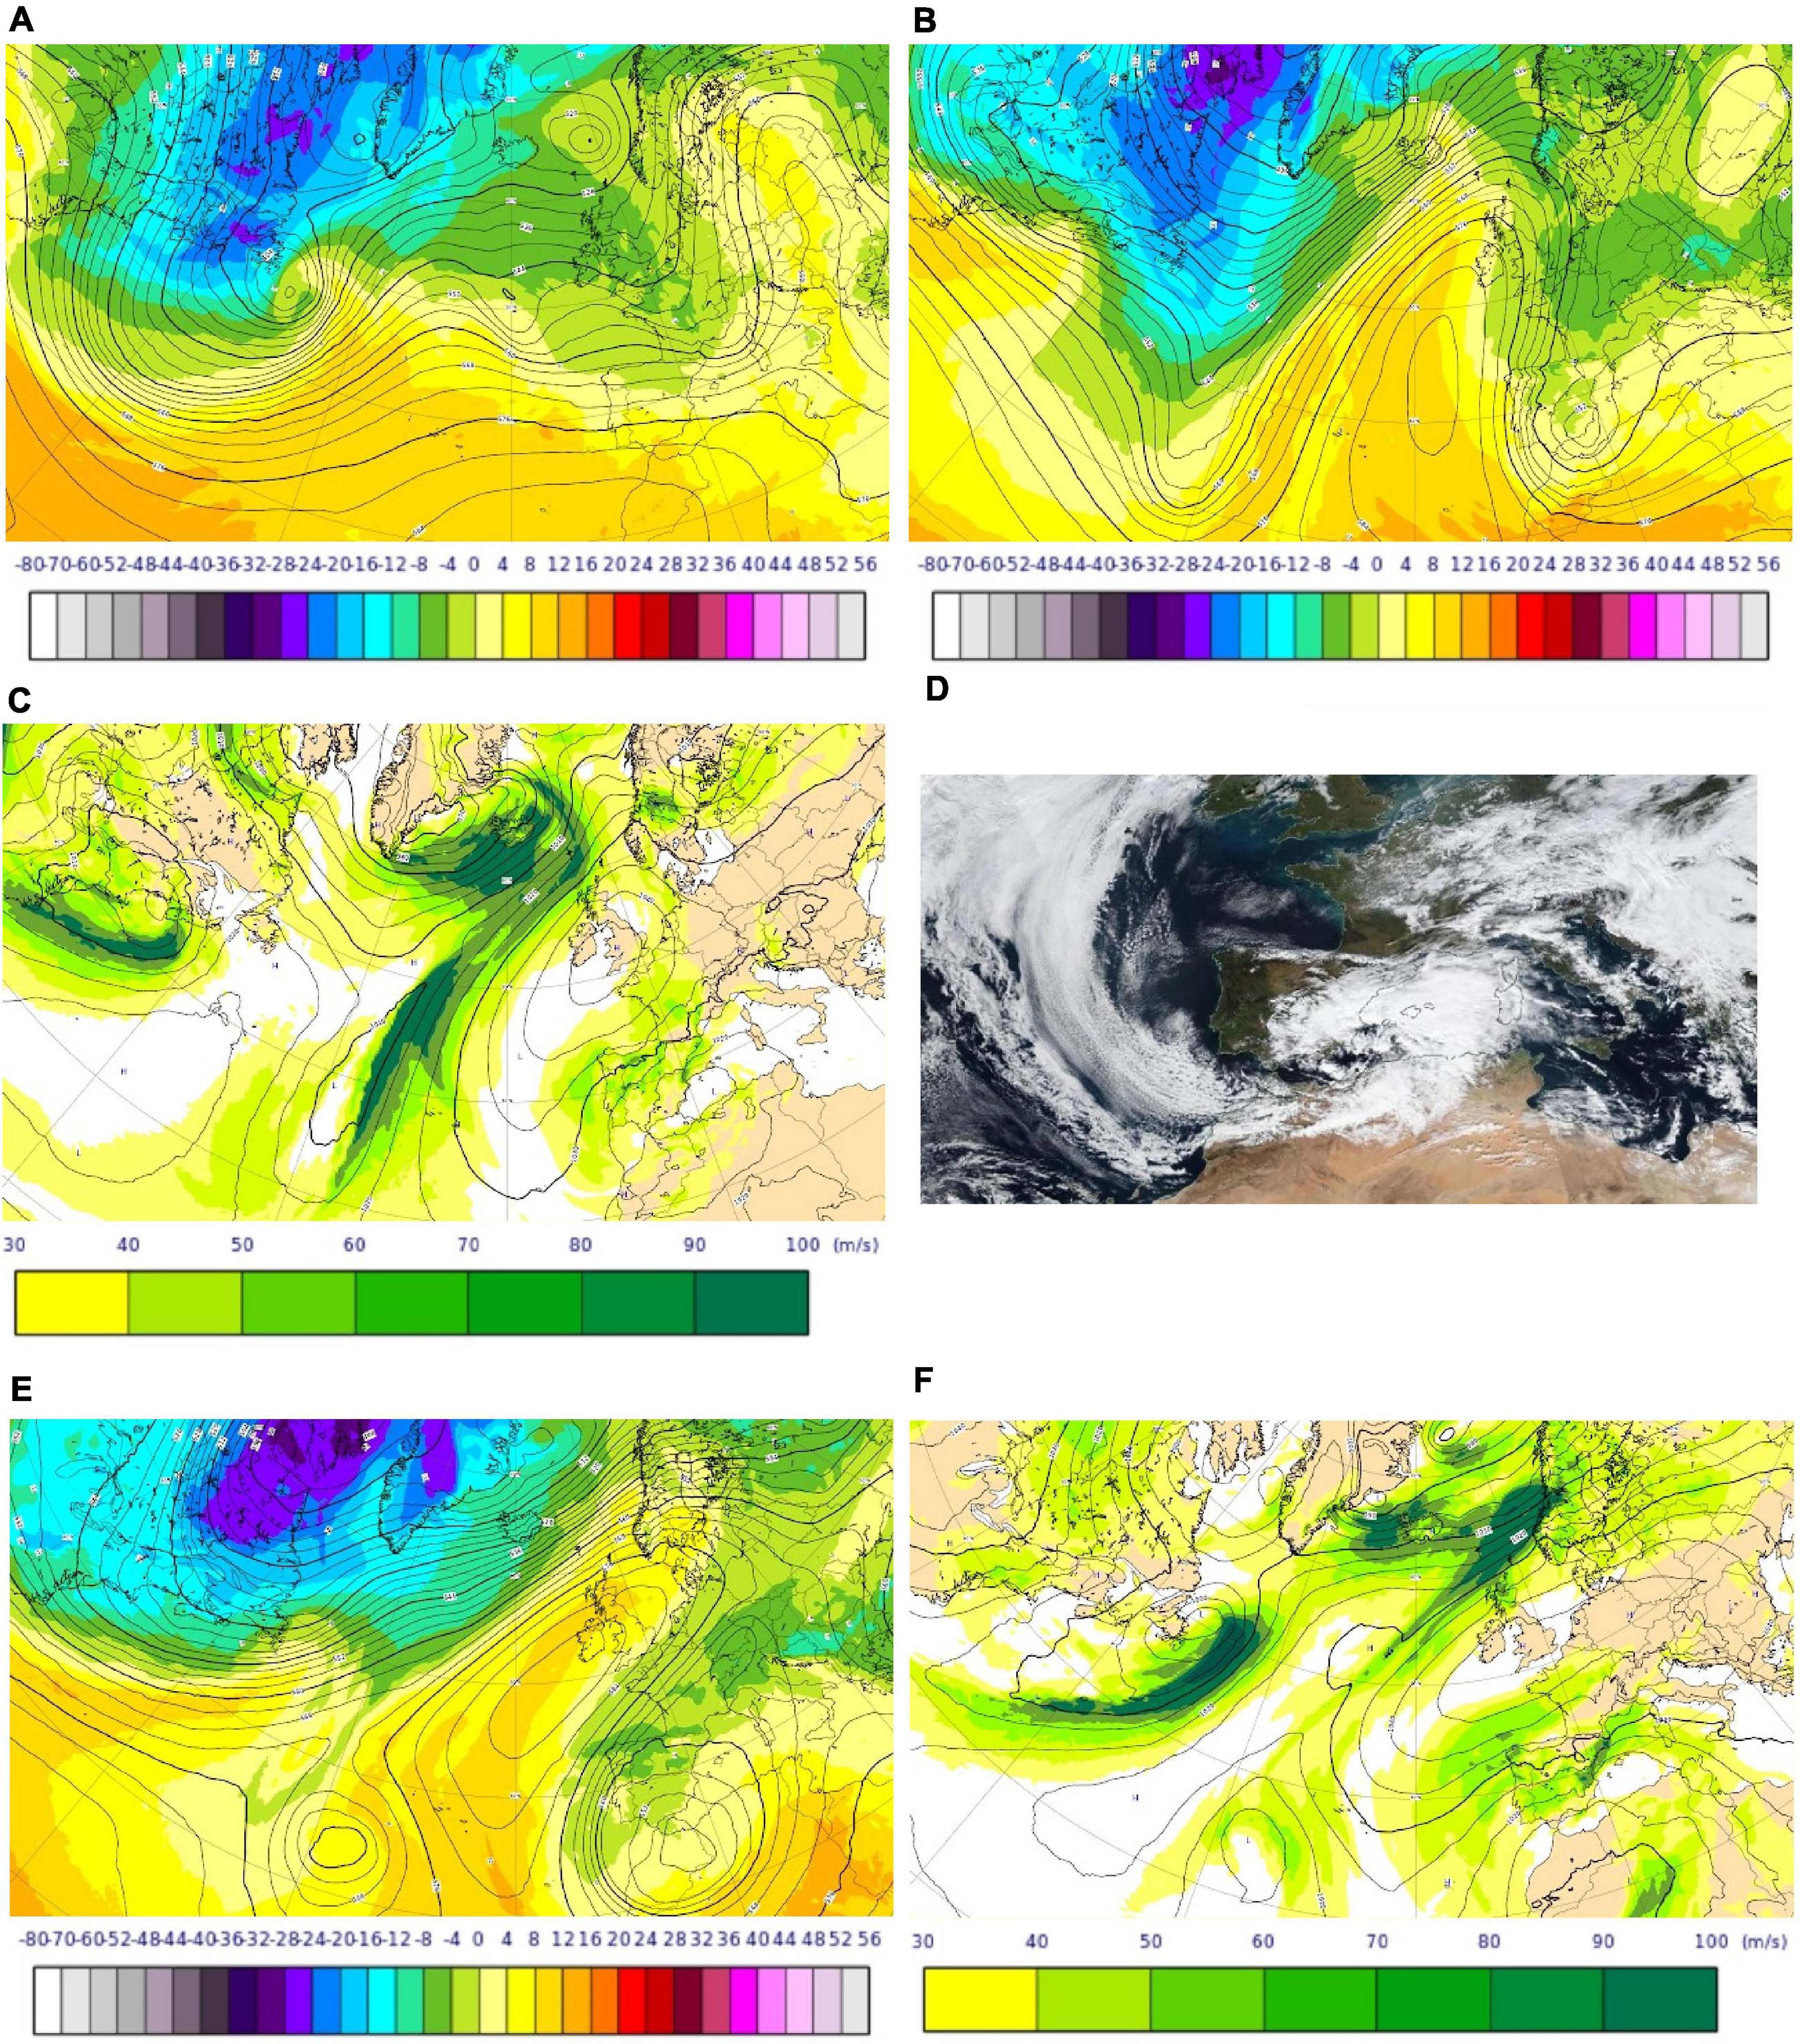
Figure 2. (A) ECMWF analysis of geopotential height at 500 hPa (contours in meters) and temperature at 850 hPa (colors in°C) at 0000 UTC on January 18th; (B) similar analysis at 1200 UTC on January 19th; (C) ECMWF analysis of mean sea-level pressure (contours in hPa) and 200-hPa wind speed (colors in m/s) on 19th January at 1200 UTC; (D) image MODIS SUOMI-NPP satellite on 19th January at 1200 UTC; (E) ECMWF analysis on 20th January 2020 on geopotential height at 500 hPa (contours in meters) and temperature at 850 hPa (colors in°C) on 20th January 2020; (F) mean sea-level pressure (contours in hPa) and 200-hPa wind speed (colors in m/s) on 20th January 2020.
On January 19th, a low-pressure center at surface level was situated between Nao Cape and Ibiza Island, which are on either side of the Gulf of Valencia. This surface low was not quite deep (1,011 hPa in the center), but a strong high-pressure system situated over the British Islands, recording a historical value of 1,050 hPa in the center (highest-pressure value registered by the Met Office since 1957), promotes a strong pressure gradient (Figure 2C). The synoptic situation can be appreciated in the satellite image displayed in Figure 2D.
A strong pressure gradient was established between South France and the Balearic Islands, promoting strong winds and high waves in the Mediterranean area. On January 19th and 20th, wind gusts sped up to 108 km/h in Barx (Province of Valencia, Community of Valencia) in January 19th to 115 km/h in Oliva (same province as Barx) on January 20th and to 110 km/h in Capdepera (Balearic Islands) on January 19th.
The intense upper-level trough was centered over the Iberian Peninsula on 20th January (Figure 2E). It was associated with cold air in 850 hPa, leading up to unstable conditions and great potential instability over the Mediterranean area of Spain. The pressure gradient was intensified, as can be observed in Figure 2F. In the next days, the upper-level trough was disconnected from the main westerly circulation, becoming an intense cutoff low-pressure center over the Iberian Peninsula. This configuration favored a south-easterly flow over the Iberia Mediterranean coast and the Balearic Islands, providing great amounts of humidity and rainfall. The warm and moist unstable air, in addition to the orography near the coast, established a perfect triggering mechanism for deep-convection development. According to the observation system of AEMET, this resulted in heavy precipitation and flash floods in several Spanish Mediterranean towns: Horta de Sant Joan (Tarragona province in Catalonia), registered 227.4 mm on January 21st, and Lluc, Escorca (Balearic Islands), registered 156.4 mm on January 20th, just to mention a few. The mean maximum daily precipitation had been 50–100 mm in most of the Spanish Mediterranean coast, as well as the Balearic Islands.
During January 20th, Gloria moved toward the southwest. It was located over the Alboran Sea (between Spain and the African Continent, approximately at 36.08°N, 3.3°W) and extended over the southern half of the Iberian Peninsula and Morocco. This large, albeit thin, low-pressure system remained in the same position until January 22nd, allowing for the warm and moist unstable air to continue claiming the Mediterranean Spanish coast, promoting heavy precipitation and snow in low levels in Tarragona, Castellón, and Teruel provinces (located from northern Spanish Mediterranean to middle Spanish Mediterranean). More details about the atmospheric condition can be found in Lorente et al. (2021).
Evolution of the Storm: Comparative Time Series With PORTUS-Wana Predicted Wave Field Maps, Reanalysis, and Buoys
Figure 3 shows the forecasted significant wave height fields provided by the PORTUS-wana wave model at different times. The figures coincide with the storm peak at Dragonera (a), Valencia (b), Tarragona (c), and Begur (d). The maximum value, over 8 m, was reached in Gulf of Valencia, on January 20th. However, extreme wave heights (over a threshold) lasted longer in Catalonia.
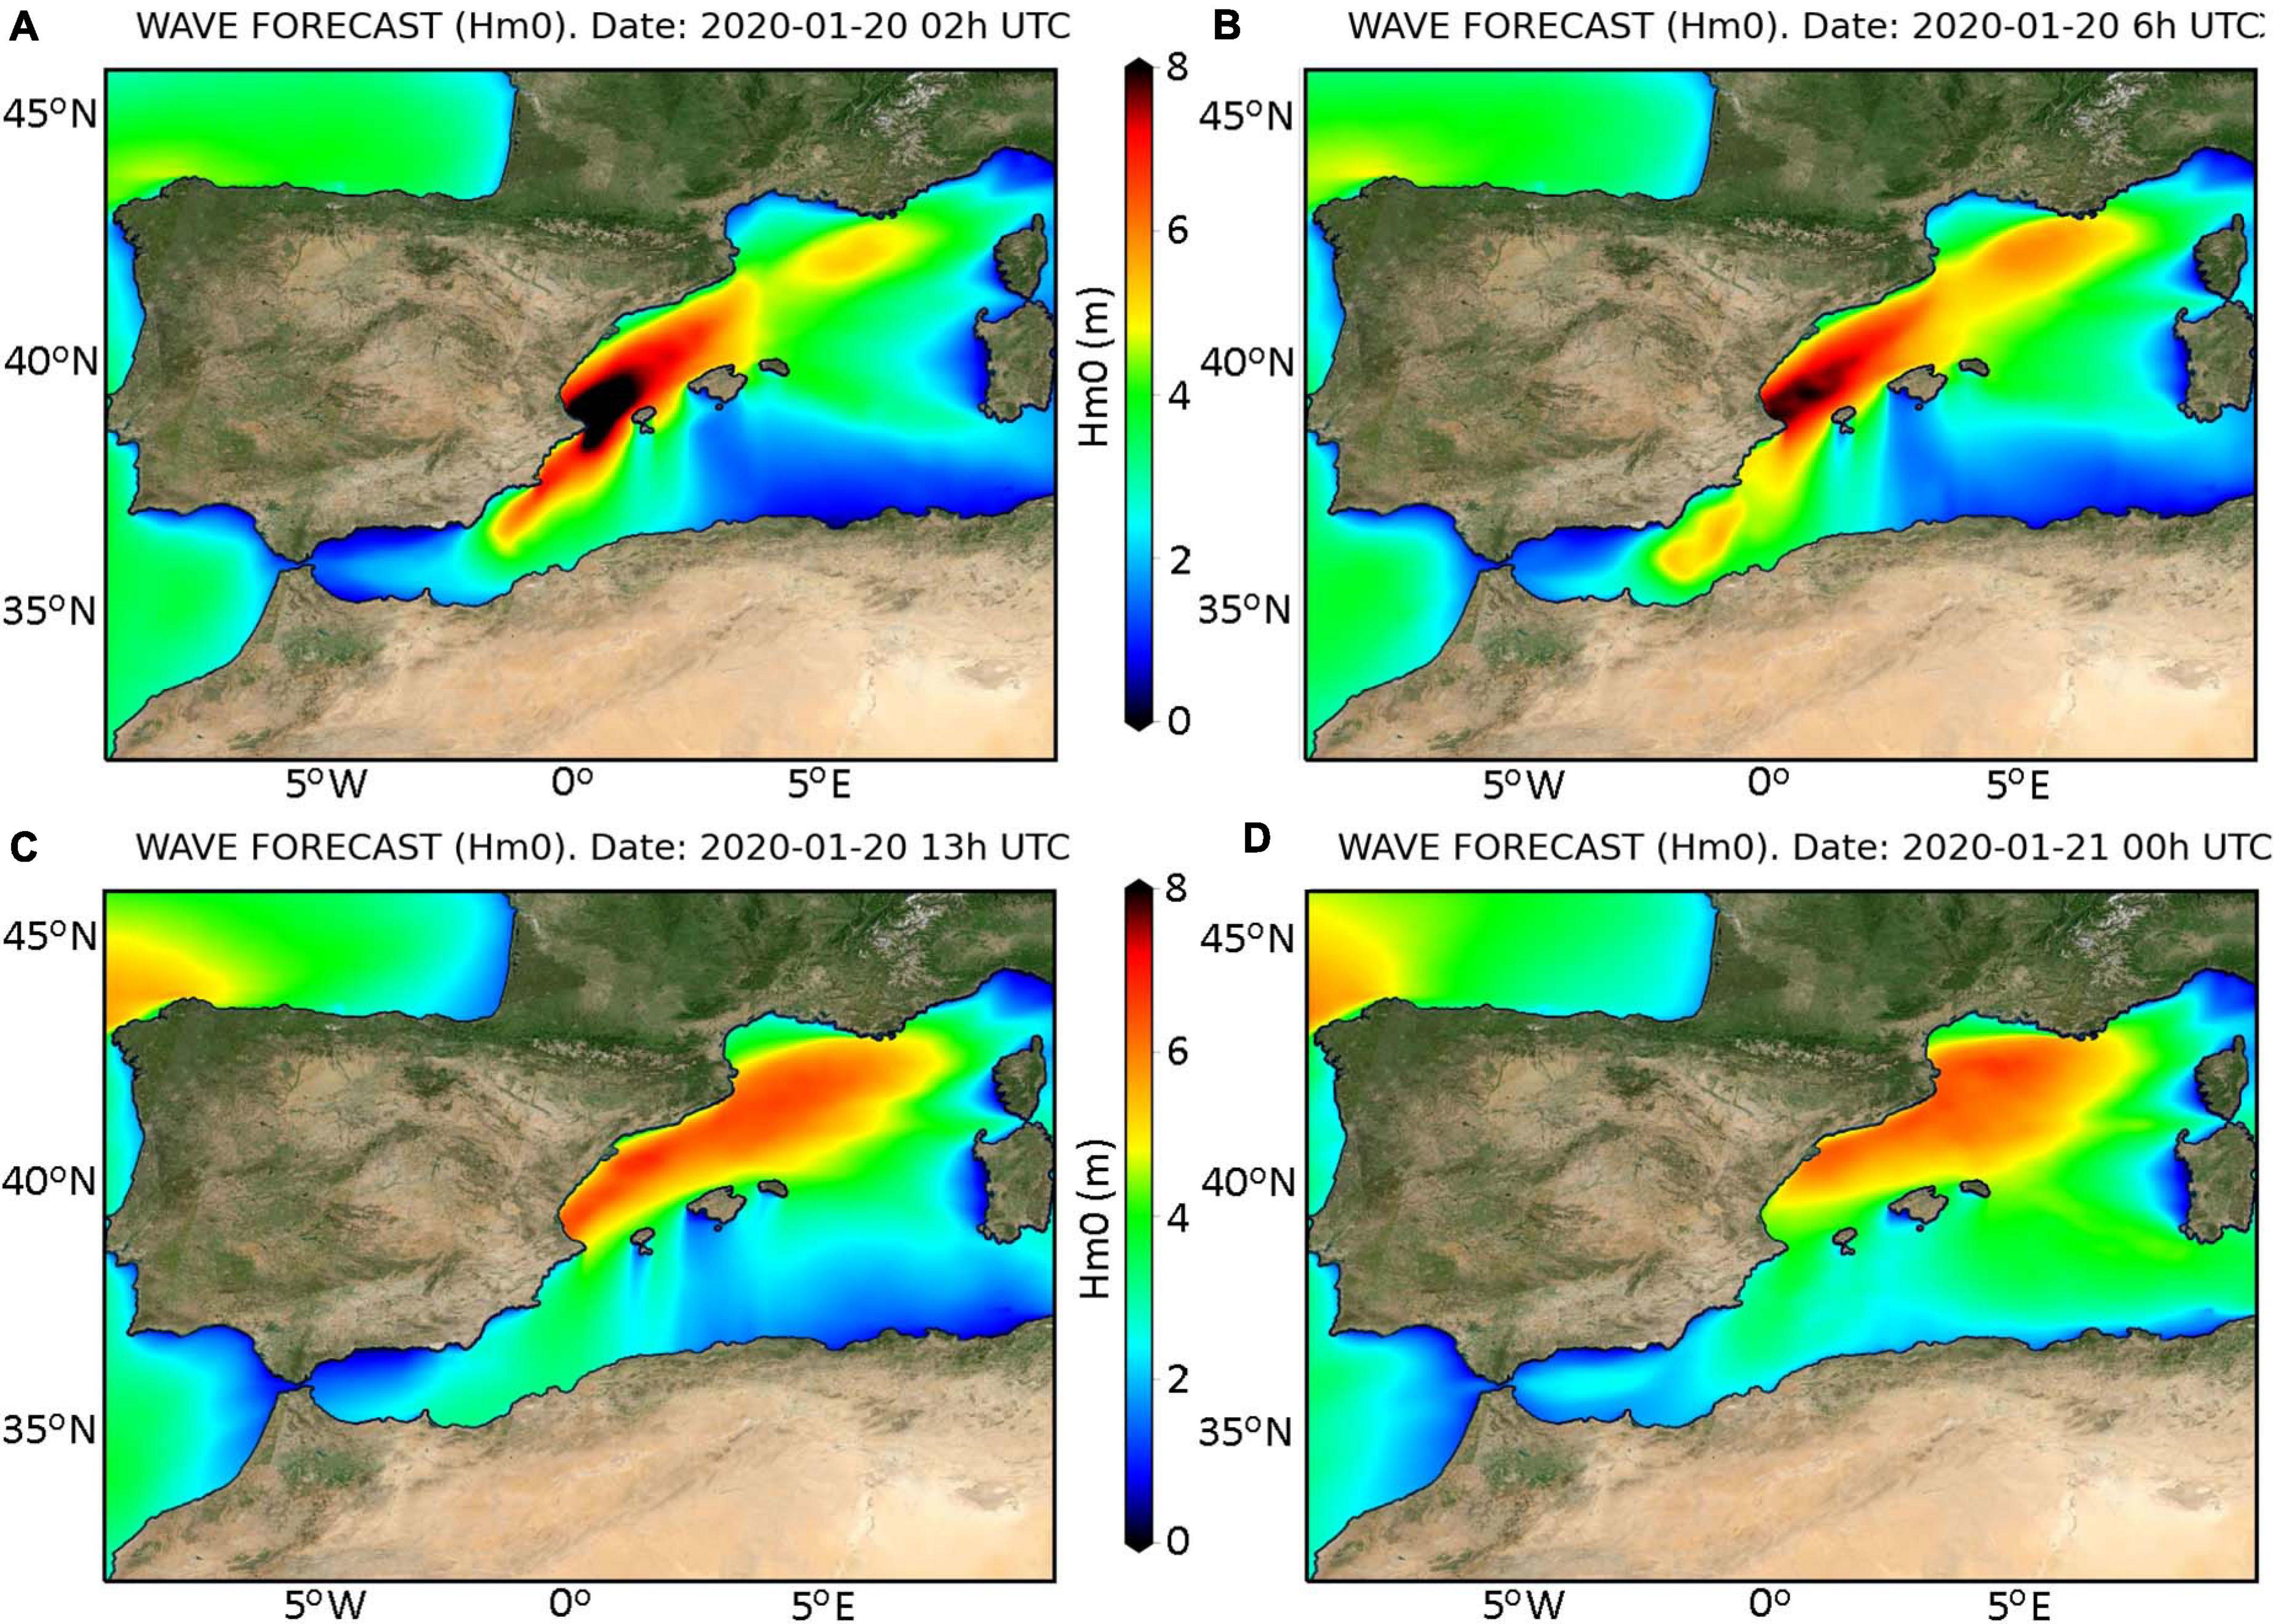
Figure 3. Map of the significant wave height field provided by the forecast wave system during Gloria at 2020-01-20 02 UTC (A), 2020-01-20 06 UTC (B), 2020-01-20 13 UTC (C), and 2020-01-21 00 UTC (D). They coincide with the storm peak measured at Dragonera, Valencia, Tarragona, and Begur, respectively.
In Figure 4, the evolution of the storm is represented through comparative time series of the significant wave height (Hm0) and the mean direction, from the buoys and the PORTUS-wana reanalysis model. The reanalysis of the Hm0, during Gloria, differed in less than 1 m from the corresponding buoy measurements. The only exception was Tarragona. The model also presented a smoother evolution of Hm0 than the observations. The predictions in calm periods were smaller than 0.4 m. The wave direction was more erratic during the calm period preceding and continuing Storm Gloria, but it turned predominantly Eastern in Valencia, Tarragona, and Begur, the three peninsular sites. It was mainly North-Eastern, in Dragonera. The prediction of the wave direction was practically coincident with the measurements.
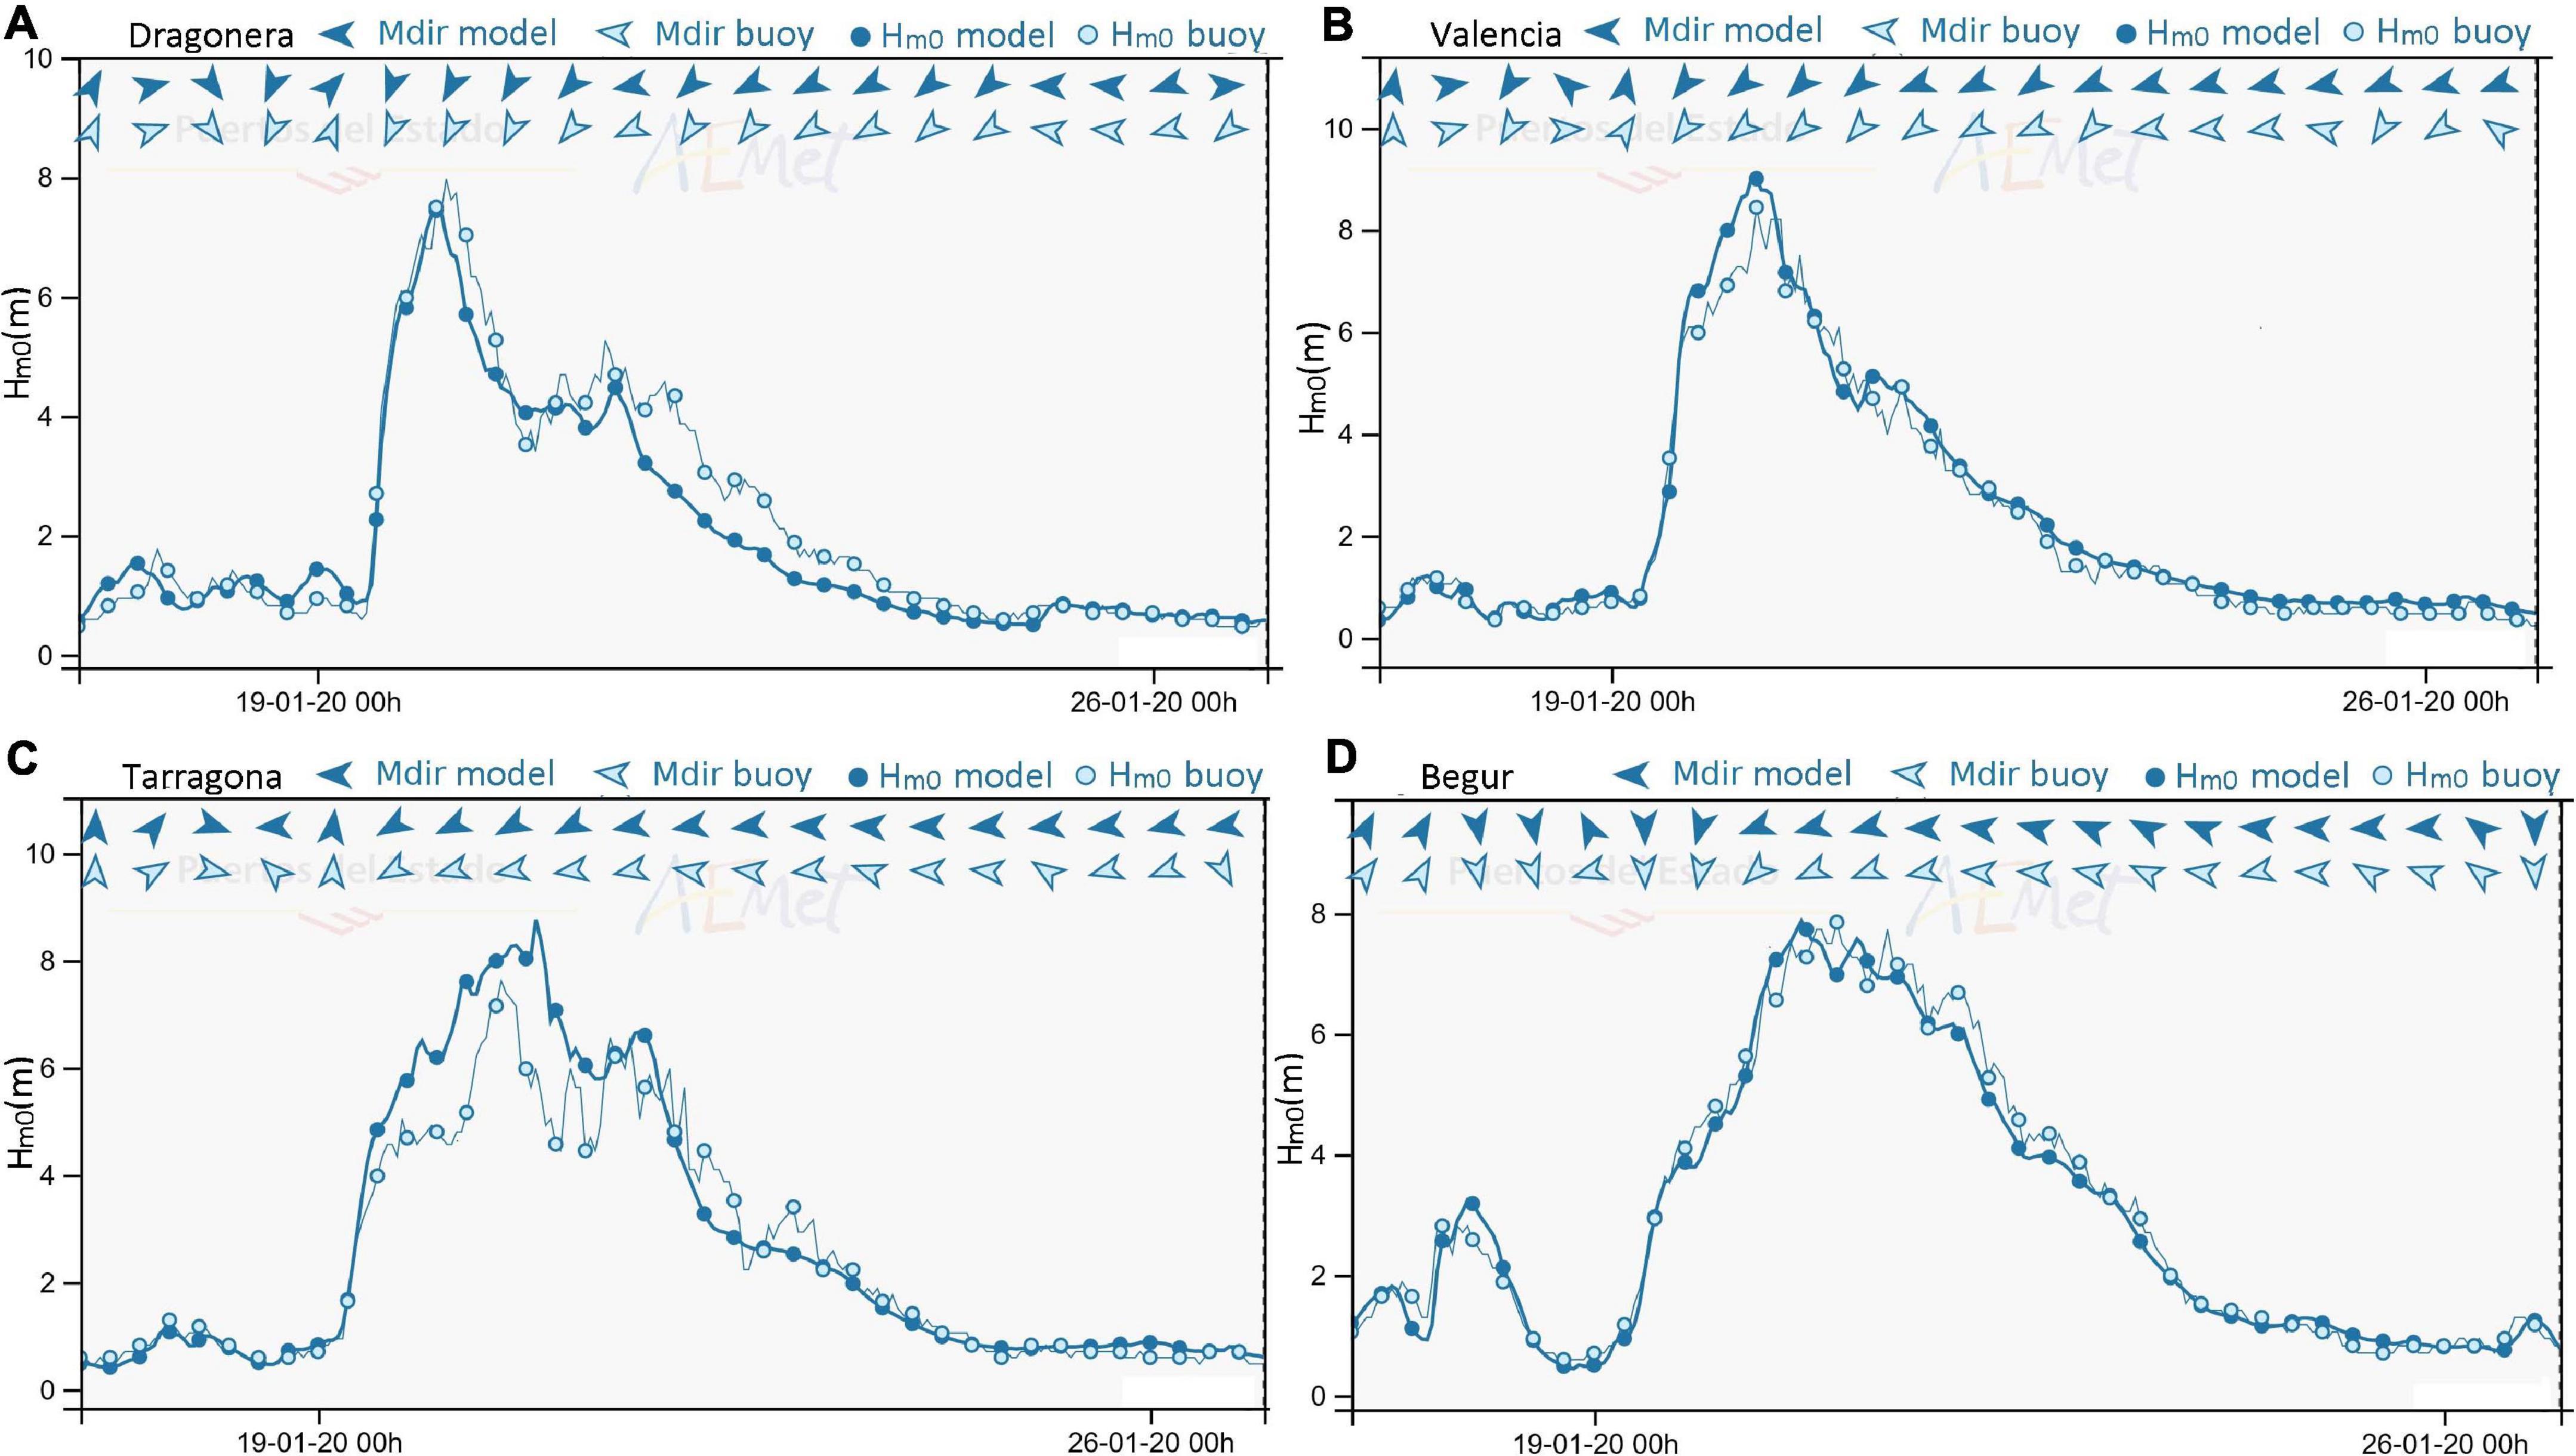
Figure 4. Evolution of the spectral significant wave height (Hm0) during storm Gloria, as measured by the buoy in Dragonera (A), Valencia (B), Tarragona (C), and Begur (D). The reanalyses are also presented. The dates are shown in “day-month-year hour” (UTC). The solid dots are the reanalyses, the lighter dots are the buoy measurements, the darker arrows are the wave directions from the reanalysis, and the lighter arrows are the observed wave directions (the positive y-axis is 0° and the direction increases clockwise).
Table 1 shows how the record Hm0 was beaten in these locations. The Hm0 was extremely high in Valencia and Tarragona, where major destruction to the coastal areas was registered. It also did in Tarragona coastal, to a lesser degree. The only location where the historical record is intact is Mahon, but extreme Hm0 was reached, as well.
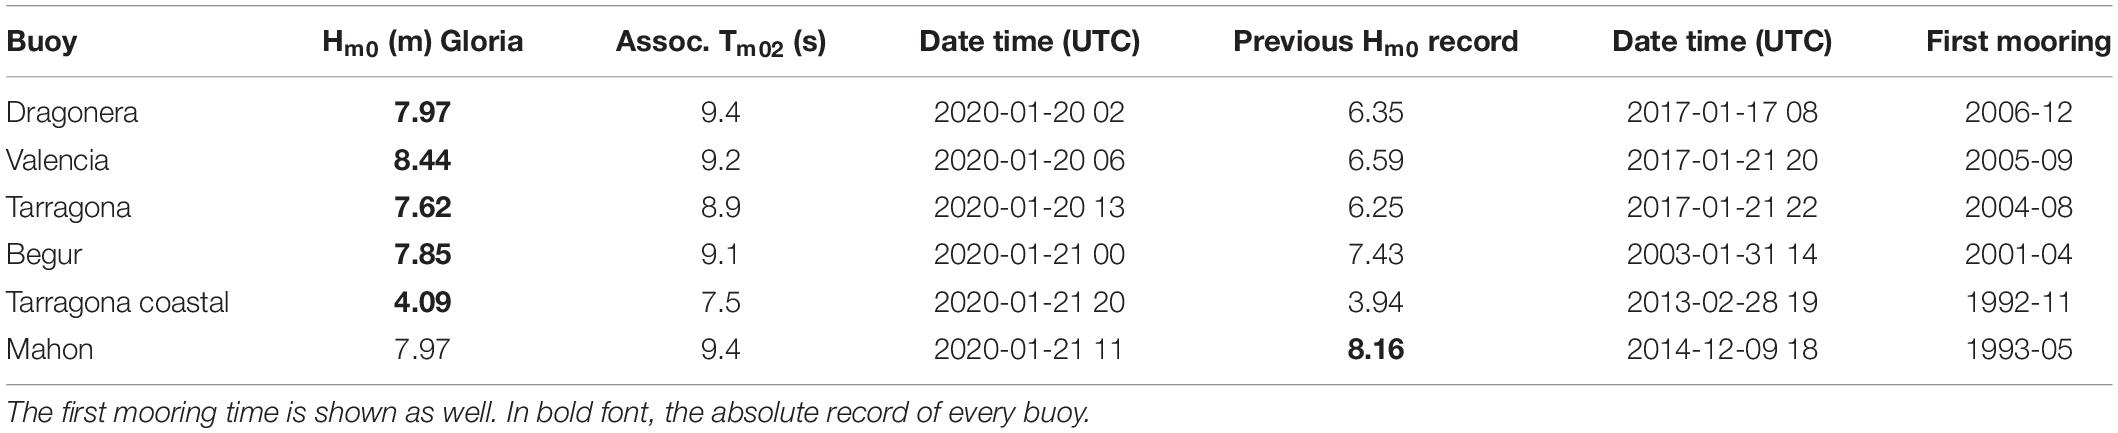
Table 1. Record spectral significant wave height (Hm0) reached during Gloria and associated mean period (Tm02), in comparison with historical records.
The reanalysis and the observations show the same maximum wave heights and evolution of the wave heights than the PORTUS-wana forecast system. The maxima are approximately 8 m, and the duration is longer in Tarragona and Begur.
PdE Wave Forecast Results Showing the Evolution of the Storm
Evolution of the Forecast With the Different Horizons
From a forecast horizon up to 48 h, the performance improves with lower forecast horizons (Figure 5). However, the performance for a forecast horizon equal to 60 or 72 h is better than the performance for a forecast horizon equal to 48 h. The prediction of the 2018–2020 series is also better than for Gloria. For greater prediction horizons, the mean square deviation and the Hanna–Heinold indicator are larger, denoting greater variance, so the associated skill scores are negative values with larger modules (Figures 5C,F). The Hanna–Heinold indicator does not vary perceptively for Gloria, in comparison to the 2018–2020 series. These skill scores are similar.
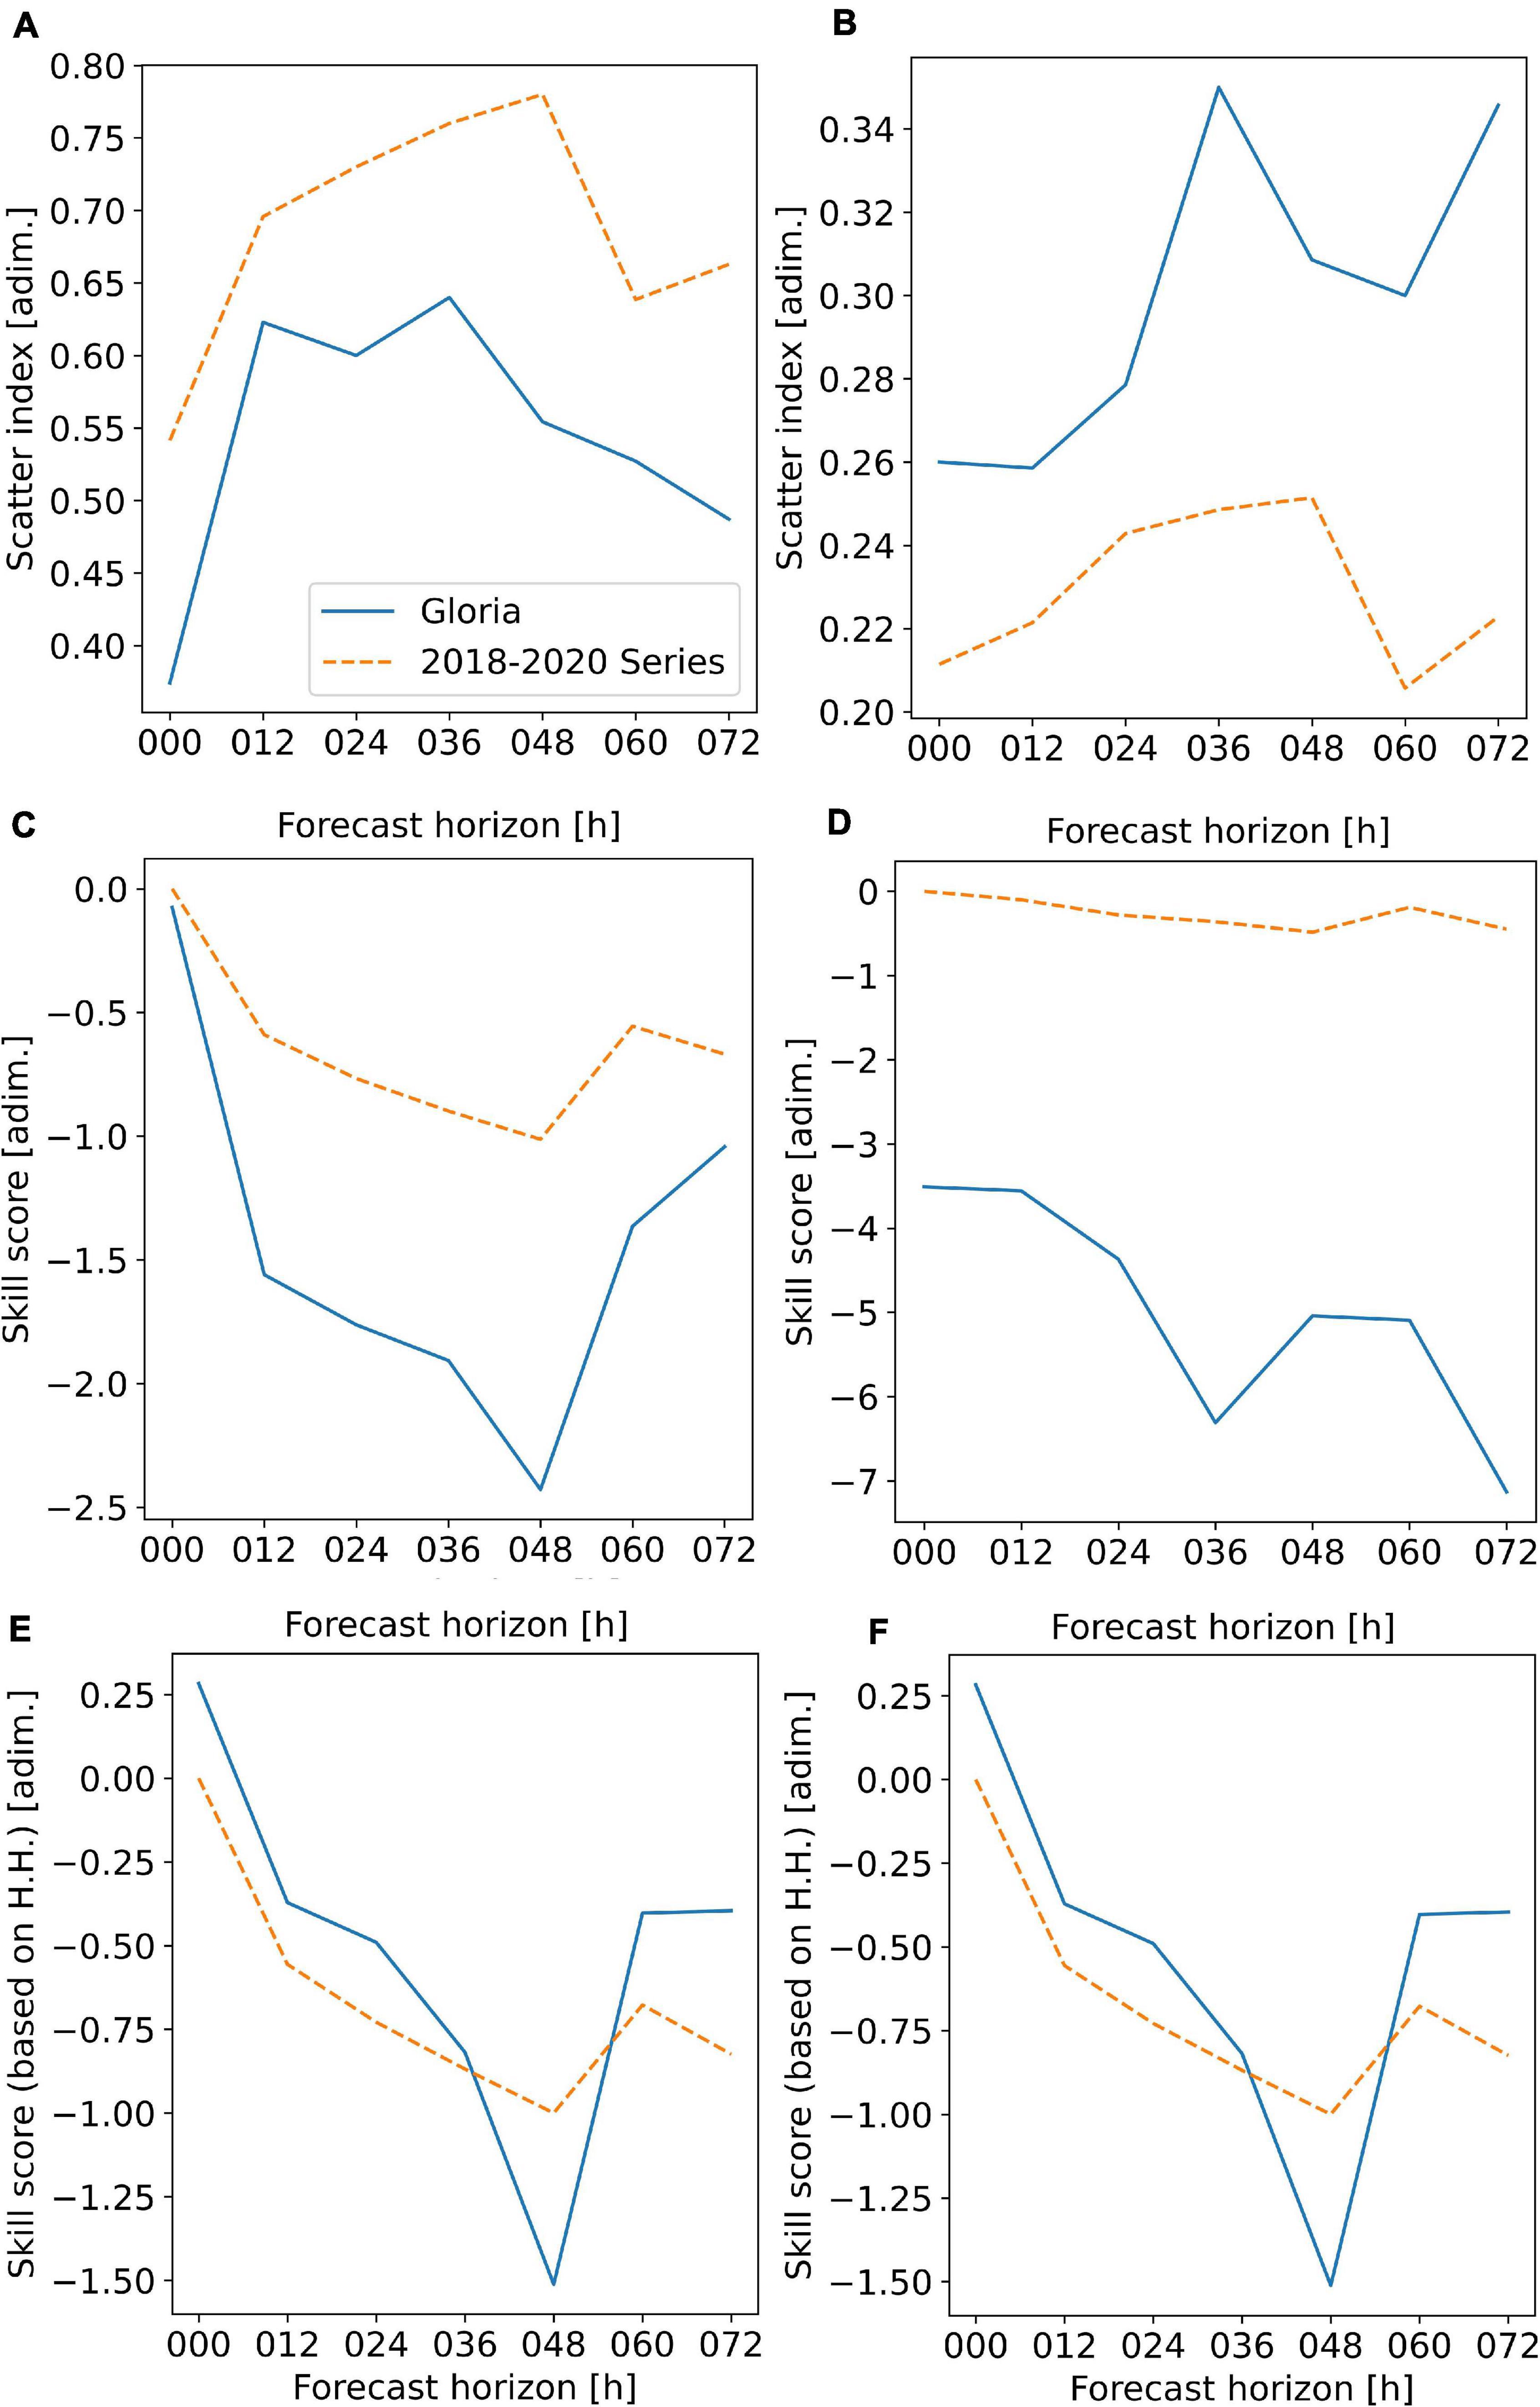
Figure 5. (A,B) show the scatter indexes averaged over the Mediterranean stations of Spain. (C,D) show the skill scores (based on the mean square deviation) averaged over the Mediterranean stations of Spain. (E,F) are the skill scores (based on the Hanna–Heinold indicator, instead of the mean square deviation) averaged over the Mediterranean stations of Spain. The left column is for wind, whereas the right one is for waves. One value is given for every prediction time and time period (either storm Gloria or the 2018–2020 series).
Evolution of the Overtopping Alerts
During storm Gloria, overtopping occurred in several sections of the different breakwaters. The CMA provided warning notifications to the Port Authority of Barcelona.
At the Nova Bocana section, a camera, owned by the Port Authority of Barcelona, recorded focusing the vertical wall of the breakwater, from January 18th to January 23rd. From the review of the recorded images, the Port Authority has estimated that the first overtopping event was registered at 2020-01-19 9:40 UTC (Figure 6A), whereas the last overtopping event was registered at 2020-01-23 7:40 UTC (Figure 6B). This means almost 4 days of overtopping events in this section.
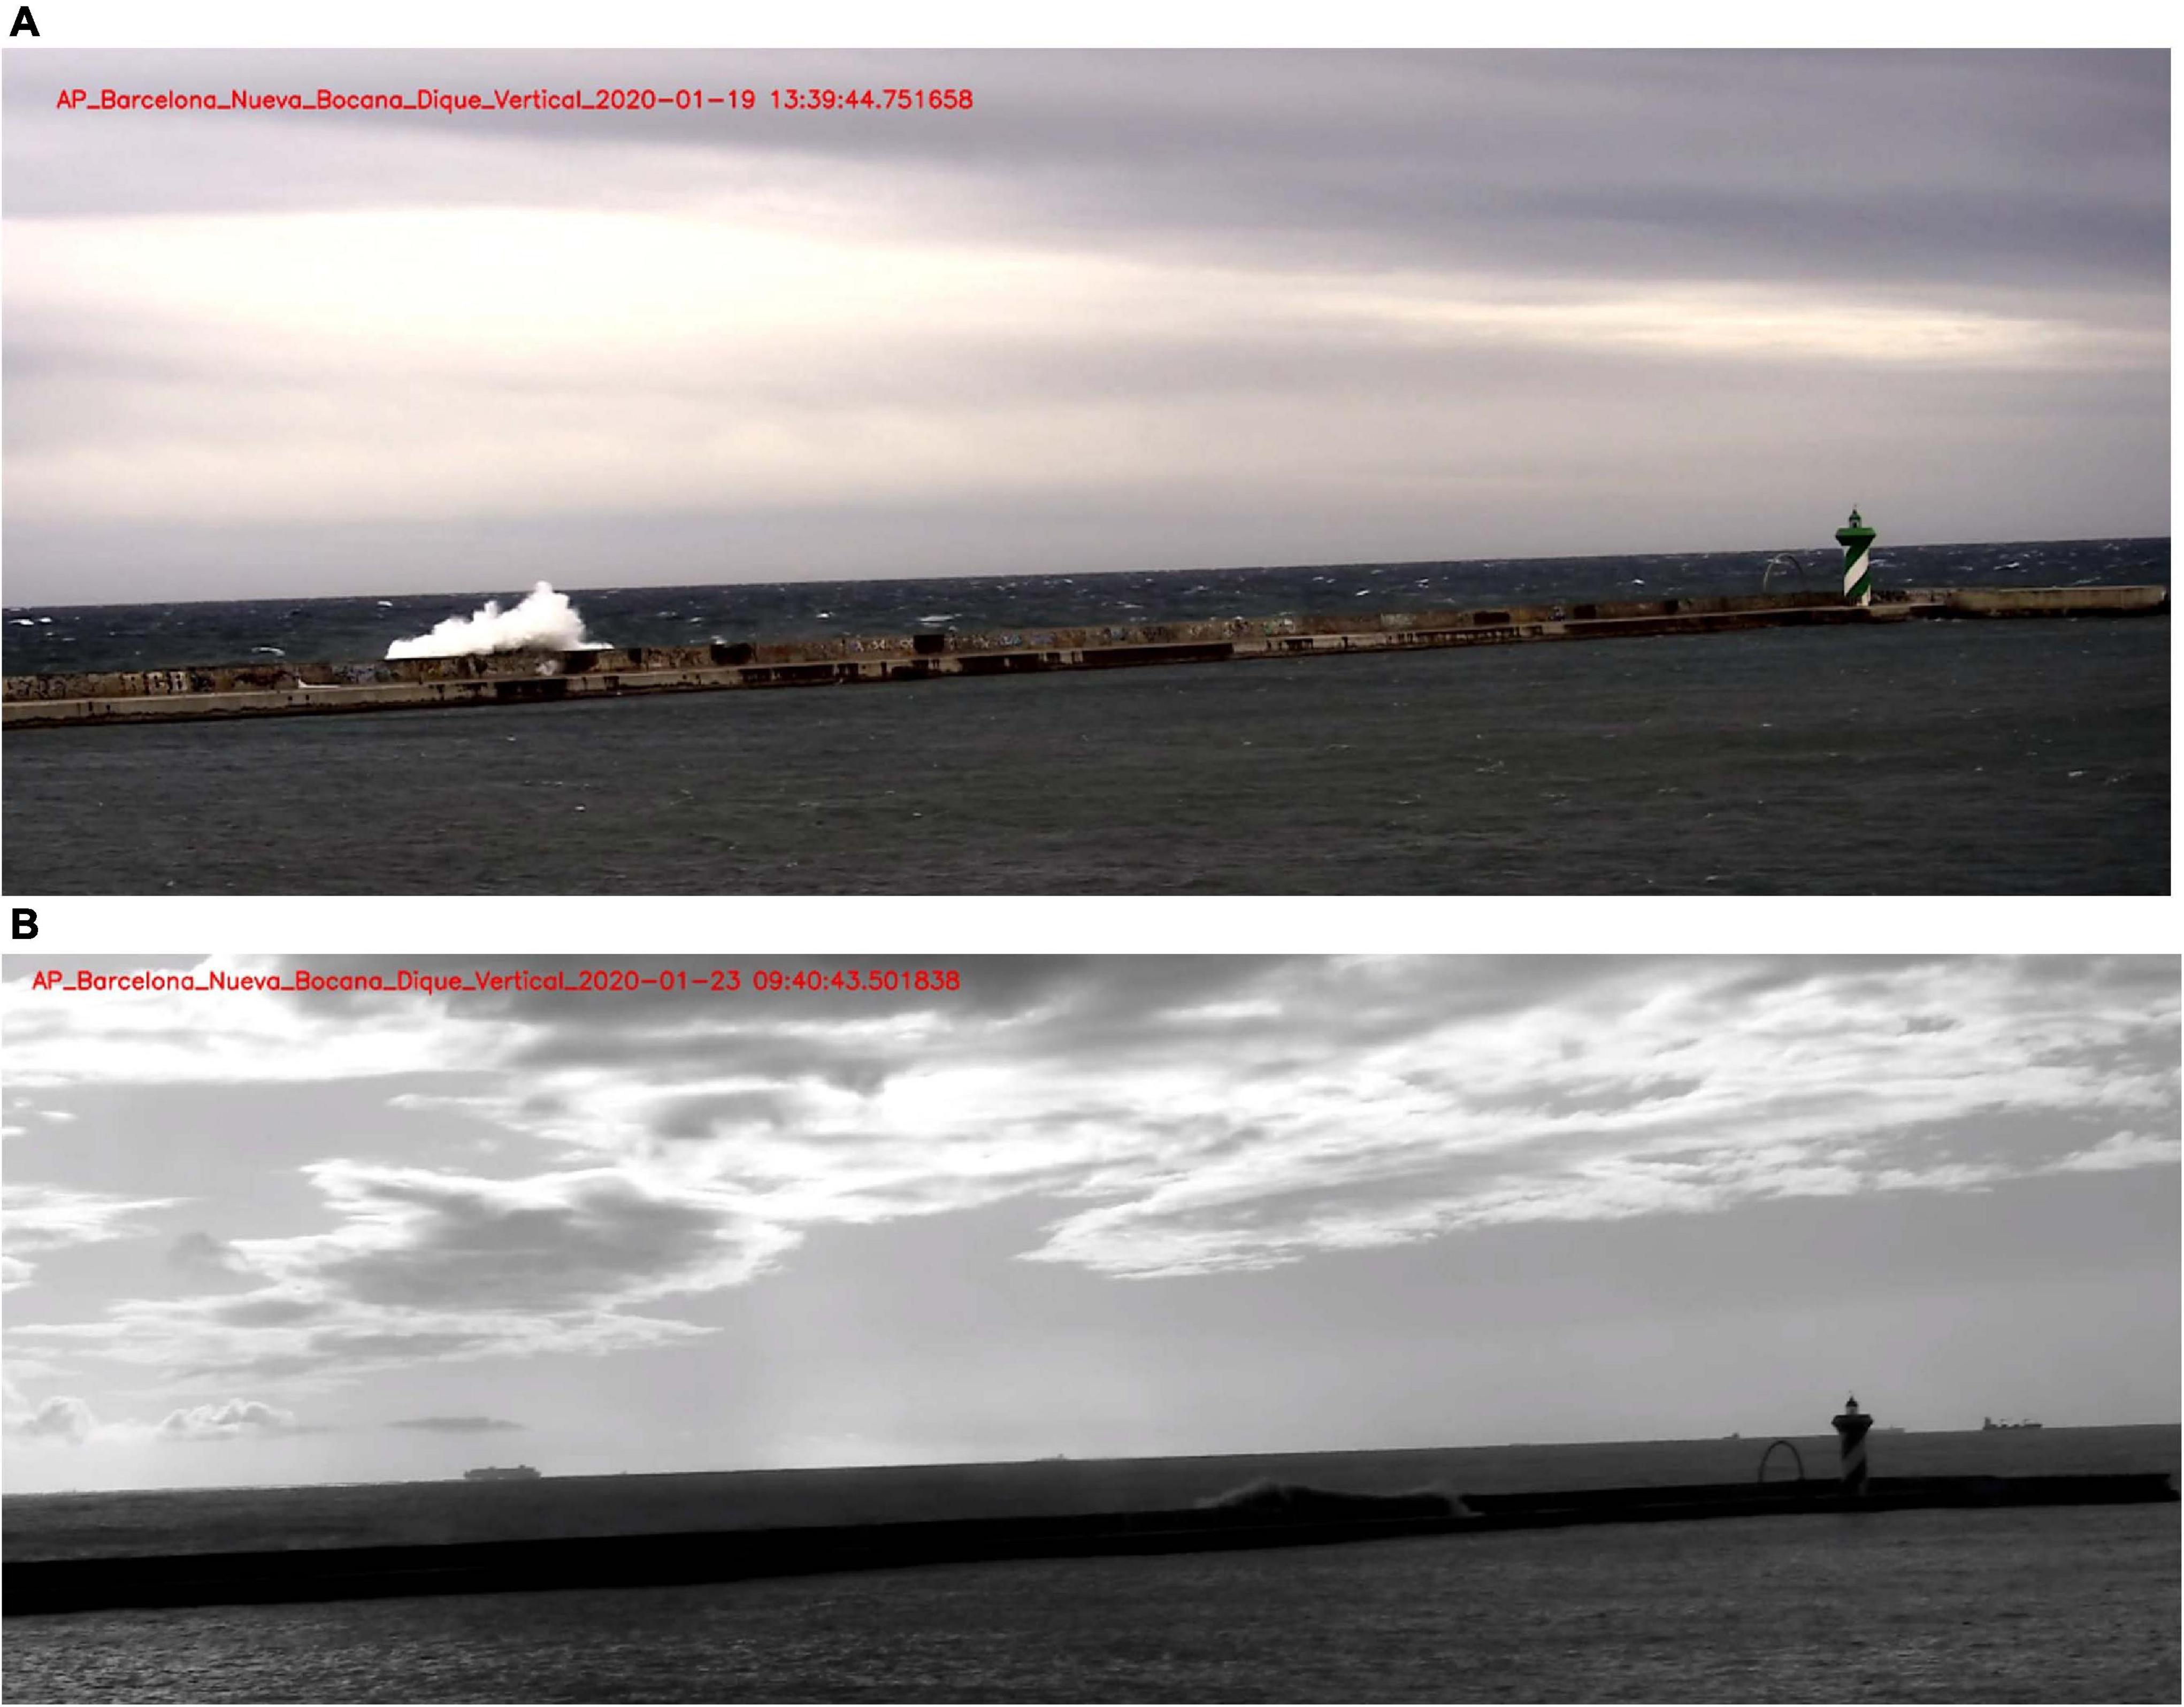
Figure 6. Image of camera-recorded overtopping. (A) around time of first overtopping (January 19th 2020) and (B) around time of last overtopping (January 23rd 2020).
The first overtopping alert, in Nova Bocana, was raised by PdE on 2020-01-16 12 h (72 h forecast), and the last overtopping alert was on 2020-01-23 00 h (12 h forecast). The overtopping was successfully predicted (Figure 7), with an error below 3 h of the first recorded event, within 72 h of anticipation. It is forecasted on January 16th, in the cycle starting at 12 h (Figures 7A,B). The end of the overtopping was also predicted 72 h in advance (Figures 7C,D), with an error below 2 h from the last recorded overtopping event.
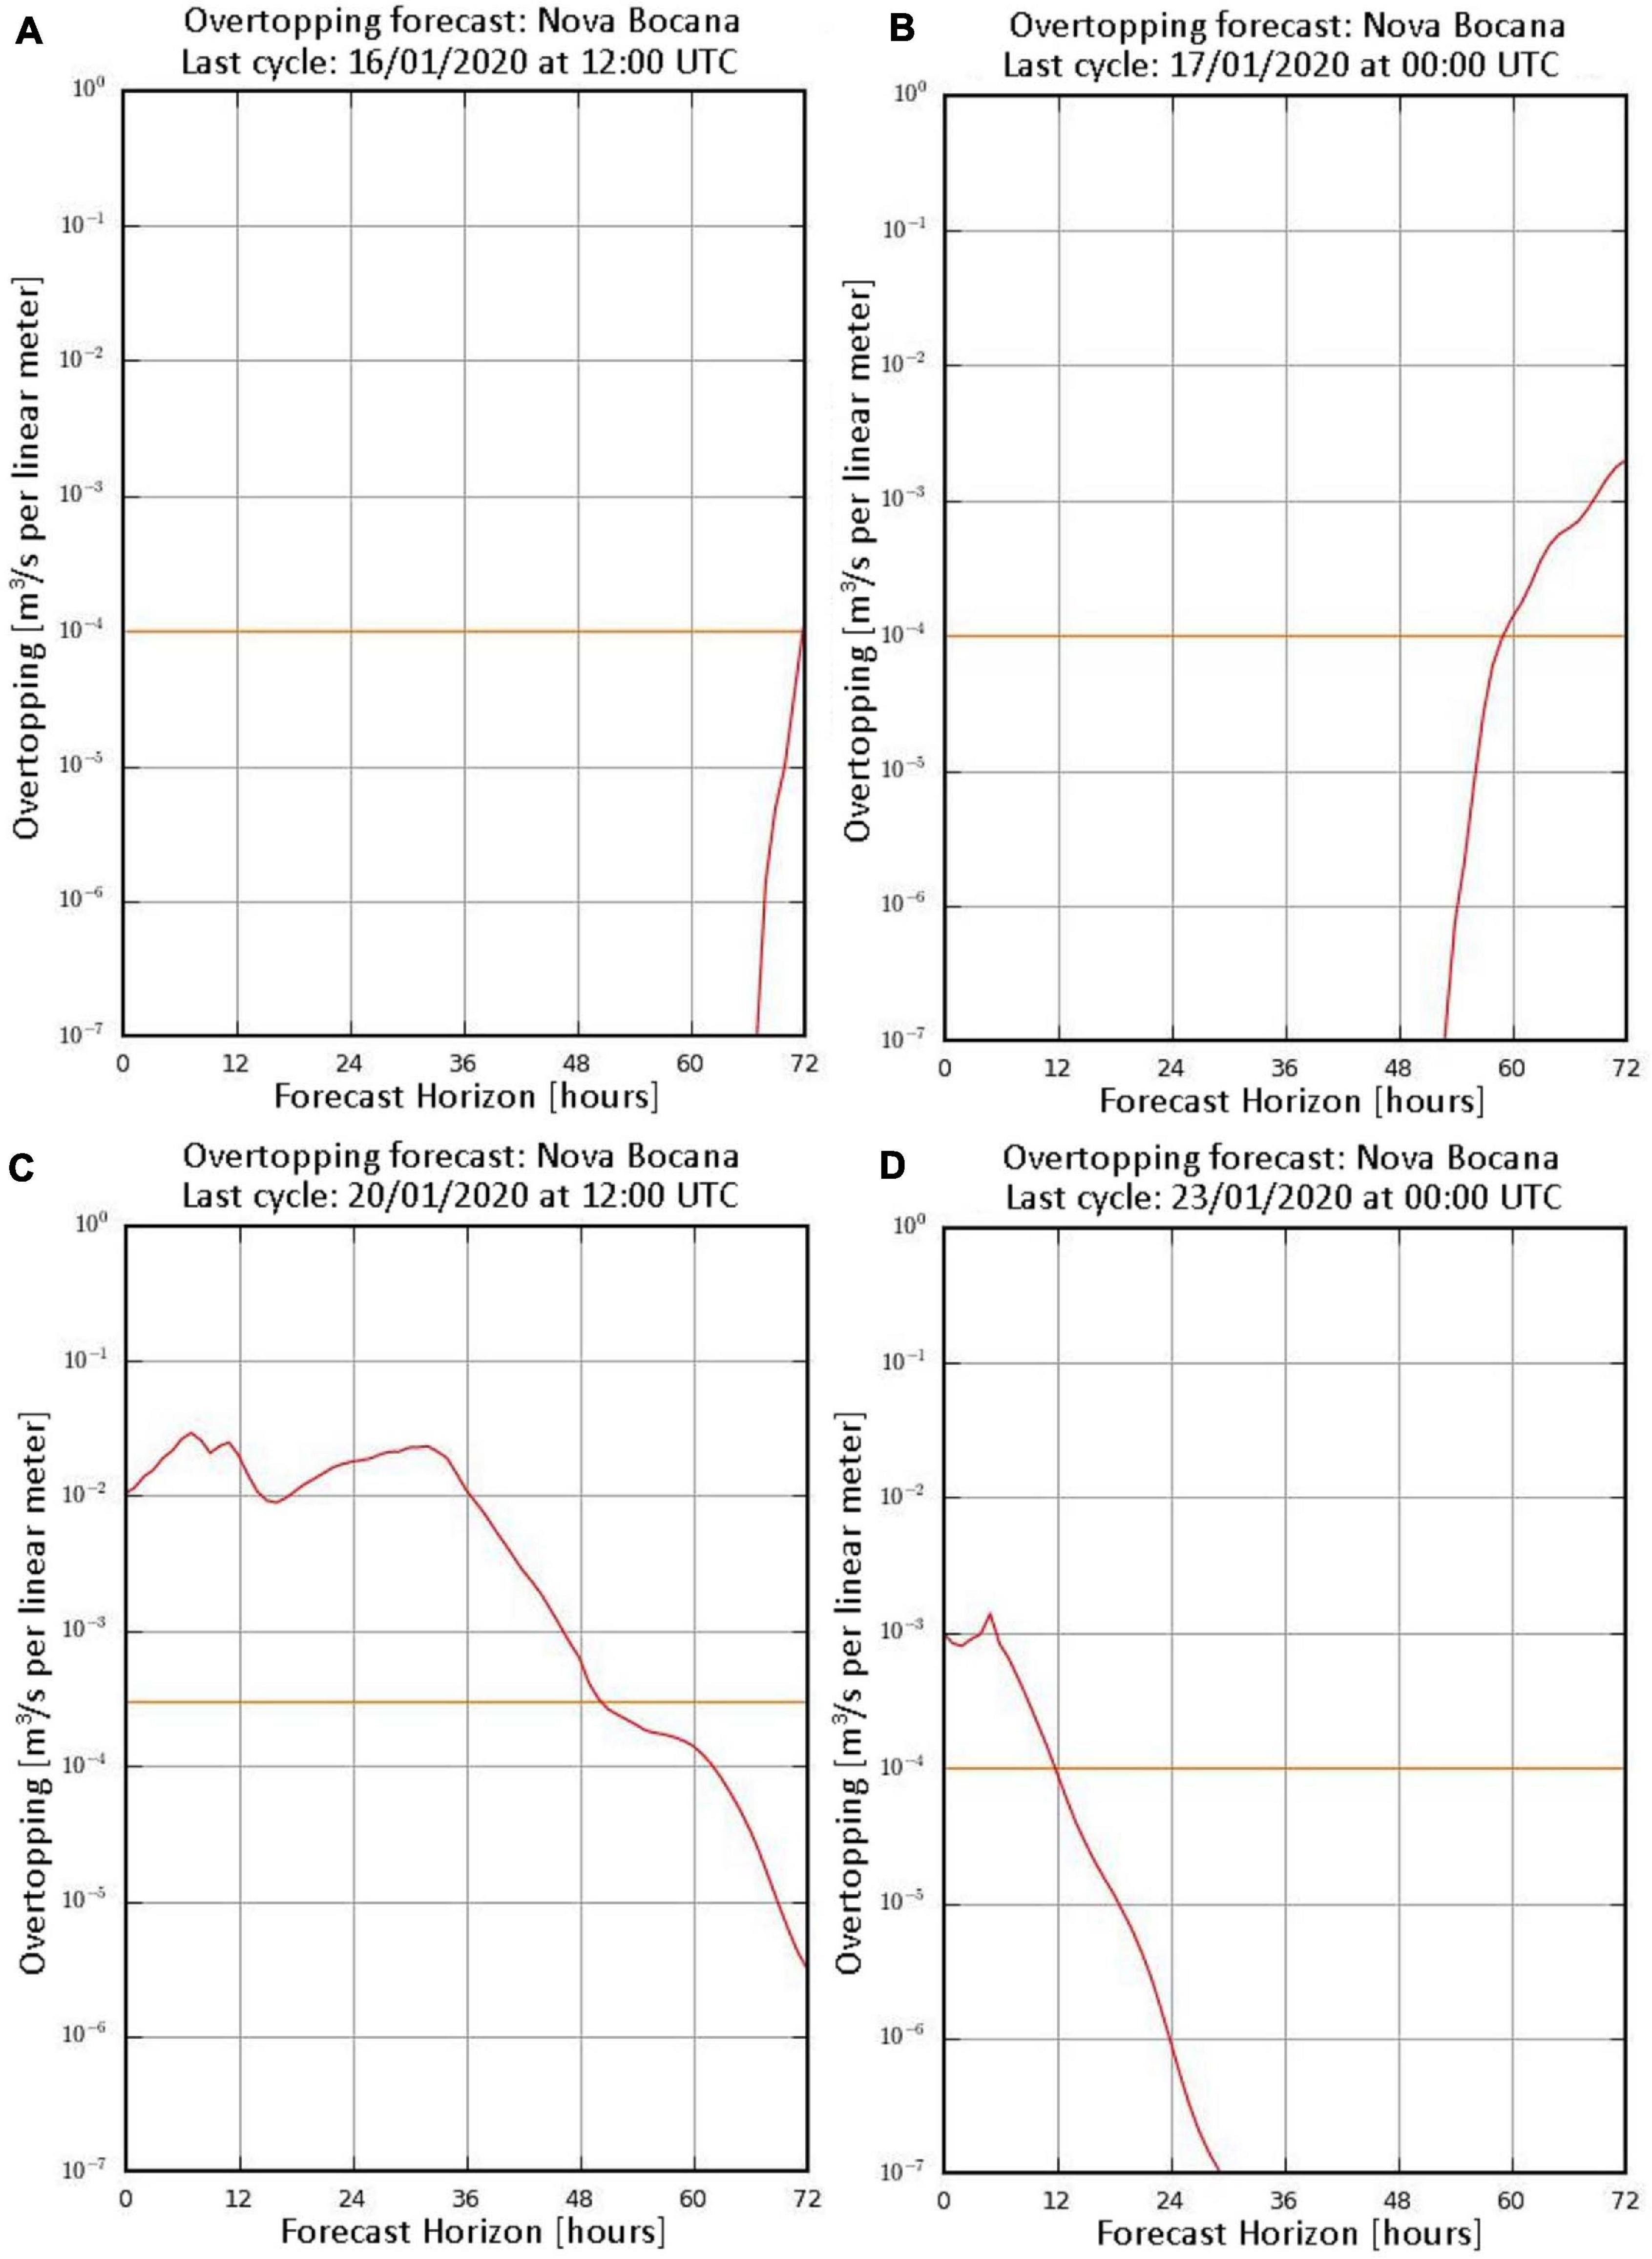
Figure 7. Forecast of overtopping at Jan/16/2020 12:00 (A), Jan/17/2020 00:00 (B), Jan/20/2020 12:00 (C), and Jan/23/2020 00:00 (D). Time is in UTC. The location is Nova Bocana, in the Port of Barcelona. The x-axis shows the forecast horizons in hours. The y-axis shows the overtopping in m3/s per linear meter of breakwater. The yellow line is the threshold to raise an alarm. The red line is the overtopping.
The hindcast time series (Figure 8) shows the unusual overtopping event, with a duration of 4 days and with a maximum predicted value of 34 liters per second per linear meter of breakwater.
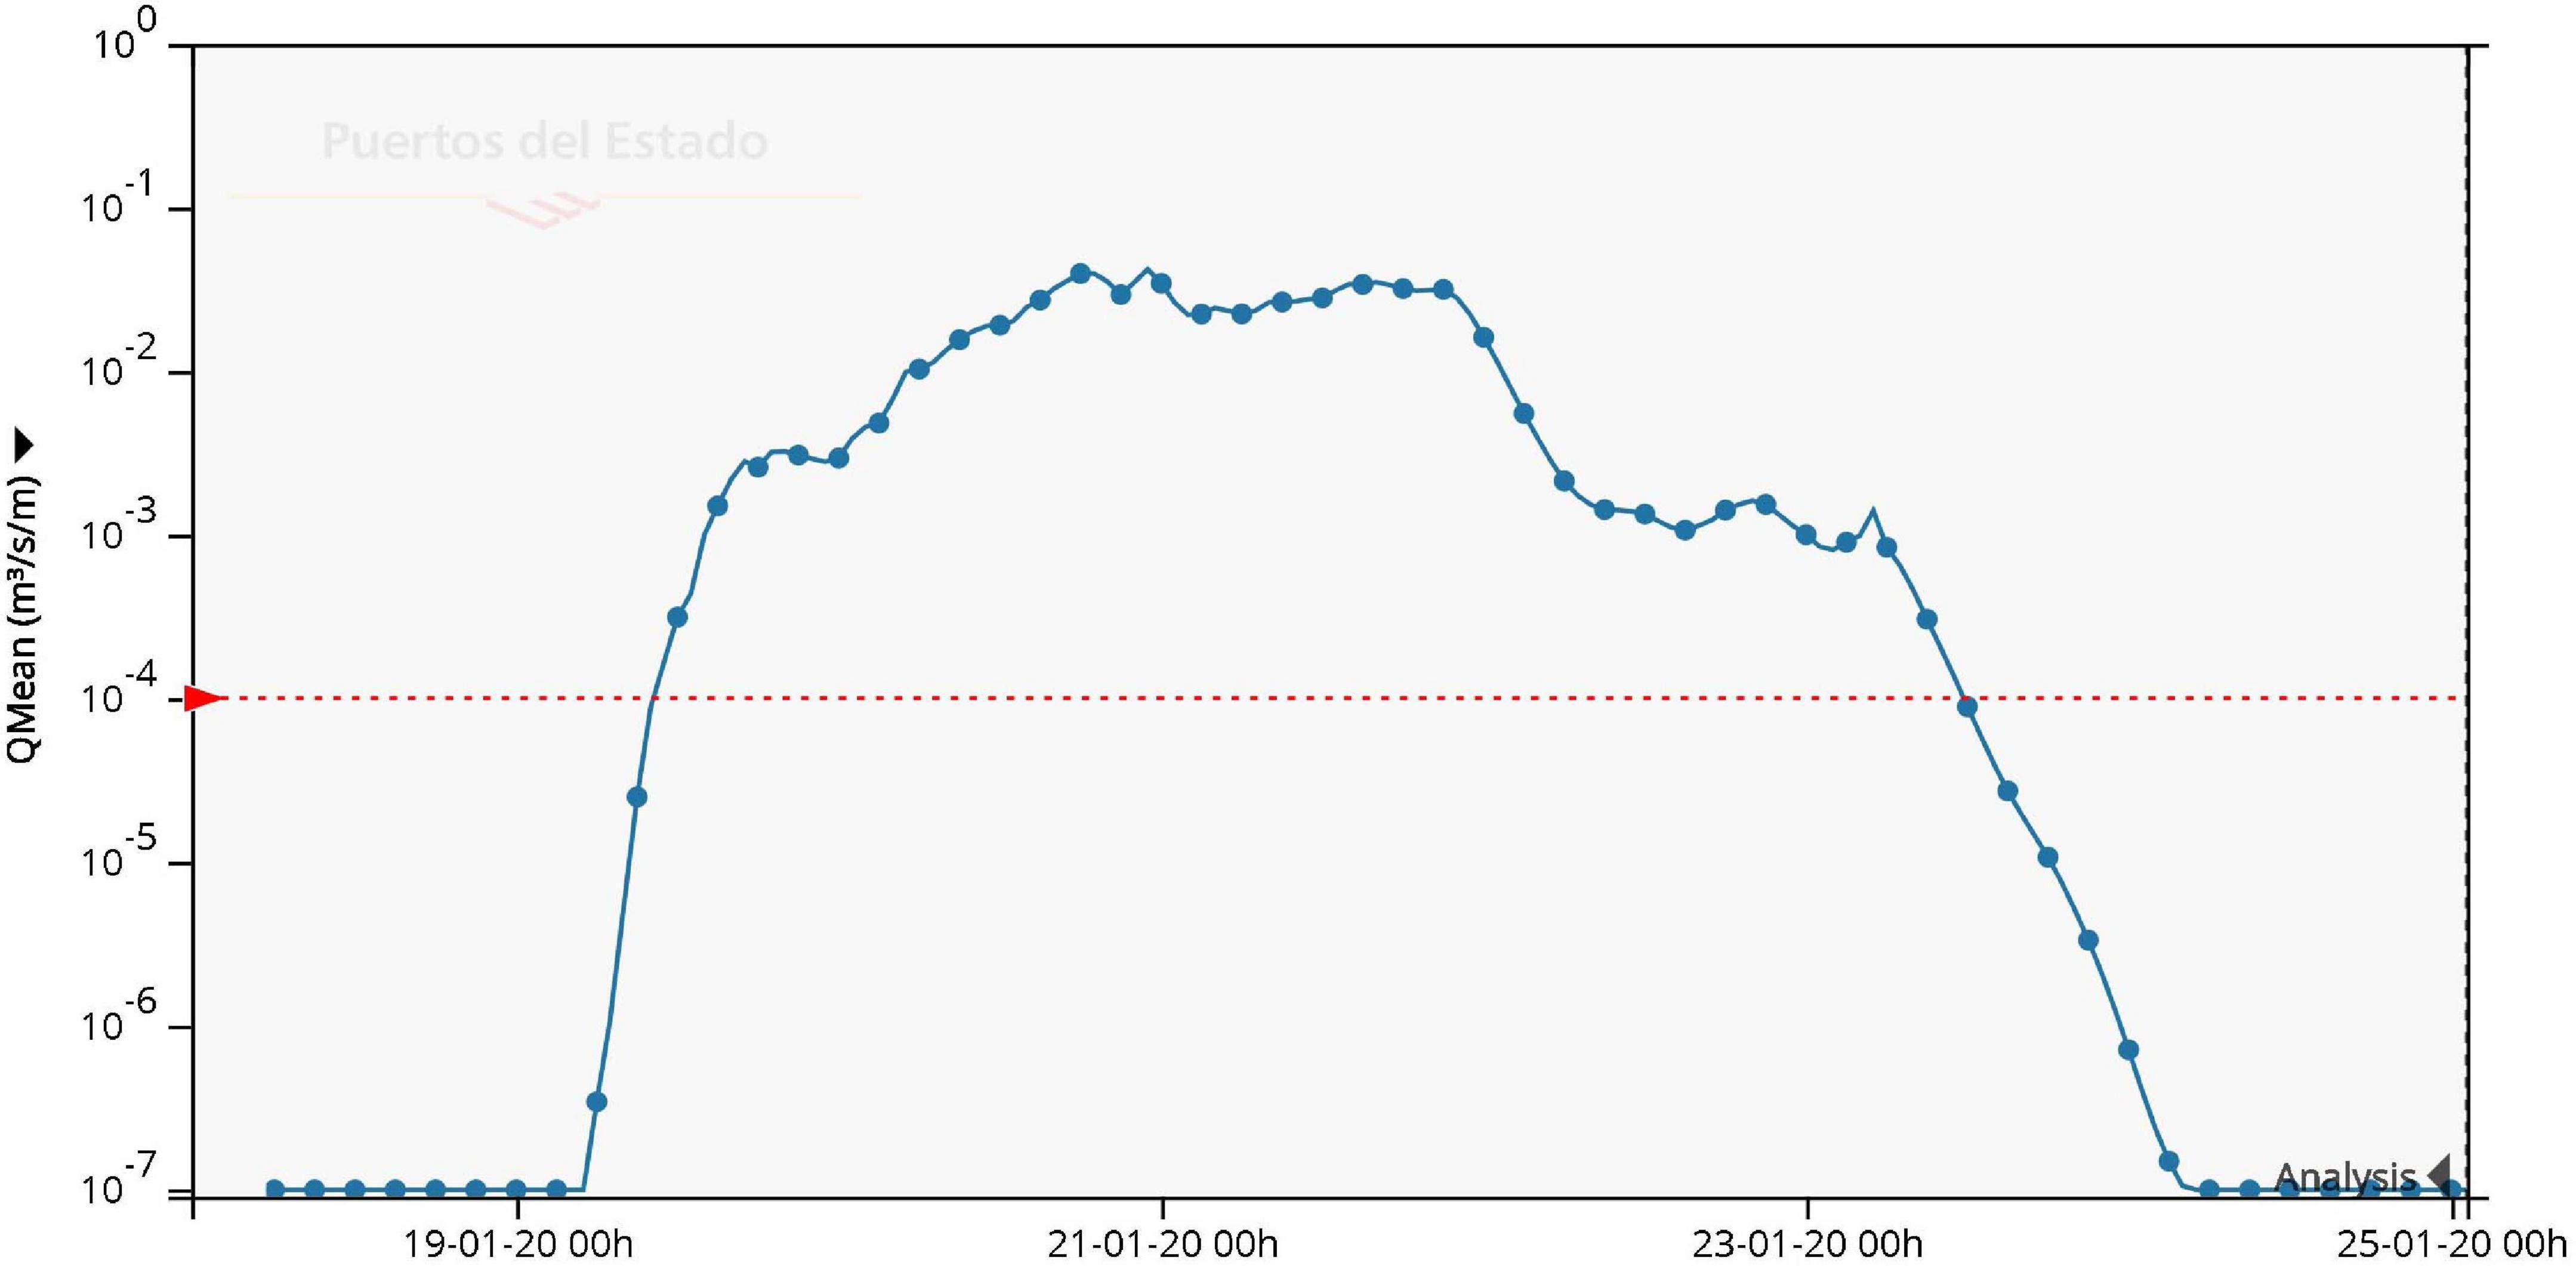
Figure 8. Time series of the hindcasted overtopping (41.36°N, 2.19°E). The x-axis shows the time in UTC. The format of the time is “day-month-year hour.” The y-axis shows the overtopping m3/s per linear meter of breakwater. The blue line is the overtopping, and the red dashed line is the threshold to raise an alarm.
Historical Performance of Several Reanalysis Models, and Relevance of Storm Gloria
The characteristics of every reanalysis are shown in Table 2. The mean skill scores are shown in Table 3. The CMEMS-IBI model is the least successful in the comparison. It bears a significant underestimation. At the same time, the CMEMS-MED model presents the best results in the skill scores. PORTUS-wana shows similar numbers – ERA5 and PORTUS-ERA5 present good results, with high correlation coefficients (0.93–0.94) and a slope under 0.85. They show a noticeable underestimation. Considering that PORTUS-wana has not a homogeneous forcing, CMEMS-MED does not cover storm Gloria, and the weak results obtained with CMEMS-IBI in the area, these reanalyses are not selected for this study.
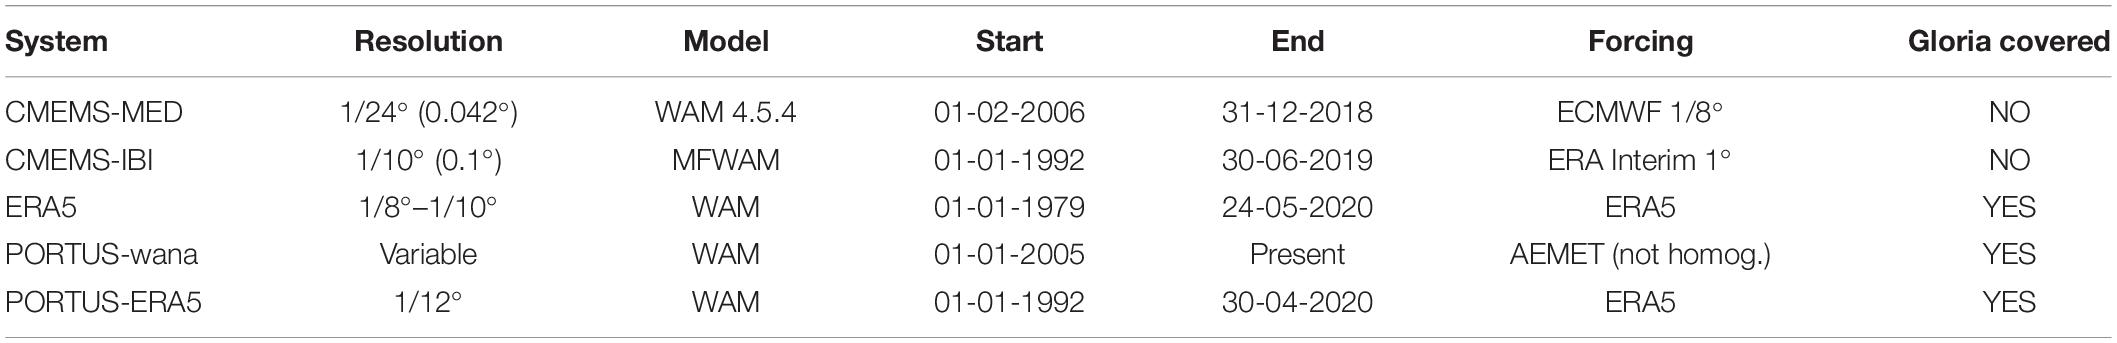
Table 2. Description of the wave reanalysis in the area.
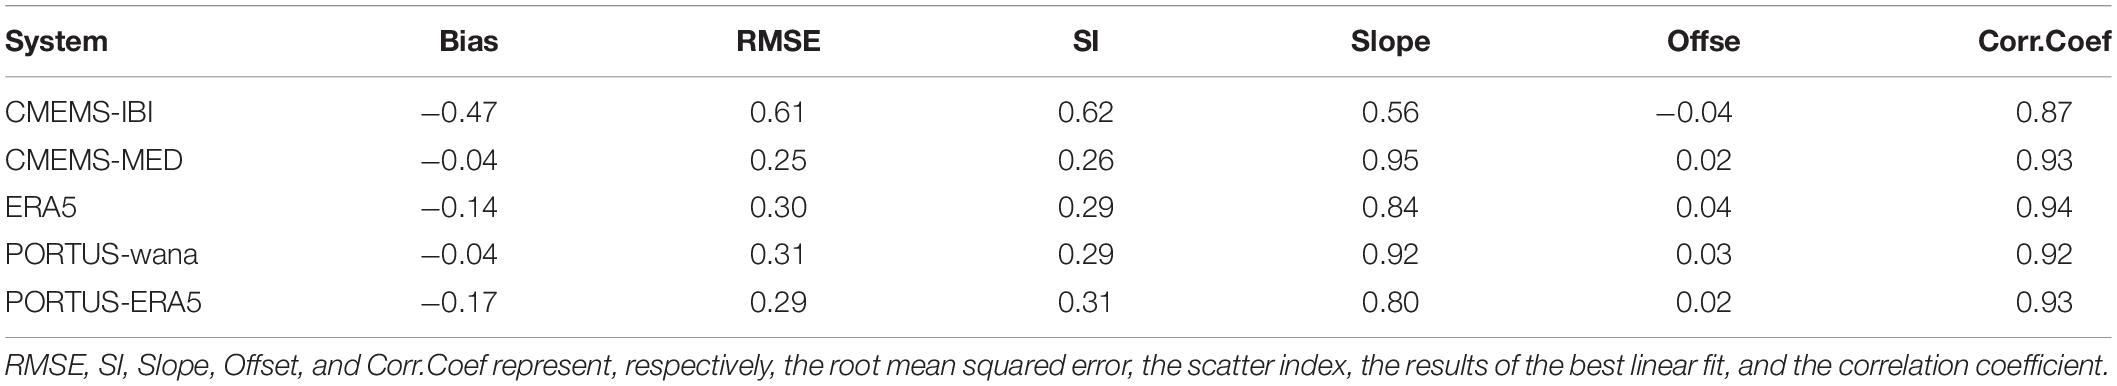
Table 3. Analysis of the system performance (mean values over the area, same period 2006–2018).
The ERA5, PORTUS-wana, and PORTUS-ERA5 reanalyses did cover storm Gloria (Table 2). Therefore, PORTUS-wana is a suitable model to describe and forecast Storm Gloria. Because PORTUS-ERA5 has a better resolution and a longer time series, it has been selected to be compared to the observations, in a historical context. This perspective has allowed us to verify the exceptional extreme wave conditions produced by Gloria, with several broken wave height and period records.
In the following figure (Figure 9), the time series of significant wave height (Hm0) are presented. These cover the period between January 1992 and April 2020. The model values from PORTUS-ERA5 reanalysis (blue line) cover the whole period, without gaps. The measurements from the buoys (red dots) are shown as well, to have a historical perspective.
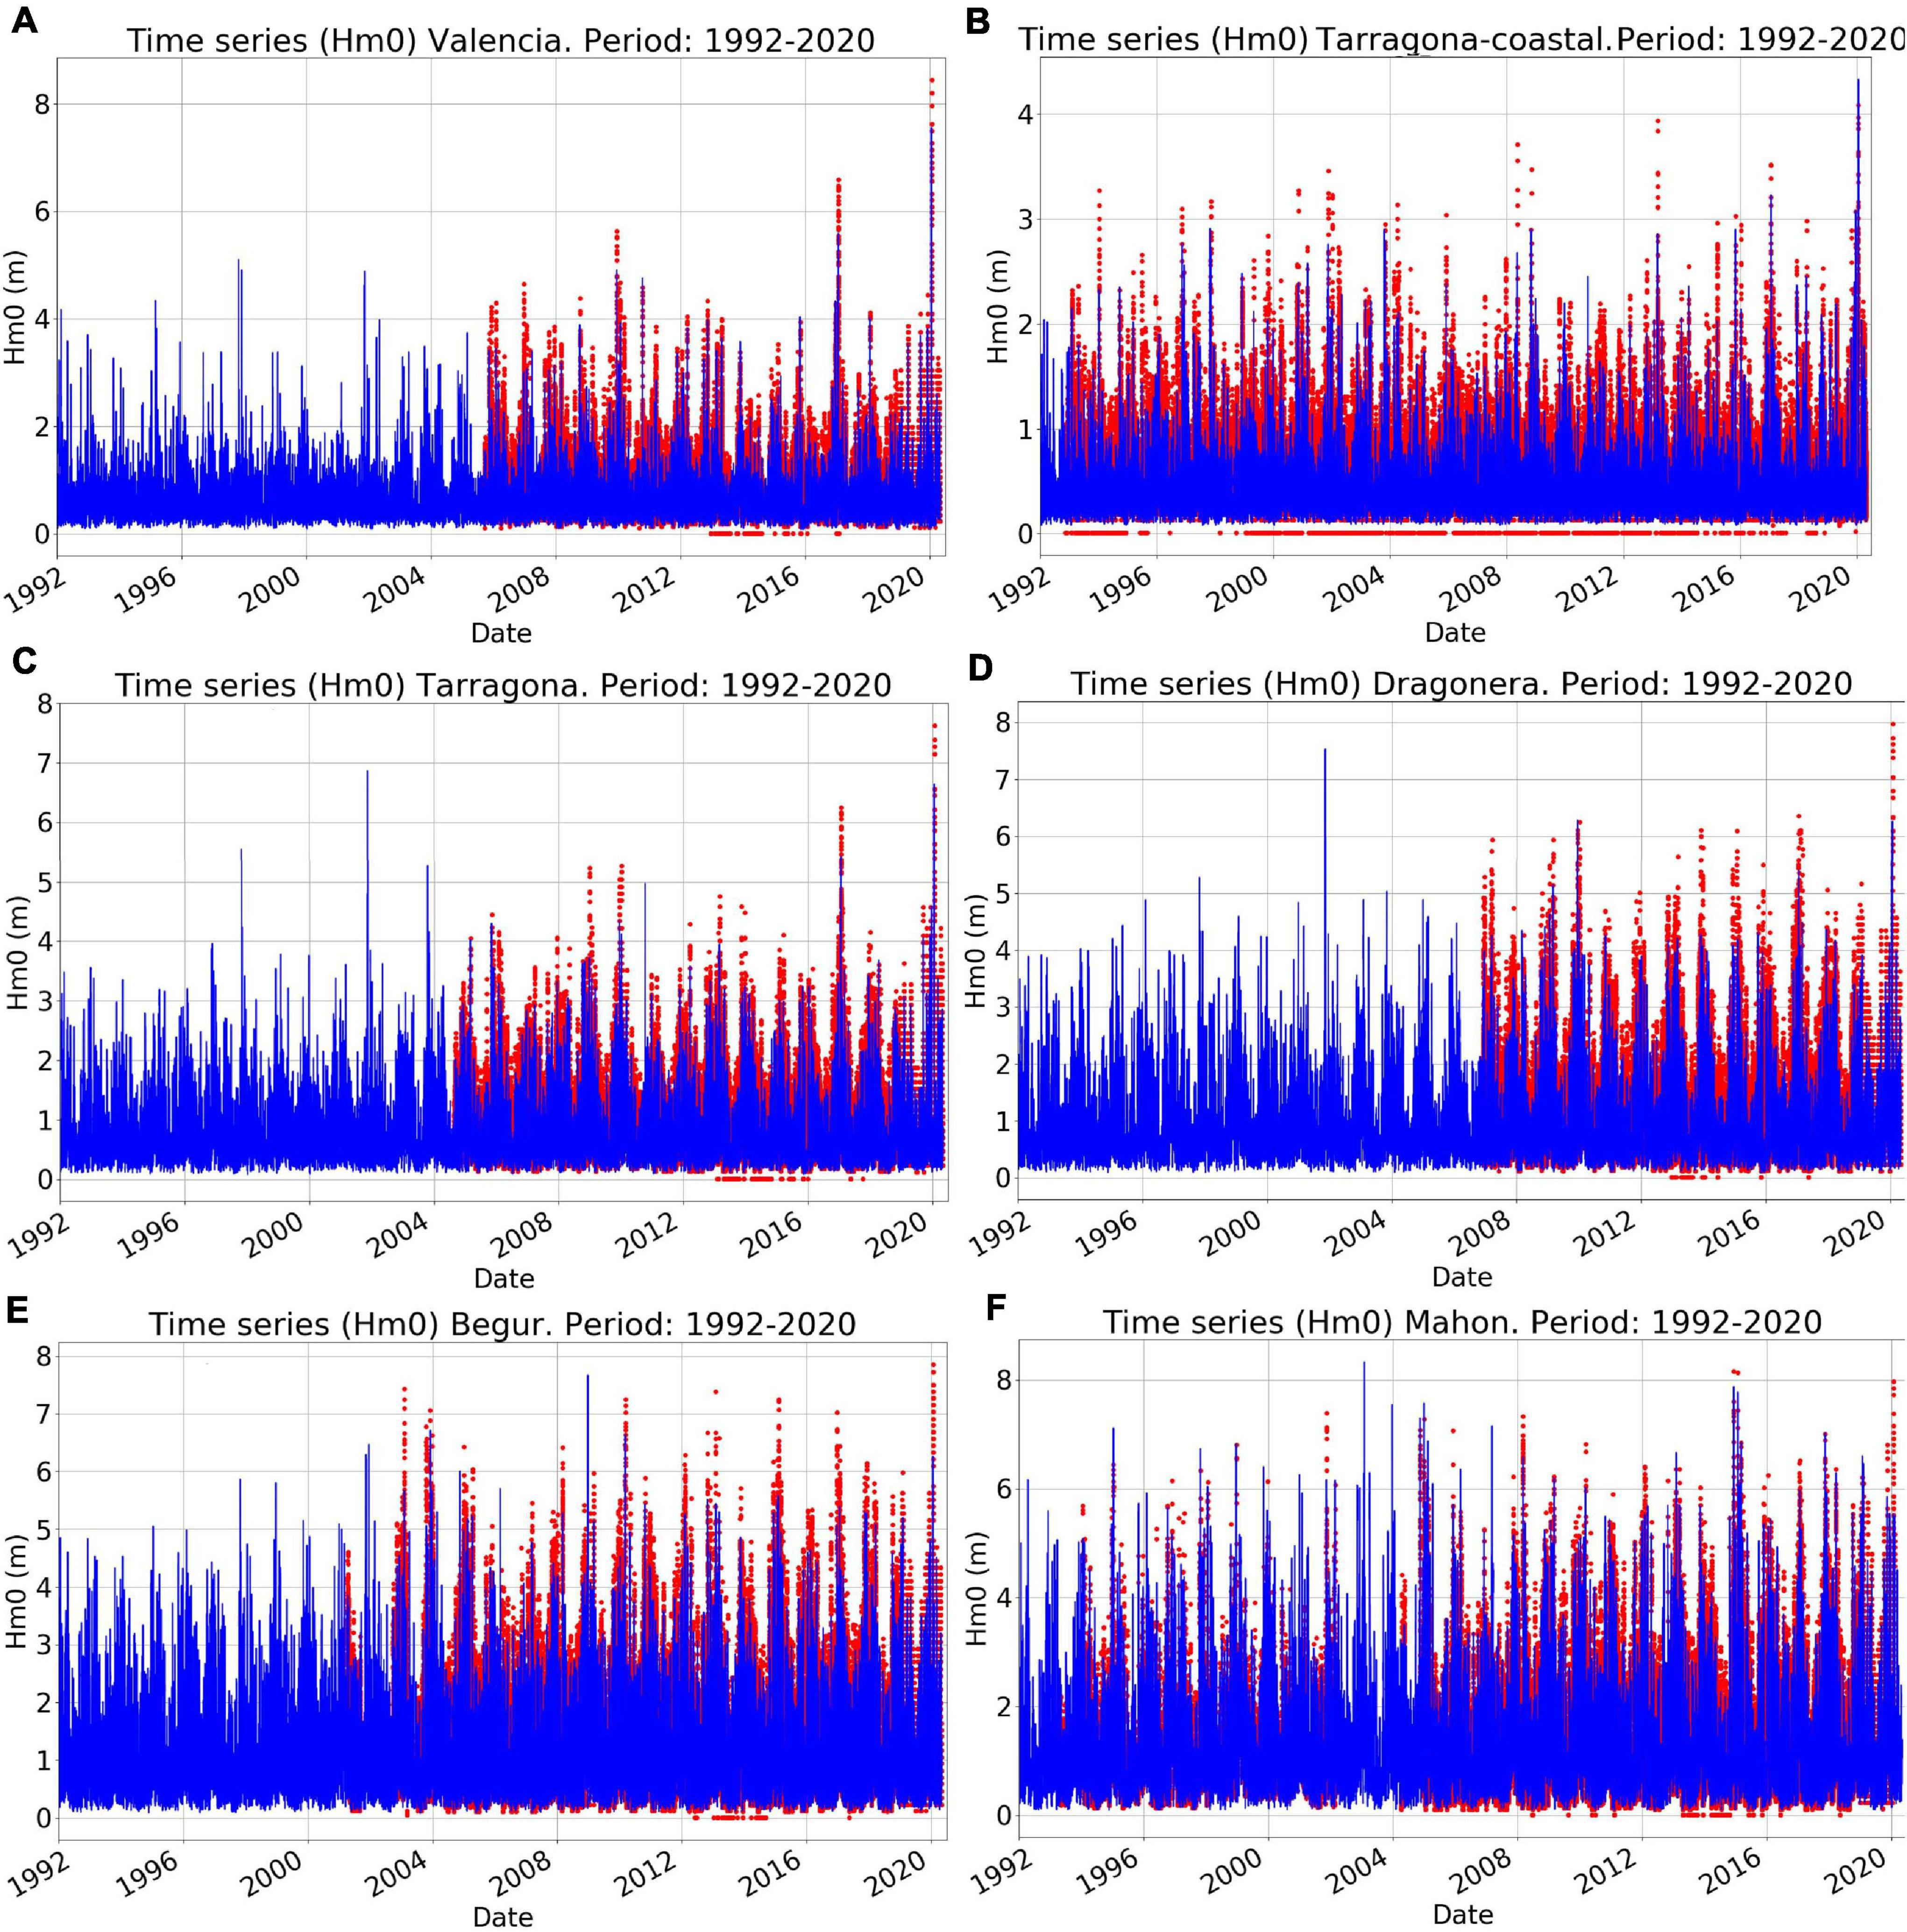
Figure 9. Significant wave height time series (1992–2020) for Valencia (A), Tarragona coastal (B), Tarragona (C), Dragonera (D), Begur (E), and Mahon (F). Buoy measurements are represented by red dots and model PORTUS-ERA5, by a blue line.
In two of the positions, Valencia (Figure 9A) and Tarragona coastal (Figure 9B), it is clear that the values during Gloria, obtained by both the buoy and the model, are the highest during the whole series. The other locations present some previous strong wave storms, of extreme wave heights, through the PORTUS-ERA5 reanalysis model.
Analysis of Extreme Wave Heights
As commented above, during storm Gloria, the maximum significant wave height (Hm0,max) exceeded historical records (Table 1). The whole record without storm Gloria is fit to a probability distribution function of extremes. The same record, including storm Gloria, is fit to another function. It is revealed that the second, new probability distribution function has differed from the first one, in a way that the return periods for the same values have decreased. For instance, in Valencia, the Hm0,max of 8.44 m was associated with a return period of 707.7 years; it has been lowered to 37.2 years. Similarly, in Dragonera, the Hm0,max of 7.97 m (544.4 years) has been associated with a new return period, of 40.3 years, whereas in Tarragona, a Hm0,max of 7.62 m (414.7 years) has been associated with a new return period, of 48.7 years.
Discussion and Conclusion
Infrastructures in the Mediterranean coast, such as seafront promenades or coastal defenses in Valencia, must be designed to endure a substantial number of extreme events. However, a cutting point must be given, as for the return period of such events. Extremely rare individuals might not be encountered in even several times the lifetime of the infrastructure, while the cost of construction would be prohibitive. The same knowledge can help to ease the management of the rice fields or the natural habitats in the Ebro Delta. Up to now, new constructions have depended on knowledge about the historical records of Hm0, but storm Gloria has beaten those records.
Detailed Description of Storm Gloria
The synoptic conditions in this study coincide with Lopez-Bustins and Martin-Vide (2020). According to them, Gloria was short-lived. It did not have a great depression. Actually, the atmospheric pressure at sea level in Catalonia, one of the most affected areas, was greater than 1,020 hPa. The through became a cold drop, a high impact rainfall event occurring in the fall, along the Spanish Mediterranean coast (Martín León, 2003). The potent anticyclone over the British Isles reached 1,050 hPa at its center, on January 19th. It was a record in 300 years in the British region (Martin-Vide, 2020).
Due to the strong winds, the Hm0 reached historical highs, all over the Spanish Mediterranean coast (Table 1). However, there were some slight regional differences. The moorings in Tarragona coastal and Mahon predate the other buoys, by about a decade, which should have explained their larger record Hm0, in history. However, the previous records actually happened in 2013 (Tarragona coastal) and 2014 (Mahon), when the other buoys were also operating. That is, there could have been record breaking Hm0 at these other sites, but there were none. Therefore, the fact that records were barely surpassed or missed in these two sites, during Gloria, could be a matter of chance. Here is when a wave reanalysis model can help fill in these gaps of knowledge.
CMEMS-MED, ERA5, PORTUS-wana, and PORTUS-ERA5 (Tables 2, 3) performed better than CMEMS-IBI, due to a greater resolution in the wind fields. This is crucial in the Western Mediterranean, where wind conditions are strongly influenced by the rough orography. There is a need for a flexible grid size to adapt to abruptly changing orography. In a historical context, the chosen model, the PORTUS-ERA5 reanalysis model, produces peak Hm0 at the same moment as occurs in the observations, most of the time, like in Valencia or Tarragona coastal buoy. Therefore, it can provide some insight into historical high Hm0.
In Tarragona (Figure 9C) and Dragonera (Figure 9D), the buoys recorded historical wave heights during Gloria, but the PORTUS-ERA5 reanalysis model shows a greater value during a storm in November 2001. It was produced by a strong cyclogenesis (Arreola et al., 2003). For these two locations, the fact that the wave height record was beaten during Storm Gloria might be only due to the shortness of the time series.
At the Begur buoy (Figure 9E), the greatest Hm0 of the model series (7.1 m) occurred in December 2008. However, the buoy was not measuring by then. Although the highest value of the buoy series was recorded during Gloria, it is possible that had the buoy been active during December 2008, the observations would have been greater than the value during Storm Gloria. Sánchez-Arcilla et al. (2014) described similar pressure centers than Storm Gloria, for December of 2008, with its consequent similar strong easterly winds. The XIOM Catalan regional network measured a Hm0 equal to 5 m at Blanes (40 km south of Begur). The wave height in Begur is usually higher than in the region comprising Blanes (Lin-Ye et al., 2016). It is possible that Hm0 at Begur was about 8 m. The wave direction was mostly easterly. In the case of Mahon, the buoy record, measured in December 2014, has not been surpassed, and the model shows several values greater than the obtained during Gloria (Figure 9F).
Therefore, Storm Gloria had some powerful predecessors. Nevertheless, by examining both the buoy and the reanalyzed time series, it can be concluded that storm Gloria produced one of the most severe wave storms in the last three decades, in the Balearic Sea. Gloria was especially severe in the area of the Gulf of Valencia.
The associated mean wave period (Tm02), recorded at the peak of the storm, shows extraordinarily high values. It was over 9 s, in four of the six locations. In Tarragona and Tarragona coastal buoys, the maximum value for Tm02 arrived some hours after the storm peak, reaching 9.1 and 8.7 s, respectively. These values have set new records, also, in the Tm02 for Valencia, Tarragona, Tarragona coastal, and Begur buoys. This makes sense in the Western Mediterranean, where the Hm0, Tp, and duration present a significant dependence (Lin-Ye et al., 2016).
It is necessary to be aware of the uncertainty in the estimation of Hm0 and Tm02. It is due to the statistical variability. Several studies had been centered on this issue (Goda, 1977, 1988, 2010). Despite the oftentimes complication in quantifying this uncertainty, it is estimated to be around 5%. These data have been processed on board, by the buoys themselves, and have been transmitted in real time. In every session of maintenance, the raw data (high-frequency time series) are recovered and are further reprocessed through an exhaustive quality control, at PdE. This might cause the definitive historical data in the PORTUS database (PdE) to vary from the real-time data.
The extremely high Hm0 had additionally beaten the record for duration. The wave Hm0 above 5 m lasted 39 h when the usual duration of such high waves is of about 12 h. This helped Storm Gloria to be more destructive, for instance, than the event in January 2017. There were severe damages to harbors and seaside constructions. These were already damaged during the storm that passed some months earlier, called Dora (Pérez-Gómez et al., unpublished). Furthermore, the storm duration for Gloria was clearly out of range, in the rubble-mound breakwater design formulas. For instance, the widely used formula of Van der Meer (1995), and CIRIA et al. (2007) implies less than 7,500 waves per storm. In the case of Gloria, if it is assumed a significant wave height of 5 m for 50 h, and a mean wave period of 8 s, then the number of waves is (50 h/8 s)∗3,600 s = 22,500 waves. Therefore, the number of waves during Storm Gloria was clearly out of the range of the current design formulations. Hence, there had been severe damage to rubble-mound breakwaters. One example of many, to verify this point, is the dique de Levante and l’Escullera promenade, at the Tarragona harbor (Diario del Canal, 2020).
The double-peaked (bimodal) wave spectra are typical of the Catalan coast. These are often observed under strong northwestern winds, in combination with offshore easterly or southerly winds (Sánchez-Arcilla et al., 2008). Such northerly winds were not present, during Storm Gloria, but these are common. In the presence of these winds, river valleys would be particularly affected by this kind of waves. In the Ebro Delta, bimodal spectra can occur more than 50% of the time. Such form of waves complicates, for instance, the prediction of sediment transport and morphodynamic evolution.
The wave heights might have had been affected by concomitant currents. For instance, in the Ebro Delta, there might have been an interaction between high incoming waves, intense Ebro river outflow currents (reinforced by rain), and the wind-forced flow to the south-west, over the inner continental shelf (Lorente et al., 2021). High-frequency radars can help detect this interaction, as well as to complement the buoys in the monitoring of extreme coastal hazards in near real time.
The surface current velocity itself also broke records. The current simulated by CMEMS-MED shifts to a more easterly storm surge, so it impacted frontally on the Catalan coast (exceeding 1.2 ms–1) (Sotillo et al., 2021). Thus, waves can directly contribute to extreme surge levels (Charnock, 1955; Melet et al., 2018). During Gloria, the extreme wave height was the main cause of damage, but the storm surge, worsened by the extreme waves, could have added to it (Pérez-Gómez et al., unpublished). The moments of maximum wave height (storm peak) do not need to coincide with the moment of maximum surge height (surge peak). It did not happen, at least, during Storm Gloria.
The record duration led to heavy overtopping (Figure 6). A hindcast of the overtopping (Figure 8) shows its exceptionally great volume. It added up to the heavy precipitation and the increase in surge. The surge was actually not as high in Barcelona and Valencia as during November 2001. Had the surge been extreme, the overtopping would be even worse. However, total sea level has risen since 2001, so the damage had been more severe, in 2020, than in 2001. Other consequences of high waves are the run-ups, which add up to destruction. It was highest for higher waves and steeper slopes, so it affected Northern Spanish Mediterranean coasts, rather than the Southern ones. An extensive analysis of the impact of Storm Gloria can be found in Centro de Estudios y Experimentación de Obras Públicas [CEDEX] (2020).
Waves, as high-frequency sea water surface oscillations, can affect the performance of tidal gauges (Lin-Ye et al., 2020). Much energy is concentrated in the higher-frequency water levels, which are currently not fully captured by existing sensors. The reason is the methodology to compute the 1-min products for total sea level. A future implementation of medians, to produce such products, will reduce this drawback.
In addition to the waves, the rain also caused a drastic, record-breaking, drop in sea surface temperature and salinity. This was measured in Tarragona coastal buoy (Sotillo et al., 2021). A dramatic gradient in sea temperature and salinity can cause damage, for instance, to local biota, which are vulnerable to such parameters (Fernández-Torquemada and Sánchez-Lizaso, 2011).
Validation of the Forecast Model and Redesign of the Return Period
The reanalysis and the observations showed how the forecast did predict satisfactorily the peak of the wave height. It happened on January 20th, at different stations in the Gulf of Valencia. The longer duration of extreme wave heights in Tarragona and Begur, which were correctly forecasted, are consistent with current knowledge on wave storms in Catalonia (Lin-Ye et al., 2016). There was a steep growth of the significant wave height in Dragonera and Valencia (Figures 4A,B, respectively). Then, the Hm0 decreased more gradually than it increased. The growth for Tarragona and Begur (Figures 4C,D) was more sustained, increasing at a similar rate than it decreased. These types of evolution of the Hm0 are typical of this region.
Some reasons for the difference of waves between (reanalysis and forecast) model and observations were the following. HARMONIE-AROME overestimated the winds during Storm Gloria. Such severe wind overestimation led to a moderate wave overestimation. From an operational point of view, such wind overestimation is preferable than underestimation, because wave models tend to underestimate due to two main reasons: (i) wind-wave growth parameterization and (ii) numerical diffusion in the propagation scheme. Additionally, HARMONIE-AROME assimilates wind observations from land stations, but it lacks observations over the ocean. Accordingly, if they assimilated data from the ocean in situ stations, wind fields may be more consistent along the coastal fringe.
Extreme waves may influence ocean surface roughness and the drag coefficient (Wu et al., 2017). The present version of PORTUS-wana considers an exchange of energy from wind momentum to ocean waves, but there is no feedback to the atmospheric model. When addressing atmosphere-wave model coupling, the roughness coefficient is more consistent. For instance, Lársen et al. (2017) coupled the atmospheric model WRF and SWAN with a momentum roughness length parameterization (Fan et al., 2012). This formulation tends to lower drag coefficients, under wind speeds up to 20 m/s, than other formulations, such as Beljaars (1995). More recently, Wiese et al. (2020) analyzed the internal variability of a coupled atmosphere and wave system for the North and Baltic Sea (GCOAST). They showed that coupling reduced the internal variability on both models, plus having a better agreement with in situ and satellite data.
In addition, a cause of possible under/overestimation of wave heights might be the local currents that may reduce/enhance the waves, depending on the relative direction of the two. Similar directions of the currents can reduce the resulting wave heights, whereas opposite directions can enhance them. The direction of the wind-induced currents, during Storm Gloria, was similar to the mean wave direction (Sotillo et al., 2021). On the contrary, the Ebro River outflow currents had an opposite direction to the waves (Lorente et al., 2021). Hence, a suitable option for modifying the overprediction of the wave heights may be to couple a circulation model with PORTUS-wana.
The wave direction provided by the model coincided significantly to the measured one. The predominance of eastern waves is well reproduced by the PORTUS-wana reanalysis model. Interestingly, it was mentioned in Lorente et al. (2021) that the wave directions led to easterly currents.
The performance of the forecast model (Figure 5), for a forecast horizon equal to 60 or 72 h, had been better than the performance for a forecast horizon equal to 48 h, because, up to 48 h, the model uses AEMET’s HARMONIE-AROME wind forcing with a resolution of 2.5 km. At 60 and 72 h, the forcing used is the wind from ECMWF’s HRES model, with a resolution of 10 km. The ECMWF forcing, which has a greater range, is slightly more precise than AEMET’s forcing, at the boundaries.
The scatter index of the prediction of wind during Gloria is 10–15% lower (model is less precise) than the prediction of the wind during the 2018–2020 series (Figure 5A). The scatter index of the prediction of waves during Gloria is about 5–10% lower than the prediction of the wave during the 2018–2020 series (Figure 5B). This reflects on the overestimation of winds and the consequent waves, during the event. ECMWF’s HRES model is also better at providing the wind forcing than AEMET’s HARMONIE model, at least for prediction horizons above 48 h. This improvement of ECMWF’s HRES over AEMET’s HARMONIE is diluted in the prediction of the waves.
The skill score, which is based on the mean square deviation, shows a significantly worse prediction during Gloria than during the 2018–2020 series. The skill score for wind can be 1.5 points lower (model is less precise) than during the reference time (Figure 5C). The skill score for waves can be 7 points lower than during the reference time (Figure 5D). The Hanna–Heinold indicator is a corrected mean square deviation. Here, it does not vary, either for wind (Figure 5E) or for wave (Figure 5F). Therefore, Figure 5 shows that the model predicts wind and wave with a similar precision than for the 2018–2020 series.
It has been demonstrated that some Hm0 that seemed extreme and rare are actually more average than expected (Table 4). The return periods of Hm0 in the area should be updated, according to what happened during Gloria. Some Hm0 that had an average return period of several centuries, in Valencia, Tarragona, and Dragonera, are in fact expected in an average of half a century. The return periods are prone to be updated by extreme events in an increasingly long time series of observations. The convergence of the function of probability distribution is yet to be achieved. However, Storm Gloria presents wave heights that are at the frontier of the physical possible in the Western Mediterranean, in accordance with historical written records. There is a necessity of redesigning the new maritime infrastructure, for instance, with more resources, in order to make them robust against these Hm0, which are more common than previously thought.
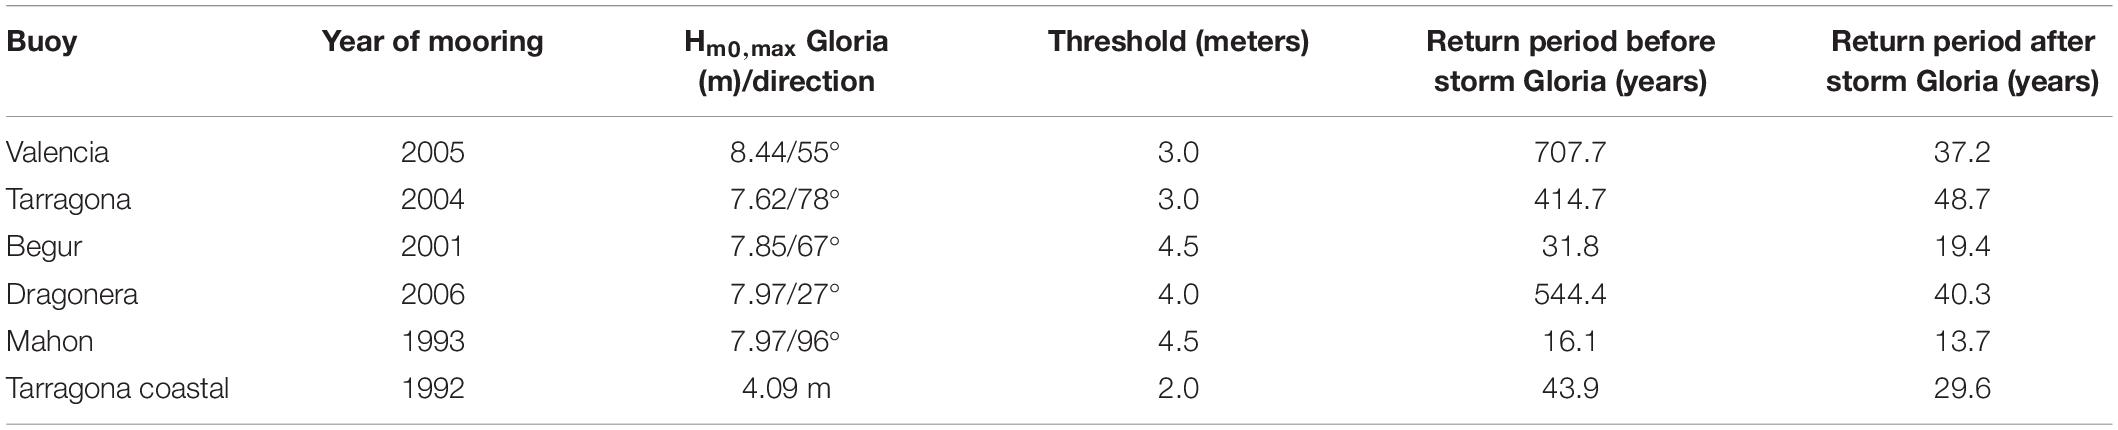
Table 4. Table showing the year of mooring, the maximum significant wave height (Hm0,max), the corresponding wave direction, the threshold to select the Hm0 for the analysis of extremes, the return period that would be assigned to the Hm0,max, before storm Gloria, and the return period that would be assigned to it after storm Gloria.
Conclusion
Extreme wave heights, duration of extreme waves, and overtopping were encountered during Storm Gloria, in the Spanish Mediterranean coast. The wave height, in particular, had been significant in the history of the in situ measurements and the reanalyzed time series. The early warning system in PdE is working correctly to alert against such extreme wave events. Wave forecast and early warning systems require constant, 24/7, maintenance and improvement. There is a need to make sure that all entry data are fed correctly, that the model has the proper parameters, and the results need to be validated. It is necessary to have access to powerful computers, as well as skilled personnel. This system has been updated with an improved return period of extreme wave heights.
The best way to ensure accurate return periods is to have enough extreme events in the sample. Thus, long-term monitoring is deemed essential. Every time an extraordinary event is observed, it might be necessary to fit the probability distribution function, again, to these new data.
The observations are provided by the buoy networks. The main purposes of the buoy networks are to monitor the Spanish waters, in real time, and to store all the data measured in the long term, for climatic characterization. For both aims, it is essential to have reliable sensors, to maintain them properly and periodically, to apply to the data an effective, real-time quality control, and to perform scientific validation in a regular basis. The users of the data, provided by the wave forecast system and the buoys, are in a wide range within the maritime sector. Only a constant development of these systems can help them along their daily economic, social, and environmental activities.
Data Availability Statement
The CMEMS IBI and MED wave model reanalyses used in this article are publicly available in CMEMS catalog. All the in situ data measured by buoys are available through PdE PORTUS System and also through the CMEMS in situ products. The PdE reanalyses are available through PdE PORTUS System.
Author Contributions
MA, JL-Y, JG-V, MR, SP-R, and EÁ-F contributed to the design and structure of the manuscript. MA, JL-Y, JG-V, and SP-R contributed writing the original draft and in the investigation, analysis of the results, review, editing, and supervision. ML and DS-M contributed with the description of the HARMONIE system and the synoptic description of the storm. MR and BP-G contributed in the investigation and contents. EÁ-F contributed with supervision, writing, review, and editing. All authors contributed to the article and approved the submitted version.
Conflict of Interest
The authors declare that the research was conducted in the absence of any commercial or financial relationships that could be construed as a potential conflict of interest.
Footnotes
- ^ https://emergency.copernicus.eu/mapping/sites/default/files/files/EMSR422_Floods-_in_Spain_0.pdf
- ^ http://www.puertos.es/en-us/oceanografia/Pages/portus.aspx
- ^ https://resources.marine.copernicus.eu/?option=com_csw&task=results/http://www.marineinsitu.eu/
- ^ https://resources.marine.copernicus.eu/?option=com_csw&view=details&product_id=MEDSEA_HINDCAST_WAV_006_012
- ^ https://resources.marine.copernicus.eu/?option=com_csw&view=details&product_id=IBI_REANALYSIS_WAV_005_006
- ^ https://doi.org/10.24381/cds.bd0915c6
References
AEMET Report (2020). Borrasca Gloria. Spanish Meteorological Agency. Available online at: http://www.aemet.es/es/conocermas/borrascas/2019-2020/estudios_e_impactos/gloria (in Spanish only) (accessed August 30th, 2020).
Álvarez-Fanjul, E., Alfonso, M., Ruiz, M. I., Lopez, J. D., and Rodriguez, I. (2003). Real time monitoring of Spanish coastal waters: the deep water network. Elsevier Oceanogr. Ser. 69, 398–402. doi: 10.1016/S0422-9894(03)80066-1
Álvarez-Fanjul, E., García Sotillo, M., Pérez Gómez, B., García Valdecasas, J. M., Pérez Rubio, S., Rodríguez Dapena, A., et al. (2018). “Operational oceanography at the service of the ports,” in New Frontiers in Operational Oceanography, eds E. Chassignet, A. Pascual, J. Tintoré, and J. Verron (Cambridge: GODAE OceanView), 729–736. doi: 10.17125/gov2018.ch27
Amores, A., Marcos, M., Carrió, D. S., and Gómez-Pujol, L. (2020). Coastal impacts of storm gloria (2020) over the northwestern mediterranean. Nat. Hazards Earth Syst. Sci. 20, 1955–1968. doi: 10.5194/nhess-20-1955-2020
Arreola, J. L., Homar Santaner, V., Romero, R., Ramis, C., and Alonso, S. (2003). “Multiscale numerical study of the 10-12 November 2001 strong cyclogenesis event in the Western Mediterranean,” in Proceedings of the 4 th EGS Plinius Conference Held at Mallorca, Spain.
Battjes, J., and Janssen, J. (1978). “Energy loss and set-up due to breaking of random waves,” in Proceedings of the 16th International Conference Coastal Engineering, Reston, VA.
Beljaars, A. (1995). The Parametrization of Surface Fluxes in Large Scale Models under Free Convection. Reading: Shinfield Park.
Bengtsson, L., Andrae, U., Aspelien, T., Batrak, Y., Calvo, J., de Rooy, W., et al. (2017). The HARMONIE-AROME model configuration in the ALADIN-HIRLAM NWP system. Mon. Wealth Rev. 145, 1919–1935. doi: 10.1175/MWR-D-16-0417.1
Booij, N., Ris, R. C., and Holthuijsen, L. H. (1999). A third-generation wave model for coastal regions, Part I, Model description and validation. J. Geophys. Res. 104, 7649–7666. doi: 10.1029/98jc02622
Cañellas, B., Orfila, A., Méndez, F. J., Menéndez, M., and Tintoré, J. (2007). Application of a POT model to estimate the extreme significant wave height levels around the Balearic Sea (Western Mediterranean). J. Coast. Res. Special Issue 50: THE INTERNATIONAL COASTAL SYMPOSIUM (ICS 2007), 329–333.
Centro de Estudios y Experimentación de Obras Públicas [CEDEX] (2020). Análisis de los Efectos Provocados por La Borrasca Gloria en el litoral Mediterráneo español. Informe Técnico para la Dirección General de la Costa y del Mar. Clave 22-417-5-001. London: CEDEX.
Charnock, H. (1955). Wind stress on a water surface. Q. J. R. Meteorol. Soc. 81, 639–640. doi: 10.1002/qj.49708135027
CIRIA, CUR, and CETMEF (2007). The Rock Manual: The use of Rock in Hydraulic Engineering C683, 2nd Edn, London: CIRIA.
Diario del Canal (2020). Available online at: https://diarioelcanal.com/los-puertos-de-barcelona-y-tarragona-intentan-recuperar-la-operativa-a-pesar-de-la-virulencia-de-la-tormenta-gloria/ (accessed August 30th, 2020).
ECMWF (2019). Evolution of the IFS Cycle. Available online at: https://www.ecmwf.int/en/forecasts/documentation-and-support/changes-ecmwf-model (accessed August 30th, 2020).
Eldeberky, Y. (1996). Nonlinear Transformation of Wave Spectra in the Nearshore Zone, Ph.D. thesis, Delft University of Technology, Delft.
Fan, Y., Lin, S. J., Held, I. M., Yu, Z., and Tolman, H. L. (2012). Global ocean surface wave simulation using a coupled atmosphere-wave model. J. Clim. 25, 6233–6252. doi: 10.1175/jcli-d-11-00621.1
Fernández-Torquemada, Y., and Sánchez-Lizaso, J. L. (2011). Responses of two Mediterranean seagrasses to experimental changes in salinity. Hydrobiologia 669, 21–33. doi: 10.1007/s10750-011-0644-1
Folt, C. L., Chen, C. Y., Moore, M. V., and Burnaford, J. (1999). Synergism and antagonism among multiple stressors. Limnol. Oceanogr. 44, 864–877. doi: 10.4319/lo.1999.44.3_part_2.0864
Franco, C., and Franco, L. (1999). Overtopping formulas for caisson breakwaters with nonbreaking 3D waves. J. Waterway Port Coast. Ocean Eng. 125, 98–108. doi: 10.1061/(asce)0733-950x(1999)125:2(98)
Goda, Y. (1977). Numerical experiments on statistical variability of ocean waves. Rep. Port Harb. Res. Instit. 16, 3–26.
Goda, Y. (1988). Statistical variability of sea state parameters as a function of wave spectrum. Coast. Eng. J. 31, 39–52. doi: 10.1080/05785634.1988.11924482
Goda, Y. (2010). Random Seas and Design of Maritime Structures. Singapore: World scientific, doi: 10.1142/7425
Gómez, M., Álvarez-Fanjul, E., Carretero, J. C., Pérez-Gómez, B., Rodríguez, I., Serrano, O., et al. (2002). “Oceanographic and atmospheric analysis of the 10-16 November 2001 Storm in the Western Mediterranean,” in Proceedings of the IV Plinius Conference on Mediterranean Storms, Mallorca.
Günther, H., Hasselmann, S., and Janssen, P. A. (1992). The WAM Model Cycle 4 (No. DKRZ-TR–4 (REV. ED.)). Hamburg: Deutsches Klimarechenzentrum (DKRZ).
Hasselmann, K., Barnett, T., Bouws, E., Carlson, H., Cartwright, D., Enke, K., et al. (1973). Measurements of wind-wave growth and swell decay during the joint north sea wave project (JONSWAP). Deut. Hydrogr. Z. 12:95.
Hasselmann, S., Hasselmann, K., Allender, J., and Barnett, T. (1985). Computations and parametrizations of the nonlinear energy transfer in a gravity wave spectrum. Part II: parametrizations of the nonlinear transfer for application in wave models. J. Phys. Oceanogr. 15, 1378–1391. doi: 10.1175/1520-0485(1985)015<1378:capotn>2.0.co;2
ICM-CSIC (2020). Resumen Sobre la Formación y Consecuencias de la Borrasca Gloria (19-24 enero 2020). Barcelona: ICM-CSIC.
Janssen, P. (1991). Quasi-linear theory of wind-wave generation applied to wave forecasting. J. Phys. Oceanogr. 21, 1631–1642. doi: 10.1175/1520-0485(1991)021<1631:qltoww>2.0.co;2
Komen, G., Hasselmann, S., and Hasselmann, K. (1984). On the existence of a fully developed wind-sea spectrum. J. Phys. Oceanogr. 14, 1271–1285. doi: 10.1175/1520-0485(1984)014<1271:oteoaf>2.0.co;2
Lársen, X. G., Du, J., Bolaños, R., and Larsen, S. (2017). On the impact of wind on the development of wave field during storm Britta. Ocean Dyn. 67, 1407–1427. doi: 10.1007/s10236-017-1100-1
Lin-Ye, J., García-León, M., Gràcia, V., and Sánchez-Arcilla, A. (2016). A multivariate statistical model of extreme events: an application to the Catalan coast. Coast. Eng. 117, 138–156. doi: 10.1016/j.coastaleng.2016.08.002
Lin-Ye, J., Pérez-Gómez, B., Álvarez-Fanjul, E., and García-Valdecasas, J. (2020). The Huelva (Spain) tsunami-ready station and its interaction with Storm Emma (March 2018). Mar. Geodesy 43, 509–539. doi: 10.1080/01490419.2020.1758856
Lopez-Bustins, J. A., and Martin-Vide, J. (2020). Causes meteorològiques i contextualització climàtica de la precipitació del temporal Glòria. Treballs Soc. Catalana Geograf. 89, 39–54.
Lorente, P., Lin-Ye, J., García-León, M., Reyes Reyes, E., Fernandes, M., Sotillo, M. G., et al. (2021). On the performance of High Frequency radar in the Western Mediterranean during the record-brekaing Storm Gloria. Front. Mar. Sci. 8:645762. doi: 10.3389/fmars.2021.645762
Martín León, F. (2003). Las gotas Frías/DANAs. Ideas y Conceptos Básicos. Servicio de técnicas de Análisis y Predicción, INM. Available online at: http://www.aemet.es/documentos/es/conocermas/recursos_en_linea/publicaciones_y_estudios/estudios/dana_ext.pdf (accessed January 19, 2020).
Martin-Vide, J. (2020). “Precipitacions torrencials a Catalunya: el temporal Glòria i perspectives de futur,” in Precipitacions (Meteorologia) - Catalunya, eds M. Canals and J. Miranda (Barcelona: Institut d’Estudis Catalans), 13–21.
Masson, V., Le Moigne, P., Martin, E., Faroux, S., Alias, A., Alkama, R., et al. (2013). The surfexv7.2 land and ocean surface platform for coupled or offline simulation of earth surface variables and fluxes. Geosci. Model. Dev. 6, 929–960. doi: 10.5194/gmd-6-929-2013
Melet, A., Meyssignac, B., Almar, R., and Le Cozannet, G. (2018). Under-estiamated wave contribution to coastal sea-level rise. Nat. Clim. Chang. 8:234. doi: 10.1038/s41558-018-0088-y
Mentaschi, L., Besio, G., Cassola, F., and Mazzino, A. (2013). Problems in RMSE-based wave model validations. Ocean Model. 72, 53–58. doi: 10.1016/j.ocemod.2013.08.003
Mitchell, J. F., Lowe, J., Wood, R. A., and Vellinga, M. (2006). Extreme events due to human-induced climate change. Philos. Trans. R. Soc. A Math. Phys. Eng. Sci. 364, 2117–2133.
Murphy, A. H. (1988). Skill scores based on the mean square error and their relationships to the correlation coefficient. Month. Weather Rev. 116, 2417—-2424.
Puertos del Estado (2017). Red de Boyas De Aguas Profundas. Informe de Datos de la boya de Tarragona. Periodo: Dic. 2016-Nov. 2017. Puertos del Estado, Available online at: http://portus.puertos.es
Qin, D., Plattner, G. K., Tignor, M., Allen, S. K., Boschung, J., Nauels, A., et al. (2014). “Climate change 2013: the physical science basis,” in Contribution of Working Group I to the Fifth Assessment Report of the Intergovernmental Panel on Climate Change, eds T. F. Stocker, D. Qin, G.-K. Plattner, M. Tignor, S. K. Allen, J. Boschung, et al. (Geneva: IPCC), 5–14.
Sánchez-Arcilla, A., García-León, M., Gràcia, V., Devoy, R., Stanica, A., and Gault, J. (2016). Managing coastal environments under climate change: pathways to adaptation. Sci. Total Environ. 72, 1336–1352.
Sánchez-Arcilla, A., González-Marco, D., and Bolaños, R. (2008). A review of wave climate and prediction along the Spanish Mediterranean coast. Nat. Hazards Earth Syst. Sci. 8, 1217–1228.
Sánchez-Arcilla, A., Gràcia, V., and García-León, M. (2014). Hydro-morphodynamic modelling in Mediterranean storms - Errors and uncertainties under Sharp grandients. Nat. Hazards Earth Syst. Sci. 2, 2993–3004.
Sartini, L., Besio, G., and Cassola, F. (2017). Spatio-temporal modelling of extreme wave heights in the Mediterranean Sea. Ocean Model. 117, 52–69.
Sotillo, M. G., Mourre, B., Mestres, M., Lorente, P., Aznar, R., García-León, M., et al. (2021). Evaluation of the operational CMEMS and coastal downstream ocean forecasting services during the storm Gloria (January 2020). Front. Mar. Sci. doi: 10.3389/fmars.2021.644525
Van der Meer, J. W. (1995). “Conceptual design of rubble mound breakwaters,” in Advances in Coastal and Ocean Engineering, (Singapore: World Scientific Publishing), 221–315.
WAMDI Group (1988). The WAM model-A third generation ocean wave prediction model. J. Phys. Oceanogr. 18, 1775–1810.
Wiese, A., Staneva, J., Ho-Hagemann, H. T. M., Grayek, S., Koch, W., and Schrum, C. (2020). Internal model variability of ensemble simulations with a regional coupled wave-atmosphere model GCOAST. Front. Mar. Sci. 7:596843. doi: 10.3389/fmars.2020.596843
Keywords: Storm Gloria, extreme analysis, waves, forecast, port management, Mediterranean Sea
Citation: de Alfonso M, Lin-Ye J, García-Valdecasas JM, Pérez-Rubio S, Luna MY, Santos-Muñoz D, Ruiz MI, Pérez-Gómez B and Álvarez-Fanjul E (2021) Storm Gloria: Sea State Evolution Based on in situ Measurements and Modeled Data and Its Impact on Extreme Values. Front. Mar. Sci. 8:646873. doi: 10.3389/fmars.2021.646873
Received: 28 December 2020; Accepted: 03 March 2021;
Published: 30 March 2021.
Edited by:
Joanna Staneva, Helmholtz Centre for Materials and Coastal Research (HZG), GermanyReviewed by:
Aifeng Tao, Hohai University, ChinaJuan Manuel Castillo Sanchez, Met Office, United Kingdom
Copyright © 2021 de Alfonso, Lin-Ye, García-Valdecasas, Pérez-Rubio, Luna, Santos-Muñoz, Ruiz, Pérez-Gómez and Álvarez-Fanjul. This is an open-access article distributed under the terms of the Creative Commons Attribution License (CC BY). The use, distribution or reproduction in other forums is permitted, provided the original author(s) and the copyright owner(s) are credited and that the original publication in this journal is cited, in accordance with accepted academic practice. No use, distribution or reproduction is permitted which does not comply with these terms.
*Correspondence: Marta de Alfonso, mar@puertos.es