Did the Coronavirus Disease 2019 Lockdown Phase Influence Coastal Water Quality Parameters off Major Indian Cities and River Basins?
 Aneesh Anandrao Lotliker* Sanjiba Kumar Baliarsingh
  R. Venkat Shesu Alakes Samanta R. Chandrasekhar Naik
  T. M. Balakrishnan Nair
- Indian National Centre for Ocean Information Services, Ministry of Earth Sciences, Government of India, Hyderabad, India
The end of the current decade experienced an outbreak of a new strain of coronavirus classified as severe acute respiratory syndrome coronavirus 2 (SARS-CoV2) [coronavirus disease 2019 (COVID-19)] that spread across the globe within a short span of time and was declared as a global pandemic by the World Health Organization. In order to contain the spread of COVID-19, the Indian Government imposed lockdown in various phases, namely, the strict lockdown period (SLP) and relaxed lockdown period (RLP). The present study addresses changes in the magnitude of satellite-derived water quality parameters in the coastal waters off major Indian cities (Mumbai and Chennai) and river basins (Narmada, Mandovi-Zuari, Netravathi, Periyar, Kaveri, Krishna-Godavari, Mahanadi, and Hooghly) along the eastern Arabian Sea (EAS) and western Bay of Bengal (WBoB) during SLP and RLP. The daily climatology (2003–2019) and anomaly (2020) of different water quality parameters, viz., chlorophyll-a (chl-a), downwelling diffused attenuation coefficient (kd490), and particulate organic carbon (POC) were used in the present study to eliminate seasonal biases and to unravel the signature of lockdown-induced changes in the magnitude of the above water quality parameters. During the total lockdown period, the magnitude of the above parameters reduced significantly in the coastal waters of both the EAS and the WBoB. However, this reduction was more significant in the coastal waters of the WBoB, attributed to a reduction in the supply of anthropogenic nutrients. Among different studied locations, the magnitude of water quality parameters significantly decreased off Chennai and Hooghly, during SLP, which subsequently increased during RLP probably due to reduction in anthropogenic material influx during SLP and increase during RLP. During RLP, the coastal waters off Mahanadi showed a maximum decrease in the magnitude of water quality parameters followed by Mandovi-Zuari, irrespective of these regions’ quantum of anthropogenic material input, possibly due to the higher response time of the ecosystem to reflect the reduction in anthropogenic perturbations. The satellite-retrieved water quality parameters have provided valuable insight to efficiently describe the changes in the health of the Indian coastal environment in terms of phytoplankton biomass and water clarity.
Introduction
The outbreak of a new strain of coronavirus classified as severe acute respiratory syndrome coronavirus 2 (SARS-CoV2) shook the entire world in 2020. The virus was first reported in Wuhan, China, on December 31, 2019, and spread across the globe within a short span of time. The World Health Organization (WHO) named this widespread outbreak as coronavirus disease 2019 (COVID-19) (Cascella et al., 2020). Subsequently, based on the rapid transmission, repeated emergence, and higher causality rate, WHO declared COVID-19 as a pandemic in March 2020. As of November 2020, more than 63.6 million COVID-19 cases have been confirmed in over 220 countries (Worldometers.info, 2020). In order to contain the spread of COVID-19, several countries have imposed a lockdown to maintain physical distancing. The government of India also implemented lockdown in four phases from March 25 to May 31, 2020. The first phase of the lockdown was during March 25 to April 14, 2020. These 21 days of strict lockdown imposed restrictions on physical gathering, industrial operations, and agriculture activities except for emergency services. The restrictions on industrial and agricultural activities were lifted during subsequent phases of lockdown (Figure 1)1.
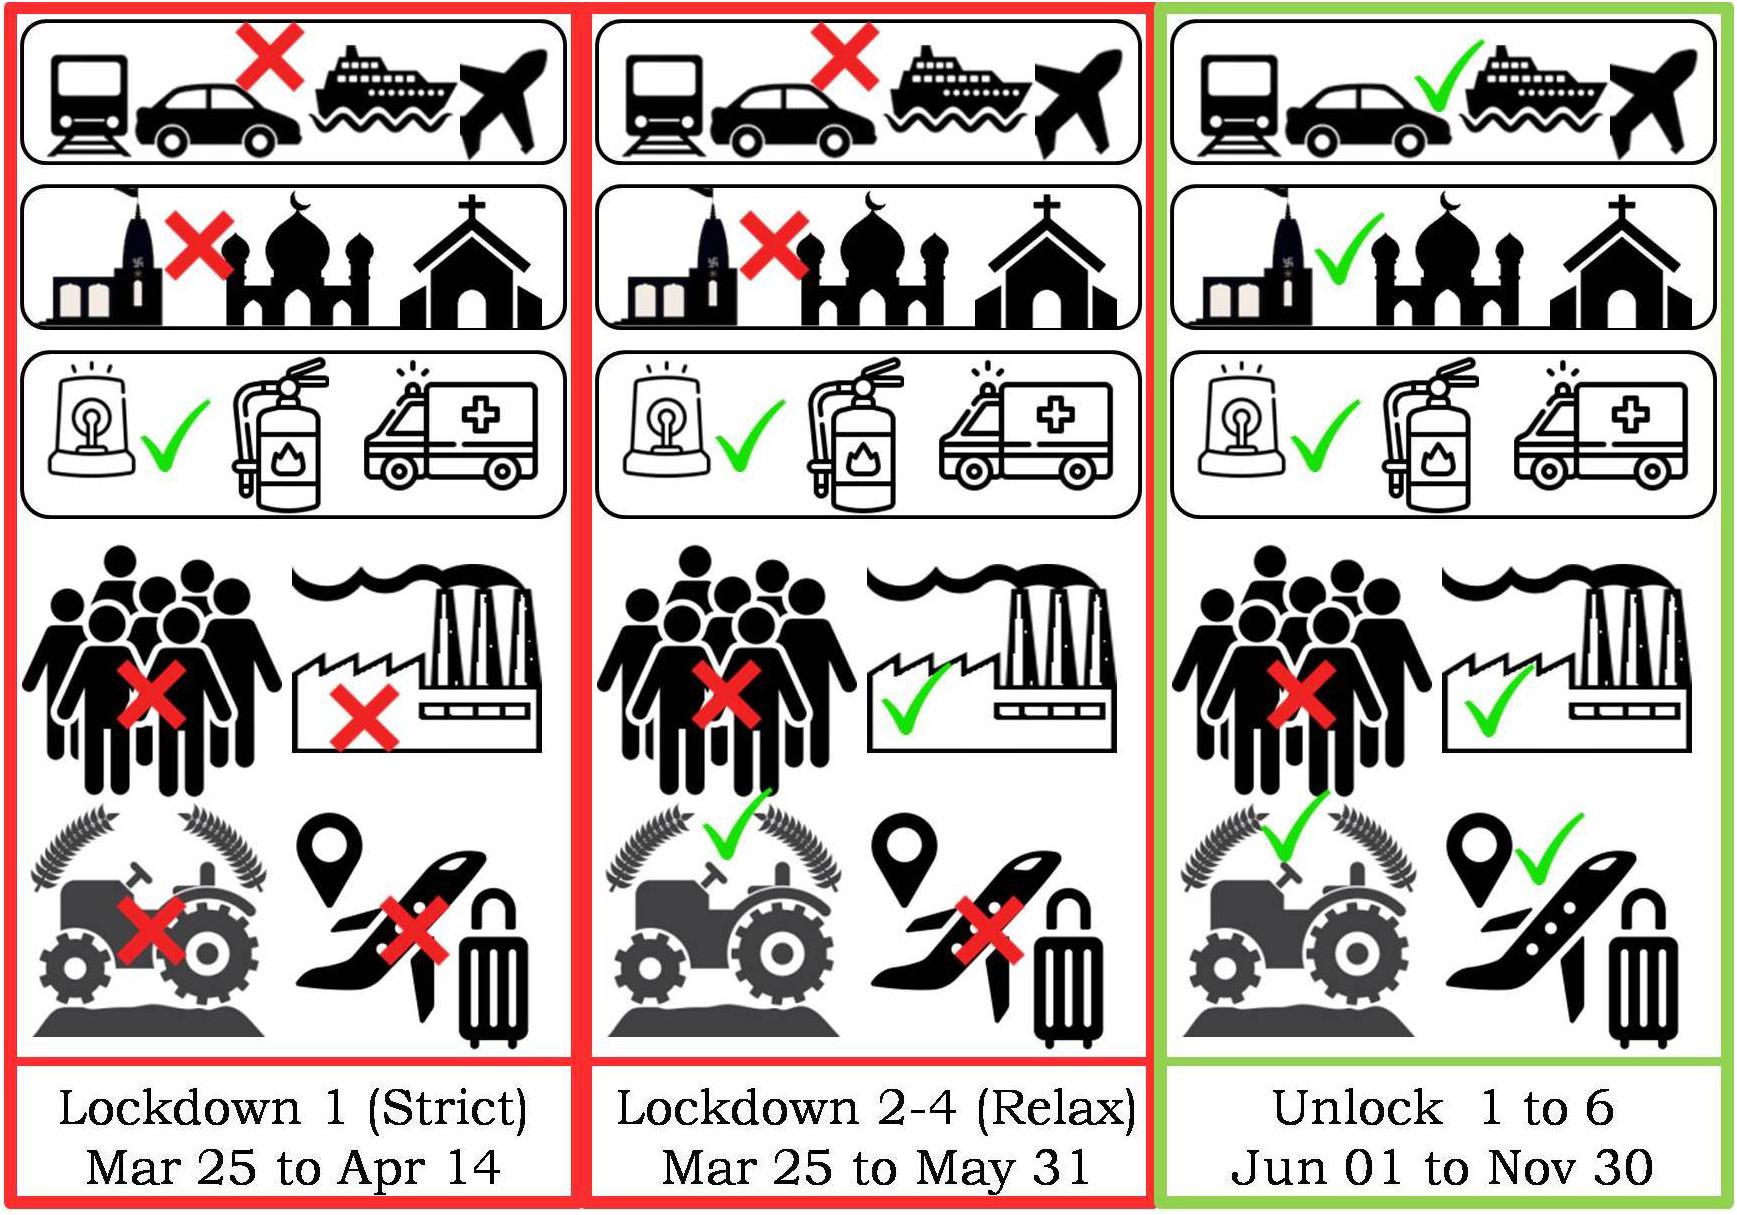
Figure 1. Schematic showing various stages of lockdown and unlock in India during the coronavirus disease 2019 (COVID-19) pandemic.
The industrial and social activities were significantly reduced during various lockdown phases, resulting in the reduction in air and water pollution in different parts of the world, including India (Garg et al., 2020; Lokhandwala and Gautam, 2020; Muhammad et al., 2020; Patel et al., 2020). In general, anthropogenic activities are the source of atmospheric and aquatic pollution. The Indian subcontinent houses many major river estuaries and large cities along the west and east coasts. The coastal waters of India in the vicinity of major cities and river basins are strongly influenced by the anthropogenic discharge (Zingde and Govindan, 2000; Verlecar et al., 2006; Gopal et al., 2018).
The coastal ecosystems around the world cover ∼10% of the total ocean surface area. However, these active land–ocean interaction zones play a pivotal role in the oceanic carbon cycle (Gattuso et al., 1998). In addition, the coastal ocean also acts as a filter for anthropogenic materials before they are transported into the deep sea. On the other hand, the continuous influx of anthropogenic materials also exerts a significant impact on the coastal environments (Hader et al., 2020). In the present century, the coastal waters of several countries are receiving high loads of anthropogenic pollutants that significantly influence the aquatic ecology, sometimes leading to eutrophication (Diaz and Rosenberg, 2008; Seitzinger et al., 2010). Therefore, natural as well as anthropogenic perturbations in the ambient water quality need regular monitoring. In the recent era, satellite-retrieved environmental parameters such as chlorophyll-a (chl-a; proxy of phytoplankton biomass), particulate organic carbon (POC; indicator of the supply and spreading of the particulate organic matter), and diffused light attenuation coefficient (kd490; index of water clarity/turbidity) can be efficiently utilized in water quality monitoring (Kratzer et al., 2003; Mishonov et al., 2003; Ni et al., 2008; Kim et al., 2017). Many previous studies have suggested and shown that human-induced material influx is the key cause of pollution in the coastal environment. During the pandemic-induced global lockdown, industrial operations, fishing activities, tourism, agriculture, and aquaculture activities are restricted for specific periods. As anticipated, the level of anthropogenic material input to the coastal waters has dropped significantly and exerted an impact on the coastal water quality of several regions of the world ocean such as the Gulf of Mannar (India), Tangier (Morocco), and Jakarta (Indonesia) (Adwibowo, 2020; Cherif et al., 2020; Yunus et al., 2020; Edward et al., 2021).
India has a long coastline of ∼7,500 km; and the coastal waters of both the west coast [eastern Arabian Sea (EAS)] and east coast [western Bay of Bengal (WBoB)] cater a large variety of ecosystem services. However, the Indian coastal waters are experiencing water quality deterioration due to the increasing influx of anthropogenic materials (Verlecar et al., 2006; Mishra et al., 2015). In the situation of the COVID-19 pandemic, India was under nationwide lockdown for over 2 months. This could have probably altered the anthropogenic inputs to the coastal waters off major Indian cities and river basins. A recent study in the Indian coastal waters has demonstrated an overall reduction in satellite-derived pre-monsoon chl-a in the offshore regions of urban centers during the peak of the lockdown in April 2020. This decline was linked to the reduction in anthropogenic nutrient supply to the coastal milieu (Mishra et al., 2020). In this regard, the COVID-19 pandemic-induced lockdown has given an opportunity to understand and quantify the effect of anthropogenic material influx on coastal water ecology on a synoptic scale using satellite remote sensing. The present study demonstrates changes in the magnitude of satellite-derived water quality parameters (chl-a, POC, and kd490), during lockdown phases of COVID-19, in the Indian coastal waters. It is important to mention here that the Indian coastal waters experience strong seasonality in the variation of water quality parameters attributed to a multitude of environmental forcing including the effect of tropical cyclones (Banse, 1987; Kone et al., 2009; Vinayachandran, 2009). Therefore, daily climatology and anomaly-based assessment are very important to eliminate the biases of seasonal and extreme events. The present study has an advantage in this regard through the adoption of such criteria.
Materials and Methods
Study Area
The present study was carried out at 10 strategic locations of the Indian coastal waters bordering the west (EAS) and east coasts (WBoB) (Figure 2). The locations in the coastal waters are selected within the vicinity of major Indian cities (Mumbai and Chennai) and river basins (Narmada, Mandovi-Zuari, Netravathi, Periyar, Kaveri, Krishna-Godavari, Mahanadi, and Hooghly). The Indian coastal waters are under the influence of reversing monsoon circulation and coastal currents. Several physical processes such as upwelling, currents, and surface winds play pivotal roles in sustaining the food web initiated by phytoplankton in the coastal waters of the WBoB and the EAS. Apart from the natural oceanographic forcing, the coastal waters of both the basins receive a huge amount of river influx and anthropogenic discharge from different urban, agricultural, and industrial centers that influence the coastal water quality and phytoplankton ecology (Gomes et al., 2000; Kumar et al., 2007, 2018; Thomas et al., 2013).
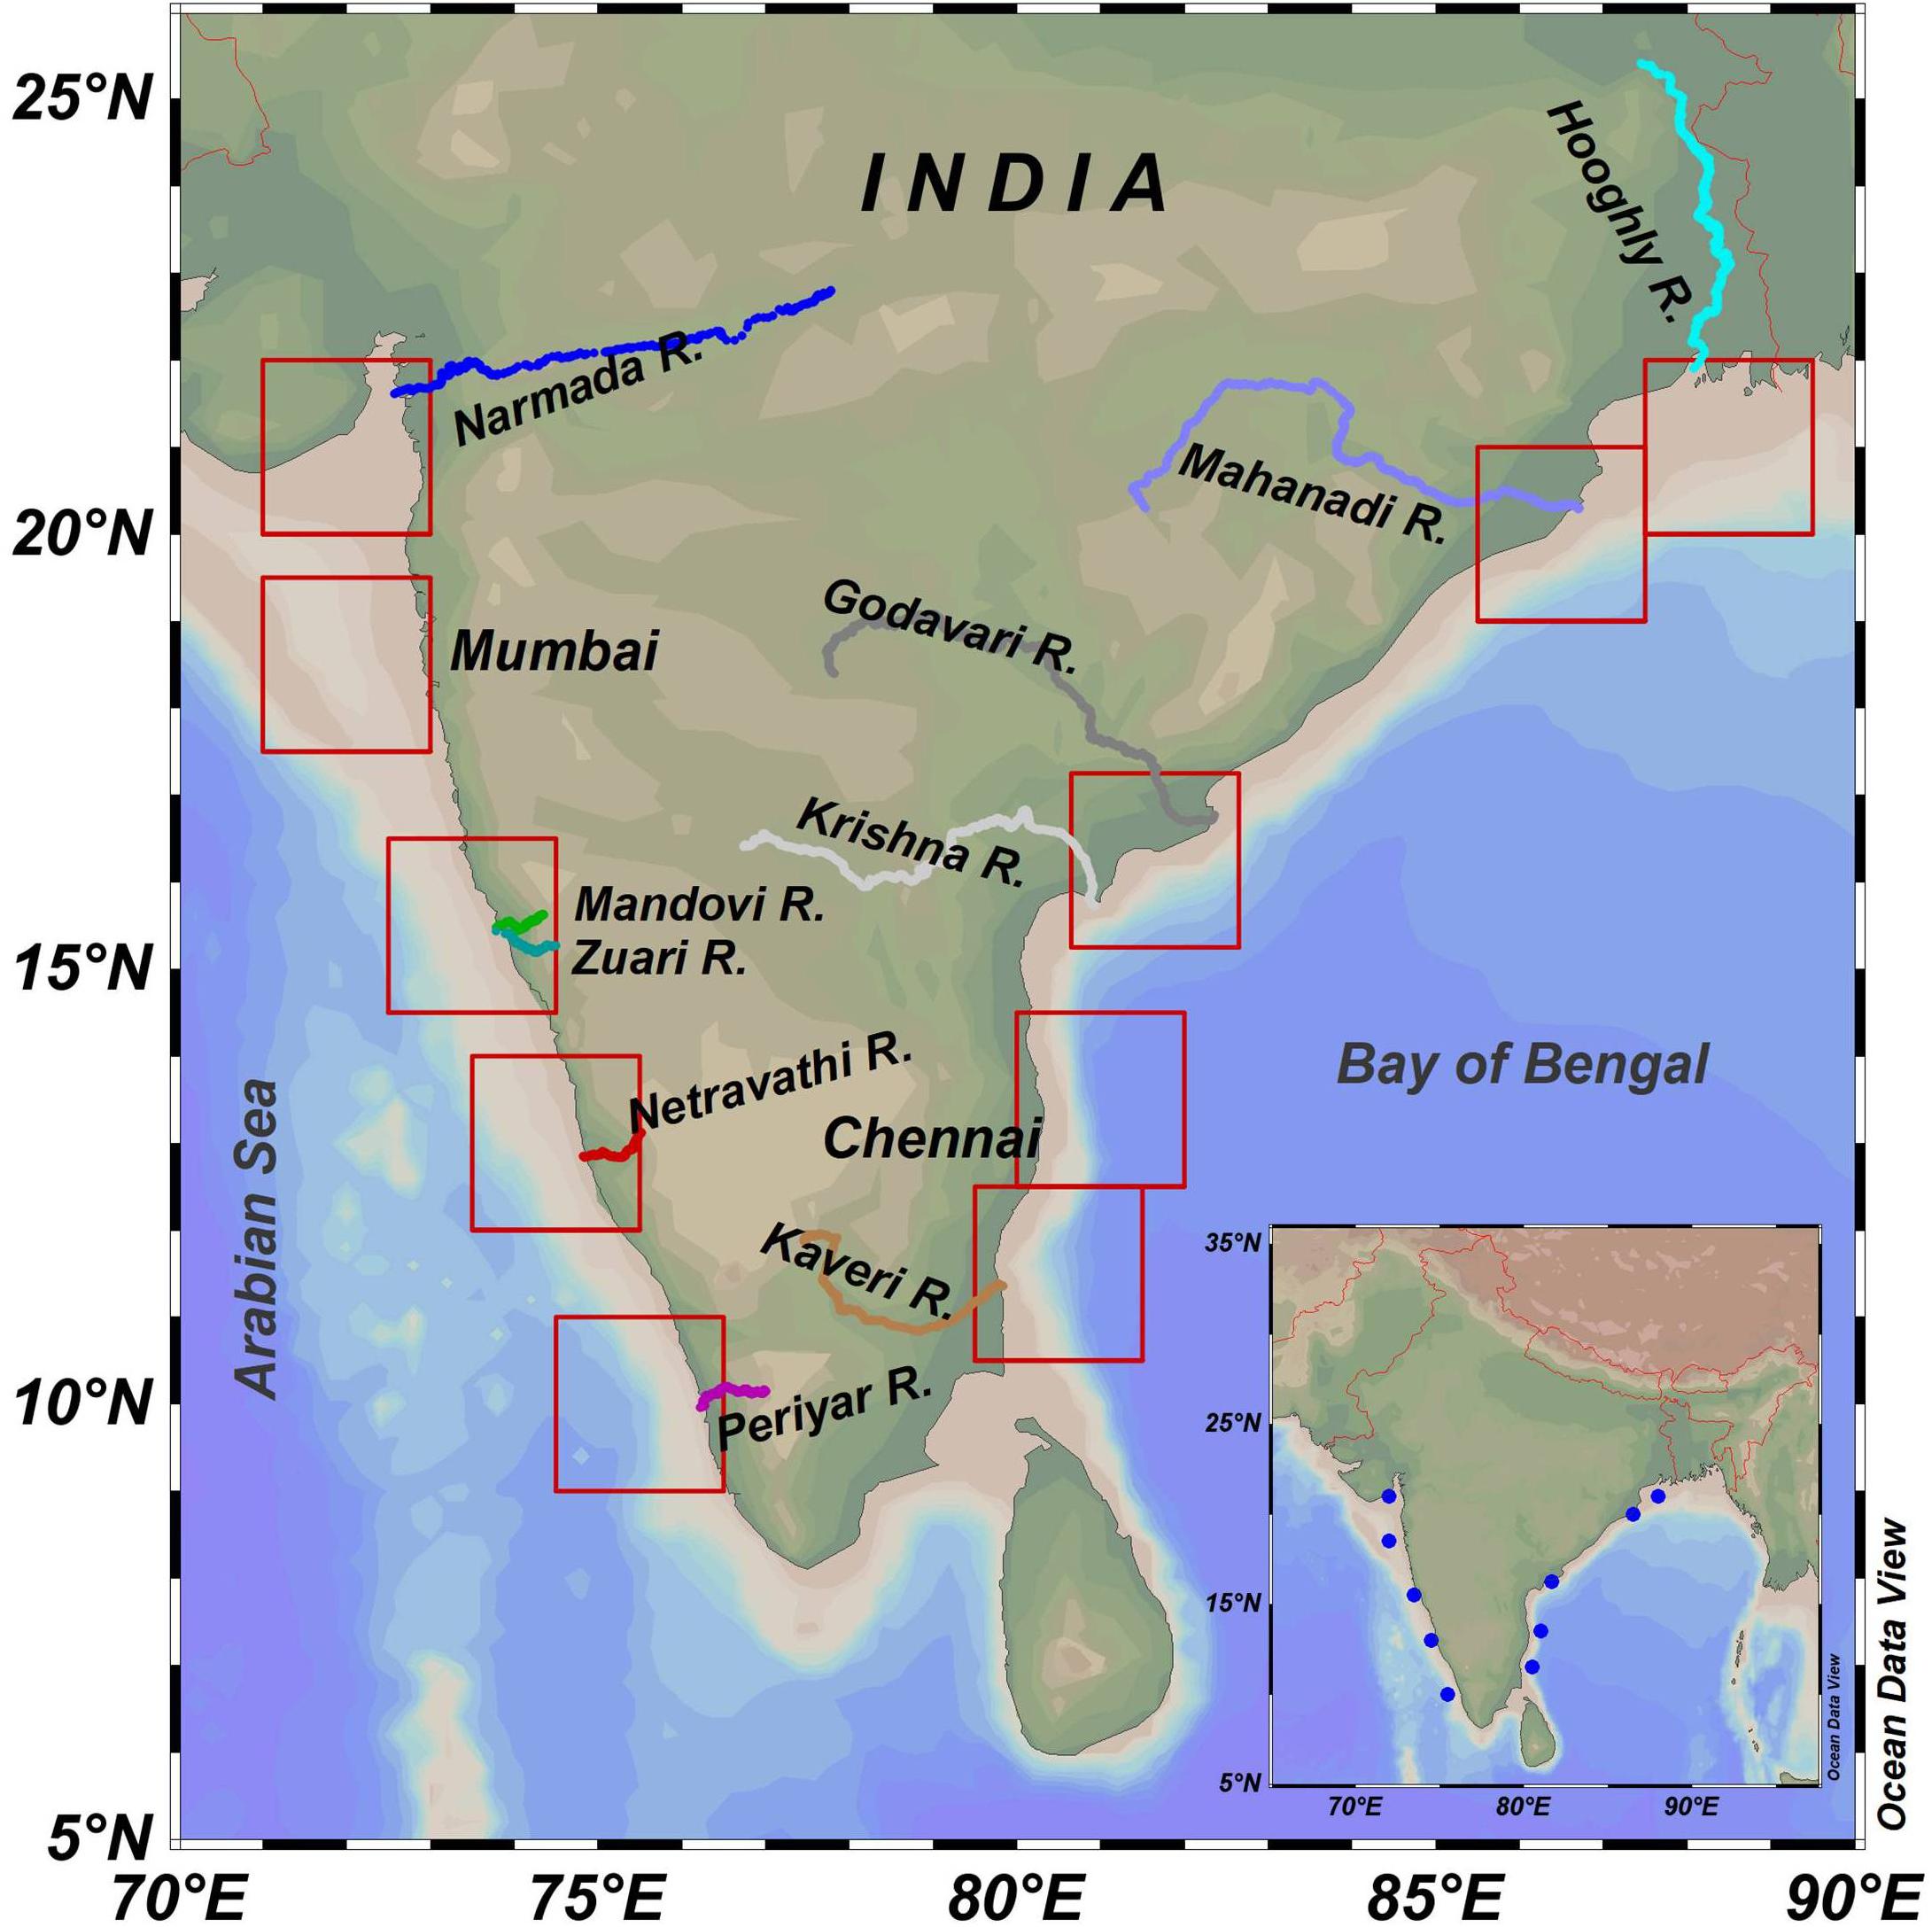
Figure 2. Map showing study regions (2°× 2° square boxes) in the Indian coastal waters. The details of geographic domains are provided in Table 1.
Satellite Data and Processing
The Moderate Resolution Imaging Spectroradiometer onboard Aqua satellite (MODISA) level 3 daily data of different water quality parameters (chl-a, kd490, POC) was taken from OceanColor Web2, which are processed (levels 0–3) by Ocean Biology Processing Group (OBPG) of the National Aeronautics and Space Administration (NASA). The level 3 standard mapped data products with 4-km spatial resolution, for each variable, were retrieved from January 1, 2003, to July 31, 2020, and processed using RStudio software. The level 3 standard data products of MODISA use sensor-default bio-optical algorithms for retrieval of chl-a (O’Reilly et al., 1998, 2000a; Hu et al., 2012), POC (Stramski et al., 2008), and kd490 (O’Reilly et al., 2000b; Lee et al., 2005). A detailed description of the genesis of algorithms, sensitivity, and performance validation is in the cited literature (in the parentheses of each parameter). A recent study by Scott and Werdell (2019) have demonstrated a similar L2 and L3 satellite-to-in situ performance for MODISA chl-a. In addition, L3 data are available with a regular Earth-grid frame of reference, which makes the data processing easier without losing the data quality and accuracy. It is also important to mention here that OBPG applies 17 quality flags while processing the data in order to produce the best quality output. In addition, OBPG datasets was checked for acceptable range limits while computing the mean values.
The retrieval accuracy of ocean color satellite products is limited in the coastal waters as compared with open ocean. However, recent studies have demonstrated reasonably well performance of ocean color bio-optical algorithms in retrieving chl-a with errors less than 30% for the full range of variability over a large area in the coastal waters (Tilstone et al., 2013; Kahru et al., 2014). Tilstone et al. (2013) have demonstrated a good match [unbiased percentage difference (UPD) < 7.5%] between remote reflectance (Rrs) retrieved from MODISA and in situ in the Indian coastal waters, which justified the use of satellite data for studying the variability of environmental parameters. The high degree of correlation between in situ and MODISA Rrs also provides confidence to use these products for studying the trend of environmental parameters in the Indian coastal waters. The data from January 1, 2003, to December 31, 2019, were used for the preparation of climatology ; and the data from January 1, 2020, to July 31, 2020 [X] along with the aforementioned climatology were used to calculate the anomaly . Subsequently, the climatology and anomaly were averaged over 2° × 2° box within the region of interest (Table 1). Further, the satellite-retrieved parameters were averaged into two categories to understand the variability during the strict lockdown period (SLP; March 25 to April 14, 2020) and relaxed lockdown period (RLP; April 15 to May 31, 2020). All the illustrations and graphics were prepared using Ocean Data View (ODV) (Schlitzer, 2002) and Grapher and SeaWiFS Data Analysis System (SeaDAS) software packages.
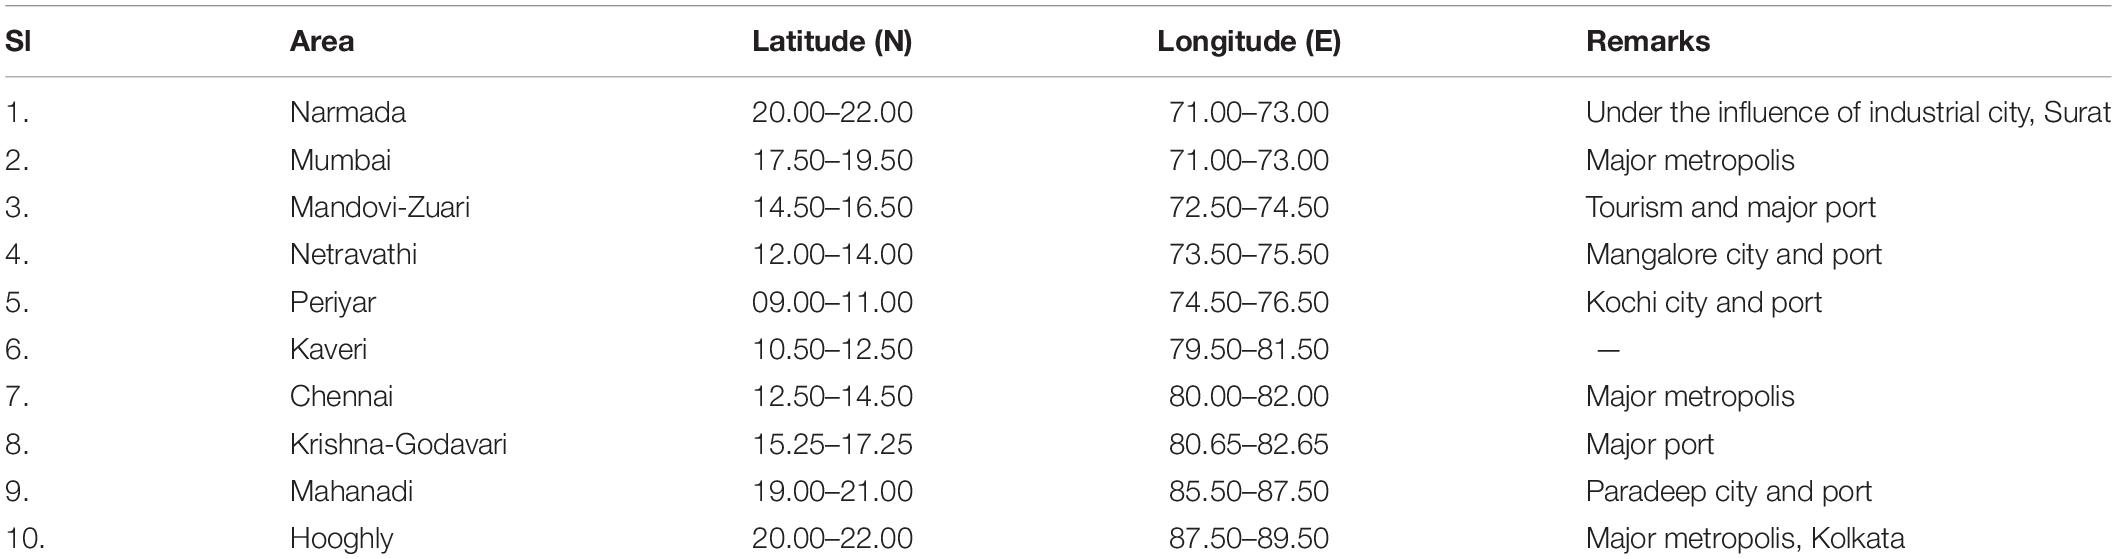
Table 1. Geographic positions and environmental attributes of the study regions.
Results and Discussion
The variability in the magnitude of MODISA-retrieved water quality parameters (chl-a, POC, and kd490) was analyzed for various lockdown and unlock phases of COVID-19 in the offshore of major Indian cities (Mumbai and Chennai) and river basins (Narmada, Mandovi-Zuari, Netravathi, Periyar, Kaveri, Krishna-Godavari, Mahanadi, and Hooghly). The daily climatology (2003–2019) and anomaly (2020) of the above parameters were generated from MODISA, describing changes in the magnitude of chl-a, kd490, and POC.
The North Indian Ocean exhibits a strong seasonal variability in water quality parameters as evident from the climatology (Figures 3–5). Therefore, in the present analysis, the anomaly was used to eliminate seasonality. The spatial distribution of chl-a, kd490, and POC anomaly during April and May 2020 is illustrated in Figure 6. The overall result showed a negative anomaly indicating a reduction in the magnitude of water quality parameters in the coastal waters of both the EAS and the WBoB during the total lockdown period (SLP and RLP). However, the reduction in magnitude was more significant in the WBoB as compared with the EAS.
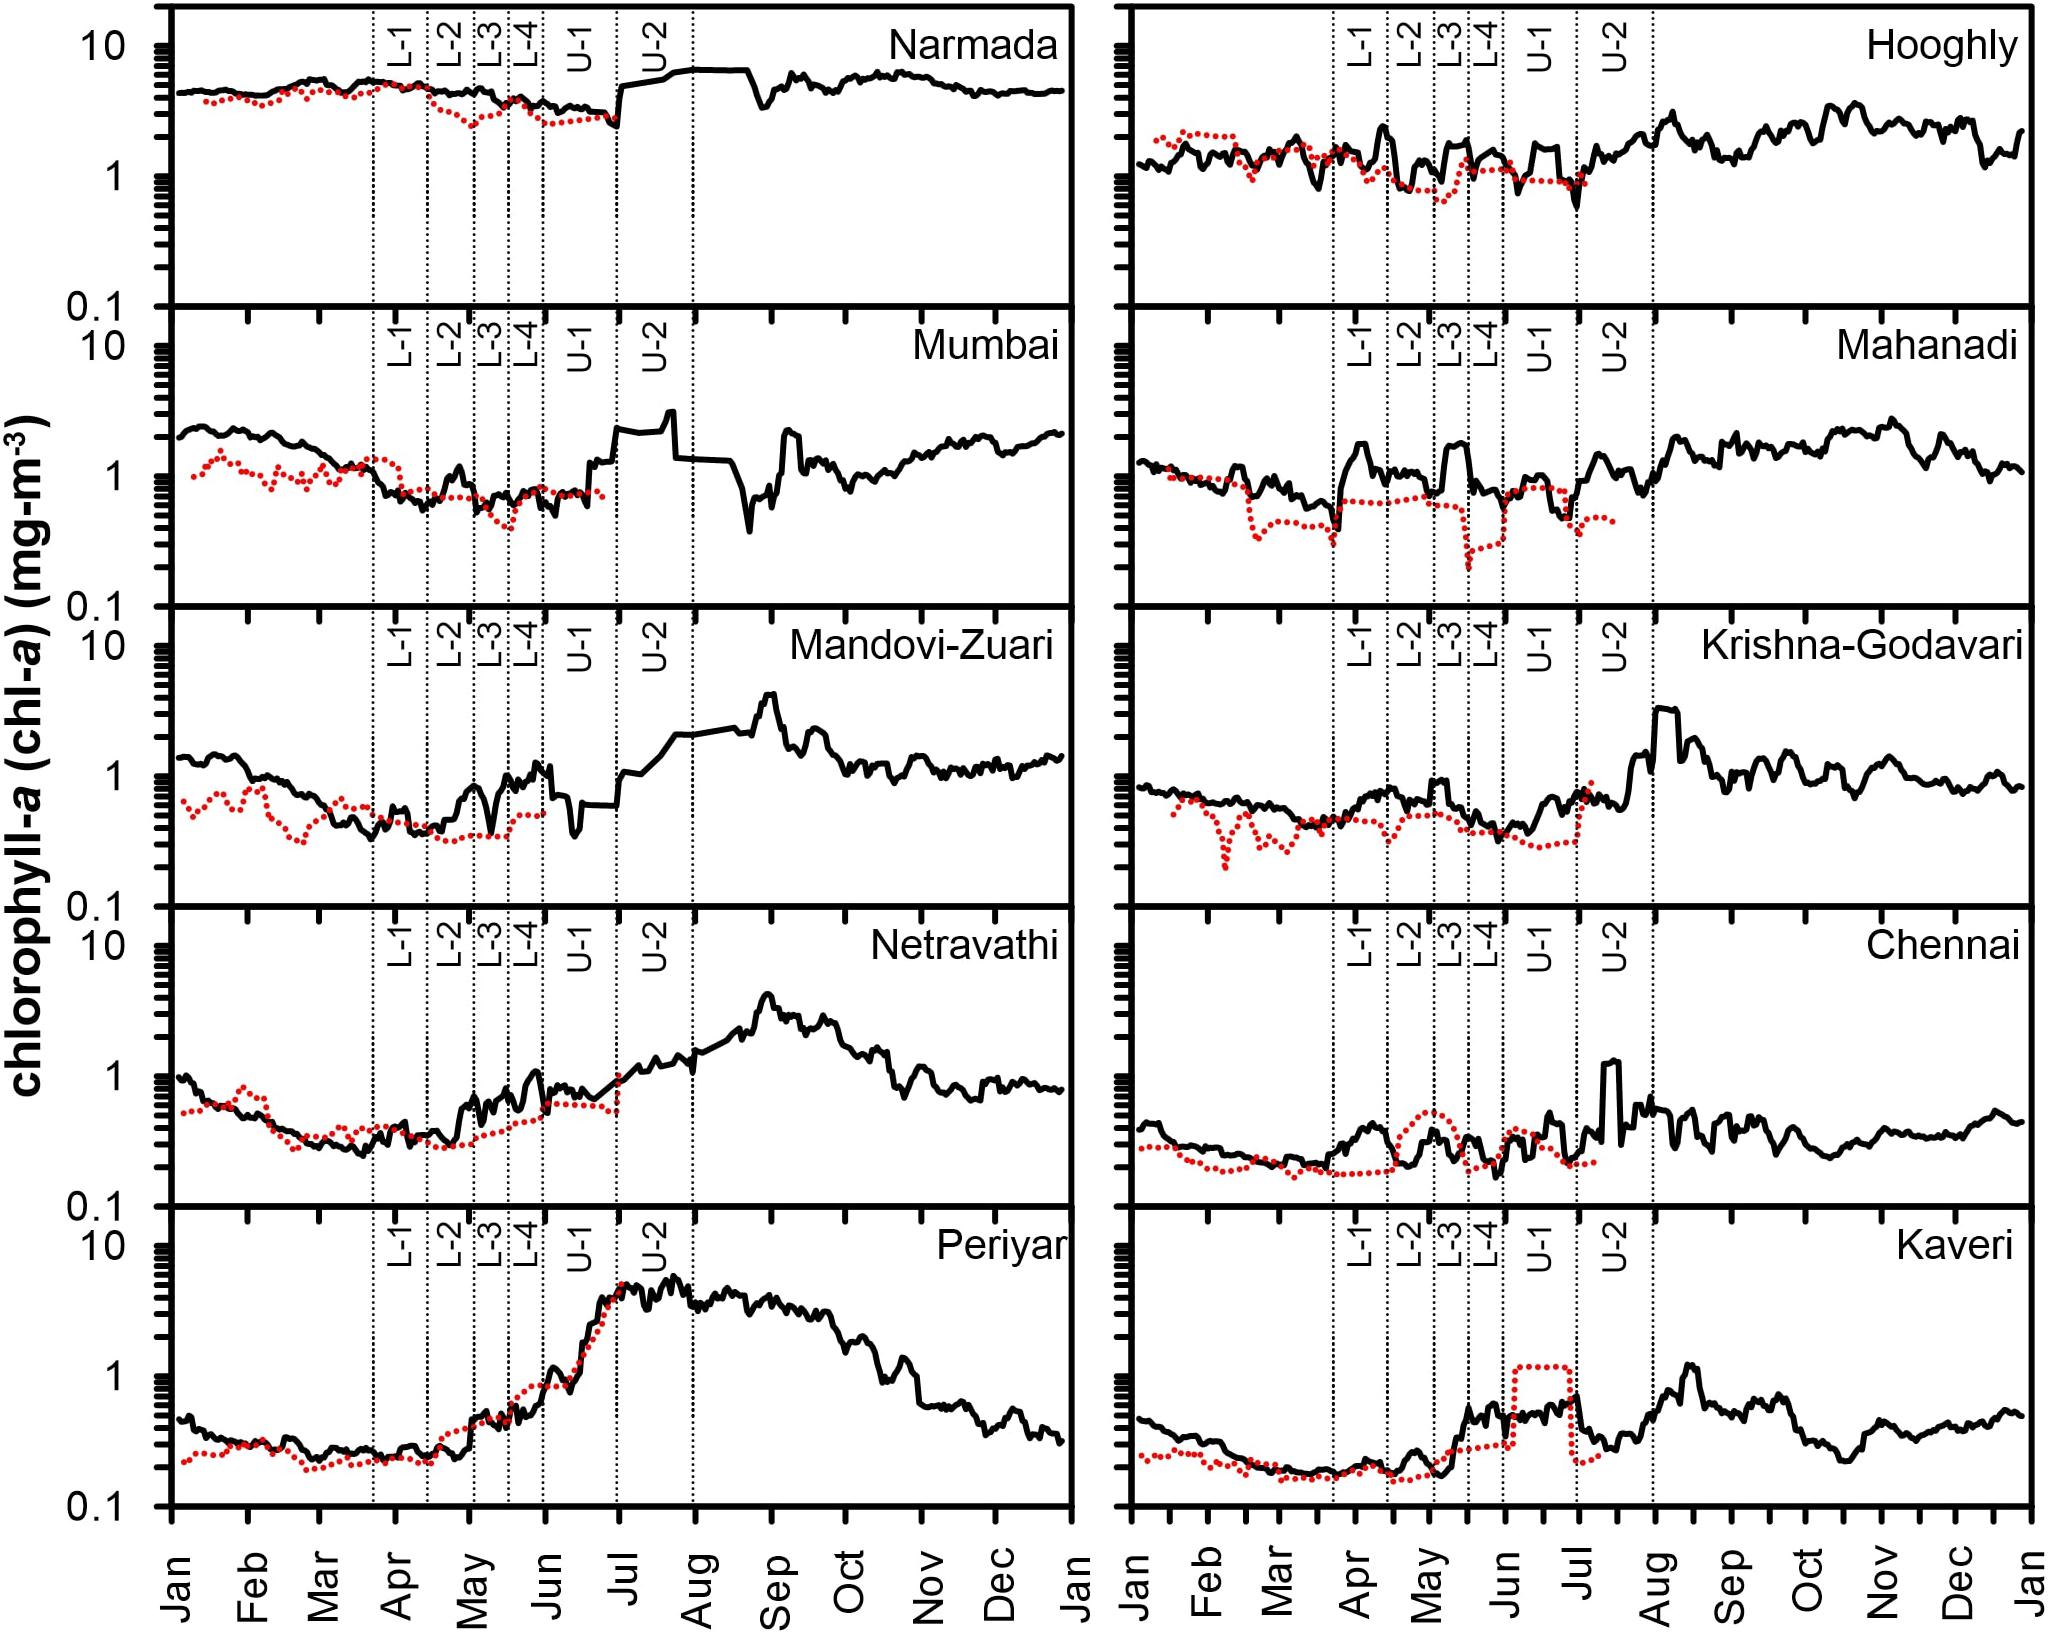
Figure 3. Mean time-series variability in chl-a climatology (solid black line) and for the year 2020 (dotted red line) off major Indian cities and river basins.
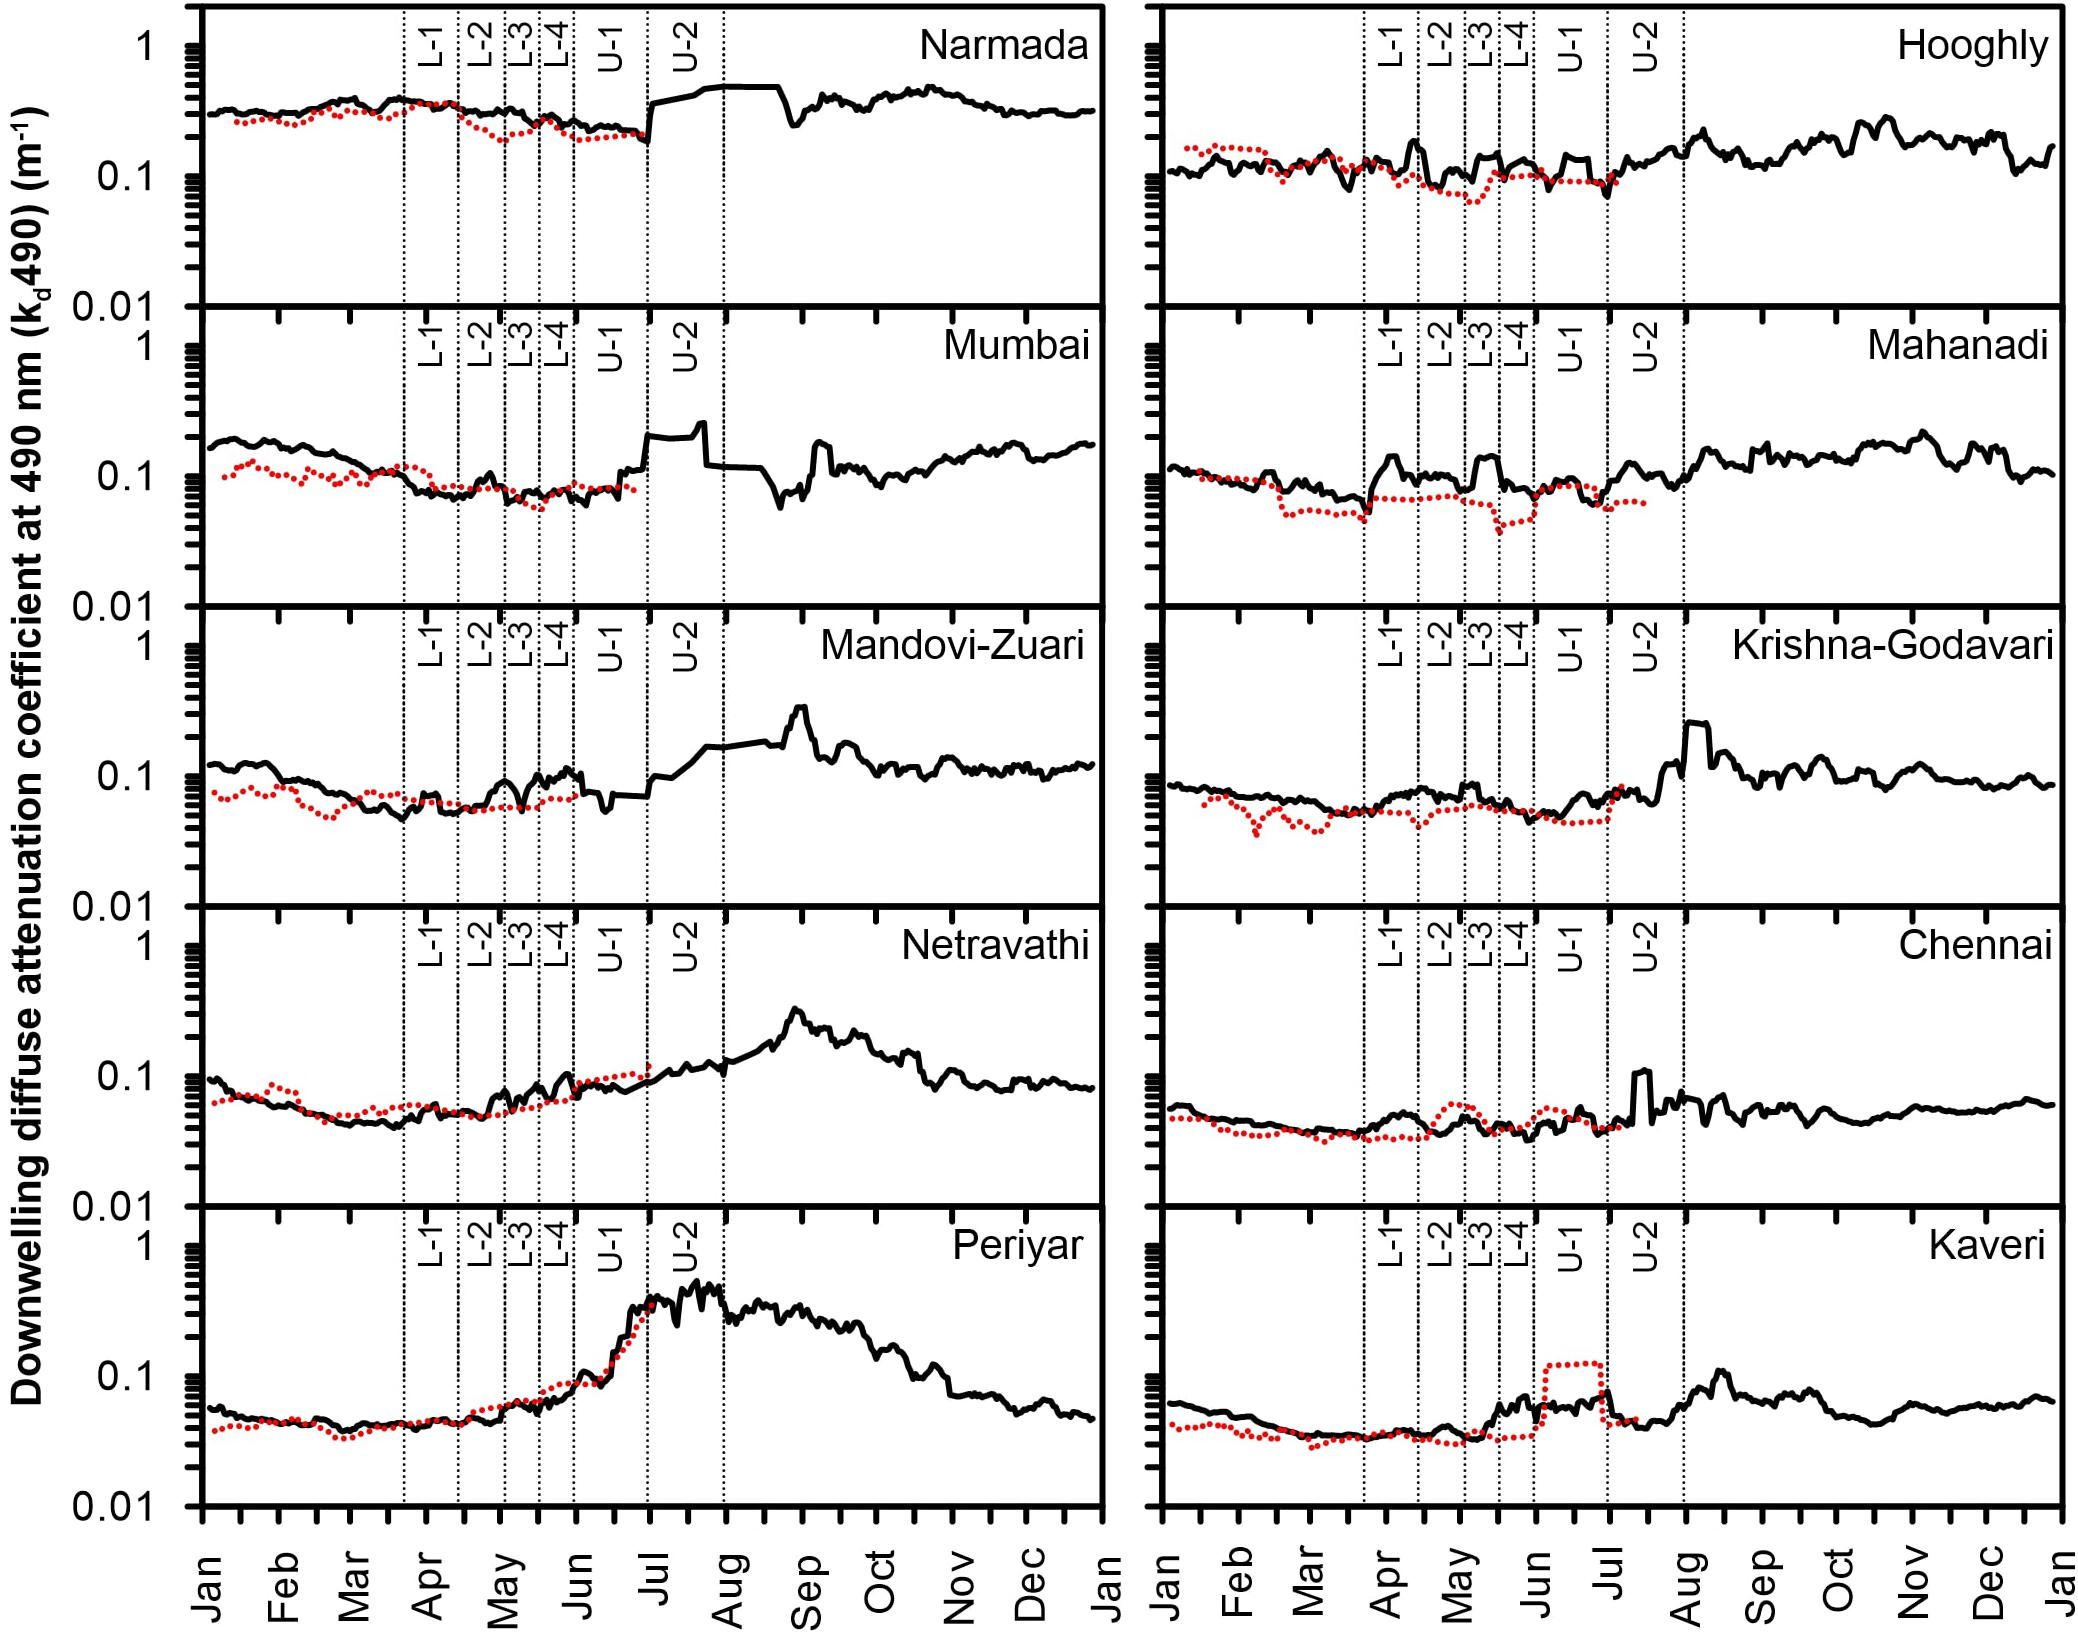
Figure 4. Mean time-series variability in kd490 climatology (solid black line) and for the year 2020 (dotted red line) off major Indian cities and river basins.
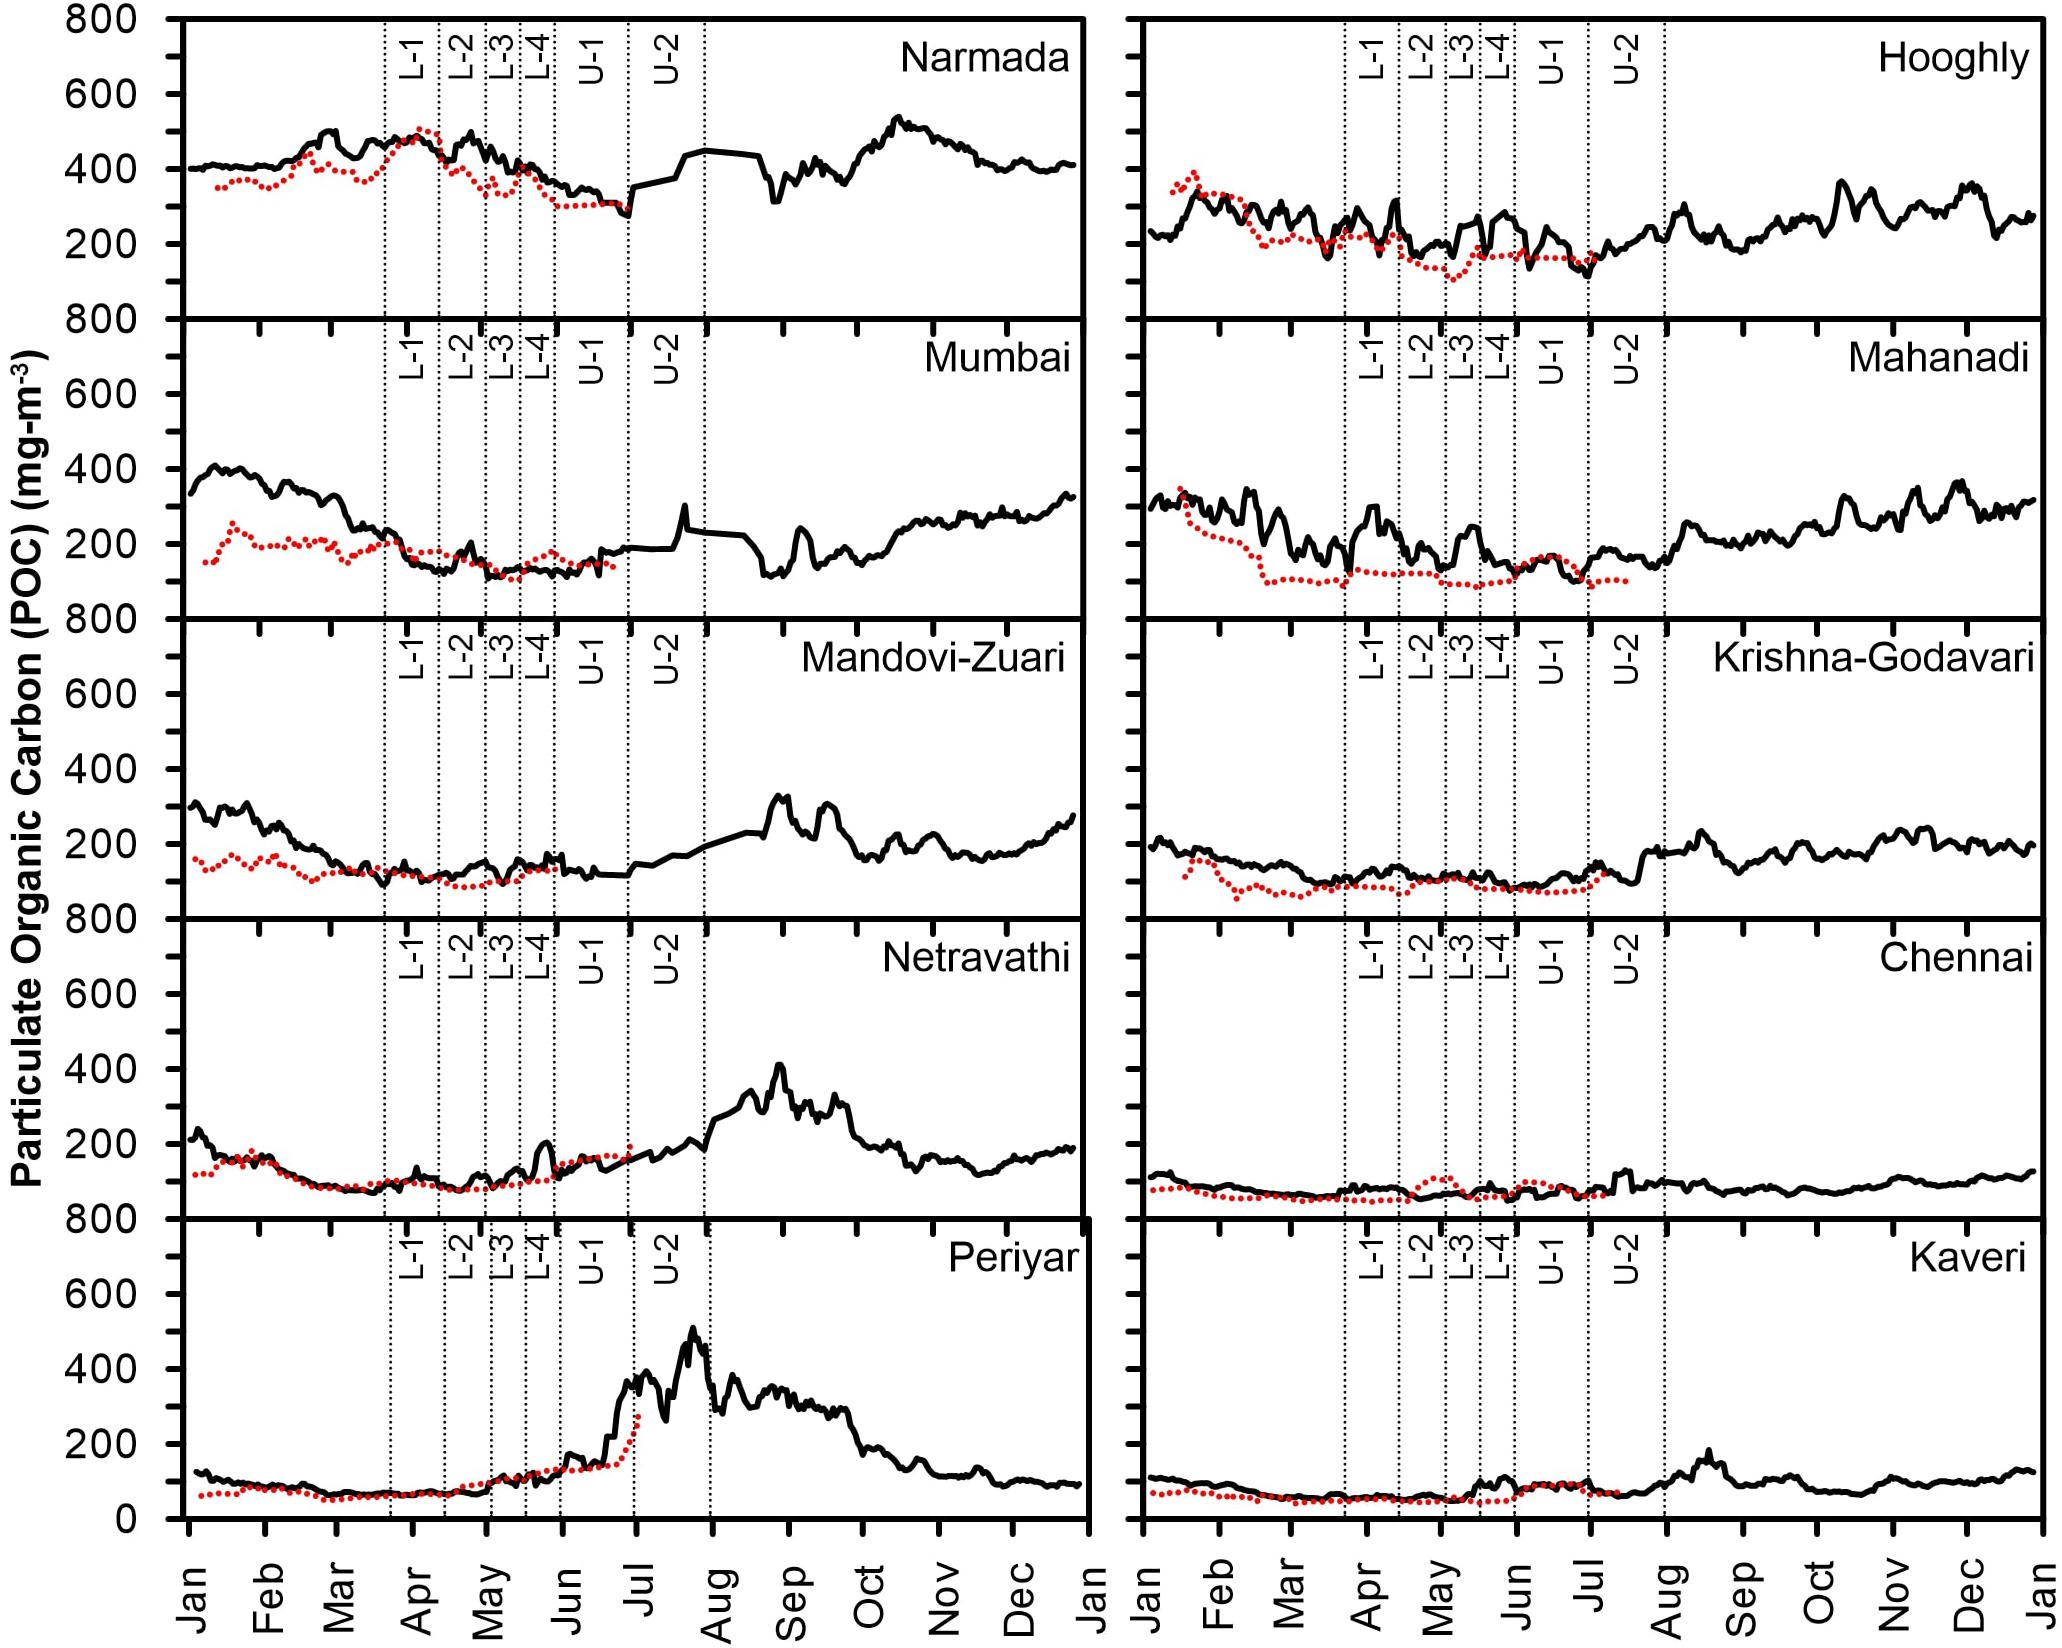
Figure 5. Mean time-series variability in POC climatology (solid black line) and for the year 2020 (dotted red line) off major Indian cities and river basins.
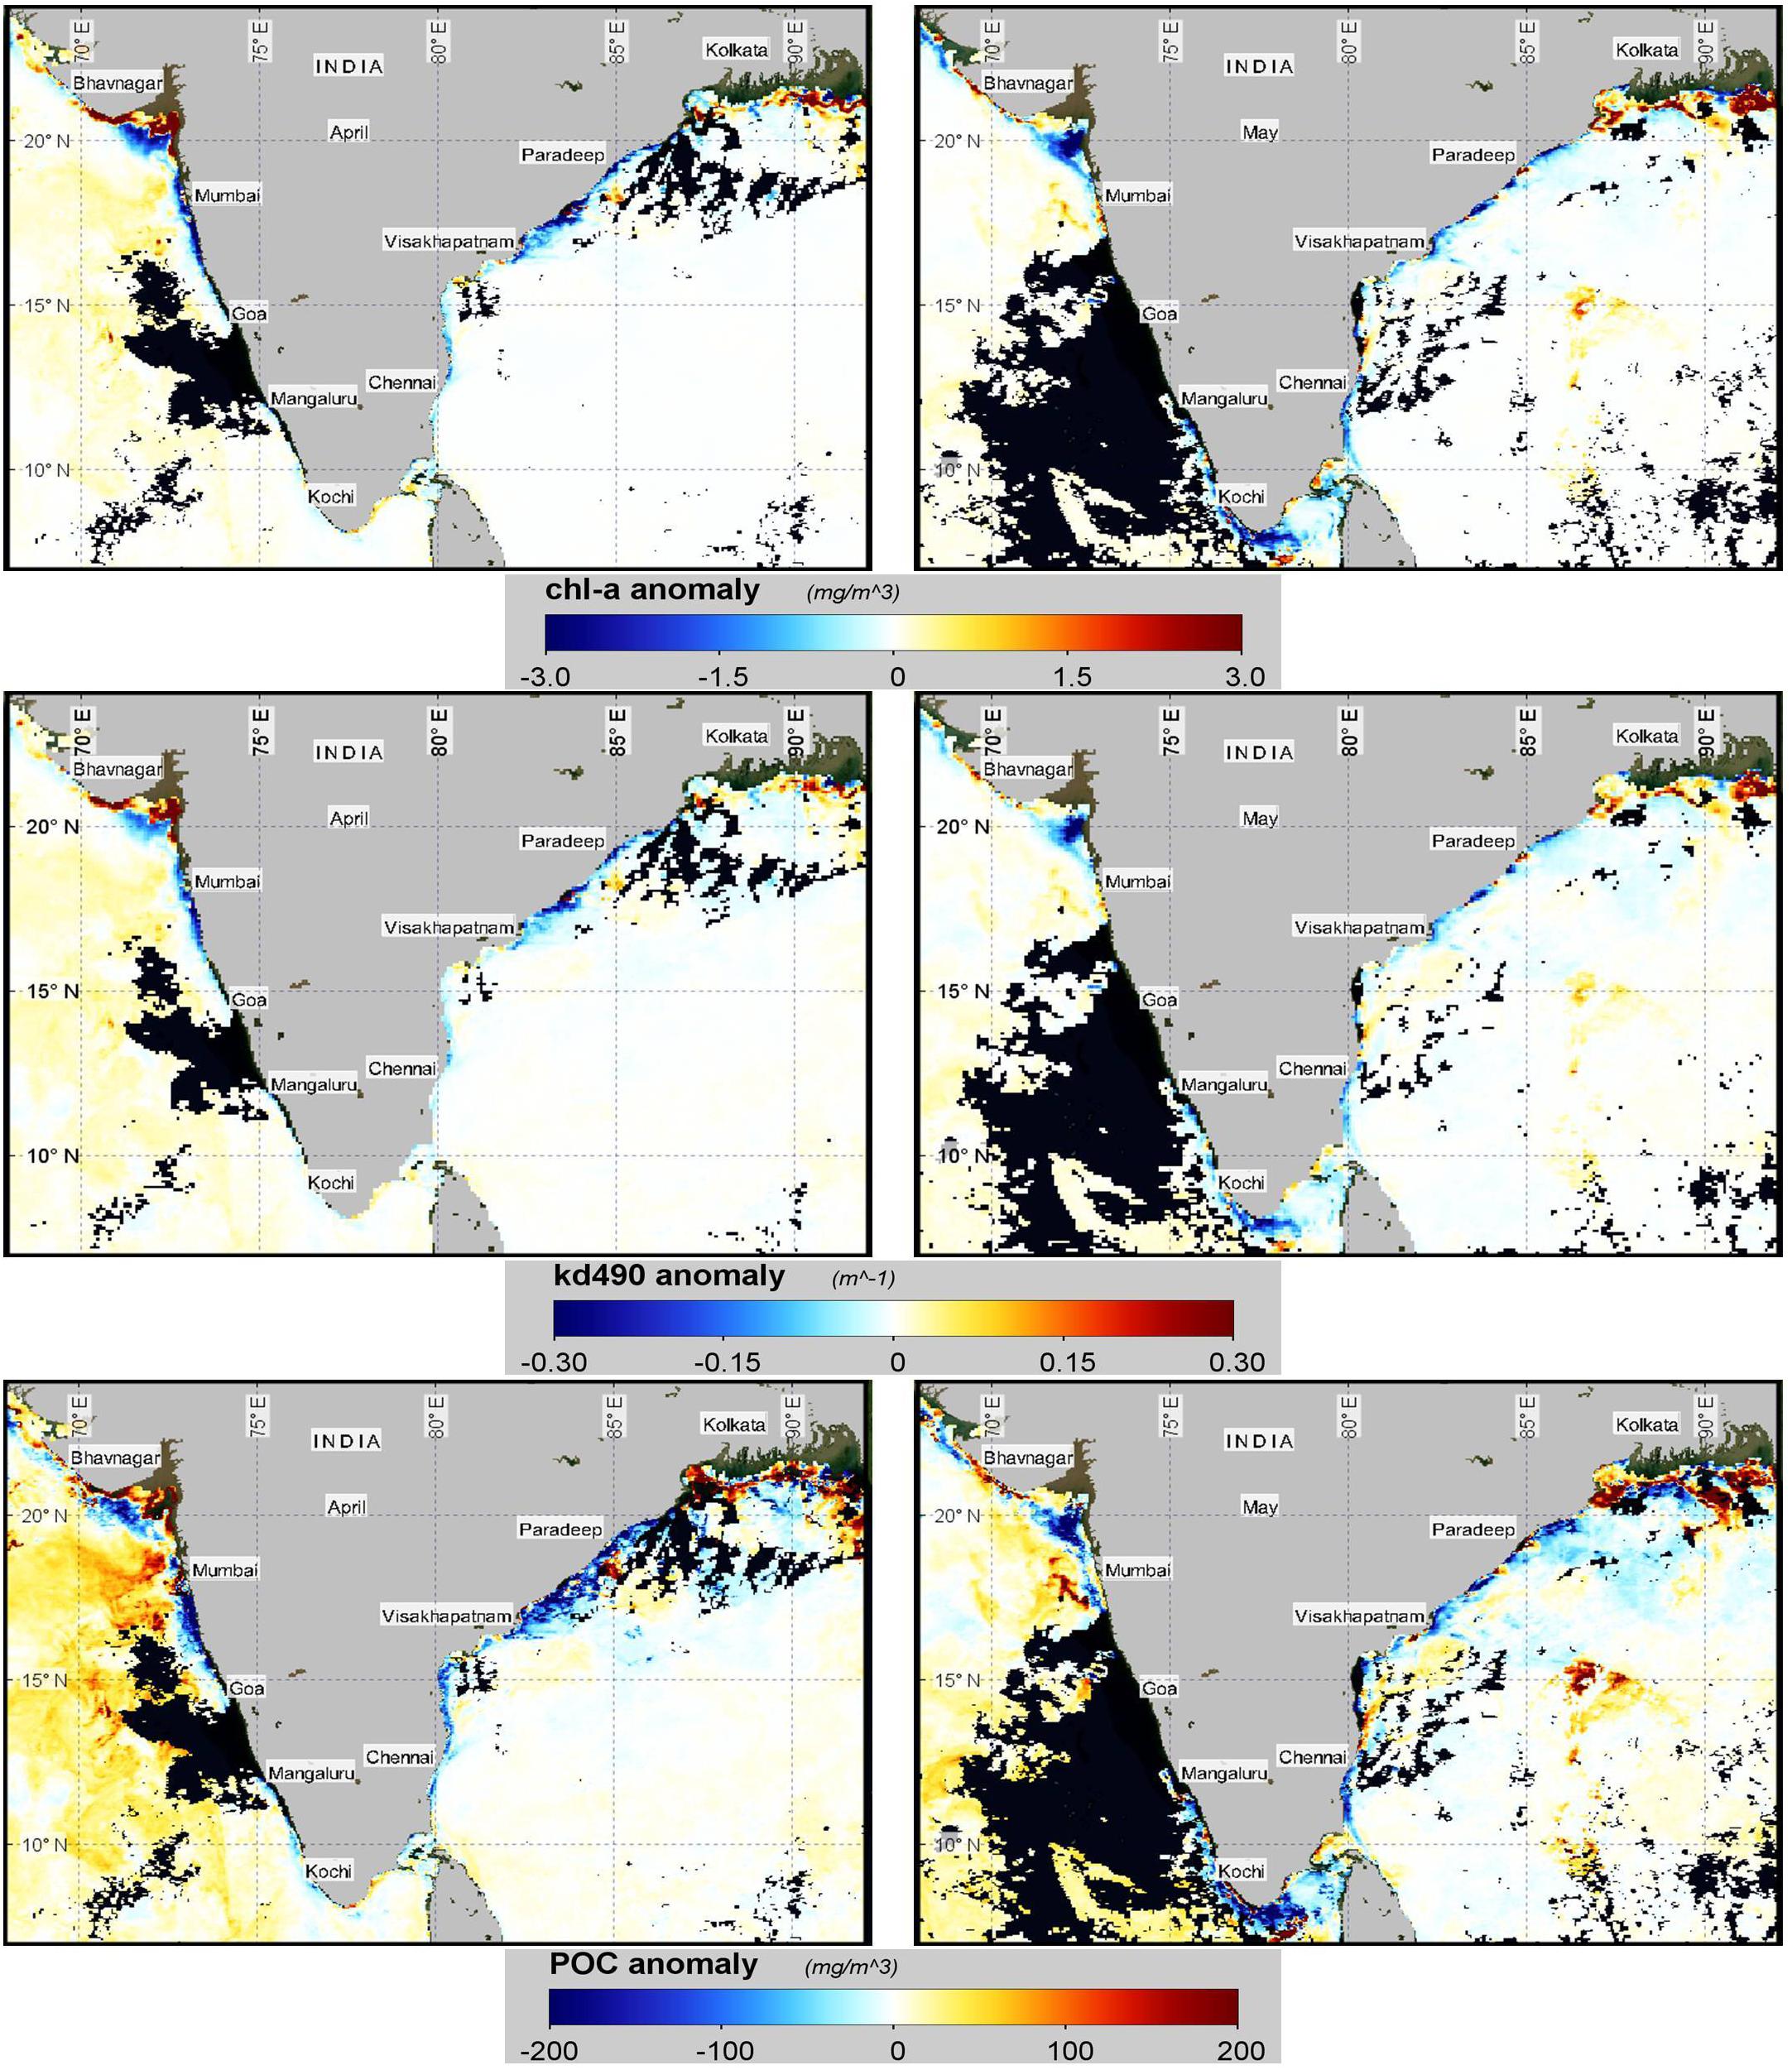
Figure 6. Spatial distribution of chl-a, kd490, and POC anomaly for April and May 2020 derived using MODISA data.
The river discharge carrying industrial, agricultural, and urban effluents could have played an important role behind the contrasting scenarios in the variability of the environmental parameters in the Indian coastal waters. In general, the coastal waters of the WBoB receive a large volume of river discharge through the major Indian rivers such as Ganga, Brahmaputra, Mahanadi, Godavari, Krishna, and Kaveri (Shetye et al., 1996; Howden and Murtugudde, 2001). In addition to the oceanic processes, river discharge acts as a major source of phytoplankton growth-promoting inorganic nutrients and suspended sediments to the WBoB and plays an important in sustaining the food web (Bharathi et al., 2018). However, the river discharges infused with higher concentration of land-derived nutrients sometimes lead to over-enrichment and result in eutrophication affecting the coastal water quality of the WBoB (Sattar et al., 2014; Sarma et al., 2020). On the other hand, the coastal waters of the EAS receive a lower quantum of freshwater discharge in comparison with the WBoB. Therefore, the possible reduction in the supply of anthropogenic nutrients especially from agriculture practices, industrial effluents, and urban wastes through terrigenous/river discharge could have resulted in lower productivity and improved water clarity during the lockdown period. A recent study has reported a significant reduction in turbidity levels in the upstream of Ganga River during the lockdown period, which signified the reduction in anthropogenic pollutant level (Garg et al., 2020). It is also important to mention here that apart from land-derived inputs, the lower atmospheric fallouts also play an important role in modulating the coastal food chain. Concomitantly, Mishra et al. (2020) have hypothesized the decrease in the concentration of chl-a in the Indian coastal waters due to the reduction in the atmospheric nutrient deposition in the coastal waters as well as watershed fluxes due to the lockdown.
In order to quantify the changes in the magnitude of water quality parameters, during the COVID-19 lockdown period, the percent change in anomaly with respect to climatology was computed. The mean anomaly in the magnitude of water quality parameters, during SLP and RLP, off major Indian cities and river basins in the coastal waters of the WBoB and the EAS are illustrated in Figure 7. During SLP, the coastal waters of the WBoB showed a significant negative anomaly in water quality parameters (chl-a, 10–51%; kd490, 4–27%; POC, 12–37%). On the other hand, in the coastal waters of EAS, the positive anomaly was observed off Mumbai, Mandovi-Zuari, and Netravathi (chl-a, 14%; kd490, 19%). However, the anomaly was not significant off Mumbai and Mandovi-Zuari. The overall variability in the magnitude of water quality parameters, in the Indian coastal waters, discerned maximum negative anomaly off Chennai (chl-a, 51%; kd490, 27%; POC, 37%) followed by off Hooghly (chl-a, 31%; kd490, 26%; POC, 20%).
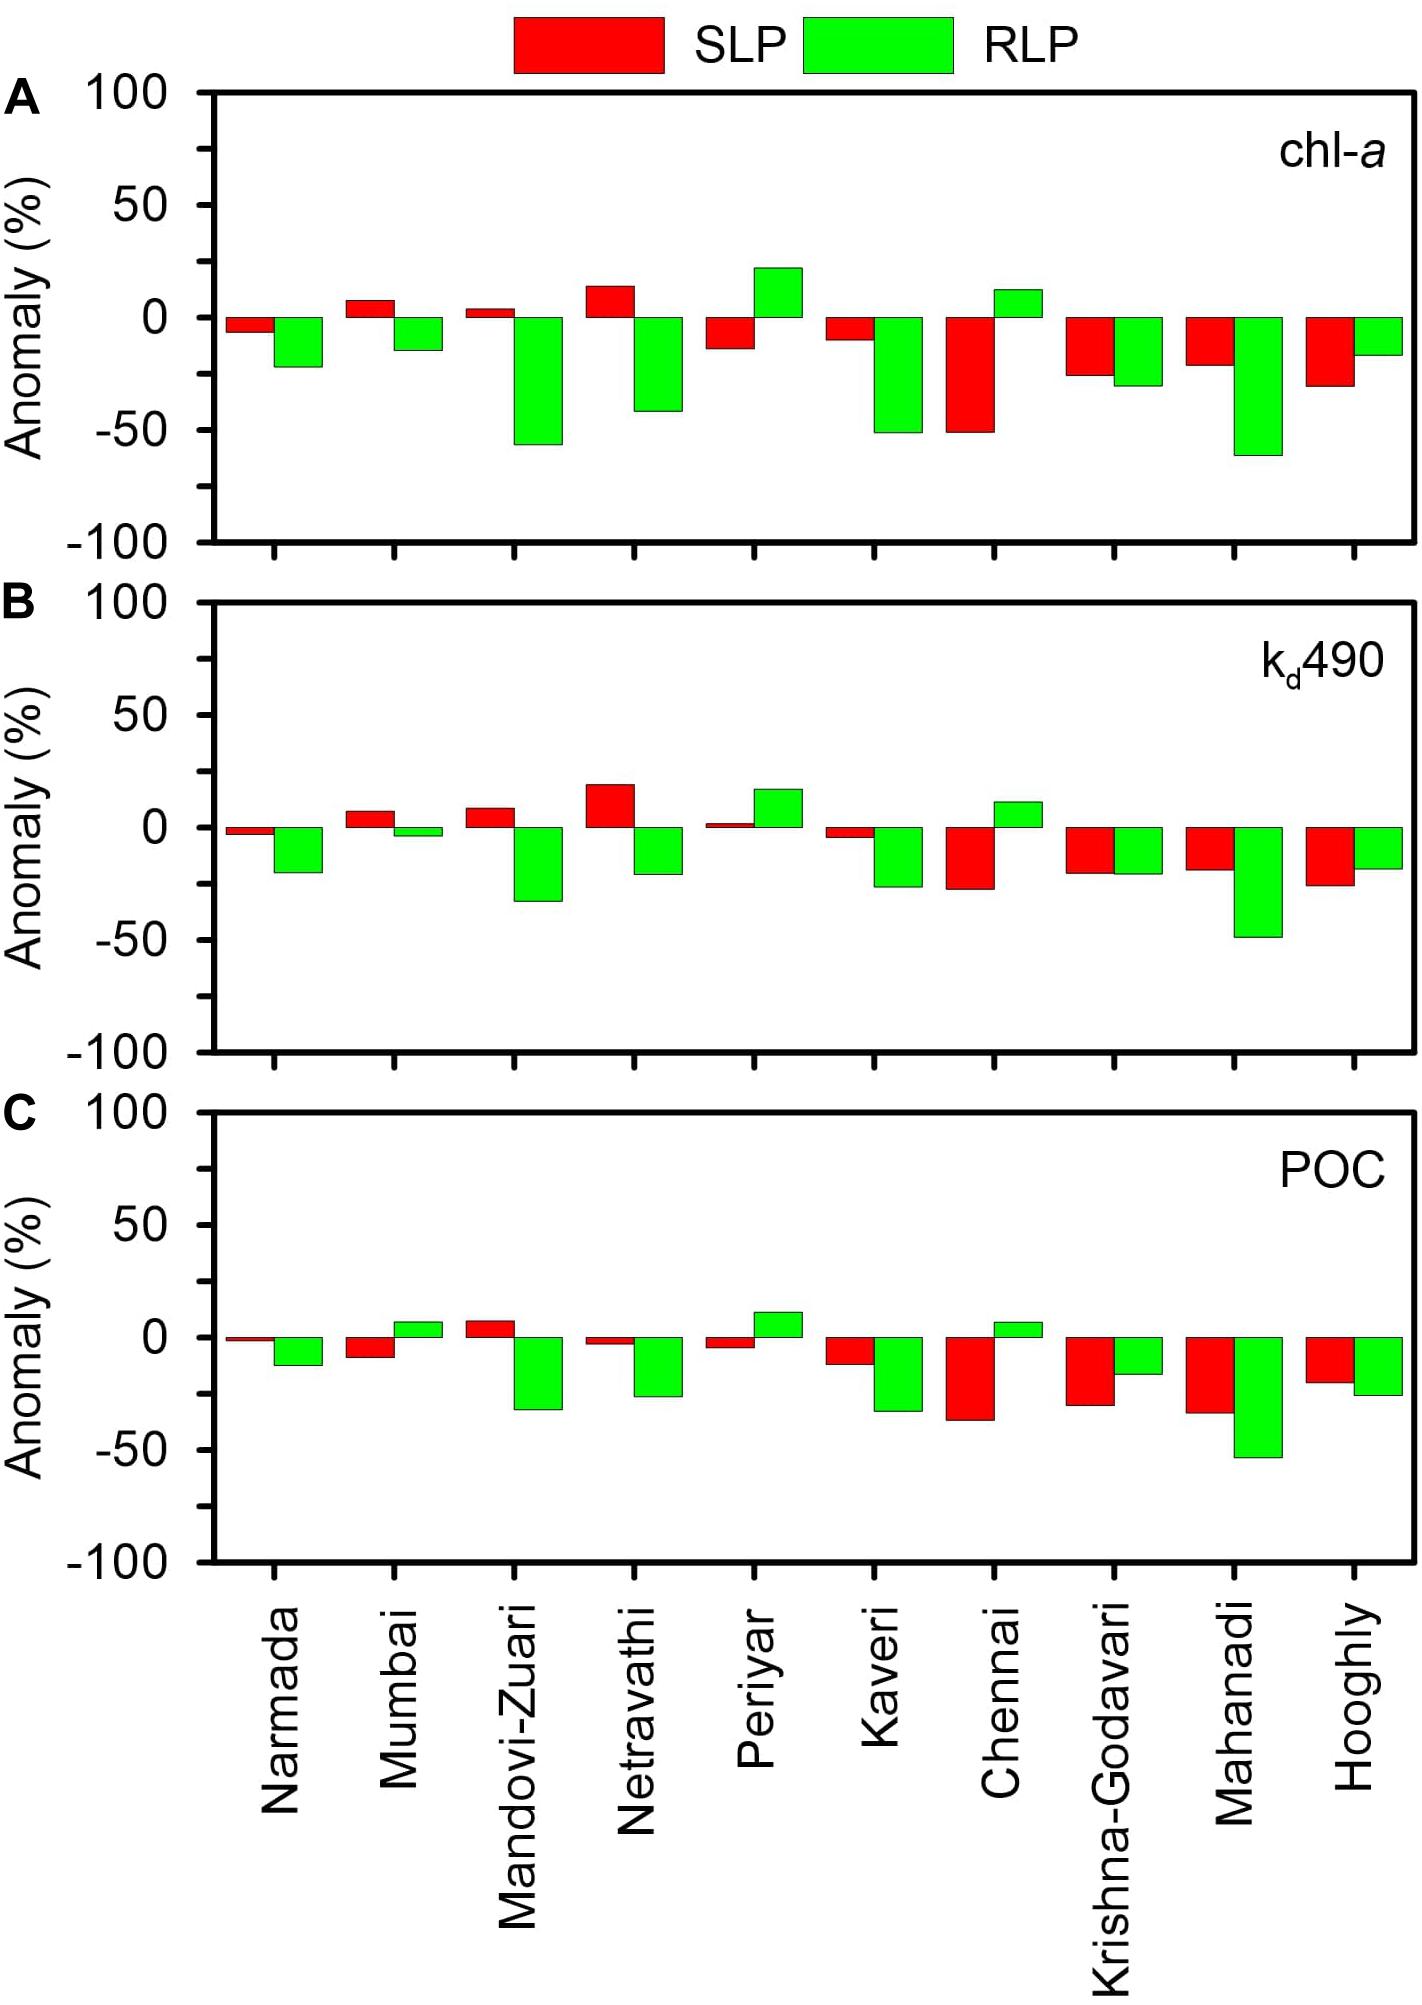
Figure 7. Mean anomaly of (A) chl-a, (B) kd490, and (C) POC during strict (March 25 to April 14, 2020) and relaxed lockdown (April 15 to May 31, 2020) off major Indian cities and river basins.
During RLP, the WBoB showed negative anomaly at all the locations (chl-a, 17–61%; kd490, 18–49%; POC, 16–53%) except off Chennai, where chl-a (12%) and kd490 (11%) showed positive anomaly. The coastal waters of EAS showed negative anomaly at all the locations (chl-a, 15–56%; kd490, 4–33%; POC, 12–32%) except off Periyar, where the magnitude of all water quality parameters showed positive anomaly (chl-a, 22%; kd490, 17%; POC, 11%). As per a recent report, the Periyar River had continued to receive anthropogenic discharge even during the lockdown period and thereby possibly resulted in a higher magnitude of the studied parameters (Satheesh, 2020). Among different studied locations in the coastal waters of the WBoB, the magnitude of all water quality parameters significantly decreased off Chennai during SLP, which subsequently increased during RLP.
The metropolis of Chennai generates a high volume of anthropogenic pollutants. The coastal waters of Chennai experience episodes of eutrophication and toxic algal blooms due to the city pollutants brought by the Adyar and Cooum Rivers (Shanmugam et al., 2007; Mishra et al., 2015). Therefore, it can be hypothesized that the higher load of anthropogenic pollutants could have not allowed phytoplankton to flourish. However, during RLP, an increase in chl-a anomaly was probably attributed to the relative reduction in pollution stress. Analogous to Chennai, the coastal waters off Hooghly also receive a significant load of anthropogenic pollutants. The Hooghly River is one of the major distributaries of Ganga River. After traveling a considerable distance from the upstream, the river passes through the urbanized metropolitan city of Kolkata and carries all the anthropogenic materials into the coastal waters of the WBoB. The recent reports showed a significant increase of the water transparency in the upper reaches of Ganga River during the lockdown period, signifying a reduction in anthropogenic influx (Garg et al., 2020). Concomitantly, the subsequent reduction in the pollution stress restored phytoplankton growth in the downstream (Hooghly estuary), which has been also reported during the lockdown period (Pal et al., 2020; Sengupta et al., 2020). In general, the estuaries act as a filter for the anthropogenic material before passing into the adjoining sea. Therefore, the reduction in excess anthropogenic materials restored the phytoplankton growth by optimally utilizing the nutrients. Therefore, these coastal waters also showed an increase in the magnitude of chl-a from SLP to RLP.
During RLP, the maximum percentage decrease in concentration was observed off Mahanadi (chl-a, 61%; kd490, 49%; POC, 53%). Although the coastal waters off Mandovi-Zuari estuary receive lesser anthropogenic inputs than the coastal waters off Mahanadi, they also followed a decreasing pattern in the studied parameters (chl-a, 56%; kd490, 33%; POC, 32%) with a higher percentage next to off Mahanadi. The response times of these ecosystems to reflect the variability in biogeochemical parameters could have played an important role behind the decreased magnitude of water quality parameters during RLP (Drupp et al., 2011). It can be hypothesized that the coastal water productivity was sustained using the available nutrients in the ecosystem during SLP. Subsequently, after the reduction in the anthropogenically sourced nutrients during SLP, the decrease in the magnitude of chl-a and POC was reflected in the lag phase during RLP. A recent study has reported a similar instance off Mahanadi showing a decrease in the magnitude of chl-a attributed to anthropogenic nitrate reduction during SLP (Mishra et al., 2020).
Conclusion
In recent decades, anthropogenic activities in the coastal regions have risen at an unprecedented pace, which poses a significant threat to coastal water habitats. The stochastic anthropogenic nutrient supplies to the coastal areas result in recurrent events of eutrophication, algal blooms (sometimes toxic), phytoplankton community shift, and depletion in aquatic oxygen concentration. As urbanization and population growth are rising, several research programs and monitoring plans are undergoing to address this global concern and to understand the root causes as well as long-term impact.
The COVID-19 pandemic-induced lockdown pave the way to an opportunity to understand and quantify the effect of anthropogenic material influx on coastal water ecology. In this regard, the present study has addressed the temporal variation in the magnitude of satellite-retrieved water quality parameters (chl-a, kd490, and POC), in the Indian coastal waters, during different phases of lockdown. The satellite (MODISA)-retrieved magnitudes of water quality parameters have provided valuable insight to efficiently describe the changes in response to the lockdown. As the North Indian Ocean exhibits seasonality in the spatio-temporal variation of water quality parameters, an anomaly-based assessment was adopted in this study to eliminate the seasonal biases. The overall results discerned a decrease in the magnitude of water quality parameters in the coastal waters of both the EAS and the WBoB during the total lockdown period (SLP and RLP). However, the reduction was more significant in the WBoB as compared with the EAS. The larger decrease in the magnitude of water quality parameters in WBoB was attributed to the reduction in the supply of anthropogenic nutrients. During SLP, the coastal waters of the WBoB showed a significant negative anomaly in the magnitude of water quality parameters, which was not the case for the EAS due to the lesser dependence on the river-borne anthropogenic material. Among different studied locations in the coastal waters of the WBoB, the magnitude of all water quality parameters significantly reduced off Chennai and Hooghly, during SLP, which subsequently increased during RLP. The coastal waters off Chennai and Hooghly showed the clear signature of lockdown attributed to the reduction in anthropogenic pollutant influx during SLP and subsequent increase during RLP. Among all the studied locations during RLP, the maximum decrease in the magnitude of water quality parameters was observed off Mahanadi followed by Mandovi-Zuari, possibly due to the higher response time of these ecosystems to reflect the reduction in anthropogenic perturbations. In general, the significant reduction in anthropogenic fluxes of nutrients, during the first phase of lockdown, could have led to the decrease in the surfeit primary production and organic matter, thus increasing the water clarity and improvement in the health of the coastal environment.
Data Availability Statement
The datasets presented in this study can be found in online repositories. The names of the repository/repositories and accession number(s) can be found below: https://oceandata.sci.gsfc.nasa.gov/MODIS-Aqua/Mapped/Daily/4km/.
Author Contributions
TMBN provided motivation to conceptualize the study. AAL conceived and conceptualized the study. AAL, RVS, and RCN downloaded and processed satellite data. AAL and AS prepared the graphical illustrations with substantial input from SKB. AAL, SKB, and AS interpreted the data. AAL and SKB prepared the first draft of the manuscript with the critical input of AS. TMBN and RVS reviewed and edited the manuscript. All authors contributed to the article and approved the submitted version.
Funding
This study has been undertaken as a part of the project entitled “Coastal Monitoring” under the umbrella of “Ocean Services, Modelling, Application, Resources and Technology (O-SMART)” scheme, sanctioned by the Indian Ministry of Earth Sciences (MoES) vide Administrative Order no. MoES/36/OOIS/CM/2019 dated May 7, 2019.
Conflict of Interest
The authors declare that the research was conducted in the absence of any commercial or financial relationships that could be construed as a potential conflict of interest.
Acknowledgments
We are thankful to the Director, Indian National Centre for Ocean Information Services (INCOIS), Ministry of Earth Sciences, Hyderabad, India, for the encouragement. We wish to acknowledge the NASA-GSFC for providing satellite data of MODIS and the development team of SeADAS. We also acknowledge RStudio for processing satellite data. This is INCOIS contribution no. 406.
Footnotes
References
Adwibowo, A. (2020). Does social distancing have an effect on water quality? An evidence from Chlorophyll-a level in the water of populated Southeast Asian coasts. Preprints. doi: 10.20944/preprints202005.0091.v1
Banse, K. (1987). Seasonality of phytoplankton chlorophyll in the central and northern Arabian Sea. Deep Sea Res. Part A Oceanogr. Res. Pap. 34, 713–723. doi: 10.1016/0198-0149(87)90032-x
Bharathi, M. D., Sarma, V. V. S. S., Ramaneswari, K., and Venkataramana, V. (2018). Influence of river discharge on abundance and composition of phytoplankton in the western coastal Bay of Bengal during peak discharge period. Mar. Pollut. Bull. 133, 671–683. doi: 10.1016/j.marpolbul.2018.06.032
Cascella, M., Rajnik, M., Cuomo, A., Dulebohn, S. C., and Di Napoli, R. (2020). Features, Evaluation and Treatment Coronavirus (COVID-19). In Statpearls [internet]. Treasure Island, FL: StatPearls Publishing.
Cherif, E. K., Vodopivec, M., Mejjad, N., Esteves da Silva, J. C., Simonoviè, S., and Boulaassal, H. (2020). COVID-19 pandemic consequences on coastal water quality using WST Sentinel-3 Data: case of Tangier. Morocco. Water 12:2638. doi: 10.3390/w12092638
Diaz, R. J., and Rosenberg, R. (2008). Spreading dead zones and consequences for marine ecosystems. Science 321, 926–929. doi: 10.1126/science.1156401
Drupp, P., De Carlo, E. H., Mackenzie, F. T., Bienfang, P., and Sabine, C. L. (2011). Nutrient inputs, phytoplankton response, and CO2 variations in a semi-enclosed subtropical embayment, Kaneohe Bay, Hawaii. Aquat. Geochem. 17, 473–498. doi: 10.1007/s10498-010-9115-y
Edward, J. P., Jayanthi, M., Malleshappa, H., Jeyasanta, K. I., Laju, R. L., Patterson, J., et al. (2021). COVID-19 lockdown improved the health of coastal environment and enhanced the population of reef-fish. Mar. Pollut. Bull. 165:112124. doi: 10.1016/j.marpolbul.2021.112124
Garg, V., Aggarwal, S. P., and Chauhan, P. (2020). Changes in turbidity along Ganga River using Sentinel-2 satellite data during lockdown associated with COVID-19. Geomatics Nat. Hazards Risk 11, 1175–1195. doi: 10.1080/19475705.2020.1782482
Gattuso, J. P., Frankignoulle, M., and Wollast, R. (1998). Carbon and carbonate metabolism in coastal aquatic ecosystems. Annu. Rev. Ecol. Systemat. 29, 405–434. doi: 10.1146/annurev.ecolsys.29.1.405
Gomes, H. R., Goes, J. I., and Saino, T. (2000). Influence of physical processes and freshwater discharge on the seasonality of phytoplankton regime in the Bay of Bengal. Cont. Shelf Res. 20, 313–330. doi: 10.1016/s0278-4343(99)00072-2
Gopal, V., Shanmugasundaram, A., Nithya, B., Magesh, N. S., and Jayaprakash, M. (2018). Water quality of the Uppanar estuary, Southern India: implications on the level of dissolved nutrients and trace elements. Mar. Pollut. Bull. 130, 279–286. doi: 10.1016/j.marpolbul.2018.03.046
Hader, D. P., Banaszak, A. T., Villafañe, V. E., Narvarte, M. A., González, R. A., and Helbling, E. W. (2020). Anthropogenic pollution of aquatic ecosystems: emerging problems with global implications. Sci. Tot. Environ. 713:136586. doi: 10.1016/j.scitotenv.2020.136586
Howden, S. D., and Murtugudde, R. (2001). Effects of river inputs into the Bay of Bengal. J. Geophys. Res. Oceans 106, 19825–19843. doi: 10.1029/2000jc000656
Hu, C., Lee, Z., and Franz, B. (2012). Chlorophyll-a algorithms for oligotrophic oceans: a novel approach based on three-band reflectance difference. J. Geophys. Res. 117:C01011. doi: 10.1029/2011jc007395
Kahru, M., Kudela, R. M., Anderson, C. R., Manzano-Sarabia, M., and Mitchell, B. G. (2014). Evaluation of satellite retrievals of ocean chlorophyll-a in the California Current. Rem. Sens. 6, 8524–8540. doi: 10.3390/rs6098524
Kim, H. C., Son, S., Kim, Y. H., Khim, J. S., Nam, J., Chang, W. K., et al. (2017). Remote sensing and water quality indicators in the Korean West coast: Spatio-temporal structures of MODIS-derived chlorophyll-a and total suspended solids. Mar. Pollut. Bull. 121, 425–434. doi: 10.1016/j.marpolbul.2017.05.026
Kone, V., Aumont, O., Lévy, M., and Resplandy, L. (2009). Physical and biogeochemical controls of the phytoplankton seasonal cycle in the Indian Ocean: a modeling study. Indian ocean biogeochemical processes and ecological variability. Geophys. Monogr. Ser. 185:350.
Kratzer, S., Hakansson, B., and Sahlin, C. (2003). Assessing Secchi and photic zone depth in the Baltic Sea from satellite data. Ambio 32, 577–585. doi: 10.1579/0044-7447-32.8.577
Kumar, P. S., Kumaraswami, M., Rao, G. D., Ezhilarasan, P., Sivasankar, R., Rao, V. R., et al. (2018). Influence of nutrient fluxes on phytoplankton community and harmful algal blooms along the coastal waters of southeastern Arabian Sea. Cont. Shelf Res. 161, 20–28. doi: 10.1016/j.csr.2018.04.012
Kumar, S. P., Nuncio, M., Ramaiah, N., Sardesai, S., Narvekar, J., Fernandes, V., et al. (2007). Eddy-mediated biological productivity in The Bay Of Bengal during fall and spring intermonsoons. Deep Sea Res. Part I Oceanogr. Res. Pap. 54, 1619–1640. doi: 10.1016/j.dsr.2007.06.002
Lee, Z. P., Du, K. P., and Arnone, R. (2005). A model for the diffuse attenuation coefficient of downwelling irradiance. J. Geophys. Res. Oceans 110:C02016. doi: 10.1029/2004JC002275
Lokhandwala, S., and Gautam, P. (2020). Indirect impact of COVID-19 on environment: A brief study in Indian context. Environ. Res. 188:109807. doi: 10.1016/j.envres.2020.109807
Mishonov, A. V., Gardner, W. D., and Richardson, M. J. (2003). Remote sensing and surface POC concentration in the South Atlantic. Deep Sea Res. Part II Top. Stud. Oceanogr. 50, 2997–3015. doi: 10.1016/j.dsr2.2003.07.007
Mishra, D. R., Kumar, A., Muduli, P. R., Equeenuddin, S., Rastogi, G., Acharyya, T., et al. (2020). Decline in phytoplankton biomass along Indian Coastal waters due to COVID-19 Lockdown. Remote Sens. 12:2584. doi: 10.3390/rs12162584
Mishra, P., Panda, U. S., Pradhan, U., Kumar, C. S., Naik, S., Begum, M., et al. (2015). Coastal water quality monitoring and modelling off Chennai city. Proc. Eng. 116, 955–962. doi: 10.1016/j.proeng.2015.08.386
Muhammad, S., Long, X., and Salman, M. (2020). COVID-19 pandemic and environmental pollution: a blessing in disguise? Sci. Total Environ. 728:138820. doi: 10.1016/j.scitotenv.2020.138820
Ni, H. G., Lu, F. H., Luo, X. L., Tian, H. Y., and Zeng, E. Y. (2008). Riverine inputs of total organic carbon and suspended particulate matter from the Pearl River Delta to the coastal ocean off South China. Mar. Pollut. Bull. 56, 1150–1157. doi: 10.1016/j.marpolbul.2008.02.030
O’Reilly, J. E., Maritorena, S., Mitchell, B. G., Siegel, D. A., Carder, K. L., Garver, S. A., et al. (1998). Ocean color chlorophyll algorithms for SeaWiFS. J. Geophys. Res. 103, 24937–24953. doi: 10.1029/98jc02160
O’Reilly, J. E., Maritorena, S., O’Brien, M. C., Siegel, D. A., Toole, D., Menzies, D., et al. (2000a). SeaWiFS Postlaunch Calibration and Validation Analyses, Part 3. NASA Tech. Memo. 2000-206892, Vol. 11, eds S. B. Hooker and E. R. Firestone (Maryland: NASA Goddard Space Flight Center), 49.
O’Reilly, J. E., Maritorena, S., Siegel, D. A., O’Brien, M. C., Toole, D., Mitchell, B. G., et al. (2000b). Ocean Color Chlorophyll a Algorithms for SeaWiFS, OC2, and OC4: Version 4. SeaWiFS Postlaunch Calibration and Validation Analyses, Part, 3. Greenbelt, MD: NASA Goddard Space Flight Center, 9–23.
Pal, N., Barman, P., Das, S., Zaman, S., and Mitra, A. (2020). Status of brackish water phytoplankton during COVID-19 lockdown phase. NUJS J. Regulatory Stud. 75–78.
Patel, P. P., Mondal, S., and Ghosh, K. G. (2020). Some respite for India’s dirtiest river? Examining the Yamuna’s water quality at Delhi during the COVID-19 lockdown period. Sci. Total Environ. 744:140851. doi: 10.1016/j.scitotenv.2020.140851
Sarma, V. V. S. S., Krishna, M. S., and Srinivas, T. N. R. (2020). Sources of organic matter and tracing of nutrient pollution in the coastal Bay of Bengal. Mar. Pollut. Bull. 159:111477. doi: 10.1016/j.marpolbul.2020.111477
Satheesh, S. (2020). The pandemic does not stop the pollution in River Periyar. Interface J. Soc. Mov. 12, 250–257.
Sattar, M. A., Kroeze, C., and Strokal, M. (2014). The increasing impact of food production on nutrient export by rivers to the Bay of Bengal 1970–2050. Mar. Pollut. Bull. 80, 168–178. doi: 10.1016/j.marpolbul.2014.01.017
Schlitzer, R. (2002). Ocean Data View. Available online at: https://odv.awi.de/ (accessed December 2, 2020).
Scott, J. P., and Werdell, P. J. (2019). Comparing level-2 and level-3 satellite ocean color retrieval validation methodologies. Opt. Express 27, 30140–30157. doi: 10.1364/oe.27.030140
Seitzinger, S. P., Mayorga, E., Bouwman, A. F., Kroeze, C., Beusen, A. H. W., Billen, G., et al. (2010). Global river nutrient export: a scenario analysis of past and future trends. Global Biogeochem. Cy 24:GB0A08. doi: 10.1029/2009GB003587
Sengupta, T., Pramanick, P., and Mitra, A. (2020). Nutrient load in the River Ganges during the COVID-19 lockdown phase: a ground zero observation. NUJS J. Regulatory Stud. 79–83.
Shanmugam, P., Neelamani, S., Ahn, Y. H., Philip, L., and Hong, G. H. (2007). Assessment of the levels of coastal marine pollution of Chennai city, Southern India. Water Resour. Manag. 21, 1187–1206. doi: 10.1007/s11269-006-9075-6
Shetye, S. R., Gouveia, A. D., Shankar, D., Shenoi, S. S. C., Vinayachandran, P. N., Sundar, D., et al. (1996). Hydrography and circulation in the western Bay of Bengal during the northeast monsoon. J. Geophys. Res. Oceans 101, 14011–14025. doi: 10.1029/95jc03307
Stramski, D., Reynolds, R. A., Babin, M., Kaczmarek, S., Lewis, M. R., Röttgers, R., et al. (2008). Relationships between the surface concentration of particulate organic carbon and optical properties in the eastern South Pacific and eastern Atlantic Oceans. Biogeoscinces 5, 171–201. doi: 10.5194/bg-5-171-2008
Thomas, L. C., Padmakumar, K. B., Smitha, B. R., Devi, C. A., Nandan, S. B., and Sanjeevan, V. N. (2013). Spatio-temporal variation of microphytoplankton in the upwelling system of the south-eastern Arabian Sea during the summer monsoon of 2009. Oceanologia 55, 185–204. doi: 10.5697/oc.55-1.185
Tilstone, G. H., Lotliker, A. A., Miller, P. I., Ashraf, P. M., Kumar, T. S., Suresh, T., et al. (2013). Assessment of MODIS-Aqua chlorophyll-a algorithms in coastal and shelf waters of the eastern Arabian Sea. Cont. Shelf Res. 65, 14–26. doi: 10.1016/j.csr.2013.06.003
Verlecar, X. N., Desai, S. R., Sarkar, A., and Dalal, S. G. (2006). Biological indicators in relation to coastal pollution along Karnataka coast, India. Water Res. 40, 3304–3312. doi: 10.1016/j.watres.2006.06.022
Vinayachandran, P. N. (2009). Impact of physical processes on chlorophyll distribution in the Bay of Bengal. Indian Ocean Biogeochemical Processes and Ecological Variability. Geophys. Monogr. Ser. 185, 71–86. doi: 10.1029/2008gm000705
Worldometers.info (2020). Worldometers.info. Coronavirus Updates. Available online at: https://www.worldometers.info/ (accessed December 10, 2020).
Yunus, A. P., Masago, Y., and Hijioka, Y. (2020). COVID-19 and surface water quality: Improved lake water quality during the lockdown. Sci. Tot. Environ. 731:139012. doi: 10.1016/j.scitotenv.2020.139012
Keywords: satellite, anthropogenic discharge, chlorophyll-a, POC, Kd490, Bay of Bengal, Arabian Sea, COVID-19
Citation: Lotliker AA, Baliarsingh SK, Shesu RV, Samanta A, Naik RC and Balakrishnan Nair TM (2021) Did the Coronavirus Disease 2019 Lockdown Phase Influence Coastal Water Quality Parameters off Major Indian Cities and River Basins? Front. Mar. Sci. 8:648166. doi: 10.3389/fmars.2021.648166
Received: 31 December 2020; Accepted: 08 March 2021;
Published: 01 April 2021.
Edited by:
Deepak R. Mishra, University of Georgia, United StatesReviewed by:
Haimanti Biswas, Council of Scientific and Industrial Research (CSIR), IndiaAbhishek Kumar, University of Georgia, United States
Copyright © 2021 Lotliker, Baliarsingh, Shesu, Samanta, Naik and Balakrishnan Nair. This is an open-access article distributed under the terms of the Creative Commons Attribution License (CC BY). The use, distribution or reproduction in other forums is permitted, provided the original author(s) and the copyright owner(s) are credited and that the original publication in this journal is cited, in accordance with accepted academic practice. No use, distribution or reproduction is permitted which does not comply with these terms.
*Correspondence: Aneesh Anandrao Lotliker, aneesh@incois.gov.in