A Fish Chorus on the Margin of New Jersey Atlantic Continental Shelf
 Qianchu Zhang
 Boris Katsnelson
- Department of Marine Geosciences, University of Haifa, Haifa, Israel
We report herein an underwater biological chorus coming from the margin of the New Jersey Atlantic continental shelf that we tentatively attribute to a species of fish. The chorus occurred every night for over a month during the Shallow Water 2006 experiment and covers the frequency band 150–4,800 Hz, with maximum intensity in the band from 1450 to 2,000 Hz. Remarkable intensity peaks occurred at 500, 725, 960, 1,215, 1,465, 1,700, and 1,920 Hz, rising to as much as 20 dB above the background noise without the chorus. The chorus begins at sunset and reaches its maximum intensity within an hour, following which it weakens slightly and then gradually climbs again to a peak before sunrise, at which point it quickly weakens and disappears. Its frequency-domain characteristics and the nocturnal timing are reminiscent of sound produced by underwater animals. The intensity of the chorus weakens along the across-shelf path going shoreward, which indicates that the chorus originates from the margin of the continental shelf rather than from the coastal zone, as is generally considered. The chorus contains a single type of acoustic signal that takes the form of double-pulse bursts that last about 8.7 ms, with each pulse containing several acoustic cycles. The time interval between successive bursts varies from 1.5 to 1.9 s. Signals containing a number of bursts vary in length from tens to hundreds of seconds. Although it is impossible to determine the fish species responsible for the chorus, its characteristics, including its low frequency and intensity, its single type of short-duration sound signal, and its multiple peaks in the frequency domain, are all consistent with the general characteristics of fish sounds.
Introduction
Ocean noise is the background sound field in the ocean, which is continuous and ubiquitous, and diverse sources of noise exist, including man-made and natural sources. Underwater biological sounds are important instantaneous noise, especially in biological gathering areas, such as coral reefs, where biological sounds form an important part of the local soundscape. Numerous marine animals can produce sounds, including marine mammals, invertebrates, and fish (Coquereau et al., 2016; Gervaise et al., 2019). Bio-noise varies widely in the time and frequency domains, and temporal and spatial distributions (Etter, 2018). A “chorus” is defined as three or more animals making calls that overlap or are produced in rapid succession (Cato, 1978; Greenfield and Shaw, 1983; D’Spain and Batchelor, 2006; McCauley and Cato, 2016; Rice et al., 2017). For example, fish could vocalize together, forming a chorus. The individual voices can superimpose upon each other, significantly increasing the acoustic intensity over a relatively wide frequency band for a few hours (Erbe et al., 2015). Fish choruses could be the dominant component of the local ocean noise.
Reports of marine animals creating sounds appeared historically in the scientific literature, but vigorous research on underwater biological noise began in World War II (D’Spain and Batchelor, 2006; Kasumyan, 2008; Lindseth and Lobel, 2018). The symposium on marine bioacoustics in 1963 further promoted research into biological noise (Tavolga, 1964; Kasumyan, 2008). However, current reports on biological sounds (invertebrates and fish sounds, except for marine mammals (Erbe et al., 2017), mainly involved shallow waters such as coral reefs and coastal waters or shallow continental shelves (Freeman et al., 2014; McCauley and Cato, 2016; Sánchez-Gendriz and Padovese, 2017b; Archer et al., 2018). After an anatomical survey in the 1950s, the importance of sound communication in the ecology of deep-sea fish became substantially clearer (Marshall, 1954, 1967). Based on this research, it was further hypothesized that sound production was common in bottom fish on the continental slope (Marshall, 1954, 1967; Wall et al., 2014). Since then, reports had appeared of sound produced by deep-sea fish in various non-coastal waters. Fish at the continental margin and in the deep sea can also produce sound, but such choruses, which significantly impacted the ocean soundscape, were rarely reported in the literature. McCauley and Cato (2016) believed that this was likely due to the lack of sampling or the inability to determine the source of the sound, not because of the lack of choruses (Mann and Jarvis, 2004; McCauley and Cato, 2016).
Deep-sea fish sounds have frequently been recorded in various ocean zones. Mann and Jarvis (2004) localized a biological sound to a depth of 548–696 m in the Tongue of the Ocean off Andros Island, Bahamas, where depth was 1,620 m. Given that the sound was pulsed and of relatively low frequency, they tentatively attributed it to deep-sea fish. Rountree et al. (2012) used a deep-water autonomous underwater listening system to make a 24-h recording on the seafloor at 682 m depth in Welkers Canyon located south of Georges Bank. They recorded numerous biological sounds: in addition to several sounds produced by certain cetaceans and dolphins, they recorded at least 12 unique unidentified sounds that were believed to be produced by fish or cetaceans. Carrico et al. (2019, 2020) recorded biological sounds using Ecological Acoustic Recorders bottom-moored 5–10 m from the Condor seamount at an approximate depth of 190 m and on the seafloor at a depth of 36 m in Princess Alice Bank. Although the Azores hosted a wealth of fish species, only 20 species from 14 families had been reported, and at least 79 species from 24 families were potential sound producers. In the Canadian waters of the Northeast Pacific, sounds from deep-sea fish were recorded by the North East Pacific Time-Series Undersea Networked Experiment (NEPTUNE), which was part of the Ocean Networks Canada Observatory. The system was located on the seafloor about 1 km off the west coast of Vancouver Island at a depth of almost 1000 m. The system also had three NEPTUNE-Canada cameras (Širović et al., 2012; Doya et al., 2014; Wall et al., 2014). In addition to baleen whales and odontocetes, numerous broadband pulsed signals were recorded, which may be produced by fish. In addition to the sounds known to be produced by sablefish (Anoplopoma fimbria), many unknown sounds were recorded. Wall et al. (2014) presented 32 possible sources for these sounds, not all of which were attributed to fish. Doya et al. (2014) argued that the biological sounds in this area did not follow day-night or tidal-based rhythms.
Only a few fish choruses from continental margins and deep sea have been detected. Non-coastal biological noise has also been reported from the Pacific Ocean off California. These seas also hosted fish choruses in addition to the sounds produced by individual fish. McDonald et al. (2006) undertook long-term continuous observations in the waters west of San Nicolas Island, California, at a depth of 1,090 m. The experiment was done at the same location as in the 1960s, which allowed a comparison of the deep-sea ambient noise. The 1960s experiment recorded a diel pattern of 10–20 dB variation in the frequency band 80–300 Hz, but McDonald et al. (2006) did not observe a diel pattern. At 315 Hz, the sound pressure spectrum from 2003 to 2004 was greater than that from 1964 to 1965, even when the noise was stronger at night. The strong noise background may have masked the diel pattern or altered the fish sounds related to reproductive and predatory behavior, thereby deteriorating the undersea environment, reducing the abundance of the fish, and leading to the disappearance of the diel pattern. Although no diel pattern had been detected in fish choruses, occasional “fish bumps” or brief impulsive sounds of unknown origin had been detected. At a depth of 175 m, 35 km southeast of San Clemente Island, a biological chorus was detected by D’Spain and Batchelor (2006), who deployed a large-vertical-aperture, 131-hydrophone, two-dimensional billboard array. The chorus energy spectrum has two broad spectral peaks centered around 1.5 and 5 kHz. The biological chorus appeared at sunset and disappeared at sunrise. No individual biological sound was detected. D’Spain and Batchelor attributed this not to a local voice but to the 43-Fathom Spot 2 km away, a popular Southern California fishing spot whose depth can exceed 75 m. Therefore, the origin of the sound remains unknown; it could be marine mammals, fish, invertebrates, or a combination thereof. Širović et al. (2009) recorded sounds with Passive-acoustic recordings at 14 locations in the Gulf of Southern California to study the sound of rockfish. The sea depth ranged from 44 to 160 m, including the 43-Fathom Spot where the duration of experiment was longest. The fish sounds at the 43-Fathom Spot were in the low frequencies (less than 900 Hz) and consisted mostly of individual sounds (i.e., no choruses), which meant that the chorus reported by D’Spain and Batchelor (2006) may not have come from the 43-Fathom Spot. Reshef et al. (2018) conducted 12 years of passive observations at 18 locations in the Gulf of Southern California and detected two important choruses in the frequency bands 100–200 and 400–800 Hz. The signals were lower in intensity at the offshore sites than at the inshore sites, which suggested that the chorus propagated from the inshore sites to the offshore sites or that the offshore sites contained fewer fish. Pagniello et al. (2019) used a Wave Glider surface vehicle to detect five types of fish choruses along the California coast and stated that the second type of chorus was the same as the 400–800 Hz chorus reported by Reshef et al. (2018). In the deep-sea waters off of Australia, several fish choruses were also detected. Cato (1978) detected biological choruses at different locations in the tropical waters near Australia at depths of 35, 640, and 1,000 m. Note that the experimental site was within 6 km of shallow water with coral reefs. The source of this biological chorus may thus be fish or sea urchins in the shallow sea. Instantaneous choruses were also detected and were composed of intense clicking sounds, apparently from sperm whales. Kelly et al. (1985) reported a 400–600 Hz nighttime biological chorus from three deep-water sites 250, 700, and 900 km from the Australian coast at depths of 1,500–5,500 m. The sounds were thought to be produced by croakers, which were fish of the family Sciaenidae and whose habitat was shallow coastal waters. However, because fish usually produced a low sound intensity and the propagation distance was limited, it was improbable that the individual sounds would be detected at a site 250 km offshore. Erbe et al. (2015) explored the marine soundscape of Perth Canyon at a depth of 430–490 m, 70 km offshore from the coast of Perth. Biological sound was an important component of the soundscape. Whales dominated seasonally at low (15–100 Hz) and mid frequencies (200–400 Hz), and fish or invertebrate choruses dominated at high frequencies. In the Perth Canyon, nighttime choruses likely due to fish were detected all year round in the range 1,000–2,500 Hz. The unknown hump at 600 Hz could be another type of fish or an invertebrate chorus. McCauley and Cato (2016) argued that the most likely source of the 2 kHz chorus in Perth Canyon was fish of the family Myctophidae foraging in the water column. They also believed some sporadic choruses existed in other locations on the Australian shelf slope.
Fish sounds are abundant in shallow water, and deep water. But fish choruses are rarely reported on the margin of the continental shelf and in deep water. However, if a chorus appears, it becomes the dominant component of ocean noise over a relatively wide frequency band for several hours of a day. This paper reports a new fish chorus appearing on the margin of the New Jersey Atlantic continental shelf and describes the characteristics of the chorus. The chorus does not originate in the coastal zone and differs from the documented biological sounds of the American Atlantic coast.
The Experiment and Data Processing
The Shallow Water 2006 experiment was performed on the New Jersey Atlantic shelf (approximately 100 miles east of the New Jersey coast) and lasted from mid-July to mid-September 2006 (Newhall et al., 2007). The experiment deployed a total of 62 acoustic and oceanographic moorings in a “T” geometry along the shelf path following 80 m isobaths and across the shelf path starting at a depth of 600 m and going shoreward to a depth of 60 m. Among the moorings, five Single Hydrophone Receiving Units (SHRUs) were positioned across the shelf path in the sequence SHRU2, SHRU1, SHRU3, SHRU4, and SHRU5 at depths of 107, 85, 83, 67, and 65 m, respectively (see Figure 1). The SHRUs were all deployed 7 m above the seafloor.
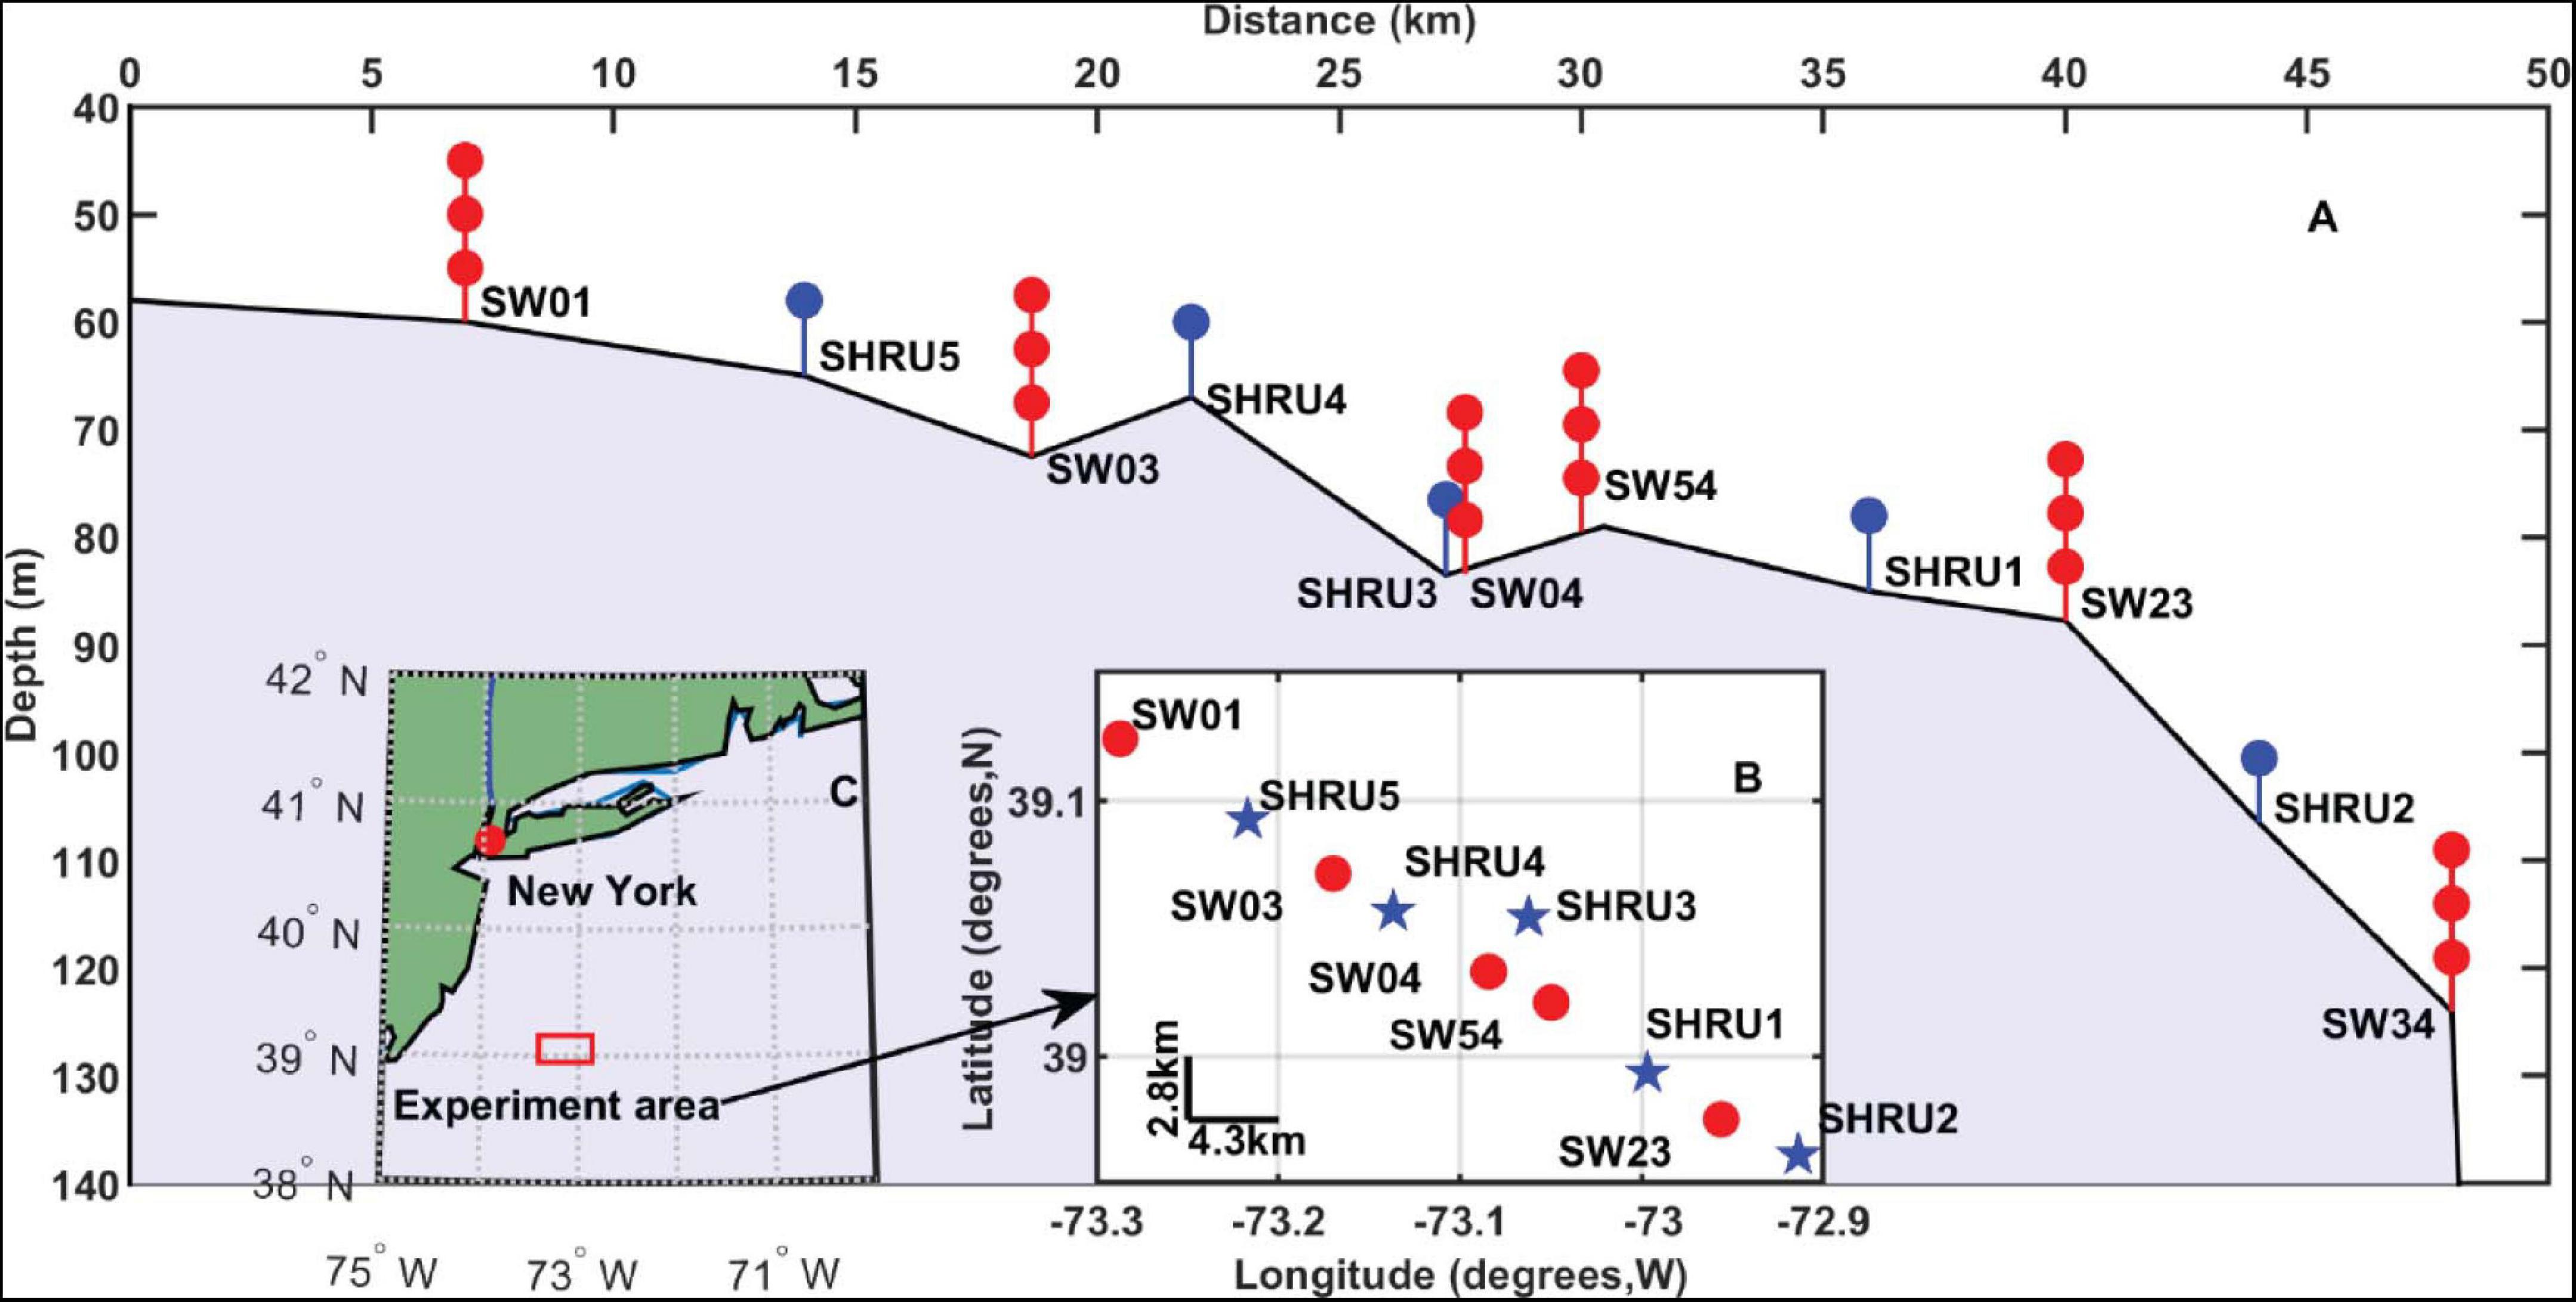
Figure 1. (A) The depth of SHRUs and other moorings. The orientation from SW01 to SHRU2 is in a southeast trajectory as shown in (B). (B) The location of SHRUs and other moorings. (C) The experiment area.
The SHRU sampling frequency was 9765.625 Hz, the flat passband was 4,424 Hz, the -3 dB frequency was 4,785 Hz, the passband ripple was 0.005 dB, and the sensitivity was 170 dB re 1 μPa per 1 volt. The SHRUs were active over differing periods of time: SHRU2, SHRU1, SHRU3, SHRU4, and SHRU5 started recording at 14:18 on July 26, 11:07 on July 26, 20:41 on July 28, 14:42 on July 29 and 19:04 on July 29, 2006, respectively, and ended at 08:25 on August 31, 05:22 on August 31, 14:32 on September 2, 09:14 on September 3 and 13:25 on September 4, 2006, respectively. This study uses Universal Time Coordinated (UTC). Local time is obtained by subtracting 4 h from UTC (Newhall et al., 2007).
All data are processed using MATLAB (The MathWorks, Inc.). To understand the characteristics in the frequency domain, Fourier transform is performed on the noise data to produce the power spectral density (PSD). In the computational process, the data is not selected, which contains various signals and unknown interferences. To calculate the PSD, each segment has 8192 points for the Fourier transform with a gate window. The PSD has a 50% overlap, and the frequency resolution is 1.192 Hz. In addition, the PSD is averaged over different time intervals, allowing it to distinguish variations in noise from different sources over time (McCauley and Cato, 2016). Based on the PSD, the spectral probability density (SPD) is calculated in the form of normalized histograms of decibel levels in each frequency bin. The SPD can be used to evaluate the tonal contribution of different components of marine noise, and the percentiles can reveal the underlying distribution of noise intensity (Merchant et al., 2013; Archer et al., 2018).
Results
All soundscapes recorded at the experimental site by the SHRUs vary periodically with a period of 1 day. The noise intensity in this area increases at sunset and diminishes at sunrise. At nighttime, a host of indistinguishable signals form a sort of biological chorus with clear and stable characteristics in time and frequency domains and distributions in time and space.
The sound PSD is calculated and averaged over an hour to obtain the spectrogram of the sound field. Figure 2 shows the time-frequency distribution of the sound recorded by SHRU2 from July 26 to July 31 and from August 26 to August 31, 2006: the sound field clearly varies in a diel pattern. Because no interference is cut out, all kinds of noise and the acoustic signals emitted in this experiment are also available from Figure 2. For example, signals at 300 and 400 Hz are detected for several minutes every half hour and become continuous in Figure 2 after averaging over an hour. However, here only the diel pattern is focused on and other sounds or noise are not described.
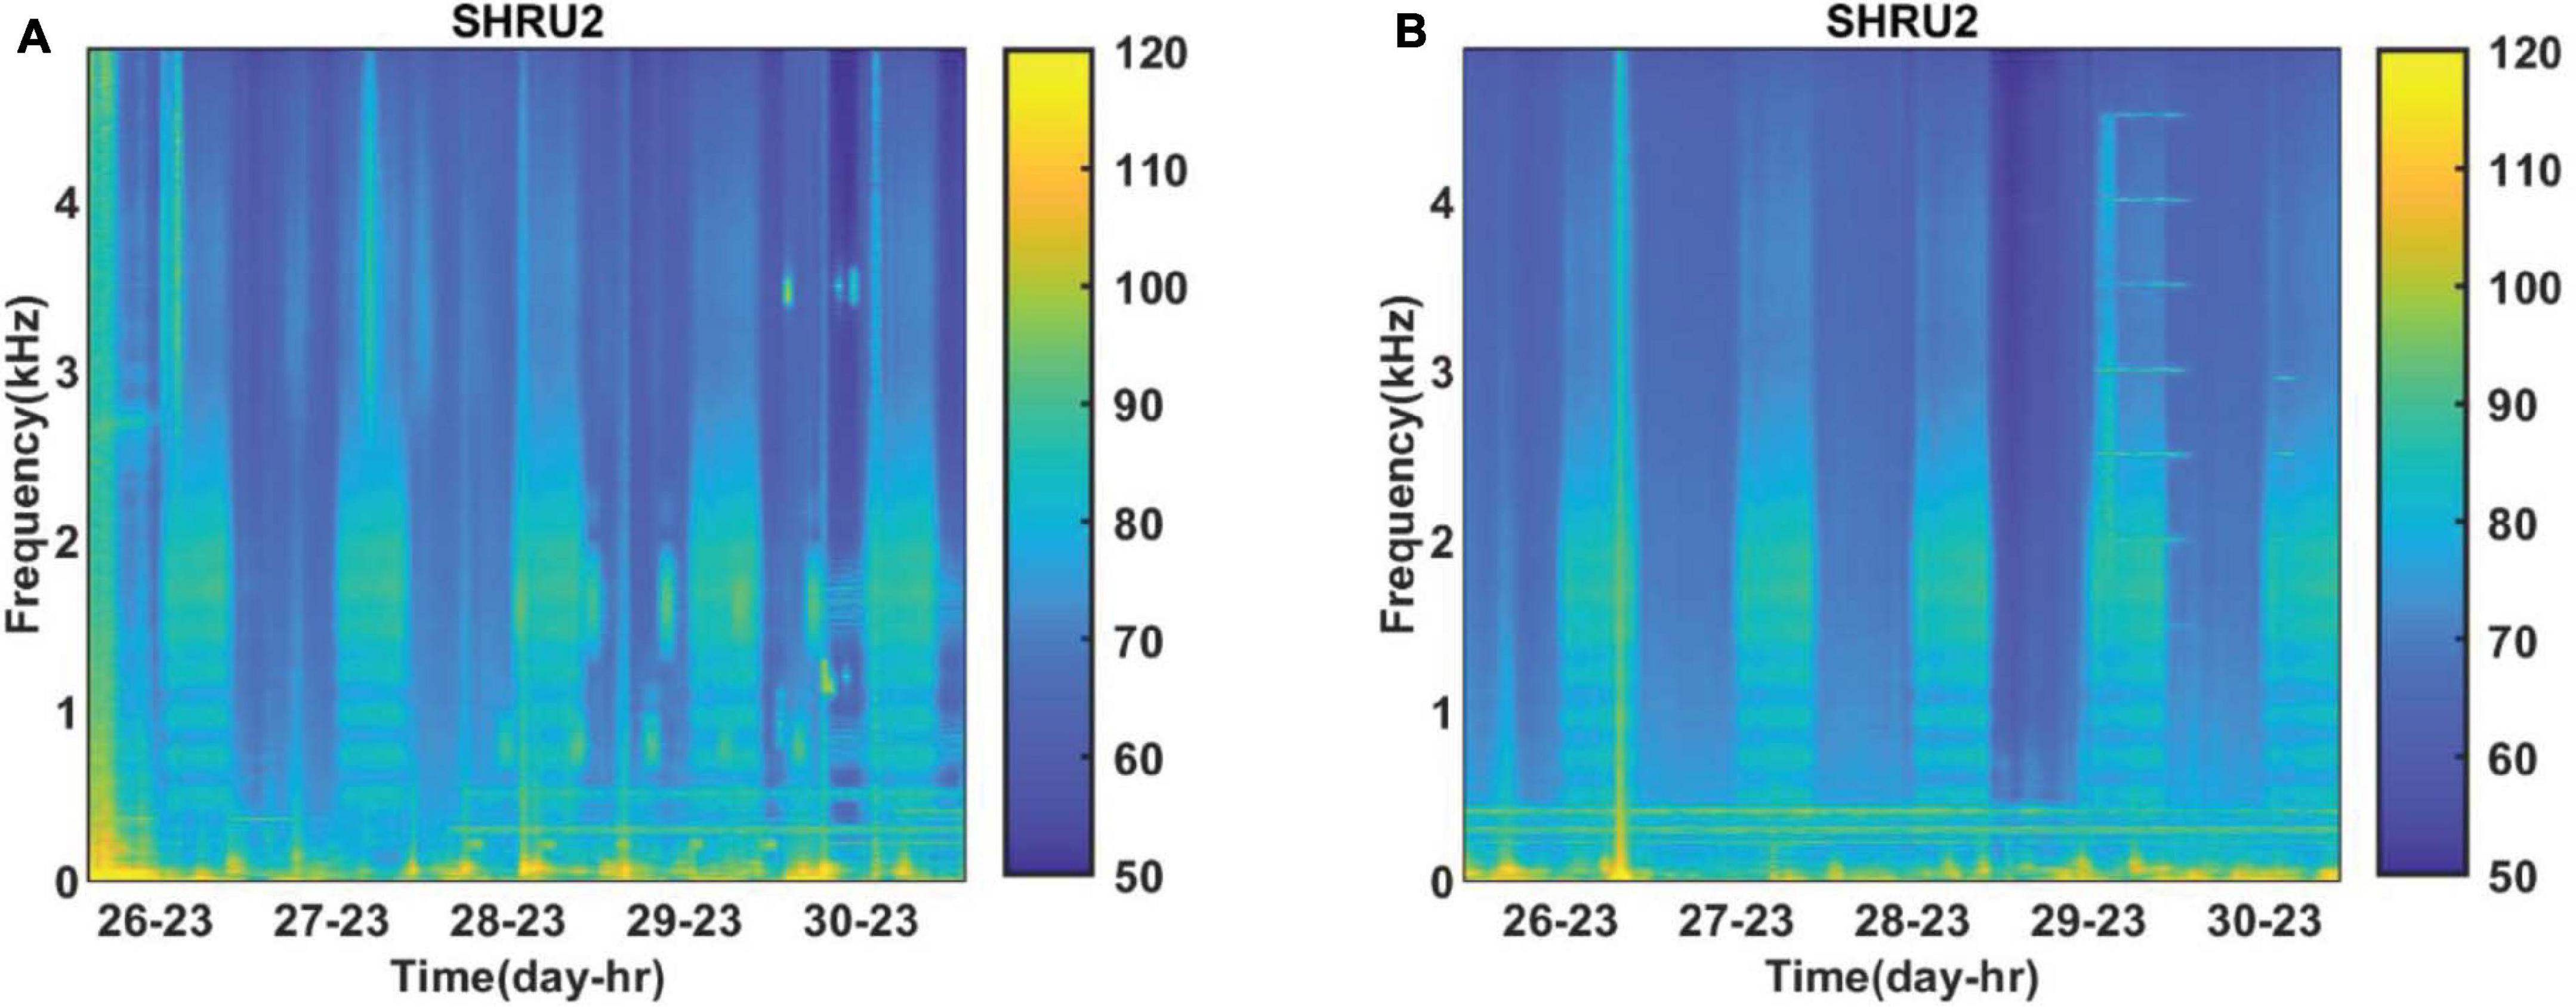
Figure 2. Spectrograms of sound field recorded by SHRU2 (A) from July 26 to July 31 and (B) from August 26 to August 31. Each segment had 8,192 points for the Fourier transform with a gate window and a 50% overlap. Then it is averaged over 1 h.
To calculate the PSD, we select 1,280 s of sound data from both the daytime and the nighttime on August 28. The method is the same as described above, but without averaging. Figure 3 shows the time-frequency distributions of daytime and nighttime sound field. Figure 4 shows the average daytime and nighttime PSD from Figure 3. At night, the soundscape intensity increases significantly above about 150 Hz and reaches the strongest at around 1,700 Hz. During the day, this difference reduces to around 20 dB. In addition, the chorus spectral peaks at 500, 725, 960, 1,215, 1,465, 1,700, and 1,920 Hz. The difference between adjacent peaks is 220–255 Hz, which is not uniformly distributed.
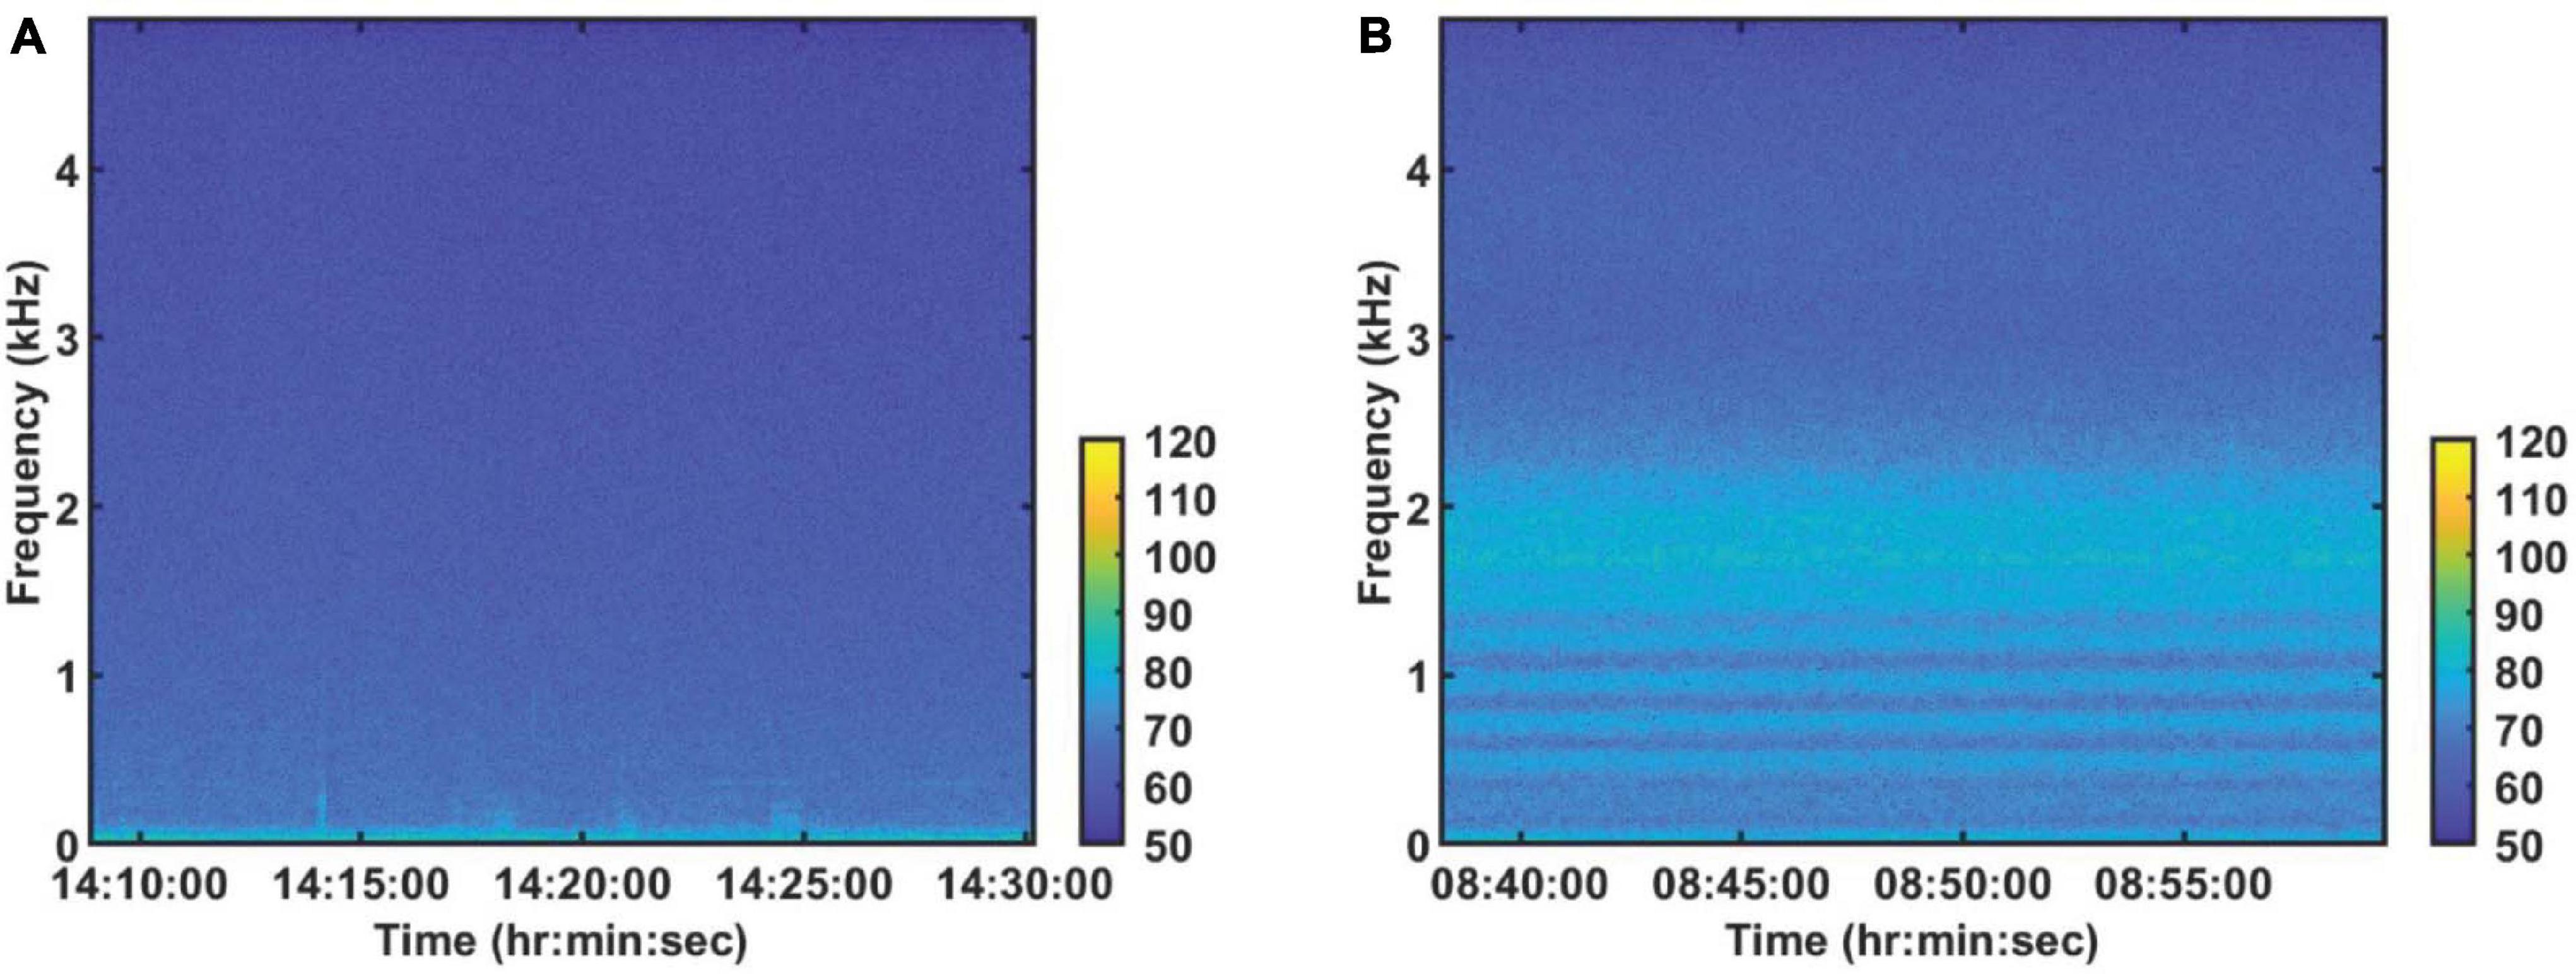
Figure 3. Spectrogram of 1280 s of sound on August 28, 2006 (A) in the daytime (Supplementary Audio 1) and (B) nighttime (Supplementary Audio 2). Each segment had 8192 points for the Fourier transform with a gate window and a 50% overlap.
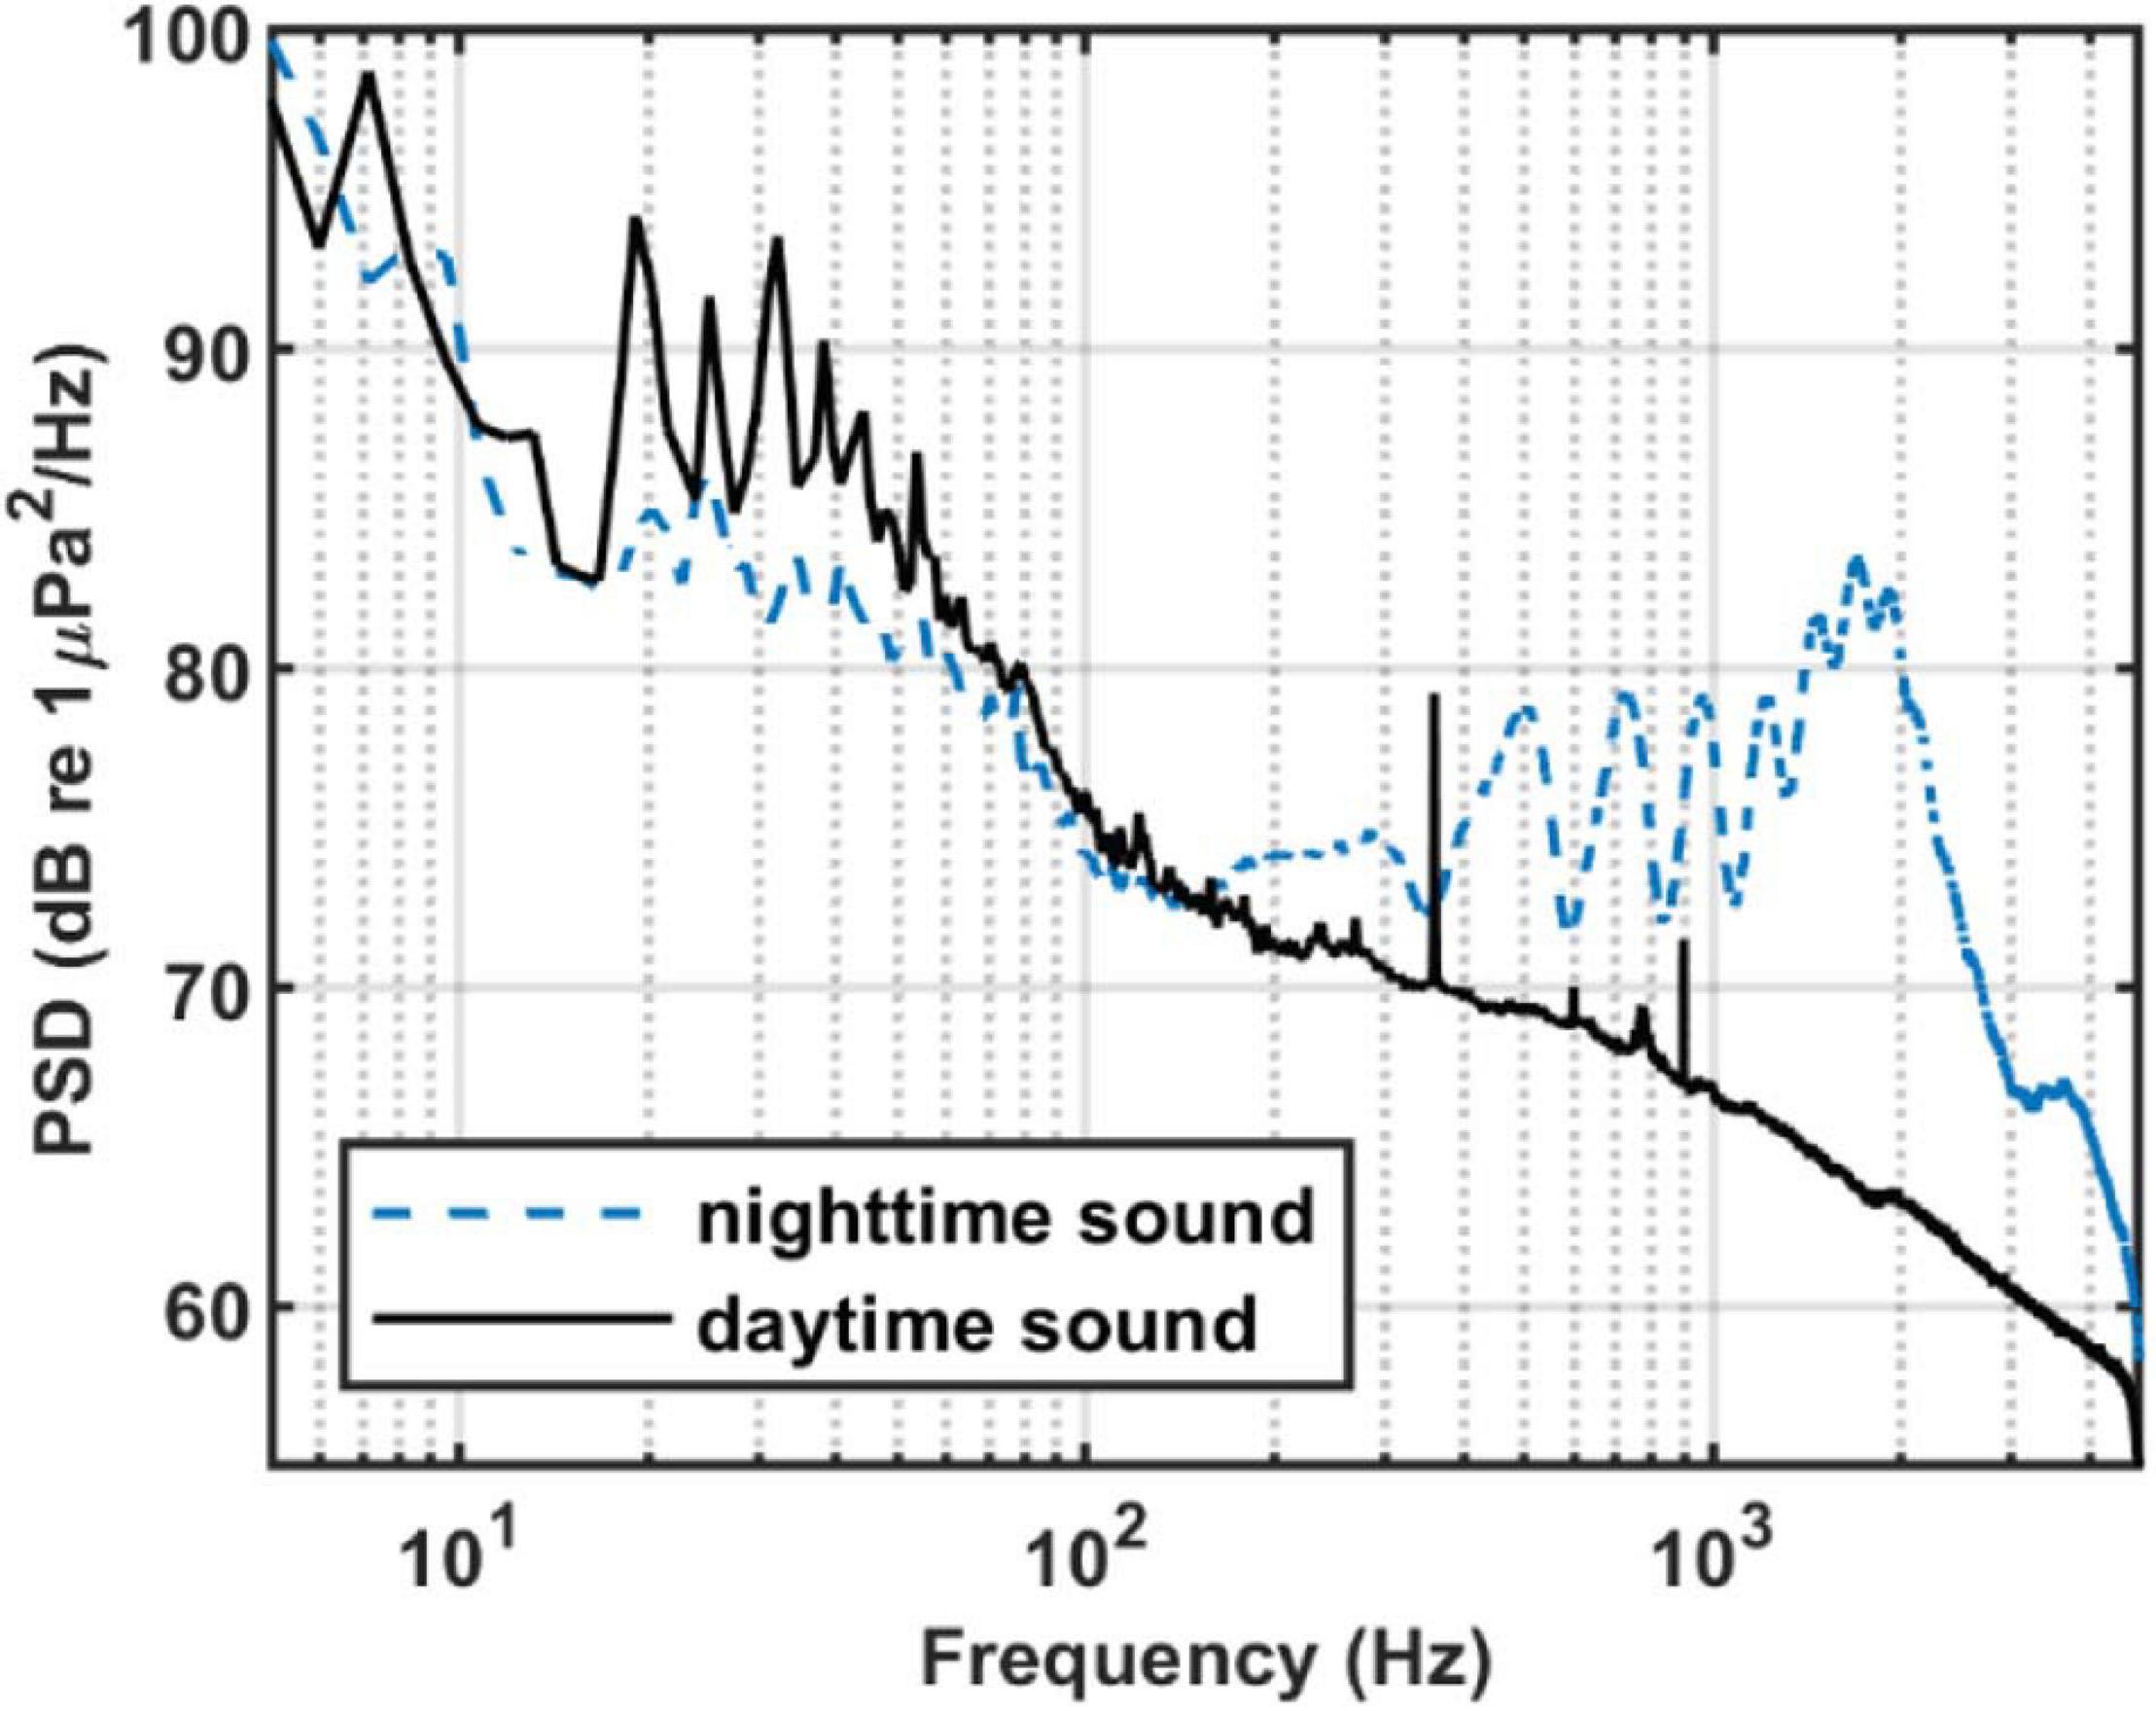
Figure 4. PSD of nighttime and daytime sound. Each segment had 8,192 points for the Fourier transform with a gate window and a 50% overlap. Then it is averaged in 1,280 s. Blue dash line: The averaged PSD in Figure 3B. Black solid line: The averaged PSD in Figure 3A.
Figure 5 shows the SPD calculated from the 1-h-averaged PSD. The frequency interval is 1.192 Hz, and the histogram bin width is 1 dB. Above 150 Hz, the SPD distribution of each frequency has two peaks. As for the spectral distribution shown in Figure 4, these two peaks correspond to the distribution of the daytime and nighttime soundscapes. The nighttime soundscape is more concentrated and dense, whereas the daytime soundscape is more scattered. No double peaks appear below 150 Hz. In addition, the black curves of percentiles fluctuate rapidly in some frequency bands, which corresponds to signals detected during the experiment at, e.g., 300 and 400 Hz in Figure 5.
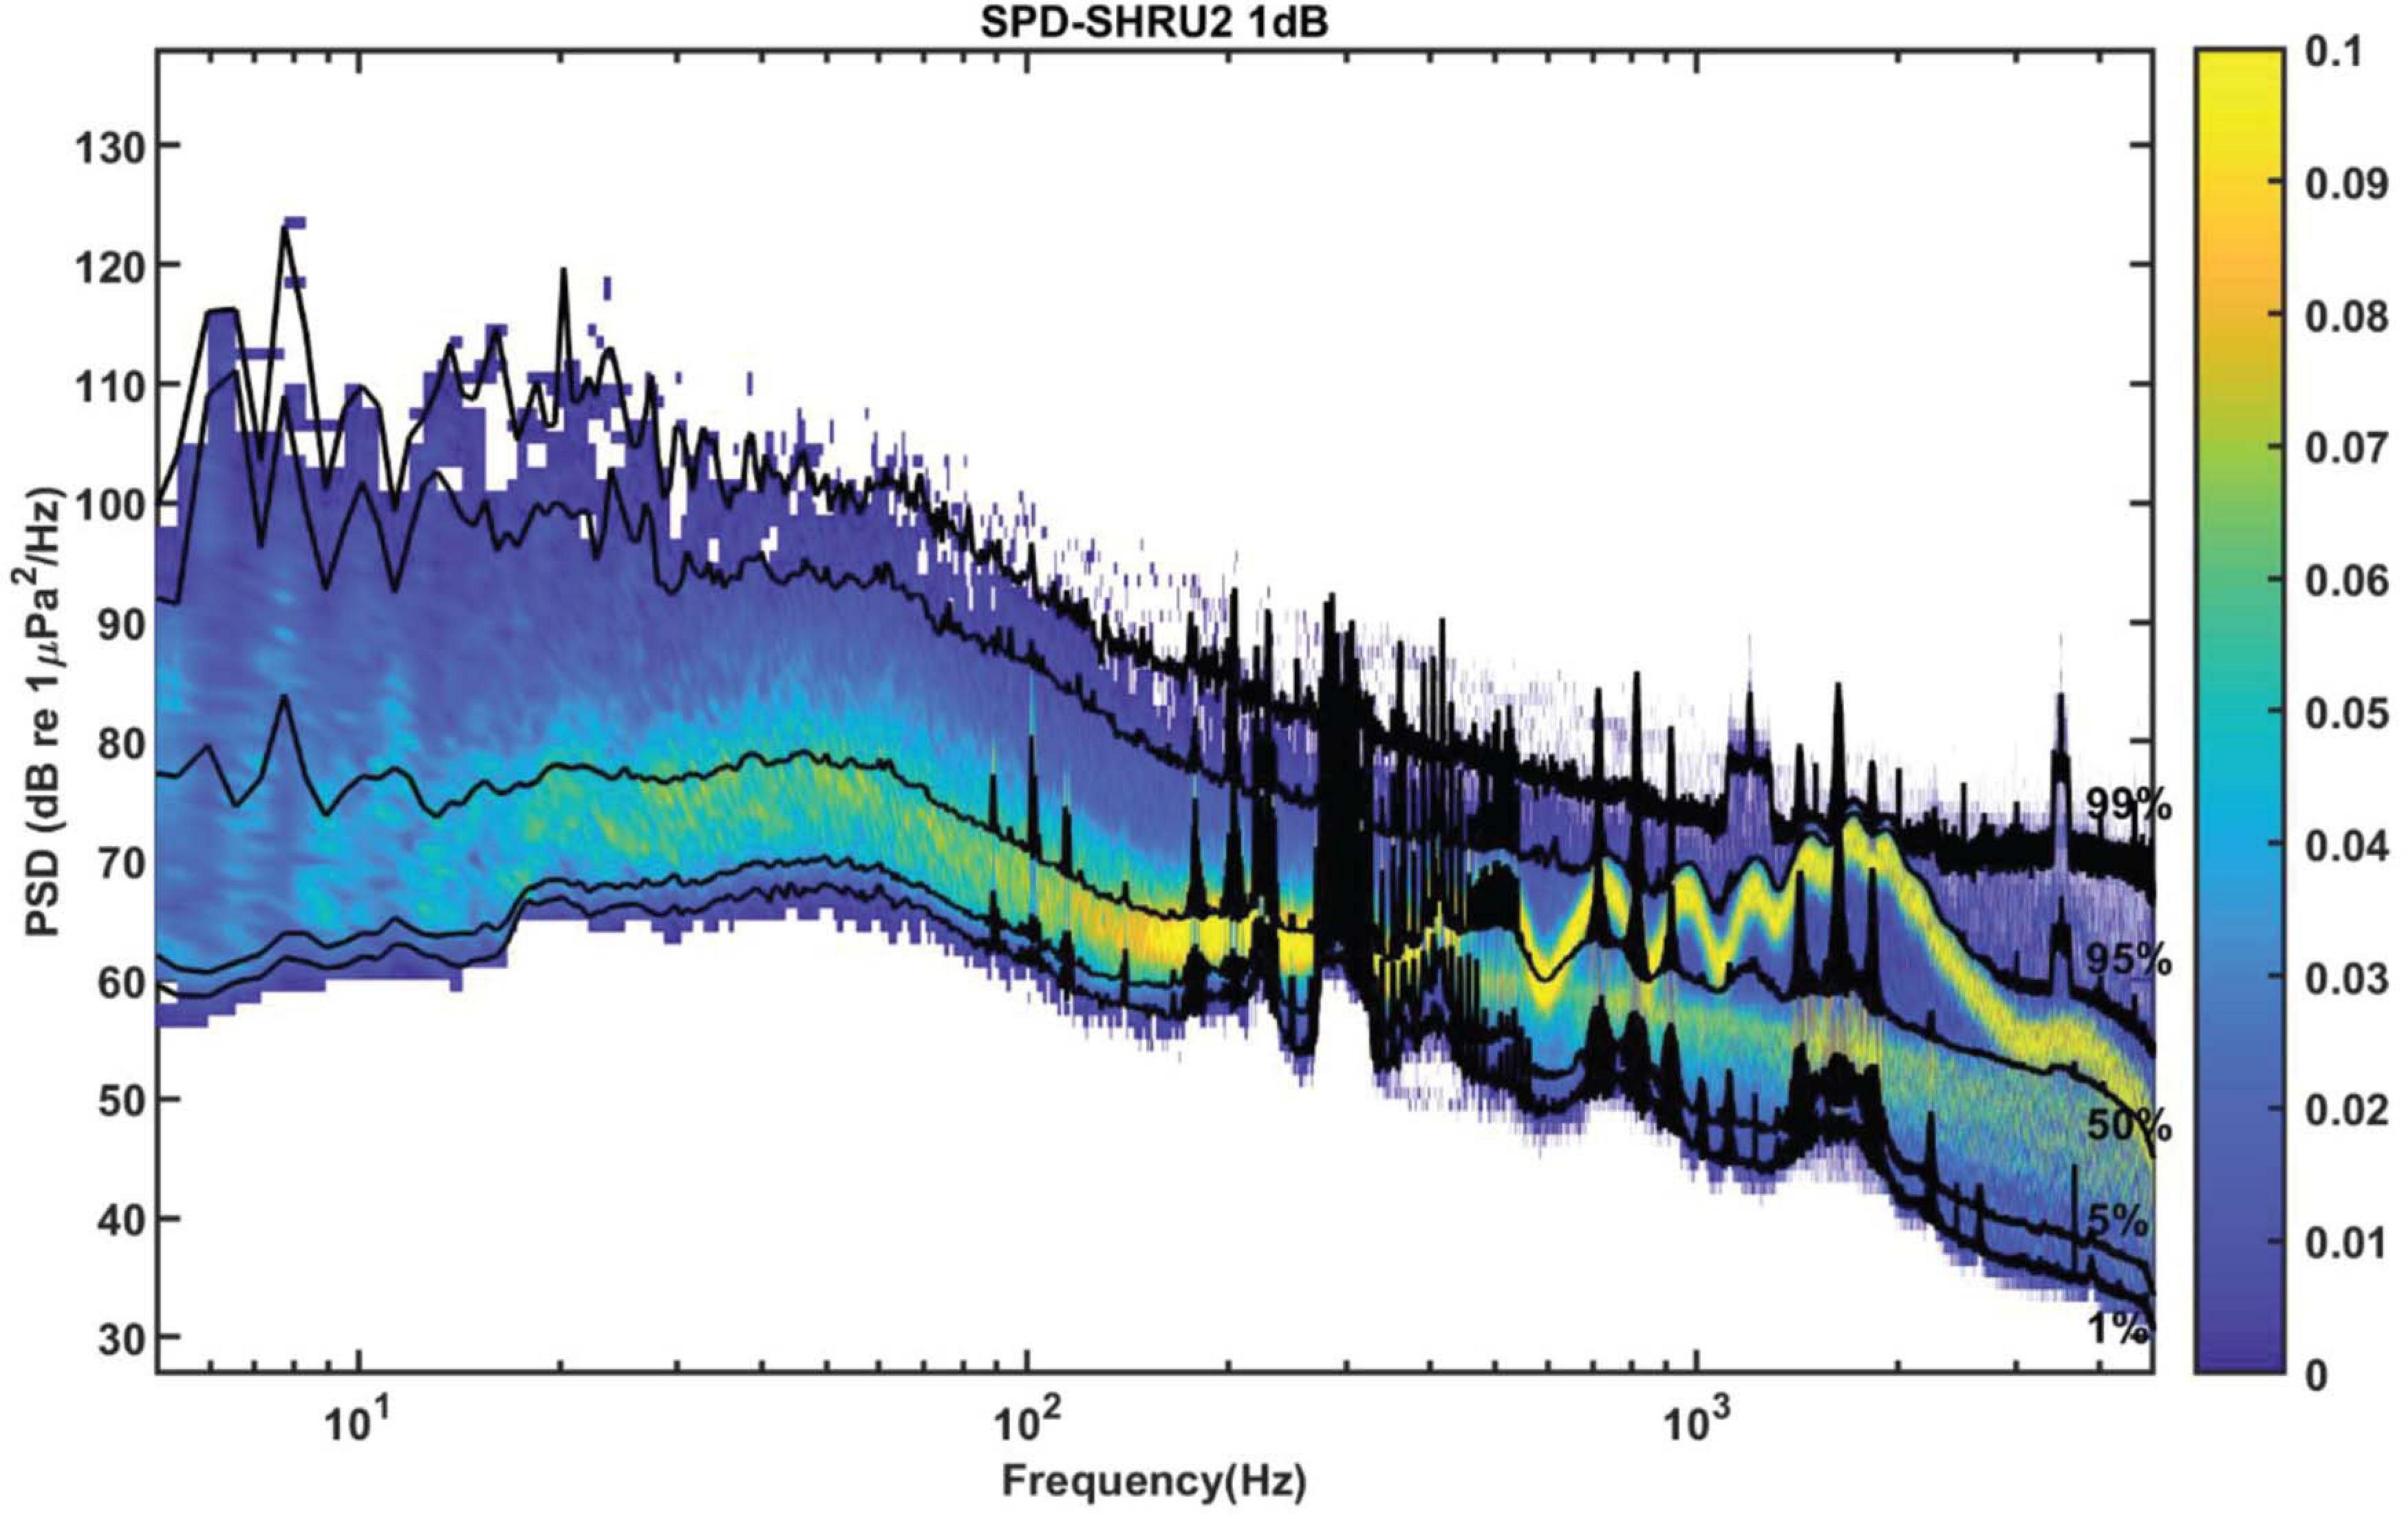
Figure 5. The PSD is calculated with 8,192 points data for the Fourier transform with a gate window and a 50% overlap. Then it is averaged over 1 h. SPD from 1-h averaged PSD with frequency interval 1.192 Hz and histogram bin width of 1 dB. The black curves of percentiles are 1, 5, 50, 95, and 99%.
Sound above 4.8 kHz is not known due to limited sampling frequency. However, as can be seen from Figure 4, the intensity of nighttime sound remains greater than that of daytime sound at frequencies above 4.8 kHz, which indicates that the chorus likely contains energy at higher frequencies. However, given that the nighttime sound intensity weakens with increasing frequency above 2 kHz and that the intensity difference between the nighttime and daytime soundscape decreases upon approaching 4.8 kHz, the chorus above 4.8 kHz should be less intense and thus can be neglected.
As shown in Figure 4, the intensity of chorus is strongest from 1,450 to 2,000 Hz, so we calculate the variation of sound intensity from 1,450 to 2,000 Hz. Figure 6 shows the results for the five SHRUs. The horizontal axis represents time (UTC) from July 27 to September 2, 2006. Figure 6 shows clearly that the sound intensity varies periodically with a 1-day period; the chorus begins and ends at essentially almost the same time every day. It increases in intensity around 00:00 and disappears around 10:00, which is consistent with the sunset and sunrise at the experiment site. Note that the nighttime becomes longer over the course of the experiment, which means that the sun sets earlier and/or rises later. If the chorus is related to daylight, its start and end should follow the sunrise and sunset. Because the chorus intensity is greatest at SHRU2, we determine the daily start and end time from the sound recorded by SHRU2 and compare the results with the time of sunrise and sunset (see Figure 7A). In addition, we calculate the nighttime sound intensity for July 27 and August 27 when the chorus starts and ends (see Figure 7B). Sunset is 20:14 on July 27 (00:14, July 28, UTC), and sunrise is 05:53 on July 28 (09:53, July 28, UTC). Sunset is 19:36 on August 27 (23:36, August 27, UTC) and sunrise is 06:22 on August 28 (10:22, August 28, UTC). The sunset and sunrise times are taken from the “Time and Date” website for Atlantic City, New Jersey (Time and Date AS, 2020), which is close to the experimental site.
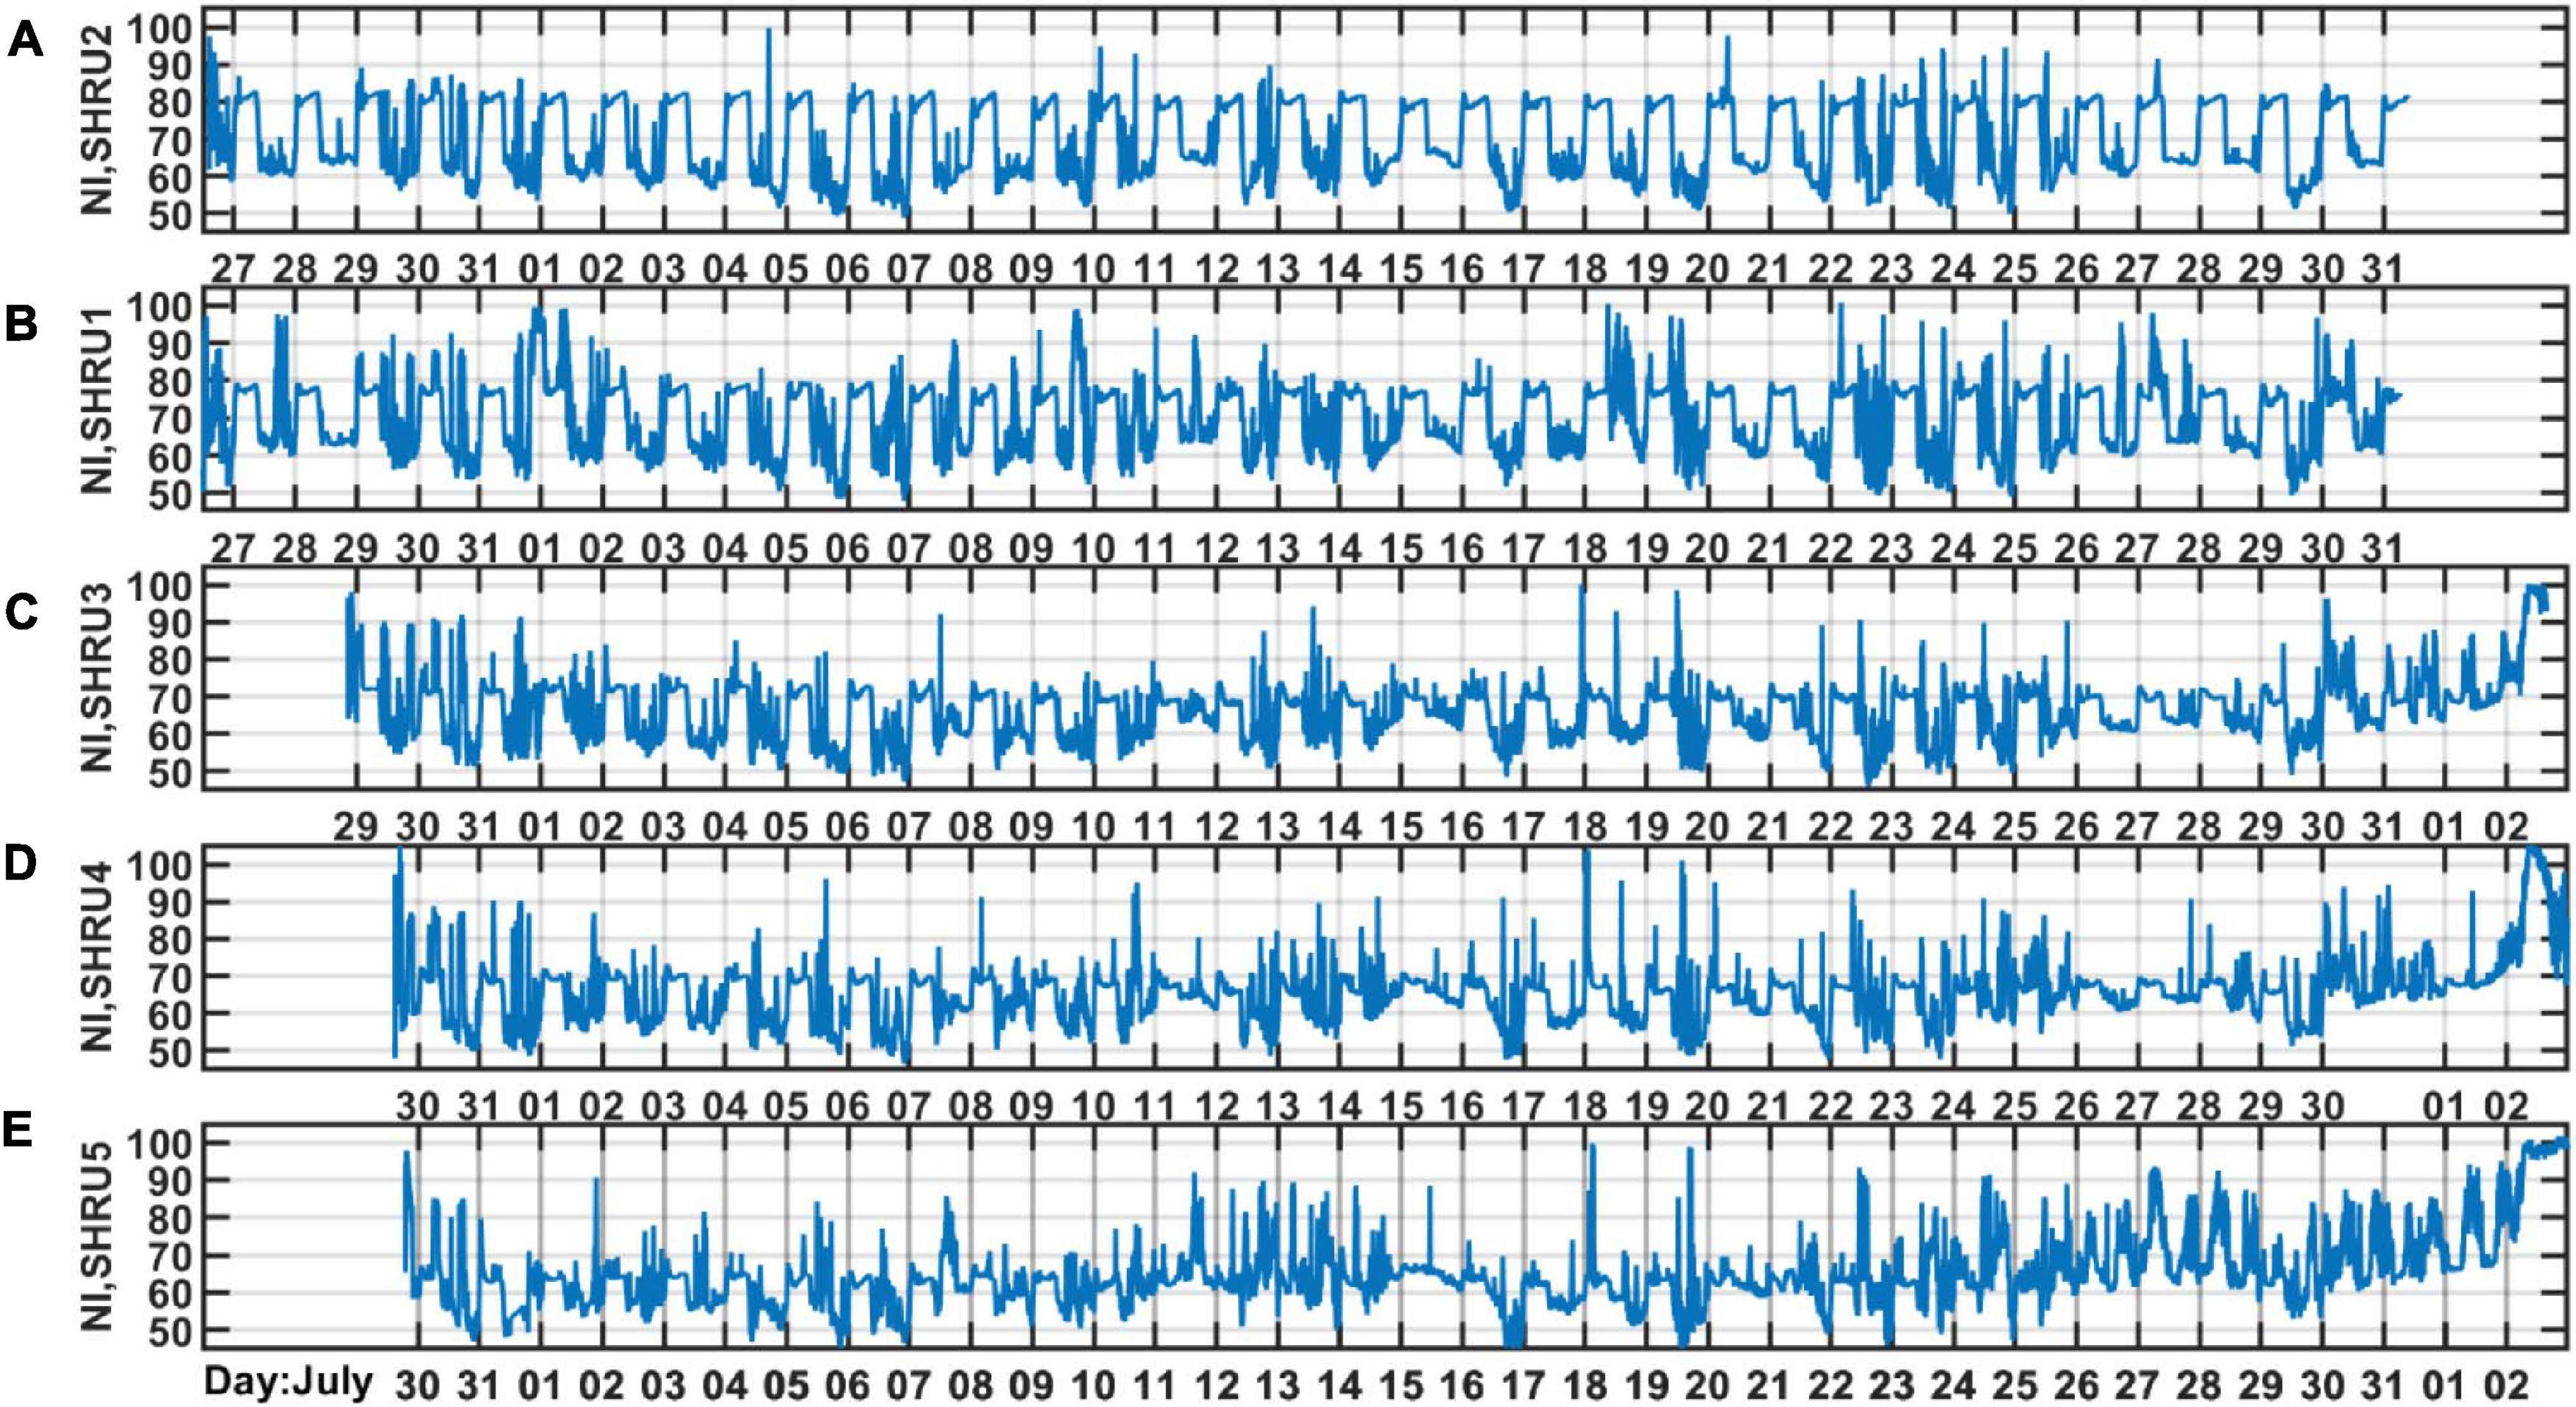
Figure 6. The sound intensity as a function of time during the experiment measured by (A) SHRU2, (B) SHRU1, (C) SHRU3, (D) SHRU4 and (E) SHRU5. The band is strongest chorus band 1,450–2,000 Hz.
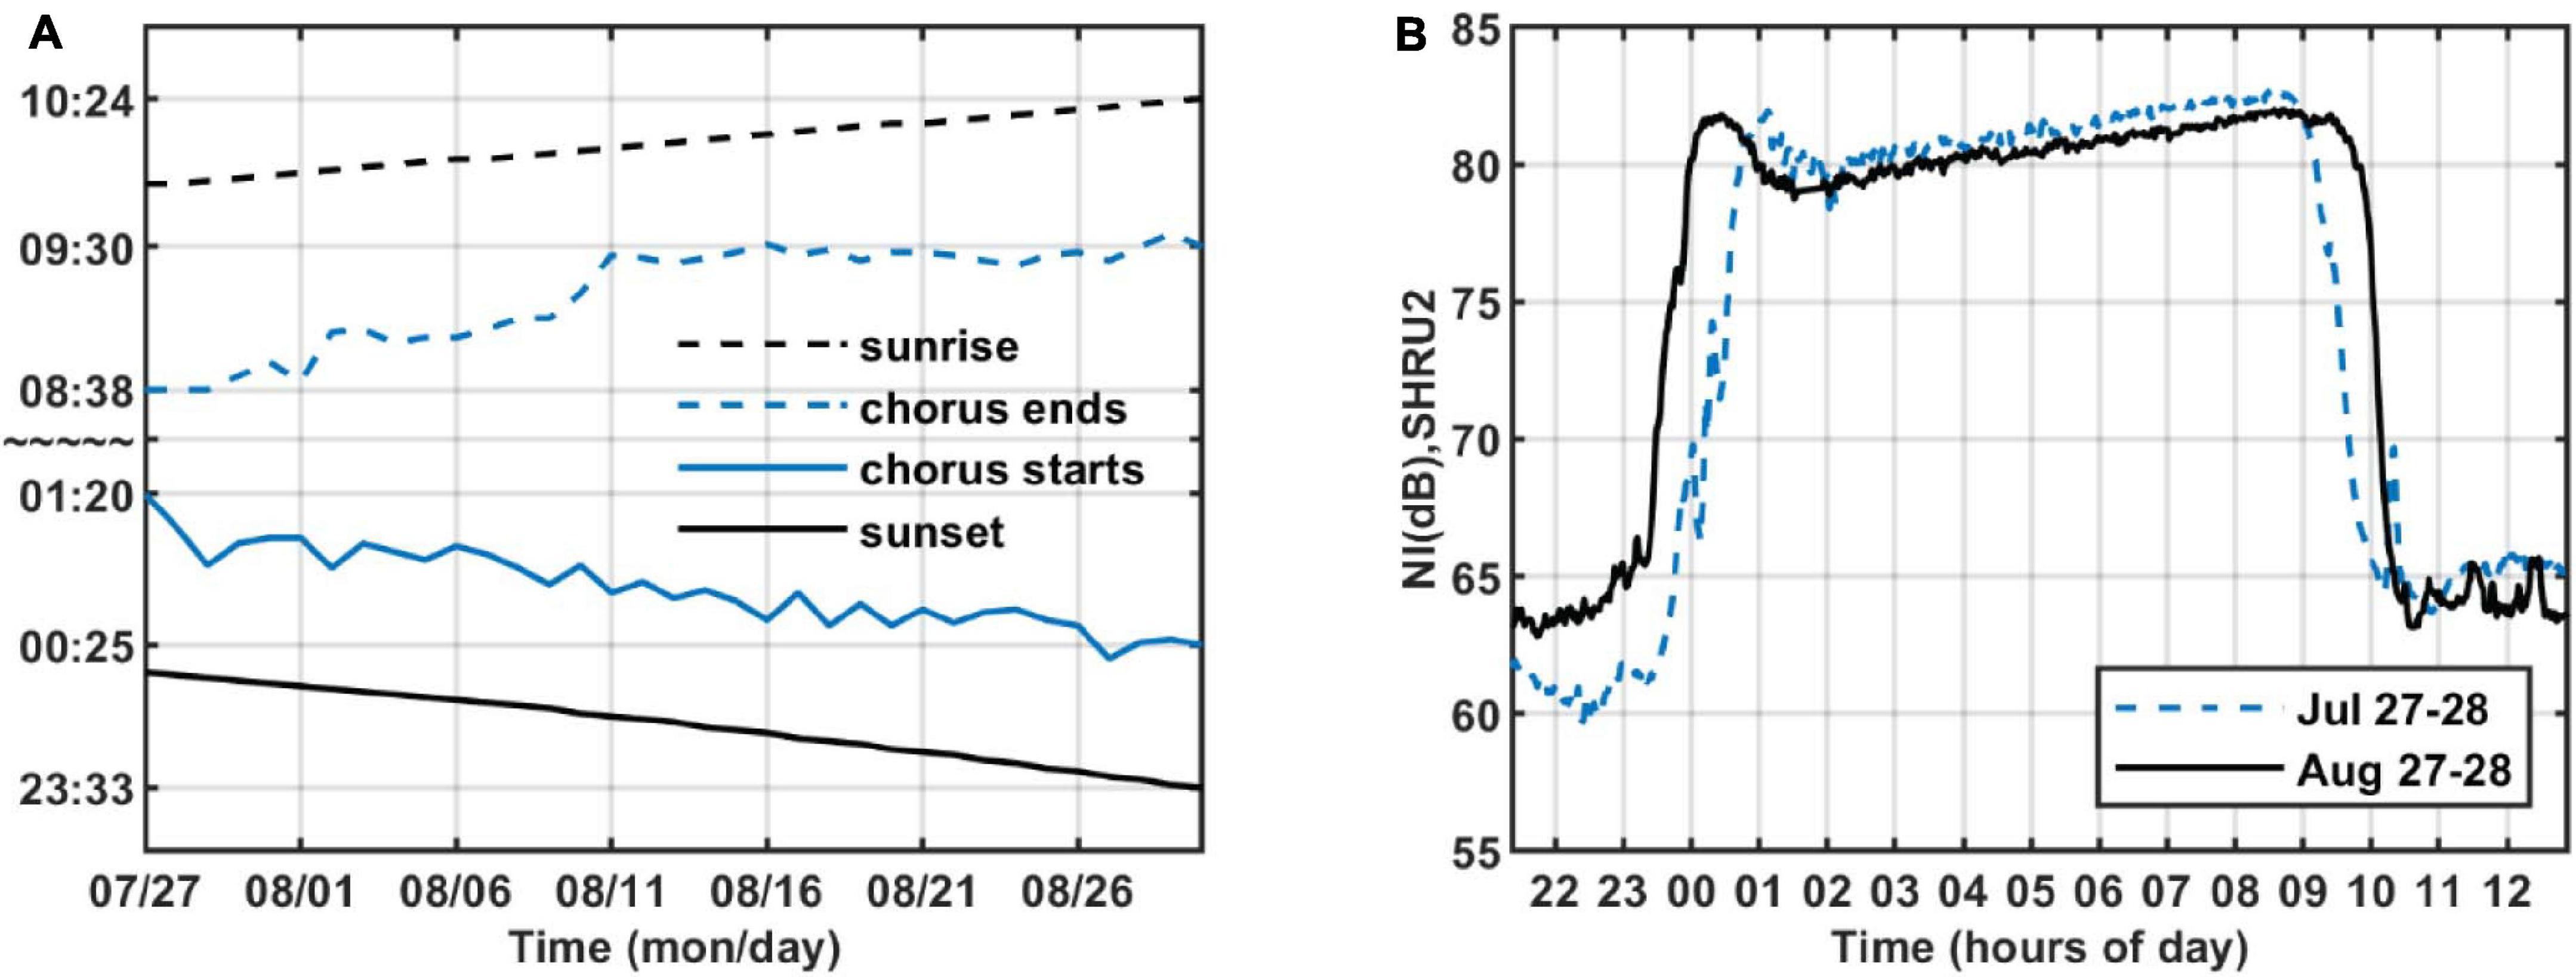
Figure 7. (A) Start and end time of chorus and time of sunrise and sunset as functions of time. (B) Nighttime sound intensity as a function of time of day on July 27–28 and August 27–28, 2006, recorded by SHRU2. The band is strongest chorus band 1,450–2,000 Hz.
Considering that the background noise level varies, the chorus start and end times are difficult to determine. As a reference, we choose a start time around sunset when the chorus is at maximal intensity, and as an end time we choose when the intensity begins to decline at sunrise. These moments correspond to the strongest sound intensity (cf. Figure 7B). Therefore, in Figure 7A, the chorus starts after sunset and ends before sunrise. As shown in Figure 7A, the start and end times of the chorus change every day, which is consistent with the evolution of sunrise and sunset. From this, we infer that the chorus begins at sunset and ends at sunrise. Figure 7, right, shows that the chorus intensity quickly maximizes shortly after sunset but then decreases to a minimum in about an hour. Next, it gradually strengthens to a new maximum before sunrise and then quickly disappears.
In addition to temporal variations, Figure 6 also reveals the spatial distribution of chorus intensity, which is strongest at SHRU2 and weakest at SHRU5. We consider the chorus on August 7, which has less interference, to calculate the nighttime intensity and average it. The result is 80.1 dB at SHRU2, 76.6 dB at SHRU1, 71.0 dB at SHRU3, 68.7 dB at SHRU4, and 63.4 dB at SHRU5. Combining these results with Figure 1 shows that the chorus intensity weakens going shoreward along an across-shelf path. In other words, the chorus intensity decreases upon approaching the coast, which means that the source of the chorus is not evenly distributed throughout the experimental area but is mainly near the margin of the continental shelf or even in the deep sea, rather than the coastal zone or the continental shelf.
At SHRU2, the chorus is relatively strong, and the individual chorus sound signals are recognizable in the time domain. Figure 8 shows that, at 3:49 a.m. on August 7, a 20 s sound consisting of 12 strong bursts at intervals of 1.5–1.9 s. The first strong burst is shown on a larger scale in Figures 8B,C. Each burst lasts about 8.7 ms and contains a first stronger pulse and a second weaker pulse, with each pulse containing several cycles. In addition to the signals detected by SHRU2, individual signals are also detected at SHRU1, although these are weaker than those at SHRU2. It is difficult to recognize individual sound signals at SHRU4 and SHRU5. Although Figure 8 shows only 20 s of data containing 12 bursts, the signals can last for tens to hundreds of seconds. Thus, this experiment detects only one type of signal; no other types of biological signals or other sounds are observed, which may be because they are covered by the noise.
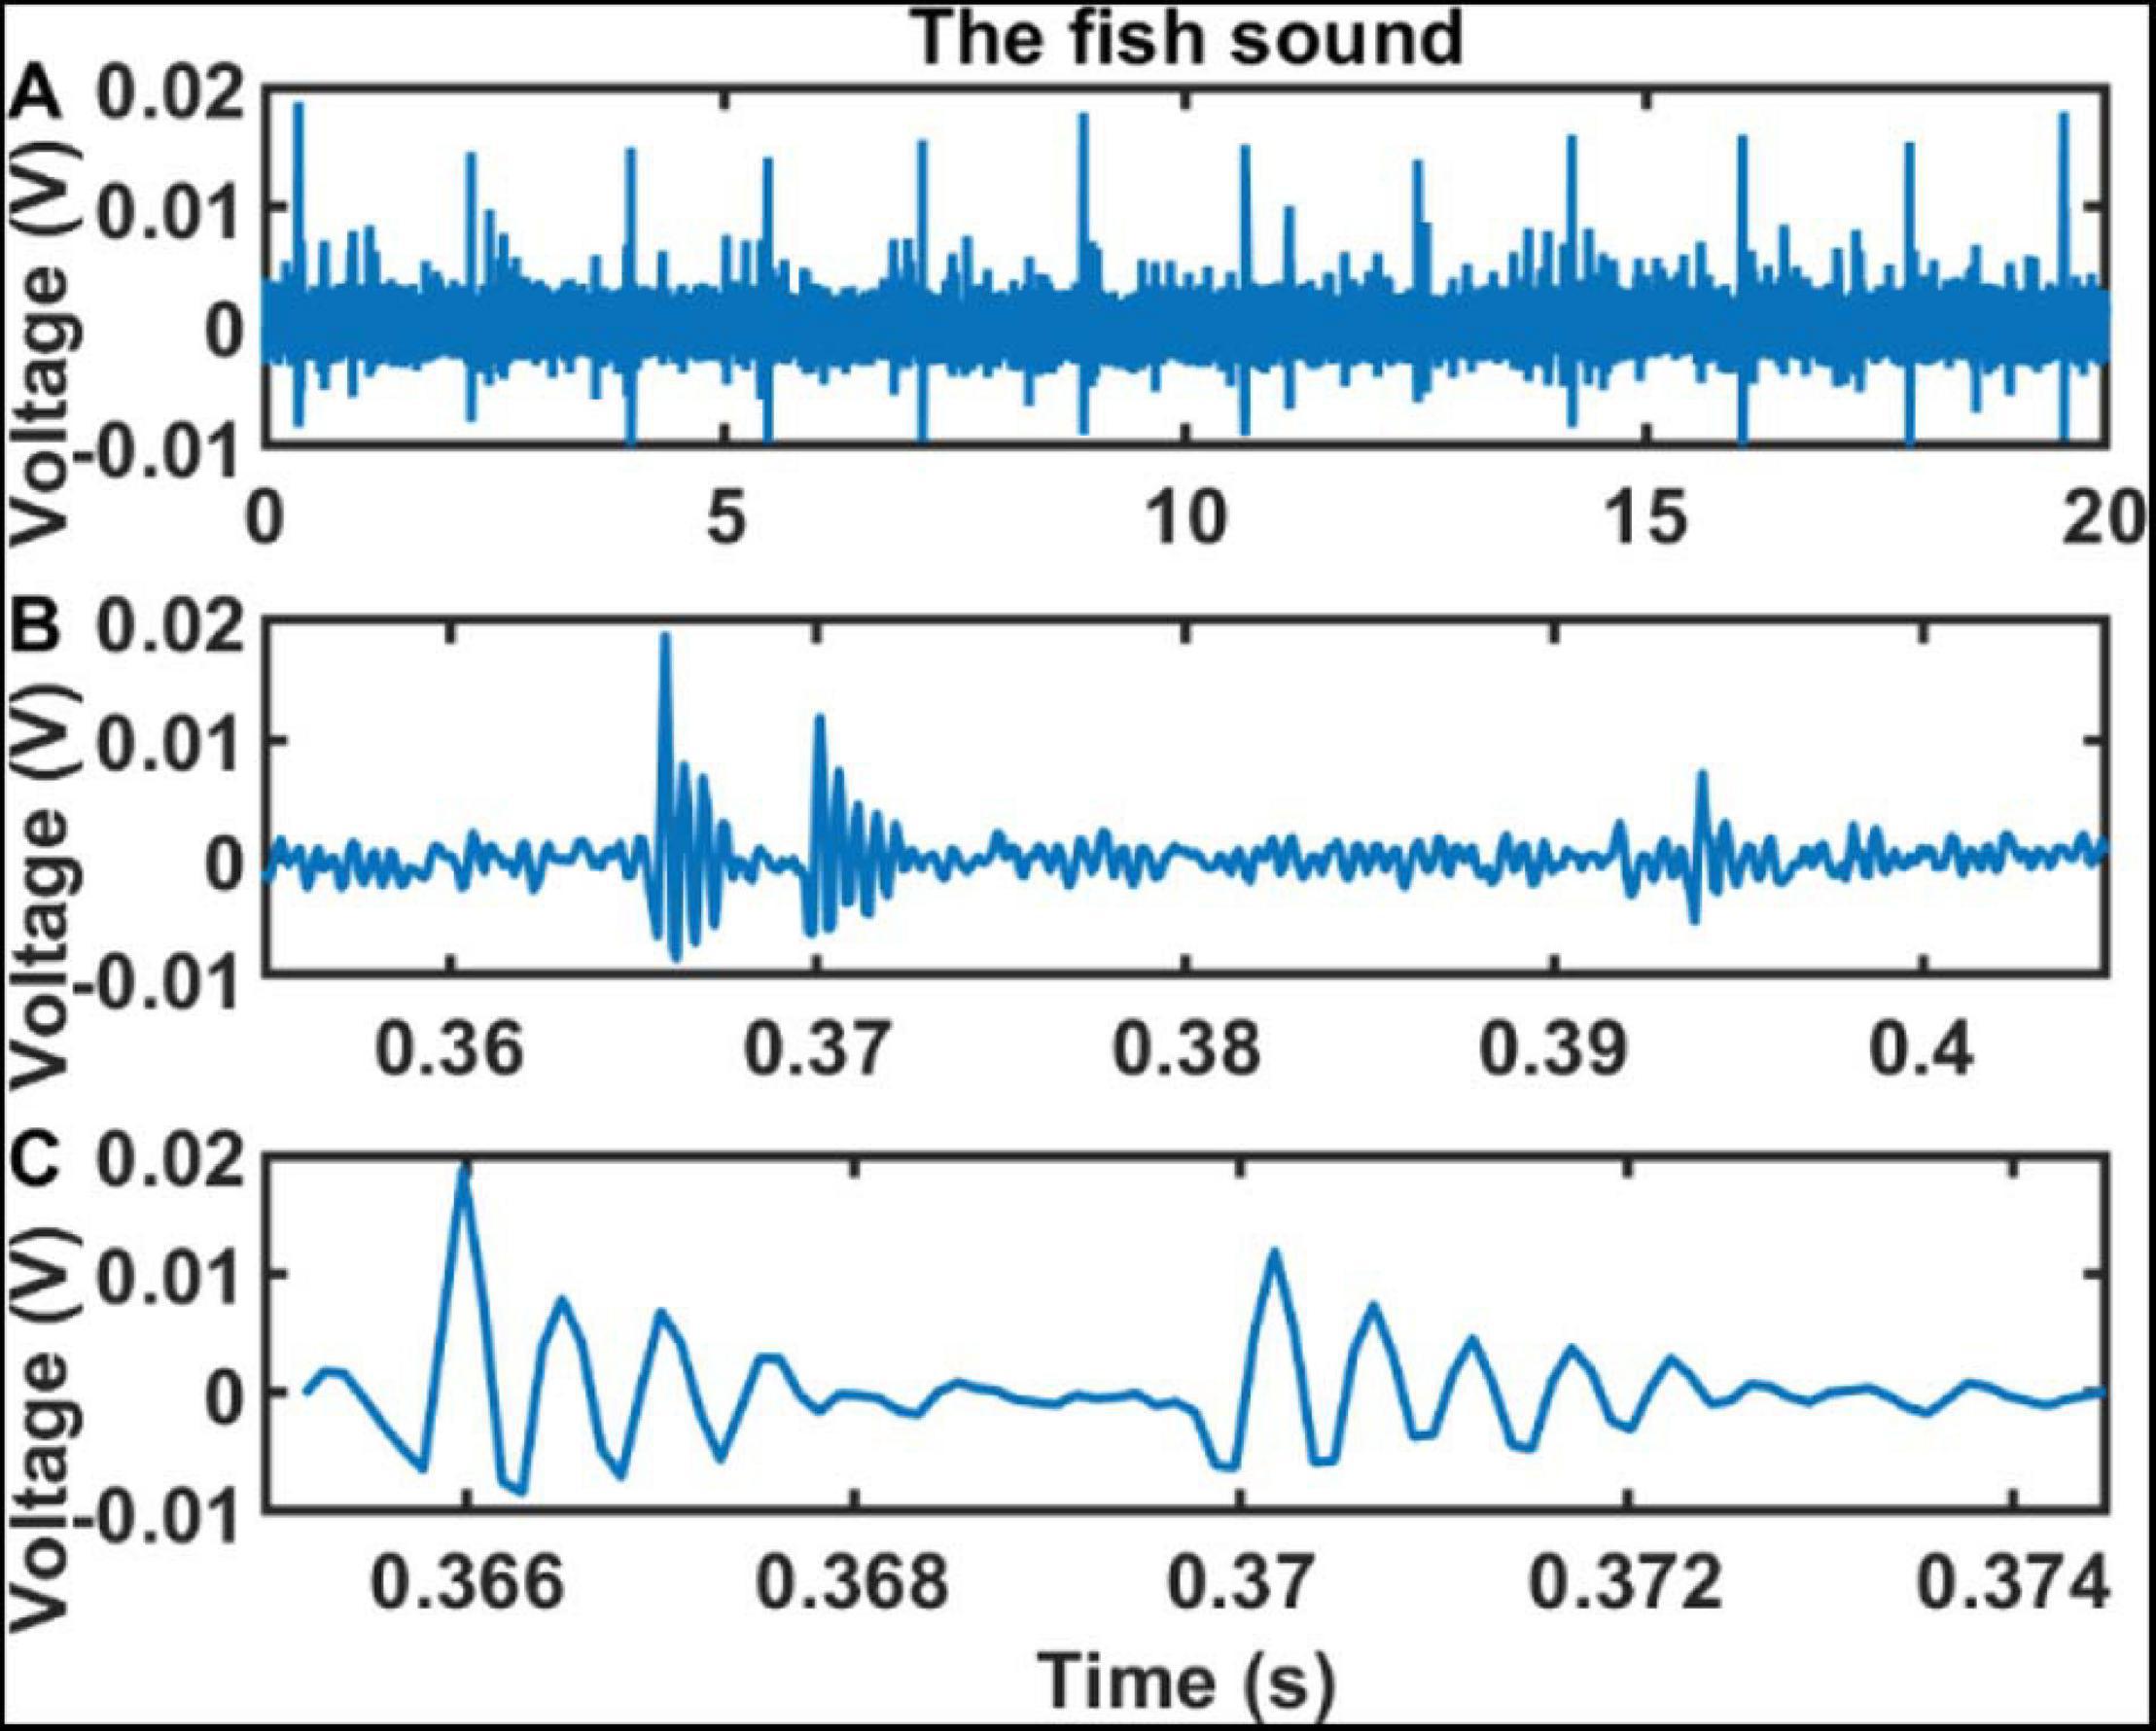
Figure 8. Sound signals recorded by SHRU2 in the time domain in different time scales. (A) 20 s sound data from 03:48:50 to 03:49:10 on Aug 7 (Supplementary Audio 3). (B) 0.05 s sound data in panel A from 0.355 to 0.405 s. (C) About 9.4 ms sound data in panel A from 0.3652 to 0.3746 s.
Figure 9 compares the PSD of the bursts recorded by SHRU2 and of the overall nighttime sound without distinguishing individual bursts with that of the daytime sound from Figure 4. To calculate the PSD of the bursts, the 12 bursts in Figure 8 are considered separately and then averaged. The length of each burst is 92 samples (about 9.4 ms). The overall nighttime sound without distinguishing individual bursts (such as the noise between 0.38 and 0.39 s) is cut to calculate the PSD. The comparison shows that the overall nighttime sound (i.e., without distinguishing individual bursts) is stronger than the daytime sound. In the frequency domain, the energy distribution of the bursts is like that of the nighttime sound but with greater intensity, which means that the chorus is continuous at night. In the time domain, the sound signals overlap one another and so cannot be distinguished.
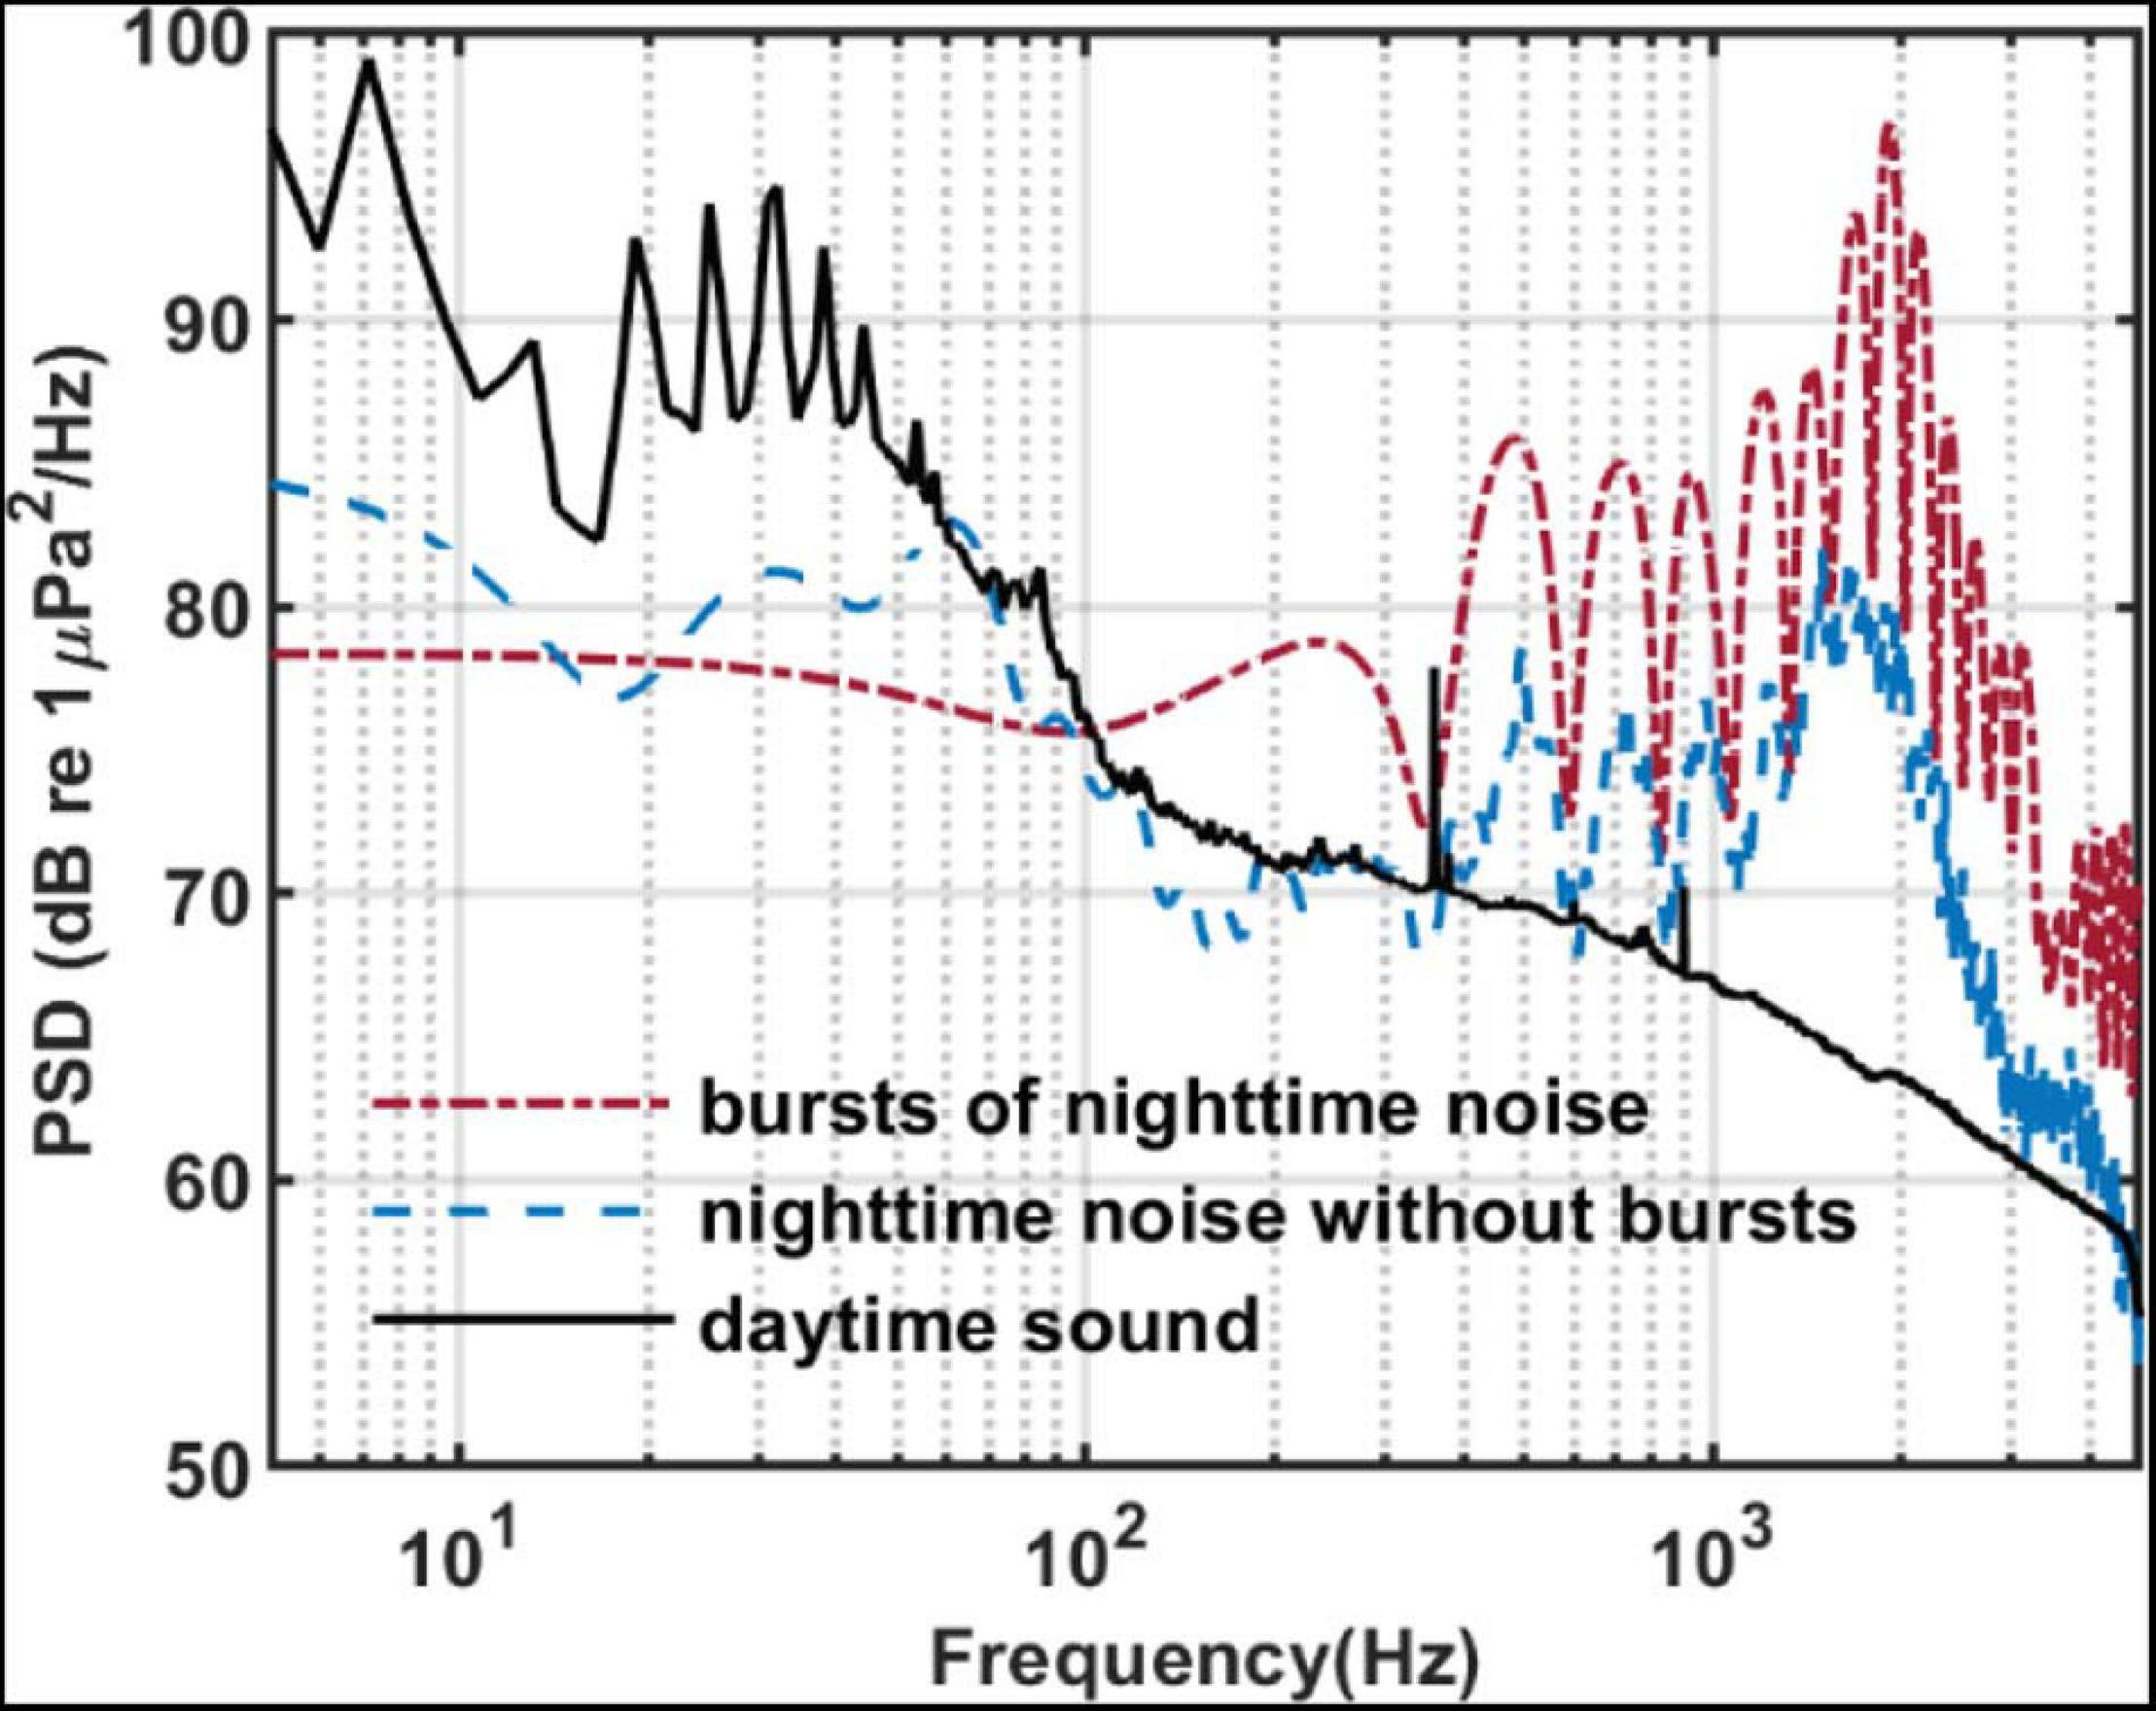
Figure 9. PSD of sound recorded by SHRU2. Red dash-dotted line: The averaged PSD of 12 bursts in Figure 8A. Each burst has 92 points for the 8,192 points Fourier transform with a gate window. Then they are averaged. Blue dash line: The averaged PSD of the data from 5.9003 to 6.7390 s (8193 points) in Figure 8A without bursts. Each segment had 512 points for the 8,192 points Fourier transform with a gate window and a 50% overlap. Then they are averaged. Black solid line: It is the same with the black solid line in Figure 4.
Given that the individual sound bursts are very short and separated by 1.5 –1.9 s and that the chorus is continuous in the time domain, it must be due to a large number of sources, so the signals may frequently overlap each other in the time domain. SHRU1 is about 4.1 km from SHRU2, which detects a strong individual sound signal. However, no corresponding individual sound signal is found at SHRU1. Thus, the sound intensity is too weak to propagate the 4.1 km between the SHRUs. However, the chorus is distributed over a wide spatial range, so the acoustic sources should also be similarly distributed. The chorus must therefore be due to a collection of animals and not just a single animal.
Discussion
The results show that the noise occurs primarily at night, starting at sunset and ending at sunrise, following a diel pattern. Furthermore, the frequency band of the sound is consistent with that of biological sounds, so the most likely source of the noise is marine animals. Biological sounds are often associated with behavior such as predation, courtship, reproduction, warning or attack, communication, and navigation (Kasumyan, 2008; Popper and Hawkins, 2019; Rogers et al., 2020). Some sounds are made by marine animals themselves, whereas others are generated by impacts between marine animals and water flow or water surface.
In the ocean, many species of marine animals can vocalize, including marine mammals, invertebrates, and fish (Coquereau et al., 2016; Gervaise et al., 2019). Among the species that can vocalize, invertebrates and fish are the main contributors to choruses. In addition, marine mammals sometimes vocalize together in the shallow or deep sea, such as the communication of cetaceans (McCauley and Cato, 2016).
Marine mammals can produce sounds for communication and navigation. In addition, movements, such as foraging and impacting the water surface, can also produce sounds (Au, 1993; Tyack and Clark, 2000; Dunlop et al., 2008). Erbe et al. (2017) reviewed the sounds produced by marine mammals in Australia and Antarctica, including whales, dolphins, sea cows, and carnivores. All sounds can be grouped into three classes: constant-wave (CW) tones, frequency-modulated (FM) sounds and broadband pulses. Mellinger and Clark (2003) pointed out that mammalian vocalizations in the North Atlantic Ocean were basically the same as those in other regions, although some differences existed; namely, the specific frequencies, durations, and repetition intervals may differ. The frequency of mammalian sounds was very wide, ranging from a few Hz to more than 100 kHz (Haver et al., 2018). The duration and type of sounds produced by marine mammals differ significantly from the chorus reported herein, so the chorus is not likely to be produced by marine mammals.
Many species of invertebrates, such as shrimp, can also produce sounds, and the frequency of vocalization was relatively high. Coquereau et al. (2016) measured 20 species of invertebrates along the coast of the Northeast Atlantic Ocean and found eight that produce sounds, including sea urchins, shrimp, and spider crabs. The peak frequency emitted by these invertebrates exceeds 3 kHz, and some can reach above 50 kHz. Buscaino et al. (2011) characterized the acoustic behavior of the European spiny lobster Palinurus elephas in a water tank. The measured signal duration, number of pulses per signal, pulse rate, bandwidth, peak intensity, and peak frequency all differed significantly from the chorus reported herein. For example, the peak frequency reported by Buscaino et al. was 19.52 kHz. Snapping shrimp were a widespread family of Caridean shrimp comprising over 600 species (Lillis and Mooney, 2016) and were an important source of biological marine noise. They lived typically at depths less than a few tens of meters and had an approximate geographic range of ± 40° latitude (Au and Banks, 1998; Bohnenstiehl et al., 2016). They produced sounds over a wide range of frequency bands, mainly in the high frequencies (from several to tens of kilohertz). The duration of an individual signal was relatively short, less than 1 ms (Au and Banks, 1998; Freeman et al., 2014; Bohnenstiehl et al., 2016; Lillis and Mooney, 2016). According to the analysis of sounds recorded in the waters off of New Zealand (Radford et al., 2010), sea urchins produced sounds in the frequency band from 800 to 2,500 Hz, with a peak between 1,000 and 1,200 Hz, although Soars et al. (2016) detected a higher-frequency band (2.3–9.2 kHz). The frequency band of sound produced by sea urchins in tropical waters was higher than that produced by temperate-water sea urchins, and the sound duration and frequency band also depended on the sea urchin size. However, the sound produced by sea urchins gradually changed frequency and no spectral peaks were formed. In the time domain, each burst consisted of only a single pulse, whereas the chorus reported herein was made of double pulses (Radford et al., 2008). Given that the frequency and temporal characteristics of invertebrate sound differ significantly from those of the chorus reported herein, it is unlikely that the chorus is produced by invertebrates.
We now consider fish as the origin of the chorus. Over 35,000 fish species are known (D’Spain and Batchelor, 2006; Califormia Academy of Sciences, 2021; FishBase, 2021), of which over 800 species from 109 families worldwide are known to be soniferous (Fish and Mowbray, 1970; Kaatz, 2002; Rountree et al., 2006; Kasumyan, 2008; Slabbekoorn et al., 2010; Parsons et al., 2016b; Carrico et al., 2019; Popper and Hawkins, 2019), and this number is growing as research continues to discover soniferous fish. Fish vocalization is very weak compared with other organisms (Kasumyan, 2008). Most of the energy is in the low frequencies, below 1–2 kHz (Kasumyan, 2008).
The chorus reported herein is quite simple: it contains a series of bursts, with each burst containing two pulses. As shown in Figure 8, the energy is also concentrated in the low frequencies. More importantly, it contains spectral peaks that are relatively evenly distributed within the frequency domain of some fish. The frequency defined by the inverse of the time between spectral peaks is called the “pulse repetition frequency,” where the pulses are triggered by muscle contractions (Oppenheim and Schafer, 2004; McCauley, 2012; Parsons et al., 2013, 2016a,b; Sánchez-Gendriz and Padovese, 2017a). In the chorus reported herein, the time between pulses is about 4.3 ms, so the inverse is 233 Hz, which is consistent with the interval of the spectral peaks. In addition, fish choruses commonly occur at night, when large numbers of fish gather and vocalize together, thereby greatly increasing the broadband sound for a few hours (Cato, 1978; McCauley, 2012; Parsons et al., 2013; Erbe et al., 2015). Fish sound is generally characterized by its low frequency and short duration (Fish and Mowbray, 1970; Amorim, 2006; Kasumyan, 2008; Wall et al., 2014). Thus, the characteristics of fish sounds resemble those of the chorus reported herein, hence the chorus is likely produced by fish.
To further specify which type of fish may produce this chorus, we searched the literature to identify fish that produce sound similar to that of the chorus. Table 1 lists the fish species considered.
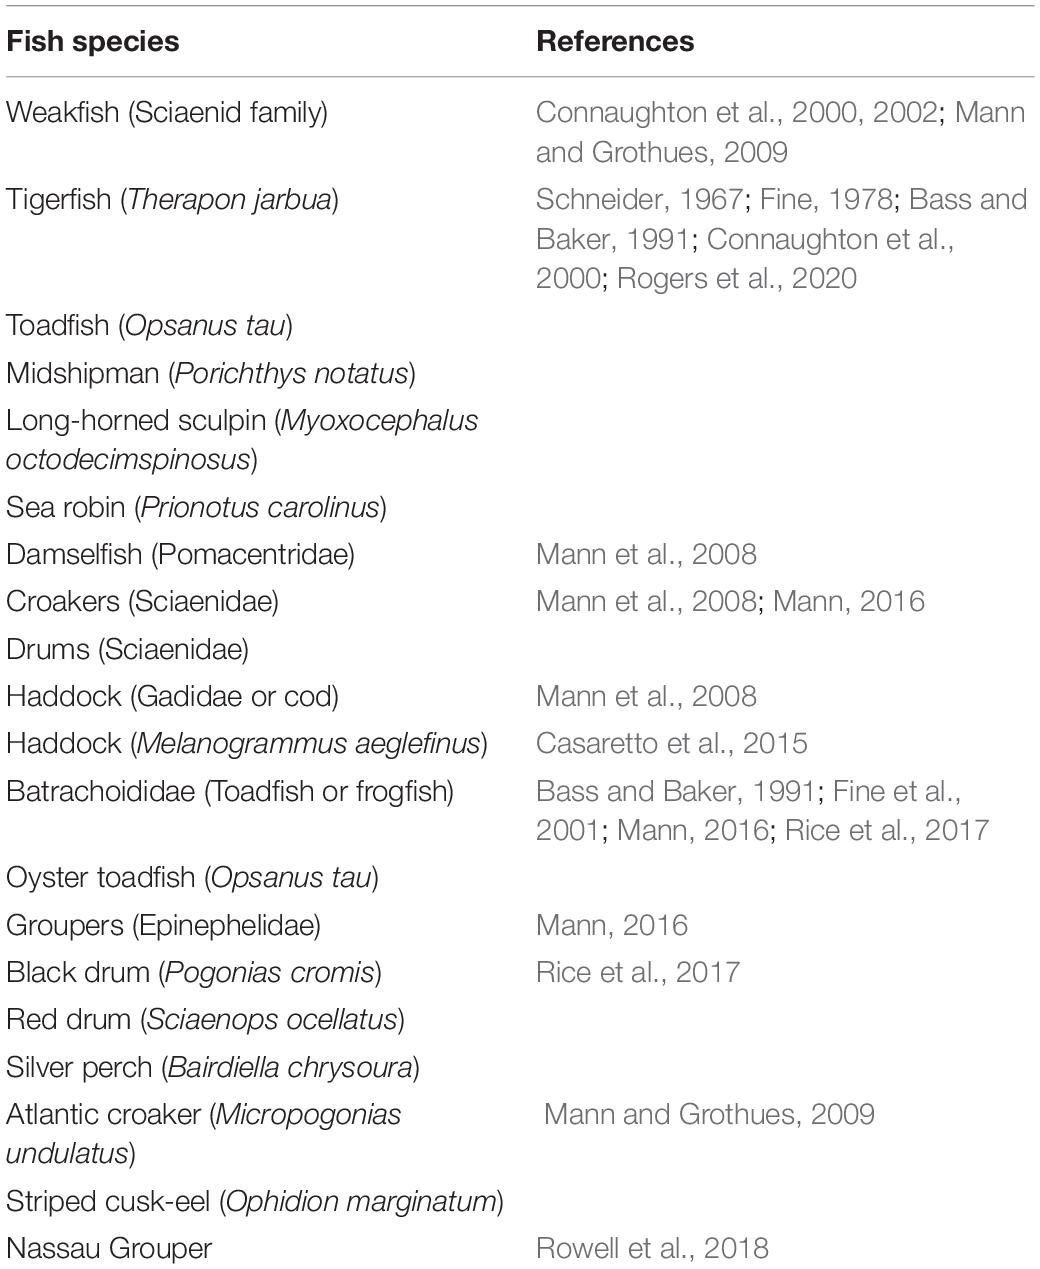
Table 1. Fish species considered as source of the chorus.
None of the fish listed in Table 1 produce sound similar to the chorus reported herein. Some sounds of fishes in a family are also reported, such as Family Sciaenidae (Croakers and Drums) (Ramcharitar et al., 2006), Drum fishes (Sciaenids), and Codfishes (gadids) (Rountree et al., 2006), and no same sound is found. We also search the website Fishbase (FishBase, 2020), which contains 90 types of fish sounds, none of which match our chorus. The University of Massachusetts, Amherst website on Fish Ecology (Rodney Rountree’s Homepage on Fish Ecology, 2020) also describes a variety of fish sounds, but none match the chorus reported herein. Thus, despite consulting numerous sources, we are not able to identify the fish species that produces the chorus detected in this work. This chorus may thus be produced by a previously unknown soniferous fish species, which requires further investigation.
The spatial distribution of the chorus intensity shows that the chorus is strongest at SHRU2 and weakest at SHRU5. In other words, the chorus intensity weakens with proximity to the coastal zone. At SHRU5, the chorus is already very weak, so areas closer to the coast than SHRU5 would likely experience no chorus. Because fish emit only a weak sound intensity and the sound does not propagate over long distances, so the fish must be distributed throughout the experimental area. The spatial distribution of the chorus indicates that the fish become less abundant closer to the coast. In the experimental area, the chorus is most intense at SHRU2, which means that the fish are most abundant in this area. Beyond SHRU2, toward the deep sea, how is the distribution of the chorus and how deep it disappears, cannot be known. However, the results do indicate that the source of the chorus is not from the coastal zone, but the margin of the continental shelf and perhaps the continental slope or deep-sea areas.
The biological noise reported for the Atlantic coast of the United States differs from the chorus reported herein, which also indicates that fish does not exist in the shallow sea. In the mid-Atlantic Ocean off the southern New Jersey coast, biological sounds are mainly produced by three types of fish: Atlantic croaker (Micropogonias undulates), weakfish (Cynoscion regalis), and striped cusk-eel (Ophidion marginatum) (Mann and Grothues, 2009). Cusk-eels produce a peak in intensity when calling at dusk and a smaller peak when calling at dawn. The cusk-eel chorus lasts all night and varies in intensity. In the western Gulf of Maine, a remotely operated vehicle (ROV) was used to investigate the vocalization of fish (Rountree and Juanes, 2010). Sixteen species of fish and one species of squid were observed. Ten fish species produce sound, including Atlantic cod (Zemeckis et al., 2019). The Estuarine soundscapes are dominated by the sounds produced by invertebrates at 2–23 kHz, such as shrimp in Pamlico Sound, North Carolina, in the southeastern United States (Lillis et al., 2014). There are spectral peaks in the 200–300 Hz and 450–600 Hz frequency bands. Lillis et al. (2014) attribute these sounds to oyster toadfish (Opsanus tau). Other soniferous fish including weakfish (Cynoscion regalis), pigfish (Orthopristis chrysoptera), silver perch (Bairdiella chrysoura), and Atlantic croaker (Micropogonias undulates) also produce sounds. Off the coasts of Georgia and eastern Florida, the fish chorus is dominated by Black drum (Pogonias cromis) and toadfish (Opsanus sp.). In addition, red drum (Sciaenops ocellatus), silver perch (Bairdiella chrysoura), and an unidentified soniferous species also produce sounds (Rice et al., 2017). In addition, choruses exist in tropical nearshore habitats in Florida, producing both high and low frequencies. Butler et al. (2016) attribute the low-frequency sound to toadfish and the high-frequency sound to shrimp. However, none of the biological sounds reported for the Atlantic coast of the United States are the same as the fish chorus reported herein, so the source should be different. A 1-day recording was made at 682 m depth in Welkers Canyon on the continental slope (Rountree et al., 2012), which is northeast of our experiment site. Numerous biological sounds were detected, including various cetaceans and at least 12 unknown sounds produced by cetaceans or fish. However, no chorus was recorded, and the biological sounds differ from the fish chorus reported herein.
Thus, although the Shallow Water 2006 experiment elucidates the characteristics of the chorus and evidence suggests that it is produced by fish, the source remains undetermined. The intensity of the chorus can rise 20 dB above the background sound of the local ocean. The chorus lasts all night and strongly affects the local sound field. Further research is required to identify the species that produces the chorus, which would improve our understanding of the local ecosystem and biological sound fields.
Conclusion
This work reports a biological chorus recorded by five SHRUs emanating from the margin of the New Jersey Atlantic continental shelf and tentatively attributes it to an unidentified species of fish. The chorus occurs every night for over a month (July to August 2006). The frequency band of the chorus is 150 Hz to 4.8 kHz, with the maximum intensity occurring between 1,450 and 2,000 Hz. In addition, clear spectral peaks in intensity occur at 500, 725, 960, 1,215, 1,465, 1,700, and 1,920 Hz. In the maximum band at SHRU2, the chorus intensity rises to 20 dB above the background noise level. The chorus begins at sunset and ends at sunrise; it reaches its strongest peak in intensity within 1 h of sunset, following which it weakens slightly before again gradually increasing to a peak before sunrise, at which point it quickly weakens and disappears.
Of the five SHRUs, the chorus intensity is strongest at SHRU2 and weakest at SHRU5, which indicates that the intensity weakens along a shoreward across-shelf path. In other words, the chorus intensity decreases approaching the coast. The intensity is quite weak at SHRU5, so it is likely undetectable closer to the coast than SHRU5. Because fish produce low-intensity sound, the sound signal does not propagate over long distances, which means that the fish should be distributed throughout the experimental area. The spatial distribution of the chorus intensity implies that the fish must be less abundant closer to the coast. In the experimental area, SHRU2 records the highest chorus intensity, so the greatest abundance of fish must be in this area. However, the chorus intensity may be stronger still farther out to sea, in deeper waters and farther from the coast.
The chorus consists of only one type of signal, with relatively stable characteristics. The signal is made up of bursts about 8.7 ms long and containing two pulses, each of which contains several cycles. The time interval between successive bursts varies from 1.5 to 1.9 s. The duration of each signal is tens to hundreds of seconds, which means that the number of bursts in each signal varies widely. SHRU1 is about 4.1 km from SHRU2, where a strong individual signal is clearly detected. However, no corresponding individual signal is detected at SHRU1, which indicates that the sound intensity produced by the fish is weak and does not propagate over a long distance. However, the spatial extent of the chorus is quite large, so the spatial extent of the source of the chorus must also be relatively large. Assuming fish are the source of the chorus, the large spatial extent of the source implies that a large number of fish contribute to the chorus. In the experimental site, the spatial distribution of fish is consistent with the spatial distribution of the chorus.
Many individual animals, mainly invertebrates and fish, gather to produce choruses, although marine mammals also sometimes vocalize together. Numerous invertebrate species vocalize, but they produce sounds at relatively high frequencies. The sounds produced by marine mammals can be grouped into three classes that cover frequencies ranging from a few Hz to over 100 kHz. The frequency band of sea urchins is the same as that of the chorus reported herein, but sea urchins produce no spectral peaks in the frequency domain, and their bursts contain only single pulse in the time domain. The acoustic energy of the chorus reported herein is concentrated in the lower frequencies. The chorus is characterized by one type of signal of short duration and with multiple spectral peaks, which is characteristic of fish sounds. Thus, the most likely source of the chorus is fish.
Despite comparing the chorus with the sounds produced by numerous relevant species of fish, no match is found. However, not all recorded fish sounds are compared against the chorus, so the chorus may yet be generated from a known fish sound. However, the biological sounds documented for the Atlantic coast of the United States all differ from the fish chorus in this study, which implies that the habitat of this fish is not within the coastal zone. The fish choruses previously reported are mainly in shallow sea areas, such as coastal zones. The fish chorus reported herein has its origin on the margin of the continental shelf, or perhaps on the continental slope or in the deep sea. At present, only the sound characteristics of the fish chorus are known. Further investigation is required to determine the sound source, which should aid in better understanding the ecosystem on the margin of the continental shelf.
Data Availability Statement
The raw data supporting the conclusions of this article will be made available by the authors, without undue reservation.
Author Contributions
QZ carried out data processing and numerical analysis of results. BK carried out theoretical analysis of data and results and provided interpretation of results. Both authors discussed results and were writing manuscript together.
Funding
Work was supported by NSF-BSF program, grant 2016545, ISF grant 946/20, and RFBR grant 20-05-00119.
Conflict of Interest
The authors declare that the research was conducted in the absence of any commercial or financial relationships that could be construed as a potential conflict of interest.
Acknowledgments
We are grateful to Prof. O. A. Godin for his help and useful discussions.
Supplementary Material
The Supplementary Materials are uploaded as Audio (wav). The audio 1 is the 1280s sound in Figure 3(A). The audio 2 is the 1280s sound in Figure 3(B). The audio 3 is the 20s fish sound in Figure 8. The Supplementary Material for this article can be found online at: https://www.frontiersin.org/articles/10.3389/fmars.2021.671965/full/#supplementary-material
Supplementary Audio 1 | 1280 s of sound, referenced in Figure 3A.
Supplementary Audio 2 | 1280 s of sound, referenced in Figure 3B.
Supplementary Audio 3 | 20 s of sound, referenced in Figure 8A.
References
Amorim, M. C. P. (2006). “Diversity of sound production in fish,” in Communication in Fishes, eds F. Ladich, S. P. Collin, P. Moller, and B. G. Kapoor (Enfield, NH: Science Publishers), 71–104.
Archer, S. K., Halliday, W. D., Riera, A., Mouy, X., Pine, M. K., Chu, J. W. F., et al. (2018). First description of a glass sponge reef soundscape reveals fish calls and elevated sound pressure levels. Mar. Ecol. Prog. Ser. 595, 245–252. doi: 10.3354/meps12572
Au, W. W. L., and Banks, K. (1998). The acoustics of the snapping shrimp Synalpheus parneomeris in Kaneohe Bay. J. Acoust. Soc. Am. 103, 41–47. doi: 10.1121/1.423234
Bass, A., and Baker, R. (1991). Evolution of homologous vocal control traits. Brain Behav. Evol. 38, 240–254. doi: 10.1159/000114391
Bohnenstiehl, D. R., Lillis, A., and Eggleston, D. B. (2016). The curious acoustic behavior of estuarine snapping shrimp: temporal patterns of snapping shrimp sound in sub-tidal oyster reef habitat. PLoS One 11:e0143691.
Buscaino, G., Filiciotto, F., Gristina, M., Bellante, A., Buffa, G., Stefano, V. D., et al. (2011). Acoustic behaviour of the European spiny lobster Palinurus elephas. Mar. Ecol. Prog. Ser. 441, 177–184. doi: 10.3354/meps09404
Butler, J., Stanley, J. A., and Butler, M. J. (2016). Underwater soundscapes in near-shore tropical habitats and the effects of environmental degradation and habitat restoration. J. Exp. Mar. Biol. Ecol. 479, 89–96. doi: 10.1016/j.jembe.2016.03.006
Califormia Academy of Sciences (2021). Eschmeyer’s Catalog of Fishes. Available online at: https://researcharchive.calacademy.org/research/ichthyology/catalog/SpeciesByFamily.asp (accessed April 19, 2021).
Carrico, R., Silva, M. A., Menezes, G. M., Fonseca, P. J., and Amorim, M. C. P. (2019). Characterization of the acoustic community of vocal fishes in the Azores. PeerJ 7, e7772. doi: 10.7717/peerj.7772
Carrico, R., Silva, M. A., Menezes, G. M., Vieira, M., Bolgan, M., Fonseca, P. J., et al. (2020). Temporal dynamics in diversity patterns of fish sound production in the Condor seamount (Azores, NE Atlantic). Deep Sea Res. Part I 164:103357. doi: 10.1016/j.dsr.2020.103357
Casaretto, L., Picciulin, M., and Hawkins, A. D. (2015). Seasonal patterns and individual differences in the calls of male haddock Melanogrammus aeglefinus. J. Fish Biol. 87, 579–603. doi: 10.1111/jfb.12740
Cato, D. H. (1978). Marine biological choruses observed in tropical waters near Australia. J. Acoust. Soc. Am. 64, 736–743. doi: 10.1121/1.382038
Connaughton, M. A., Fine, M. L., and Taylor, M. H. (2002). Weakfish sonic muscle: influence of size, temperature and season. J. Exp. Biol. 205, 2183–2188. doi: 10.1242/jeb.205.15.2183
Connaughton, M. A., Taylor, M. H., and Fine, M. L. (2000). Effects of fish size and temperature on weakfish disturbance calls: implications for the mechanism of sound generation. J. Exp. Biol. 203, 1503–1512. doi: 10.1242/jeb.203.9.1503
Coquereau, L., Grall, J., Chauvaud, L., Gervaise, C., Clavier, J., Jolivet, A., et al. (2016). Sound production and associated behaviours of benthic invertebrates from a coastal habitat in the north east Atlantic. Mar. Biol. 163:127. doi: 10.1007/s00227-016-2902-2
Doya, C., Aguzzi, J., Pardo, M., Matabos, M., Company, J. B., Costa, C., et al. (2014). Diel behavioral rhythms in sablefish (Anoplopoma fimbria) and other benthic species, as recorded by the Deep-sea cabled observatories in Barkley canyon (NEPTUNE-Canada). J. Mar. Syst. 130, 69–78. doi: 10.1016/j.jmarsys.2013.04.003
D’Spain, G. L., and Batchelor, H. H. (2006). Observations of biological choruses in the Southern California Bight: a chorus at midfrequencies. J. Acoust. Soc. Am. 120, 1942–1955. doi: 10.1121/1.2338802
Dunlop, R. A., Cato, D. H., and Noad, M. J. (2008). Non-song acoustic communication in migrating humpback whales (Megaptera novaeangliae). Mar. Mamm. Sci. 24, 613–629. doi: 10.1111/j.1748-7692.2008.00208.x
Erbe, C., Dunlop, R., Jenner, K. C. S., Jenner, M. M., McCauley, R. D., Parnum, I., et al. (2017). Review of underwater and in-air sounds emitted by Australian and Antarctic Marine Mammals. Acoust Aust. 45, 179–241. doi: 10.1007/s40857-017-0101-z
Erbe, C., Verma, A., McCauley, R., Gavrilov, A., and Parnum, I. (2015). The marine soundscape of the Perth Canyon. Prog. Oceanogr. 137, 38–51. doi: 10.1016/j.pocean.2015.05.015
Etter, P. C. (2018). Underwater Acoustic Modeling and Simulation, 5th Edn. New York, NY: CRC Press, 297–298.
Fine, M. L. (1978). Seasonal and geographical variation of the mating call of the oyster toadfish Opsanus tau. Oecologia 36, 45–57. doi: 10.1007/BF00344570
Fine, M. L., Malloy, K. L., King, C. B., Mitchell, S. L., and Cameron, T. M. (2001). Movement and sound generation by the toadfish swimbladder. J. Comp. Physiol. A 187, 371–379. doi: 10.1007/s003590100209
Fish, M. P., and Mowbray, W. H. (1970). Sounds of Western North Atlantic Fishes: A Reference File of Biological Underwater Sounds. Baltimore: The Johns Hopkins Press.
FishBase (2020). Fish Sounds. Available online at: https://www.fishbase.se/Topic/List.php?group=sounds (accessed July 1, 2020)
FishBase (2021). Catalogue of Life. Available online at: https://www.catalogueoflife.org/data/dataset/1010 (accessed April 19, 2021)
Freeman, S. E., Rohwer, F. L., D’Spain, G. L., Friedlander, A. M., Gregg, A. K., Sandin, S. A., et al. (2014). The origins of ambient biological sound from coral reef ecosystems in the Line Islands archipelago. J. Acoust. Soc. Am. 135, 1775–1788. doi: 10.1121/1.4865922
Gervaise, C., Lossent, J., Valentini-Poirier, C. A., Boissery, P., Noel, C., and Iorio, L. D. (2019). Three-dimensional mapping of the benthic invertebrates biophony with a compact four-hydrophones array. Appl. Acoust. 148, 175–193. doi: 10.1016/j.apacoust.2018.12.025
Greenfield, M. D., and Shaw, K. C. (1983). “Adaptive significance of chorusing with special reference to the Orthoptera,” in Orthopteran Mating Systems: Sexual Competition in A Diverse Group of Insects, eds D. T. Gwynne and G. K. Morris (Boulder, CO: Westview Press), 1–27.
Haver, S. M., Gedamke, J., Hatchc, L. T., Dziakd, R. P., Parijs, S. V., McKenna, M. F., et al. (2018). Monitoring long-term soundscape trends in U.S. Waters: the NOAA/NPS Ocean Noise Reference Station Network. Mar. Policy 90, 6–13. doi: 10.1016/j.marpol.2018.01.023
Kaatz, I. M. (2002). Multiple sound producing mechanisms in teleost fishes and hypotheses regarding their behavioural significance. Bioacoustics 12, 230–233. doi: 10.1080/09524622.2002.9753705
Kasumyan, A. O. (2008). Sounds and sound production in fishes. J. Ichthyol. 48, 981–1030. doi: 10.1134/S0032945208110039
Kelly, L. J., Kewley, D. J., and Burgess, A. S. (1985). A biological chorus in deep water northwest of Australia. J. Acoust. Soc. Am. 77, 508–511. doi: 10.1121/1.392363
Lillis, A., Eggleston, D. B., and Bohnenstiehl, D. R. (2014). Estuarine soundscapes: distinct acoustic characteristics of oyster reefs compared to soft-bottom habitats. Mar. Ecol. Prog. Ser. 505, 1–17. doi: 10.3354/meps10805
Lillis, A., and Mooney, T. A. (2016). Loudly heard, little seen, and rarely understood: spatiotemporal variation and environmental drivers of sound production by snapping shrimp. Proc. Meet. Acoust. 27:010017. doi: 10.1121/2.0000270
Lindseth, A. L., and Lobel, P. S. (2018). Underwater soundscape monitoring and fish bioacoustics: a review. Fishes 3:36. doi: 10.3390/fishes3030036
Mann, D. A. (2016). “Acoustic communication in fishes and potential effects of noise,” in The Effects of Noise on Aquatic Life II, eds A. Popper and A. Hawkins (New York, NY: Springer), 673–678.
Mann, D. A., and Grothues, T. M. (2009). Short-Term upwelling events modulate fish sound production at a Mid-Atlantic Ocean observatory. Mar. Ecol. Prog. Ser. 375, 65–71. doi: 10.3354/meps07720
Mann, D. A., Hawkins, A. D., and Jech, J. M. (2008). “Active and passive acoustics to locate and study fish,” in Fish Bioacoustics, eds J. F. Webb and A. N. Popper (New York, NY: Springer), 279–309.
Mann, D. A., and Jarvis, S. M. (2004). Potential sound production by a deep-sea fish. J. Acoust. Soc. Am. 115, 2331–2333. doi: 10.1121/1.1694992
Marshall, N. B. (1967). “Sound-producing mechanisms and the biology of deep-sea fishes,” in Marine Bio-Acoustics, ed. W. N. Tavolga (Oxford: Pergamon Press), 123–133.
McCauley, R. D. (2012). “Fish choruses from the Kimberley, seasonal and lunar links as determined by long term sea noise monitoring,” in Proceedings of the Acoustics 2012 Fremantle, (Fremantle: Australian Acoustical Society).
McCauley, R. D., and Cato, D. H. (2016). Evening choruses in the Perth Canyon and their potential link with Myctophidae fishes. J. Acoust. Soc. Am. 140, 2384–2398. doi: 10.1121/1.4964108
McDonald, M. A., Hildebrand, J. A., and Wiggins, S. M. (2006). Increases in deep ocean ambient noise in the Northeast Pacific west of San Nicolas Island. California. J. Acoust. Soc. Am. 120, 711–718. doi: 10.1121/1.2216565
Mellinger, D. K., and Clark, C. W. (2003). Blue whale (Balaenoptera musculus) sounds from the North Atlantic. J. Acoust. Soc. Am. 114, 1108–1119. doi: 10.1121/1.1593066
Merchant, N. D., Barton, T. R., Thompson, P. M., Pirotta, E., Dakin, D. T., and Dorocicz, J. (2013). Spectral probability density as a tool for ambient noise analysis J. Acoust. Soc. Am. 133, EL262–EL267. doi: 10.1121/1.4794934
Newhall, A. E., Duda, T. F., von der Heydt, K., Irish, J. D., Kemp, J. N., Lerner, S. A., et al. (2007). Acoustic and Oceanographic Observations and Configuration Information for the WHOI Moorings from the SW06 Experiment. Woods Hole Oceanogragphic Institution Techical Report. New Jersey: Woods Hole Oceanogragphic Institution, doi: 10.1575/1912/1826
Oppenheim, A. V., and Schafer, R. W. (2004). From frequency to quefrency: A history of the cepstrum. IEEE Signal Process. Mag. 21, 95–106. doi: 10.1109/MSP.2004.1328092
Pagniello, C. M. L. S., Cimino, M. A., and Terrill, E. (2019). Mapping fish chorus distributions in Southern California using an autonomous Wave Glider. Front. Mar. Sci. 6:526. doi: 10.3389/fmars.2019.00526
Parsons, M., Mccauley, R., and Thomas, F. (2013). The sounds of fish off Cape Naturaliste, Western Australia. Acoust. Aust. 41, 58–64.
Parsons, M. J. G., Kent, C. P. S., Recalde-Salas, A., and McCauley, R. D. (2016a). Fish choruses off Port Hedland, Western Australia. Bioacoustics 26, 135–152. doi: 10.1080/09524622.2016.1227940
Parsons, M. J. G., Salgado-Kent, C. P., Marley, S. A., Gavrilov, A. N., and McCauley, R. D. (2016b). Characterizing diversity and variation in fish choruses in Darwin Harbour. ICES J. Mar. Sci. 73, 2058–2074. doi: 10.1093/icesjms/fsw037
Popper, A. N., and Hawkins, A. D. (2019). An overview of fish bioacoustics and the impacts of anthropogenic sounds on fishes. J. Fish Biol. 94, 692–713. doi: 10.1111/jfb.13948
Radford, C., Jeffs, A., Tindle, C., and Montgomery, J. C. (2008). Resonating sea urchin skeletons create coastal choruses. Mar. Ecol. Prog. Ser. 362, 37–43. doi: 10.3354/meps07444
Radford, C. A., Stanley, J. A., Tindle, C. T., Montgomery, J. C., and Jeffs, A. G. (2010). Localised coastal habitats have distinct underwater sound signatures. Mar. Ecol. Prog. Ser. 401, 21–29. doi: 10.3354/meps08451
Ramcharitar, J., Gannon, D. P., and Popper, A. N. (2006). Bioacoustics of fishes of the family sciaenidae (Croakers and Drums). Trans. Am. Fish. Soc. 135, 1409–1431. doi: 10.1577/T05-207.1
Reshef, E. S., Demer, D. A., Wiggins, S., and Baumann-Pickering, S. (2018). Chorusing Fish Behavioral Changes Potentially Linked to Climate Variability. Ocean Sciences Meeting 2018 Portland, Oregon, United States. Available online at: https://agu.confex.com/agu/os18/meetingapp.cgi/Paper/324358 (accessed February 12, 2018).
Rice, A. N., Soldevilla, M. S., and Quinlan, J. A. (2017). Nocturnal patterns in fish chorusing off the coasts of Georgia and eastern Florida. Bull. Mar. Sci. 93, 455–474. doi: 10.5343/BMS.2016.1043
Rodney Rountree’s Homepage on Fish Ecology (2020). Soniferous Fish. Available online at: http://www.fishecology.org/soniferous/soniferous.htm (accessed July 1, 2020)
Rogers, L. S., Putland, R. L., and Mensinger, A. F. (2020). The effect of biological and anthropogenic sound on the auditory sensitivity of oyster toadfish, Opsanus tau. J. Comp. Physiol. A 206, 1–14. doi: 10.1007/s00359-019-01381-x
Rountree, R. A., Gilmore, R. G., Goudey, C. A., Hawkins, A. D., Luczkovich, J. J., and Mann, D. A. (2006). Listening to fish: applications of passive acoustics to fisheries science. Fisheries 3, 433–446.
Rountree, R. A., and Juanes, F. (2010). First attempt to use a remotely operated vehicle to observe soniferous fish behavior in the Gulf of Maine, Western Atlantic Ocean. Curr. Zool. 56, 90–99. doi: 10.1093/czoolo/56.1.90
Rountree, R. A., Juanes, F., Goudey, C. A., and Ekstrom, K. E. (2012). “Is biological sound production important in the deep sea?,” in The Effects of Noise on Aquatic Life, eds A. N. Popper and A. Hawkins (New York, NY: Springer Science+Business Media), 181–183.
Rowell, T. J., Schärer, M. T., and Appeldoorn, R. S. (2018). Description of a new sound produced by Nassau Grouper at spawning aggregation sites. Gulf Caribbean Res. 29, GCFI22–GCFI26. doi: 10.18785/gcr.2901.12
Sánchez-Gendriz, I., and Padovese, L. R. (2017a). Temporal and spectral patterns of fish choruses in two protected areas in southern Atlantic. Ecol. Inform. 38, 31–38. doi: 10.1016/j.ecoinf.2017.01.003
Sánchez-Gendriz, I., and Padovese, L. R. (2017b). A methodology for analyzing biological choruses from long-term passive acoustic monitoring in natural areas. Ecol. Inform. 41, 1–10. doi: 10.1016/j.ecoinf.2017.07.001
Schneider, H. (1967). “Morphology and physiology of sound producing mechanisms in teleost fishes,” in Marine Bio-Acoustics, ed. W. N. Tavolga (New York, NY: Pergamon Press), 135–158.
Širović, A., Brandstatter, S., and Hildebrand, J. A. (2012). Fish recordings from NEPTUNE Canada. J. Acoust. Soc. Am. 132:1916. doi: 10.1121/1.4755031
Širović, A., Cutter, G. R., Butler, J. L., and Demer, D. A. (2009). Rockfish sounds and their potential use for population monitoring in the Southern California Bight. ICES J. Mar. Sci. 66, 981–990. doi: 10.1093/icesjms/fsp064
Slabbekoorn, H., Bouton, N., van Opzeeland, I., Coers, A., ten Cate, C., and Popper, A. N. (2010). A noisy spring: the impact of globally rising underwater sound levels on fish. Trends Ecol. Evol. 25, 419–427. doi: 10.1016/j.tree.2010.04.005
Soars, N., Byrne, M., and Cato, D. H. (2016). “Characterization of the sounds produced by temperate and tropical sea urchins during feeding (Diadematidae and Echinometridae),” in The Effects of Noise on Aquatic Life II, eds A. Popper and A. Hawkins (New York, NY: Springer), 1075–1080.
Tavolga, W. N. (ed.) (1964). “Marine bio−acoustics,” in Proceedings of a Symposium Held at the Lerner Marine Laboratory, Bimini, Bahamas, April 11 to 13, 1963, (New York, NY: Pergamon Press).
Time and Date AS (2020). Atlantic City. Available online at: https://www.timeanddate.com/sun/usa/atlantic-city?month=7&year=2006 (accessed July 1, 2020)
Tyack, P. L., and Clark, C. W. (2000). “Communication and acoustic behavior of dolphins and whales,” in Hearing by Whales and Dolphins, eds W. W. L. Au, A. N. Popper, and R. R. Fay (New York, NY: Springer), 156–224.
Wall, C. C., Rountree, R. A., Pomerleau, C., and Juanes, F. (2014). An exploration for deep-sea fish sounds off Vancouver Island from the NEPTUNE Canada ocean observing system. Deep Sea Res. I 83, 57–64. doi: 10.1016/j.dsr.2013.09.004
Keywords: continental shelf, soundscape, ocean noise, SW06 experiment, fish choruses
Citation: Zhang Q and Katsnelson B (2021) A Fish Chorus on the Margin of New Jersey Atlantic Continental Shelf. Front. Mar. Sci. 8:671965. doi: 10.3389/fmars.2021.671965
Received: 24 February 2021; Accepted: 11 May 2021;
Published: 15 June 2021.
Edited by:
DelWayne Roger Bohnenstiehl, North Carolina State University, United StatesReviewed by:
Aaron N. Rice, Cornell University, United StatesThomas Marcellin Grothues, Rutgers, The State University of New Jersey, United States
Copyright © 2021 Zhang and Katsnelson. This is an open-access article distributed under the terms of the Creative Commons Attribution License (CC BY). The use, distribution or reproduction in other forums is permitted, provided the original author(s) and the copyright owner(s) are credited and that the original publication in this journal is cited, in accordance with accepted academic practice. No use, distribution or reproduction is permitted which does not comply with these terms.
*Correspondence: Boris Katsnelson, bkatsnels@univ.haifa.ac.il
†These authors have contributed equally to this work