The Next Wave of Passive Acoustic Data Management: How Centralized Access Can Enhance Science
 Carrie C. Wall1,2*
  Samara M. Haver3,4
  Leila T. Hatch5
  Jennifer Miksis-Olds6
  Rob Bochenek7 Robert P. Dziak8 Jason Gedamke9
- 1Cooperative Institute for Research in Environmental Sciences, University of Colorado, Boulder, CO, United States
- 2NOAA National Centers for Environmental Information, Boulder, CO, United States
- 3Cooperative Institute for Marine Ecosystem and Resources Studies, NOAA Pacific Marine Environmental Laboratory and Oregon State University, Hatfield Marine Science Center, Newport, OR, United States
- 4Department of Fisheries, Wildlife, and Conservation Sciences, Oregon State University, Corvallis, OR, United States
- 5Gerry E. Studds Stellwagen Bank National Marine Sanctuary, NOAA Office of National Marine Sanctuaries, Scituate, MA, United States
- 6Center for Acoustics Research and Education, University of New Hampshire, Durham, NH, United States
- 7Axiom Data Science, LLC, Anchorage, AK, United States
- 8NOAA Pacific Marine Environmental Laboratory, Hatfield Marine Science Center, Newport, OR, United States
- 9Office of Science and Technology, NOAA Fisheries, Silver Spring, MD, United States
Passive acoustic data collection has grown exponentially over the past decade resulting in petabytes of data that document our ocean soundscapes. This effort has resulted in two big data challenges: (1) the curation, management, and global dissemination of passive acoustic datasets and (2) efficiently extracting critical information and comparing it to other datasets in the context of ecosystem-based research and management. To address the former, the NOAA National Centers for Environmental Information recently established an archive for passive acoustic data. This fast-growing archive currently contains over 100 TB of passive acoustic audio files mainly collected from stationary recorders throughout waters in the United States. These datasets are documented with standards-based metadata and are freely available to the public. To begin to address the latter, through standardized processing and centralized stewardship and access, we provide a previously unattainable comparison of first order sound level-patterns from archived data collected across three distinctly separate long-term passive acoustic monitoring (PAM) efforts conducted at regional and national scales: NOAA/National Park Service Ocean Noise Reference Station Network, the Atlantic Deepwater Ecosystem Observatory Network, and the Sanctuary Soundscape Monitoring Project. Nine sites were selected from these projects covering the Alaskan Arctic, Northeast and Central Pacific, Gulf of Mexico, Caribbean Sea, and Mid and Northwest Atlantic. Sites could generally be categorized into those strongly influenced by anthropogenic noise (e.g., vessel traffic) and those that were not. Higher sound levels, specifically for lower frequencies (<125 Hz), and proximity to densely populated coastal zones were common characteristics of sites influenced by anthropogenic noise. Conversely, sites with lower overall sound levels and away from dense populations resulted in soundscape patterns influenced by biological sources. Seasonal variability in sound levels across selected decidecade bands was apparent for most sites and often represented changes in the presence or behavior of sound-producing species. This first order examination of levels across projects highlights the utility of these initial metrics to identify patterns that can then be examined in more detail. Finally, to help the PAM community collectively and collaboratively move forward, we propose the next frontier for scalable data stewardship, access, and processing flow.
Introduction
Sound is important to marine ecosystems and essential to quantify ocean health. Marine mammals, fish, and invertebrates use sound to communicate with each other and navigate their environment (Hazlett and Winn, 1962; Fish and Mowbray, 1970; Watkins and Wartzok, 1985). For many species, reproductive success relies heavily on the ability to hear and be heard (e.g., Lobel, 2002; Au and Hastings, 2008). At the same time, sound from human activity, such as vessel traffic, has increased steadily over the past 70 years (National Research Council, 2003; McDonald et al., 2006; Miksis-Olds and Nichols, 2016). To help understand and monitor how marine animals use sound and the impacts of anthropogenic noise on these communication pathways, scientists throughout the world use passive acoustic monitoring (PAM; Holt et al., 2009; Jensen et al., 2009; Hatch et al., 2012; Nieukirk et al., 2012; Rolland et al., 2012; Houghton et al., 2015; Au and Lammers, 2016; Erbe et al., 2016; Haver et al., 2017; Hawkins and Popper, 2017; Marley et al., 2017; Dunlop, 2019; Howe et al., 2019). Ocean sound has been identified as an Essential Ocean Variable by the Global Ocean Observing System (Tyack and A Partnership for Observation of the Global Oceans International Quiet Ocean Experiment Working Group, 2017). PAM systems record sound in a single location, concurrently at multiple locations (array), or from a moving platform (Mellinger et al., 2007; Au and Lammers, 2016). Instruments are then recovered and analyzed by trained acousticians to extract the desired signal to support research and management applications (Van Parijs et al., 2009; Mooney et al., 2020).
Longer deployment periods through longer battery life and larger compact storage capacity, larger array sizes, higher sampling rates, and integration in new platforms like autonomous vehicles and seafloor observatories have allowed PAM data collection to grow exponentially over the past decade. The result is petabytes of data that document ocean soundscapes. Efficiently extracting this critical information and comparing it to other datasets in the context of ecosystem-based research management is a Big Data challenge that traditional desktop processing methods cannot address (Marx, 2013; Bhadani and Jothimani, 2016). Machine learning and artificial intelligence are increasingly playing a role in research applications for PAM datasets (Shamir et al., 2014; Shiu et al., 2020; Allen et al., 2021). The curation, management, and dissemination of passive acoustic datasets is another Big Data challenge where progress is just beginning.
The National Oceanic and Atmospheric Administration (NOAA) National Centers for Environmental Information (NCEI) have recently established a national archive for passive acoustic data. This archive is designed to steward large volumes of raw acoustic data and enable discovery, query, and accessibility of those data through an ESRI web-based map service (NOAA National Centers for Environmental Information, 2017). Since 2018, NCEI has partnered with Google through the NOAA Big Data Program to provide free and immediate access to archived datasets using google cloud platform (GCP). The archive hosts datasets from the ocean noise reference station network (NRS); Atlantic deepwater ecosystem observatory network (ADEON), and the sanctuary soundscape monitoring project (SanctSound; NOAA OAR Pacific Marine Environmental Laboratory et al., 2014; NOAA Office of National Marine Sanctuaries, and U.S Navy, 2020i; University of New Hampshire, and JASCO Applied Sciences, 2020).
Noise reference station network is a unique national-scale collaborative effort across NOAA Oceanic and Atmospheric Research, national marine fisheries service (NMFS), and national ocean service, and the department of interior national park service (NPS). This project has been collecting consistent and comparable acoustic datasets since 2014 covering all major regions of the United States coasts, from the Arctic to the Tropics (Haver et al., 2018). The objective of this project is to monitor long-term changes and trends in the underwater ambient sound field.
Deployed in 2017, ADEON is a regional-scale array supported by the National Oceanographic Partnership Program (NOPP) involving the Bureau of Ocean Energy Management (BOEM), the Office of Naval Research (ONR), and NOAA to generate long-term measurements of both the natural and human factors contributing to the soundscape of the United States Mid- and South Atlantic Outer Continental Shelf. These data are being used to provide a mechanistic understanding of the cumulative impacts these factors have on marine resources. The goal of this project is to provide data for the greater community in support of efforts that will potentially provide insight for effective ecosystem-based management efforts.
Initiated in 2018, SanctSound represents a collaboration between NOAA and the US Navy along with numerous scientific partners to study sound on a national scale within seven national marine sanctuaries and one marine national monument. The recording locations include waters off Hawai’i and the east and west coasts of the United States. Standardized measurements produced from this effort are being used to assess sounds produced by marine animals, physical processes (e.g., wind and waves) and human activities. Particular attention has been paid to documenting baseline acoustic conditions in sanctuaries.
The NCEI national archive has recently expanded to include datasets from the NOAA NMFS Alaska Fisheries Science Center, Northeast Fisheries Science Center, and Pacific Island Fisheries Science Center. To date, the archive holds over 100 TB of data consisting primarily of audio files along with some derived data products. However, with the generation of derived data products and intended inclusion of the multiple petabytes already collected by NOAA, NPS, and BOEM- and US Navy-funded programs, the archive is positioned to grow exponentially in the coming years.
Standardized soundscape measurement routines and metrics are essential for comparing datasets across large spatio-temporal scales. Best practices, particularly for deriving ambient sound level statistics from long time series data, have been implemented across all three projects (Haver et al., 2018; Heaney et al., 2020; Martin et al., 2021). These practices are driven by established international standards in acoustic terminology [International Organization for Standardization (ISO), 2017; Ainslie et al., 2018]. Recommendations from several international workshops focused on long term trends in ambient sound level measurements have centered on the use of decidecade bands, also known as one-third octaves, with an averaging window of 1 m (International Whaling Commission et al., 2014; Consortium for Ocean Leadership, 2018; International Quiet Ocean Experiment, 2020). These parameters reflect the minimum acceptable resolution, with higher resolution spectral (1 Hz bands) and temporal (1-s averages) parameters desired when feasible. These minimum recommendations balance the amount of information available for comparison with limitations to process and store large datasets (Martin et al., 2021). Recently, a hybrid millidecidecade spectra has been proposed to quantify ambient sound levels (Martin et al., 2021). This new approach has not been applied widely across projects but it could provide a meaningful metric that captures many sources of sound contributing to the soundscape with greater resolution than decidecade, particularly for low frequencies, and offer greater volume compression compared to straight 1 Hz bands. Temporal analysis windows of 1 day to 1 month are noted as the minimum recommendation for establishing long-term (monthly, seasonal, and annual) statistics of the ambient sound levels with desirable analysis windows as short as 1 h (International Quiet Ocean Experiment, 2020). Following these guidelines, the SanctSound project has established hourly decidecade bands created from 1-s observations as one of the standardized metrics calculated across all project sites to enable comparative analysis. Similarly, ADEON has established 1-s decidecade bands as one of the standardized metrics calculated across all the ADEON recording sites.
To leverage existing analyses and community standards, we calculate and compare hourly decidecade ambient sound level measurements of three large-scale, long-term monitoring efforts (NRS, ADEON, and SanctSound) for the first time thanks to the unifying nature of the NCEI passive acoustic archive. While higher resolution metrics, such as 1 Hz bands or millidecades would provide greater information on the contributions of sound for lower frequencies where noise from wind, waves and natural seismic events are recorded, decidecades successfully capture sound levels from human activity and vocalizations of most marine organisms. Notably, this metric produces manageable file sizes to visualize and share. We also lay out the next frontier of passive acoustic data management for scalable data stewardship and access with a focus on community-driven processing tools to help the community more forward collectively and collaboratively.
Materials and Methods
The NCEI passive acoustic archive holds metadata, raw audio files, calibration information and, for some deployments, data products (NOAA National Centers for Environmental Information, 2017). Datasets submitted to the archive arrive in a standardized structure and are accompanied by standards-based metadata that describe the location, purpose, data collection methods, and data quality information. This standardization supports a highly automated workflow during which audio files are compressed using FLAC (Free Lossless Audio Codec) and stored on a robotic tape system, and a spatial database is populated with the associated ISO 19115-2 compliant metadata. The archive’s database schema follows Tethys, a system developed as a community standard for representing spatial-temporal passive acoustic metadata (Roch et al., 2013). Datasets are discoverable through the archive’s map viewer where filtering is driven by fields in the database (e.g., sample rate, duty cycle, platform type). The data are also hosted on GCP where they can be accessed immediately compared to the asynchronous requests that the cost-effective tape storage requires. To ensure proper credit back to the original data generators, digital object identifiers (DOIs) are minted for each project. Each DOI provides a permanent citation for future users to include in their publications involving archived datasets. These citations also facilitate tracking the re-use of archived datasets.
Nine stationary recording sites were selected from archived NRS, ADEON, and SanctSound deployments spanning multiple years and depth ranges across the United States (Figure 1 and Table 1).
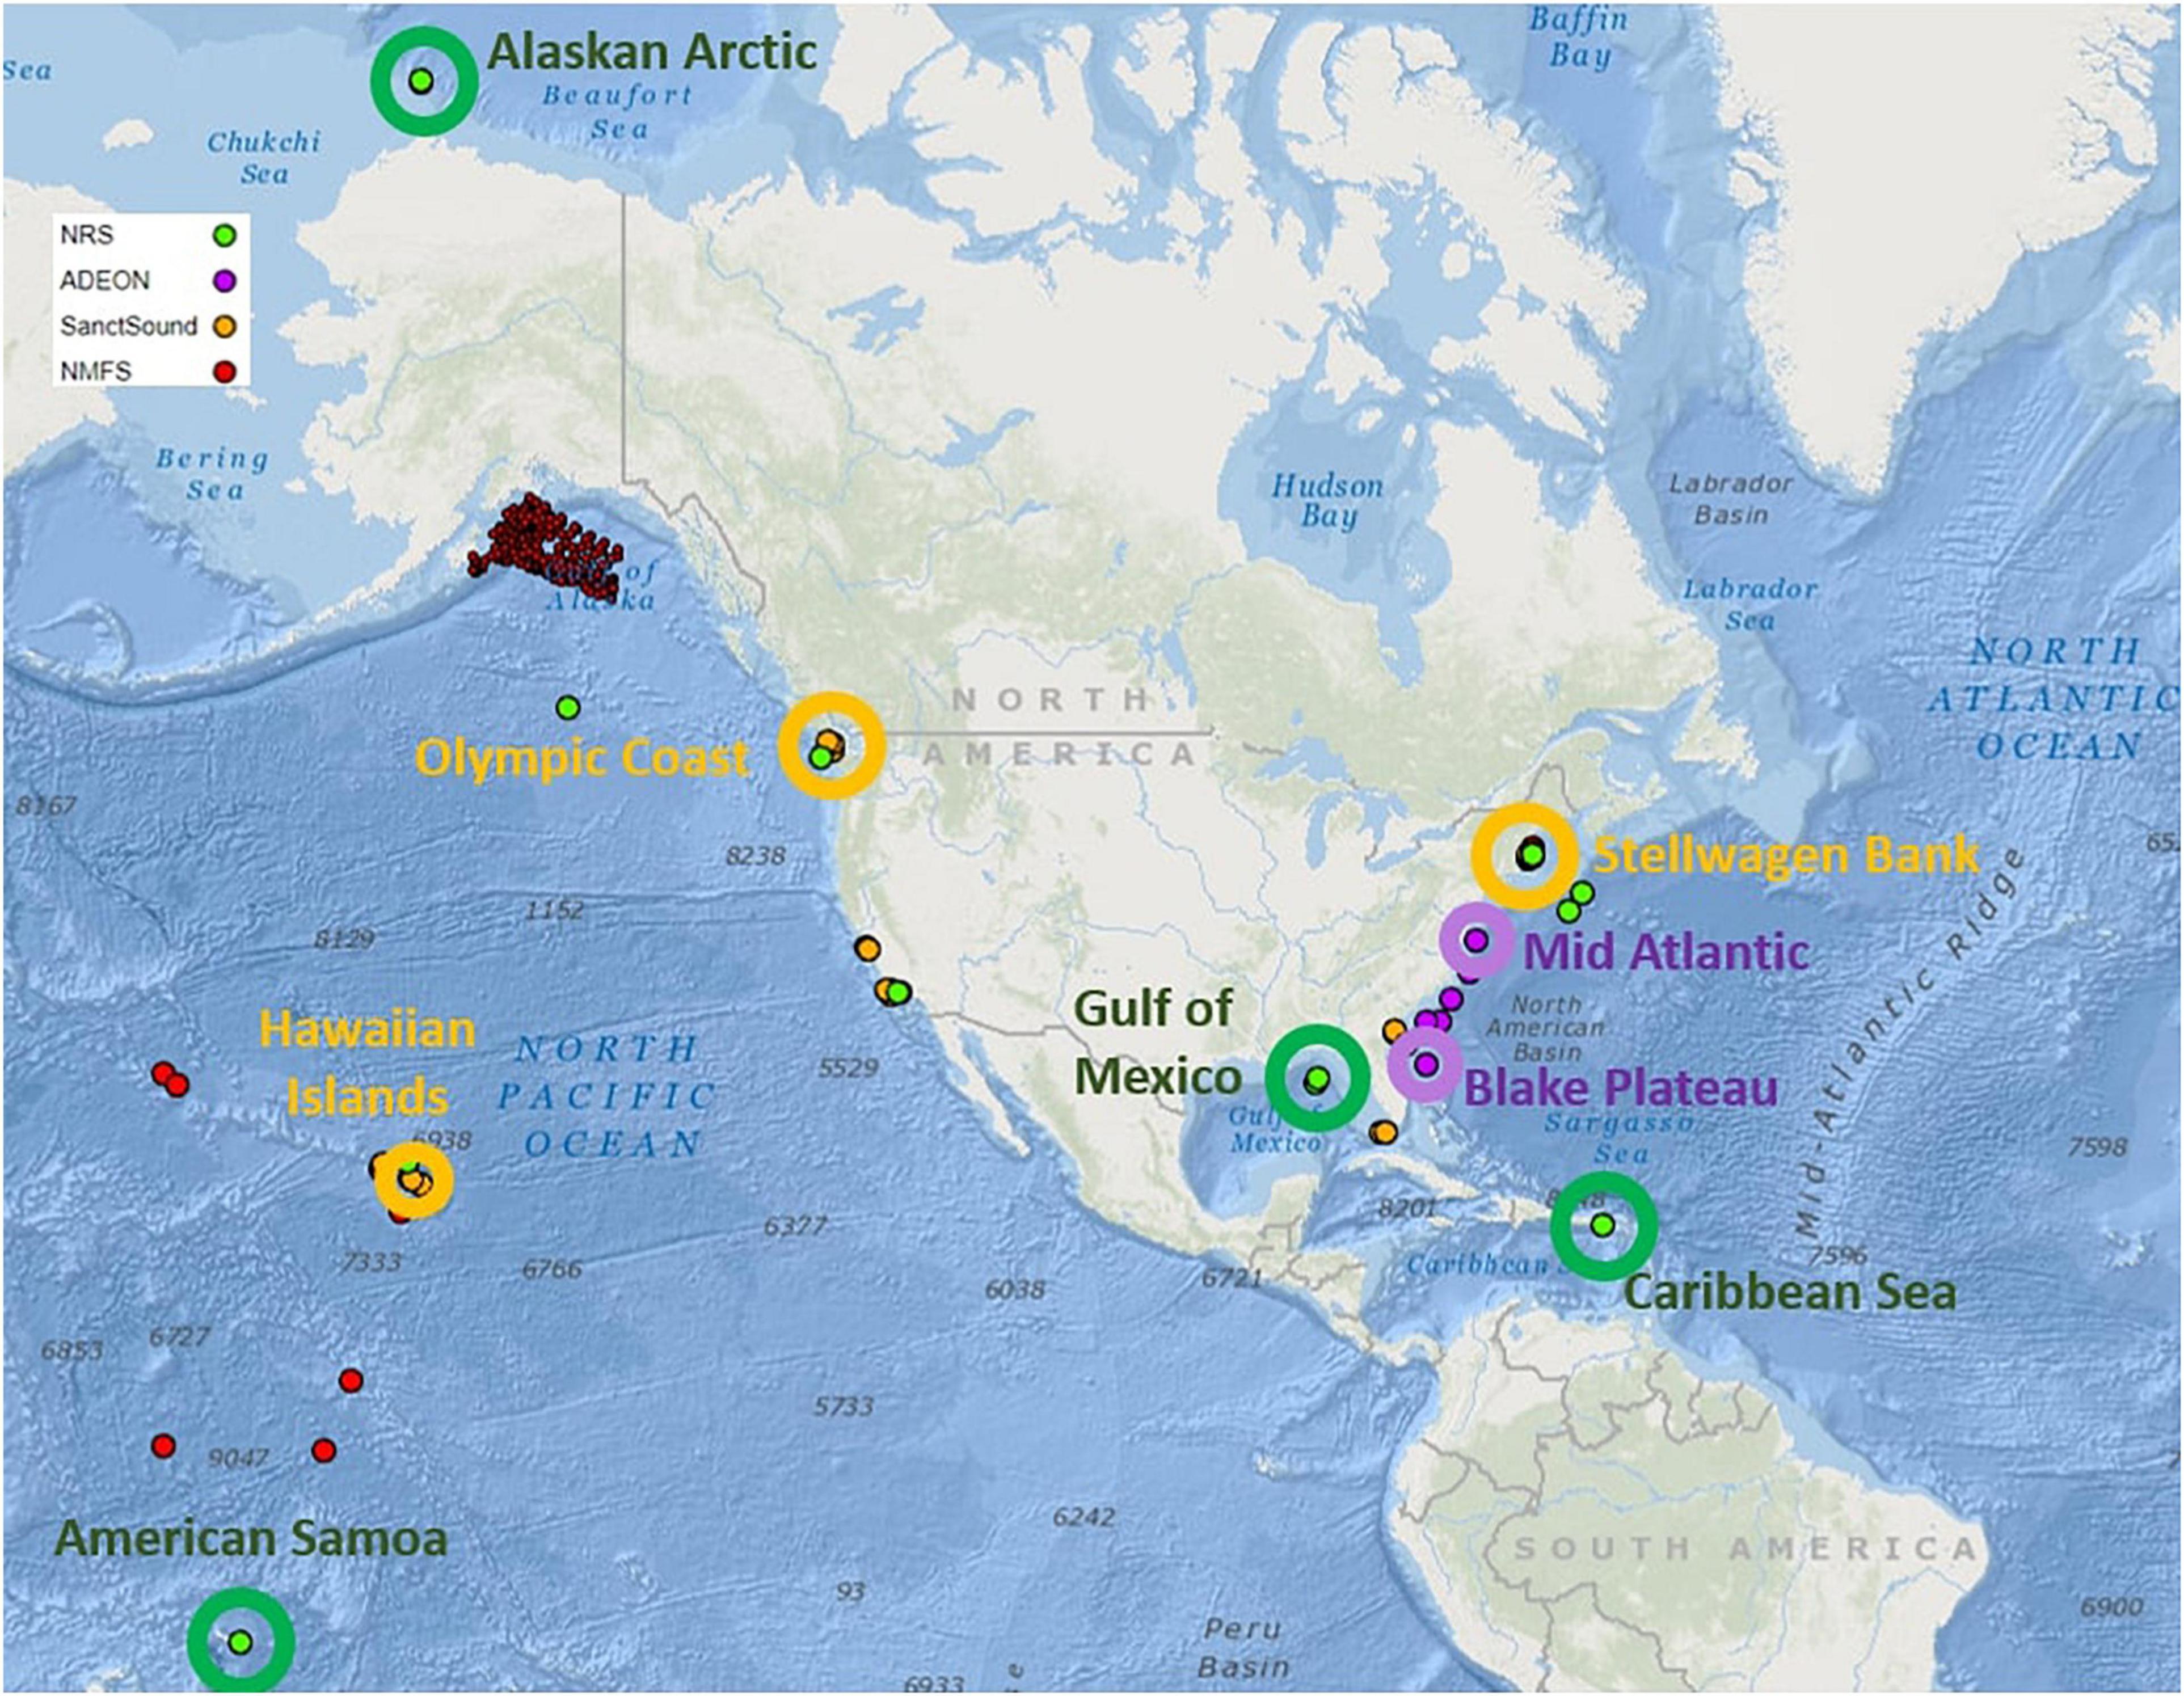
Figure 1. Recording sites selected from the NCEI passive acoustic archive for analysis across the NRS (green open circles), ADEON (purple open circles), and SanctSound (orange open circles) projects. The red circles represent datasets collected by National Oceanic and Atmospheric Administration (NOAA) Fisheries Science Center monitoring programs.
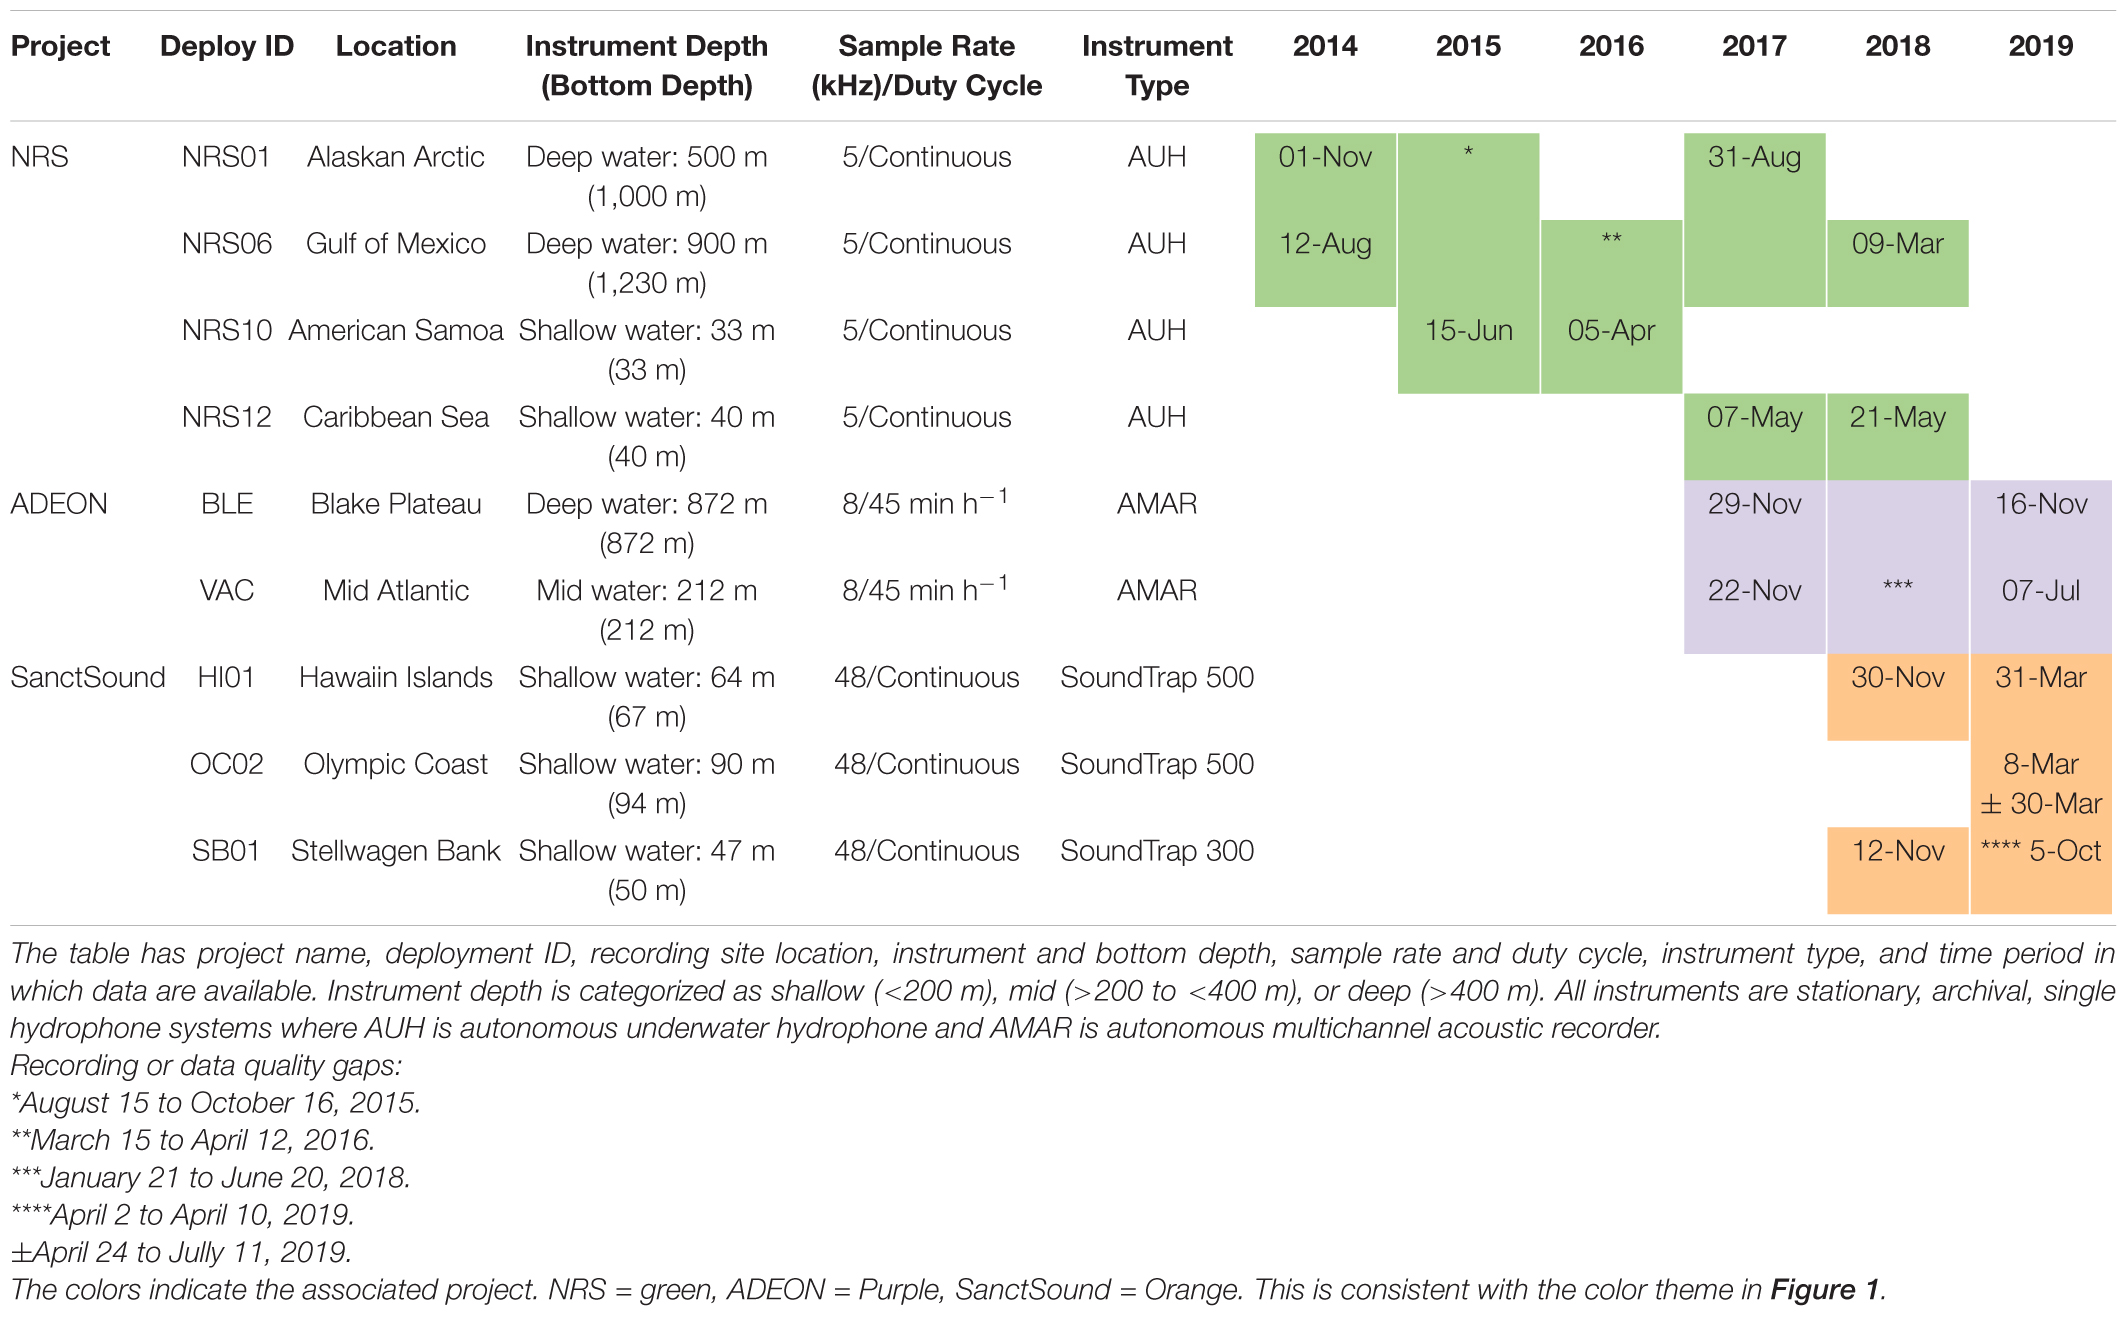
Table 1. Archived deployments selected for analysis.
Ocean Noise Reference Station Network
Ocean noise reference station network recorders collect data continuously at a sample rate of 5 kHz with a 2 kHz low pass cutoff frequency using calibrated and standardized stationary recorders across 12 locations (see Figure 1, green dots). Archived audio files from the four selected NRS sites were copied from the NCEI GCP bucket to the University of Colorado High Performance Computing (CU HPC) system. The files were calibrated to account for hydrophone sensitivity and frequency-dependent preamplifier gain curves between 10 Hz and 2 kHz specific to each deployment prior to calculating long-term spectral averages (LTSA) with 1 Hz/1 s resolution. Decidecade values were calculated by integrating the 1 Hz/1 s resolution LTSA mean-square pressure decidecade bands for center frequencies ranging from 13 to 1,600 Hz. The result was then calculated per hour using the median for each hourly bin of decidecade values. These analyses were completed using Matlab 2019b (Mathworks, Natick, MA, United States) run on the CU HPC. Martin et al. (2021) provides details on the calculation of decidecade sound pressure level (SPL) bands including Matlab scripts to calculate decidecade values.
Atlantic Deepwater Ecosystem Observatory Network
Atlantic deepwater ecosystem observatory network recorders collect data for 45 min per hour at a sample rate of 8 kHz and 3 min per hour at sample rate of 375 kHz using calibrated (Warren et al., 2018) and standardized stationary recorders across seven locations (see Figure 1, purple dots). Only the 8 kHz data from the selected sites were used in this analysis due to the high temporal coverage compared to the 375 kHz time series. 1-s resolution decidecade bands were calculated as outlined in Martin et al. (2021) with the nominal center frequencies ranging from 10 to 4,000 Hz. This work was completed by ADEON analysts and made available for public distribution (Miksis-Olds and Martin, 2019). These derived products were fed into the CU HPC to calculate hourly decidecade values using the median value in each time block.
Sanctuary Soundscape Monitoring Project
Sanctuary soundscape monitoring project recorders collect data continuously at 48 kHz using calibrated and standardized stationary recorders across 30 locations (see Figure 1, orange dots). Hourly decidecade values were calculated by integrating the pressure spectral density estimates of the mean-square pressure with a 1 Hz/1 s resolution over decidecade bands for nominal center frequencies ranging from 25 to 20,000 Hz for all sites. The result was then calculated per hour as a median over no less than 1,800 1-s values for that hour. This work was completed by SanctSound analysts using Triton–Soundscape Metrics Remora,1 and submitted for archive at NCEI along with the raw audio files (NOAA Office of National Marine Sanctuaries, and U.S Navy, 2020a–2020h).
Analysis
The 10th, 50th, and 90th percentile of each hourly decidecade band was calculated to visualize the amplitude and variation of sound across all sites. Further, the median values for all months in each decidecade band was calculated for each site. Monthly decidecade anomalies were then calculated by subtracting each monthly decidecade median from the median of all months from that site. Values above zero indicate that the sound recorded in that decidecade band during that month was louder than the median of that decidecade band recorded throughout the entire recording period. The anomaly time series allowed for quick and easy identification of seasonal patterns.
Four decidecade bands were selected for comparison across the nine recording sites and three projects based on overlapping frequencies and their applicability to first order examination of biological and anthropogenic sound sources (EU Marine Strategy Framework Directive, 2008). Nominal center frequencies selected were
1. (1) 63 Hz, which includes noise from large vessels and some mysticete vocalizations
2. (2) 125 Hz, which includes sounds from some fish calls and mysticete vocalizations, and vessels
3. (3) 315 Hz, which represents sounds from some fish calls and components of humpback whale vocalizations, vessels, and natural abiotic sound sources
4. (4) 1,600 Hz, which includes natural abiotic sources and vessel noise.
The 63 and 1,600 Hz decidecade monthly median for March and November were compared across the sites to visualize the spatial variability of relative sound levels during a representative spring and fall time period. Due to a lack of recording during November, the fall sound levels are represented by data recorded in October for the Olympic Coast and December for the Hawaiian Islands sites. A non-parametric version of the one-way analysis of variance (Kruskal–Wallis test) was performed on the hourly 63 and 1,600 Hz decidecade values recorded in the spring and fall representative months (March and November unless otherwise noted) to determine whether data from each group have a common mean (Equation 1).
Where N is the total number of observations (here the hourly median SPL for a decidecade band) across all groups; g is the number of groups; ni is the number of observations in group i; rij is the range (among all observations) of the observation j from group i; ri. is the average range of all observations in group i; r is the average of all the rij.
Using Tukey’s honestly significant difference test (HSD), a matrix of pairwise comparisons of the group means was created from the Kruskal–Wallis results to identify which pairs of group means differed significantly (Equation 2).
Where Mi – Mj is the difference between the pair of means, MSw is the mean square within, and n is the number in the group. P values less than 0.01 are considered significantly different.
The above analyses were completed using Matlab 2020b (Mathworks, Natick, MA, United States) and spatial maps were created using ArcGIS (ESRI, Redlands, CA, United States).
Results
The nine recording sites selected from the ongoing NRS, ADEON, and SanctSound monitoring projects represent diverse locations and environments throughout the United States exclusive economic zone. Figure 2 illustrates the hourly decidecade SPLs between 25 and 2,000 Hz for the selected sites. The Gulf of Mexico site recorded consistently higher SPL up to 200 Hz (104.1 dB median) compared to the other sites (76.2–94.3 dB median) throughout the recording period. Conversely, the Alaskan Arctic site recorded the lowest median SPL (77.9 dB) compared to the other sites (78.4–97.3 dB) but some variability in amplitude was observed especially below 200 Hz. The American Samoa and Caribbean Sea sites were fairly consistent in the levels recorded, and contained the lowest average standard deviation for the recording period (2.5 and 4 dB, respectively). Similar to the Gulf of Mexico site, the Mid Atlantic, Blake Plateau, Stellwagen Bank, and Olympic Coast sites soundscapes were characterized by high amplitude sounds below 200 Hz throughout the recording period (median SPL below 200 Hz: 92.2, 89.3, 88.4, and 94.3 dB, respectively). The Hawaiian Islands site was marked by an increase in amplitude between 160 and 1,600 Hz at the beginning of 2019.
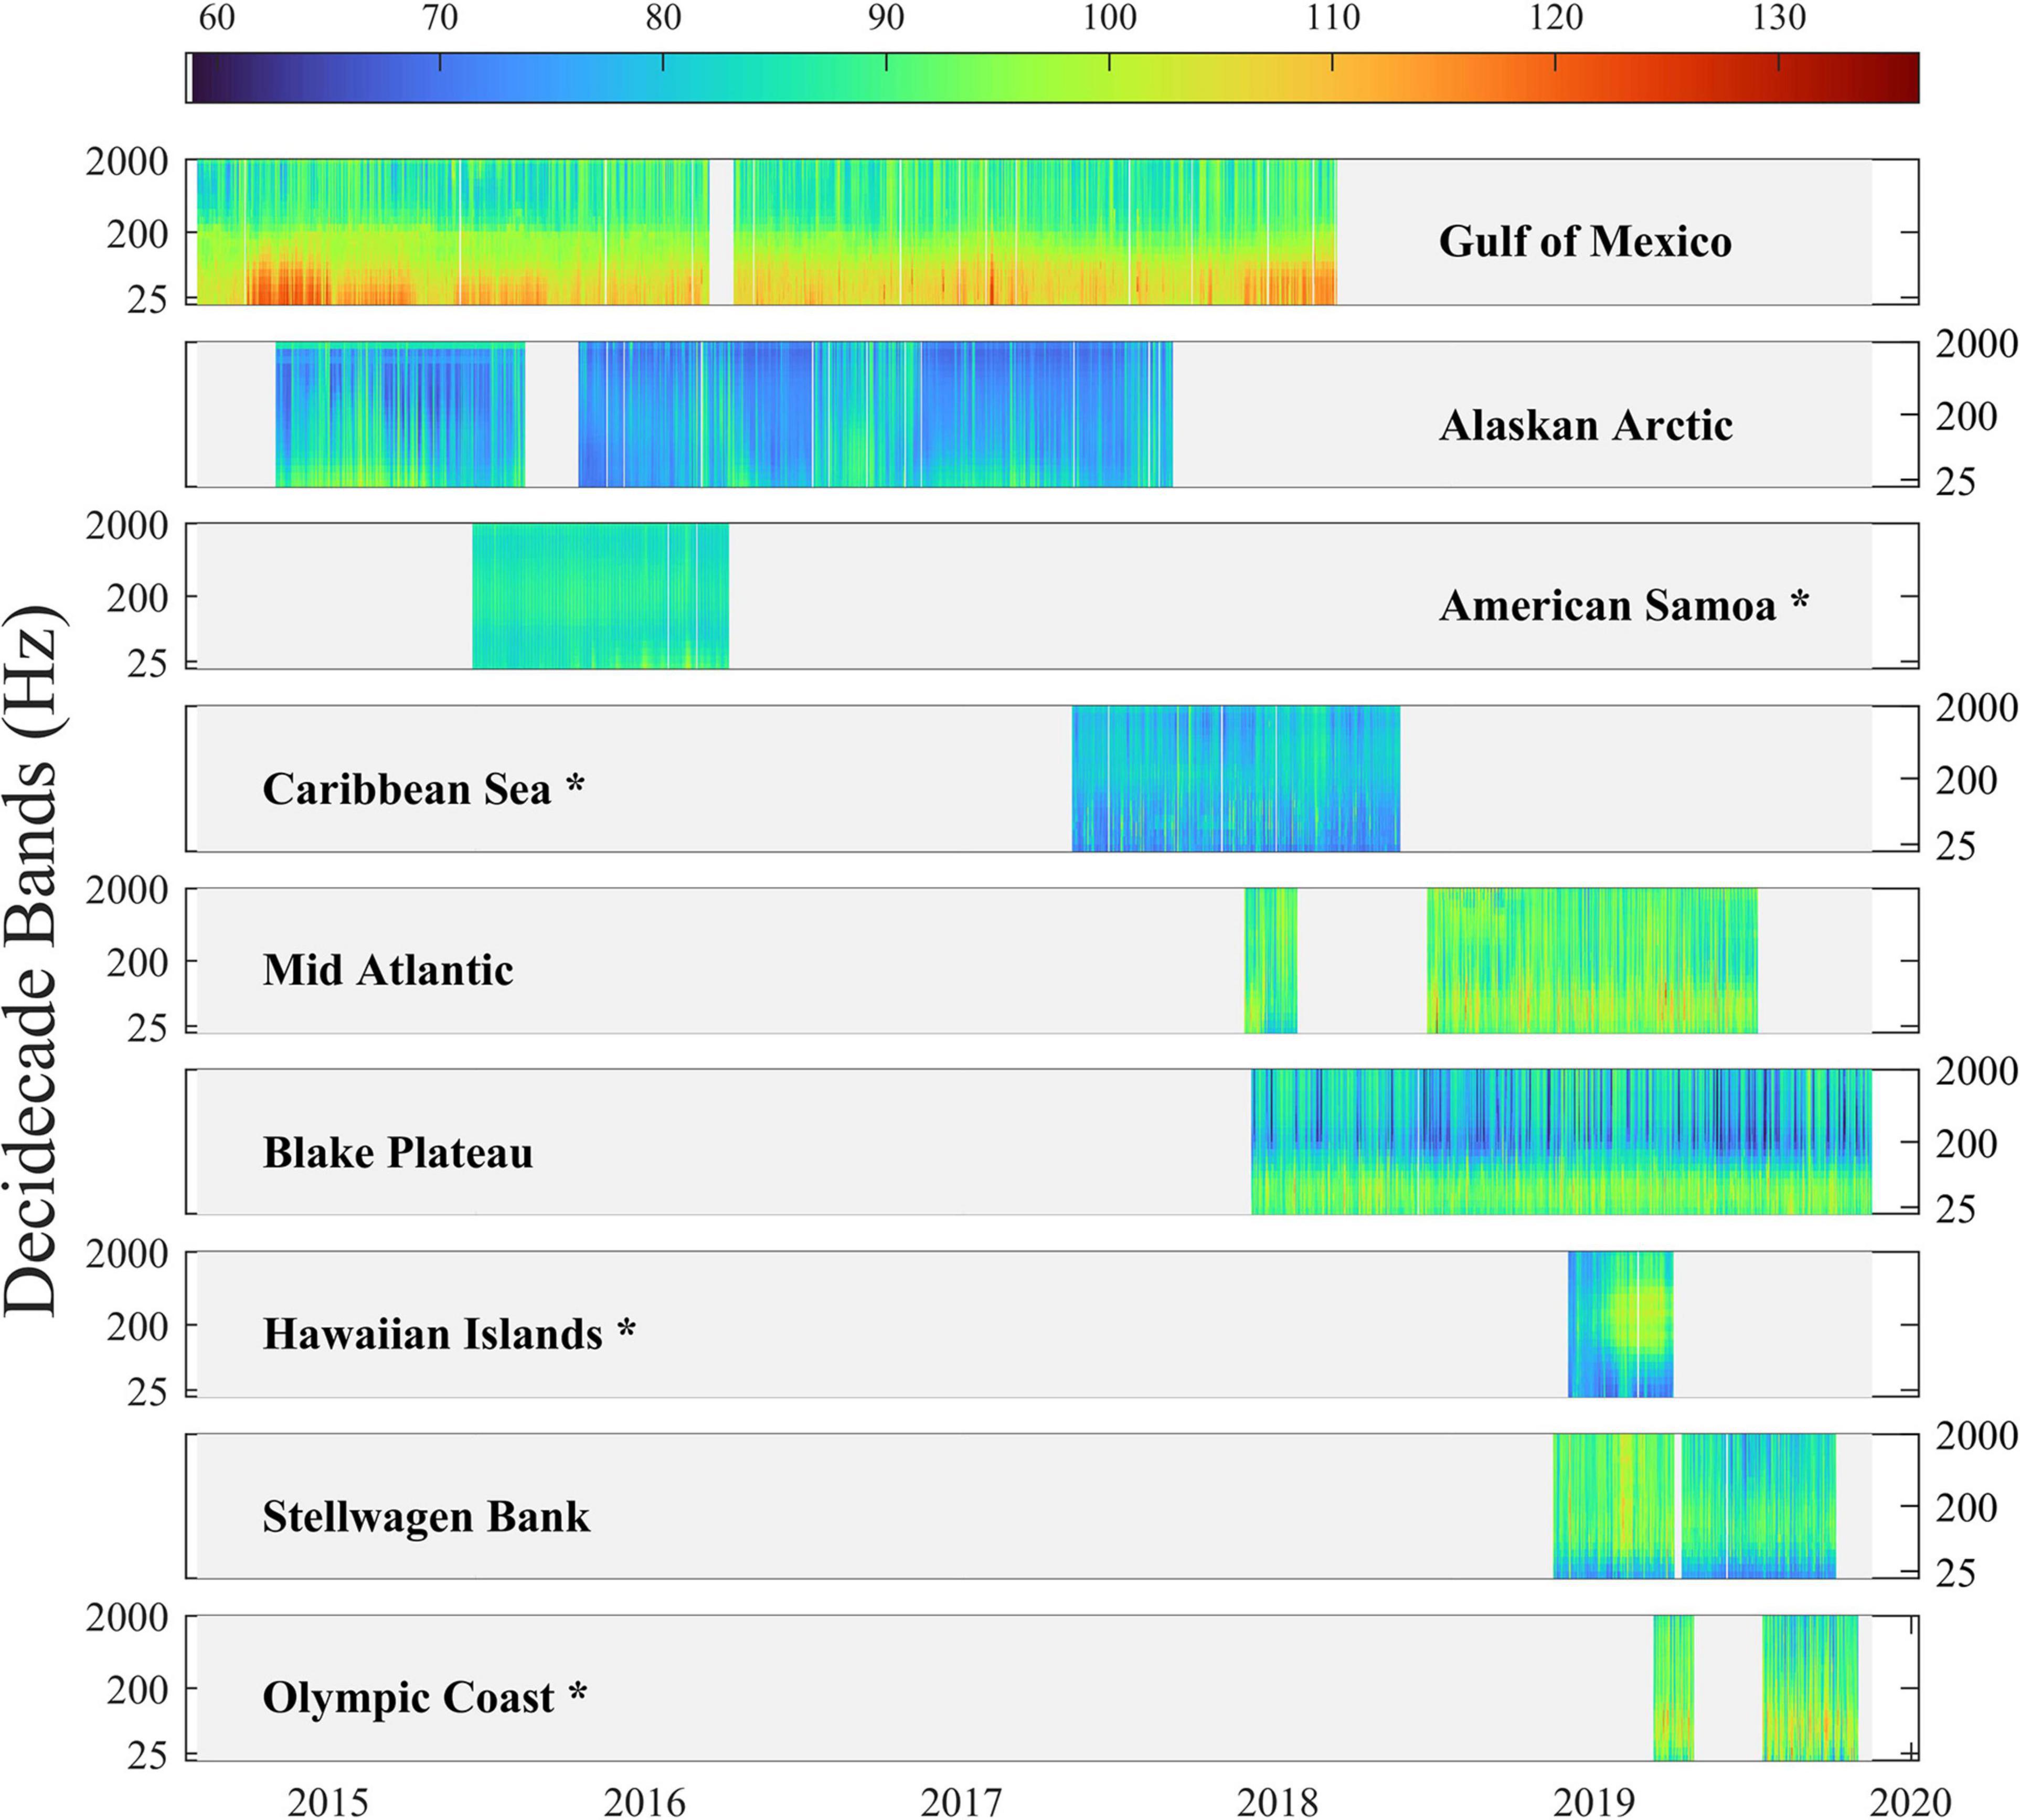
Figure 2. Temporal coverage of acoustic recordings for the nine sites. Spectrograms depict the sound pressure level (dB re 1 μPa2) of each hourly decidecade band by site. The frequency range is limited from 25 to 2,000 Hz, which reflects the common frequencies across all recordings. *Indicates a shallow water site. Note the y-scale represents decidecade bands and is non-linear.
The 10th, 50th, and 90th percentile spectrum levels for each decidecade band show the most common and least common sounds across for the recording period (Figure 3). This soundscape summary enables ambient sound levels to be compared across sites irrespective of sampling period. The Gulf of Mexico, Olympic Coast, Mid Atlantic, Blake Plateau, and Stellwagen Bank sites contain the highest amplitude for bands less than 250 Hz with peaks at 63 Hz. American Samoa, Alaskan Arctic, Hawaiian Islands, and Caribbean Sea have a different spectral pattern. American Samoa and Alaskan Arctic sites steadily decrease in amplitude with increasing frequency. The Hawaiian Islands site peaks between 200 and 630 Hz and again between 10,000 and 20,000 Hz. The Caribbean Sea site slowly increases in amplitude with increasing frequency but overall remains low compared to the other sites save the Alaskan Arctic, which contains the lowest amplitude of all from 125 to 1,600 Hz.
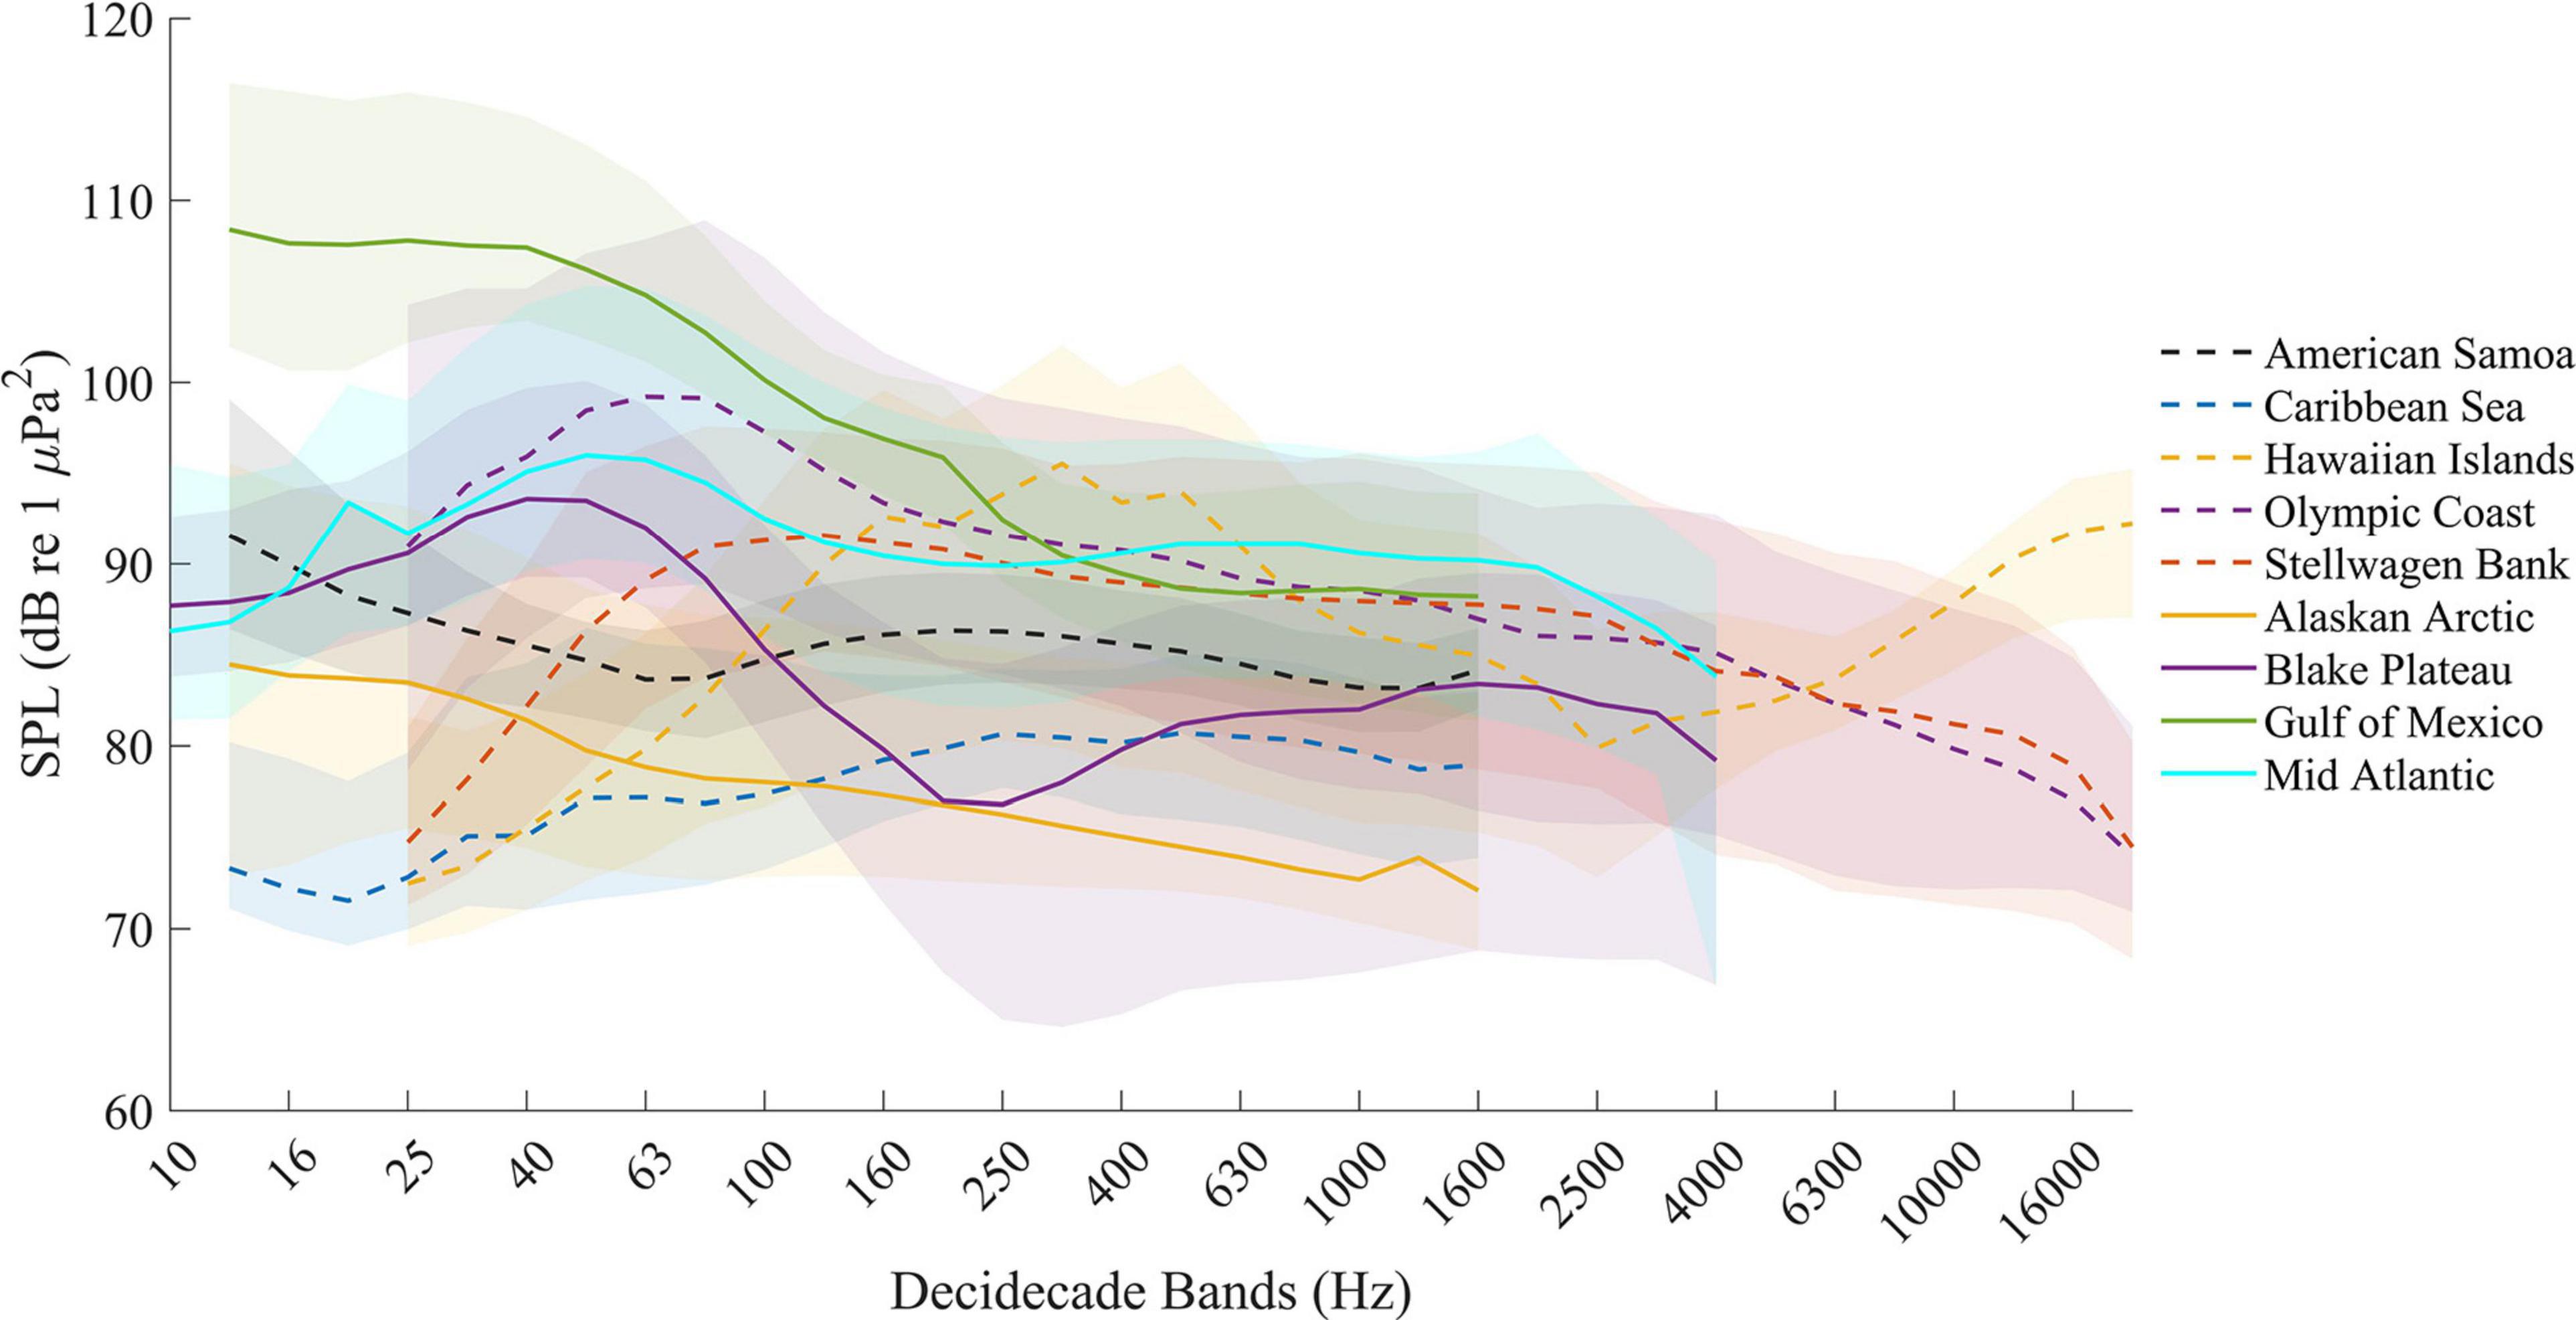
Figure 3. Median (50th percentile) spectrum levels (line) for each hourly decidecade band by site. Dashed lines indicate a shallow water site (<200 m) while solid lines indicate a mid (>200 and <400 m) or deep (>400 m) water site. The shaded regions represent the 10th (lower) and 90th (upper) percentiles of each decidecade band. Spectrum levels are limited by each site’s sample rate and therefore do not span all frequencies in the x-axis. Note the x-axis shows the decidecade band and is therefore non-linear.
Seasonal variability in the soundscape is depicted in the monthly median anomalies. Figure 4 shows these anomalies for the 63, 125, 315, and 1,600 Hz decidecade bands for all sites where at least 12 months of data were recorded. The Alaskan Arctic recorded higher amplitude sounds from late summer to the fall (August to approximately November) for all four bands with a slight peak in late winter (February to March). Stellwagen Bank also showed a wintertime peak with increased amplitude in February for all four bands and a decrease in amplitude in the summer (May to September). This pattern is most apparent in the 1,600 Hz band. A similar summertime (June to September) trough is apparent for the Blake Plateau site. Interestingly, the Mid Atlantic site, which is closest in geographic proximity to the Blake Plateau site, has the opposite pattern with peaks in amplitude around July especially for the 1,600 Hz band. Although the trend is more muted, the Gulf of Mexico and Caribbean Sea sites also show seasonality in sound levels. The Gulf of Mexico is characterized by higher amplitudes in the late fall/early Spring (October to April) and decreased amplitudes in the summer (May to September) for all bands. The Caribbean Sea was generally lowest in the summer (June to July) and highest in the late summer/fall (August to November) for the 63 Hz and 125 Hz bands. However, the 1,600 Hz band was lowest in the fall (October and November) and varies little after March for the 315 Hz band. All bands showed a peak in amplitude in February.
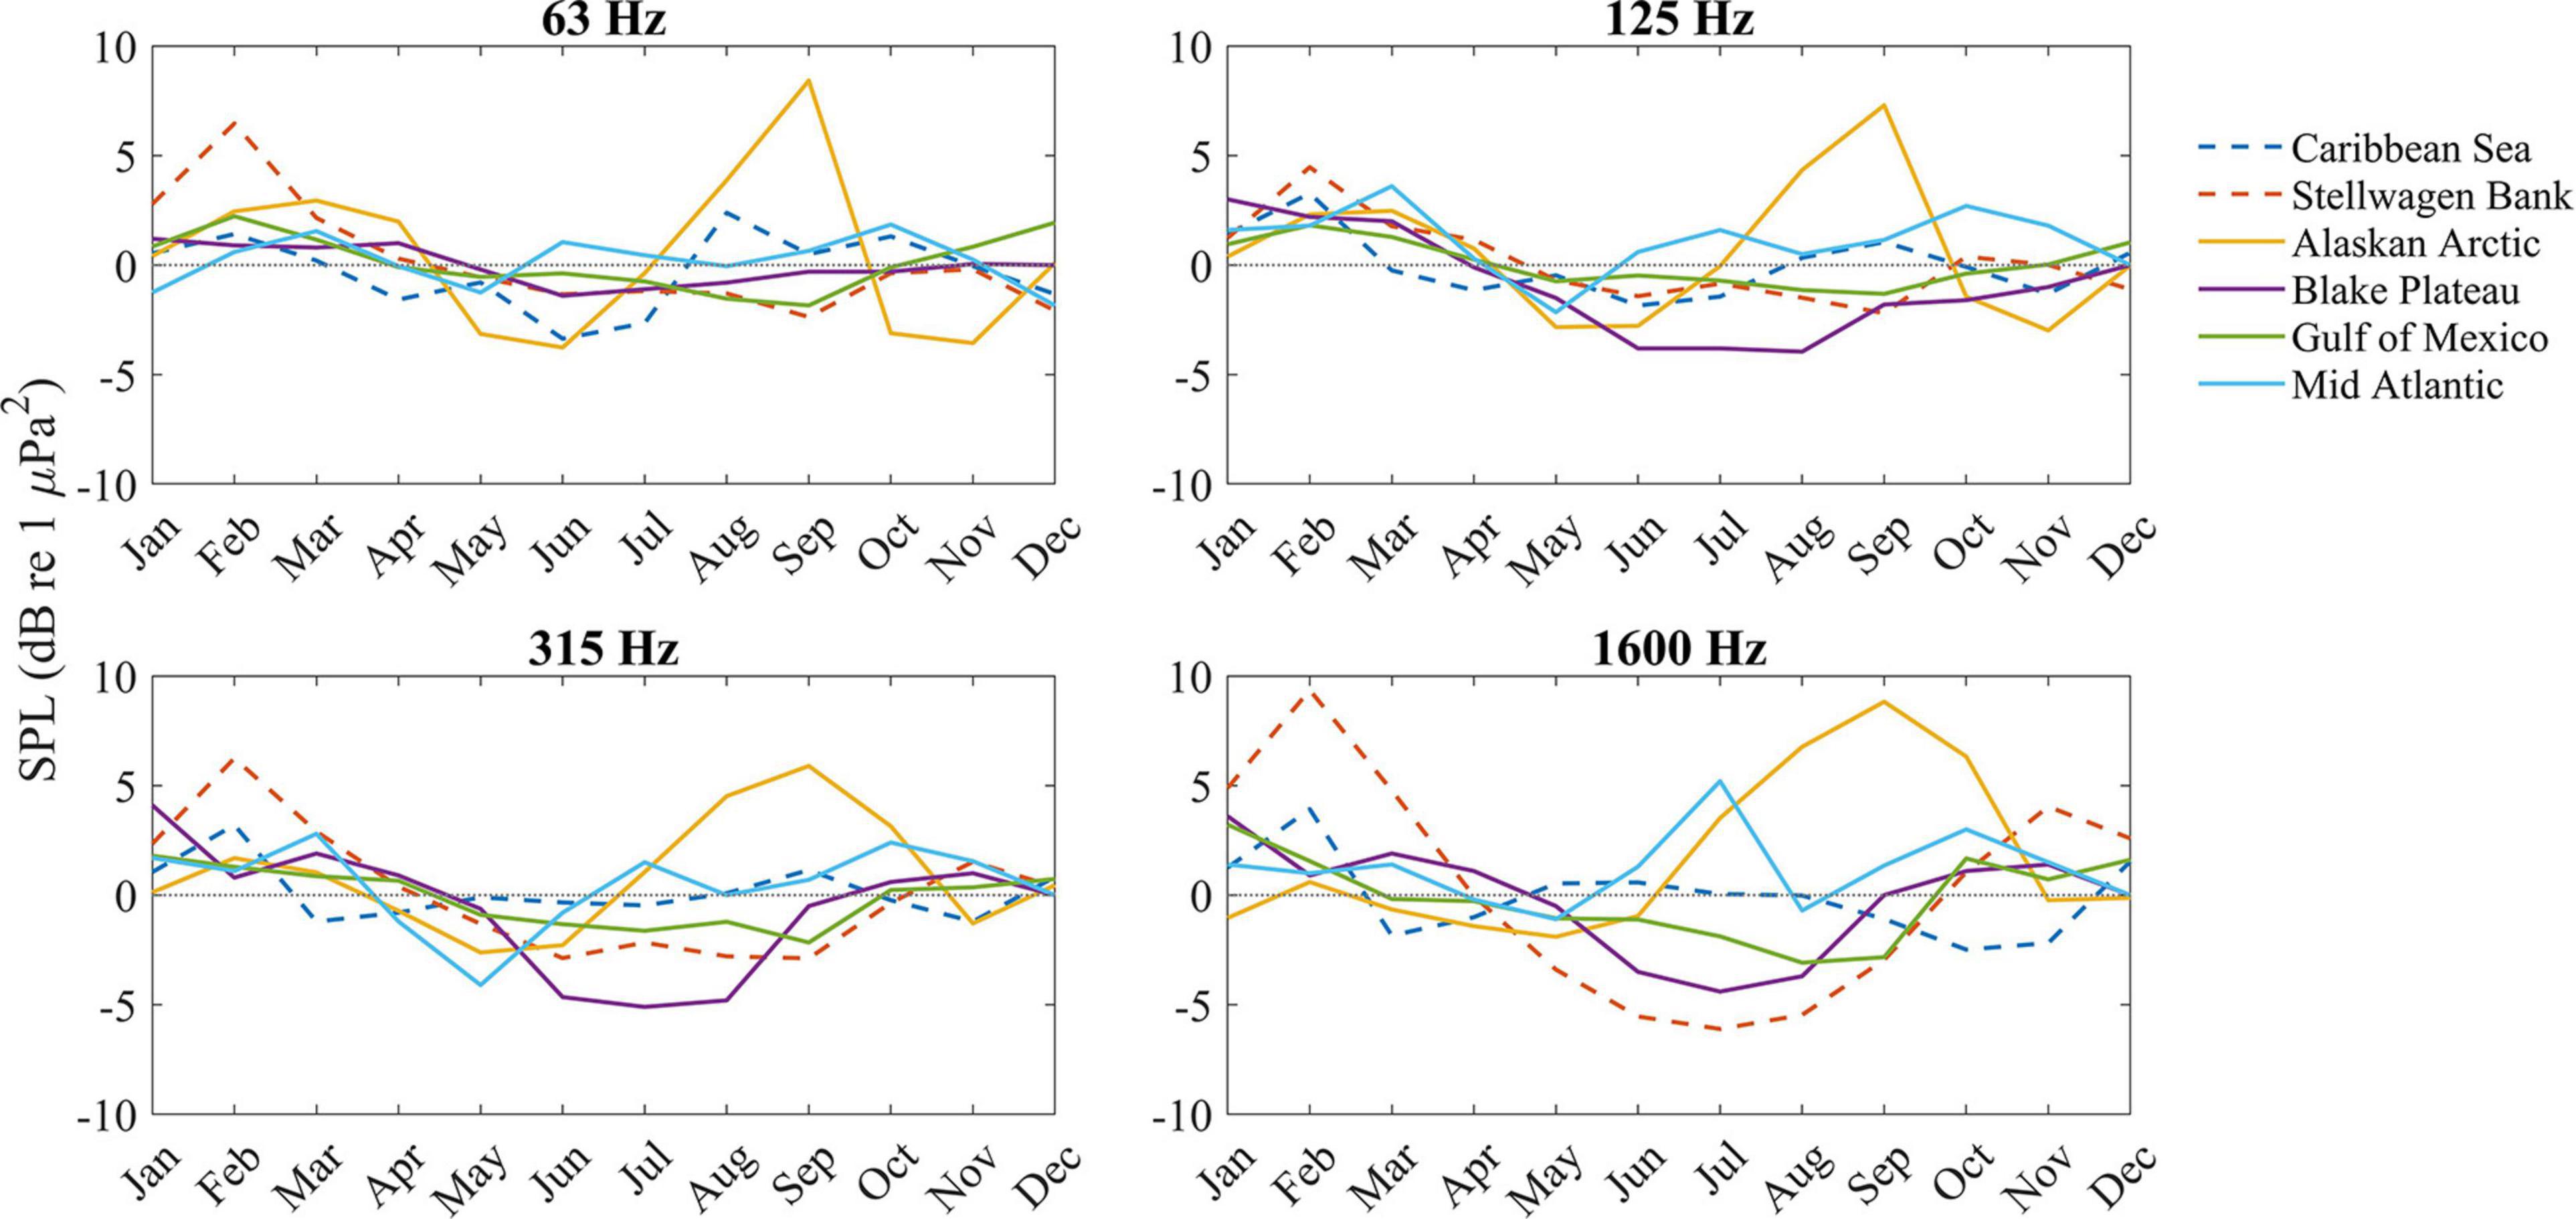
Figure 4. Monthly median anomalies for the 63, 125, 315, and 1,600 Hz decidecade bands. Lines above zero (gray dotted line) indicate that that month’s median sound level was higher than the median sound level for all months recorded in that band. Lines below zero indicate a lower median sound level for that month compared to the median across all months. Dashed lines indicate a shallow water site while solid lines indicate a mid or deep water site. Data from Hawaiian Islands, Olympic Coast, and American Samoa are not included because the deployments did not span a full 12-month period.
Monthly median anomalies plotted by site for representatives of a shallow water (Caribbean Sea), mid water (Mid Atlantic), and deep water recording location (Gulf of Mexico) further demonstrate the variability in sound levels across the four selected decidecade bands throughout the year (Figure 5). The Caribbean Sea shallow water site and Mid Atlantic mid water site show a less consistent trend in seasonal variability compared to the Gulf of Mexico deep water site. An interesting similarity across all sites and all frequencies is above average SPL in February and below average SPL in May with the only exception being 1,600 Hz decidecade band in the Caribbean Sea where SPL was higher than the site’s overall median in May. This trend is also apparent for Stellwagen Bank, Alaskan Arctic, and Blake Plateau (see Figure 4).
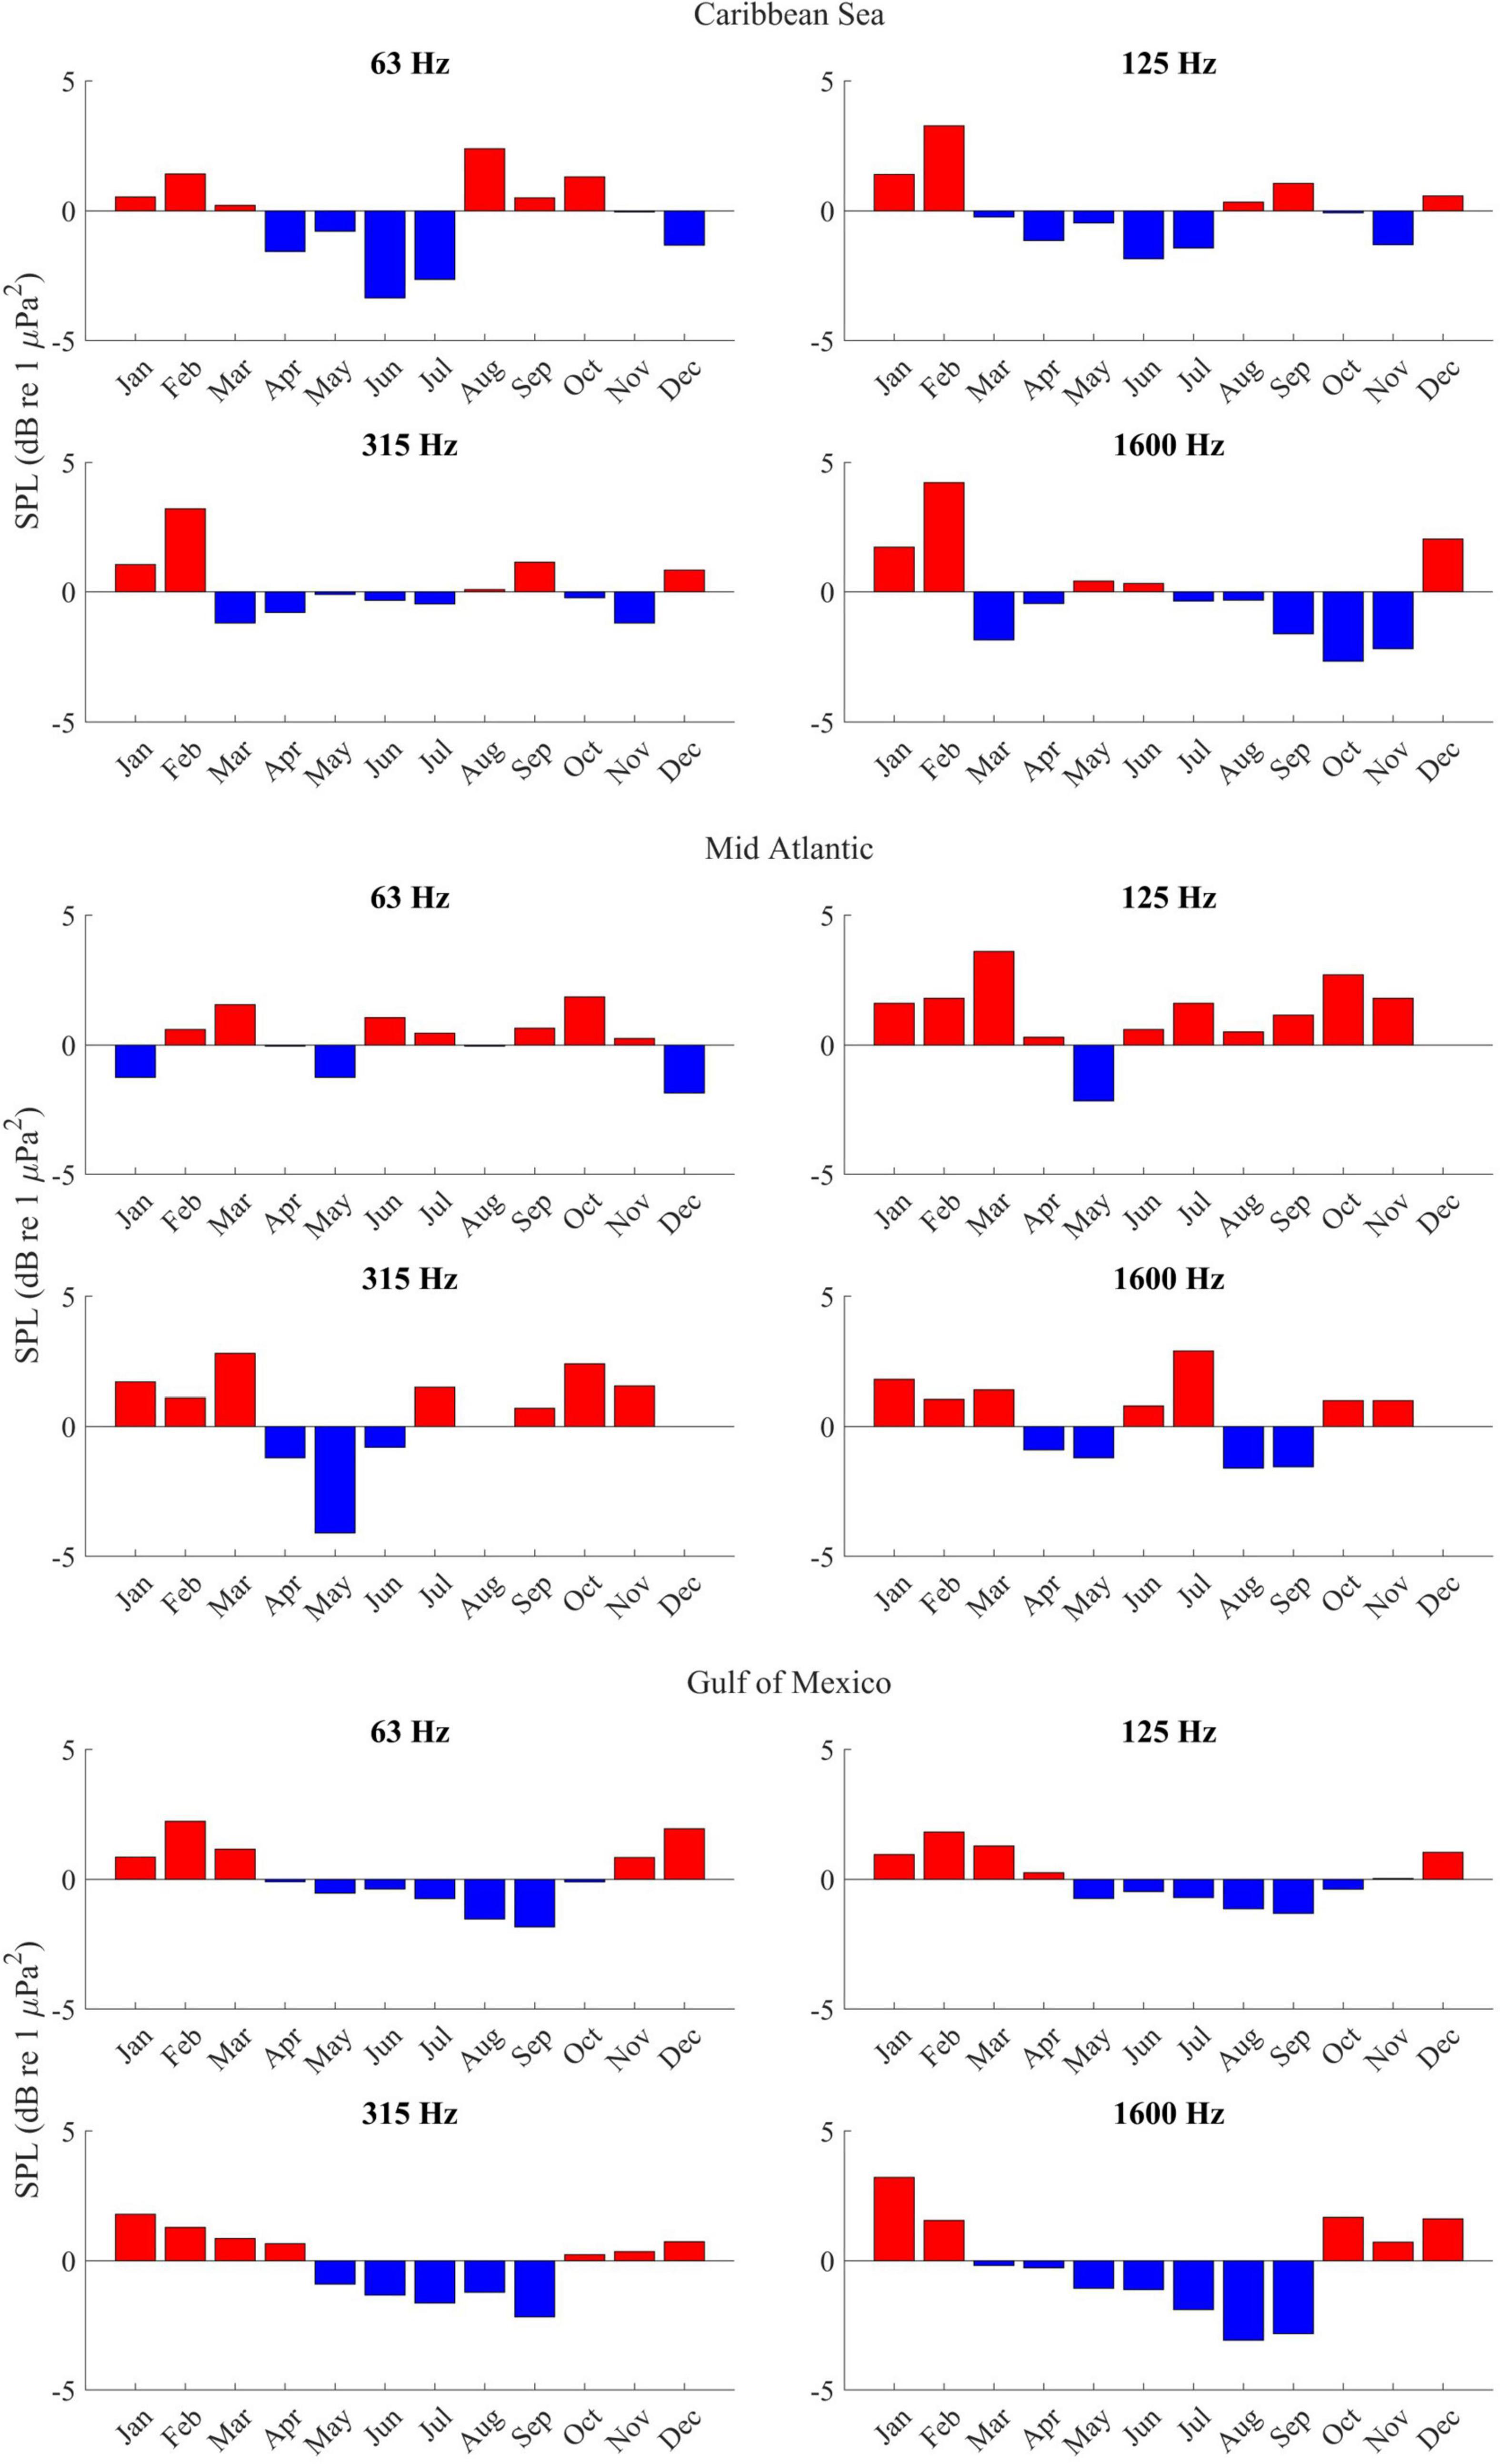
Figure 5. Monthly anomalies at four decidecade bands recorded at a (top) shallow water site, Caribbean Sea; (middle) mid water site, Mid Atlantic, and (bottom) deep water site, Gulf of Mexico. Months where no bar is displayed represent 0 dB difference from the site’s overall median SPL for that decidecade band.
The monthly median for two decidecade bands (63 and 1,600 Hz) were selected to compare SPL across all sites in a spring and fall month (Table 2 and Supplementary Figure 1). Spatially visualizing how these sound levels differ across the sites and seasons helps illustrate the variability of soundscapes throughout the United States (Figure 6). The Alaskan Arctic and Caribbean Sea sites have the lowest SPL for both bands and months followed closely by American Samoa. The Gulf of Mexico, Olympic Coast, Blake Plateau, and Mid Atlantic all contain significantly higher SPL in the 63 Hz band for both spring and fall compared to the 1,600 Hz band (Table 3). Conversely, the Caribbean Sea has a slightly higher SPL for the 1,600 Hz band compared to the 63 Hz but is not significantly different across either frequency or month. The Hawaiian Islands site contains significantly higher SPL for both 63 and 1,600 Hz bands in the spring (March) compared to the fall (December). Stellwagen Bank SPL recorded in the spring are significantly different from SPL at 63 Hz in the fall.
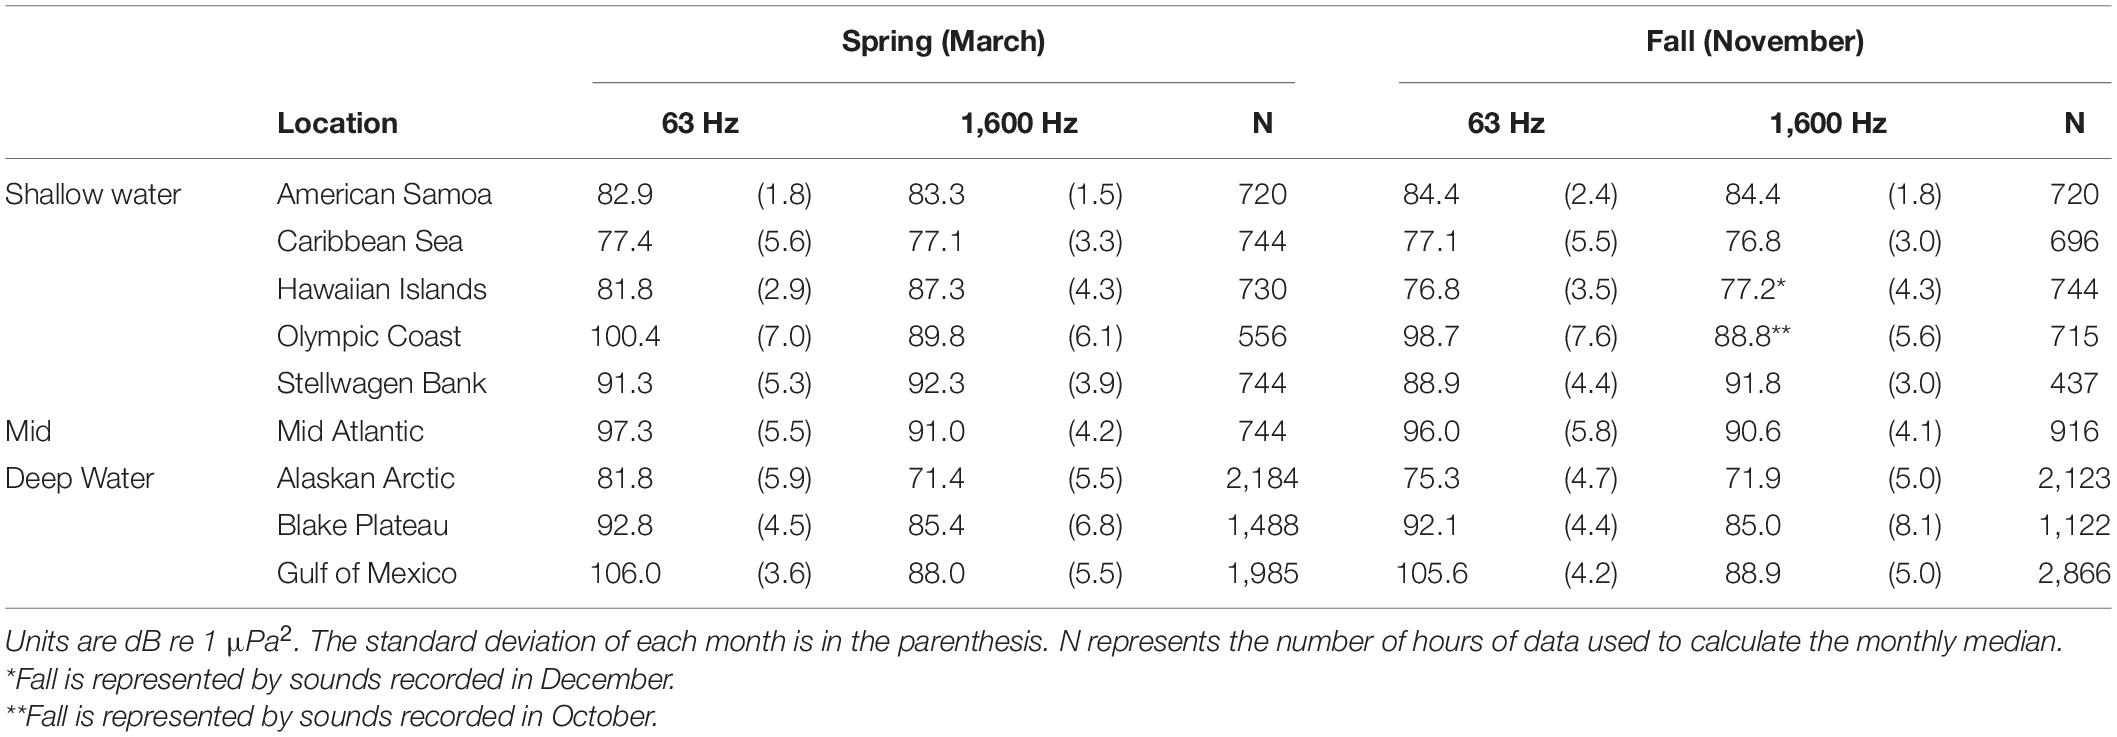
Table 2. Monthly median values at 63 and 1,600 Hz decidecade bands for a representative spring (March) and fall (November) month.
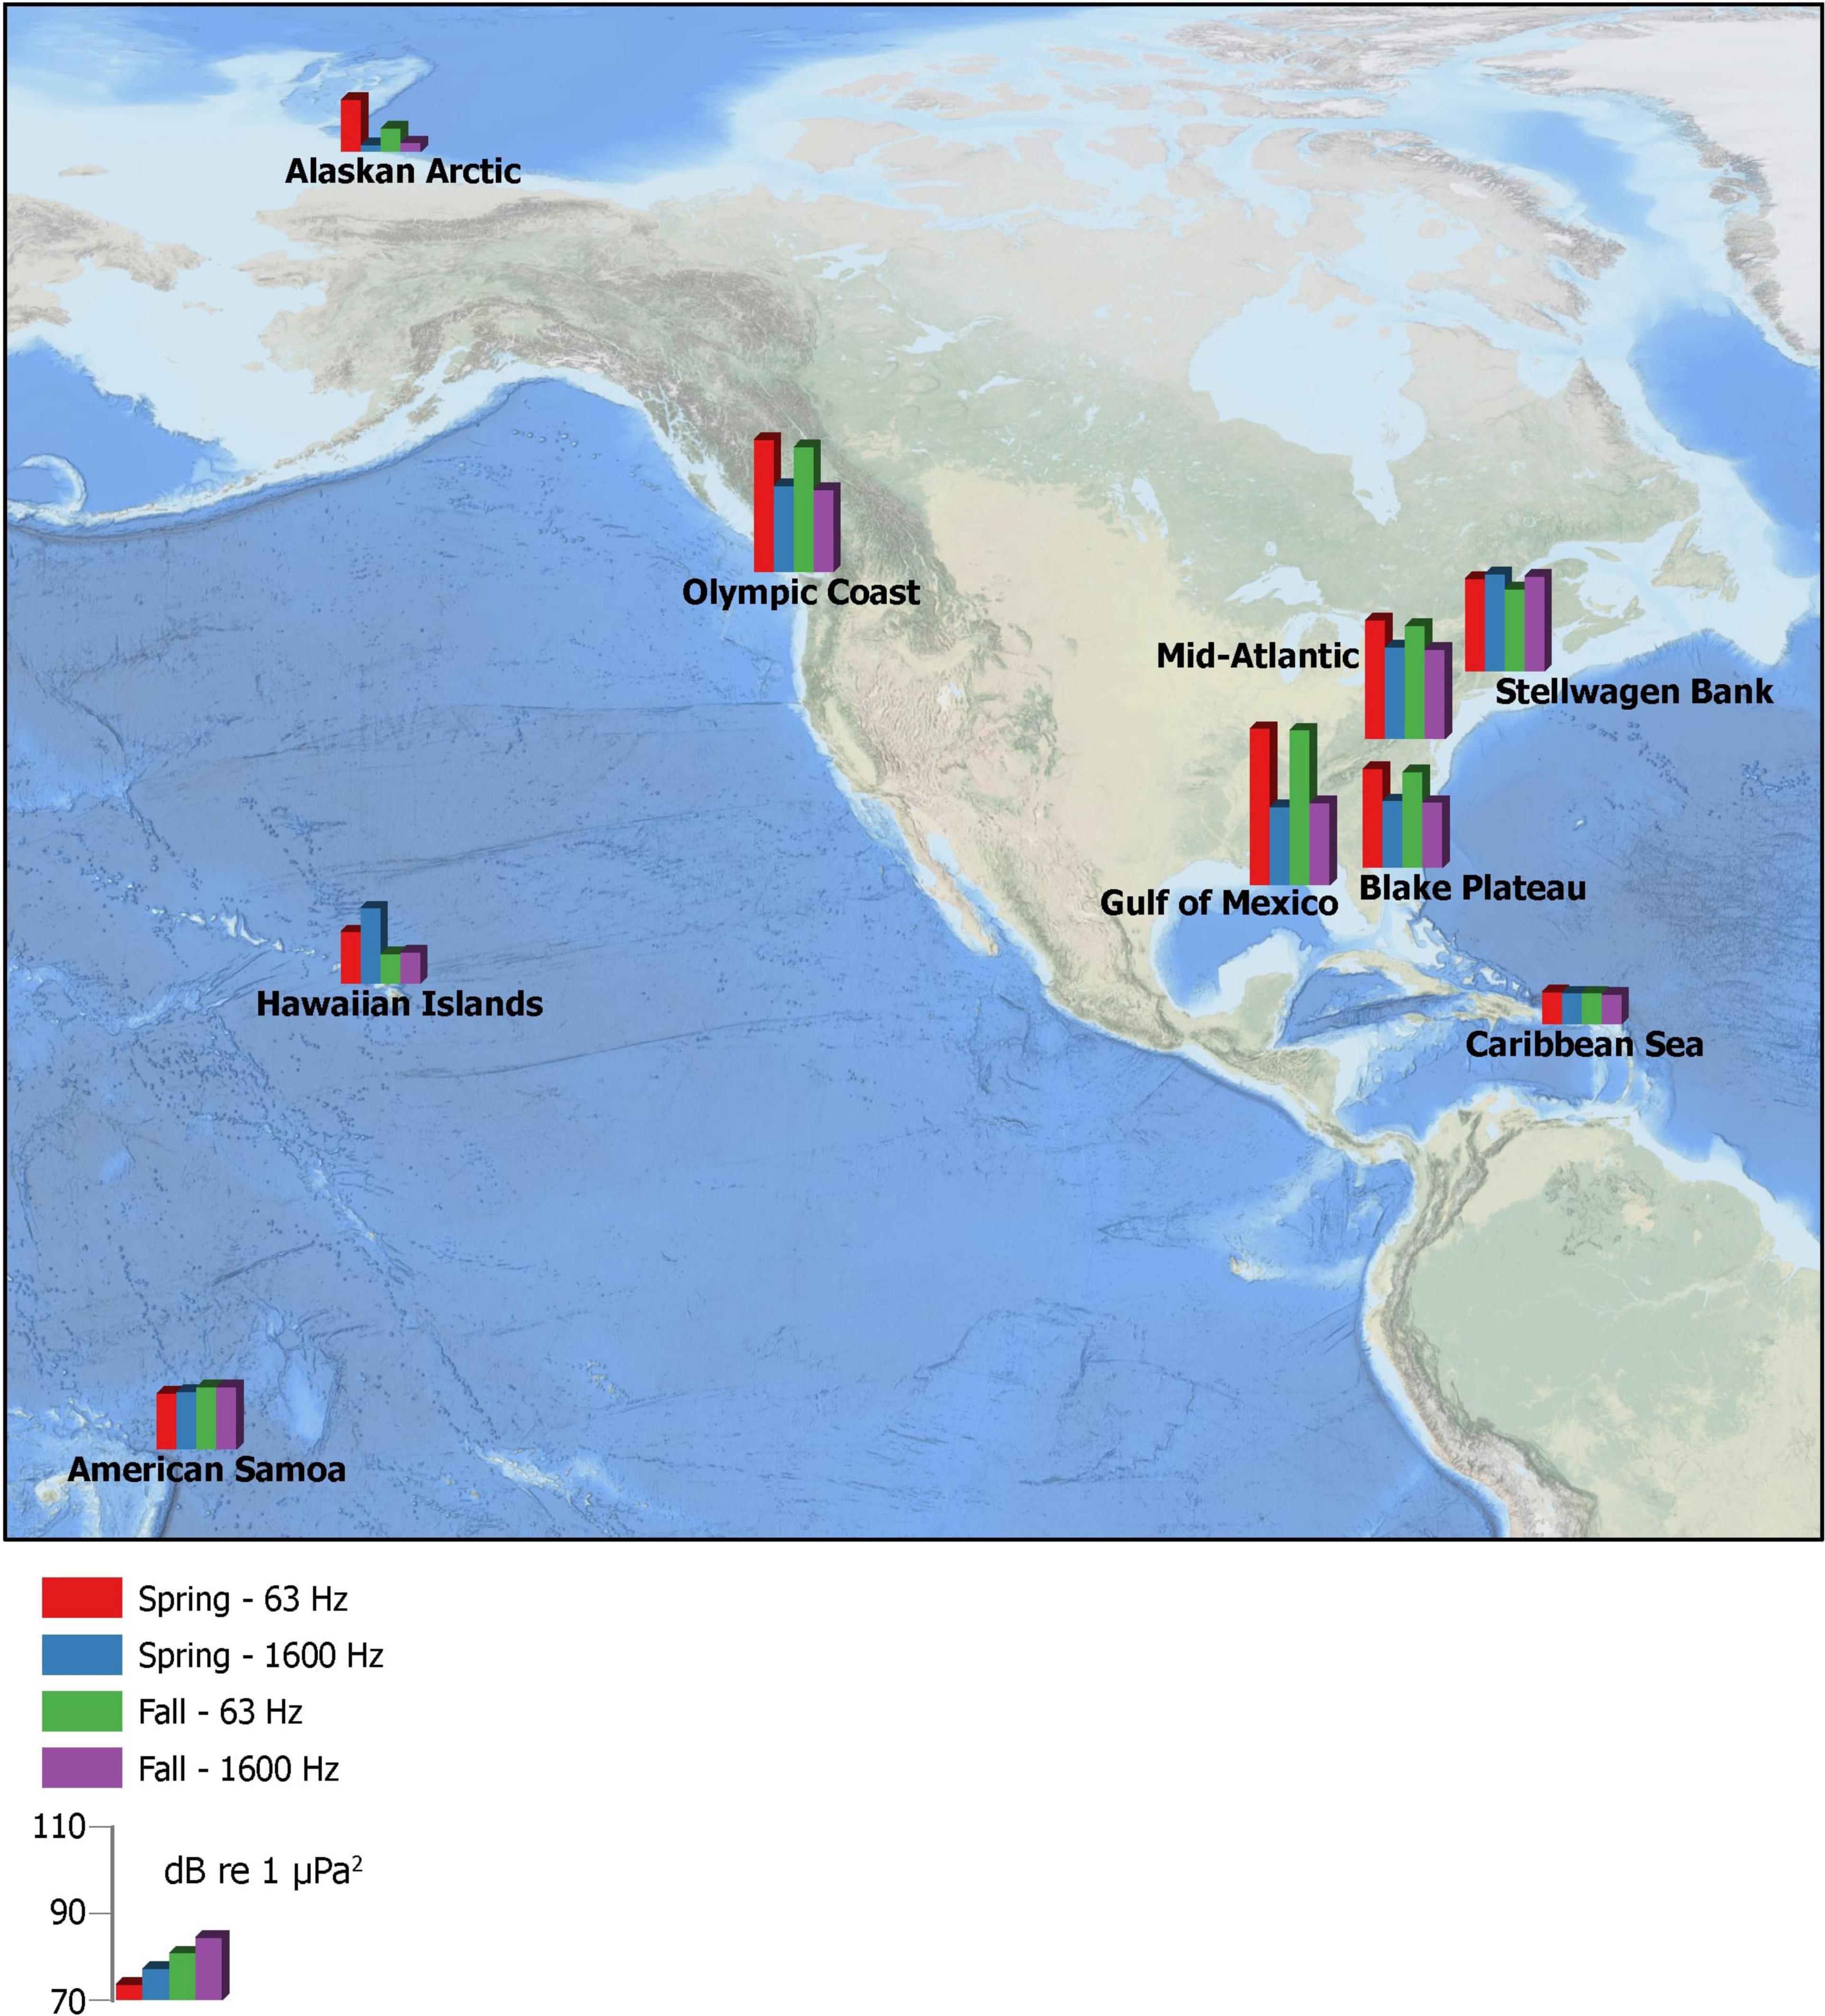
Figure 6. Spatial distribution of the monthly median value for 63 and 1,600 Hz decidecade bands for spring (March) and fall (November) across the nine stationary recording sites. Bar height corresponds to SPL (dB re 1 μPa2).
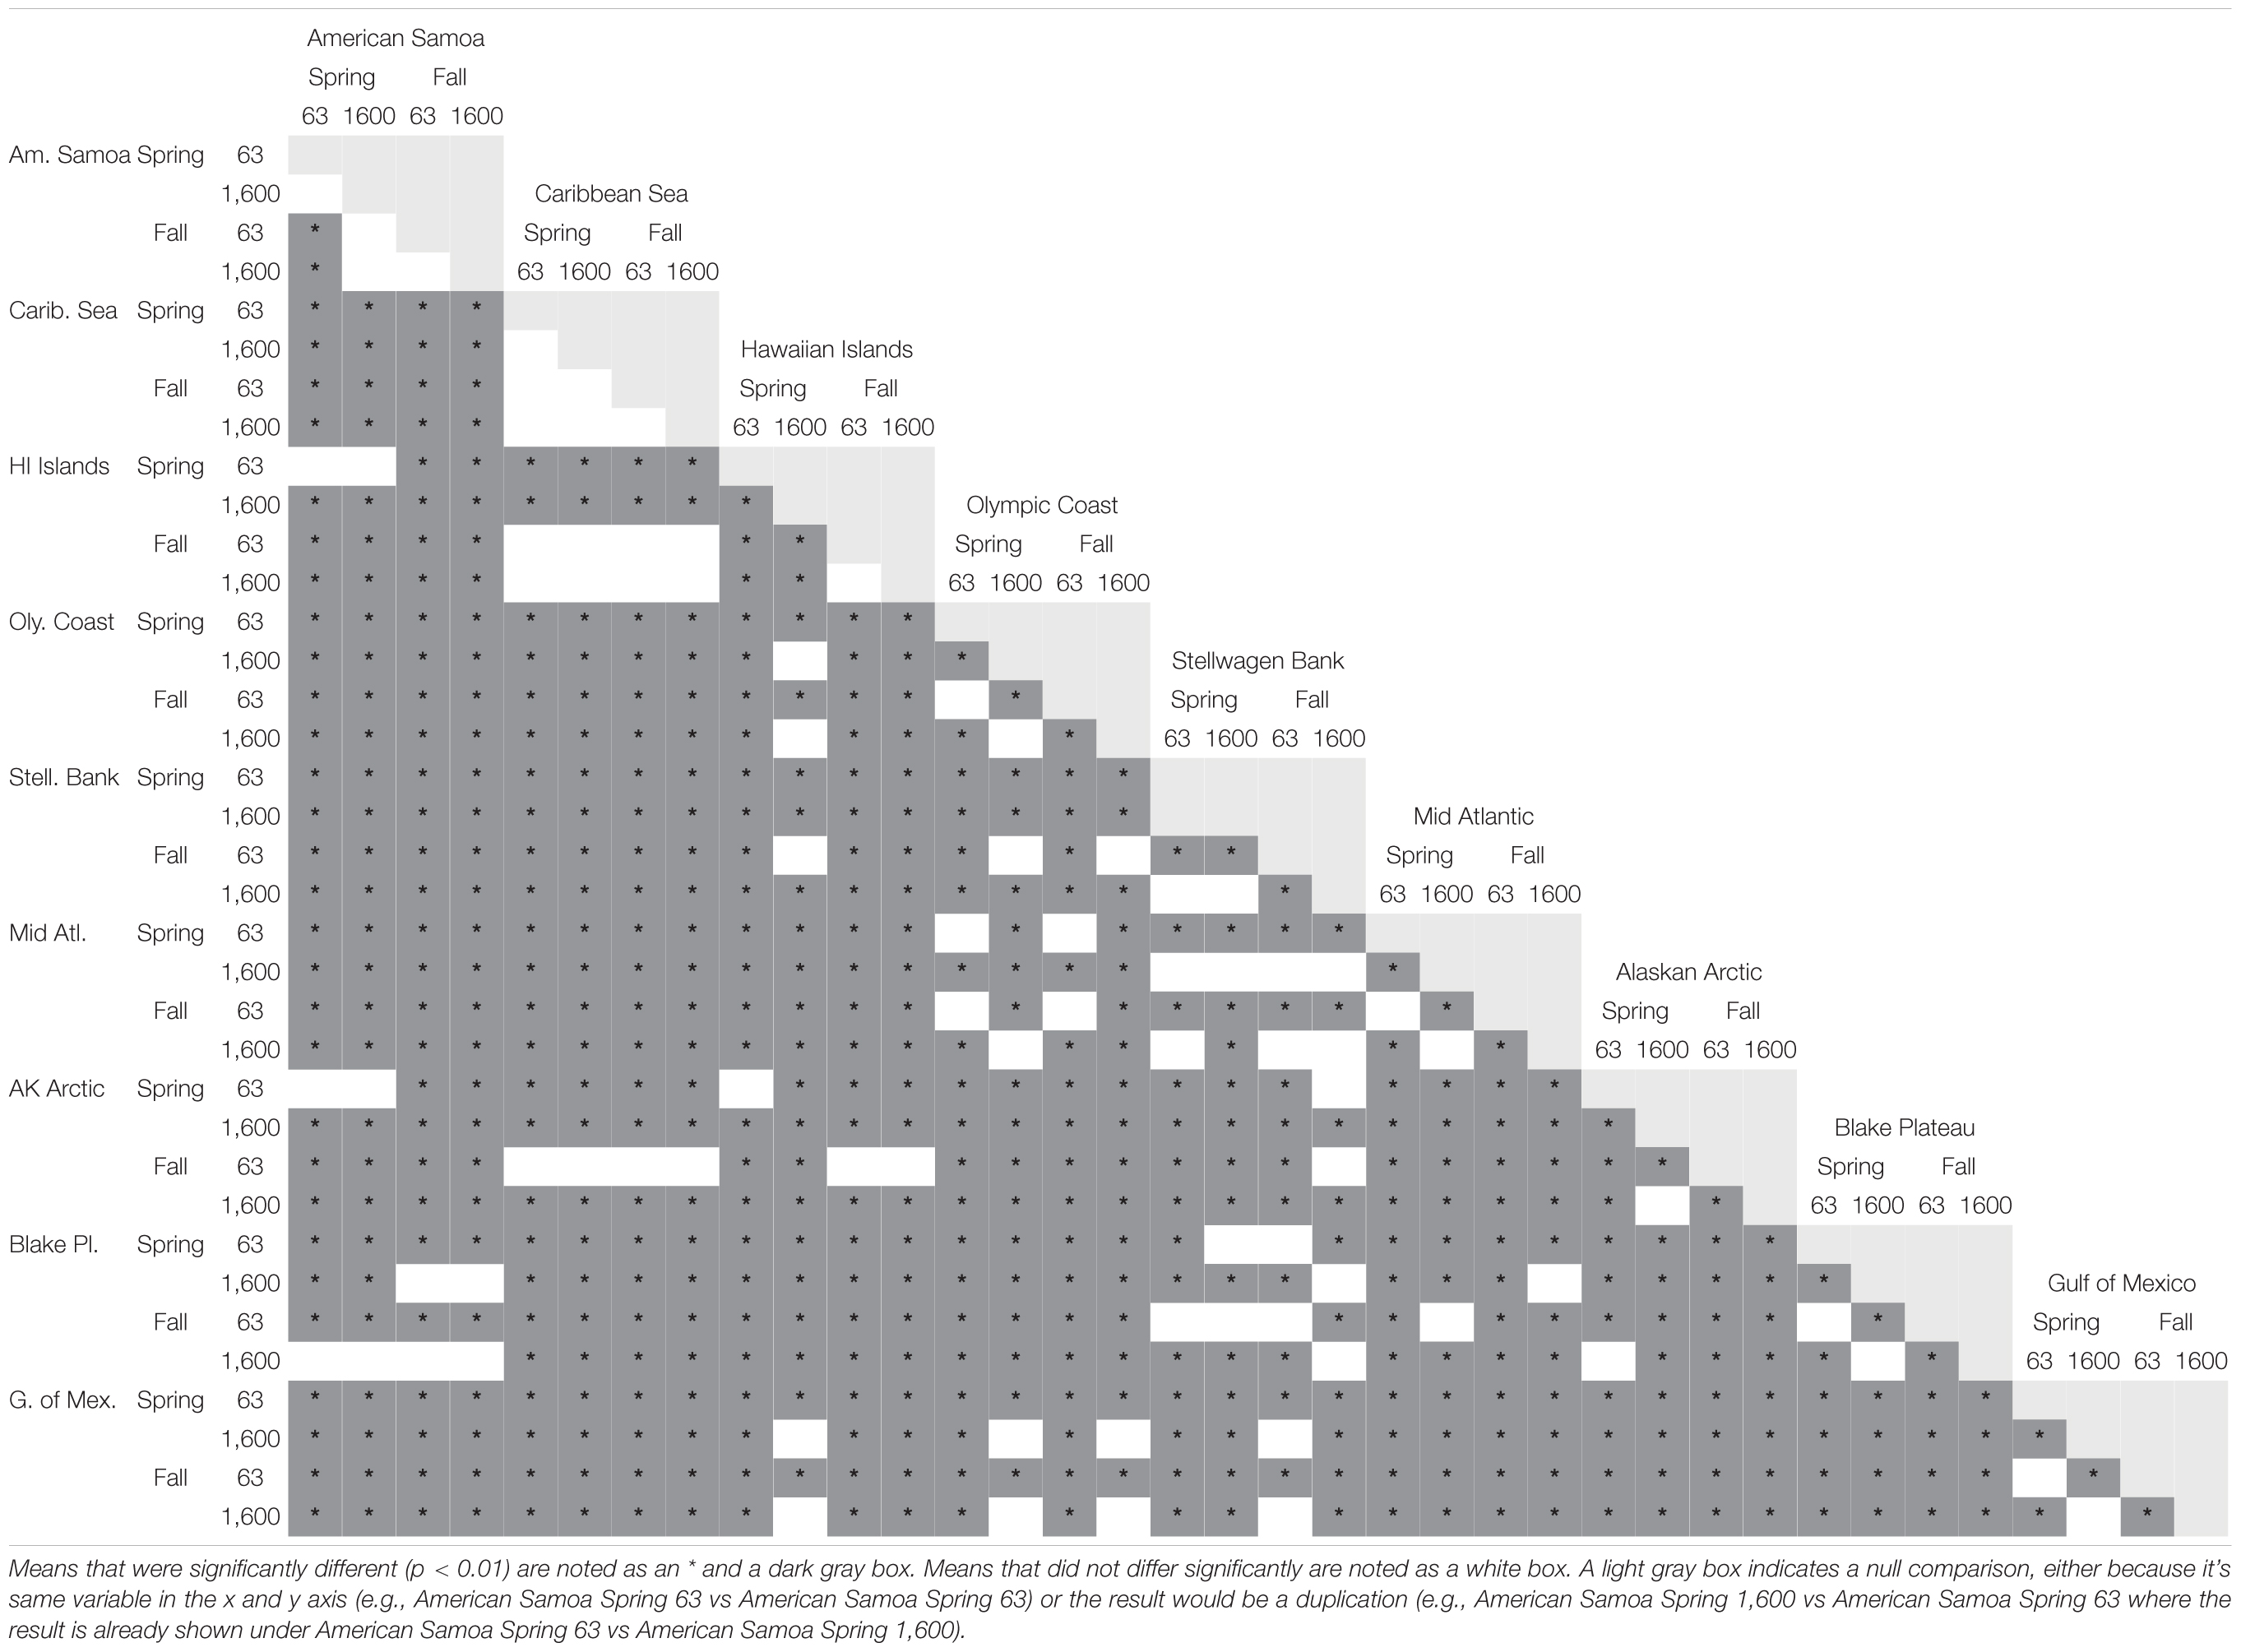
Table 3. Matrix of Tukey HSD results comparing mean SPLs for all sites in the 63 Hz (63) and 1,600 Hz (1,600) decidecade bands recorded in March (Spring) or November (Fall).
Discussion
Through standardized processing and centralized stewardship and access, we provide a previously unattainable comparison of first order sound level-patterns across three distinctly separate long-term PAM efforts. The analysis completed here is not intended to be exhaustive and many further investigations into daily and lunar patterns including oceanographic conditions as well as narrow-band frequencies could provide further insight into understanding each site’s soundscape. High frequency sounds (>2 kHz) from song, whistles, and clicks that various species of marine mammals produce were largely excluded from this analysis because cross project comparisons were limited to 1,600 Hz. The reader may still have questions about what species or activity contributes to the sounds presented here. It is this continued curiosity and drive for more data, more detail, and more answers that we aim to ignite.
Collective efforts to enhance data management support the examination of soundscape trends across a longer time period and broader scale than the individual research projects alone. First order examination of levels across several projects highlights the utility of these initial metrics for identifying patterns that can then be examined in more detail, and with further analytical approaches (McKenna et al., unpublished data). For example, lower frequency measurements can be used to preliminarily categorize recorders as more or less influenced by vessel traffic. Sites strongly influenced by vessel traffic are likely to contain higher SPL values overall as well as peak below 100 Hz. These characteristics are reflected in the Gulf of Mexico, Olympic Coast, Mid Atlantic, Blake Plateau, and Stellwagen Bank sites. The Gulf of Mexico, Mid Atlantic and Blake Plateau are mid or deep water sites where sound travels farther, especially low frequency sounds like the 63 Hz decidecade band that best captures large vessel noise (Wenz, 1972; EU Marine Strategy Framework Directive, 2008). The Olympic Coast and Stellwagen Bank sites are located in shallow water but are close to shipping lanes or densely populated coastal zones where vessel activity is higher (Hatch et al., 2008; Haver et al., 2018). Extensive contribution of low frequency sound (<200 Hz) from large commercial vessels has been documented at the Stellwagen Bank National Marine Sanctuary (Hatch et al., 2008). As a result of these noise levels, the communication space of marine animals, and efficacy of communication between them, has been reduced (Hatch et al., 2012; Redfern et al., 2017; Putland et al., 2018). In addition to vessel activity, the Gulf of Mexico and Mid Atlantic Ocean are also impacted by regional or ocean-basin scale seismic airgun activity, which contributes significantly to the low frequency SPL (Nieukirk et al., 2004, 2012; Haver et al., 2017, 2018). Low frequency sounds from biological sources, namely fish, have been documented within the Gulf of Mexico and Mid Atlantic including Blake Plateau, however, these sounds are typically recorded at shallower depths (<100 m) (e.g., Mann and Grothues, 2009; Wall et al., 2013, 2017) and unlikely to contribute strongly at these deep water recording locations.
The sites predicted here to be less strongly influenced by vessel traffic contain lower SPL values overall and do not peak around 63 Hz. These characteristics are reflected in the American Samoa, Caribbean Sea, Hawaiian Islands, and Alaskan Arctic sites. Of these sites, the Alaskan Arctic is the only one located in deep water. Due to the site’s remote location, far traveling low frequency noise from vessels is not a significant component of this soundscape. Sea ice coverage, seismic airgun activity, and sounds from bowhead and beluga whales, and bearded seals contribute to a seasonal trend at these frequencies (Haver et al., 2018; Stafford et al., 2018).
The remaining sites are located in shallow water where low frequency sounds tend to not propagate as well and are in areas away from dense populations. Here sound from biological sources is predicted to contribute the most to the soundscape. For example, the peaks in SPL at 315 and 630 Hz decidecade bands from February to March at the Hawaiian Islands site likely reflect the nearly continuous vocalizations from humpback whales who arrive during this time to breed (Au et al., 2000; Lammers et al., 2011; Kügler et al., 2020). The American Samoa and Caribbean Sea site soundscapes were likely influenced by fish and invertebrates in addition to humpback whales (Kaplan et al., 2015; Haver et al., 2018, 2019; Lillis and Mooney, 2018). Snapping shrimp are frequently the most ubiquitous sound in coral reef environments, influenced largely by light levels where day light and lunar phase change snapping activity and therefore tend to impact the overall SPL of the environment, especially for high frequencies (>2 kHz) (Staaterman et al., 2014; Lillis and Mooney, 2018). There are many species of soniferous fish found on coral reefs with groupers being some of the most common, especially in the Caribbean Sea (Lobel et al., 2010; Staaterman et al., 2013; Rowell et al., 2015). Groupers produce low frequency sounds (<500 Hz) related to spawning activity generally in the late winter to late spring though this will vary based on the individual species (Schärer et al., 2012; Rowell et al., 2015). The increase in SPL observed in December through February at the Caribbean Sea site for both the 125 and 315 Hz band in addition to the consistent monthly pattern that these bands share suggests that sound production from fish, possibly in part by spawning grouper, is contributing to this site’s soundscape. The soundscape of the American Samoa site is likely influenced by coral reef fish (e.g., Pomacentridae), snapping shrimp and humpback whales. All are well documented sound producers in the North Pacific (Mann and Lobel, 1998; Munger et al., 2012; Zang et al., 2016; Kaplan et al., 2018; Allen et al., 2021).
Next Steps for Global Passive Acoustic Data Management
Understanding long-term trends and changes to our ocean soundscape is a key objective of the three projects highlighted here but is also undertaken globally and has recently been reported on specifically in the context of increased anthropogenic noise (Duarte et al., 2021). Centralized repositories or at a minimum centralized access to data collections enables new analyses that can be used to answer new scientific questions. Therefore, supporting cyberinfrastructure to steward large volumes of passive acoustic data and connect datasets in a federated system as well as scale to meet the ever-increasing volumes of data being collected is needed. This approach will facilitate research on global and decadal scales, and will match the scales at which many signals of interest are happening.
Beyond NCEI, additional efforts to manage PAM data within the United States and internationally are ramping up. Axiom Data Science, through partnerships for data services with NOAA integrated ocean observing system (IOOS) and industry partners, is beginning to curate and create data management infrastructures for large PAM datasets to support several IOOS Regional Associations and a large JASCO Applied Sciences dataset from the Chukchi Sea. Internationally, government agencies, universities and non-governmental organizations are establishing regional to national-scale solutions for managing, curating, archiving, and collectively analyzing PAM data. Several regional-scale ocean PAM projects have been funded by the European Union in support of the Marine Strategy Framework Directive, which has necessitated advancing regional-scale repositories. The International Quiet Ocean Experiment’s Data Office at the Alfred Wegener Institute in Germany is developing management and access to data from the Perennial Acoustic Observatory in the Antarctic Ocean-Real-Time Eavesdropping on the Antarctic Underwater Soundscape (or PALAOA) project and is developing the Open Portal to Underwater Soundscapes, which will encompass PAM audio data and spectral files from a broader group of monitoring projects. Oceans Network Canada has an extensive collection of passive acoustic data collected throughout its cabled observatories in the Arctic, Atlantic and Pacific Ocean. Data are made accessible to the public through their search page, which includes spectrograms of the recordings and the ability to request the data in a range of formats.
Applications for sound time-series data products range from outreach-focused public interests to natural resource and environmental compliance applications to innovative scientific research endeavors. Connection to complimentary datasets such as the Animal Telemetry Network (ATN) offer clear synergies that could be linked to provide additional exploratory and explanatory opportunities (Block et al., 2016; Taylor et al., 2017). The need, therefore, is to promote the use of centralized assets where appropriate, leverage what has already been built toward a larger group of stakeholders and coordinate further development opportunities to avoid duplication and divergent products.
In addition to centralized data access, there is a need for standardized processing routines and standardized sound level metrics available to the community to support cross-project comparisons and enable analyses to rapidly produce answers to new or previously unimaginable questions like how does the soundscape change during a global pandemic (Lecocq et al., 2020; Thomson and Barclay, 2020; Tyack et al., 2021). The international community has recommended metrics to quantify ambient noise and some groups have started to make their processing scripts available to the public. Centralized access to high quality scripts [e.g., Manta2; Triton3; PamGuide (Merchant et al., 2015)] will allow the community to easily implement those standards. Further, open source, cloud-friendly processing routines will enable scientists to bring the processing to the data, which are increasingly being made available on cloud platforms. An exemplary scenario would be Jupyter notebooks, an interactive, open-source, web-based computational tool, located in a publicly accessible github repository that create calibrated 1-s decidecade (or hybrid millidecidecade) bands from cloud-hosted raw audio files that are cost-effectively executed in a cloud environment. Further, it would be beneficial to make the results of that processing accessible for further research endeavors.
Although a single, centralized repository for both raw acoustic data and resulting data products containing all United States PAM data collections is not an attainable or even reasonable goal, bioacoustic research and management would benefit greatly from federated repositories that leverage common cyberinfrastructure components and data management approaches. Interest in assessing trends in underwater sound variables and relating them to possible changes in animal behavior, physiology, or biodiversity at regional, national, and global scales has been heightened during the COVID pandemic due to the resulting global reduction of vessel traffic and ocean activities. Therefore, we recommend establishing cyberinfrastructure encompassing federated repositories that can scale to the nation’s wealth and diversity of PAM data. This cyberinfrastructure would include best practices for standardized data processing and technology to implement that processing to promote sustainable access for management and scientific applications.
Data Availability Statement
Publicly available datasets were analyzed in this study. These data can be found here: https://doi.org/10.25921/PF0H-SQ72.
Author Contributions
RD, JG, and LH conceived and designed the NRS. LH co-led and designed the SanctSound. JM-O conceived and designed the ADEON. RB, LH, and CW outlined the future direction of data management. With input from all authors, CW designed the manuscript, processed and analyzed the data, prepared figures, and drafted the manuscript. All authors edited the manuscript.
Funding
This analysis was supported by NOAA Fisheries Science & Technology and the NOAA Cooperative Agreement with CIRES NA17OAR4320101. The NCEI passive acoustic archive is supported by NOAA Fisheries Science & Technology, NOAA ONMS (through the SanctSound project), and the University of New Hampshire (through the ADEON project) award number: AWD-19-04-0258.
Conflict of Interest
RB was employed by the company Axiom Data Science, LLC.
The remaining authors declare that the research was conducted in the absence of any commercial or financial relationships that could be construed as a potential conflict of interest.
Acknowledgments
The authors would like to thank Bruce Martin for guidance on the decidecade scripts; Haru Matsumoto for assistance on NRS calibration details; Andy Monaghan, Joel Frahm, and Daniel Trahan for assistance with the CU HPC; Charles Anderson and Veronica Martinez for NCEI passive acoustic data management; Jesse Varner for assistance with spatial maps; Timothy Rowell, Jenni Stanley, John Joseph, Tetyana Margolina, Eden Zang and Marc Lammers for SanctSound data analysis, and Theresa Ridgeway for facilitating ADEON data transfer and access. The 1-s decidecade SPL files from Blake Plateau and Mid Atlantic were prepared and generated as part of the ADEON project by JASCO Applied Sciences. This is PMEL contribution # 5255. We would like to thank the reviewers for helping to improve the manuscript.
Supplementary Material
The Supplementary Material for this article can be found online at: https://www.frontiersin.org/articles/10.3389/fmars.2021.703682/full#supplementary-material
Supplementary Figure 1 | Boxplots of the SPL in 63 Hz (“63”) and 1,600 Hz (“1,600”) decidecade bands recorded in March (“Sp”) and November (“Fa”) for American Samoa (“AS”), Caribbean Sea (“CS”), Hawaiian Islands (“HI”), Olympic Coast (“OC”), Stellwagen Bank (“SB”), Mid Atlantic (“MA”), Alaskan Arctic (“AA”), Blake Plateau (“BP”), and Gulf of Mexico (“GM”). The red bar indicates the median (50th percentile); the lower and upper bounds of the box show the 25th and 75th percentiles; the whiskers extend to the most extreme data points not considered outliers, and the outliers are shown as “+.”
Footnotes
- ^ https://github.com/MarineBioAcousticsRC/Triton; Github commit ‘44f0f20’; February 9, 2020
- ^ https://bitbucket.org/CLO-BRP/manta-wiki/wiki/Home
- ^ https://github.com/MarineBioAcousticsRC
References
Ainslie, M. A., Miksis-Olds, J. L., Martin, B., Heaney, K., de Jong, C. A. F., von Benda-Beckmann, A. M., et al. (2018). ADEON Underwater Soundscape and Modeling Metadata Standard. Version 1.0. Technical report by JASCO Applied Sciences for ADEON Prime Contract No. M16PC00003. Halifax, NS: JASCO Applied Sciences.
Allen, A. N., Harvey, M., Harrell, L., Jansen, A., Merkens, K. P., Wall, C. C., et al. (2021). A convolutional neural network for automated detection of humpback whale song in a diverse, long-term passive acoustic dataset. Front. Mar. Sci. 8:165.
Au, W. W., and Hastings, M. C. (2008). Principles of Marine Bioacoustics, Vol. 510. New York, NY: Springer.
Au, W. W., Mobley, J., Burgess, W. C., Lammers, M. O., and Nachtigall, P. E. (2000). Seasonal and diurnal trends of chorusing humpback whales wintering in waters off western Maui. Mar. Mammal Sci. 16, 530–544. doi: 10.1111/j.1748-7692.2000.tb00949.x
Bhadani, A. K., and Jothimani, D. (2016). “Big data: challenges, opportunities, and realities,” in Effective Big Data Management and Opportunities for Implementation, eds M. K. Singh and G. D. Kumar (Hershey, PA: IGI Global), 1–24. doi: 10.4018/978-1-5225-0182-4.ch001
Block, B. A., Holbrook, C. M., Simmons, S. E., Holland, K. N., Ault, J. S., Costa, D. P., et al. (2016). Toward a national animal telemetry network for aquatic observations in the United States. Anim. Biotelemetry 4, 1–8.
Consortium for Ocean Leadership (2018). Report of the Workshop on Recommendations Related to Passive Ocean Acoustic Data Standards. Washington, DC: Consortium for Ocean Leadership.
Duarte, C. M., Chapuis, L., Collin, S. P., Costa, D. P., Devassy, R. P., Eguiluz, V. M., et al. (2021). The soundscape of the Anthropocene ocean. Science 371:6529.
Dunlop, R. A. (2019). The effects of vessel noise on the communication network of humpback whales. R. Soc. Open Sci. 6:190967. doi: 10.1098/rsos.190967
Erbe, C., Reichmuth, C., Cunningham, K., Lucke, K., and Dooling, R. (2016). Communication masking in marine mammals: a review and research strategy. Mar. Pollut. Bull. 103, 15–38. doi: 10.1016/j.marpolbul.2015.12.007
EU Marine Strategy Framework Directive (2008). Directive 2008/56/EC of the European Parliament and of the Council of 17 June 2008 establishing a framework for community action in the field of marine environmental policy (Marine Strategy Framework Directive). Offi. J. Eur. Union L 164, 19–40.
Fish, M. P., and Mowbray, W. H. (1970). Sounds of Western North Atlantic Fishes. A Reference File of Biological Underwater Sounds. Kingston, RI: University of Rhode Island.
Hatch, L., Clark, C., Merrick, R., Van Parijs, S., Ponirakis, D., Schwehr, K., et al. (2008). Characterizing the relative contributions of large vessels to total ocean noise fields: a case study using the Gerry E. Studds Stellwagen Bank National Marine Sanctuary. Environ. Manag. 44, 998–999. doi: 10.1007/s00267-009-9386-5
Hatch, L. T., Clark, C. W., Van Parijs, S. M., Frankel, A. S., and Ponirakis, D. W. (2012). Quantifying loss of acoustic communication space for right whales in and around a US National Marine Sanctuary. Conserv. Biol. 26, 983–994. doi: 10.1111/j.1523-1739.2012.01908.x
Haver, S. M., Fournet, M. E., Dziak, R. P., Gabriele, C., Gedamke, J., Hatch, L. T., et al. (2019). Comparing the underwater soundscapes of four US National Parks and Marine Sanctuaries. Front. Mar. Sci. 6:500.
Haver, S. M., Gedamke, J., Hatch, L. T., Dziak, R. P., Van Parijs, S., McKenna, M. F., et al. (2018). Monitoring long-term soundscape trends in US Waters: the NOAA/NPS Ocean noise reference station network. Mar. Policy 90, 6–13. doi: 10.1016/j.marpol.2018.01.023
Haver, S. M., Klinck, H., Nieukirk, S. L., Matsumoto, H., Dziak, R. P., and Miksis-Olds, J. L. (2017). The not-so-silent world: measuring Arctic, equatorial, and antarctic soundscapes in the Atlantic Ocean. Deep Sea Res. 1 Oceanogr. Res. Pap. 122, 95–104. doi: 10.1016/j.dsr.2017.03.002
Hawkins, A. D., and Popper, A. N. (2017). A sound approach to assessing the impact of underwater noise on marine fishes and invertebrates. ICES J. Mar. Sci. 74, 635–651. doi: 10.1093/icesjms/fsw205
Hazlett, B. A., and Winn, H. E. (1962). Sound production and associated behavior of Bermuda crustaceans (Panulirus, Gonodactylus, Alpheus, and Synalpheus). Crustaceana 4, 25–38.
Heaney, K., Martin, B., Miksis-Olds, J., Ainslie, M., Moore, T., and Warren, J. (2020). ADEON Data Processing Specification, Version 1.0 FINAL. Technical report by Applied Ocean Sciences for Prime Contract No. M16PC00003. Available online at: https://adeon.unh.edu/sites/default/files/user-uploads/ADEON_Data%20Processing_Specification_FINAL.pdf (accessed January 1, 2021).
Holt, M. M., Noren, D. P., Veirs, V., Emmons, C. K., and Veirs, S. (2009). Speaking up: killer whales (Orcinus orca) increase their call amplitude in response to vessel noise. J. Acoust. Soc. Am. 125, EL27–EL32.
Houghton, J., Holt, M. M., Giles, D. A., Hanson, M. B., Emmons, C. K., Hogan, J. T., et al. (2015). The relationship between vessel traffic and noise levels received by killer whales (Orcinus orca). PLoS One 10:e0140119. doi: 10.1371/journal.pone.0140119
Howe, B. M., Miksis-Olds, J., Rehm, E., Sagen, H., Worcester, P. F., and Haralabus, G. (2019). Observing the oceans acoustically. Front. Mar. Sci. 6:426.
International Organization for Standardization (ISO) (2017). ISO 18405:2017 Underwater acoustics – Terminology. International Organization for Standardization. Available online at: http://www.iso.org/iso/catalogue_detail.htm?csnumber=62406 (accessed May 21, 2017)
International Quiet Ocean Experiment (2020). Guidelines for Observation of Ocean Sound. Den Haag: International Quiet Ocean Experiment, 18.
International Whaling Commission, IQOE, US NOAA & ONRG, and Netherlands TNO & Ministry of Infrastructure and the Environment (2014). Joint Workshop Report: Predicting Sound Fields—Global Soundscape Modelling to Inform Management of Cetaceans and Anthropogenic Noise. Leiden: TNO, 20.
Jensen, F. H., Bejder, L., Wahlberg, M., Soto, N. A., Johnson, M., and Madsen, P. T. (2009). Vessel noise effects on delphinid communication. Mar. Ecol. Prog. Ser. 395, 161–175. doi: 10.3354/meps08204
Kaplan, M. B., Lammers, M. O., Zang, E., and Mooney, T. A. (2018). Acoustic and biological trends on coral reefs off Maui, Hawaii. Coral Reefs 37, 121–133. doi: 10.1007/s00338-017-1638-x
Kaplan, M. B., Mooney, T. A., Partan, J., and Solow, A. R. (2015). Coral reef species assemblages are associated with ambient soundscapes. Mar. Ecol. Prog. Ser. 533, 93–107. doi: 10.3354/meps11382
Kügler, A., Lammers, M. O., Zang, E. J., Kaplan, M. B., and Mooney, T. A. (2020). Fluctuations in Hawaii’s humpback whale Megaptera novaeangliae population inferred from male song chorusing off Maui. Endanger. Species Res. 43, 421–434. doi: 10.3354/esr01080
Lammers, M. O., Fisher-Pool, P. I., Au, W. W., Meyer, C. G., Wong, K. B., and Brainard, R. E. (2011). Humpback whale Megaptera novaeangliae song reveals wintering activity in the Northwestern Hawaiian Islands. Mar. Ecol. Prog. Ser. 423, 261–268. doi: 10.3354/meps08959
Lecocq, T., Hicks, S. P., Van Noten, K., Van Wijk, K., Koelemeijer, P., De Plaen, R. S., et al. (2020). Global quieting of high-frequency seismic noise due to COVID-19 pandemic lockdown measures. Science 369, 1338–1343.
Lillis, A., and Mooney, T. A. (2018). Snapping shrimp sound production patterns on Caribbean coral reefs: relationships with celestial cycles and environmental variables. Coral Reefs 37, 597–607. doi: 10.1007/s00338-018-1684-z
Lobel, P. S. (2002). Diversity of fish spawning sounds and the application of passive acoustic monitoring. Bioacoustics 12, 286–289. doi: 10.1080/09524622.2002.9753724
Lobel, P. S., Kaatz, I. M., and Rice, A. N. (2010). “Acoustical behavior of coral reef fishes,” in Reproduction and Sexuality in Marine Fishes: Patterns and Processes, ed. K. S. Cole (Oakland, CA: University of California Press), 307–386. doi: 10.1525/9780520947979-013
Mann, D. A., and Grothues, T. M. (2009). Short-term upwelling events modulate fish sound production at a mid-Atlantic Ocean observatory. Mar. Ecol. Prog. Ser. 375, 65–71. doi: 10.3354/meps07720
Mann, D. A., and Lobel, P. S. (1998). Acoustic behavior of the damselfish Dascyllus albisella: behavioral and geographic variation. Environ. Biol. Fishes 51, 421–428. doi: 10.1023/a:1007410429942
Marley, S. A., Kent, C. P. S., Erbe, C., and Parnum, I. M. (2017). Effects of vessel traffic and underwater noise on the movement, behaviour and vocalisations of bottlenose dolphins in an urbanised estuary. Sci. Rep. 7:13437.
Martin, S. B., Gaudet, B. J., Klinck, H., Dugan, P. J., Miksis-Olds, J. L., Mellinger, D. K., et al. (2021). Hybrid millidecade spectra: a practical format for exchange of long-term ambient sound data. JASA Exp. Lett. 1:011203. doi: 10.1121/10.0003324
McDonald, M. A., Hildebrand, J. A., and Wiggins, S. M. (2006). Increases in deep ocean ambient noise in the Northeast Pacific west of San Nicolas Island, California. J. Acoust. Soc. Am. 120, 711–718. doi: 10.1121/1.2216565
Mellinger, D. K., Stafford, K. M., Moore, S. E., Dziak, R. P., and Matsumoto, H. (2007). An overview of fixed passive acoustic observation methods for cetaceans. Oceanography 20, 36–45. doi: 10.5670/oceanog.2007.03
Merchant, N. D., Fristrup, K. M., Johnson, M. P., Tyack, P. L., Witt, M. J., Blondel, P., et al. (2015). Measuring acoustic habitats. Methods Ecol. Evol. 6, 257–265.
Miksis-Olds, J., and Martin, B. (2019). AMAR L2+Products_all_cruises. figshare. Dataset. Available online at: https://doi.org/10.6084/m9.figshare.8397926.v10 (accessed January 1, 2021).
Miksis-Olds, J. L., and Nichols, S. M. (2016). Is low frequency ocean sound increasing globally? J. Acoust. Soc. Am. 139, 501–511. doi: 10.1121/1.4938237
Mooney, T. A., Di Iorio, L., Lammers, M., Lin, T. H., Nedelec, S. L., Parsons, M., et al. (2020). Listening forward: approaching marine biodiversity assessments using acoustic methods. R. Soc. Open Sci. 7:201287. doi: 10.1098/rsos.201287
Munger, L. M., Lammers, M. O., Fisher-Pool, P., and Wong, K. (2012). Humpback whale (Megaptera novaeangliae) song occurrence at American Samoa in long-term passive acoustic recordings, 2008–2009. J. Acoust. Soc. Am. 132, 2265–2272. doi: 10.1121/1.4747014
National Research Council (2003). Ocean Noise and Marine Mammals. Washington, DC: National Academies Press, 204.
Nieukirk, S. L., Mellinger, D. K., Moore, S. E., Klinck, K., Dziak, R. P., and Goslin, J. (2012). Sounds from airguns and fin whales recorded in the mid-Atlantic Ocean, 1999–2009. J. Acoust. Soc. Am. 131, 1102–1112. doi: 10.1121/1.3672648
Nieukirk, S. L., Stafford, K. M., Mellinger, D. K., Dziak, R. P., and Fox, C. G. (2004). Low-frequency whale and seismic airgun sounds recorded in the mid-Atlantic Ocean. J. Acoust. Soc. Am. 115, 1832–1843. doi: 10.1121/1.1675816
NOAA National Centers for Environmental Information (2017). Passive Acoustic Data Collection. Asheville, NC: NOAA National Centers for Environmental Information. doi: 10.25921/PF0H-SQ72
NOAA OAR Pacific Marine Environmental Laboratory, National Marine Fisheries Service, NOS Office of National Marine Sanctuaries, and DOI NPS Natural Resource Stewardship and Science Directorate (2014). NOAA Ocean Noise Reference Station Network Raw Passive Acoustic Data. Asheville, NC: NOAA National Centers for Environmental Information. doi: 10.7289/V5M32T0D (accessed December 30, 2020).
NOAA Office of National Marine Sanctuaries, and U.S Navy (2020a). One-third Octave Band Sound Pressure Levels at 1 Hertz and 1 Hour Resolution Recorded at SanctSound Site SB01_01, SanctSound Mar 2020 Data Products (Oct 2018-Dec 2019). Asheville, NC: NOAA National Centers for Environmental Information. doi: 10.25921/5q3b-mv70 (accessed December 30, 2020).
NOAA Office of National Marine Sanctuaries, and U.S Navy (2020b). One-third Octave Band Sound Pressure Levels at 1 Hertz and 1 Hour Resolution Recorded at SanctSound Site SB01_02, SanctSound Mar 2020 Data Products (Oct 2018-Dec 2019). Asheville, NC: NOAA National Centers for Environmental Information. doi: 10.25921/r40h-c047 (accessed December 30, 2020).
NOAA Office of National Marine Sanctuaries, and U.S Navy (2020c). One-third Octave Band Sound Pressure Levels at 1 Hertz and 1 Hour Resolution Recorded at SanctSound Site SB01_03, SanctSound Mar 2020 Data Products (Oct 2018-Dec 2019). Asheville, NC: NOAA National Centers for Environmental Information. doi: 10.25921/wak8-2c73 (accessed December 30, 2020).
NOAA Office of National Marine Sanctuaries, and U.S Navy (2020d). One-third Octave Band Sound Pressure Levels at 1 Hertz and 1 Hour Resolution Recorded at SanctSound Site SB01_04, SanctSound Mar 2020 Data Products (Oct 2018-Dec 2019). Asheville, NC: NOAA National Centers for Environmental Information. doi: 10.25921/37tg-vg42 (accessed December 30, 2020).
NOAA Office of National Marine Sanctuaries, and U.S Navy (2020e). One-third Octave Band Sound Pressure Levels at 1 Hertz and 1 Hour Resolution Recorded at SanctSound Site SB01_05, SanctSound Mar 2020 Data Products (Oct 2018-Dec 2019). Asheville, NC: NOAA National Centers for Environmental Information. doi: 10.25921/s530-2z35 (accessed December 30, 2020).
NOAA Office of National Marine Sanctuaries, and U.S Navy (2020f). One-third Octave Band Sound Pressure Levels at 1 Hertz and 1 Hour Resolution Recorded at SanctSound Site OC02_01, SanctSound Mar 2020 Data Products (Oct 2018-Dec 2019). Asheville, NC: NOAA National Centers for Environmental Information. doi: 10.25921/tg82-kt15 (accessed December 30, 2020).
NOAA Office of National Marine Sanctuaries, and U.S Navy (2020g). One-third Octave Band Sound Pressure Levels at 1 Hertz and 1 Hour Resolution Recorded at SanctSound Site OC02_02, SanctSound Mar 2020 Data Products (Oct 2018-Dec 2019). Asheville, NC: NOAA National Centers for Environmental Information. doi: 10.25921/b5wt-5y05 (accessed December 30, 2020).
NOAA Office of National Marine Sanctuaries, and U.S Navy (2020h). One-third Octave Band Sound Pressure Levels at 1 Hertz and 1 Hour Resolution Recorded at SanctSound Site HI01_01, SanctSound Mar 2020 Data Products (Oct 2018-Dec 2019). Asheville, NC: NOAA National Centers for Environmental Information. doi: 10.25921/1c8y-x824 (accessed December 30, 2020).
NOAA Office of National Marine Sanctuaries, and U.S Navy (2020i). SanctSound Raw Passive Acoustic Data. Asheville, NC: NOAA National Centers for Environmental Information. doi: 10.25921/saca-sp25
Putland, R. L., Merchant, N. D., Farcas, A., and Radford, C. A. (2018). Vessel noise cuts down communication space for vocalizing fish and marine mammals. Glob. Chang. Biol. 24, 1708–1721. doi: 10.1111/gcb.13996
Redfern, J. V., Hatch, L. T., Caldow, C., DeAngelis, M. L., Gedamke, J., Hastings, S., et al. (2017). Assessing the risk of chronic shipping noise to baleen whales off Southern California, USA. Endanger. Species Res. 32, 153–167. doi: 10.3354/esr00797
Roch, M. A., Baumann-Pickering, S., Batchelor, H., Hwang, D., Širović, A., Hildebrand, J. A., et al. (2013). “Tethys: A workbench and database for passive acoustic metadata,” in 2013 OCEANS-San Diego, (San Diego, CA: IEEE), 1–5.
Rolland, R. M., Parks, S. E., Hunt, K. E., Castellote, M., Corkeron, P. J., Nowacek, D. P., et al. (2012). Evidence that ship noise increases stress in right whales. Proc. R. Soc. B Biol. Sci. 279, 2363–2368. doi: 10.1098/rspb.2011.2429
Rowell, T. J., Nemeth, R. S., Schärer, M. T., and Appeldoorn, R. S. (2015). Fish sound production and acoustic telemetry reveal behaviors and spatial patterns associated with spawning aggregations of two Caribbean groupers. Mar. Ecol. Prog. Ser. 518, 239–254. doi: 10.3354/meps11060
Schärer, M. T., Rowell, T. J., Nemeth, M. I., and Appeldoorn, R. S. (2012). Sound production associated with reproductive behavior of Nassau grouper Epinephelus striatus at spawning aggregations. Endanger. Species Res. 19, 29–38. doi: 10.3354/esr00457
Shamir, L., Yerby, C., Simpson, R., von Benda-Beckmann, A. M., Tyack, P., Samarra, F., et al. (2014). Classification of large acoustic datasets using machine learning and crowdsourcing: application to whale calls. J. Acoust. Soc. Am. 135, 953–962. doi: 10.1121/1.4861348
Shiu, Y., Palmer, K. J., Roch, M. A., Fleishman, E., Liu, X., Nosal, E. M., et al. (2020). Deep neural networks for automated detection of marine mammal species. Sci. Rep. 10:607.
Staaterman, E., Paris, C. B., DeFerrari, H. A., Mann, D. A., Rice, A. N., and D’Alessandro, E. K. (2014). Celestial patterns in marine soundscapes. Mar. Ecol. Prog. Ser. 508, 17–32. doi: 10.3354/meps10911
Staaterman, E., Rice, A. N., Mann, D. A., and Paris, C. B. (2013). Soundscapes from a tropical Eastern Pacific reef and a Caribbean Sea reef. Coral Reefs 32, 553–557. doi: 10.1007/s00338-012-1007-8
Stafford, K. M., Castellote, M., Guerra, M., and Berchok, C. L. (2018). Seasonal acoustic environments of beluga and bowhead whale core-use regions in the Pacific Arctic. Deep Sea Res. 2: Top. Stud. Oceanogr. 152, 108–120. doi: 10.1016/j.dsr2.2017.08.003
Taylor, M. D., Babcock, R. C., Simpfendorfer, C. A., and Crook, D. A. (2017). Where technology meets ecology: acoustic telemetry in contemporary Australian aquatic research and management. Mar. Freshw. Res. 68, 1397–1402. doi: 10.1071/mf17054
Thomson, D. J., and Barclay, D. R. (2020). Real-time observations of the impact of COVID-19 on underwater noise. J. Acoust. Soc. Am. 147, 3390–3396. doi: 10.1121/10.0001271
Tyack, P. L., and A Partnership for Observation of the Global Oceans International Quiet Ocean Experiment Working Group (2017). Developing an essential ocean variable for the acoustic environment. J. Acoust. Soc. Am. 141:3525. doi: 10.1121/1.4987432
Tyack, P. L., Miksis-Olds, J., Ausubel, J., and Urban, E. R. Jr. (2021). Measuring ambient ocean sound during the COVID-19 pandemic. Eos 102. doi: 10.1029/2021EO155447
University of New Hampshire, and JASCO Applied Sciences (2020). ADEON Raw Passive Acoustic Data. Asheville, NC: NOAA National Centers for Environmental Information.
Van Parijs, S. M., Clark, C. W., Sousa-Lima, R. S., Parks, S. E., Rankin, S., Risch, D., et al. (2009). Management and research applications of real-time and archival passive acoustic sensors over varying temporal and spatial scales. Mar. Ecol. Prog. Ser. 395, 21–36. doi: 10.3354/meps08123
Wall, C. C., Mann, D. A., Lembke, C., Taylor, C., He, R., and Kellison, T. (2017). Mapping the soundscape off the southeastern USA by using passive acoustic glider technology. Mar. Coast. Fish. 9, 23–37. doi: 10.1080/19425120.2016.1255685
Wall, C. C., Simard, P., Lembke, C., and Mann, D. A. (2013). Large-scale passive acoustic monitoring of fish sound production on the West Florida Shelf. Mar. Ecol. Prog. Ser. 484, 173–188. doi: 10.3354/meps10268
Warren, J. D., Ainslie, M. A., Miksis-Olds, J. L., Martin, B., and Heaney, K. D. (2018). ADEON Calibration and Deployment Good Practice Guide. Version 1.0. Technical report by Stony Brook University for ADEON Prime Contract No. M16PC00003. Stony Brook, NY: Stony Brook University.
Watkins, W. A., and Wartzok, D. (1985). Sensory biophysics of marine mammals. Mar. Mamm. Sci. 1, 219–260. doi: 10.1111/j.1748-7692.1985.tb00011.x
Wenz, G. M. (1972). Review of underwater acoustics research: noise. J. Acoust. Soc. Am. 51, 1010–1024.
Keywords: passive acoustic monitoring, soundscape, marine mammal, anthropogenic noise, data management, open access
Citation: Wall CC, Haver SM, Hatch LT, Miksis-Olds J, Bochenek R, Dziak RP and Gedamke J (2021) The Next Wave of Passive Acoustic Data Management: How Centralized Access Can Enhance Science. Front. Mar. Sci. 8:703682. doi: 10.3389/fmars.2021.703682
Received: 30 April 2021; Accepted: 16 June 2021;
Published: 14 July 2021.
Edited by:
Laura Lorenzoni, National Aeronautics and Space Administration (NASA), United StatesReviewed by:
Philippe Blondel, University of Bath, United KingdomAntoine De Ramon N’Yeurt, University of the South Pacific, Fiji
Copyright © 2021 Wall, Haver, Hatch, Miksis-Olds, Bochenek, Dziak and Gedamke. This is an open-access article distributed under the terms of the Creative Commons Attribution License (CC BY). The use, distribution or reproduction in other forums is permitted, provided the original author(s) and the copyright owner(s) are credited and that the original publication in this journal is cited, in accordance with accepted academic practice. No use, distribution or reproduction is permitted which does not comply with these terms.
*Correspondence: Carrie C. Wall, carrie.bell@colorado.edu