 Pierre Failler
 Haoran Pan2†
 Negar Akbari
- 1Centre for Blue Governance, University of Portsmouth, Portsmouth, United Kingdom
- 2Center for Innovation and Development Studies, Beijing Normal University, Zhuhai, China
Marine and coastal areas are complex systems formed by the interaction among the local population, economy, environment and resources and there is an increasing tendency for recent studies in fisheries research to incorporate interdisciplinary methods in their approach. In this paper, the Integrated Social-Economic-Ecological model for Fisheries (ECOST) model is structured with three modules each of which intends to characterize some relevant aspects of social, economic and ecological systems, respectively. At the heart of the model stands a fisheries economic module describing the fisheries economy; within the model the economic module is extended to the areas of fisheries sociology and biology or ecology where social and ecological aspects of fisheries are modeled following appropriate theory and methodology, respectively.
Introduction
The continued slipping of world-wide fishery resources toward unsustainable direction and the persistent poverty existing in poor fisheries community indicates that fisheries management relies on complex interactions involving competing social, economic and ecological objectives (Failler et al., 2009). For addressing this complexity, decision makers may constrain the short-term economic drive of fishers for addressing the ecological objectives with measures such as effort control, however, that tends to cause economic inefficiencies in fisheries (Failler and Des Clers, 2002; Kompas et al., 2004). This research intends to introduce the integrated assessment method in fisheries for the evaluation of fishing activities and fishing policies to contribute to a better management of aquatic resources which affect sustainable development in coastal zones around the world. For this purpose, the present research develops an Integrated Social-Economic-Ecological model for Fisheries management called the ECOST model.
To analyze systems with numerous interacting elements such as species interactions in an ecosystem or those between industries and consumers in a socio-economic system economists and ecologists have applied regional fisheries linear economics models, ecosystem-based management models and multi-models (Fulton et al., 2014, 2015) as well as probabilistic models (Ruiz et al., 2017) and agent-based model, such as for Individual transferable quotas (Little et al., 2009). Linear models such as Input-output (IO) model and Social Accounting Matrix (SAM) are used to analyze the regional economic impacts of fisheries (Pilling et al., 2008) and multispecies and ecosystem modeling approaches such as multispecies production models (MSP) and Ecopath with Ecosim (EwE) have shown remarkable potential for ecosystem modeling (Latour et al., 2003; Christensen et al., 2011). The intertwined nature of economy and ecology in the fishery sector leads to economic-ecologic models which combine information and results from each discipline in a single cohesive model. Hoagland et al. (2003) develop an economic-ecological model via merging the IO model of a coastal economy with a model of marine food web with a case application in New England, United States. Their model simulates the economic impact of changes in primary production in the ecosystem on final demands for fishery products. Steinback et al. (2008) apply the IO to examine the biological and economic impact of reductions in the level of effort for the southern new England lobster fishery. Their results show that reduction in effort could potentially improve the sustainability of lobster resource and stimulate economic growth in the coastal economy. Kaplan and Leonard (2012) combine a fishery ecosystem model with IO model that traces how changes in seafood landing impact the broader economy in the US west coast region under different scenarios. Based on their results each policy option involves trade-offs between economics and conservation of the resources. Fay et al. (2019) link the Atlantis ecosystem model to an Input-Output regional economic model and assess the economic impact of change in the fishing effort via different scenarios in the Northeast US. Rybicki et al. (2020) use a bioeconomic model to understand the response of fleets of northeast Atlantic pelagic fisheries to different scenarios related to quota allocation, disruption in fish and fuel price and changes in recruitment. In another study by D’Andrea et al. (2020) a bioeconomic model to capture the dynamics between resources and fishing activities and evaluate the performance of fisheries in terms of catch, and profit is developed.
However, one of the shortcomings of these approaches is that these models work in isolation and the dynamic flow of feedback from the ecological system to the socio-economic systems may not be fully captured (Failler and Pan, 2007). The ECOST model proposed in this paper is structured with three modules each of which intends to characterize some relevant aspects of social, economic and ecological systems, respectively. At the heart of the model stands a fisheries economic module describing the fisheries economy; within the model the economic module is extended to the areas of fisheries sociology and biology or ecology where social and ecological aspects of fisheries are modeled following appropriate theory and methodology, respectively. Under the model the three modules are interconnected through established hard-links (which means different modules are internally linked, whereas a soft-link means different models are externally linked each other’s). So, any change in a system automatically affects other systems and take other systems’ reaction into account. In particular, the linkage between social and economic systems is made through income distribution, the linkage between economic and ecological systems is made through changes in fish stock and marine environment, and the linkage between social and ecological systems is made through social response to environmental problems, concerns and states (Failler et al., 2014). This design enables us to evaluate fisheries management and policies from social, economic and ecological dimensions.
The ECOST model is further extended to measure, monitor, assess, evaluate and analyze consequences of fisheries management and policy intervention with indicators and values. Fisheries impact on the society is obvious and ubiquitous but complex, demanding multi-faceted description. In this aspect various indicators for fisheries performance have been developed in past decade, particularly indicators related to ecology, economy and community (Eggert et al., 2021). These indicators are designed and organized according to cause-effect chain of Driver-Pressure-State-Impact-Response, ranging from several key indicators or main categories to thousand indices. While they have advantage in characterizing various processes, they encounter many problems such as measurability, data availability, selection, aggregation, and judgement. A competing alternative to indicator is valuation, which attempts to measure processes in a unique metric, usually monetary value, and thus provides convenience for policy assessment. However, many ecological and social processes are not possible to be valued. In this research we will not pursue exclusive use of indicators and valuations. Instead, we design a small set of indicators and valuation methods, which are most relevant to the questions in interest and can be generated from the model.
The rest of this paper is organized as follows. Section “The ECOST model” presents the integrated model. Sections “The integration model” and “Indicators of fisheries performance” discuss the indicators and valuation methods to be used. Section “Applications of the ECOST model” implements an empirical study to explore insights from the model. Finally, Section “Conclusion” will conclude the research.
The ECOST Model
A Structural Bioeconomic Model of Fisheries
There are two strands in the economic modeling of fisheries. One focuses on the bioeconomic relations of fisheries, aiming to maximize fisher’s profit by optimally utilizing the resources of commercial species. Its standard bioeconomic model features a fish production function that maps catchability, fishing effort and biomass stock into fish harvest. At steady state the fishing effort can be derived from the balance between harvest and growth of biomass. The other strand is interested in assessment of broad impact of fisheries industry. This strand focuses on the economic structural relations of fisheries, attempting to explore demand or supply stimulus on fisheries and linkage impact of fisheries, with little consideration of interactions between biomass change and fish production. The structural model has traditionally been dominated by input-output models, but recently there emerge SAM and CGE models that allow more comprehensive modeling and analysis (Dixon and Rimmer, 2016). Although linear economic models such as Input–Output can handle a great number of industry sectors, they are unable to capture some key non-linear interactions such as supply and demand for goods and services in the economy and may not be suitable to be used to examine the economic efficiency and welfare and ecosystem changes.
Our interest, however, lies not only in the bioeconomic relations of fisheries that are more oriented toward resource utilization, but also in the economic structural relations of fisheries that are more oriented toward regional economic and social development. Thus, we develop a structural bioeconomic model of fisheries by combining both strands. For this purpose we take a two-step modeling strategy. Firstly, we develop a fisheries input–output model in which structural relations of fish production with other sectors are specified, and with which full impact of fisheries on the economy can be assessed. Secondly, we specify a function of fish production that is determined by both fishing effort and catchability. With the function fishing effort is exogenously given rather than optimally determined, and catchability varies according to changes in biomass stock, which in turn depends on fish production. By this way the fish production follows a non-linear function that relates Catch per Unit Effort (CPUE) to fishing effort in calculating total catch. The innovative advance of the model is that the CPUE is no longer a parameter rather it is a variable, which is subject to biomass change. Therefore, the model establishes connection between the economy and the resource status via the CPUE which acts as an adjustable variable.
The Structural Relations of Fisheries
In the economics literature, input–output analysis was a traditional method to model structural relationships of an economy, probably due to its concise presentation of quantitative interdependence and operational convenience (Seung et al., 2021). The well-known input–output model is the Leontief demand-driven model and the less well-known is the Ghosh supply-driven model. In the Leontief model, the Leontief production coefficients, , is defined to be the proportion of sector i’s product in sector j’s total use of production, where xi,j is sector j’s production requirement on sector i’s product and Xj is sector j’s total input of production. In the Ghosh model, the Ghosh allocating coefficients, , is defined to be the share of the sector i’s product allocated to sector j in total product of sector i, where Xi is sector i’s total output.
Fish production consumes other sectors’ products or services, and fish are provided for other sectors’ production as well as for consumption. In this sense, fishing sector is backward or forward linked with its upstream or downstream sectors and has impacts that spread out the economy. This structural impact reflects fishing sector’s overall economic importance or performance and thus needs to be assessed with disaggregate, structural economic models.
In the literature of fisheries economics, input-output method was conventionally adopted to analyse the contribution of fishing sector to the economy (Seeteram et al., 2019). The traditional fisheries input-output models were either demand-driven or output supply-driven, not well consistent with modern fisheries regulations. In recognition of the problem, the present research develops a new input–output model that takes fishing effort as the driver of the fisheries economy to assess the economy-wide impact of fishing.
According to the fish production chain, fisheries can be classified into subsectors including not only fishing but also fishing supporting, fish processing and marketing. Figure 1 shows the structural relationships of fishing with other relevant sectors, i.e., the fishery production chain and its linkages to social and ecological systems. At the outset it is the variable of fishing effort, which is the principal driver of fishing activity. The fishing supporting sector is backward-driven by fishing sector to service, for example, gear production and maintenance. The fish processing sector is forward-driven by fishing sector, processing raw fish with particular techniques such as frozen, smoking, canned, salted, etc. The fish marketing sector sells raw and processed fisheries products and forward-driven by both fishing and processing sectors. The rest of the economic sectors are the non-fisheries sectors, which are backward-driven by all the fisheries sectors. Within the fishing sector, there are some heterogeneous micro fishers that we define as metiers. A fishing metier refers to a particular fleet equipping with a particular gear and targeting a particular species as main catch with other possible species as by-catch. Conventionally, a metier should be related to more than a single target species, indeed. However, one of the fundamental assumptions and limitations of input–output models is that one type of producer only produces one type of products. Therefore, we have to assume a metier catches a basket of differential species rather than a single species.
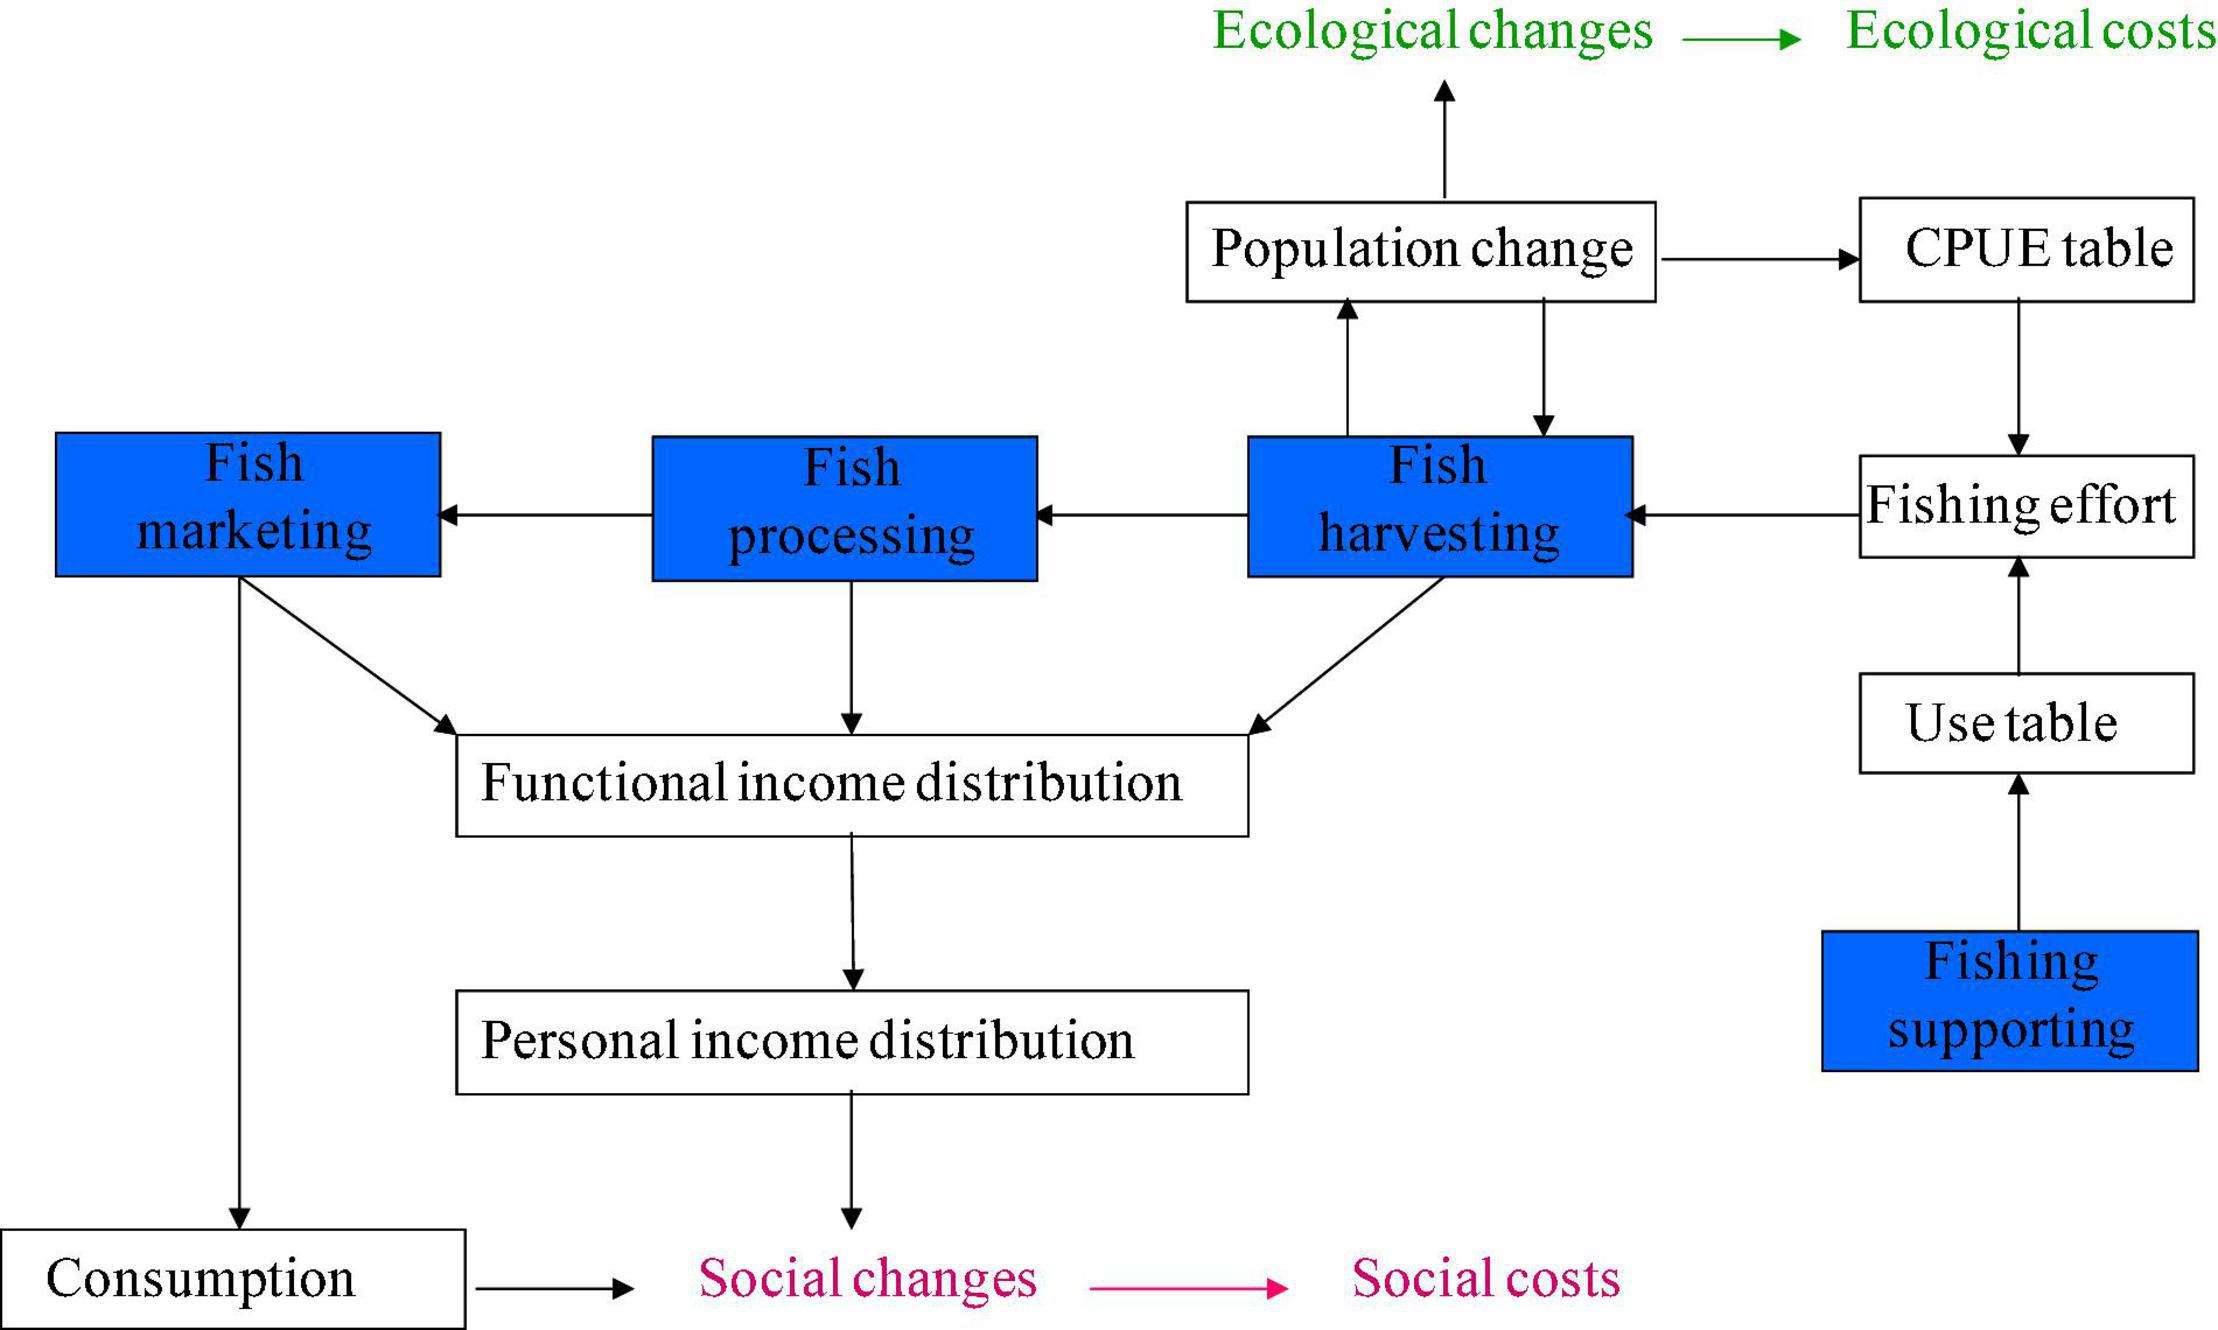
Figure 1. A fisheryeconomic model with full production chain and linkages to social and ecological systems.
Consider a fisheries economy with a general economic structure that includes a capture fisheries sector (f) which consists of n metiers, a fish processing sector (fp), a fish marketing sector (fm), and a non-fisheries sector (nf) that includes fishing supporting business. Assume that fishing efforts are represented by the primary inputs or value added in capture fisheries and are exogenously given, the value added generated by the fish processing sector is ‘pushed’ by the capture fisheries,
where the parameter, cfp, is the ratio of value added to total core input in the fish processing sector, representing the effect of per unit core input use on value added generation; Bfp,f is a row vector consisting of the Ghosh intermediate allocating coefficients of metiers for the fish processing sector, bfp,f. Xf is a column vector of endogenous total inputs of the metiers.
The value added generated by the fish marketing sector is ‘pushed’ by both the capture fisheries and the fish processing sector,
where the parameter, cfm, is the ratio of value added to total core input in the fish marketing sector, representing the effect of per unit of core input on value added generation. Bfm,f is a row vector consisting of the Ghosh intermediate allocating coefficients of the capture fisheries for the fish marketing sector. bfm,fp is a Ghosh intermediate allocating coefficients of the processing sector for the marketing sector. Xfp is endogenous total input of the fish processing sector.
Assuming that the fisheries sectors’ production follows the Ghosh supply-driven model, the balances of fish production are as follows,
where all B represent the Ghosh intermediate allocating coefficients. Among them, Bf,f is a square matrix by metier with elements bf,f. Normally this matrix contains zeros from the data, since basically there are no interactions among the metiers. Xf is a column vector of total outputs by metier. Bf,fp is a column vector by metier for the fish processing sector. Bf,fm is a column vector by metier for the fish marketing sector. Bf,nf is a column vector by metier for the non-fisheries sector. Xfm and Xnf are total inputs of the fish marketing and non-fisheries sectors, respectively. Vf is a column vector by metier of exogenous primary inputs (or value added of the metiers).
The primary input of the fish processing sector depends on the amount of fish captured. The more raw and fresh fish that are to be processed, the more primary input that is needed in the fish processing sector. As a result, the production of the fish processing sector will also follow the Ghosh supply-driven model with the following supply and demand balance,
where Bfp,f is a row vector by metier for the fish processing sector. Its element bfp,f indicates the proportion of metier f’s product allocated to the fish processing sector (reflecting the forward linkage effect). bfp,fp, bfp,fm, and bfp,nf are the Ghosh intermediate allocating coefficients of the processing, marketing and non-fisheries sectors for the fish processing sector, respectively. The primary input (or value added) of the sector Vfp is endogenously determined through the ‘pushing’ effect of capture fisheries.
The primary input of the fish marketing sector depends on both the amount of fish harvested and processed. The more raw or processed fish that needs to be distributed in the market, the more the primary input needed in the fish marketing sector. As a result, the production of the fish marketing sector also follows the Ghosh supply-driven model, with the following supply and demand balance,
where Bfm,f is a row vector by metier for the fish marketing sector. Its element bfm,f indicates the proportion of metier f’s product allocated to the fish marketing sector (reflecting the forward linkage effect). bfm,fp, bfm,fm, and bfm,nf are the Ghosh intermediate allocating coefficients of the processing, marketing and non-fisheries sectors for the fish marketing sector, respectively. The primary input (or value added) of the sector Vfm is endogenously determined through the ‘pushing’ effect of both capture fisheries and fish processing.
Substituting equations (1) and (2) into equations (4) and (5), respectively, we get
and
Contrary to the supply-driven fisheries sectors, the non-fisheries sector follows the Leontief demand-driven model, and has the following product balance:
where all parameters are the Leontief intermediate use coefficients of the non-fisheries sector. Among them, Anf,f is a row vector the element of which anf,f indicates the proportion of the non-fisheries sector’s product used in capture fisheries sector f’s production (reflecting the backward linkage effect). anf,fp, anf,fm, and anf,nf are the proportions of the non-fisheries sector’s product used in processing, marketing and non-fisheries sectors’ production (also reflecting the backward linkage effect), respectively. Dnf is exogenous final demand for non-fisheries product.
Combining equations (3), (6), (7) and (8), we express them in a matrix format,
where
The solution of this linear equation system can be solved with
where I is unity matrix. Assuming Dnf = 0, the solution then gives all impact of capture fisheries.
Since non-fisheries production follows the Leontief demand model, its value added will be determined endogenously by total output or input:
where vnf represents the share of value added in total input in the non-fisheries sector.
Finally, all fisheries sectors’ value added can be summed into total fisheries value added,
Combining the fisheries value added with the non-fisheries value added then produces the economy-wide value added, which is equivalent to the total final demand of society (GDP).
This equation describes an economic system where exogenous primary inputs of capture fisheries (or fishing effort in the terminology of fisheries economics) determines fish production, these act as core inputs to generate value added in the fish processing and marketing sectors (forward linkage sectors), and all fisheries sectors pull non-fisheries sector’s production (backward linkage sector).
The Bioeconomic Relations of Fisheries
Fish production uses not only intermediate products and primary factors but also natural aquatic resource. Fishing removes some fish from the sea and thus intervenes into natural production process of fish stock. On the other hand, state of fish stock affects fishing productivity. At this point it is the connection between economic and ecological systems.
The fisheries bioeconomics relates fishing effort with Catch Per Unit of fishing Effort (CPUE) to measure catch of fish in a time interval. CPUE values depend on catchability and fish stock. CPUE coefficient will be high if a fish stock is abundant and will be low if the fish is scarce. Assume a metier’s action removes some amounts of multiple species from the biomass stocks and total catch of a species results from all relevant metiers’ actions. Let Em,t denote the fishing effort of metier m, cm,s,t the catch of species s by metier m, and Cs,t total catch of species s by all metiers at time t, then
Let qm,s,t denote the catchability of species s by metier m, and BMs,t biomass stock of species s at time t, the CPUE coefficient can be transformed into a linear function of biomass stock
where the catchability is a constant representing the probability of species s being caught by per unit of fishing effort of metier m, and can be calibrated from data at any reference time 0
Substitute equation (16) into (15), then
Equation (17) obviously states that CPUE value simply is the adjustment of reference CPUE by change in biomass stock. Substitute this equation into (14), the catch becomes a non-linear function of both fishing effort and biomass stock
In the equation, fishing effort, E, plays a key role in calculation. It can be set up on basis of exogenous value, optimisation, simulation or forecast, depending on the questions in interest. In our structural model, since fishing effort is exogenously given and structurally related to total input of fish production, we revise equation (18) by replacing effort with total input into a new formula
where CPUOm,s,0 measures Catch of species s Per Unit of Output of metier m, its values can be calibrated from the data at reference time 0. Since total output equals to total input, let Cm,t denote total catch by metier m, then
In equation (18), the biomass stock at present period depends on both the level and growth of biomass stock, and also the catch at previous period
where BG is growth rate of biomass stock, and Cs,t−1 = ∑mcm,s,t−1 is total catch of species s across metiers.
The Ecological Module
The ecological module is an ecological extension of the economic model, focusing on assessment of biomass change. From equation (21) catch is a man-made factor of biomass change to be determined in the economic model, and biomass growth is a natural property of biomass change, needing to be simulated with some biological functions such as linear, logistic, exponential, or others (Hilborn and Walters, 1992). Through this way the economic and ecological modules are hard linked to each other, and the interactions between the economic and ecological systems are captured (Duan et al., 2009). However, due to the complexity of biological system, biomass change would be better assessed from comprehensive biological model systems where biological interactions are considered to a considerable extent. In that situation, a soft (external) link between the economic and ecological modules is needed.
In this research, we assume biomass change follows the logistic curve. Let θs and CAPs denote the intrinsic growth rate and carrying capacity of species s, respectively, then biomass growth of the species is
Both θs and CAPs are biological parameters that can be estimated or calibrated from biological data.
The Social Module
The social module is a social extension of the economic model, focusing on income-based social issues.
Figure 2 shows the linkages among the social, economic and ecological models and the calculation of social, economic and ecological costs. In the figure, ECOSTSM, ECOSTEM, and ECOSIM represent social, economic and ecological model, respectively. The economic model is in the middle of the figure, linking the social model by functional incomes and the ecological model by fishing effort. Presently we have not established direct link between the social and ecological model. Based on personal income distribution, the social model can be used to calculate the social cost of fisheries. The economic cost of fisheries is the sum of production costs of all fisheries sectors net of total output, which depends on the catch from the ecological model. The ecological cost is assessed from biomass stock change.
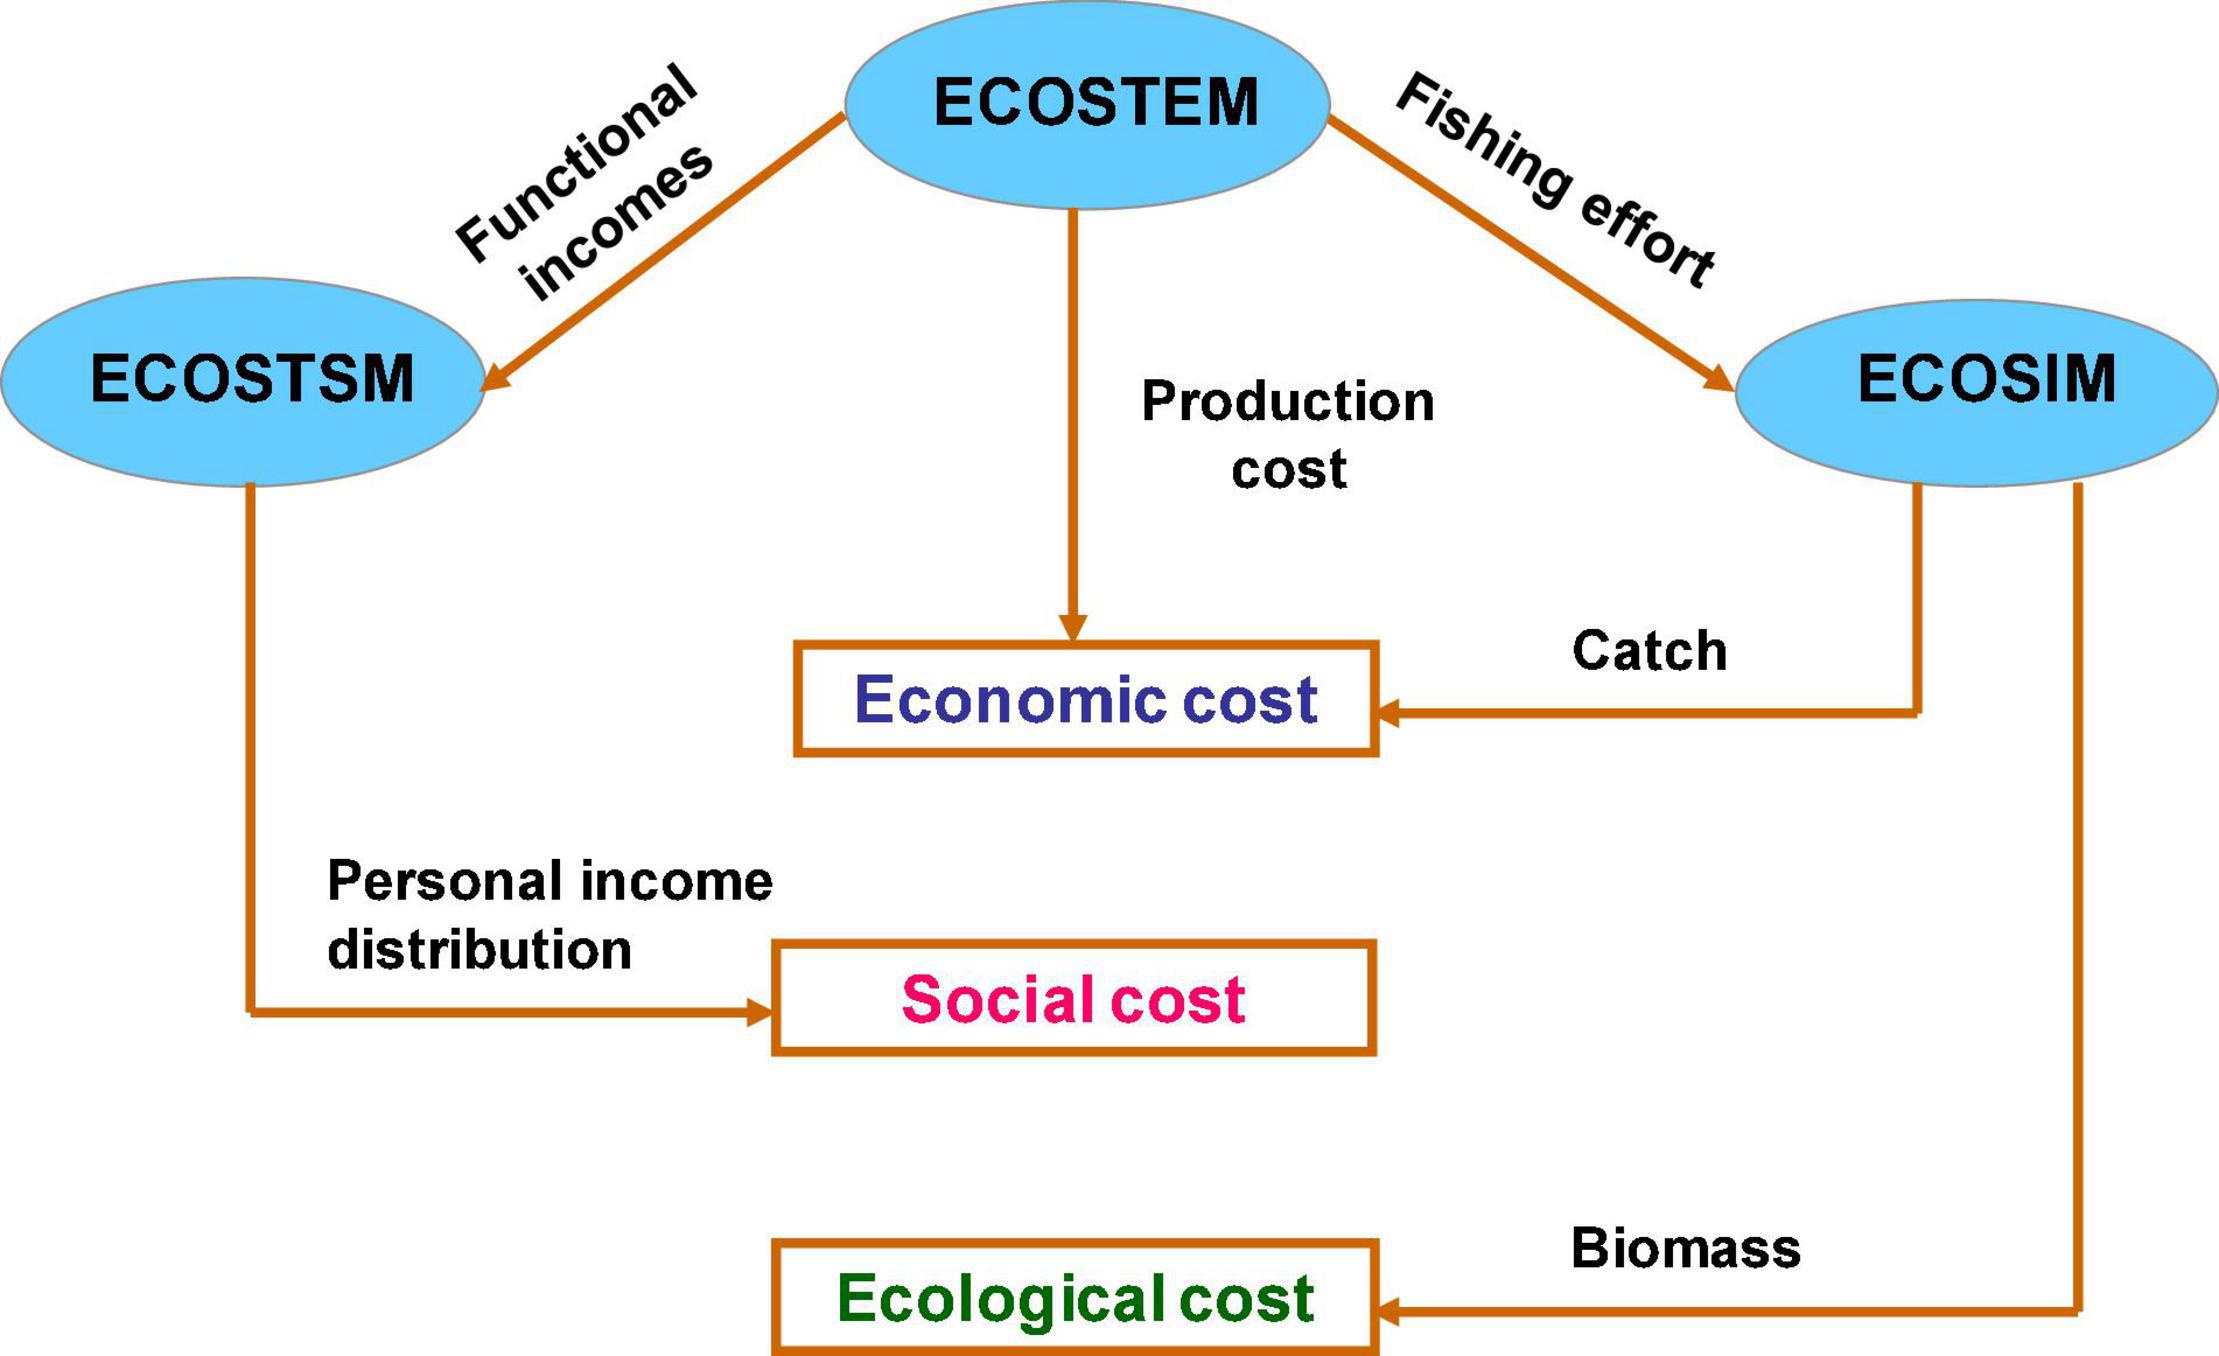
Figure 2. The linkages of social, economic and ecological models for cost calculation.
Figure 2 shows the interrelations among fisheries, all the four fishery sectors will use production factors – capital and labor – and generate functional incomes. Once the functional incomes are distributed to the factors, they will be further distributed among fishery-depending households. This comes to the personal income distribution, which is relevant to social issues. Here is the linkage between social and economic systems.
The details of the model are presented in Wang et al. (2015). The resource content of fish production is specified and changes in biomass stock are estimated. Thirdly, the feedback of biomass change on fishing productivity or catchability is introduced into fish production. This integration of the bioeconomic and economic structural approaches on fisheries seems to be novel.
Fish products are raw and fresh fish, part of which will directly go to households for consumption, part of which will go to the fish market for sale, and the rest of which will go to the fish processing sub-sector for processing. In industrial evolutionary theory, a sector’s evolution largely depends on its “core inputs,” which are produced and provided by the so-called “carrier sectors or branches.” According to this view the model regards raw and fresh fish to be the “core inputs” of the fish processing and marketing sub-sectors, and so capture fisheries as the “carrier sectors or branches.” Fish processing produces processed fish; part of which will directly go to households for consumption, part of which will go to the fish marketing sub-sector for sale. Finally, raw and/or fresh and/or processed fish can also be supplied direct to the consumers.
It is the economic system that generates income from factor uses. The factor incomes affect the social system through income redistribution among persons. The personal income distribution is thus commonly regarded as one of the main forces determining the social costs and benefits. It is closely related to well-being, poverty, and other income-based social issues. After all, some non-income based social issues are also indirectly related to personal income distribution. The social well-being is discussed in Millennium Ecosystem Assessment where the social services include five categories, namely basic material needs, health, social relations, personal security, and freedom and choice. The basic material needs generally cover food, water, clothing, shelter, etc. The health concerns body condition, life length, feeling, and living environment. The social relations include social cohesion, respect and help, and gender development. Personal security means safety from natural and social environment. Lastly, freedom and choice refer to own control. Clearly, the first two categories are directly related to personal income that is generated from the economy.
The Integration Model
Figure 2 shows the linkages among the social, economic and ecological models and the calculation of social, economic and ecological costs. In the figure, ECOSTSM, ECOSTEM, and ECOSIM represent social, economic and ecological model, respectively. The economic model is in the middle of the figure, linking the social model by functional incomes and the ecological model by fishing effort. Presently we have not established direct link between the social and ecological model. Based on personal income distribution, the social model can be used to calculate the social cost of fisheries. The economic cost of fisheries is the sum of production costs of all fisheries sectors net of total output, which depends on the catch from the ecological model. The ecological cost is assessed from biomass stock change.
Fisheries have been a traditional primary industry, which not only produce aquatic products for human consumption and industrial uses but also provide employment and generate primary incomes to support the fishery society. In this aspect, the impact of fishing on the society is obvious. However, the impact of fishing activity on social system involves much complexity. Fisheries incomes are relatively low on average particularly in the developing economy and unevenly distributed among earners, causing some social problems such as poverty, food insecurity, poor health care, less education, and others. According to Millennium Ecosystem Assessment (2003), social products and services include five categories: basic material needs, health, social relations, personal security, and freedom and choice. While the first two categories are generally classified as income based social well-being, the latter three categories are classified as non-income based social well-being. Because of immaturity in theory and methodology of valuation of the non-income-based social well-being, this research focuses on the income-based social well-being through the changes in income level and distribution induced by fishing activity. We adopt the ideal point method to value the social costs.
Fishing activity means a cost to the ecological system if it removes biomass stock at a scale beyond nature’s ability to recover. As biomass stock declines, catching as same amount of fish as before will require more fishing effort. In this sense, the ecological system in turn induces additional cost to the fishing activity. Both types of costs are related to the ecological system, but they are different by nature. The former measuring the damage to the natural system can be regarded as the ecological cost, while the latter should be taken as the indirect economic cost caused by ecological system. However, if fishing activity does not affect the natural state of biomass stock, the ecological system will offer a net benefit to the activity. There is also indirect impact of fishing on species population or biodiversity. Some fishing methods may damage the environment or ecological system by fishing. As a result, relevant species will be affected inevitably. This research assesses the direct impact on population change by the ecological module and the indirect impact by an associate method.
Indicators of Fisheries Performance
At the central of the ECOST model is the fishery economy which then extends to fishery-related social and ecological systems. The fisheries economic model of the ECOST model considers the full production chain of fisheries, which includes fish harvesting, fishing supporting, fish processing, and fish marketing sectors. The fish harvesting sector consists of some micro producers that we define as metiers. A harvesting metier refers to a particular fleet equipping with a particular gear and targeting a particular species as main catch. A metier may capture other species as by-catch. Figure 1 illustrates the fishery production chain and its linkages to social and ecological systems.
Valuation of Fisheries Performance
Our aim in this research is to assess total cost of a metier’s fishing activity. As the fishing activity will induce supporting, processing and marketing activities, the economic cost of a metier’s fishing activity must include the costs occurred in all relevant fishery sectors. The fishing cost of a metier normally consists of two parts, namely fixed and variable costs. The former normally refers to the maintenance costs that are independent of fishing effort and the latter the running cost including factor and product inputs. To assess the full cost of a fishing metier’s activity, we extend the fishing metier to include its impact on supporting, processing and marketing sectors. Let ext, har, sup, pro, and mak represent extended metier, harvesting, supporting, processing and marketing sector, respectively, then the full cost of an extended metier then is calculated as follows
Where
m: metiers
sp: processing firms or processed species
d: distributors
c: cost
: the proportion of metier m’s products processed by the processor
: the proportion of metier m’s products directly distributed by the distributor d
: the processor sp’s product distributed by the distributor d.
The proportion variables θ can be either calibrated from data or endogenously determined by maximizing the revenues of processing and marketing sectors. Similarly, the benefit of the extended metier is
And the net economic cost is
The Ecological Costs
Environmental economics has traditionally focused on impact of human activity on ecosystem. Recently a new brand of research mainly generated from ecological economics instead proposes to study impact of ecosystem on human society. Constanza et al. (1997) argue that ecosystem contributes to human society through ecosystem services, which contain some economic value. Once these services are valued, they represent the ecological benefits to human society in monetary term. Millennium Ecosystem Assessment (2003) further extends to social system’s services to explore the economic value of social system. Beaumont et al. (2007) apply the approach of ecosystem goods and services to marine system to study the goods and services that marine provides to human society. They identify 13 types of marine goods and services, which can be classified into five categories, namely, production services, regulation services, cultural services, option use value, and support services. Beaumont et al. (2008) further attempt to value those marine goods and services, using various valuation methods, in case studies. The result of the research inspires further directions as well as exposes difficulties in valuation of the marine goods and services that are not directly observed in the markets.
The ECOST research basically follows the theory of ecosystem approach to develop a methodology of quantifying and valuing marine goods and services. Instead of studying the full range of marine goods and services, we focus on fish only in this research. The fish perhaps is one of the most important goods and services that marine system provides to human society. The appropriation of the benefit is through fisheries, a direct economic activity. It is the economic system that reduces biomass stock through capture of marine fish and in turn the ecological system affects the fishing productivity due to the scarcity of biomass. If economic capture of marine fish is within the original natural growth of marine resource, the economic activity gains a net value from exploring the marine resource without damaging it. However, if the capture is beyond the original natural growth, the marine resource will only sustain a growth below its original natural growth. As a result, the marine resource may provide less value to the economic system than the marine resource at the original natural state does. In this sense, we say that over- exploration reduces the growing ability of marine resource and causes a loss to the ecological system. It will take time for the marine resource to recover from the new to its original natural state. The recovering process can be viewed as a loss in economic value that the economic system otherwise may subtract from the resource at the original natural state.
We first define landing value of a species of fish as the ecological benefit that the species provides to the fishing activity. Once a certain amount of the species is removed from the marine, the biomass stock of the species reduces to a new, low level, which will grow in next year. We thus define the difference between the landing value and the growth value as the ecological cost. If the growth value is below the land value, there exists an ecological cost. If the growth value exceeds the land value, the ecological cost is negative, representing a benefit. For example, on an extreme case that the biomass stock will not grow any, the ecological cost equates to the landing value or ecological benefit, the net ecological benefit in fact is zero.
Let el refer to ecological system, X total removal of a species, the ecological benefit of a species is
The potential growth of the biomass stock is
Then, the ecological cost of species s, is
And, the net ecological cost is
which in fact is the value of the potential growth of the biomass stock.
Since our aim is to measure social, economic and ecological costs at metier level and the ecological costs are measured for each species, they need to be transformed into the ecological costs by metier. The ecological costs and benefits are associated with not only harvesting fisheries but also processing and distributing fisheries. In each of these fisheries sectors, the ecological benefits are defined to be total production values, which are
In order to get the ecological costs for fisheries sectors, we first need to know how value output will change correspondingly with the potential growth of the biomass stock of a species. For each of the sector, it is
where z represents the value of potential growth of the biomass stock of a species.
The ecological benefit of an extended metier is
The value of potential growth of an extended metier is
The ecological costs of an extended metier thus is
And, the net ecological cost of an extended metier is
The Social Costs and Benefits
In previous section, we stated that the Millennium Ecosystem Assessment (2003) classifies social products and services into five categories the first two of which are referred to income based social well-being and the latter three are referred to non-income based social well-being. Rare are researches that report any valuation of the income based social well-being, needless to say the non-income based ones. In this research, we attempt to develop methods to value the basic material needs and health. To address the social value, we must at first define a society’s economic position. Let us assume that an ideal level of personal income in a society is known. Based on this, ideal levels of spending on basic material needs, health and others can also be derived. Furthermore, based on the current market situation, we can calculate the necessary spending on basic material needs, health and others, respectively. If we define the real spending as social benefit, the difference between the ideal and real situation measures the social cost. For example, if ideal level of spending on basic material needs is $1000 and real spending is $600 in a fisheries society. We say that the social benefit of the fisheries is $600 and the social cost is $400. If the real spending can reach $1000, there is no social cost in terms of basic material needs.
In this research, we focus on social costs and benefits of basic material needs and health. We leave all other social services to the other category. Let BMN, HLH, and OTH represent basic material needs, health care and other social services, respectively. PIN is person income, and the share of each spending in personal income. Then, the social benefits of each of social services related to each fisheries sector can be calculated as follows
The total social benefit of all social services related to each fisheries sector is
In order to calculate the social costs and benefits at métier level, we need to know the number of households depending on the income generated in j’s fisheries sector, NHH. Then, the social costs related to each fisheries sector can be calculated as follows
And, the total social cost of all social services related to each fisheries sector is
Finally, we need to transform the social costs and benefits into extended métier level. The social benefit of an extended metier is
The social cost of an extended metier is
And, the net social cost of an extended metier is
The Societal Cost
The societal cost is the sum of social, economic and ecological costs. Let st indicate the society, then the societal cost of metier m’s fishing activity is
Applications of the ECOST Model
One of the main application areas of the proposed model is to assess the impacts of fishing policy on fishing activities considering an integrated approach toward the social, economic and ecological aspects in fisheries. Through evaluating the changes in the economic and social indicators and connecting that to an ecosystem module, the model is constructed to investigate how different policies result in different states of the socio-economic and ecosystem structure.
An application of the model is found in the study of Christensen et al. (2011) where a case study based on an ecological model of the South China Sea ecosystems is used where the Tuna, Mackarel, and Clams value chains are assessed. The trophic ecosystem model is linked to a value chain approach where the flow (amount, revenue, and costs) of fish products from sea to the end consumer is tracked. From a management perspective the model shows the impact of interventions such as quota setting and effort regulations, on the ecosystem, economy, the social setting, and the food availability for the consumers. In the study by Wang et al. (2016) the ECOST model is applied to assess the implementation of ecosystem-based fisheries management in the Pearl River Estuary. Impacts on the ecological-economy-social system are examined by varying fishing efforts for four scenarios including status quo management, fishing effort reduction policy, fishing gear switch and summer closure extensions policies. Their results show the gear switch scenario presents a compromise among the economics, conservation and social metrics and outperforms other scenarios in terms of biomass at the end of the simulation period. However, the fishing effort reduction policy performs better than the summer closure extensions policy in terms of the conservation metrics but does relatively poorly in economics terms. The model is also used in the study by Wang et al. (2020) to investigate how different scenarios of fishing effort and catch management reflecting varying levels of input and output in four fishery management simulations result in different states of the socio-economic and ecosystem structure. The modeling results show that the output control policy has the most positive effect on ecosystem restoration and can increase over all social welfare.
By providing a useful approach to quantify the trade-offs between ecological and socio-economic systems, the model tends to deal with the multi-objective management of the fisheries sector and reconcile the socio-economic and ecological goals which are inherently conflicting.
As an example, we applied here the ECOST model to the Thai economy. The model is a spreadsheet model that is tailor-made for Thai fisheries on basis of the ECOST integrated fishery model, which evaluates social, economic and ecological costs and benefits in a framework coupling the economy with social and ecological systems. The economic module of the model combines macroeconomic structure with microeconomic fishery production, where the fish chain and fishery production chain are reflected. The model contains both supply-push and demand-pull input-output mechanism at the core to trace full impact of marine fishing on the economy. The model can simulate fishing decisions on effort based on optimal allocation of fleets among different metiers. The model is linked with the Ecopath Thai ecological model and extended to social valuation of fisheries. We conduct the application as follows.
The Steps
1. Input macroeconomic data
2. Define the metiers
3. Input fishery microeconomic data
4. Input economic data, calculate results and conduct analyses
5. Optimize the decisions on fishing effort
6. Do input-output analysis for the fishery economy
7. Compute multiplier effect of fishing on the economy and the society
8. Estimate ecological change of biomass stock due to catch via linkage with the Ecopath model
9. Import the results on biomass change by species from the Ecopath model
10. Evaluate welfare changes by valuation of social goods and services
11. Calculate societal costs and benefits - final results of model simulation, including societal costs and benefits, by species
12. Conduct dynamic computation and analysis for the period of 2005–2015.
The Data
The data for empirics cover macroeconomic, fisheries and microeconomic data. Below we present macroeconomic and fisheries data (the micro data tables are presented in the Supplementary Appendix). Table 1 distinguishes fishing sector, fish processing sector and the rest of the Thai economy, each of which includes a list of inputs such as fish harvested, fish processed, non-fishery product, labor, capital and taxes. Table 2 briefly describes fishery sector’s input–output structure. Table 3 defines five typical metiers.
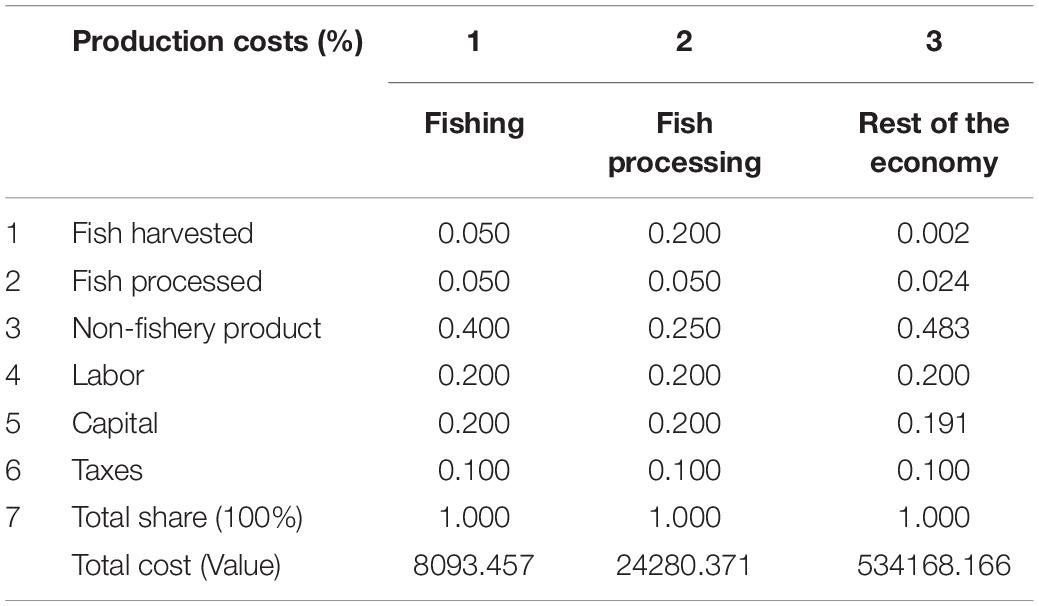
Table 1. The macroeconomic data needed for the model.
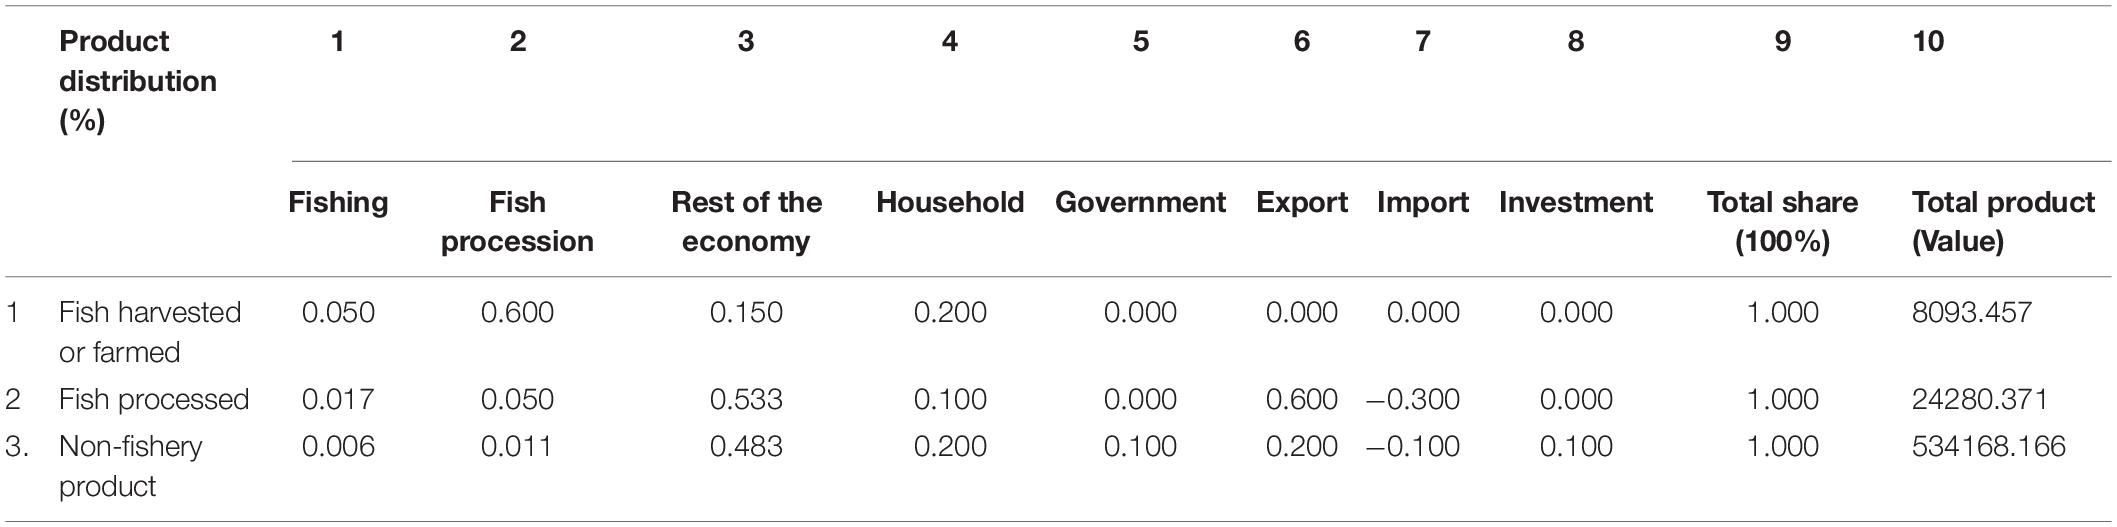
Table 2. The input–output data of fishery sectors.
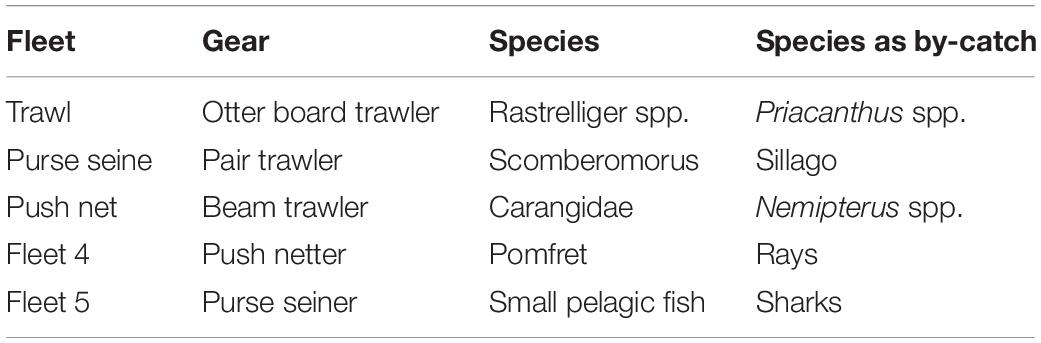
Table 3. Definition of the metiers.
The Results
Tables 4–6 present the results. Table 4 gives economic results of fishery and non-fishery sectors on production, material use, value added, employee’s awards, capital return (Owner’s profit), capital depreciation, tax contribution, household consumption, export, import, economic benefits and costs of fishery, and net economic benefit of fishery. Table 5 gives ecological results of species regarding biomass stock and change, catch, growth, ecological benefits and costs, and net ecological benefit. Obviously, with each species its ecological costs are far larger than benefits and results in net ecological loss.
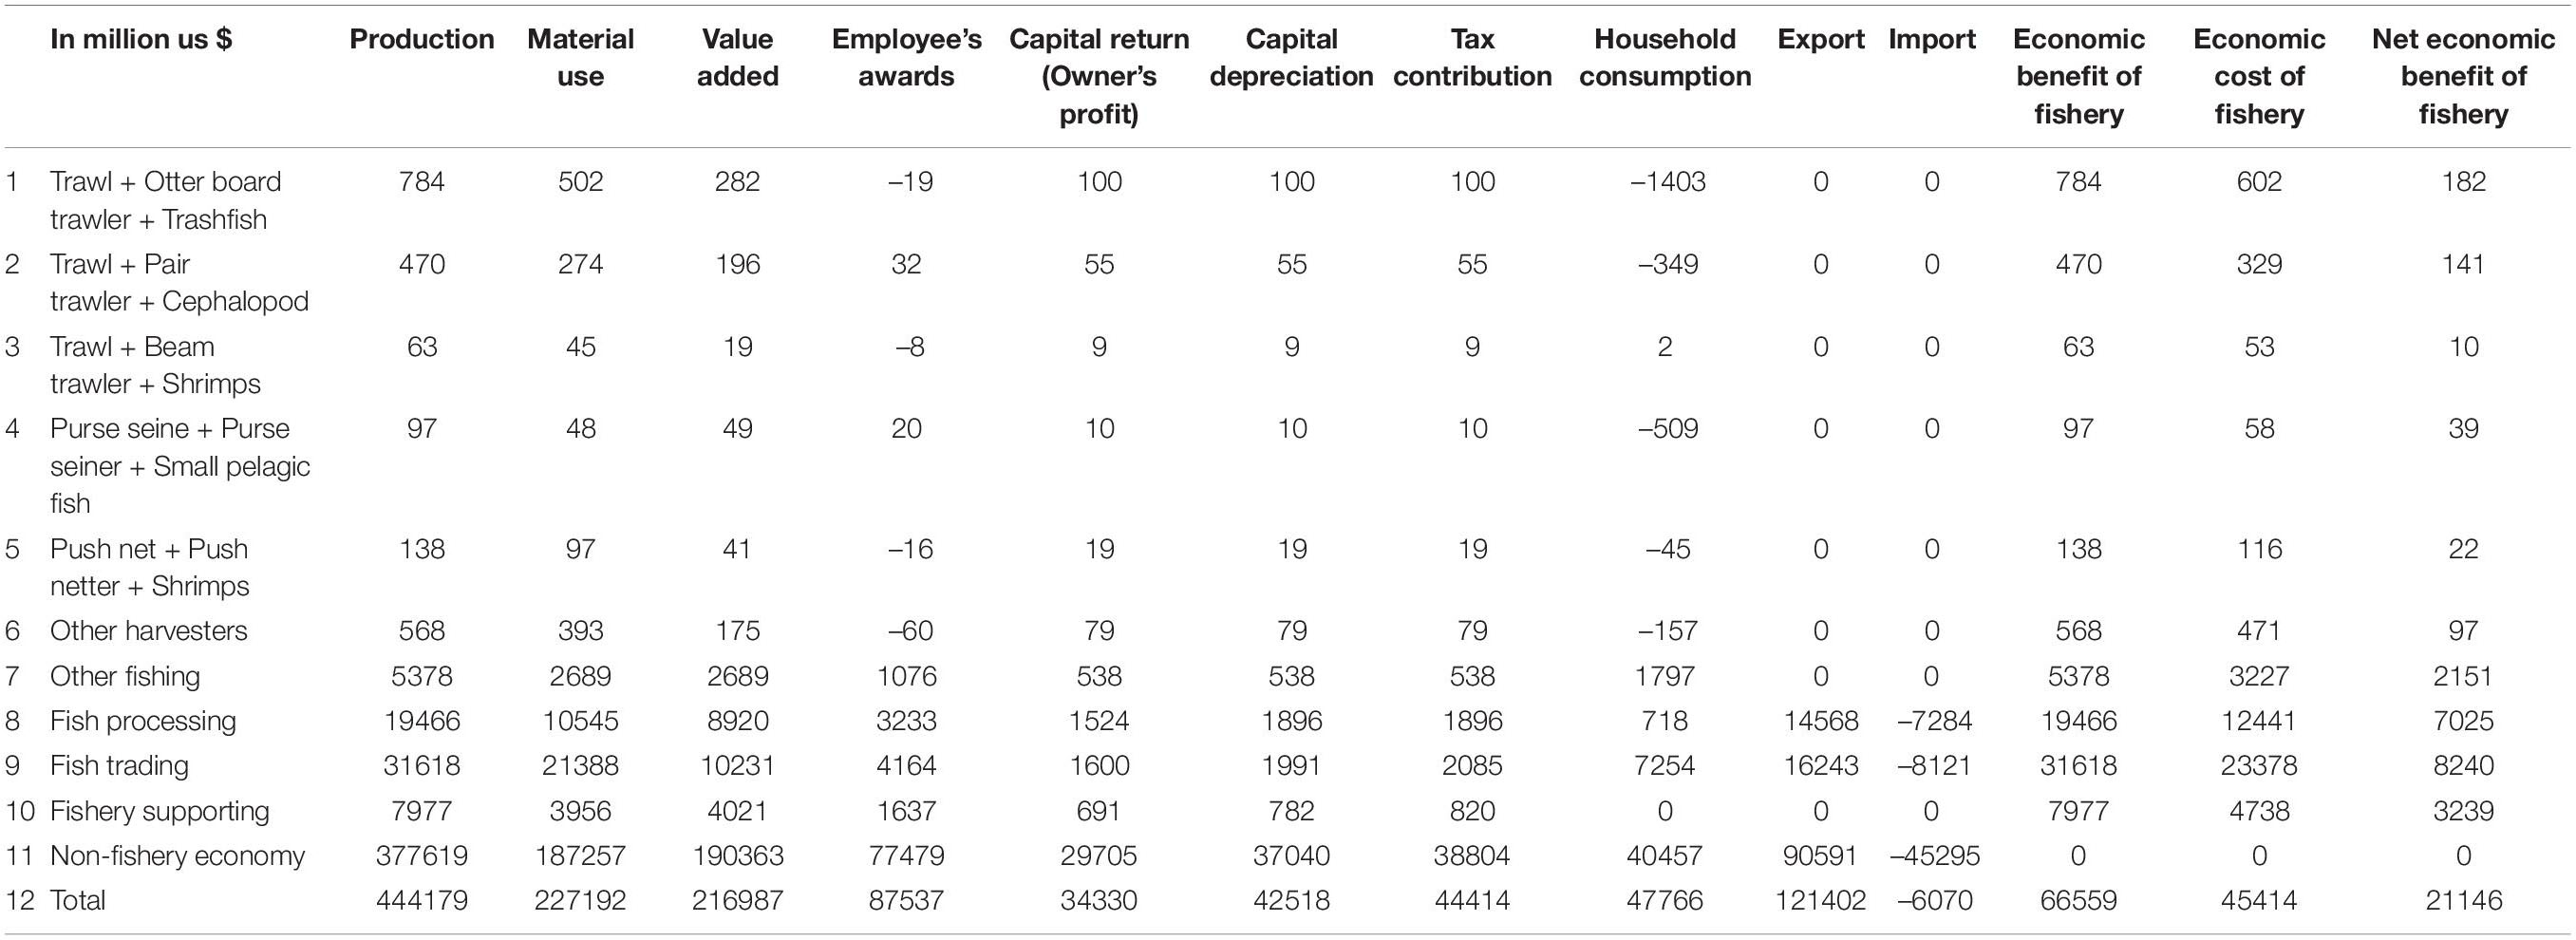
Table 4. Results on economic performance in 2015.
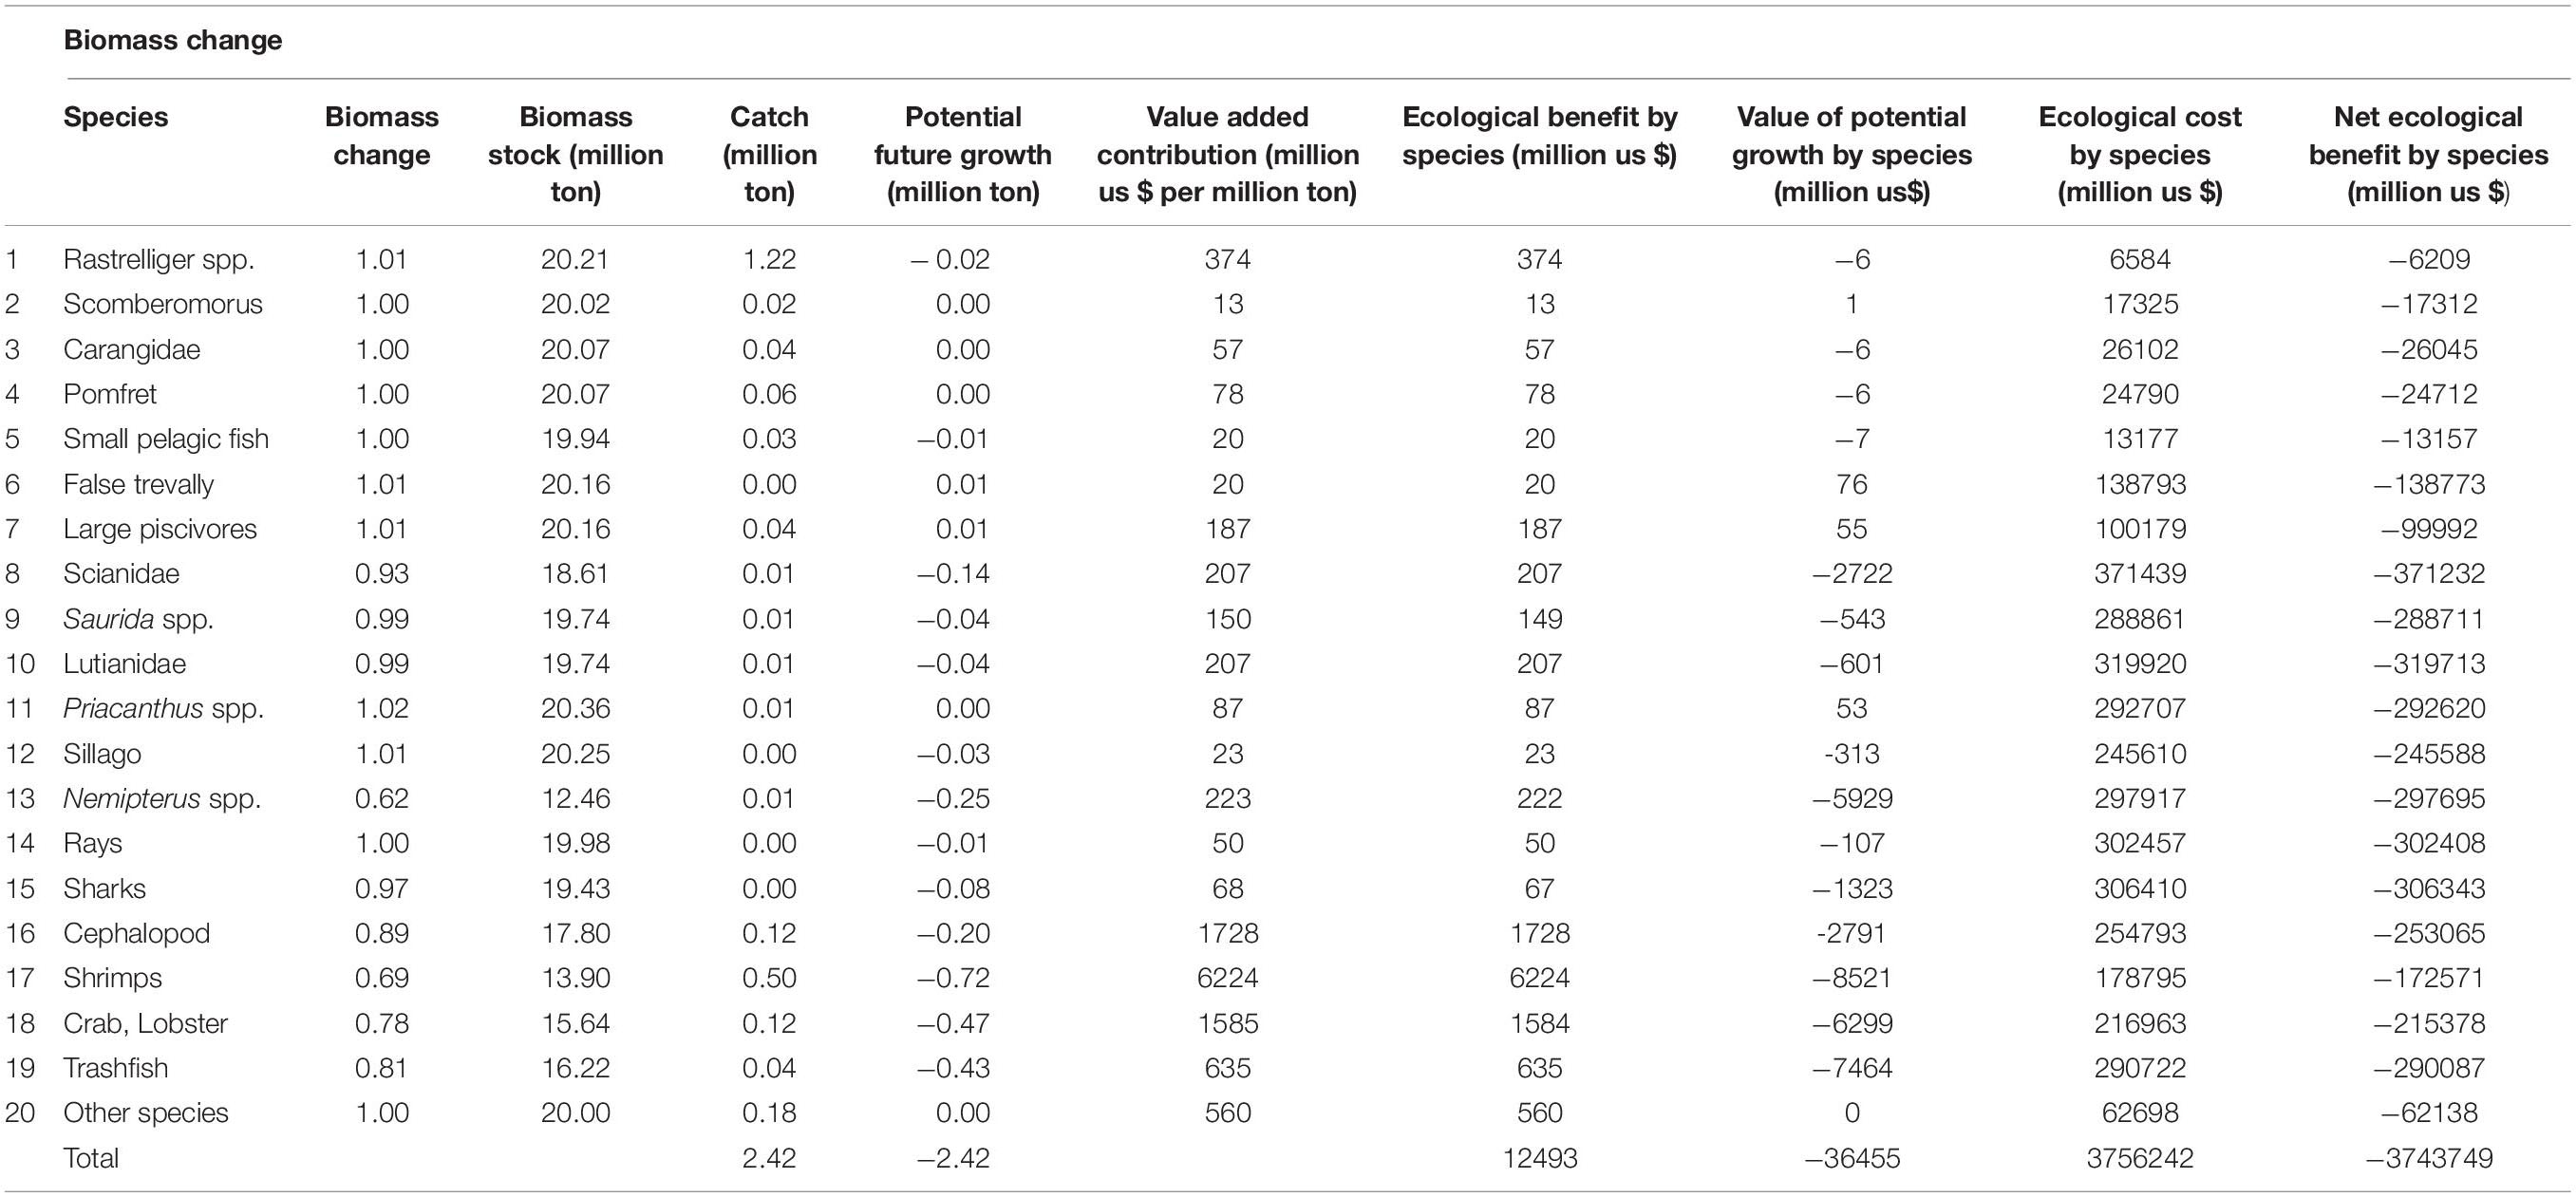
Table 5. Results on ecological performance in 2015.
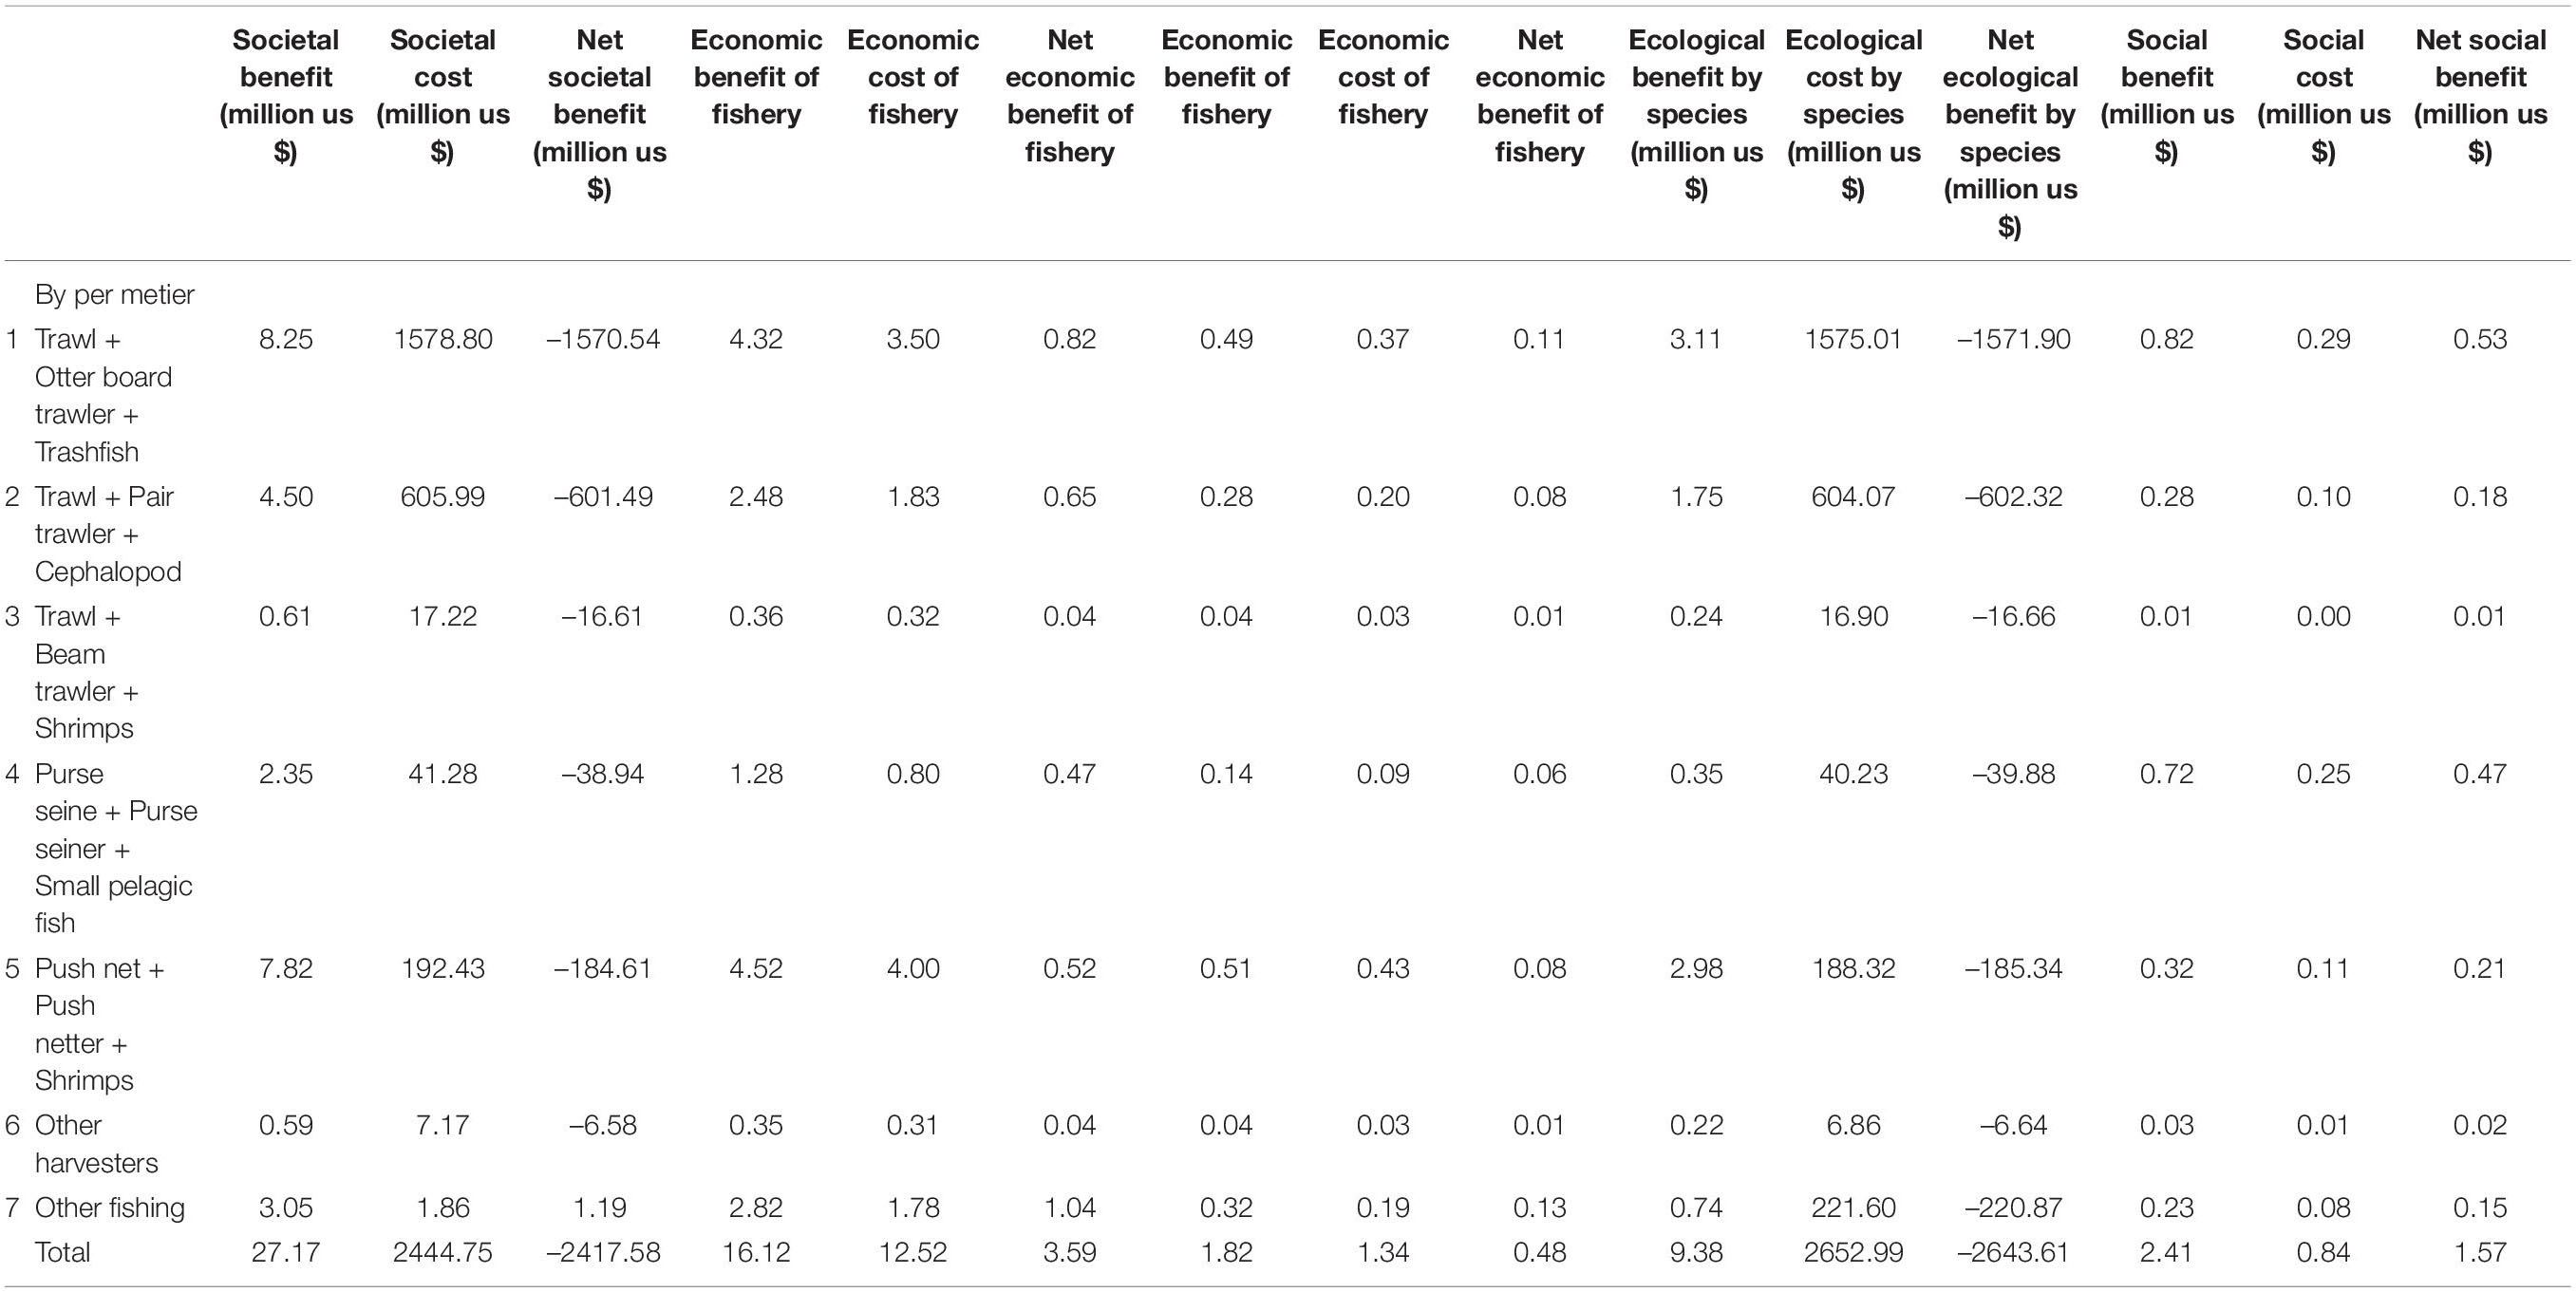
Table 6. Results on society-wide performance in 2015 (in million us $).
Table 6 presents societal costs and benefits with respect to metiers, fisheries and social categories. It shows huge losses with net societal benefits due to huge losses with net ecological benefits. At meantime, both net economic and social benefits show noticeably gains. It is clear from the results that at current stage fisheries in Thailand can result in considerable loss of net social benefits, therefore the fisheries need to be managed under strict controls. Results can be expressed per ton of fish caught. The societal cost represents then the net positive or negative benefit for the society of catching, processing, and trading one ton of fish depending on the fishing technique (metier), processing and trade pathways. As such, it allows comparison between metiers, processing form and trade choice (for instance export versus domestic market).
Conclusion
Marine and coastal area are complex systems formed by the interaction among the local population, economy, environment and resources and there is an increasing tendency for recent studies in fisheries research to incorporate interdisciplinary methods in their approach. This paper proposes an integrated ecological-economics-social model for evaluating fishing activities and policies to improve fisheries management. The integrated model developed in this research could be applied in developing fishery regions in Africa, Asia and Caribbean. Data requirements include an aggregate macroeconomic SAM with the fisheries sector particularly identified, detailed microeconomic fisheries data, some social data, and detailed time-series biological data.
The economy wide value-added contribution of fisheries induced by fish harvesting, lies also in its effects on secondary activities such as fish processing, storage, marketing and the indirect impact upon non-fisheries sectors. This study would be helpful particularly for developing coastal regions to assess their fisheries industry and make appropriate policy measures to reduce overexploitation of resources while maintaining a healthy economic balance. The comparison of the results among the regions would reveal the current stages of each region’s fisheries and policy simulations would provide insights into potential improvement in future practice.
Data Availability Statement
The original contributions presented in the study are included in the article/Supplementary Material, further inquiries can be directed to the corresponding author/s.
Author Contributions
PF: conceptualization, methodology, and manuscript writing. HP: conceptualization, methodology, and original manuscript writing. NA: review and editing. All authors contributed to the article and approved the submitted version.
Funding
The EU provided funding for this research through project PANDORA “Paradigm for Novel Dynamic Oceanic Resource Assessments” (Horizon 2020 Research and Innovation Programme under the grant agreement no. 773713) and ECOST “Ecosystems, Societies, Consilience, Precautionary principle: development of an assessment method of the societal cost for best fishing practices and efficient public policies” (Specific RTD programme “International Research in Co-operation” INCO-DEV).
Conflict of Interest
The authors declare that the research was conducted in the absence of any commercial or financial relationships that could be construed as a potential conflict of interest.
Publisher’s Note
All claims expressed in this article are solely those of the authors and do not necessarily represent those of their affiliated organizations, or those of the publisher, the editors and the reviewers. Any product that may be evaluated in this article, or claim that may be made by its manufacturer, is not guaranteed or endorsed by the publisher.
Supplementary Material
The Supplementary Material for this article can be found online at: https://www.frontiersin.org/articles/10.3389/fmars.2021.704371/full#supplementary-material
Supplementary Appendix 1 | Fishery producing costs (%).
Supplementary Appendix 2 | Fish production in value.
References
Beaumont, N. J., Austen, M. C., Atkins, J. P., Burdon, D., Degraer, S., Dentinho, T. P., et al. (2007). Identification, definition and quantification of goods and services provided by marine biodiversity: implications for the ecosystem approach. Mar. Pollut. Bull. 54, 253–265. doi: 10.1016/j.marpolbul.2006.12.003
Beaumont, N. J., Austen, M. C., Mangi, S. C., and Townsend, M. (2008). Economic valuation for the conservation of marine biodiversity. Mar. Pollut. Bull. 56, 386–396. doi: 10.1016/j.marpolbul.2007.11.013
Christensen, V., Steenbeek, J., and Failler, P. (2011). A combined ecosystem and value chain modeling approach for evaluating societal cost and benefit of fishing. Ecol. Modell. 222, 857–864. doi: 10.1016/j.ecolmodel.2010.09.030
Constanza, R., D’Arge, R., de Groot, R., Farber, S., Grasso, M., Hannon, B., et al. (1997). The value of the world’s ecosystem services and natural capital. Nature 387, 253–260. doi: 10.1038/387253a0
D’Andrea, L., Parisi, A., Fiorentino, F., and Garofalo, G. (2020). smartR: an r package for spatial modelling of fisheries and scenario simulation of management strategies. Methods Ecol. Evol. 11, 859–868. doi: 10.1111/2041-210X.13394
Dixon, P., and Rimmer, M. T. (2016). Johansen’s legacy to CGE modelling: originator and guiding light for 50 years. J. Policy Model. 38, 421–435. doi: 10.1016/j.jpolmod.2016.02.009
Duan, L., Li, S., Liu, Y., Jiang, T., and Failler, P. (2009). A trophic model of the Pearl River delta coastal ecosystem. Ocean Coast. Manage. 52, 359–367. doi: 10.1016/j.ocecoaman.2009.04.005
Eggert, H., Anderson, C. M., Anderson, J. L., and Garlock, T. M. (2021). Assessing global fisheries using fisheries performance indicators: introduction to special section. Mar. Policy 125:104253. doi: 10.1016/j.marpol.2020.104253
Failler, P., and Des Clers, S. (2002). “Perspectives d’extension économique et sociale du modèle ECOPATH,” in La Recherche Halieutique et le Développement Durable des Ressources Naturelles Marines en Afrique de l’Ouest, Quels Enjeux ?, Initiative de Recherche Halieutique ACP/UE, Rapport Recherche Halieutique ACP/UE, n° 11, EUR20188, eds P. Failler, A. Doumbouya, M. Bâa, and N. Lecrivain (Brussels: Office des publications officielles des Communautés européennes), 133–143.
Failler, P., and Pan, H. (2007). Global value, full value and societal costs; capturing the true cost of destroying marine ecosystems. Soc. Inf. J. 46, 109–134. doi: 10.1177/0539018407073660
Failler, P., Collet, S., and Sall, A. (2009). “Human–Marine nature interactions: what kind of valuing? towards an integrative modelling approach, chapter ten,” in New Trends in Human Ecology, eds P. F. L. MacCord and A. Begossi (Newcastle upon Tyne: Cambridge Scholars Publishing), 222–245.
Failler, P., Pan, H., Thorpe, A., and Tokrisna, R. (2014). On macroeconomic impact of fishing effort. Nat. Resour. 5, 269–281. doi: 10.4236/nr.2014.57025
Fay, G., DePiper, G., Steinback, S., and Gamble, R. J. (2019). Economic and ecosystem effects of fishing on the Northeast US shelf. Front. Mar. Sci. 6:133. doi: 10.3389/fmars.2019.00133
Fulton, E. A., Boschetti, F., Sporcic, M., Jones, T., Little, L. R., Dambacher, J. M., et al. (2015). A multi-model approach to engaging stakeholder and modellers in complex environmental problems. Environ. Sci. Policy 48, 44–56. doi: 10.1016/j.envsci.2014.12.006
Fulton, E. A., Smith, A. D., Smith, D. C., and Johnson, P. (2014). An integrated approach is needed for ecosystem based fisheries management: insights from ecosystem-level management strategy evaluation. PLoS One 9:e84242. doi: 10.1371/journal.pone.0084242
Hilborn, R., and Walters, C. J. (1992). Quantitative Fisheries Stock Assessment, 1 Edn. Boston, MA: Springer US. doi: 10.1007/978-1-4615-3598-0
Hoagland, P., Jin, D., and Dalton, T. M. (2003). Linking economic and ecological models for marine ecosystems. Ecol. Econ. 46, 367–385. doi: 10.1016/j.ecolecon.2003.06.001
Kaplan, I. C., and Leonard, J. (2012). From Krill to convenience stores: forecasting the economic and ecological effects of fisheries management on the US West Coast. Mar. Policy 36, 947–954. doi: 10.1016/j.marpol.2012.02.005
Kompas, T., Che, T. N., and Grafton, R. Q. (2004). Technical efficiency effects of input controls: evidence from Australia’s banana prawn fishery. Appl. Econ. 36, 1631–1641. doi: 10.1080/0003684042000218561
Latour, R. J., Brush, M. J., and Bonzek, C. F. (2003). Toward ecosystem-based fisheries management. Fisheries 28, 10–22. doi: 10.1577/1548-8446(2003)28[10:TEFM]2.0.CO;2
Little, R., Punt, A. E., Mapstone, B. D., Begg, G. A., Goldman, B., and Williams, A. J. (2009). An agent-based model for simulating trading of multi-species fisheries quota. Ecol. Modell. 220, 3404–3412. doi: 10.1016/j.ecolmodel.2009.08.004
Pilling, G. M., Apostolaki, P., Failler, P., Floros, C., Large, P. A., Morales-Nin, B., et al. (2008). “Assessment and management of data-poor fisheries,” in Fisheries Science, 50 Years After Beverton and Holt, ed. A. Payne (Hoboken, NJ: Wiley-Blackwell), 280–306. doi: 10.1002/9781444302653.ch12
Ruiz, J., Rincon, M. M., Castilla, D., and Ramos, F. (2017). Biological and economic vulnerabilities of fixed TACs in small pelagics: an analysis of the European anchovy (Engraulis encrasicolus) in the Gulf ofCádiz. Marine Policy 78, 171–180. doi: 10.1016/j.marpol.2017.01.022
Rybicki, S., Hamon, K. G., Simons, S., and Temming, A. (2020). To fish or not to fish – economic perspectives of the pelagic northeast Atlantic mackerel and herring fishery. Front. Mar. Sci. 7:625. doi: 10.3389/fmars.2020.00625
Seeteram, N., Bhat, M. G., Pierce, B., Cavasos, K., and Die, D. J. (2019). Reconciling economic impacts and stakeholder perception: a management challenge in Florida Gulf Coast fisheries. Mar. Policy 108:103628. doi: 10.1016/j.marpol.2019.103628
Seung, C. K., Kim, D. H., Yi, J. H., and Song, S. H. (2021). Accounting for price responses in economic evaluation of climate impacts for a fishery. Ecol. Econ. 181:106913. doi: 10.1016/j.ecolecon.2020.106913
Steinback, S. R., Allen, R. B., and Thunber, E. (2008). The benefits of rationalization: the case of the American lobster fishery. Mar. Resour. Econ. 23, 37–63. doi: 10.1086/mre.23.1.42629601
Wang, Y., Hu, J., Pan, H., and Failler, P. (2020). Ecosystem-based fisheries management in the Pearl River Delta: applying a computable general equilibrium model. Mar. Policy 112:103784. doi: 10.1016/j.marpol.2019.103784
Wang, Y., Hu, J., Pan, H., Li, S., and Failler, P. (2016). An integrated model for marine fishery management in the Pearl River Estuary: linking socio-economic systems and ecosystems. Mar. Policy 64, 135–147. doi: 10.1016/j.marpol.2015.11.014
Keywords: integrated modeling approach, fisheries management, fisheries economics, developing countries, societal cost model
Citation: Failler P, Pan H and Akbari N (2022) Integrated Social-Economic-Ecological Modeling for Fisheries: The ECOST Model. Front. Mar. Sci. 8:704371. doi: 10.3389/fmars.2021.704371
Received: 02 May 2021; Accepted: 30 December 2021;
Published: 16 March 2022.
Edited by:
Yngvar Olsen, Norwegian University of Science and Technology, NorwayReviewed by:
Md Wahab, WorldFish, BangladeshTommaso Russo, Tor Vergata University of Rome, Italy
Elizabeth A. Fulton, Commonwealth Scientific and Industrial Research Organisation (CSIRO), Australia
Copyright © 2022 Failler, Pan and Akbari. This is an open-access article distributed under the terms of the Creative Commons Attribution License (CC BY). The use, distribution or reproduction in other forums is permitted, provided the original author(s) and the copyright owner(s) are credited and that the original publication in this journal is cited, in accordance with accepted academic practice. No use, distribution or reproduction is permitted which does not comply with these terms.
*Correspondence: Pierre Failler, UGllcnJlLmZhaWxsZXJAcG9ydC5hYy51aw==
†These authors share first authorship