Coastal Adaptation and Uncertainties: The Need of Ethics for a Shared Coastal Future
 Agustín Sánchez-Arcilla1,2*
  Vicente Gracia1,2
  César Mösso1,2
  Iván Cáceres1
  Daniel González-Marco1,2 Jesús Gómez1
- 1Laboratori d’Enginyeria Marítima (LIM/UPC), BarcelonaTech (UPC), Universitat Politècnica de Catalunya, Barcelona, Spain
- 2Centre Internacional Investigació Recursos Costaners (CIIRC), Barcelona, Spain
Coastal hydro-morphodynamics present significant uncertainties, one order of magnitude larger for sediment transport than for the driving hydrodynamics. Met-ocean factors (waves, currents, and levels essentially) are normally selected from a probability distribution, where only the central trend is considered, and then the analysis of hydro-morphodynamic processes is carried out within a deterministic framework. This analysis is often based on a non-updated topo-bathymetry, with implicit error intervals for many variables, which results in uncertainties that, unless presented from an ethical perspective, tend to hinder proactive decision making and thus result in growing coastal degradation. To address this challenge, the article starts with the uncertainty in water/sediment fluxes and resulting morphodynamic impacts under average and storm conditions, proving the need to include explicit error levels in the analysis and subsequent assessments. The article develops this approach for field and lab data, considering how they are extrapolated to estimate key variables in coastal sustainability and engineering decisions, illustrated in terms of the longshore sand transport. Such a key variable estimation presents large uncertainties and thus requires a stricter ethical approach for extreme events, which serves to illustrate the transmission of uncertainties. The article concludes with a short overview of the implications that these uncertainties may have for coastal risk assessments and proactive decision making, discussing how large error levels without a suitable ethical assessment may result in socio-economic mistrust, which will limit the necessary optimism to address future coastal sustainability.
Introduction
Coastal conflicts, aggravated by increasing anthropogenic and climate change pressures, require an ethical assessment of coastal impacts that enable a delineation of coastal pathways, including reference and target states (Davos, 1998; Knowlton, 2021). Only from such a basis, with explicit and ethically estimated uncertainties, it is possible to develop adaptation pathways (Haasnoot et al., 2013) based on consensus aims, tipping points and the means to circumvent them. Such a development must involve scientists, stakeholders and users, within a motivated engagement where ethics and optimism define a fabric that supports a shared coastal sustainability drive. The present dystopian situation differs from such an idyllic landscape due to: (a) large and often implicit uncertainties that allow biased decisions, often against a sustainable coastal future; (b) corrupted analyses linked to limited ethics and diverging interests that lead to aggravated conflicts; (c) unmotivated stakeholder cooperation due to social inertia or contradictory expert opinions; (d) reactive compromises because of personal interests or perceived threats, which result in inefficient adaptation; and (e) lack of decision making, due to overwhelming uncertainties and pervasive pessimism that result in inactiveness.
All these hurdles, however, should not hinder the holistic transformation, including an ethical dimension, that is required for sustaining present coastal systems, hosting an inordinate proportion of population and a significant concentration of socio-economic assets (Neumann et al., 2015). The scientific world should support this transformation by: (a) bounding and making explicit the inherent uncertainties with larger data sets and improved knowledge; (b) increasing social and economic confidence on observational and numerical results, based on cross-disciplinary analysis impelled by balanced ethics; (c) proactive decisions linked to available forecast and projection products (e.g., Garcia Sotillo et al., 2020) that apply and share such anticipated information; and (d) cooperative commitment based on stakeholder optimism and trust on the co-designed interventions and criteria.
Following such rationale this article will start from an analysis of coastal adaptation pathways and the decisions required for a sustainable conservation (section “Coastal Adaptation Pathways: Decisions for a Sustainable Conservation”), followed by the probabilistic characterization of metocean drivers (section “Field Data and Statistical Processing: Uncertainty in Diagnosis”) to prove the importance of making the uncertainties explicit to build trust and promote fair decisions. The inevitable error intervals in lab/field data are examined next (section “Lab Data and Error Intervals: Morphodynamic and Engineering Consequences”), showing how they may condition coastal engineering calculations and interventions, illustrating the need for ethical approaches that avoid biased expert opinions that, in turn, may lead to a loss of socio-economic confidence on coastal interventions. After considering the difficulties in valuation and how that may result in fuzziness for impact and risk assessments (section “Coastal Risk Assessments: Hazard and Vulnerability Estimations”), the article ends with some discussion and recommendations (section “Shared Coastal Futures: Ethics and Optimism”) on the need for combined ethics and optimism as a basis for increasing stakeholder cooperation to sustain coastal systems.
Coastal Adaptation Pathways: Decisions for a Sustainable Conservation
Adaptation pathways (Armitage et al., 2008; Plummer, 2009; Haasnoot et al., 2013) consist in a structured set of interventions with deadlines and tipping points that, when applied to dynamic coastal systems, should make use of the windows of opportunity offered by socio-economic crises, storm events or accelerating climatic change. Such coastal pathways must consider the possible chronicity of these factors, introducing unbiased and dynamic tipping points that are ethically defined with their uncertainties to promote a cross sectoral cooperation that covers the entire polity. This sustained cooperation, based on objective knowledge and multifarious benefits across scales and social groups, should apply the wealth of data (in situ and remote) and knowledge now available (Sánchez-Arcilla et al., 2021) as well as the recent advances in lab and numerical tools (e.g., Kim et al., 2020) to steer adaptation pathways, co-developed by all relevant stakeholders. Such cooperation should contribute to overcome the lack of connectivity in present coastal systems, with barriers to biophysical fluxes, socio-economic activities and even perception by different actors, resulting in disconnected coastal realities (Nicolodi et al., 2021) that favor inactivity and ethical conflicts.
Building consensus for coastal adaptation, supported by ethically impregnated assessments, will facilitate the combination of short term “urgencies” with long-term planning, often related to climatic/anthropic pressures. Such combination will avoid disruptions in adaptation pathways associated to volatile and ephemeral interests, compounded by limited individual and collective ethics. These disruptions preclude stability for investments that ensure a legacy of the present coastal natural capital, compounded by the mismatch between natural dynamics and cultural speed, where slower benefits such as, for instance, from ecosystem services (Giakoumi et al., 2018), tend to be disregarded or despised. The new advances in data/models, permeated by an ethical dimension, should help to reconcile short-term views and benefits with the interest of future generations, facilitating the quest of new coastal paradigms, associated to a transformation of governance, finance and techniques that contribute to knit a social-ecological fabric that supports ethical decisions and optimistic engagement. By reconciling individual and collective interests within adaptation pathways it should be feasible to co-define tipping points and alarm criteria, favoring coastal sustainability and breaking the present trend toward degradation. An aggregation of cost-benefit utilitarian criteria with longer term benefits, less prone to monetary quantification, requires an ethical-based value system that underpins a transition in policy and governance to achieve sustainability within tipping points. This aggregation will overcome the purely quantitative assessment of cost-effectiveness that may obfuscate value conflicts, particularly at longer time scales, empowering scientists, decision-making authorities, and power elites to reach cooperative agreements rather than to impose an unfair balance from contentious negotiations to reach any “best” coastal status selected by the most powerful players.
The relationship between information and decision/power should be bounded by: (a) shared ethical values; (b) explicit uncertainties and error intervals; (c) clear distinction between true and false discourses. Such an approach requires a transformation on how information is generated, disseminated and even controlled, since that information shapes perceptions and the capacity to decide by diverse socio-economic groups. The application of an ethical approach to establish uncertainty levels and apply formulations to define a knowledge-based discourse is presented in next sections, illustrating how this approach can promote a balanced perception that combines hard facts with opinions, overcoming the present trend to overweight opinion with respect to facts. For interdisciplinary systems like coastal zones, the merging of social and ecological sciences should build upon knowledge-based ethics, to enable a transition from segmented management and rigid engineering to a holistic approach that links sustainability to social responsibility, particularly for the irreplaceable natural capital. By combining the rational and intuitive dimensions in coastal analyses, merging historic criteria with present big-data analysis (e.g., applied to regional high resolution forecasts or satellite data) it should be feasible to reach an informed consensus on what is best for coastal zones, avoiding futile contentious negotiations that seldom contribute to long term sustainability. Such a consensus must acknowledge that coastal sustainability is neither cheap nor immediate and affected by significant uncertainties, associated to the multiple scales that coexist in coastal processes and the wide fan of “partial” models for these processes (Thieler et al., 2000; Cooper and Pilkey, 2004, 2007; McLaughlin and Cooper, 2010). Such uncertainties tend to hinder stakeholder engagement (Dean et al., 2018; Dawson et al., 2020), limiting the capacity to tackle sustainability challenges, which are growing steadily by increasing anthropic (e.g., coastal population density) and climatic pressures (e.g., sea level rise) together with other emergent threats, in particular, those of anthropic origin. These threats must include less conspicuous pollutants (e.g., toxins, microplastics, viruses…), often forgotten interactions (e.g., with submerged aquifer, seabed contaminated sediments…) and the synergies between anthropic and climatic pressures (e.g., sea water temperature increases that increases the impact of high nutrient levels) (De los Santos et al., 2019).
Coastal adaptation pathways under climate change, illustrated in Figure 1 for a typical Mediterranean coastal stretch, will become more sustainable when building upon the natural capacity of coastal systems to repair themselves (Sánchez-Arcilla et al., 2016), introducing jump-start interventions to enhance recovery if getting dangerously close to tipping points. These interventions should address the problem root (e.g., sediment starvation, and coastal rigidization, etc.) to transform degraded coastal areas into high quality habitats (Possingham et al., 2015), and here ethical criteria must be applied when estimating the always hard to quantify natural resilience capacity. Ethical criteria suggest the need, as illustrated by the examples presented in following sections, of new coastal approaches that bound uncertainty in drivers/responses and that associate predictions and valuations with explicit error intervals. Only from bounded uncertainty, underpinned by an ethical assessment, it will be possible to generate proactive decisions for tough coastal challenges that affect long term values. And these proactive decisions are key to anticipate climatic impacts, but require a baseline of optimism to launch mid to long term plans and investments, especially in situations of economic crises where present needs may underestimate the importance of longer term assets. A typical example is that of coastal protected spaces, following the road of marine protected areas and national parks on land, which provide mid to long term benefits, such as biodiversity, that are not easy to monetise but which are essential to achieve healthy and resilient coasts. Such coastal protected areas will provide room for coastal dynamics and habitats for coastal ecosystems, helping to reconnect the natural coastal capital (represented by its biodiversity and ecosystem services) with littoral socio-economic assets, key for the welfare of coastal populations.
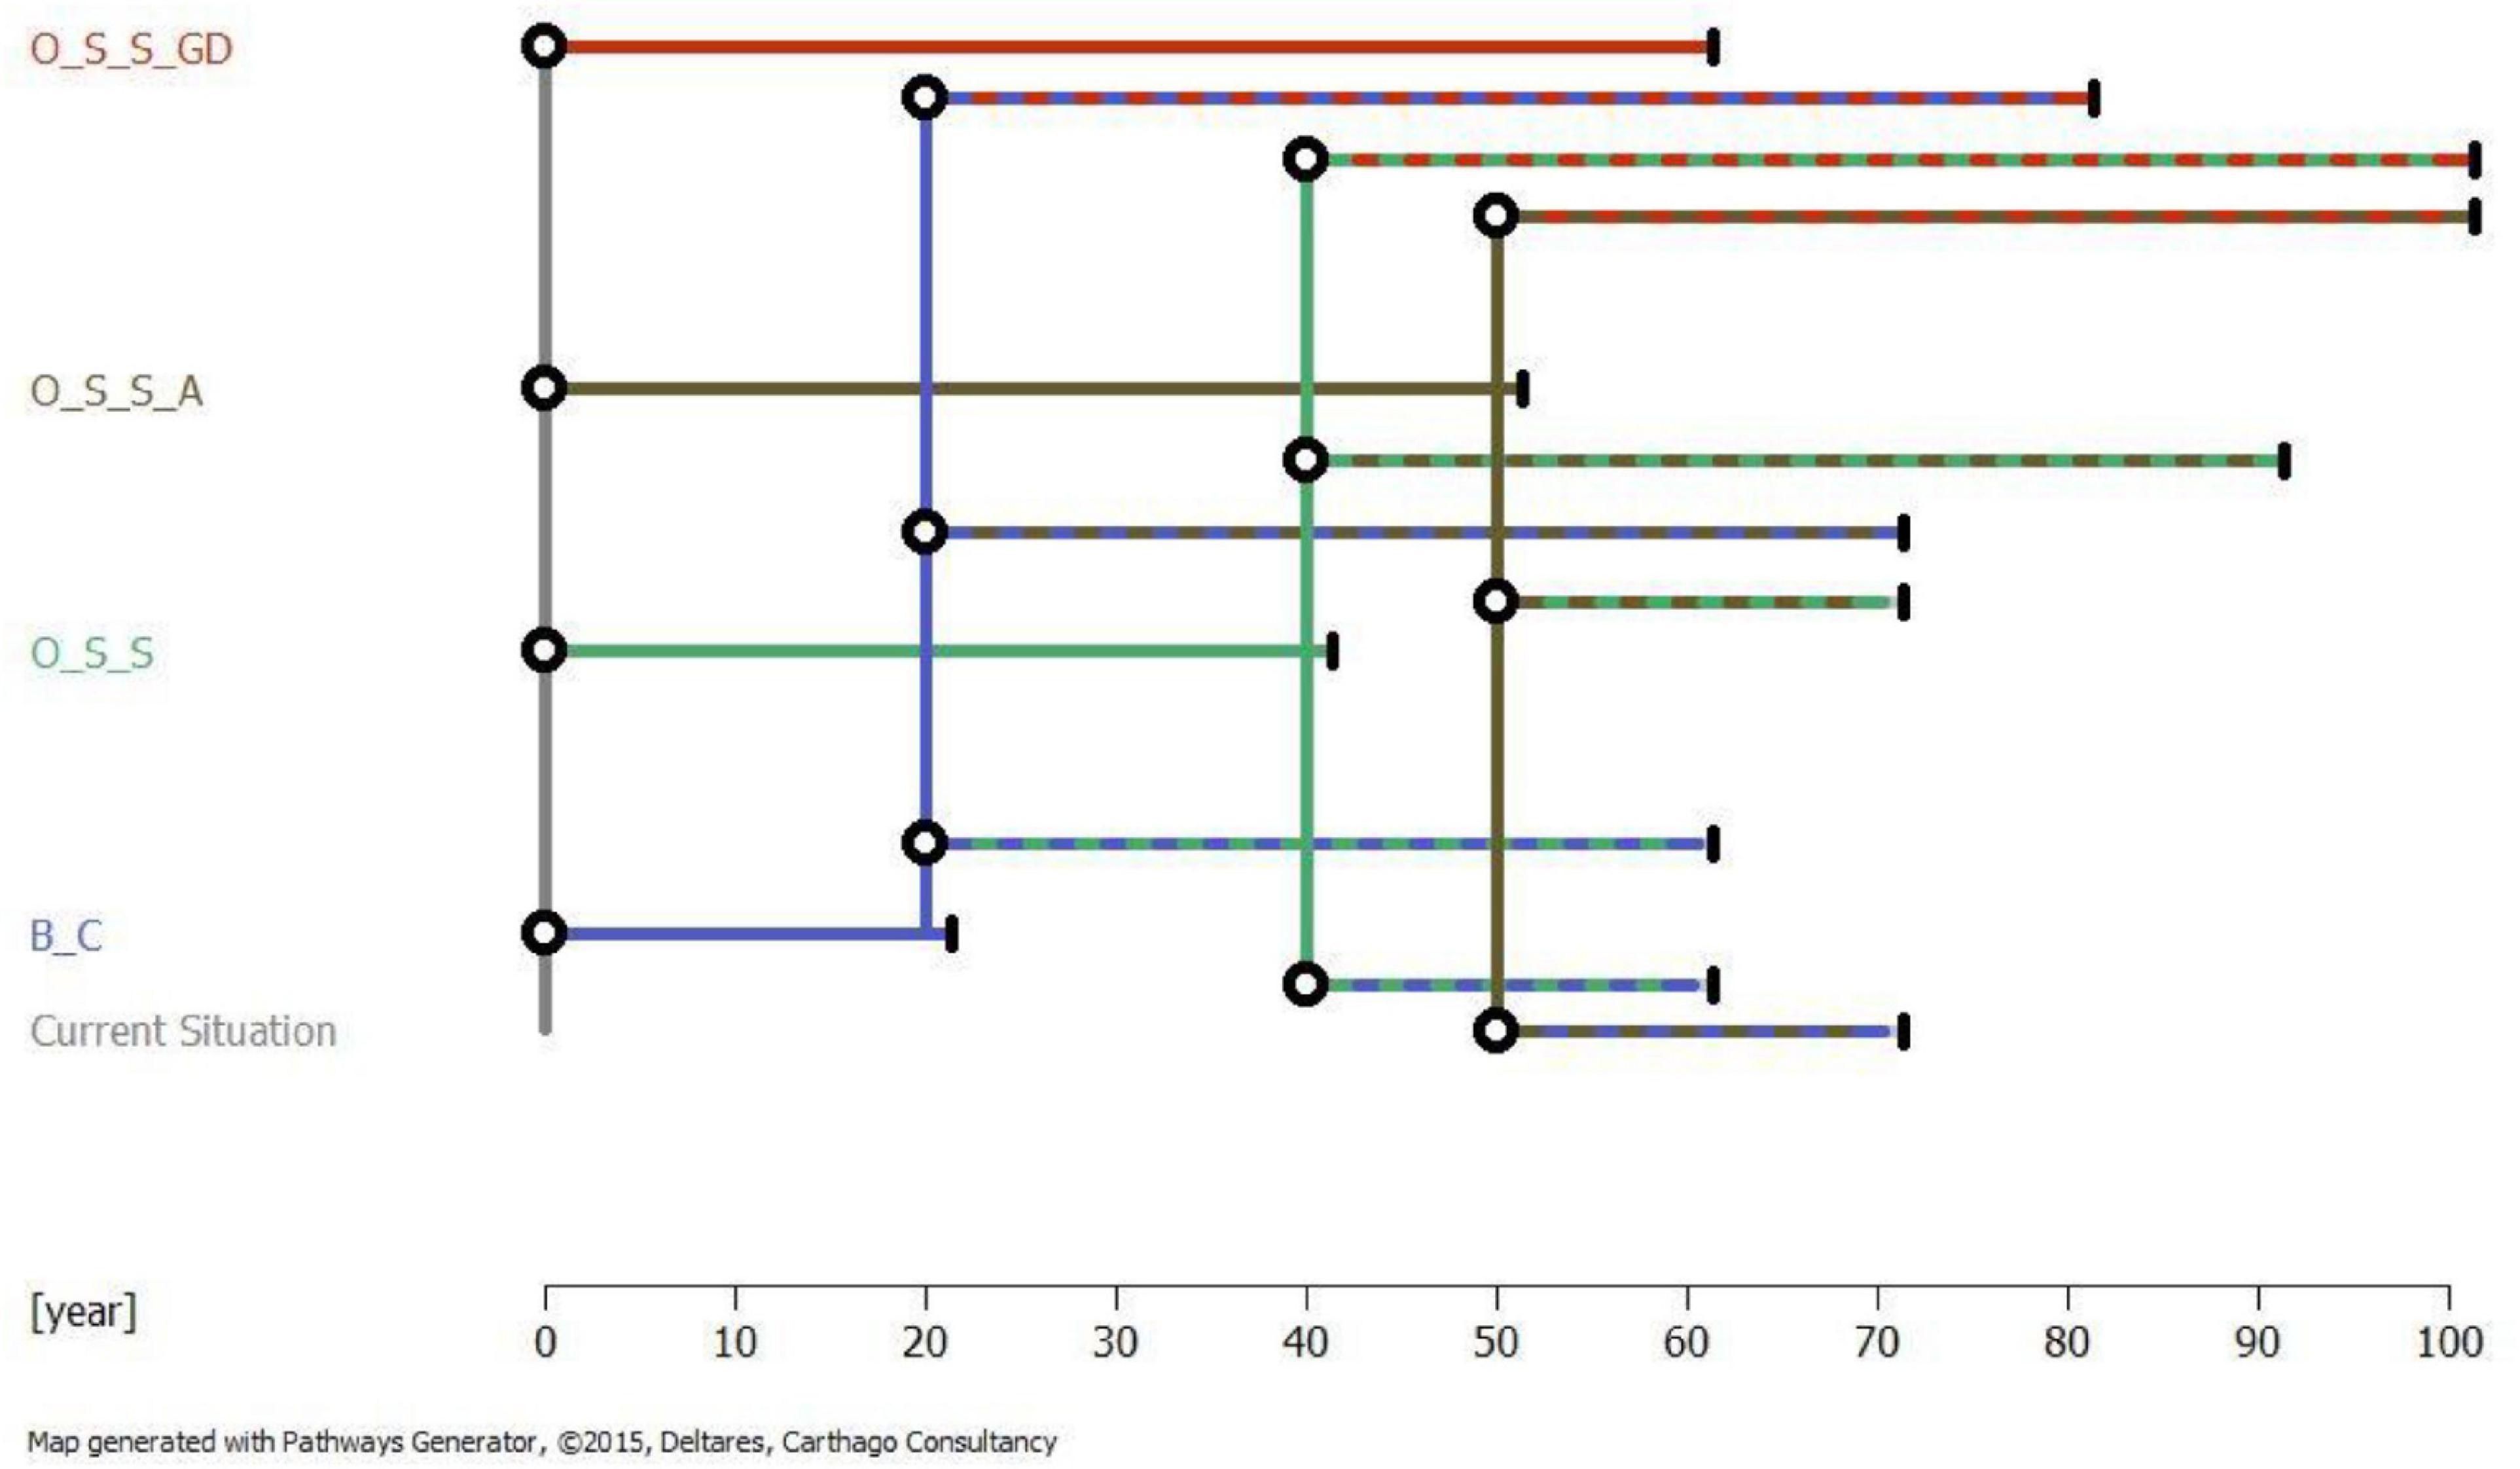
Figure 1. Illustration of coastal adaptation pathways for a Mediterranean barrier beach subject to subsidence, because it is located in a deltaic system, and erosion due to longshore transport gradients in the sea (outer) side. This barrier beach has a limited natural sediment supply and experiences rotation due to frequent overwash and breaking processes, making the delineation of adaptation pathways extremely dynamic and complex. The selected pathways are: (B_C) Maintaining Breaching and Connectivity with a tipping point 20 years from now for an intermediate scenario, between RCP 2.6 and RCP 8.5; (O_S_S) Occasional Sand Supply for an intermediate scenario, with a tipping point 40 years from now; (O_S_S_A) Occasional Sand Supply and Sand Groins for the same intermediate scenario and with a tipping point 50 years from now; (O_S_S_GD) Occasional Sand Supply with Geo-Diversity for the same intermediate scenario and a tipping point 50 years from now. The circles denote change of pathway, moving to another type of approach/interventions. The vertical lines denote tipping points.
To reduce uncertainty and promote uptake, coastal adaptation pathways should build on the best available scientific knowledge (e.g., Hilborn et al., 2020), supported by data and simulations that enable applying objective metrics to assess ecosystem services and coastal risk levels. These metrics can help steering the selection and deployment of coastal interventions, combining objective measures with subjective criteria that require an ethical framework to aggregate scales (e.g., storm scale with climatic or decadal variations) and define tipping points and the consensus “target” coastal status. The sequenced set of interventions contained in adaptation pathways should be implemented in spite of underlying uncertainties, distinguishing between success and failure based on consensus, predictions, and past experience. A proactive approach, based on ethical assessments, will result in enhanced resilience when compared to do-nothing options, enabling an explicit balance between tradeoffs (e.g., benefits for some coastal areas at the expense of other more degraded stretches) and the inclusion of long term sustainability aims (e.g., coastal legacy for next generations). Such a proactive approach can only be achieved from an ethical basis and a state of “essential” optimism, which should be supported by an informed comparison of where our coast would be if nothing had been done. The balance between positive and negative messages should be, therefore, carefully considered because negative information (e.g., Ledgerwood and Boydstun, 2014), compounded by uncertainty may preclude action and lead coastal zones to a status of irreversible degradation (Figure 2). The trend toward degradation, simply illustrated in the figure by “available” beach width as a measure of the protection, leisure and ecological functions the beach, can be alleviated by proactive decisions that apply Nature Based Solutions (NBS). Such a negative beach trend, however, will continue under reactive decisions, at different rates depending on the type of interventions: Business as Usual (BAU) is normally associated to small scale interventions, less effective than conventional engineering. These latter interventions may produce important oscillations in the beach response due to their limited synergy with natural coastal dynamics.
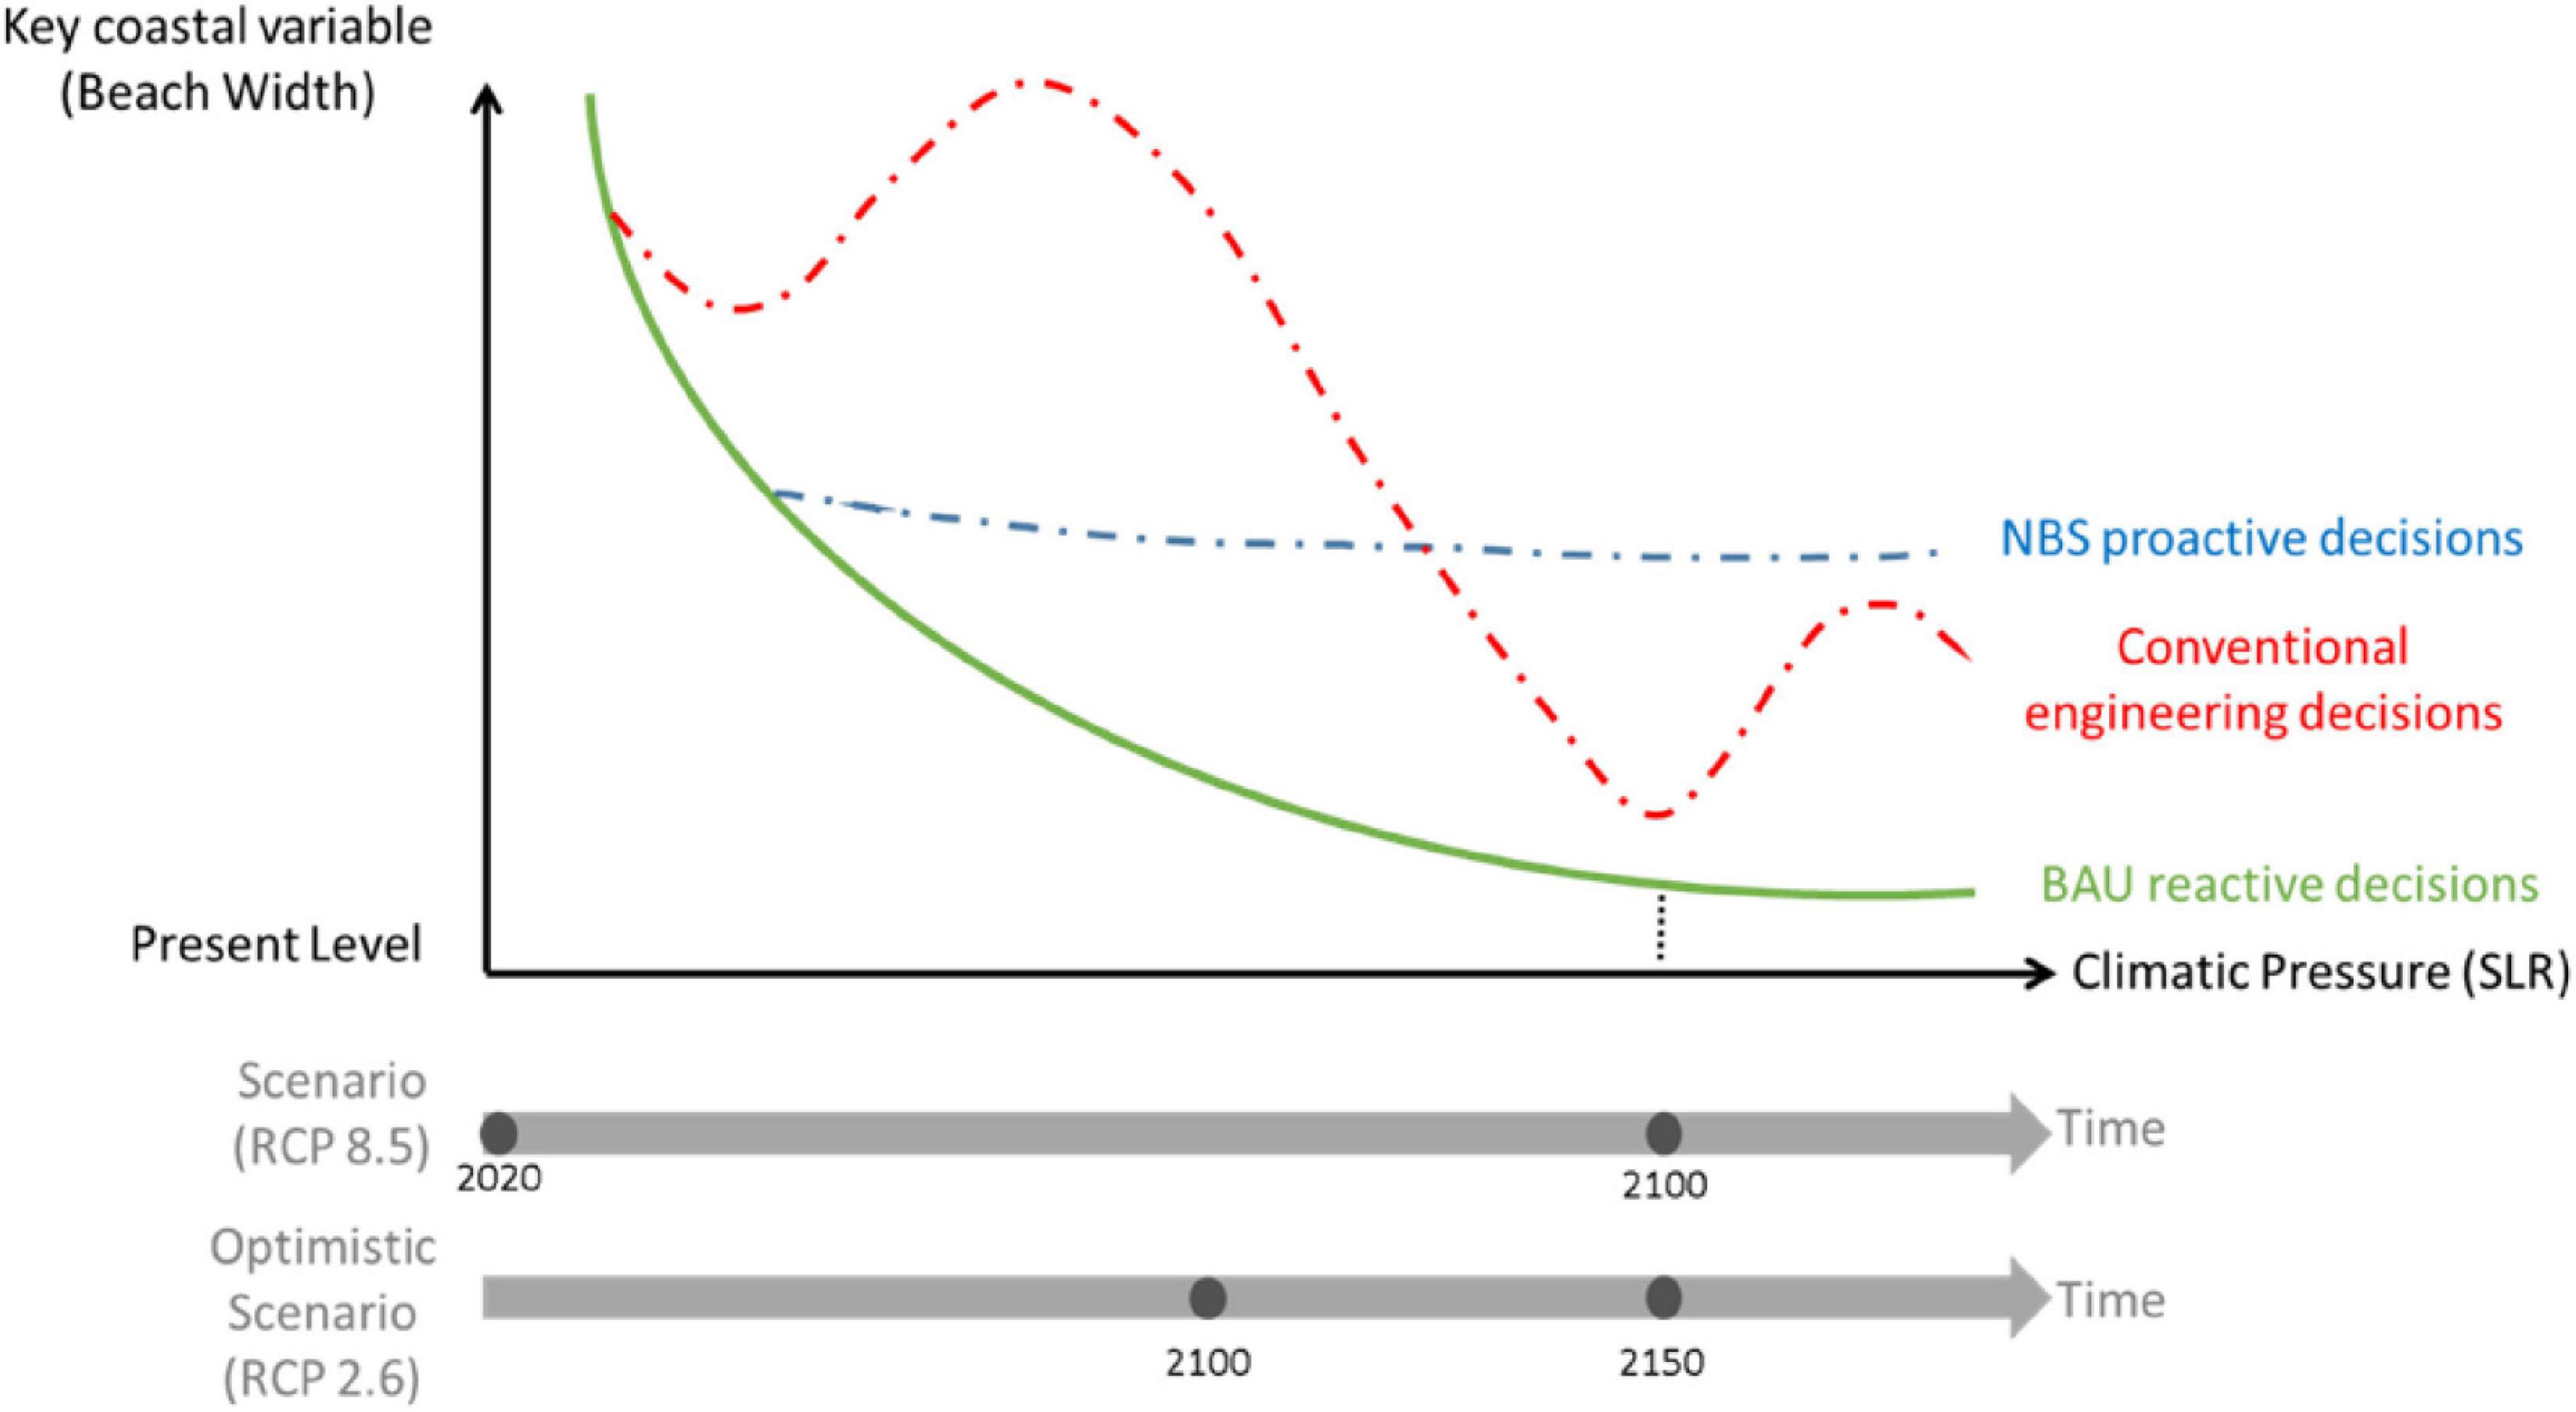
Figure 2. Schematization of coastal trajectories against time and sea level rise (SLR), defined by some key variable (beach width in this case) and illustrating the effect of proactive versus reactive decisions. Beach width is a key variable to assess the three main functions of a beach: Protection, where the capacity to dissipate incoming wave energy depends critically on width; Economic support, where the emerged beach area is proportional to tourism and directly related socio-economic activities; and Ecological support, also depending on the width/height of the beach. The various types of possible interventions considered for the trajectories are: Business as usual, BAU reactive decisions (green line); Conventional engineering decisions, in a mixed reactive/proactive approach (red line); Nature Based Solutions, NBS, proactive decisions (blue line).
Coastal systems feature a multifarious set of natural and socio-economic assets that are at risk under present meteo-oceanographic conditions and will be increasingly threatened by climate change. Coastal natural capital stock (ecosystem structure and processes) and its evolution under climatic/anthropic stressors will be modulated by initial characteristics and the level of acting pressures (Potts et al., 2014), which together determine coastal trajectories (Figure 2) and impacts, that should be evaluated from an ethical basis to aggregate hard to quantify assets that require specific combinations of monetary and non-monetary metrics. The ethical dimension should build upon explicit error intervals and a consensus balance among diverging interests or a complete monetization of ecosystem services, aggregating short term values (e.g., from a severe storm impact) with long-term criteria (e.g., maintenance of coastal defenses or biodiversity status). Only from an ethical perspective it will become credible to carry out a scale-dependent evaluation, comparing short to long term dynamics or small scale benefits versus larger scale interventions, better suited to the full development of ecosystem services. Such a balanced approach, within an ethical framework and with co-designed criteria, is the only meaningful way to assess costs/impacts for traditional versus nature-based interventions, recognizing that natural solutions may present some short term apparent losses (e.g., breaching existing defenses) but can provide mid to long term benefits impossible to achieve by conventional engineering (e.g., decarbonizing coastal protection). These multi-scale (in time and space) assessments should balance ethics with available knowledge and uncertainty levels (e.g., Helton-Fauth et al., 2003), considering their effect on engagement/perception and promoting shared benefits that are transferred to next generations. Such intergenerational and cross-sectoral transfer of benefits suppose an ethical “contract” that can be breached (Mumford et al., 2007) by excessive competition or deficiently designed coastal interventions, usually linked to an overvaluation of short term benefits or bias toward specific interests. The ethical approach will foster a transition from self-interest and company profit to common interest and social responsibility, avoiding an overconsumption of natural resources (e.g., coastal squeezing) that is likely to get aggravated under future conditions. Such aggravation will favor more frequent breaches of the ethical “contract,” that should be explicitly incorporated into coastal science and technologies to reconcile natural capital with socio-economic assets and to introduce long-term values in present coastal decisions. By building an ethical contract among generations and power actors, it will be possible to jointly promote coastal sustainability and avoid the common maladaptation practices now observed, introducing uncertainty in data/models and limits of evaluations/simulations to enhance the shared responsibility for sustaining our coastal system.
Field Data and Statistical Processing: Uncertainty in Diagnosis
Coastal analyses, necessary for adaptation decisions and for the design/selection of interventions, require field data to characterize drivers and responses. This characterization should have enough coverage in time/space to enable a robust assessment at the scales considered in the analysis, which may go from a storm event (scale of days) to climatic impacts (scale of decades). The most apparent impacts occur under impulsive storms, particularly extreme ones that find coastal systems out of equilibrium with incoming waves. Here, the scarcity of data introduces larger uncertainties which, unless handled with advanced statistical tools and an ethical basis, may lead to contradictory expert opinion on the storm features. This can be illustrated by the storm Gloria (Pérez et al., 2021) that impacted Western Mediterranean coasts in January 2020 and which some experts characterized as exceptional, while others postulated more balanced opinions, leading to contradictory interpretations, lack of socio-economic confidence on technical assessments and suggestions of poor ethics. Storm Gloria produced the highest ever recorded significant wave height in the Spanish coast, reaching 8.44 m in the deep-water Valencia buoy (Puertos del Estado network) on January 20th at 06 UTC (with an estimation of 13.5 m for the maximum wave height). The previous record for the significant wave height in the same buoy was 6.45 m and the maximum significant wave height previously recorded along Spanish coasts was 8.15 m, measured at the Mahón buoy in January 2003. Storm Gloria set a historical maximum individual wave height of 14.2 m recorded at Dragonera buoy (Balearic Islands) on January 20th at 02 UTC.
Storm Gloria can be analyzed in terms of an extreme wave height distribution, derived by best fitting of an extreme function to the XIOM (Bolaños et al., 2009) data series, providing one of the longest wave data sets along the Spanish Mediterranean coast, that cover the period 1990–2012 with 17.5 effective years of data. The extreme wave height distribution function has been obtained with a peak over threshold (e.g., Sánchez-Arcilla et al., 2008a) method (POT), where the temporal limits and adjustment parameters have been selected from a sensitivity assessment. The resulting distribution parameters, based only on “acceptable” data that comply with physical and statistical criteria as part of a strict quality control, depend on personal and technical criteria and illustrate a first decision level where ethics and knowledge are of paramount importance. Figure 3 shows the Weibull extreme distribution (Gumbel and Frechet functions were empirically discarded) based on a least squares fit and a range of formulas to estimate relative frequencies, having selected the Goda’s expression (Goda, 2010) for the plotting-position because it provided a slightly better fit. In Figure 3 the black (solid) line represents the median value, whose 90% confidence limits are depicted by dashed black lines. Horizontal lines in this figure indicate a selection of the highest recorded significant wave height in the area during the period covered by data, where the red line shows the maximum value reached in January 2020 (storm Gloria) at the closer available wave buoy (Tarragona buoy from Puertos del Estado). From this figure it could be argued that the peak of storm Gloria is an exceptional event, higher than other recorded maxima as shown in the plot and coincident with the distribution asymptote, which may indicate storm Gloria belongs to a different population that would be related to a zonal change of wave climate (probabilistic distributions of the main wave parameters such as significant wave height, peak period and average directions), probably associated to an effective global change. Such exceptional character is underpinned by the storm energetic content, which was 417 MWh/m (Megawatts per hour per linear meter of coastline), clearly exceeding previous events, and characterized by an average (since 2004) of 35 MWh/m, which is an order of magnitude smaller.
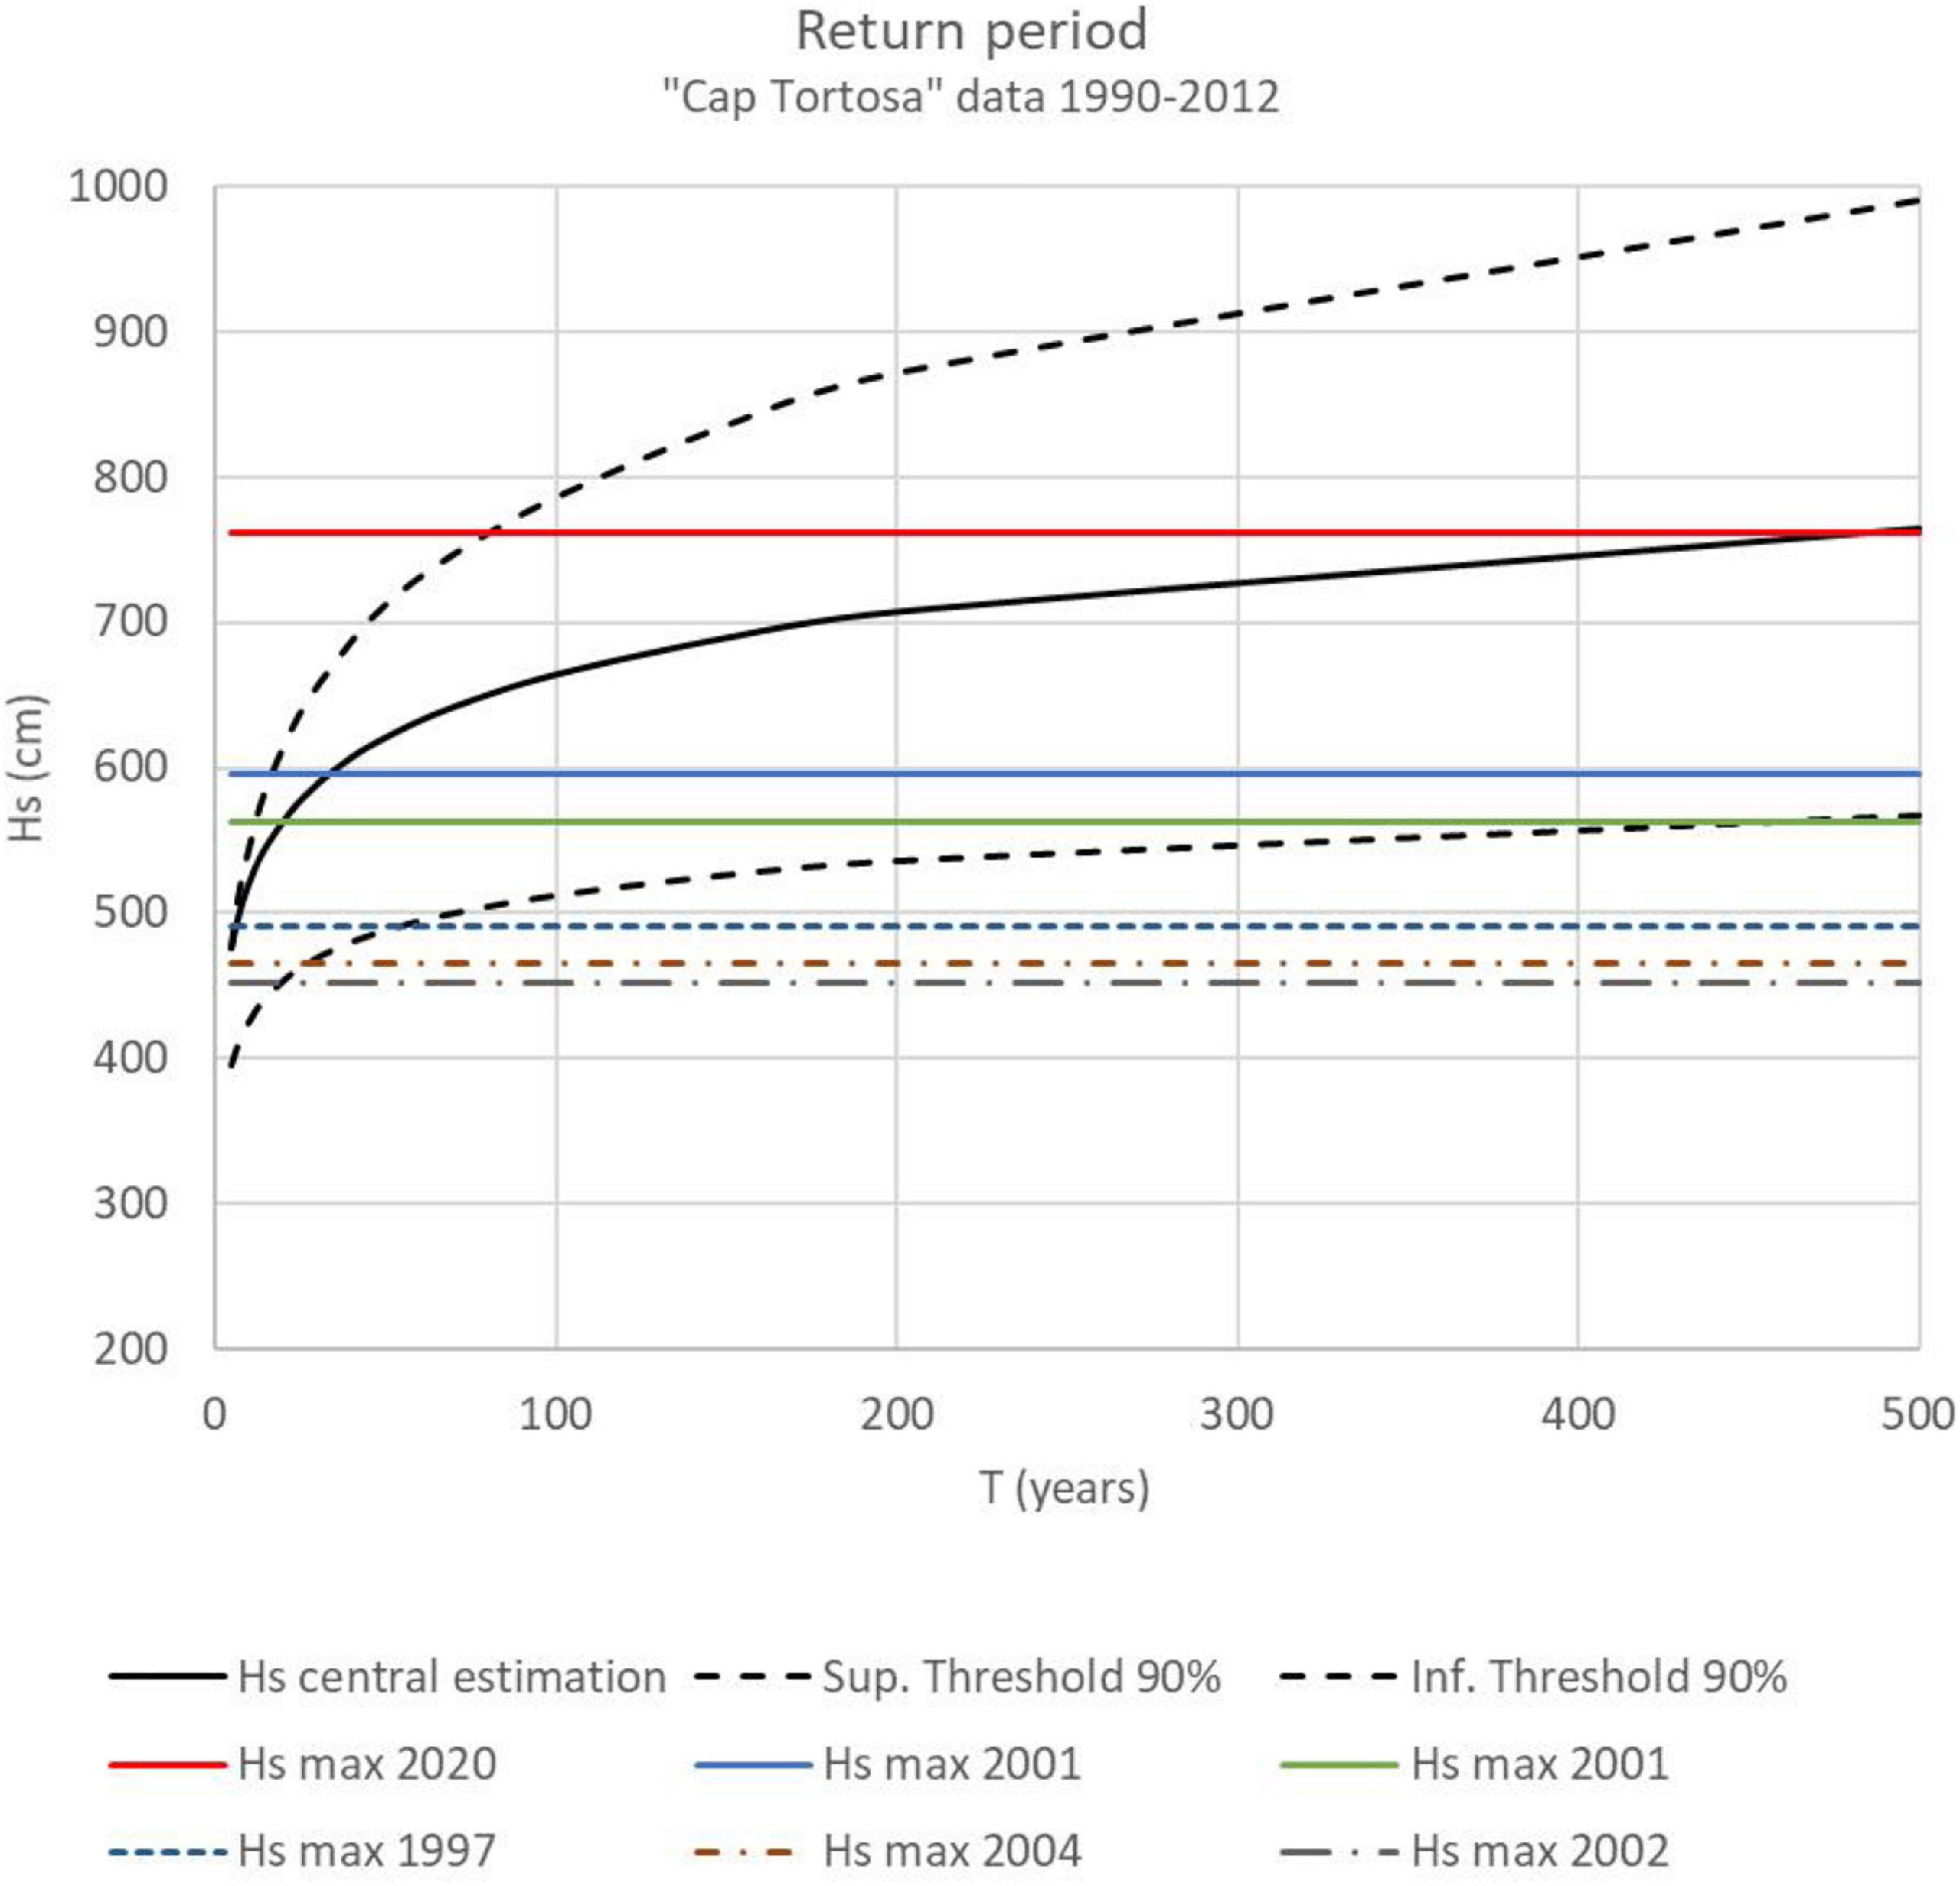
Figure 3. Weibull extreme distribution function plotting significant wave height against return period. The data set corresponds to the period 1990–2012 recorded by the XIOM wave buoy station in front of the Ebro delta, at a depth of 60m and which was dismounted in 2012. Fit according to least squares and Goda’s formula for the relative frequencies, applying a threshold of 2.5 m to define wave storms for the extreme sample.
From the adjusted extreme function and confidence limits there is a 90% probability that wave conditions reached in January 2020 in front of the Tarragona province (Tarragona buoy) correspond to a return period longer than 80 years. This return period does not mean, as indicated by some experts (e.g. Lorente et al., 2021), that another 80 years will pass until the coast receives a similar storm but it must be acknowledged that the return period of the Gloria event is significantly larger than that of other recent storms that produced significant damages along this coast. The central (median) estimation of the storm peak significant wave height, corresponding to the red line in Figure 3 (significant wave height above 7.5 m in the Ebro delta coast and close to 8.5 m in the deep-water buoy off the Valencia coast), if applied for the design of coastal infrastructure, would give a return period of about 500 years, although the lower confidence interval is close to the asymptote, indicating a return period well in excess of 500 years. These results underpin the caution and ethics needed to estimate return periods from such extreme distributions, which should be preferentially used the other way round, that is introducing a return period in the horizontal axis and selecting a wave height in the vertical axis. In any case, the assessment should be carried out with indication of confidence intervals and the danger of estimates close to the asymptotes. Without these ethical constraints, the public opinion may be easily misled, as it actually happened in the aftermath of the storm. Another conclusion from the figure is the difficulty to determine the exceptionality of the event, even its return period, by applying only the central value of the extreme distribution function.
The peak Hs value during storm Gloria clearly exceeds previously recorded maxima, suggesting this storm can denote some change in climatic patterns and limitations in the available wave height time series, supported by the fact that the storm peak level is close to the asymptote of the extreme distribution function. This would mean a transition to a different storm population, resulting in underestimations when using distributions fitted to past events when applied to project future impacts. The apparent paradox, where the storm can be considered simultaneously as an event from the same population or as a representative of a new population affected by climate change, can be related to the implicit stationarity assumption associated with extreme value assessments. Ethics require making explicit the assumed stationarity or lack of, together with the various uncertainties stemming from those hypotheses, the limited size of extreme samples and the statistical techniques applied. Wave storm projections, considering these new energetic events as belonging to a different population, would lead to higher estimates, corresponding to more frequent and severe storms, as it has been observed in recent years (Lin-Ye et al., 2020; de Alfonso et al., 2021).
However, the Gloria storm is not so far away from other recent events recorded in this Western Mediterranean area and is still compatible with the assumption of a steady wave climate. An energy based analysis of all storms recorded by the Tarragona buoy, with 17.5 years of effective data, shows that Gloria represented a maximum in incoming wave energy, with 417 MWh/m, but not so different from other recent events such as the storm in January 2017 which reached 325 MWh/m, i.e., about 70% of the Gloria energetic content (Figure 4).
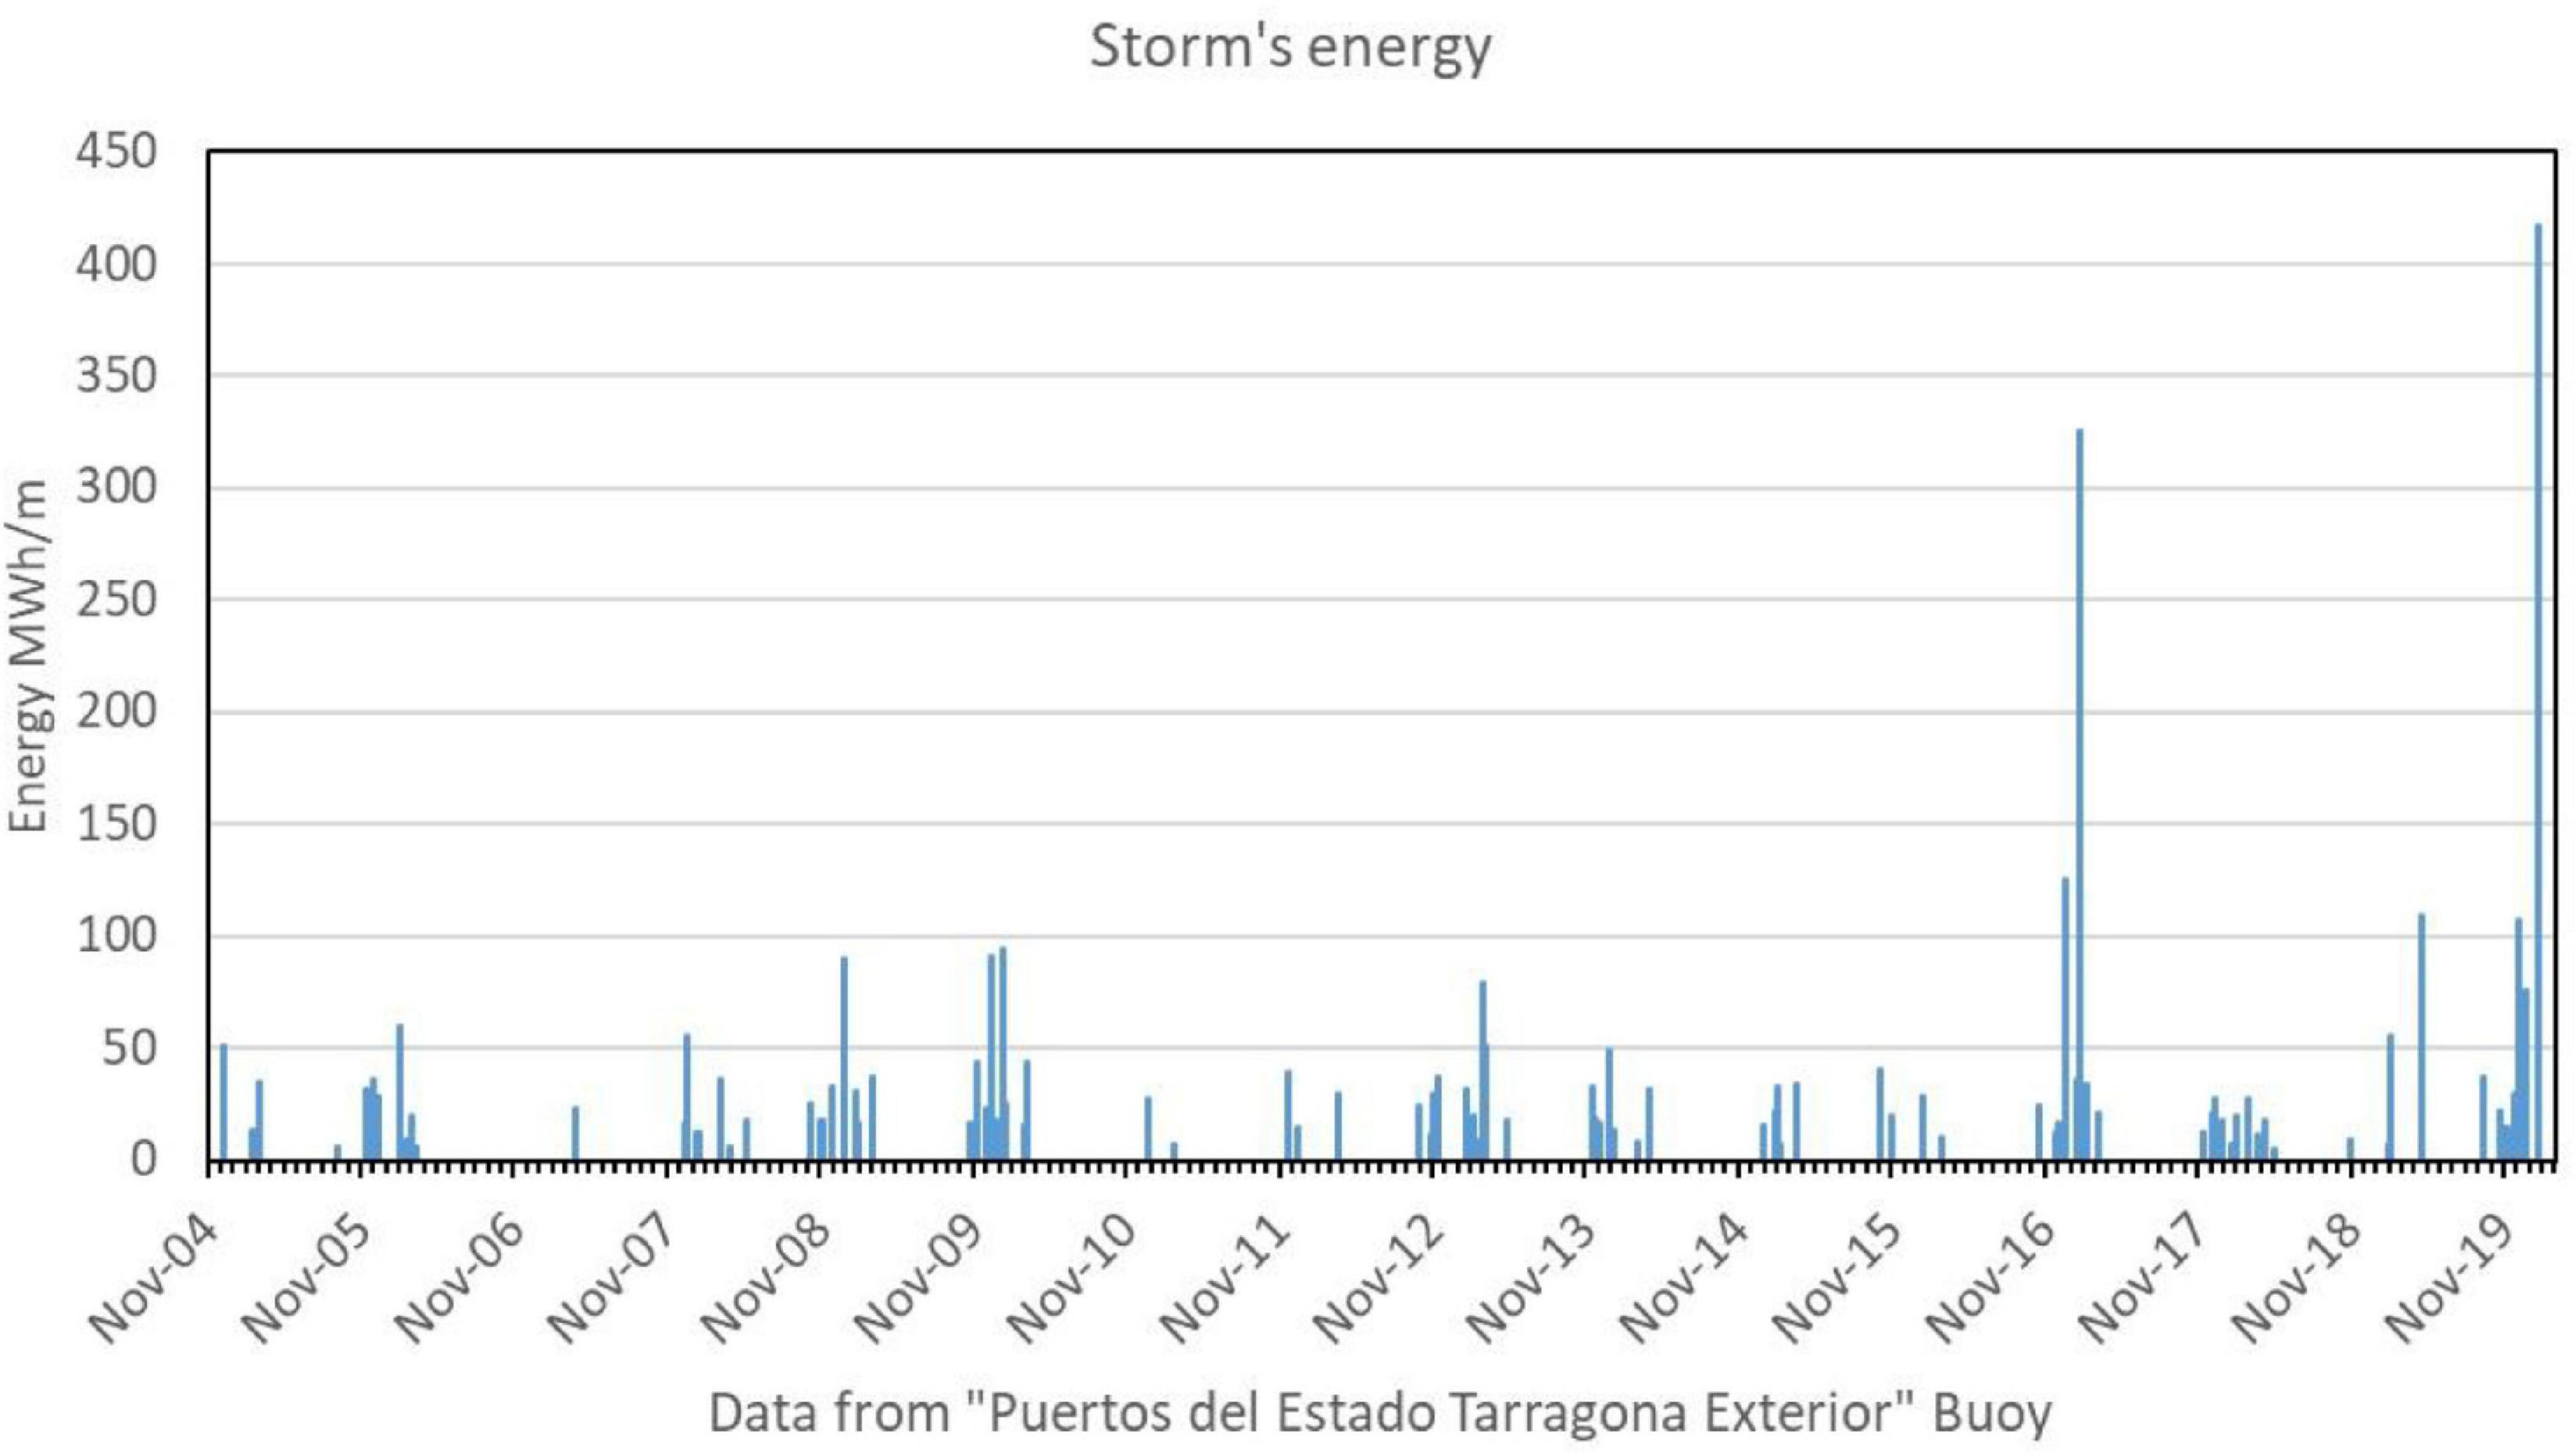
Figure 4. Time series of integrated wave storm energetic contents, where storm events are defined with respect to a 2.5 m threshold for the significant wave height. The plot corresponds to wave buoy recorded data at the Tarragona deep water buoy (depth of 688 m) and it shows the Gloria peak (January 2020) and the January 2017 peak, as very energetic events in the last 3 years.
In terms of energetic contents, Gloria storm had a duration of 4.25 days, being comparable to other events in the area, where there were recorded storm durations of 4.41 days in December 2016, 5.52 days in 2017 (longest), and 4.94 days in April 2019. The duration is, thus, not exceptional and the peak intensity (Figure 3) has a return period between 80 years and an indefinite value that cannot be estimated due to the small size of the extreme sample available. Based on the 90% confidence band it is therefore not possible to qualify this Gloria storm as exceptional and the event duration justifies this assessment. The return period for the central distribution line is still within the range of what can be considered an extreme event but without becoming an abnormal (outlier) value. By repeating the extreme analysis, sweeping thresholds between 2.2 and 2.7 m selected to characterize storm events in the Western Mediterranean area, it was decided to compare two main thresholds (Egozcue and Ortego, 2005; Sánchez-Arcilla et al., 2008b). The comparison of 2.7 m with the previously considered threshold of 2.5 m indicates different distributions depending on the selected levels. The best fit for the 2.7 m threshold case is provided by a Gumbel function, which is shown in Figure 5. By increasing the wave storm threshold from 2.5 m to 2.7 m the lower bound of the 90% confidence interval asymptotically tends to the peak of the Gloria storm, indicating that this event falls within the confidence band of the Gumbel extreme event distribution. This means that this storm, analyzed with the sample of extreme events defined with respect to the 2.7 m threshold, is therefore not an exceptional storm according to this distribution function. Such result illustrates the need to combine advanced statistical knowledge and an ethical perspective to assess the exceptionality of extreme events, with direct implications for insurance and engineering decisions.
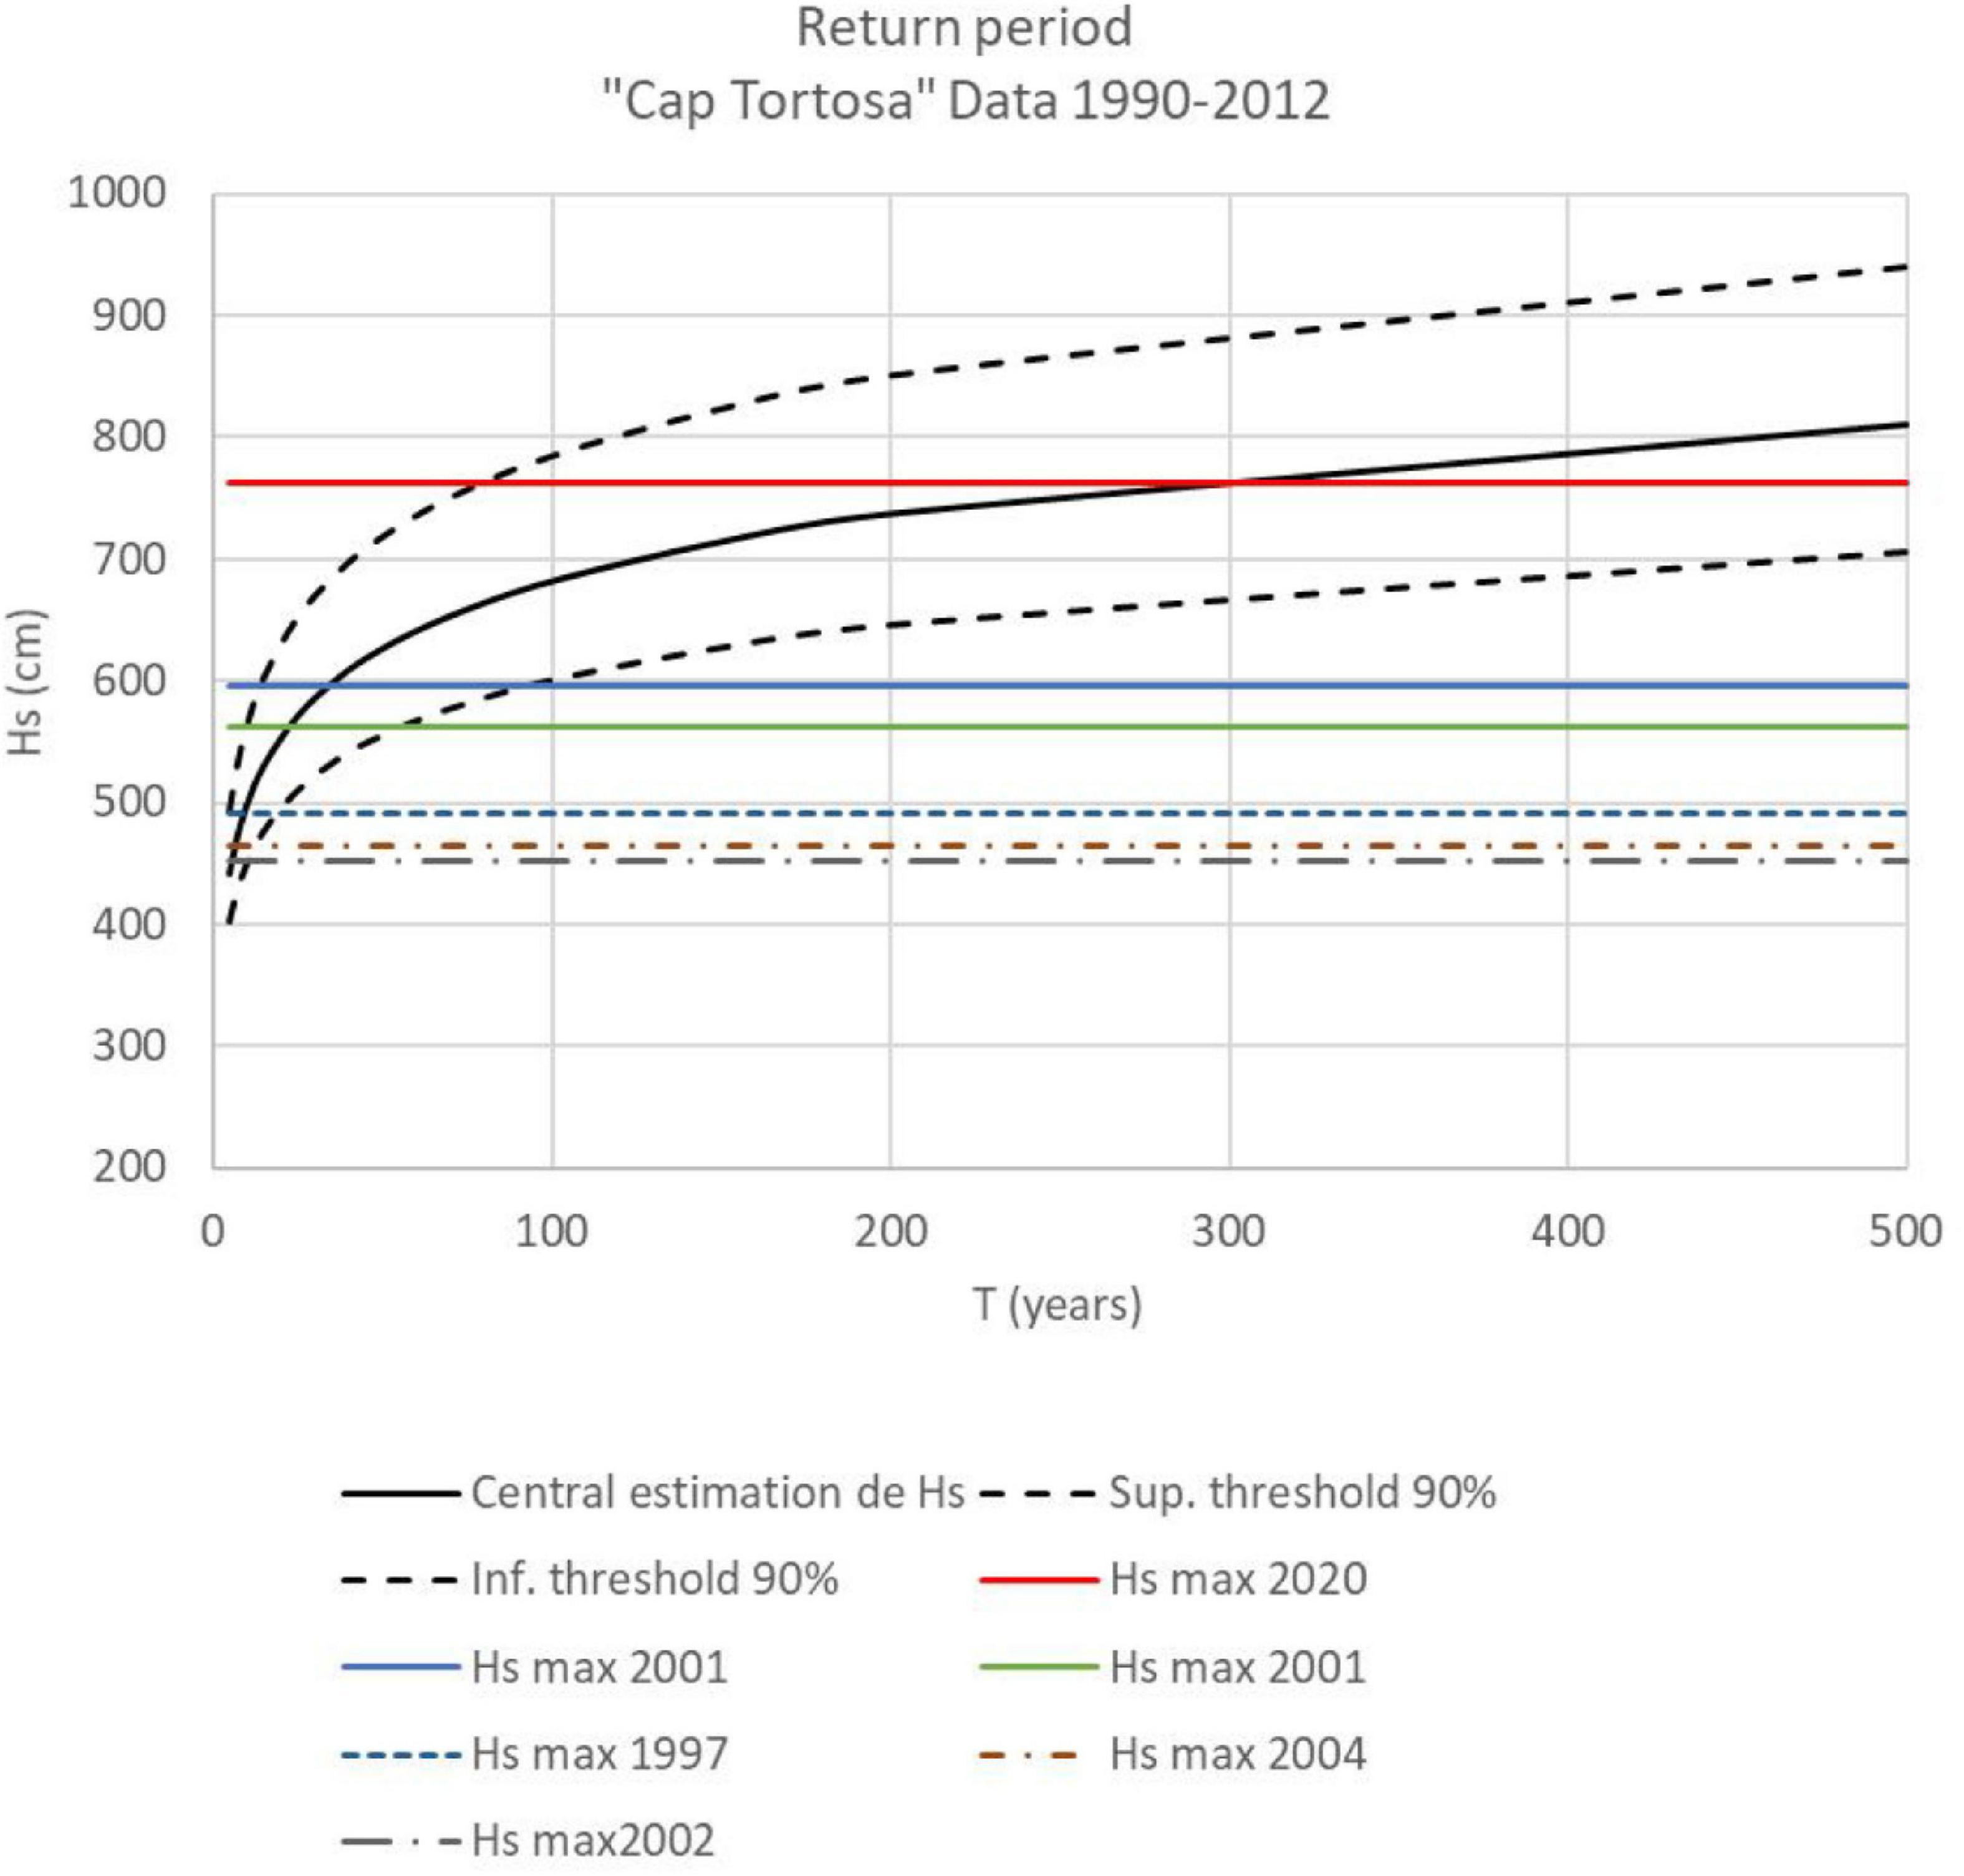
Figure 5. Alternative (compare with Figure 3) extreme distribution function, plotting significant wave height against return period. The data set is identical to that in Figure 3, corresponding to the period 1990–2012 and the XIOM wave buoy station in front of the Ebro delta at a depth of 60 m (dismounted in 2012. In this case a threshold of 2.7 m has been selected to define wave storms for the extreme sample. The function providing the best fit, using least squares and Goda’s formula for the plotting-position, is a Gumbel distribution function.
Lab Data and Error Intervals: Morphodynamic and Engineering Consequences
Sediment fluxes determine transport rates and from here the sediment budget for a given coastal cell can be estimated. Longshore sand transport in particular, is one of the main drivers for morphodynamic evolution at yearly scales (Stive et al., 2002) and the error interval of sediment transport formulations will be transformed by morphodynamic and budget calculations in a non-linear manner, seldom made explicit. Even when combining field measurements, for instance to characterize topo-bathymetric evolution for a given coastal cell, with sediment transport laboratory-based formulations, the error level in data from different sources is not usually considered and this applies very clearly to mobile bed experiments where the sediment size has not been reduced properly due to scale limitations in the experimental facility (Petruzzelli et al., 2013). This section will illustrate some seldom recognized uncertainties in lab data extrapolations which then condition engineering calculations, so that without an ethical basis that acknowledges such uncertainties, coastal engineering projects will seldom perform as expected, justifying the lack of proactive action within a general coastal pessimism and a trend toward do nothing options.
Error Intervals in Lab Data
Hydraulic laboratory data need to be applied for calibrating the formulations that characterize turbulence and water-sediment interaction processes, lying at the core of coastal engineering calculations and decisions. This calibration plays a key role in reducing uncertainty for coastal impact assessments, particularly under climate change conditions where models are forced to work outside their common calibration range. However, measured data either in the field or in the lab present large error intervals, aggravated when using reduced scale models that distort hydraulic, geometric and sediment scaling laws (Hugues, 1993; Soulsby, 1997). The introduction of advanced opto-acoustic recording equipment enables much higher resolution, but the application to areas with sharp gradients, such as the air-sea or seabed boundary layers or with poorly known mechanics, such as swash zone or ripple beds (Astruc et al., 2012; Fromant et al., 2019), still present significant error intervals seldom made explicit. Such uncertainty can be illustrated by sediment fluxes in the highly turbulent wave breaker zone, where the observational gear is forced to work under highly variable conditions for which it was not initially designed.
The reliability of water and sediment flux predictions in the surf zone depends on the type of breakers, sediment granulometry and the interaction between different flow and transport modes (e.g., long-waves or suspended suspension pulses). The error level of registered data, automatically introduced into engineering formulations, determines the reliability of coastal hydro-morphodynamic calculations, especially in storm events, which is translated into uncertainty for erosion or flooding storm impact calculations. These impacts are associated to sharp gradients, such as in plunging breakers, where a large amount of incoming oscillatory wave energy is transformed into to turbulent kinetic energy and vortices that generate important sediment fluxes (e.g., Ting and Reimnitz, 2015) and therefore produce significant impacts. Violent plunging breakers trap air volumes under the overturning crest and generate abundant air bubbles within the water column, in sufficient amount to affect the measurement capacity of most of optic and acoustic equipment used in the field and hydraulic labs. Such affectation may limit data accuracy and interpretation, reducing the reliability of registered wave heights, induced velocities and suspended sediment concentrations.
These limitations in registered data result in uncertainties to characterize hydro-morphodynamic patterns in the surf zone, degrading the reliability of impact assessments particularly under the more energetic events, featuring a larger amount of bubble generation but also responsible for the most damaging impacts on coastal systems. Even advanced measuring equipment, like Acoustic Doppler Velocimeters, may deliver data degraded by the presence of such bubbly environments, although the recorded digital information enables an objective assessment of the error level in the data and their possible distortion by violent air entrainment (bubbles) into the water column. By jointly considering the registered amplitudes and the correlation between values (Cáceres et al., 2020), together with the delivered signal-to-noise ratio, it is possible to determine the error level and reliability of the measured signals. However, when the measurement equipment does not provide a digital signal or the data application does not consider this source of uncertainty, the error level remains implicit and the engineering calculations may lead to wrong predictions. This problem affects also Optical Backscatter Sensors (OBS), a limitation already considered (Puleo et al., 2006; Cáceres et al., 2020) in the literature, but which until now was not applied to the data derived from the commonly used Pore Pressure Transducers (PPT). Conventional applications considered that air bubbles could not affect PPT data, although available lab recordings clearly showed that PPT were affected, particularly under plunging breakers, by air bubbles that reduced data accuracy and hindered a correct physical interpretation.
Such loss of accuracy is presented in Figure 6, which shows the percentage of waves that produce air bubble events (Ppeaks) for typical wave trains in a large-scale lab flume such as the CIEM flume in BarcelonaTech managed by LIM/UPC (Oliveira et al., 2012). The ensemble average free surface elevation computed from the PPT for a regular wave train with H = 0.85 m and T = 4 s and taking into account wave non-linearity, presents important differences depending on the level of bubbles present. PPT and OBS were deployed at the same vertical level in a moving carriage, providing records of bubble variation and pressures from which water free surface, an essential variable to characterize for instance the incident wave height, was determined. Panel a) in Figure 6 shows the recorded water surface elevation under a single wave within a train, as it approaches the seabed bar and starts breaking. Such a breaking process results in wave height decay over and right after the breaker bar, as depicted by the black dots in the lower central image of Figure 6, where the full black dots denote wave height evolution across the beach profile. Panels B–D present a clear drop around t/T = 0.2 on the water surface ensemble averaged signal, produced by the air bubble cloud going through the PPT sensor. The drop on the PPT signal faithfully matches a similar drop in the ADV Signal-to-Noise Ratio and is supported by the sequence of collected images. The point where the downward plunging crest impinges the free surface in front was measured at x = 54.9 m, which is the position presented in panel B, corresponding to the apparent fission of the incoming wave associated to air bubble impulsive generation by wave breaking. In all panels A–D the dashed green line shows the standard deviation from the sample of incoming registered waves, with respect to the ensemble average depicted by the continuous black line.
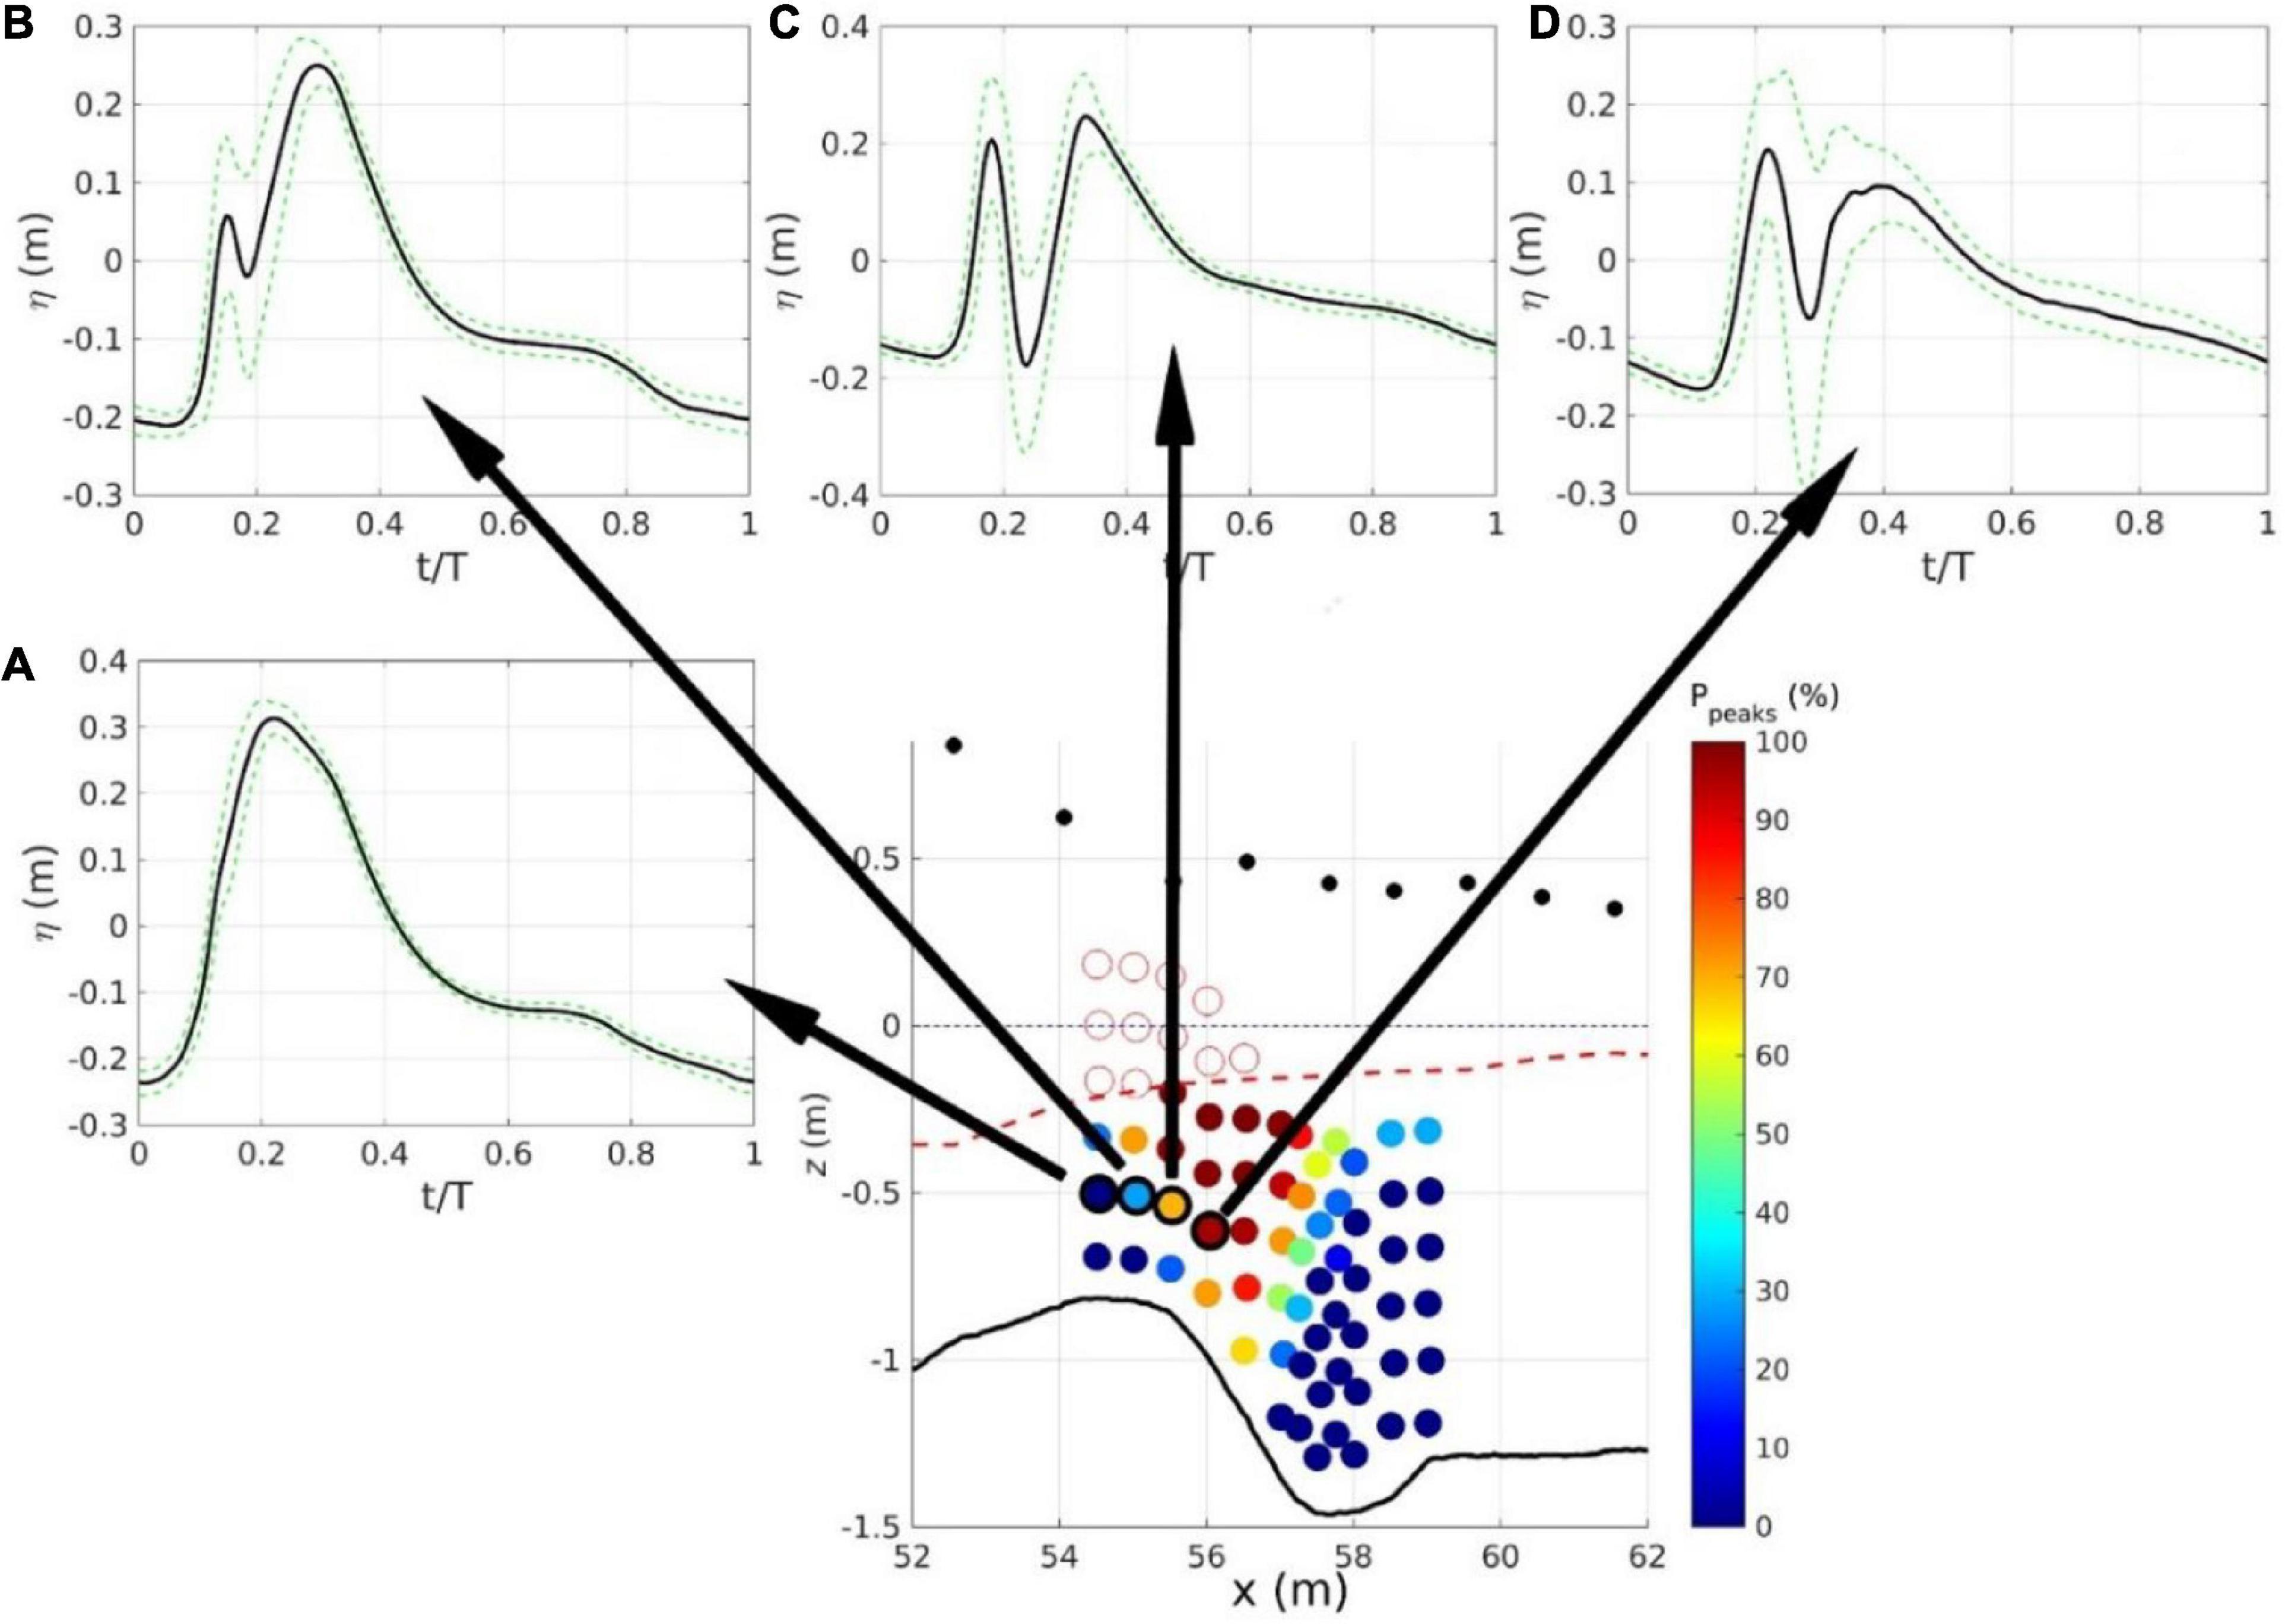
Figure 6. Presence of air bubble peaks induced by wave breaking (P peaks variable), in percentage and as a function of the bar-trough geometry (lower central panel). Plots (A–D) depict the ensemble free water surface (black continuous line) computed from a PPT signal, progressively more affected by the bubble cloud as the wave breaks over the bar and evolves into the following seabed trough. The ensemble variation of registered free surface signals within the incoming wave train is represented by the green dashed lines, corresponding to one standard deviation above and below the ensemble average and showing how the variability and uncertainty increase with breaking and air bubble non-linear interactions, as the regular incoming waves progress from bar crest to trough.
The confidence interval of width two standard deviations, centered on the ensemble average, increases from bar crest to bar trough, that is as the bubble cloud and wave interactions induce non-linear transfers between frequency bands in the breaking wave spectrum. The air bubble cloud is a nearly permanent although non steady feature that distorts all PPT measurements over the bar-trough region and is maintained by the arrival of subsequent breaking waves. Such an air bubble cloud, also detected by the percentage of bubble-induced peaks in the OBS signal (Ppeaks variable in the lower central panel), has a pervasive effect and degrades the reliability of the recorded free surface elevation, introducing error levels that may exceed, as shown in panel D, the 100% error level for wave height assessments. This uncertainty, if made explicit, should be considered in breaker zone hydro-morphodynamic analyses which, however, seldom take into account the underlying uncertainty and force conclusions that suite the research or application interests but which are not truly supported by the data. Such error intervals will grow when extrapolating to real or prototype scale and when using the wave height estimates to calculate other derived variables. For instance, sediment transport depends on wave height to a power that goes from 2.5 to 5 as described in next subsection, which would mean that for a dependency to the third power, a 50% error in wave height becomes an error interval close to 250%. These error intervals preclude deterministic assessments, particularly when used for diagnostic or prognostic applications and should be presented explicitly, based on redundant data that enable calibration followed by validation and the available knowledge on governing laws for the dominant processes. Such an explicit assessment of uncertainty, supported by an objective and ethical discussion, should facilitate the uptake of lab and field data to bound errors in engineering calculations, supporting knowledge based decisions and a stronger commitment of coastal deciders and stakeholders.
Morphodynamic and Engineering Consequences
Sediment transport formulations are calibrated with lab and field data and should, thus, include the error interval of such data. But in practice, those intervals are “lost” after the initial validation of the formulation. In addition, transport formulations represent a potential transport capacity, never verified if there is not enough sand available, which introduces an even greater uncertainty not always acknowledged in engineering applications. The key variables for sediment budget calculations (Figure 7), at the basis of most coastal engineering assessments, are the longshore sediment transport rate, the depth of closure (DC in the figure) and the berm height (B in the figure), usually characterized in a deterministic manner.
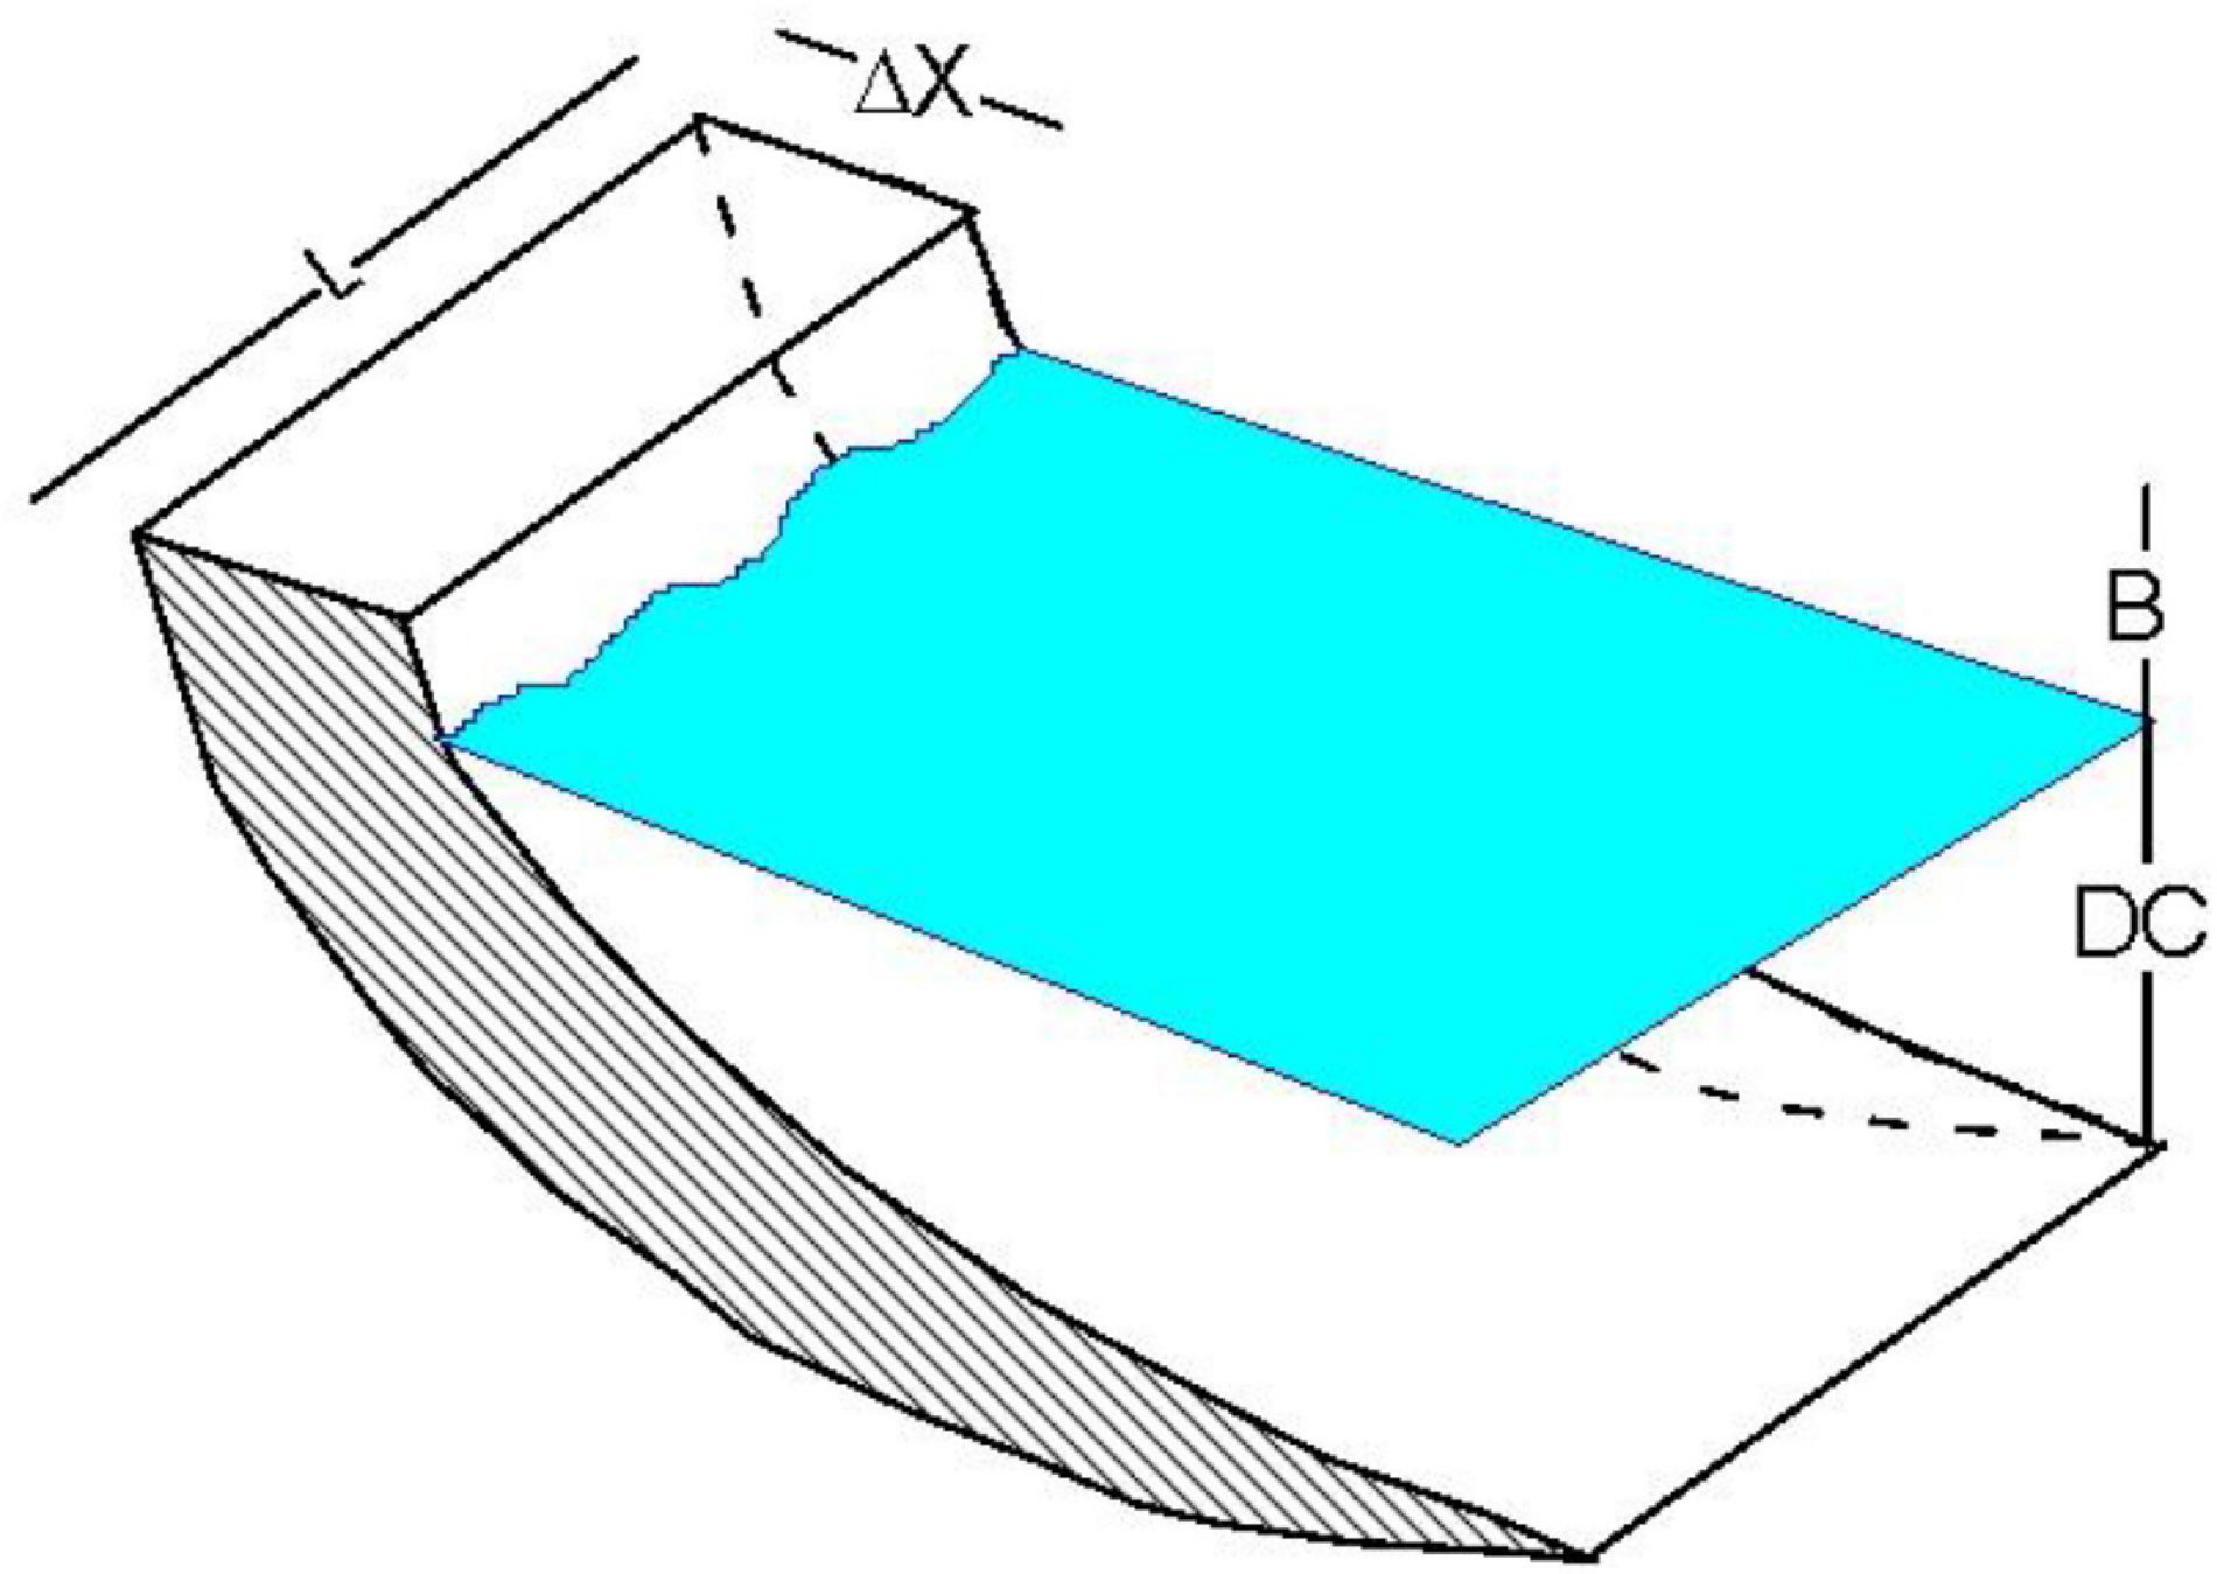
Figure 7. Beach profile schematization for sediment budget calculations, indicating the berm height (B), the closure depth (DC), and characteristic distances along (L) and across (Δx) shore to define the coastal slice volume.
The deterministic approach comes from the need to provide quantitative estimates for coastal decision making (e.g., artificial sand nourishment volumes) and by the cost associated with regular topo-bathymetric surveys, which limits a proper statistical characterization. Sediment budget and morphodynamic evolution are inferred from observed shoreline displacements, calculated from aerial or satellite data (e.g., ortophotos from aerial images or Sentinel 2 shoreline positions). To go from shoreline positions to sediment volumes and fluxes it is necessary to estimate the upper and lower limits of sediment transport, defined by the B and DC variables already mentioned. DC is typically obtained from a comparison of surveyed profiles (Figure 8) or from available formulations (e.g., Hallermeier, 1981), both approaches presenting uncertainties that may go from 3 to 15% (CIIRC, 2010). The DC formulations require the estimation of a wave height exceeded 12 hours per year, which again introduces the uncertainties from the wave height probability distribution, already discussed in section “Coastal Adaptation Pathways: Decisions for a Sustainable Conservation.” For estimating the berm height B (Figure 9) there is no universally accepted criterion, since it depends on the time scale of the analysis and the complexity of the considered beach profiles, where the usual configurations feature more than one berm (Figure 9) leaving the final value selection to technical expertise and ethical considerations, given its direct relevance for estimating sediment volumes which directly condition the cost of the engineering intervention.
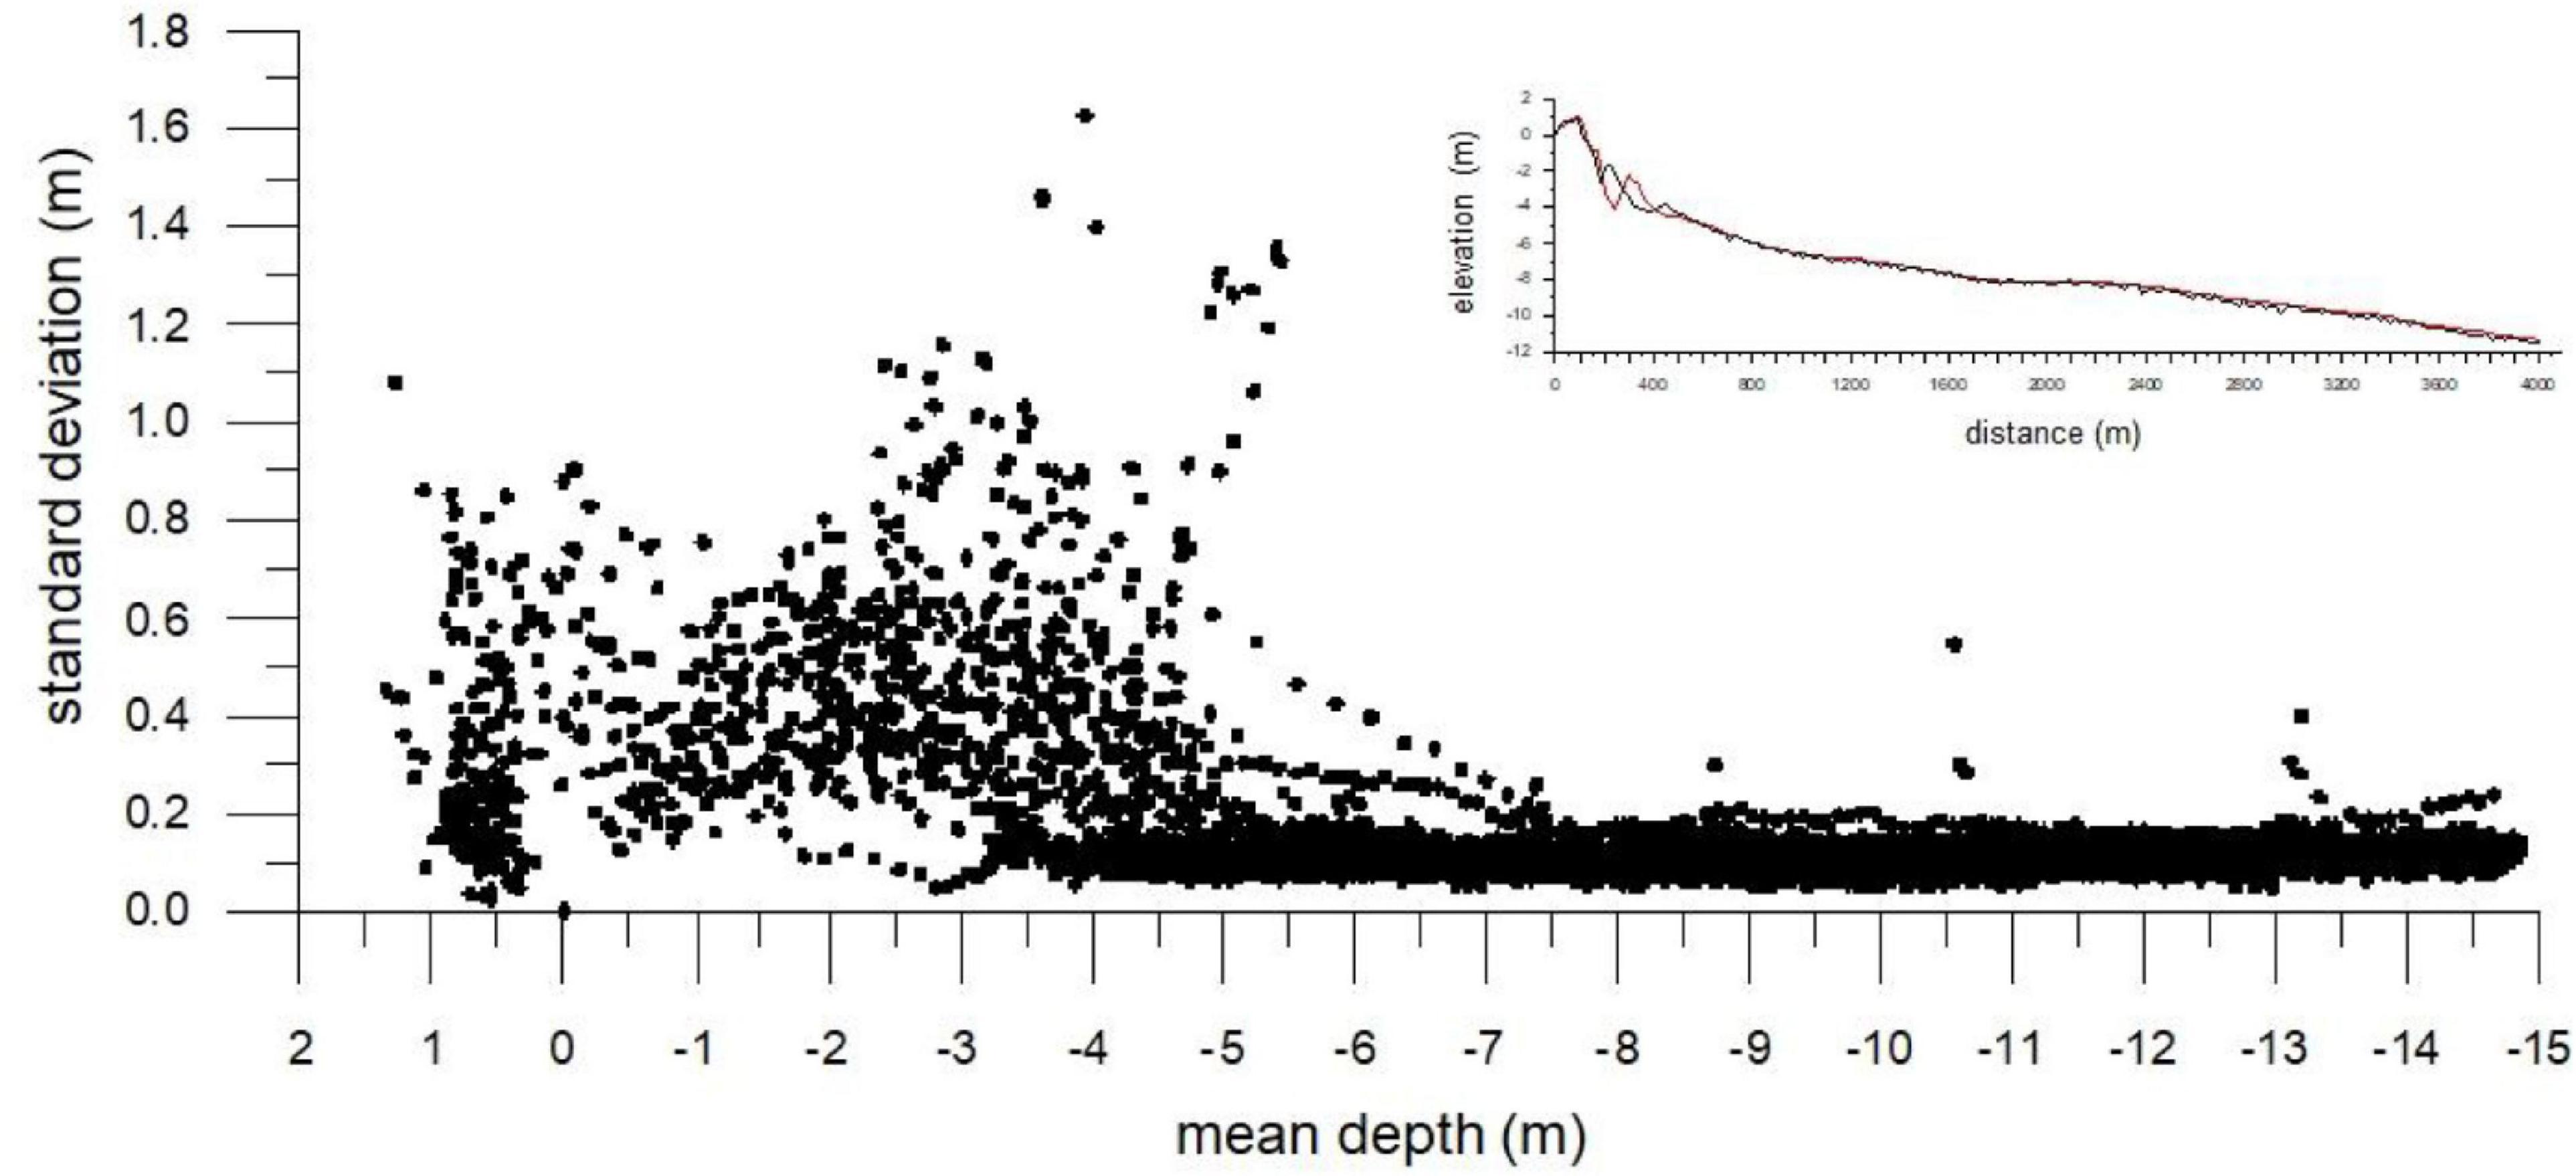
Figure 8. Set of beach profiles from the Ebro delta in the Spanish Mediterranean coast, showing the standard deviation for the ensemble of surveyed profiles (vertical axis) against the profile depth (horizontal axis). The zero depth indicates the still water level shoreline, while positive depths correspond to the emerged profile and negative depths to the submerged one. The profile geometry is depicted by the inset in the upper right hand side, showing depth (vertical axis) against distance to the origin, defined from a back beach milestone.
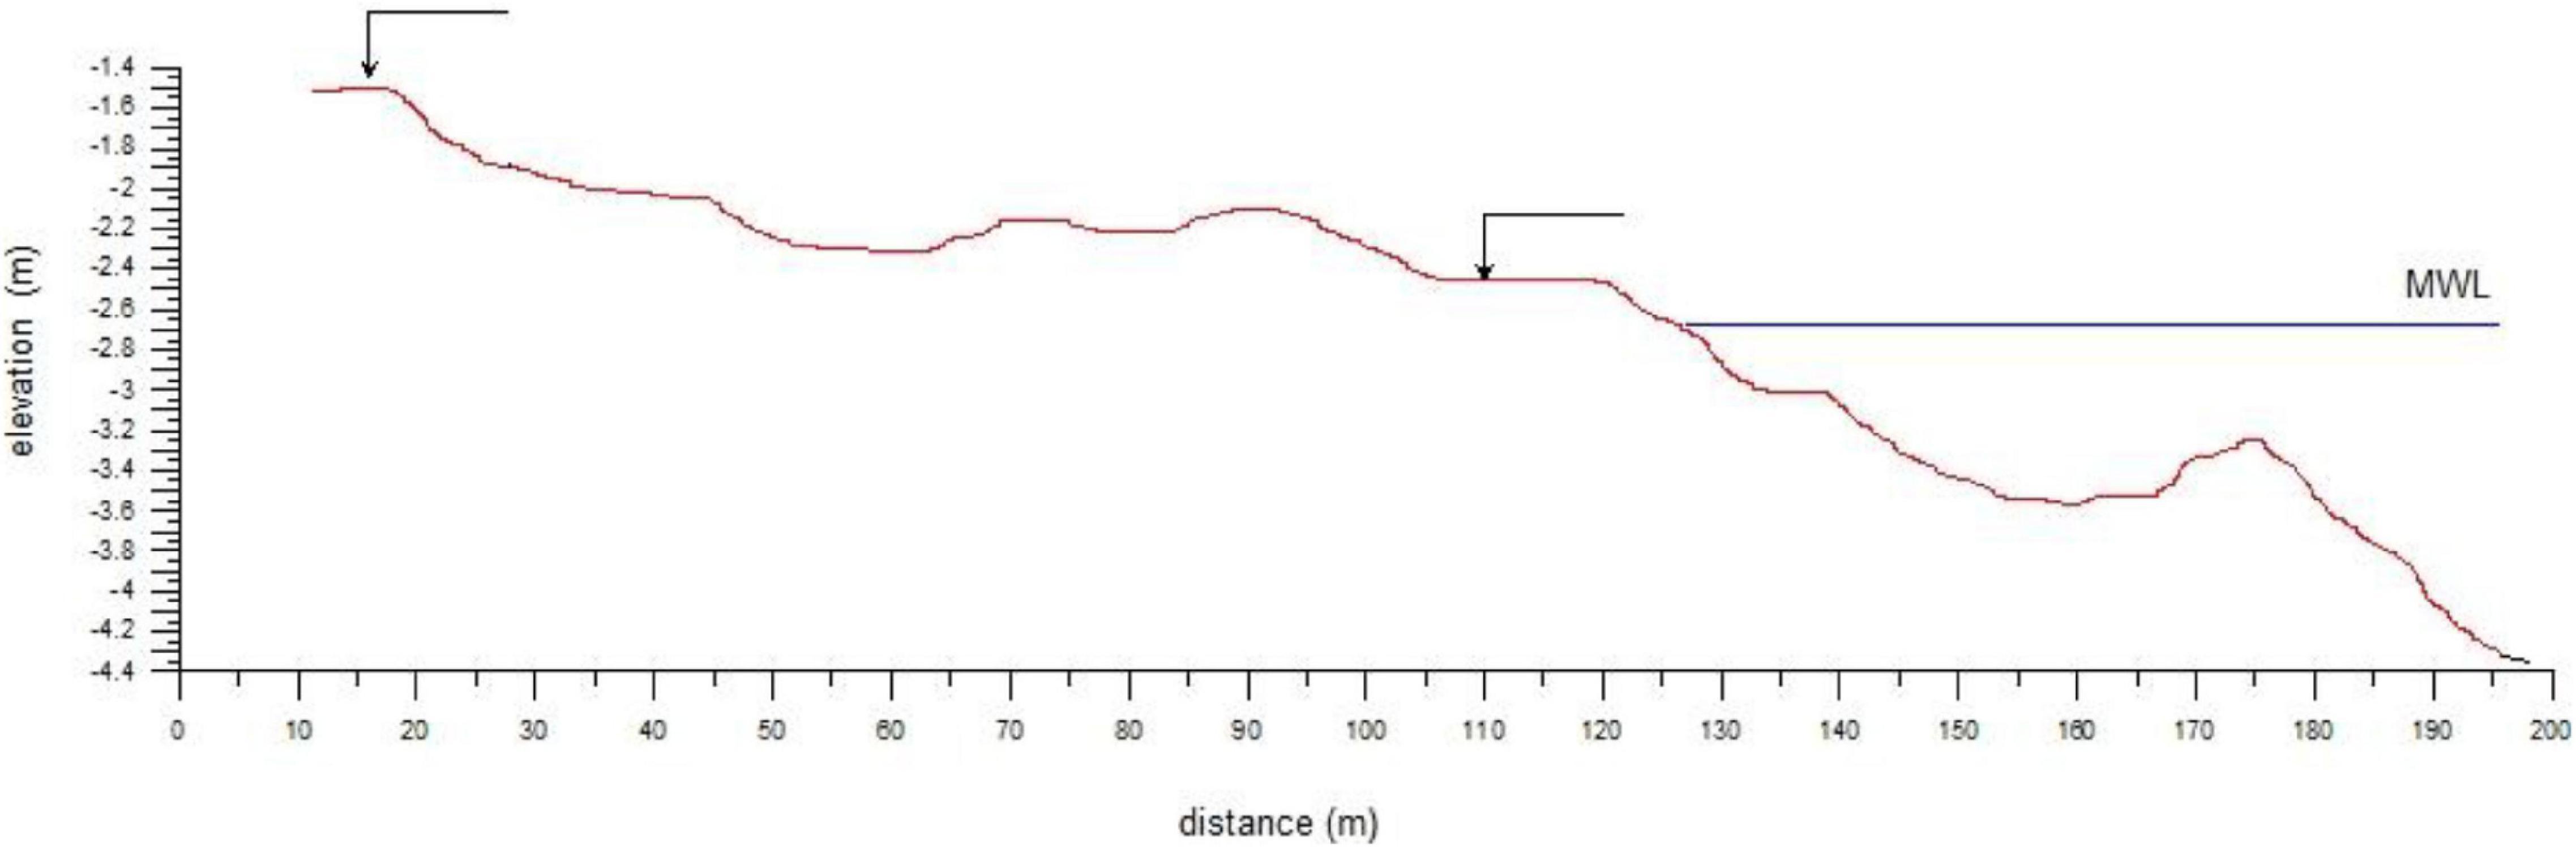
Figure 9. Beach profile (red line) from the Ebro delta in the Spanish Mediterranean coast, referred to the still water level (blue line) and depicting the inner submerged breaker bar (right hand side) together with the various berms (left hand side), whose level is indicated by arrows. This profile geometry, referred to horizontal cross-shore distance (X axis) and vertical level (Y axis) corresponds to typical geometries commonly found in microtidal coasts, but presents similar traits for other beach environments, illustrating the difficulty to define the berm level (B variable in text), which depends on the energy level of incoming waves and the time scale of the analysis.
Sediment transport rate predictions, relying on a set of state-of-the-art formulations, aggregate various sources of uncertainty stemming from hydrodynamics/morphodynamics and their interactions (wave/storm parameters and granulometry distributions, etc.). Moreover, these formulations represent the potential transport capacity (actual transport depending on sediment availability) and have been calibrated for conditions that normally do not coincide with those at the studied site. One of the simplest (yet more robust) approaches is the CERC formulation (USACE, 1984), still amply used in coastal engineering projects. The CERC equation is based on the assumption of a linear relationship between the sediment transport rate (Q) and the incident wave energy flux at breaking (Pls,b), which may be written as:
being KCERC the proportionality factor, g the gravitational acceleration, ρs and ρw the sediment and water densities, p the porosity and Hb the wave height at breaking, which occurs at a depth hb with an angle of wave incidence of αb.
The proportionality coefficient KCERC includes all uncertainties due to the limited accuracy of this formulation and the role of all variables not present in the expression, but which from basic physics should affect (Bailard, 1984; Kamphuis, 2002; Smith et al., 2009) sediment transport rates (e.g., wave period, breaker type, granulometry, and beach slope, etc.). KCERC has been empirically derived from different field experiments (Table 1), with values ranging from 1 to 0.2, being a value of 0.77 the most widely accepted option if the formula is fed by Hrms or a value of 0.29 if it uses Hs under the assumption of a Rayleigh distribution function for the incoming wave field. As a result, the evaluation of longshore sediment transport and the associated sediment budget present important uncertainties and error intervals, not always made explicit, which leads to transport results that can vary by more than one order of magnitude. The large number of parameters and error intervals that are included in sediment transport or budget evaluations result in important uncertainties that affect coastal decisions, where final conclusions may depend more on vested interests than on objective criteria. Here, again, an ethical basis underpinned by an explicit uncertainty estimation, is of paramount importance to provide a robust and balanced approach to coastal decision making.
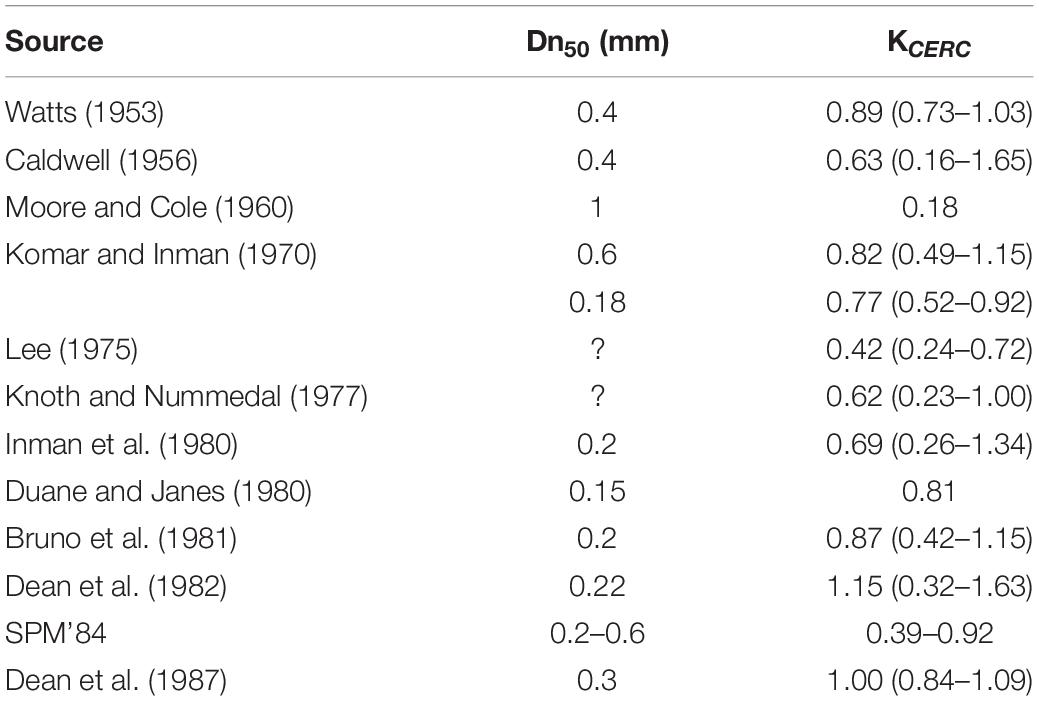
Table 1. Average values proposed by different authors for KCERC and experimentally determined variation intervals (in parenthesis), modified after Soulsby (1997), where Soulsby’s book includes all references under the “Source” column.
Longshore sediment transport and budget calculations are usually referred to yearly intervals (Kraus, 1989; Stive et al., 2002) to avoid instabilities or cumulative errors from shorter or longer, respectively, scales of analyses. Resulting estimations should provide explicit bounds for error levels, which sometimes have been proposed in the literature with different degrees of acceptance. Available proposals for variation intervals in KCERC (Table 1) and the main hydro-morpho-dynamic parameters (Table 2) indicate the wide range of aggregated error intervals, since the expressions relating these variables are highly non-linear. Building from state of the art equations that combine these variables, the total uncertainty in longshore transport can be estimated by means of a Taylor series expansion (Kraus and Rosati, 1998), making explicit the contribution from each variable. The expected range of variation of the main geometrical parameters (see Figure 7) appears in Table 3, based on results from multiple surveys for the Catalan coast in the Spanish Mediterranean (CIIRC, 2010) under representative oceanographic conditions.
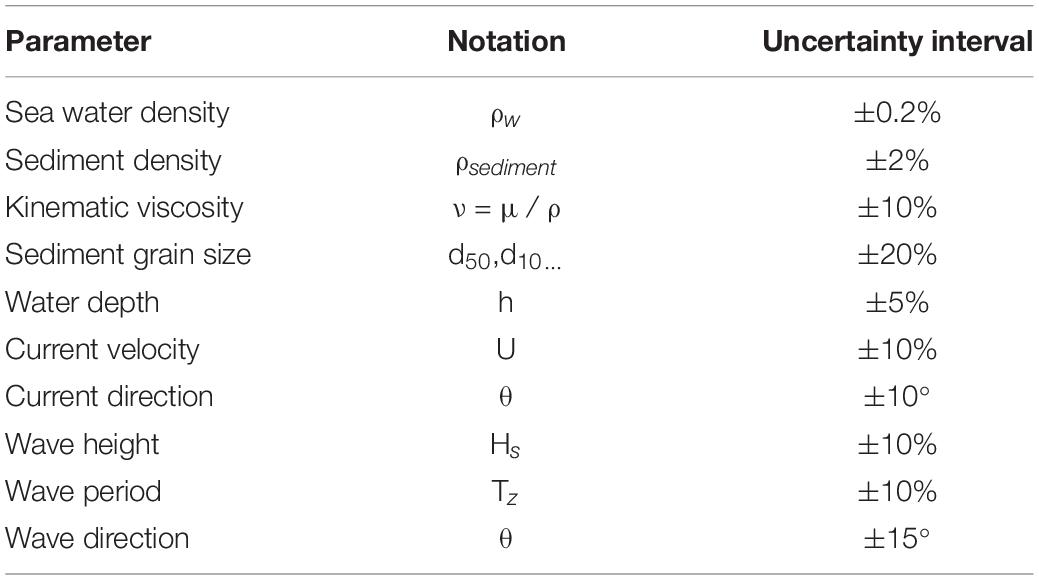
Table 2. Some common variation intervals for the main parameters that affect sand transport calculations, modified after (Soulsby, 1997).
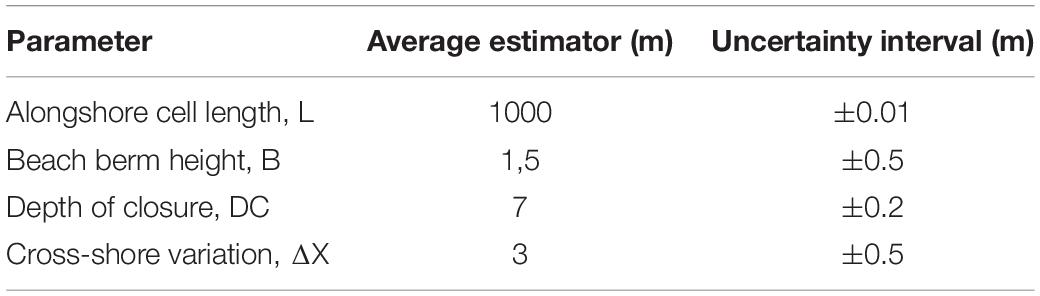
Table 3. Typical variation intervals for the geometric parameters defining control cell volume (Figure 6) in Spanish Mediterranean sandy beaches, adapted from Gracia (2005) and CIIRC (2010).
From here a sensitivity analysis to assess longshore transport error intervals can be developed, based on a typical costal stretch of 1000 m length and located in the Spanish Mediterranean coast, with a total height (DC + B) of the active beach profile of 8.5 m (Gracia, 2005), typical of deltaic systems in the Spanish Mediterranean and with uncertainty intervals as in Table 3, and derived from repeated surveys in the Ebro delta coast. The calculated volume of the sedimentary cell (Figure 7) presents an uncertainty in the total cell volume estimation between 19 and 25%, resulting from the different parameters, which in turn present different maximum and root-mean-square error limits. For instance, the total active height of the profile shows a root-mean-square error of 0.5 m and an upper bound for the variation interval of 0.9 m for the studied Ebro delta coast and similar coastal profiles.
The considered coastal stretch experiences a relatively uniform gradient in the longshore sediment transport, typical of a rectilinear coast such as is the Trabucador barrier beach in the Ebro delta, subject to oblique wave incidence without excessive bathymetric induced perturbations. The resulting sediment budget is also affected by overwash processes that take sand from the outer coast toward the lagoon side (Jiménez and Sánchez-Arcilla, 1993). In spite of these difficulties, which condition longshore transport estimations at yearly time scales and should reflect the aggregation of transport pulses mainly under storm events, the validation with coastal morphodynamic evolution requires such a sediment budget aggregation to derive stable estimates (Schoonees and Theron, 1993; Wang et al., 1998; Wang and Kraus, 1999). By condensing the available wave data into a schematised yearly scale variation (Table 4) and introducing the presented error intervals for the key variables controlling longshore sediment transport, it is possible to develop a Taylor series expansion for the error (Taylor, 1997). Applying this procedure to the Spanish Mediterranean coast and the control cell of Figure 7, it is obtained that the total error level in longshore sand transport, using the presented CERC formulation, is of about 40%. This level of error explains the mismatch often found in any comparison between calculated potential transport and actually verified transport from field data (Figure 10). In this case longshore averaged sediment transport was inferred from aerial orthophotos, multiplying shoreline advance/retreat by the active profile thickness (berm height plus closure depth) and the length of the studied coastal stretch. The resulting volumes indicate the net erosion/deposition over the period covered by the aerial images and have been expressed in cubic meters per year, corresponding to typical values for this part of the Spanish Mediterranean coast. The steeper (black) line corresponds to net sediment transport rates averaged over a few years for a typical Spanish Mediterranean coastal stretch, with estimated transport rates close to measured data and an error upper limit below 10% (average fit coefficient is 1.08), which is quite exceptional and denotes the quality of the performed calculations and subsequent model calibration. The red line represents calculated longshore transport values which are about twice the measured ones, corresponding to a deltaic beach that is sediment starved and where the potential transport estimated by the formula cannot take place in the field. There are some points (dashed areas) where the calculated transport value is almost an order of magnitude larger that the value inferred from aerial photographs, underpinning the potential transport character of the estimates provided by the sediment transport formulation.
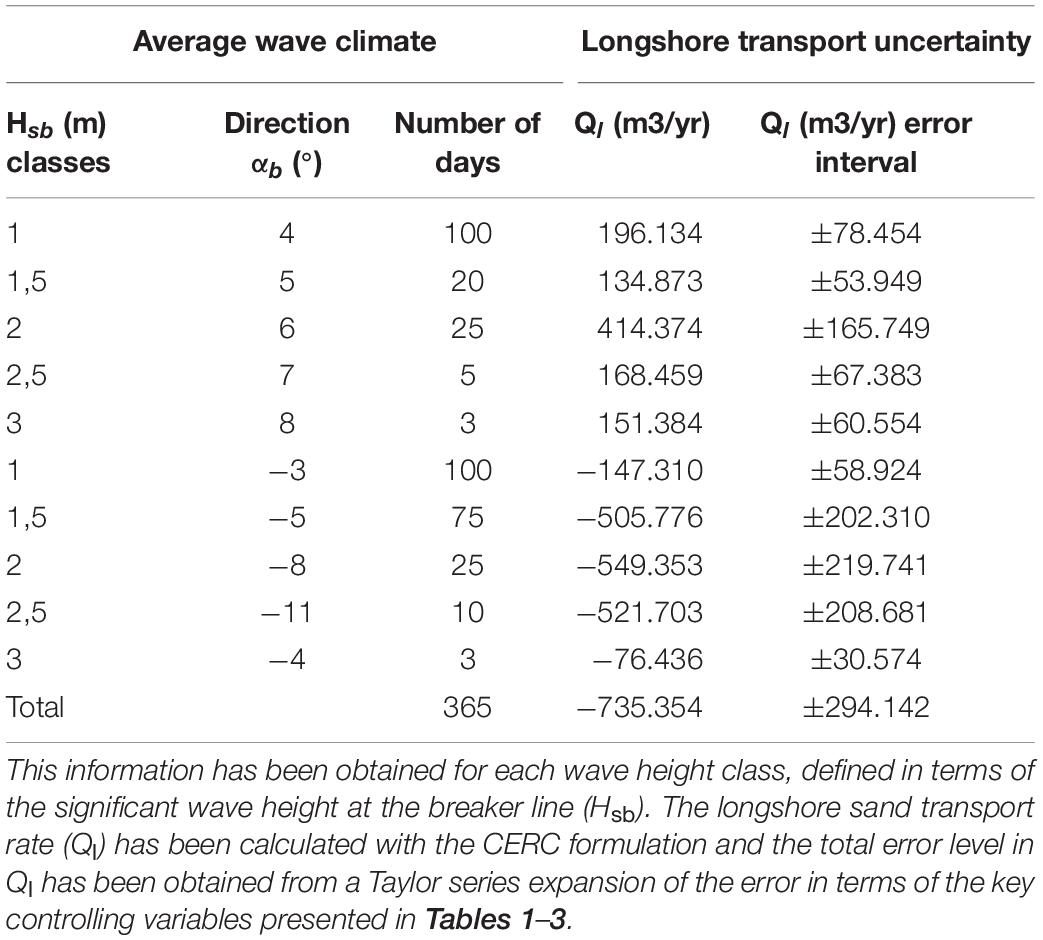
Table 4. Condensed average wave climate for the Spanish Mediterranean coast, indicating the number of days (ND) and peak direction of wave incidence at the breaker line (θb).
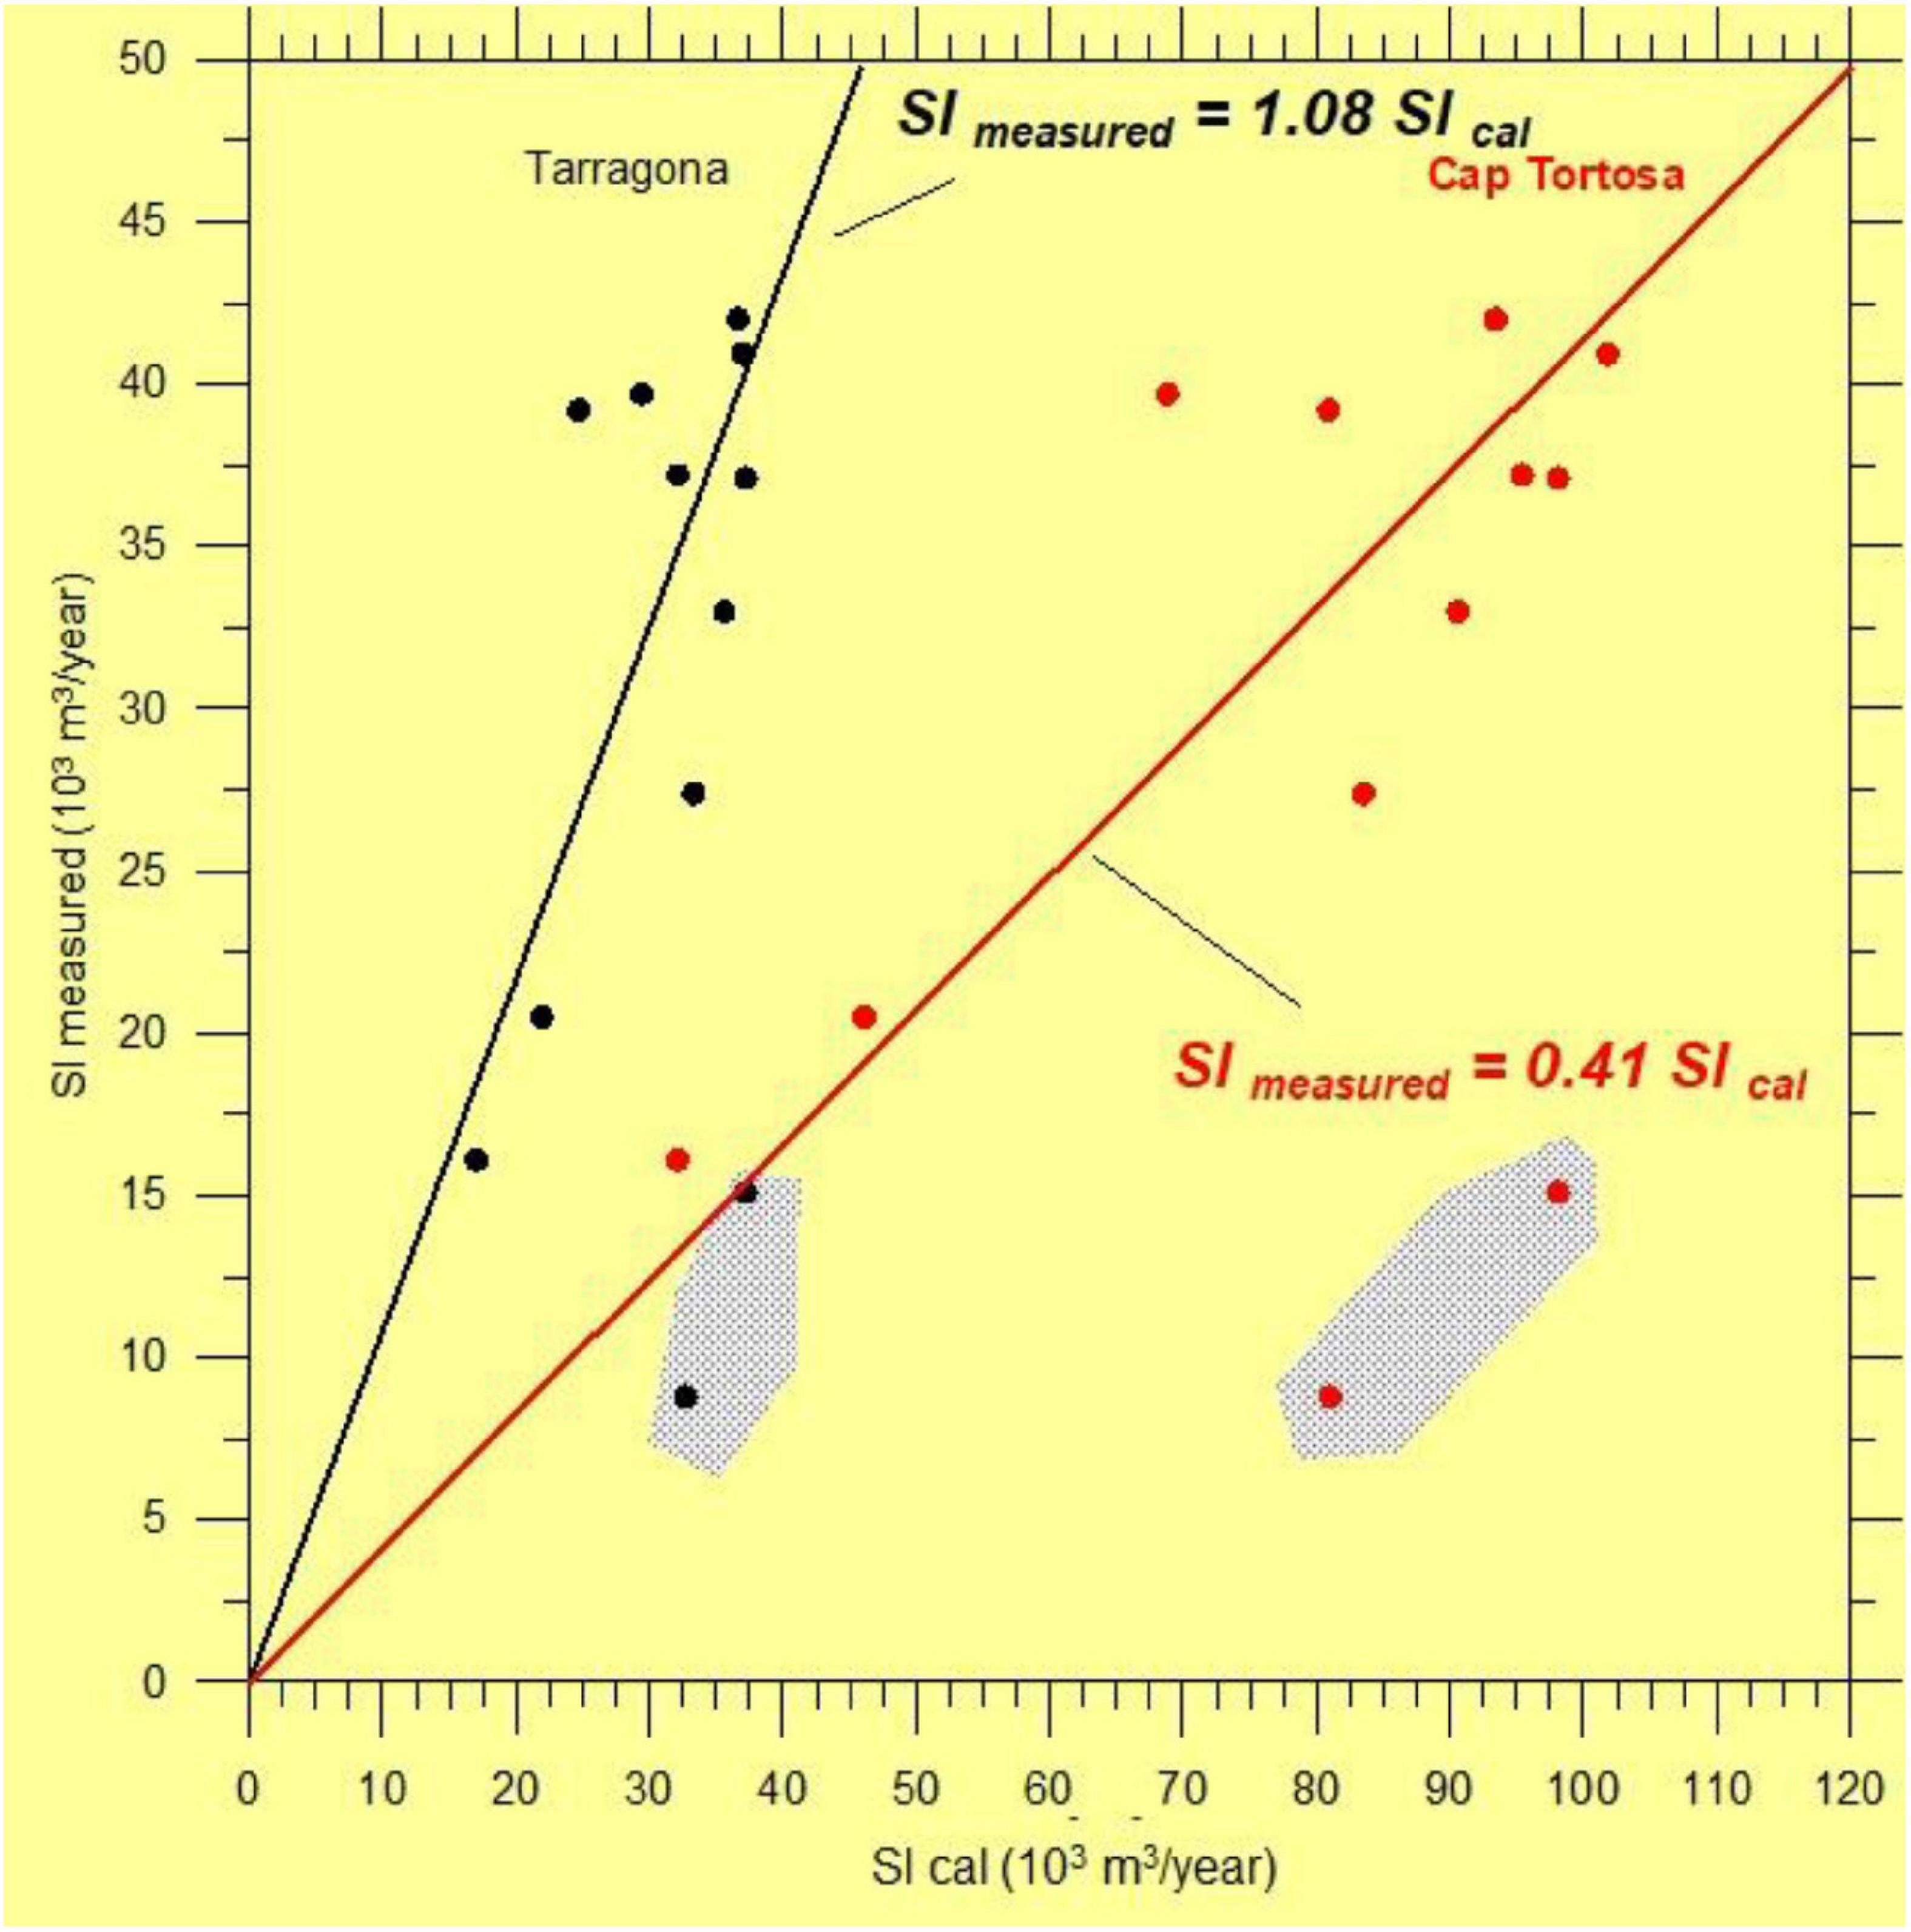
Figure 10. Measured (vertical axis) and calculated (horizontal axis) longshore sand transport rates for a typical stretch in the Spanish Mediterranean coast (black line corresponding to the Tarragona province) and for a sediment starved coastal sector in the Ebro delta (red line corresponding to the Cap Tortosa area). The dashed areas indicate profiles where the calculated transport exceeded by almost an order of magnitude the measured one, highlighting the fact that transport formulations provide a potential transport capacity rather than the actually verified transport.
The discrepancy between actually measured transport, in this case from a comparison of orthophotos characterizing shoreline evolution, and the estimates from potential transport formulations, highlight an important uncertainty in coastal engineering. Such uncertainty must be made explicit and assessed form an ethical perspective, avoiding biases by vested interests that may lead to poorly designed coastal interventions and a loss of confidence on expert opinion. The mistrust in engineering calculations may grow from these discrepancies, hampering anticipatory decisions, and the baseline optimism needed for a shared work toward coastal sustainability.
Coastal Risk Assessments: Hazard and Vulnerability Estimations
Coastal storms, particularly impulsive ones like those in the Mediterranean (Pérez et al., 2021), reshape beaches out of wave equilibrium and may generate important risk levels for highly pressured coastal zones like those in the Mediterranean. These risks, estimated as the product of hazard, vulnerability and exposure, actually happened during storm Gloria, the considered study case, which affected the Spanish Mediterranean coast in January 2020. Storm Gloria stalled for several days over the western Mediterranean Sea, generating large waves (see section “Field Data and Statistical Processing: Uncertainty in Diagnosis”) and storm surges (Pérez et al., 2021) that were forewarned by the Spanish Meteo Agency (AEMET) with red (maximum risk level) warnings between January 19th and 20th, extended to January 21st for the Catalan coastline. This storm, selected to illustrate the uncertainties in extreme impact assessments, resulted in personal losses (14 casualties and 3 more missing) and material damages to agriculture, infrastructure, and other socio-economic assets, with insurance claims exceeding 76 million €, while total economic impacts were estimated to be around 200 million €. Resulting coastal impacts were analyzed by the Spanish Ministry (CEDEX, 2020), considering the main damages reported, which affected 137 beaches, and applying state of the art valuation techniques and indicators (Botero et al., 2015; Lucrezi et al., 2016). Based on the considered indicators, coastal vulnerability was assessed specifically for each beach and then for longer coastal stretches with a subset of indicators reported for all beaches in the selected stretch. The subset of selected indicators characterize storm impacts based on the main controlling processes that can be related to: (1) beach profile volume/shape (bp); (2) coastal protection structures (cs); (3) beach services (showers, accesses, and facilities) (bs); (4) back-beach dunes (bd); (5) urban (public) infrastructure (ui); (6) private property (pp); and (7) debris accumulation (da). The individual beach analysis (called in what follows “first approach” to vulnerability) estimates vulnerability from the seven indicators just described, which may be not be available for all beaches within a generic coastal stretch. A comparative more regional analysis, developed for a longer coastal stretch (called in what follows “second approach” to vulnerability) retains only the indicators that are available for all beaches, which are normally numbers 1 (bp), 3 (bs) and 5 (ui). Vulnerability has been estimated for both approaches in terms of a damage index (di), without considering exposure that cannot often be properly assessed due to insufficient data. For all indicators and the two proposed vulnerability approaches a value of 1 for the indicator represented very significant damage (equivalent to total loss or destruction), while a value of 0 represented no damage reported. In the first approach to assess vulnerability di is calculated as the mean of all seven considered indicators:
In the second approach di is calculated as the mean of the three more relevant indicators, which tend to be more easily available for all beaches. However, for coastal systems with a back beach buffer zone formed by dunes, whenever these dunes, representing the last defense line of the coast, were damaged by the storm, a value of 1 was selected because the mean value of the indicators resulted in an underestimation of vulnerability, according to the available evidence (Pérez et al., 2021)
The illustrative analysis, performed for a typical stretch of the Spanish Mediterranean coast, resulted in 133 beaches, out of the 137 studied, with significant damages after the impact of the selected extreme storm. From the first vulnerability approach, considering all indicators, it was found that most beaches presented significant vulnerabilities, related to shoreline retreat and urban infrastructure damage, while damages to coastal infrastructure and private property was present only in about 10% of cases. The highest level of the di index was 0.71 and there was a beach without damages with di = 0.0. These estimates, although spatially characterizing vulnerability during storm Gloria, should be handled with care since there are many possible criteria to assess damage and, when multiplied by the probability of climatic pressure (wave height in the presented analysis) exceedance (see section “Field Data and Statistical Processing: Uncertainty in Diagnosis”) or the combined probability of combined climatic factors (wave height and storm surge in the presented analysis) exceedance, risk estimates will present even larger uncertainties. The fact that the average vulnerability level was 0.41 for the province of Tarragona (southern Catalan coast) and 0.33 for the provinces of Barcelona (central coast) and Girona (northern coast) indicate higher vulnerabilities in the southern part of the Catalan coast, where the fetch for wave generation was also larger and led to more energetic incident waves acting on the southern part of the coast. The high risk levels for the Ebro delta coast indicate a sediment-starved and low-lying deltaic system (e.g., Grases et al., 2020), subject to higher waves (southern part of the coast) and enhanced storm surges because of the wider continental platform and submerged prodelta, which increase the sea surface elevation due to the combined wind velocity and low atmospheric pressure.
The performed risk assessment illustrates the relation between hydro-morphodynamic processes and resulting risks, indicating the need to combine physical and socio-economic data with explicit error levels. These errors should be worked out both for the hazard and the vulnerability factors, together with a sensitivity assessment for different types of damages and combinations of meteo-oceanographic factors. A non-negligible part of the risk uncertainty comes from the selected valuation techniques (e.g., Luisetti et al., 2014) and from the fact that risk will evolve with storm development or recurrence (risk increases) and with natural coastal recovery (risk decreases), requiring a dynamic estimation to consider how risk evolves with time and space. Such risk dynamics must also consider the stabilizing effect of selected natural processes, such as onshore transport and beach debris, which integrate marine and riverine sources and illustrate the importance of natural accretive transport and protection, more relevant during storm decay stages and for chained storm events, such as those that affected the studied Spanish Mediterranean coast from February to May 2020. Physical and geological settings also produce a spatial variation of risk, that should be made explicit in regional analyses to provide a holistic characterization of risk propagation. Such a risk propagation pattern appeared during storm Gloria for the coast south of the Ebre delta, where the sheltering effect of this delta, seldom made explicit in cost/benefit analyses, became apparent for the coast downdrift, which is the Castellon province, located south of the Ebre. The deltaic sheltering effect explains why the Castellon province coast experienced smaller storm impacts than its neighboring provinces, introducing a clear spatial pattern in risk distribution that must be considered in regional coastal analyses.
A spatially distributed risk pattern, taking into account the “fixed” protection elements (such as the deltaic protuberance in the selected example) and the evolution with time of risk levels, including the error bounds assessed from limited knowledge, is the only approach to build socio-economic confidence on risk assessments. This confidence will require an ethical basis to assess risks and uncertainty from limited data and presenting clearly the error levels in the considered social-ecological interactions, which will always represent a simplification of the actual coastal system. The vulnerability levels obtained, ranging for the selected example from 0.41 to 0.33 for the first approach, and from 0.89 to 0.67 for the second approach, illustrate such uncertainties, since vulnerability should be largely insensitive to the calculation procedure. Such a dependence on the selected approach and the variability with space (e.g., along the coast) and/or time (e.g., during the storm) highlight the need to present vulnerability results from an ethical basis, making explicit the error intervals and providing a neutral (fair) assessment of the estimation. In the presented study case, and because of the limited amount of reliable information to estimate the selected indicators, vulnerability results only provide an approximate measure of relative damage levels, which showed a growing trend toward the south of the Catalan coast due to the presence of the highly vulnerable Ebro delta. Below (further south) the delta vulnerability decreased due to the sheltering effect of the deltaic form.
To facilitate the development of regional adaptation pathways (e.g., Werners et al., 2021) for the Spanish Mediterranean coast, linking adaptation with risk levels, these vulnerability results have to be fitted to a probability distribution. Such distribution will enable the characterization of low, medium and high levels of risk (Figure 11) along this or any studied coast. By an empirical fit to common probability distributions, from which a Normal function has been selected in our study case because it provided the better fit, it becomes possible to analyze if the two vulnerability approaches deliver results from the same statistical population. Applying a Kolmogorov-Smirnov test to the relative frequencies of damage levels from the two approaches, it is apparent that in the studied case the results represent different populations, depending on the approach selected for the analysis. This is another indication of the lack of robustness in many vulnerability and risk assessments, which therefore need an expert judgment based on ethics and balanced comparisons. The role of advanced statistics may enable improved conclusions, provided the data sample is large and characteristic enough, resulting in improved decisions for coastal adaptation.
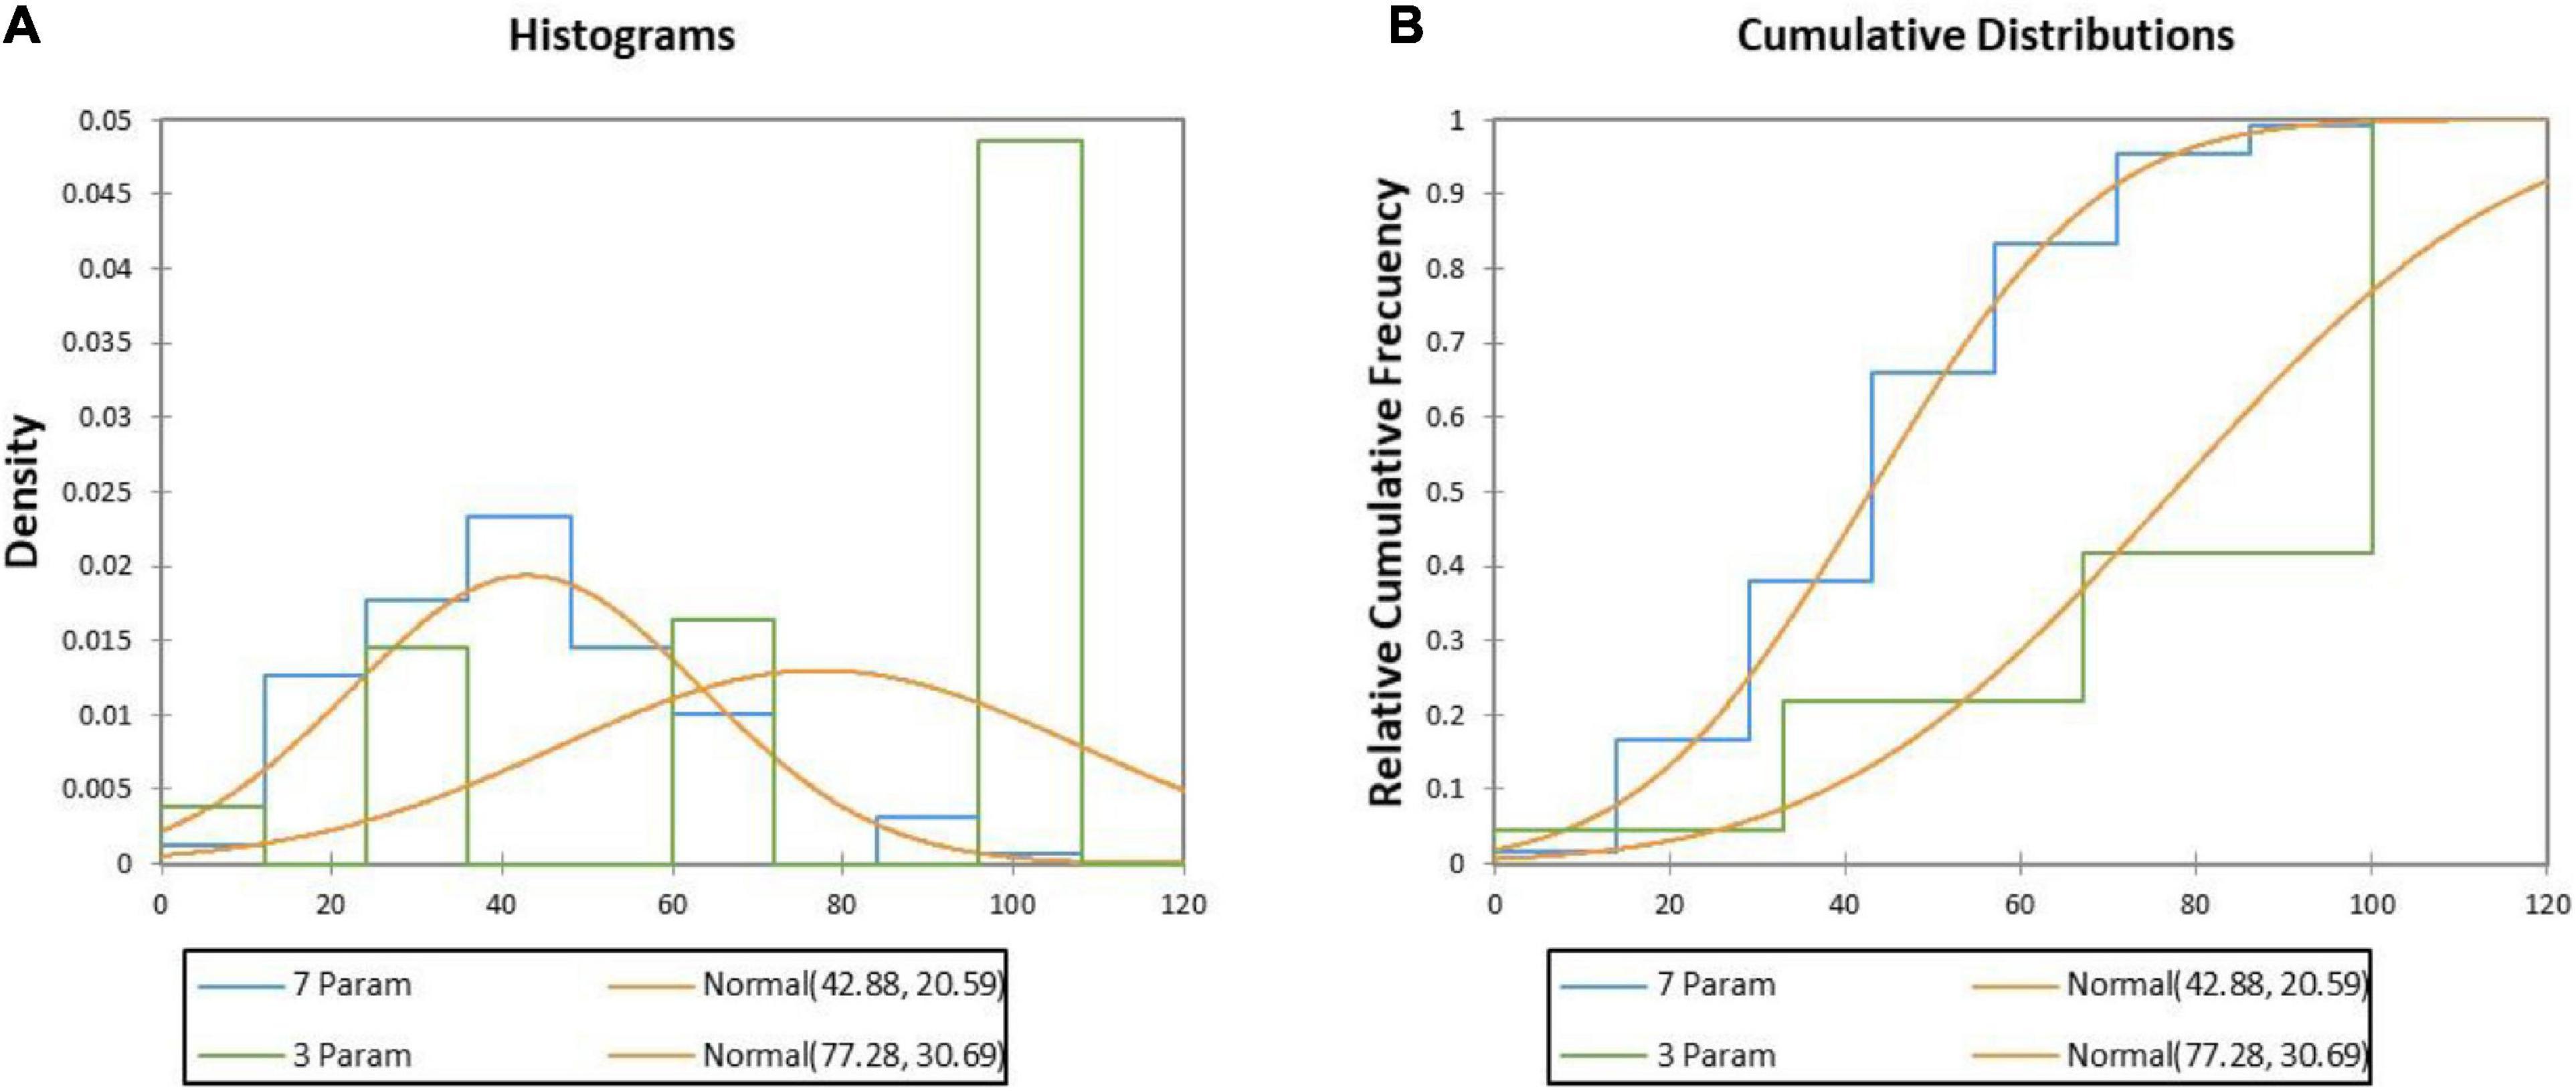
Figure 11. Relative (left panel A) and cumulative occurrence (right panel B) of vulnerability levels for beaches along the Spanish Mediterranean coast after the impact of storm Gloria (January 2020). The number of beaches affected, given by frequencies in the vertical axes of the two panels, and the different levels of risk, indicated by the variations in shape between the orange (vulnerability from 7 indicators) and blue (vulnerability from 3 indicators) lines, indicate how the analysis depends on the approach selected. The calculated frequencies have been fitted to a Normal distribution, whose parameters appear between parenthesis.
In spite of the discussed uncertainties, the applied quantitative techniques enable an objective estimation of risk levels along the coast, showing that commonly only a small percentage of beaches experience total damage during extreme events. For storm Gloria, based on the 7 indicators approach, this percentage was about 1%, while the percentage obtained with the 3 indicators was approximately 60%. Such discrepancies, unless tamed by ethics, will prevent decision making and will increase the mistrust on expert analysis or even numerical results in general, with direct consequences for coastal investments. And yet the quantitative information stemming from knowledge-based analyses is an excellent basis to make decisions or reach consensus, provided that the derived estimates are based on ethics and, whenever possible, associated to error bars that indicate the underlying uncertainty. The vulnerability results from the 3 indicators (second approach) is clearly biased toward high damage values, with higher statistical moments than those obtained for the 7 indicators (the first moment is 42.88 for the 7 indicators and 77.28 for the 3 indicators). This behavior, showing a larger uncertainty and wider variability for a reduced set of indicators that, however, could be quantified for a larger number of beaches, illustrate the difficulties to extend this type of analysis to regional cases, spanning longer and more heterogeneous coastal sectors.
The performed risk assessment, although simplified, illustrates the conundrum of deriving quantitative estimators for coastal adaptation decisions. From a technical point of view, the use of a reduced set of indicators (3 in the presented example) should lead to a more robust and regional analysis of coastal vulnerability, focusing on the beach area and infrastructure whose physical integrity was more directly affected by extreme storms. However, the limited information provided by just three indicators, with fuzzy estimations of the impact and dynamic response depending on beach morphology and presence of infrastructure, may result in fragile criteria for coastal decisions, excluding the key role played by factors such as dune integrity or the natural protection exerted by accretive transport or debris accumulation. Moreover, risk and vulnerability assessments should consider all socio-ecological factors relevant for coastal adaptation and risk characterizations, discarding variables only after a proper (knowledge-based) justification. Such limitations in risk analysis illustrate the need for explicit error intervals and a fair technical assessment based on ethics, where coastal stakeholders should be informed of the strengths and weaknesses of the data and analysis method. The obtained results should be ethically presented, comparing different options in statistical, physical and valuation techniques, so that the estimation is explicit and transparent, reflecting the limits in knowledge and data. Only from such an ethical basis it will become meaningful to incorporate risk and vulnerability assessments into coastal adaptation pathways, resulting in better decisions that reconcile short/long term priorities and build up a wider consensus.
Shared Coastal Futures: Ethics and Optimism
The presented analyses illustrate the inherent error in coastal risk assessments with present knowledge/data and how the prevailing uncertainties may vary within the Spanish Mediterranean coast. The development of coastal adaptation pathways and particularly the quantification of tipping points, deadlines for urgent coastal decisions, will suffer from the same error levels, stemming from meteo-oceanographic factors characterizing hazards (section “Field Data and Statistical Processing: Uncertainty in Diagnosis”), coastal impact/response calculations (section “Lab Data and Error Intervals: Morphodynamic and Engineering Consequences”), and vulnerability/risk assessments (section “Coastal Risk Assessments: Hazard and Vulnerability Estimations”). And yet, there is a growing consensus (e.g., Haasnoot et al., 2020) that such uncertainty should not preclude decisions on coastal adaptation, since the do-nothing option may lead to larger mid/long-term impacts and costs, further exceeding what could be achieved by anticipatory decisions. The required transformation to preserve present coastal systems and facilitate shared coastal futures, should combine biophysical and socio-economic science, often unbalanced in technical assessments, and the aggregation must reflect an ethical dimension that presents error intervals and the limits of the performed analyses. Making the risk and impact estimation more transparent and ethical is considered to be key for avoiding recent past blunders in coastal decision making, where adaptation pathways and particularly their tipping points became controversial subjects that precluded timely decisions. As a result, reactive decision-making or even the “do nothing” option were favored, leading to a steady degradation of coastal systems and increasing risk levels for population and economic/natural assets. A proactive approach, with anticipatory action that incorporates long-term priorities and builds upon robust (science-based) knowledge, should promote a balanced perception by stakeholders and general society, avoiding biased expert decisions or flattening public opinion rather than incorporating it into the knowledge basis for decision making. Such an approach, grounded by ethics, has proved to be a better long-term strategy for sustainable stakeholder cooperation, linked to a level of knowledge-based optimism (Seabright, 1993) that will facilitate a durable engagement.
Recent advances on models and observations (e.g., Sánchez-Arcilla et al., 2021) enable such an anticipatory approach which, however, may be hindered by vested conclusions and implicit error levels that hide a lack of ethics in the sense of promoting results that comply better with the interests of the more powerful stakeholders. Such a lack of ethical basis may erode the optimism necessary for anticipatory action, hampering the development of environmentally friendly and socially shared decisions, explaining why present societies balk at investments or interventions with mid/long-term benefits, and limited short-term returns. Such a short term bias, often accompanied by a too limited environmental responsibility, can be linked to the cumulative effect of limited ethics in environmental assessments, climatic analyses and valuation of coastal assets during the last decades. Promoting an ethical basis that combines short term with long term priorities and is not distorted by powerful stakeholders, will slowly demonstrate the benefits of explicit error intervals and fair decisions under uncertainty, favoring a return to the threshold level of optimism required for anticipatory coastal decisions. Below that threshold level, only short term coastal priorities will be considered, in a societal drive toward lower environmental responsibility, particularly toward future generations. Such a drive should be prevented, since it will severely limit the sustainability of present coastal systems, hampering the legacy of multifarious benefits from healthy coastal zones to future generations. That dangerous evolution should prompt an accelerated introduction of ethics in coastal assessments and adaptation decisions, so that error intervals for hazard and vulnerability estimations are made explicit, generating enough confidence and optimism to preserve coastal values for shared benefits.
Data Availability Statement
The raw data supporting the conclusions of this article can be made available by the authors upon request, without undue reservation (except costs of data recovery).
Author Contributions
AS-A coordinated the manuscript and prepared the approach and data treatment for assessing uncertainty. VG dealt with longshore transport estimations and morphodynamic analyses. CM carried out the damage and vulnerability estimations. IC tackled the lab data analysis and their extrapolation to field conditions. DG-M was responsible for the sustainability and adaptation aspects. JG dealt with the field data processing and probabilistic fitting. All authors contributed to the article and approved the submitted version.
Funding
This article was funded by the Spanish Ministry of Economy and Competitiveness, through the project ECOSISTEMA-BC (Ref.CTM2017-84275-R/AEI-FEDER, UE). In addition, it has benefitted from research carried out in the SAMOA2, EUROSEA (Grant No. H2020-862626) and MARLIT (Grant No EFA344/19 INTERREG POCTEFA) projects. Here, the excellent data set and support from Puertos del Estado should be acknowledged.
Conflict of Interest
The authors declare that the research was conducted in the absence of any commercial or financial relationships that could be construed as a potential conflict of interest.
Publisher’s Note
All claims expressed in this article are solely those of the authors and do not necessarily represent those of their affiliated organizations, or those of the publisher, the editors and the reviewers. Any product that may be evaluated in this article, or claim that may be made by its manufacturer, is not guaranteed or endorsed by the publisher.
Acknowledgments
The authors want to acknowledge the support received as consolidated research group from Generalitat de Catalunya (2017SGR773). The authors also want to acknowledge the financial support from the project mentioned under Funding and the cooperation from the field and lab technicians from LIM/UPC.
References
Armitage, D. R., Plummer, R., Berkes, F., Arthur, R. I., Charles, A., Davidson-Hunt, I. J., et al. (2008). Adaptive co-management for social–ecological complexity. Front. Ecol. Environ. 7:95–102.
Astruc, D., Cazin, S., Cid, E., Eiff, O., Lacaze, L., Robin, P., et al. (2012). A stereoscopic method for rapid monitoring of spatio-temporal evolution of the sand-bed elevation in the swash zone. Coastal Eng. 60, 11–20. doi: 10.1016/j.coastaleng.2011.08.007
Bailard, J. A. (1984). “A simplified model for longshore sediment transport,” in Proceedings of the 19th International Conference on Coastal Engineering (Texas: ASCE), 1454–1470.
Bolaños, R., Jorda, G., Cateura, J., Lopez, J., Puigdefabregas, J., Gomez, J., et al. (2009). The XIOM: 20 years of regional coastal observa-tory in the Spanish Catalan coast. J. Mar. Syst. 77, 237–260. doi: 10.1016/j.jmarsys.2007.12.018
Botero, C., Cristina, P., Marko, T., and Ganiveth, M. (2015). Design of an index for monitoring the environmental quality of tourist beaches from a holistic approach. Ocean Coastal Manag. 108, 65–73. doi: 10.1016/j.ocecoaman.2014.07.017
Cáceres, I., Alsina, J. M., Van der Zanden, J., Van der, A. D., Ribberink, J., and Sánchez-Arcilla, A. (2020). The effect of air bubbles on optical backscatter sensor measurements under plunging breaking waves. Coastal Eng. 159:103721. doi: 10.1016/j.coastaleng.2020.103721
CEDEX (2020). Análisis de los Efectos Provocados por la Borrasca Gloria en el Litoral Mediterráneo Español. Informe Técnico Para La Dirección General de la Costa y del Mar. Madrid: Ministerio para la Transición Ecológica y el Reto Demográfico.
CIIRC (2010). Estat De La Zona Costanera A Catalunya. International Centre for Coastal Resources Research, Barcelona. Available online at https://www.icgc.cat/Administracio-i-empresa/Serveis/Riscos-geologics/Dinamica-de-la-costa/Llibre-verd-de-l-Estat-de-la-zona-costanera-a-Catalunya-2010.
Cooper, J. A. G., and Pilkey, O. H. (2004). Sea-level rise and shoreline retreat: time to abandon the Bruun Rule. Global Planetary Change 43, 157–171. doi: 10.1016/j.gloplacha.2004.07.001
Cooper, J. A. G., and Pilkey, O. H. (2007). Field measurementand quantification of longshore sediment transport: an unattainable goal? Geol. Soc. London Spec. Publ. 274, 37–43. doi: 10.1144/GSL.SP.2007.274.01.05
Davos, C. A. (1998). Sustaining cooperation for coastal sustainability. J. Environ. Manag. 52, 379–387. doi: 10.1006/jema.1998.0186
Dawson, T., Hambly, J., Kelley, A., Lees, W., and Miller, S. (2020). Coastal heritage, global climate change, public engagement, and citizen science. Proc. Natl. Acad. Sci. U.S.A. 117:201912246. doi: 10.1073/pnas.191224611
de Alfonso, M., Lin-Ye, J., García-Valdecasas, J. M., Pérez-Rubio, S., Yolanda, L., Santos-Muñoz, D., et al. (2021). Storm gloria: sea state evolution based on in situ measurements and modeled data and its impact on extreme values. Front. Mar. Sci. 8:646873. doi: 10.3389/fmars.2021.646873
De los Santos, C. B., Krause-Jensen, D., Alcoverro, T., Marbá, N., Duarte, C. M., van Katwijk, M. M., et al. (2019). Recent trend reversal for declining seagrass meadows. Nat. Commun. 10:3356.
Dean, A. J., Church, E. K., Loder, J., Fielding, K. S., and Wilson, K. A. (2018). How do marine and coastal citizen science experiences foster environmental engagement? J. Environ. Manag. 213, 409–416. doi: 10.1016/j.jenvman.2018.02.080
Egozcue, J. P.-G. V., and Ortego, I. (2005). Wave-height hazard analysis in Eastern Coast of Spainbayesian approach using generalized pareto distribution. Adv. Geosci. 2, 25–30. doi: 10.5194/adgeo-2-25-2005
Fromant, G., Hurther, D., van der Zanden, J., van der, D. A., Cáceres, I., O’Donoghue, T., et al. (2019). Wave boundary layer hydrdynamics and sheet flow properties under large-scale plunging-type breaking waves. J. Geophys. Res. Oceans 124, 75–98. doi: 10.1029/2018jc014406
Garcia Sotillo, M., Cerralbo, P., Lorente, P., Grifoll, M., Espino, M., Sánchez-Arcilla, A., et al. (2020). Coastal ocean forecasting in Spanish ports: the SAMOA operational service. J. Operat. Oceanogr. 13, 37–54. doi: 10.1080/1755876X.2019.1606765
Giakoumi, S., McGowan, J. A., Mills, M., Beger, M., Bustamante, R. H., Charles, A. T., et al. (2018). Revisiting “success” and “failure” of marine protected areas: a conservation scientist perspective. Front. Mar. Sci. 5:223.
Goda, Y. (2010). Plotting position estimator for the L-moment method and quantile confidence interval for the GEV, GPA and weibull distribution applied for extreme analysis. Coastal Eng. J. 53, 111–149. doi: 10.1142/s057856341100229x
Gracia, V. (2005). Dinámica Sedimentaria En La Plataforma Interna Del Delta Del Ebro. Ph. D, Thesis. Universitat Politècnica de Catalunya.
Grases, A., Gracia, V., García-León, M., Lin-Ye, J., and Sierra, J. P. (2020). Coastal flooding and erosion under a changing climate: implications at a low-lying coast (Ebro Delta). Water 12:346. doi: 10.3390/w12020346
Haasnoot, M., Kwadijk, J., van Alphen, J., Le Bars, D., van den Hurk1, B., Diermanse, F., et al. (2020). Adaptation to uncertain sea-level rise; how uncertainty in Antarctic mass-loss impacts the coastal adaptation strategy of the Netherlands environ. Res. Lett. 15:034007.
Haasnoot, M., Kwakkel, J. H., Walker, W. E., and ter Maat, J. (2013). Dynamic adaptive policy pathways: a method for crafting robust decisions for a deeply uncertain world. Global Environ. Change 23, 485–498. doi: 10.1016/j.gloenvcha.2012.12.006
Hallermeier, R. J. (1981). A profile zonation for seasonal sand beaches from wave climate. Coastal Eng. 4, 253–277. doi: 10.1016/0378-3839(80)90022-8
Helton-Fauth, W., Gaddis, B., Scott, G., Mumford, M., Devenport, L., Connelly, S., et al. (2003). A new approach to assessing ethical conduct in scientific work. Accountabi. Res. Policies Q.Assurance 10, 205–228. doi: 10.1080/714906104
Hilborn, R., Amoros, R. O., Anderson, C. M., Baum, J. K., and Branch, T. A. (2020). Effective fisheries management instrumental in improving fish stock status. PNAS 117, 2218–2224.
Hugues, S. A. (1993). Physical Models and Laboratory Techniques in Coastal Engineering. Advanced Series on Ocean Engineering 7. Singapore: World Scientific, 588.
Jiménez, J., and Sánchez-Arcilla, A. (1993). Medium-term coastal response at the Ebro delta. Mar. Geol. 114, 1–2. doi: 10.1016/0025-3227(93)90042-T
Kamphuis, J. W. (2002). Alongshore transport of sand in Proceedings of the 28th International Conference on Coastal Engineering (Wales: ASCE), 2478–2490.
Kim, T., Baek, S., Kwon, Y., Lee, J., Cha, S. M., and Kwon, S. (2020). Improved coastal erosion prevention using a hybrid method with an artificial coral reef: large-scale 3D hydraulic experiment. Water 12:2801. doi: 10.3390/w12102801
Knowlton, N. (2021). Ocean optimism: moving beyond the obituaries in marine conservation. Ann. Rev. Mar. Sci. 13, 479–499. doi: 10.1146/annurev-marine-040220-101608
Kraus, N. C. (1989). Beach change modeling and the coastal planning process. Proc. Coastal Zone 89, 553–567.
Kraus, N. C., and Rosati, J. D. (1998). Estimation of Uncertainty in Coastal-Sediment Budgets At Inlets, Coastal Engineering Technical Note CETN-IV-16, U.S. Army Engineer Waterways Experiment Station. Vicksburg, MS: Coastal and Hydraulics laboratory.
Ledgerwood, A., and Boydstun, A. E. (2014). Sticky prospects: loss frames are cognitively stickier than gain frames. J. Exp. Psychol. 143, 376–385. doi: 10.1037/a0032310
Lin-Ye, J., García-León, M., Gràcia, V., Ortego, M. I., Lionello, P., Conte, D., et al. (2020). Modeling of future extreme storm surges at the NW mediterranean Coast (Spain). Water 12:472. doi: 10.3390/w12020472
Lorente, P., Jue, L., García-León, M., Reyes, E., Fernandes, M., Garcia Sotillo, M., et al. (2021). On the performance of high frequency radar in the Western Mediterranean during the record-breaking storm Gloria. Front. Mar. Sci. 8:645762. doi: 10.3389/fmars.2021.645762
Lucrezi, S., Saayman, M., and Van der Merwe, P. (2016). An assessment tool for sandy beaches: a case study for integrating beach description, human dimension, and economic factors to identify priority management issues. Ocean Coastal Manag. 121, 1–22. doi: 10.1016/j.ocecoaman.2015.12.003
Luisetti, T., Turner, R. K., Jickells, T., Andrews, J., Elliott, M., Schaafsma, M., et al. (2014). Coastal zone ecosystem services: from science to values and decision making; a case study. Sci. Total Environ. 493, 682–693. doi: 10.1016/j.scitotenv.2014.05.099
McLaughlin, S., and Cooper, J. A. G. (2010). A multi-scale coastal vulnerability index: a tool for coastal managers? Environ. Hazards 9, 233–248. doi: 10.3763/ehaz.2010.0052
Mumford, M. D., Murphy, S. T., Connelly, S., Hill, J. H., Antes, A. L., Brown, R. P., et al. (2007). Environmental influences on ethical decision making: climate and environmental predictors of research integrity. Ethics Behavior 17, 337–366. doi: 10.1080/10508420701519510
Neumann, B., Vafeidis, A. T., Zimmermann, J., and Nicholls, R. J. (2015). Future coastal population growth and exposure to sea-level rise and coastal floodinga global assessment. PLoS One 10:e0118571. doi: 10.1371/journal.pone.0118571
Nicolodi, J. L., Asmus, M. L., Polette, M., Turra, A., Seifert, C. A., Stori, F. T., et al. (2021). Critical gaps in the implementation of coastal ecological and economic zoning persist after 30 years of the Brazilian coastal management policy. Mar. Policy 128:104470. doi: 10.1016/j.marpol.2021.104470
Oliveira, T. C. A., Sánchez-Arcilla, A., and Gironella, X. (2012). Simulation of wave overtopping of maritime structures in a numerical wave flume. J. Appl. Math. 19:246146. doi: 10.1155/2012/246146
Pérez, B., García León, M., García-Valdecasas, J., Clementi, E., Mösso, C., Pérez, S., et al. (2021). Understanding sea level processes during western mediterranean storm gloria. Front. Mar. Sci. 8:647437. doi: 10.3389/fmars.2021.647437
Petruzzelli, V., Gracia Garcia, V., Gironella Cobos, F. X., and Felice Petrillo, A. (2013). On the use of lightweight materials in small-scale mobile bed physical models. J. Coastal Res. 65, 1575–1580. doi: 10.2112/SI65-266.1
Plummer, R. (2009). The adaptive co-management process: an initial synthesis of representative models and influential variables. Ecol. Soc. 14:24.
Possingham, H. P., Bode, M., and Klein, C. J. (2015). Optimal conservation outcomes require both restoration and protection. PLoS Biol. 13:e1002052. doi: 10.1371/journal.pbio.1002052
Potts, T., Burdon, D., Jackson, E., Atkins, J. P., Saunders, J., Hastings, E., et al. (2014). Do marine protected areas deliver flows of ecosystem services to support human welfare? Mar. Policy 44, 139–148. doi: 10.1016/j.marpol.2013.08.011
Puleo, J. A., Johnson, R. V., Butt, T., Kooney, T. N., and Holland, K. T. (2006). The effect of air bubbles on optical backscatter sensors. Mar. Geol. 230, 87–97. doi: 10.1016/j.margeo.2006.04.008
Sánchez-Arcilla, A., García-León, M., Gracia, V., Devoy, R., Stanica, A., and Gault, J. (2016). Managing coastal environments under climate change: pathways to adaptation. Sci. Total Environ. 572, 1336–1352. doi: 10.1016/j.scitotenv.2016.01.124
Sánchez-Arcilla, A., Gomez, J., Egozcue, J. J., Ortego, M. I., Galiatsatou, P., and Prinos, P. (2008a). Extremes from scarce data: the role of bayesian and scaling techniques in reducing uncertainty. J. Hydraulic Res. 46, 224–234. doi: 10.1080/00221686.2008.9521956
Sánchez-Arcilla, A., Gonzalez-Marco, D., Doorn, N., and Kortenhaus, A. (2008b). Extreme values for coastal, estuarine, and riverine environments. J. Hydraulic Res. 46, 183–190. doi: 10.1080/00221686.2008.9521953
Sánchez-Arcilla, A., Staneva, J., Cavaleri, L., Badger, M., Bidlot, J. R., Sorensen, J. V., et al. (2021). CMEMS-based coastal analyses: conditioning, coupling and limits for applications. Front. Mar. Sci. 8:604741. doi: 10.3389/fmars.2021.604741
Schoonees, J. S., and Theron, A. K. (1993). Review of the field-data base for longshore sediment transport. Coastal Eng. 19, 1–25.
Seabright, P. (1993). Managing local commons: theoretical issues in incentive design. J. Econ. Perspect. 7, 113–134. doi: 10.1257/jep.7.4.113
Smith, E. R., Wang, P., Ebersole, B. A., and Zhang, J. (2009). Dependence of total longshore sediment transport rates on incident wave parameters and breaker type. J. Coastal Res. 25, 675–683. doi: 10.2112/07-0919.1
Soulsby (1997). Dynamics of Marine Sands: A Manual for Practical Applications. London: Thomas Telford.
Stive, M. J. F., Aarninkhof, S. J. C., Hamm, L., Hanson, H., Larson, M., Winjberg, K., et al. (2002). Variability of shore and shoreline evolution. Coastal Eng. 47, 211–235. doi: 10.1016/s0378-3839(02)00126-6
Taylor, J. R. (1997). An Introduction to Error Analysis, 2nd Edn. Sausalito, CA: University Science Books, 327.
Thieler, E. R., Pilkey, O. H. Jr., Young, R. S., Bush, D. M., and Chai, F. (2000). The use of mathematical models to predict beach behavior for US coastal engineering: a critical review. J. Coastal Res. 16, 48–70.
Ting, F. C. K., and Reimnitz, J. (2015). Volumetric velocity measurements of turbulent coherent structures induced by plunging regular waves. Coastal Eng. 104, 93–112. doi: 10.1016/j.coastaleng.2015.07.002
Wang, P., and Kraus, N. C. (1999). Longshore sediment transport rate measured by short-term impoundment. J. Waterway Port Coastal Ocean Eng. ASCE 125:118. doi: 10.1061/(asce)0733-950x(1999)125:3(118)
Wang, P., Kraus, N. C., and Davis, R. A. Jr. (1998). Total rate of longshore sediment transport in the surf zone: field measurements and empirical predictions. J. Coastal Res. 14, 269–283.
Keywords: coastal, adaptation, uncertainty, data, morphodynamics, risk, ethics, optimism
Citation: Sánchez-Arcilla A, Gracia V, Mösso C, Cáceres I, González-Marco D and Gómez J (2021) Coastal Adaptation and Uncertainties: The Need of Ethics for a Shared Coastal Future. Front. Mar. Sci. 8:717781. doi: 10.3389/fmars.2021.717781
Received: 31 May 2021; Accepted: 09 August 2021;
Published: 14 September 2021.
Edited by:
Angel Borja, Technological Center Expert in Marine and Food Innovation (AZTI), SpainCopyright © 2021 Sánchez-Arcilla, Gracia, Mösso, Cáceres, González-Marco and Gómez. This is an open-access article distributed under the terms of the Creative Commons Attribution License (CC BY). The use, distribution or reproduction in other forums is permitted, provided the original author(s) and the copyright owner(s) are credited and that the original publication in this journal is cited, in accordance with accepted academic practice. No use, distribution or reproduction is permitted which does not comply with these terms.
*Correspondence: Agustín Sánchez-Arcilla, agustin.arcilla@upc.edu