Detection of Ecological Thresholds and Selection of Indicator Taxa for Epibenthic Communities Exposed to Multiple Pressures
 Laurie Isabel
 David Beauchesne
 Chris McKindsey
 Philippe Archambault
- 1ArcticNet, Québec-Océan, Takuvik, Département de Biologie, Université Laval, Québec, QC, Canada
- 2Fisheries and Oceans Canada, Maurice Lamontagne Institute, Mont-Joli, QC, Canada
The estuary and the Gulf of St. Lawrence (EGSL), eastern Canada form a vast inland sea that is subjected to numerous anthropogenic pressures. Management tools are needed to detect and quantify their effect on benthic communities. The aims of this study are to analyze the spatial distribution of epibenthic communities in the EGSL and quantify the impact of important pressures on them to identify indicator taxa. Epibenthic communities were sampled at 1314 EGSL sites between 2011 and 2018 by bottom trawling. Cluster analyses revealed the presence of six distinct epibenthic communities that seem to be strongly influenced by oxygen concentration. Threshold analyses confirm that oxygen is an important predictor of epibenthic community composition and distribution. A major oxygen threshold is observed around 50–100 μmol O2 L–1, resulting in a shift of community type. At these concentrations and below, opportunistic taxa dominate the community while sensitive taxa are absent or present at very low abundance. Biomass of the latter only starts to increase when oxygen concentrations reach 150 μmol O2 L–1. The species Actinostola callosa, Actinauge cristata, Ctenodiscus crispatus, and Brisaster fragilis were identified as good indicators for detecting this impact threshold forepibenthic communities. This study provides threshold-based indicator species that help to establish and monitor the ecological state of epibenthic communities in a marine ecosystem exposed to multiple pressures.
Introduction
Marine ecosystems are changing faster than ever, causing profound changes to communities of living organisms (Walther et al., 2002; Myers and Worm, 2003; Worm et al., 2006). Increasing types and intensities of human activities over the last century have been identified as the main cause for these rapid changes (Halpern et al., 2015; Jouffray et al., 2020). Increasing human activities concomitantly increases pressures that may affect marine species. Moreover, Anthropocene-related climate changes are occurring and interacting with other long-term trends (Hoegh-Guldberg and Bruno, 2010). Together, these pressures dominate the human footprint on marine ecosystems, with the potential for significant overlap between pressures (Halpern et al., 2008, 2015). Overlaps may lead to biological interactions and non-linear effects that are difficult to predict and interpret (Crain et al., 2008; Côté et al., 2016; Carrier-Belleau et al., 2021). Cumulative or not, increasing numbers of pressures on marine ecosystems makes ecological management increasingly challenging. Although the number and types of pressures have increased tremendously in recent decades, little is known about which are having the greatest impacts on communities and how they interact over space and time (Halpern et al., 2015).
Benthic communities are likely to be greatly affected by these environmental changes as they are located at the convergence of these pressures—the bottom. Moreover, many benthic taxa are sessile or have limited mobility, and therefore have limited ability to avoid pressures that can reduce their chances of reproduction and survival (Dauer, 1993; Weisberg et al., 1997). Benthic communities play a major role in marine ecosystems and their degradation could affect the entire ecosystem. Several taxa, such as corals, sea pens, and sponges, form biogenic structures that create habitats that serve as protection for benthic and demersal taxa (Buhl-Mortensen et al., 2010). Benthic organisms living in sediments also play an important role in the transport and circulation of water and particles through sediments and at the water-sediment interface (Rhoads, 1974; Aller, 1982). Benthic communities are also involved in biogeochemical cycles through feeding by filtering taxa such as bivalves, which play a crucial role in benthic-pelagic coupling (Newell, 2004).
The need to develop tools to capture the complexity of ecological responses to pressures has become essential for environmental management (Landres et al., 1988; Groom et al., 1997). Ecological thresholds are particularly useful in ecosystem management as they represent transition points where small changes to ecological conditions could greatly impact the diversity, structure, and function of marine communities (Toms and Lesperance, 2003; Huggett, 2005; Groffman et al., 2006; Brenden et al., 2008; Andersen et al., 2009; Sonderegger et al., 2009; Baker and King, 2010). Incorporating thresholds in ecological management can further address the increased non-linear responses (Kelly et al., 2014). Such rapid changes could generate undesirable shifts in ecological conditions, resulting in drastic impacts on communities. Indicators able to detect these thresholds can be developed and serve as a proxy of these tipping points. Indicators are quantifiable measures of an ecological parameter that can be followed over time to establish the ecological state (Jamieson et al., 2001; Large et al., 2015). Identifying relevant indicators or major ecological thresholds has been shown to strengthen ecological monitoring and assessment programs (Suding and Hobbs, 2009; Samhouri et al., 2011; Large et al., 2015).
The estuary and Gulf of St. Lawrence (EGSL) in eastern Canada is an inland sea characterized by heterogeneic oceanographic and geological conditions, and high productivity (El-Sabh and Silverberg, 1990; Therriault, 1991; Benoît et al., 2012; Moritz et al., 2013). The EGSL has attracted human settlement for centuries to the benefit of the socio-economic development of its adjacent lands (Alexander et al., 2010). Combined with global changes, this intense human use has concomitantly exposed this ecosystem to multiple environmental changes. Like many inland seas, the EGSL has internal dynamics that restrict flushing and are subject to a convergence of pressures from land-based and marine disturbances as well as climatic changes (MacCraken et al., 2008; Beauchesne et al., 2020). Deep waters of the EGSL are warming, reaching new temperature records in 2019 due to altered ocean circulation dynamics (Claret et al., 2018; Galbraith et al., 2020). Increasing temperatures has also decreased bottom oxygen levels (Poitevin et al., 2019). Indeed, oxygen concentration has decreased by more than half the 1930 value over the last century (Gilbert et al., 2005). While two-thirds of the oxygen depletion observed can be attributed to this altered ocean circulation, the remaining third is a result of higher bacterial activity due to increased particulate matter in the water column and sediments (Lehmann et al., 2009). Land-based human activities are responsible for the increased organic matter inputs in the EGSL (Gilbert et al., 2005, 2007; Thibodeau et al., 2006). A permanent hypoxic zone is now present in the estuary (Gilbert et al., 2007). These changes have also resulted in acidification, with the pH of bottom waters dropping by 0.2–0.3 over the past 75 years (Mucci et al., 2011).
Several studies have examined the impacts of environmental pressures on the distribution of benthic communities in the EGSL (Bourget et al., 2003; Lévesque, 2009; Belley et al., 2010; Moritz et al., 2013, 2015). Current trawl fisheries in the EGSL appear to have very little impact on epibenthic communities (Moritz et al., 2015). Depth, bottom current, temperature, and oxygen saturation have been shown to influence the distribution of benthic communities. Canonical analyses suggested a strong relationship between oxygen concentrations and benthic community structure (Lévesque, 2009). A strong relationship between oxygen and the level of bioturbation traces on the seafloor has also been observed (Belley et al., 2010), suggesting that the infaunal community may also be affected by hypoxia in the estuary. Similar taxa richness was observed between hypoxic and normoxic sites, which was likely the result of different community compositions along the studied oxygen gradient. Notwithstanding these studies, the quantitative impacts of pressures on benthic communities remain largely unknown. To this end, this study explores the spatial variation of EGSL epibenthic communities, identifies thresholds of community composition, and further quantifies the impact of oxygen to select indicator species. The hypothesis is that sensitive and tolerant epibenthic taxa will be negatively and neutrally or positively affected by the presence of pressures, respectively. It is expected that the type and intensity of pressures will vary spatially in the EGSL with corresponding effects on benthic communities and that ecologically relevant thresholds may be identified.
Materials and Methods
Study Area
The EGSL covers an area of 116,115 km2, excluding the coastal area, with depth varying between 37 and 550 m (Figure 1; Bourdages et al., 2018). Its topography includes three deep channels: the Laurentian, Anticosti, and Esquiman channels (Saucier et al., 2003). The seabed topography of this region is complex and strongly influences water circulation (Dufour and Ouellet, 2007). Waters are stratified with two layers during winter and spring and three layers in the summer and fall (Galbraith, 2006). Deep waters are formed by two water masses: the Labrador Current, which is cold and well-oxygenated and enters the Gulf through Strait of Belle Isle to the north, and Atlantic continental shelf water, which is warmer with less dissolved oxygen, entering the Gulf from the east through Cabot Strait (Galbraith et al., 2019).
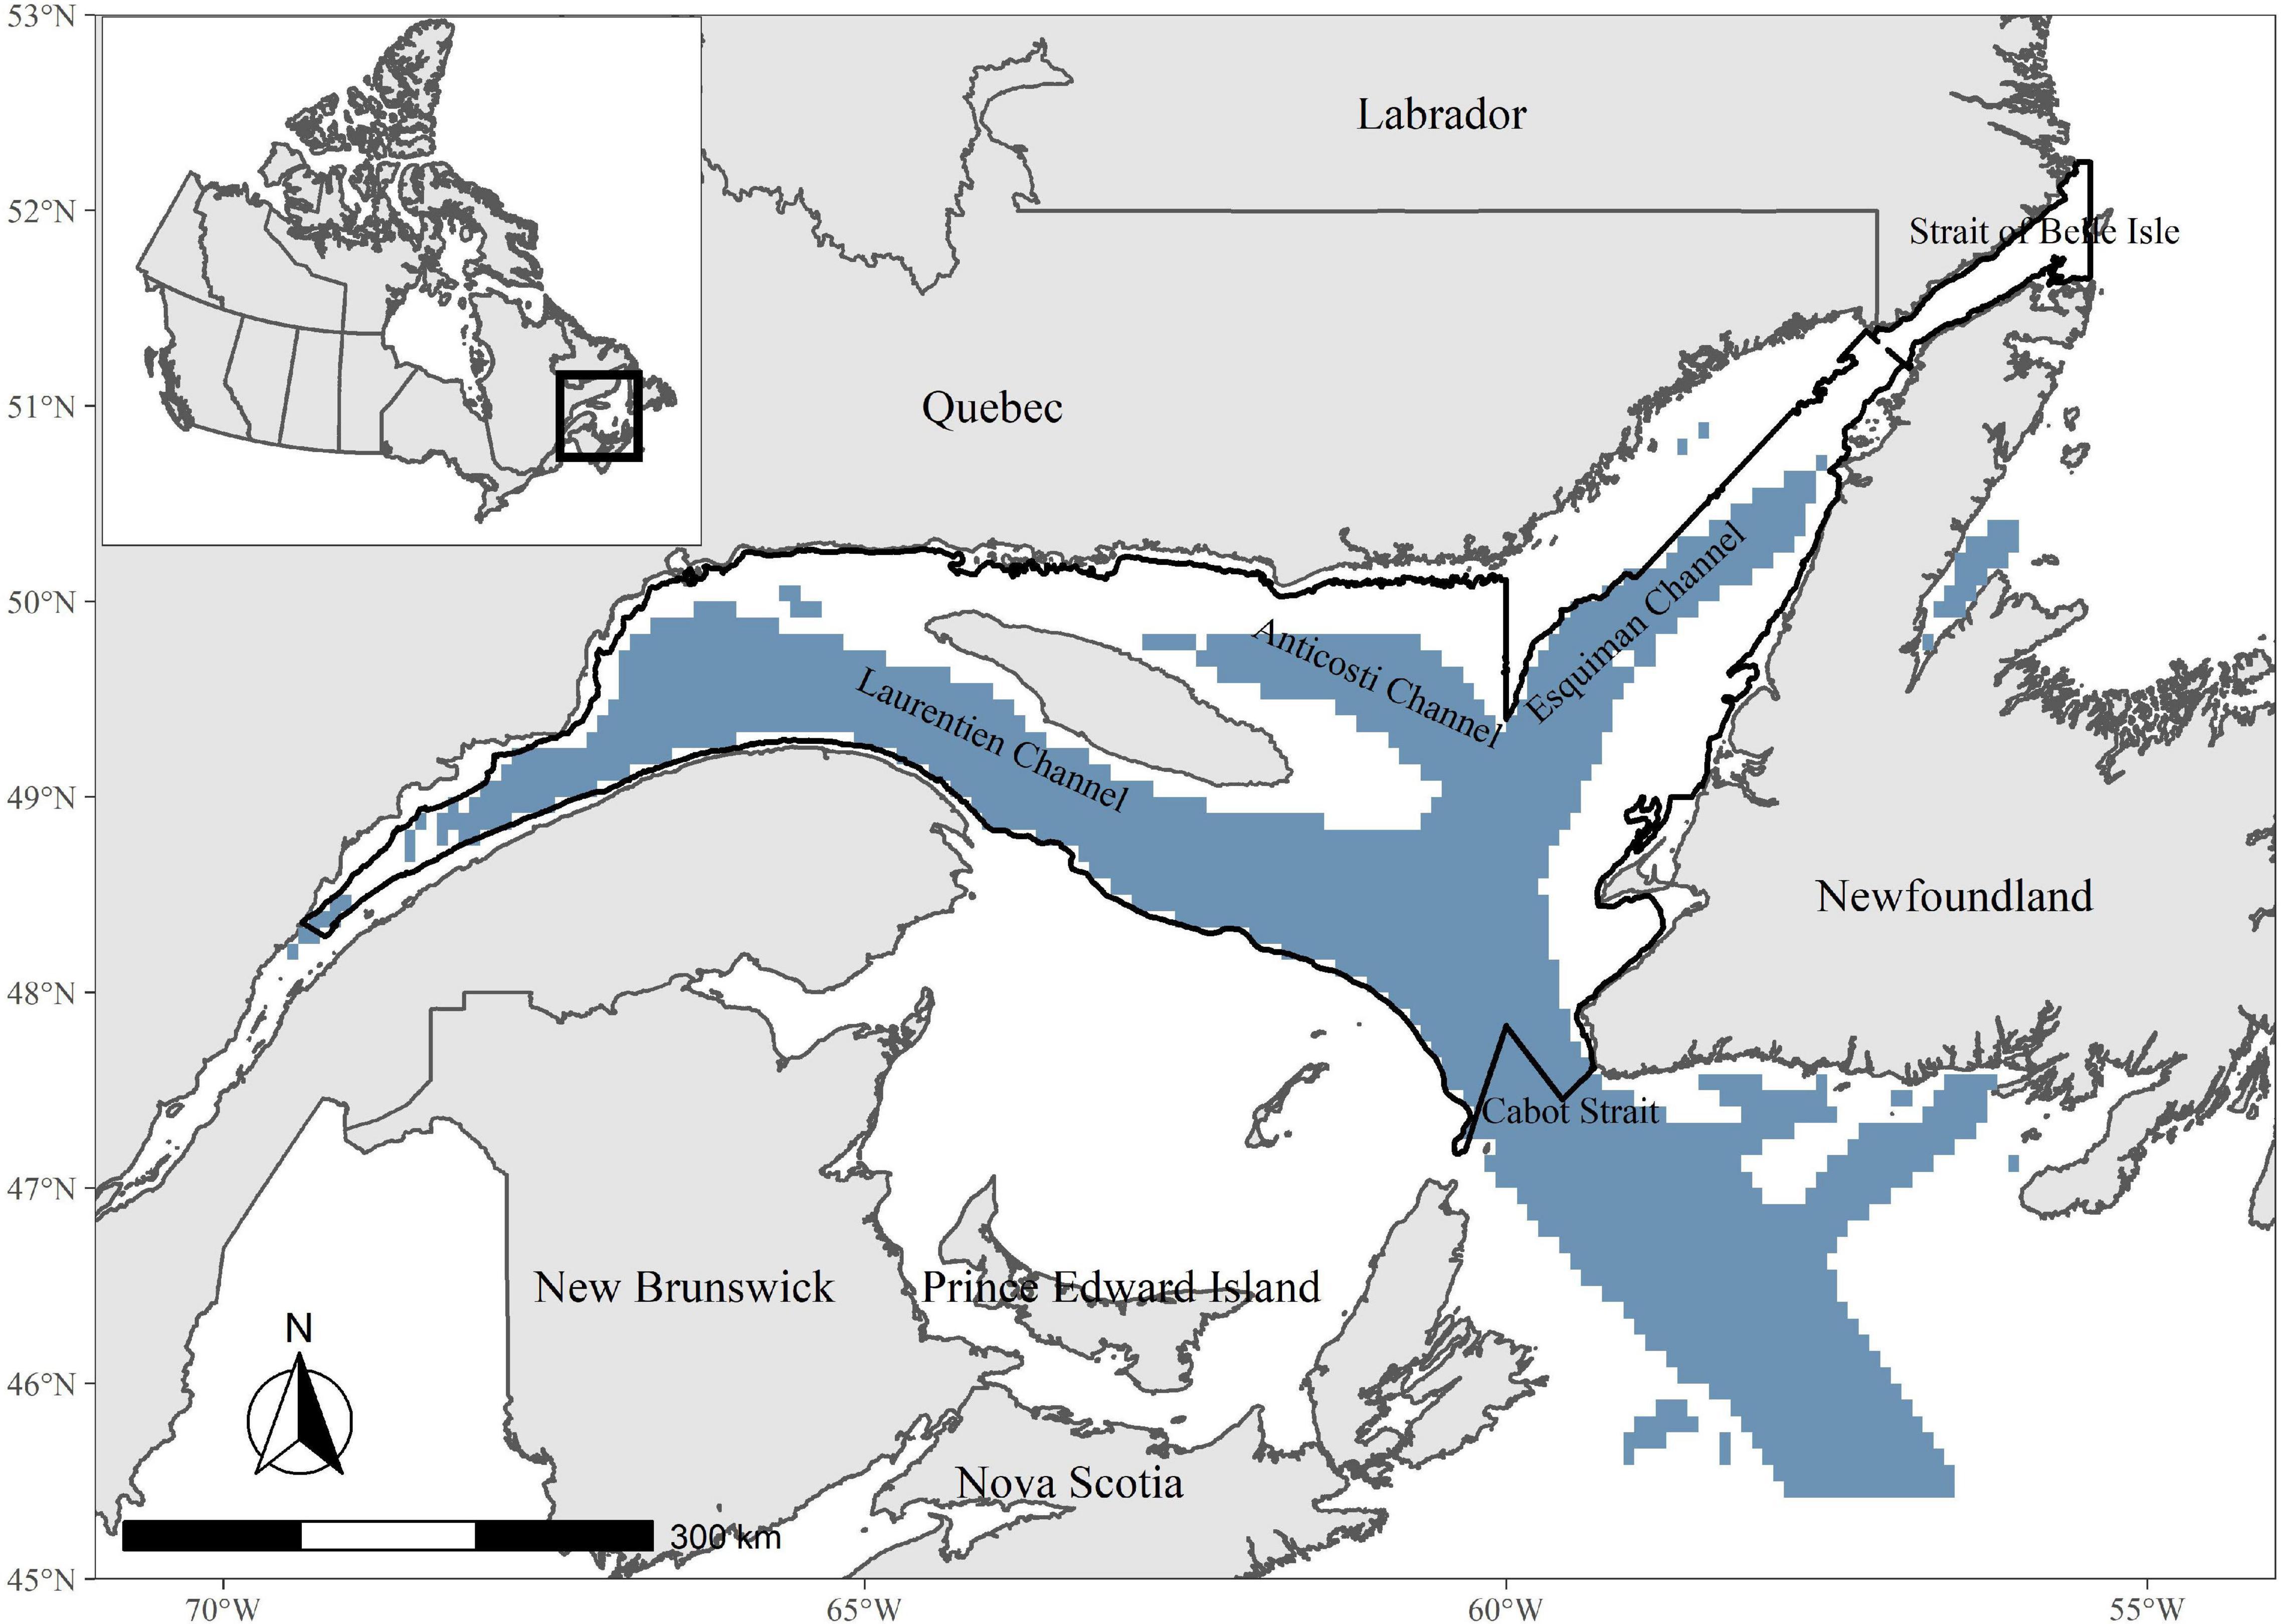
Figure 1. Location of sampling sites for years 2011–2018 covering the Estuary and Gulf of St. Lawrence (EGSL). Deep channels are shown in blue (depth > 200 m). The study area is indicated by the black contour.
Benthic Data
Benthic taxa data were collected onboard the CCGS Teleost during the Fisheries and Ocean Canada multidisciplinary research survey, each August (Moritz et al., 2013; Bourdages et al., 2018). The data used in the present study covers the years 2011–2018. Sampling was done within depth-specific strata using a random sampling design (Gagnon, 1991). Samples were collected by bottom trawling with a four-sided Campelen 1800 shrimp trawl equipped with Rockhopper footgear (Walsh and McCallum, 1997). The trawl had a knotless nylon lining with 12.7 mm mesh size, allowing most epibenthic macroinvertebrates to be collected (Bourdages et al., 2018). Trawling lasted around 15 min but was shorter if a very large amount of fish was expected, to prevent overloading the trawl net or if the bottom was rocky.
Catches were sorted at each sampling site and benthic taxa identified to the lowest possible taxonomic level. Sorted invertebrates were then photographed, one taxon at a time, weighed, and counted to obtain population density and biomass. When > 30 individuals of a given taxon were collected, the mass of the total capture and of 30 random individuals was recorded to estimate the total number of individuals collected. Since trawl lengths and times were not standardized, biomass estimates were standardized relative to the catch effort (catch per unit effort (CPUE)—kg.km–2).
Environmental Data
Data on environmental predictors were obtained from two datasets: the fisheries multidisciplinary research survey and eDrivers, an open-knowledge data platform (Beauchesne et al., 2020). For the fisheries survey data, an SBE19plusTM CTD mounted on the outside of the top of the trawl recorded temperature, salinity, and oxygen concentration on the bottom during the trawling at each site (Bourdages et al., 2018). Depth was also recorded at the beginning and end of each trawl to provide a mean for each site. The second set of predictors was extracted from the eDrivers platform for EGSL environmental data (Beauchesne et al., 2020). Selected drivers were aragonite (indicating acidification) and positive temperature anomalies (posAnom), as described in Galbraith et al. (2019). Data on fishing intensity were created from raw data (fishing vessel log book) provided by DFO for eDrivers (DFO, 2016; Beauchesne et al., 2020). Intensities of demersal non-destructive high-by-catch fisheries (DNH) and demersal destructive fisheries (DD) are expressed as the number of fishing events in a 1 km2 area in a year. Acidification and posAnom were normalized (0–1) to obtain an index of the intensity for each driver.
Data Analysis
Epibenthic Community Structure
Sites were classified based on taxonomic composition similarity using hierarchical cluster analysis performed using Ward’s hierarchical agglomeration method to identify compact, spherical clusters (Ward, 1963). The analysis was applied to a Bray-Curtis dissimilarity matrix of taxa biomass to define distinct communities based on co-distributions of individual taxa (Bray and Curtis, 1957). Data on shrimp biomass were not included in the analyses. Although shrimps are considered as “benthic” organisms, they are not permanently located on the seabed, undertaking vertical migrations, and thus limiting their link to the benthic habitat (DFO, 2002; Savenkoff et al., 2017). Indeed, only 30% of shrimp diets come from the benthos with the remaining 70% originating from pelagic food webs (Bundy et al., 2000). Moreover, northern shrimp Pandalus borealis represents 75% of the invertebrate catch of all EGSL surveys and its inclusion in the analyses could mask trends for other epibenthic taxa (Savenkoff et al., 2017). All data analyses were done using R version 3.5.1. The vegan package was used for species clustering (Oksanen et al., 2019).
Environmental Regimes
Clustering of environmental variables was done to establish if different environmental regimes existed through the study area and could explain the clustering of benthic communities. The similarity of sites in terms of environmental predictors was evaluated using k-means clustering to group sites characterized by similar environmental conditions. This clustering method works by creating k numbers of clusters with the aim to minimize the sum of residual sums-of-squares (Legendre and Legendre, 2012). The number of clusters selected was defined using the elbow method, an optimization method to select the smallest number of clusters which account for the largest proportion of variation in the data (Bholowalia and Kumar, 2014). This method consists of plotting the explained variation as a function of the number of clusters. To select the number of clusters to use, one picks the elbow of the curve. The function kmeans from the stats package was used for the environmental clustering (R Core Team, 2018).
Random Forest and Gradient Forest
Thresholds of epibenthic community assemblage were evaluated with a gradient forest analysis using the “gradientForest” package in R (Ellis et al., 2012). A gradient forest (GF) is created by combining multiple random forests (RF) to establish the response of the whole community to environmental gradients (Ellis et al., 2012). It is an automated learning algorithm used for classification and regression problems based on Breiman’s algorithm (Breiman, 2001). The RF algorithm works by combining several (n) decision trees, each created by recursive data partitioning, with bootstrap techniques to minimize the variance of a single model. Each tree is created from a bootstrapped sample of the whole dataset. At each node during the data partitioning, a fixed number of predictors (mtry) is randomly selected from all available predictors. GF combines the cross-validated R2 and accuracy importance measures of every taxa’s RF to give a global R2-value. The overall result is a monotonic function for every predictor representing the turnover of taxonomic composition along the gradient of a predictor. The analysis identified where community composition changes along predictor gradients. RF models were run for taxa individually to determine the directionality of their responses to variation in oxygen concentration with partial dependence plots; this was done solely for taxa with a strong reaction at the previously identified thresholds (from GF models). Partial dependence plots use the biomass regression function generated by each random forest model to show trends in biomass of a taxon as a function of oxygen concentration, while other predictors are kept at their average observed value (Murillo et al., 2016). Models were built with the “randomForest” package in R (Liaw and Wiener, 2002). Default parameters were used except for mtry, which was tuned for each taxon, and ntree was fixed at 150 trees following Oshiro et al. (2012). RF and GF have many advantages for modeling taxa and community distributions. They can identify which predictors are most important for the observed patterns as multiple trees are grown with different combinations of predictors; this is very useful for ecosystems exposed to multiple pressures. In addition, there are no a priori distributional assumptions about the frequency of response variables, as opposed to other methods such as generalized linear models or generalized additive models. RF and its extensions are also good for handling non-linear patterns between predictors and the response variable (Breiman, 2001).
Indicator Taxa
Indicator taxa that characterized groups of sites were identified using the IndVal method (Dufrêne and Legendre, 1997). This approach identifies indicator taxa by combining taxon abundance and frequency of occurrence to create an index representing the association of taxa to groups identified with the Ward clustering method (see section “Epibenthic Community Structure”). Indicator taxa are useful to detect taxa that are characteristic to specific habitats and correspond to a certain set of environmental conditions (Dufrêne and Legendre, 1997; De Cáceres et al., 2010; Legendre and Legendre, 2012). In this analysis, an indicator value is calculated for each taxon in each community cluster based on their specificity and fidelity to each cluster. Specificity measures if a taxon is distributed across many groups (low specificity) or only present in the group of interest (high specificity); fidelity measures if a taxon is present in all (high fidelity) or few (low fidelity) sites within the group of interest. The maximal indicator taxon, having an indicator value of 1, would be found exclusively in one group and would be present at all the sites of this group.
Results
Community Structure and Distribution
Cluster analysis of the taxa matrix revealed six, partially spatially segregated, communities in the EGSL (Figure 2). The six most dominant taxa of each community in terms of biomass and taxa richness of each community are presented in Table 1. The first community type was found almost exclusively in the St. Lawrence estuary and is composed (biomass and presence) mainly of the anemone Actinostola callosa, the sea urchin Brisaster fragilis, and the sea star Ctenodiscus crispatus. We also found a large biomass of snow crab Chionoecetes opilio and the anemone Actinauge cristata. The average total mass of invertebrates was 2,190 kg.km–2 and the highest mass captured was 18,905 kg.km–2. It was the second most diverse community in terms of the mean number of taxa found at a single site but the least diverse in terms of the total number of taxa recorded across all sites.
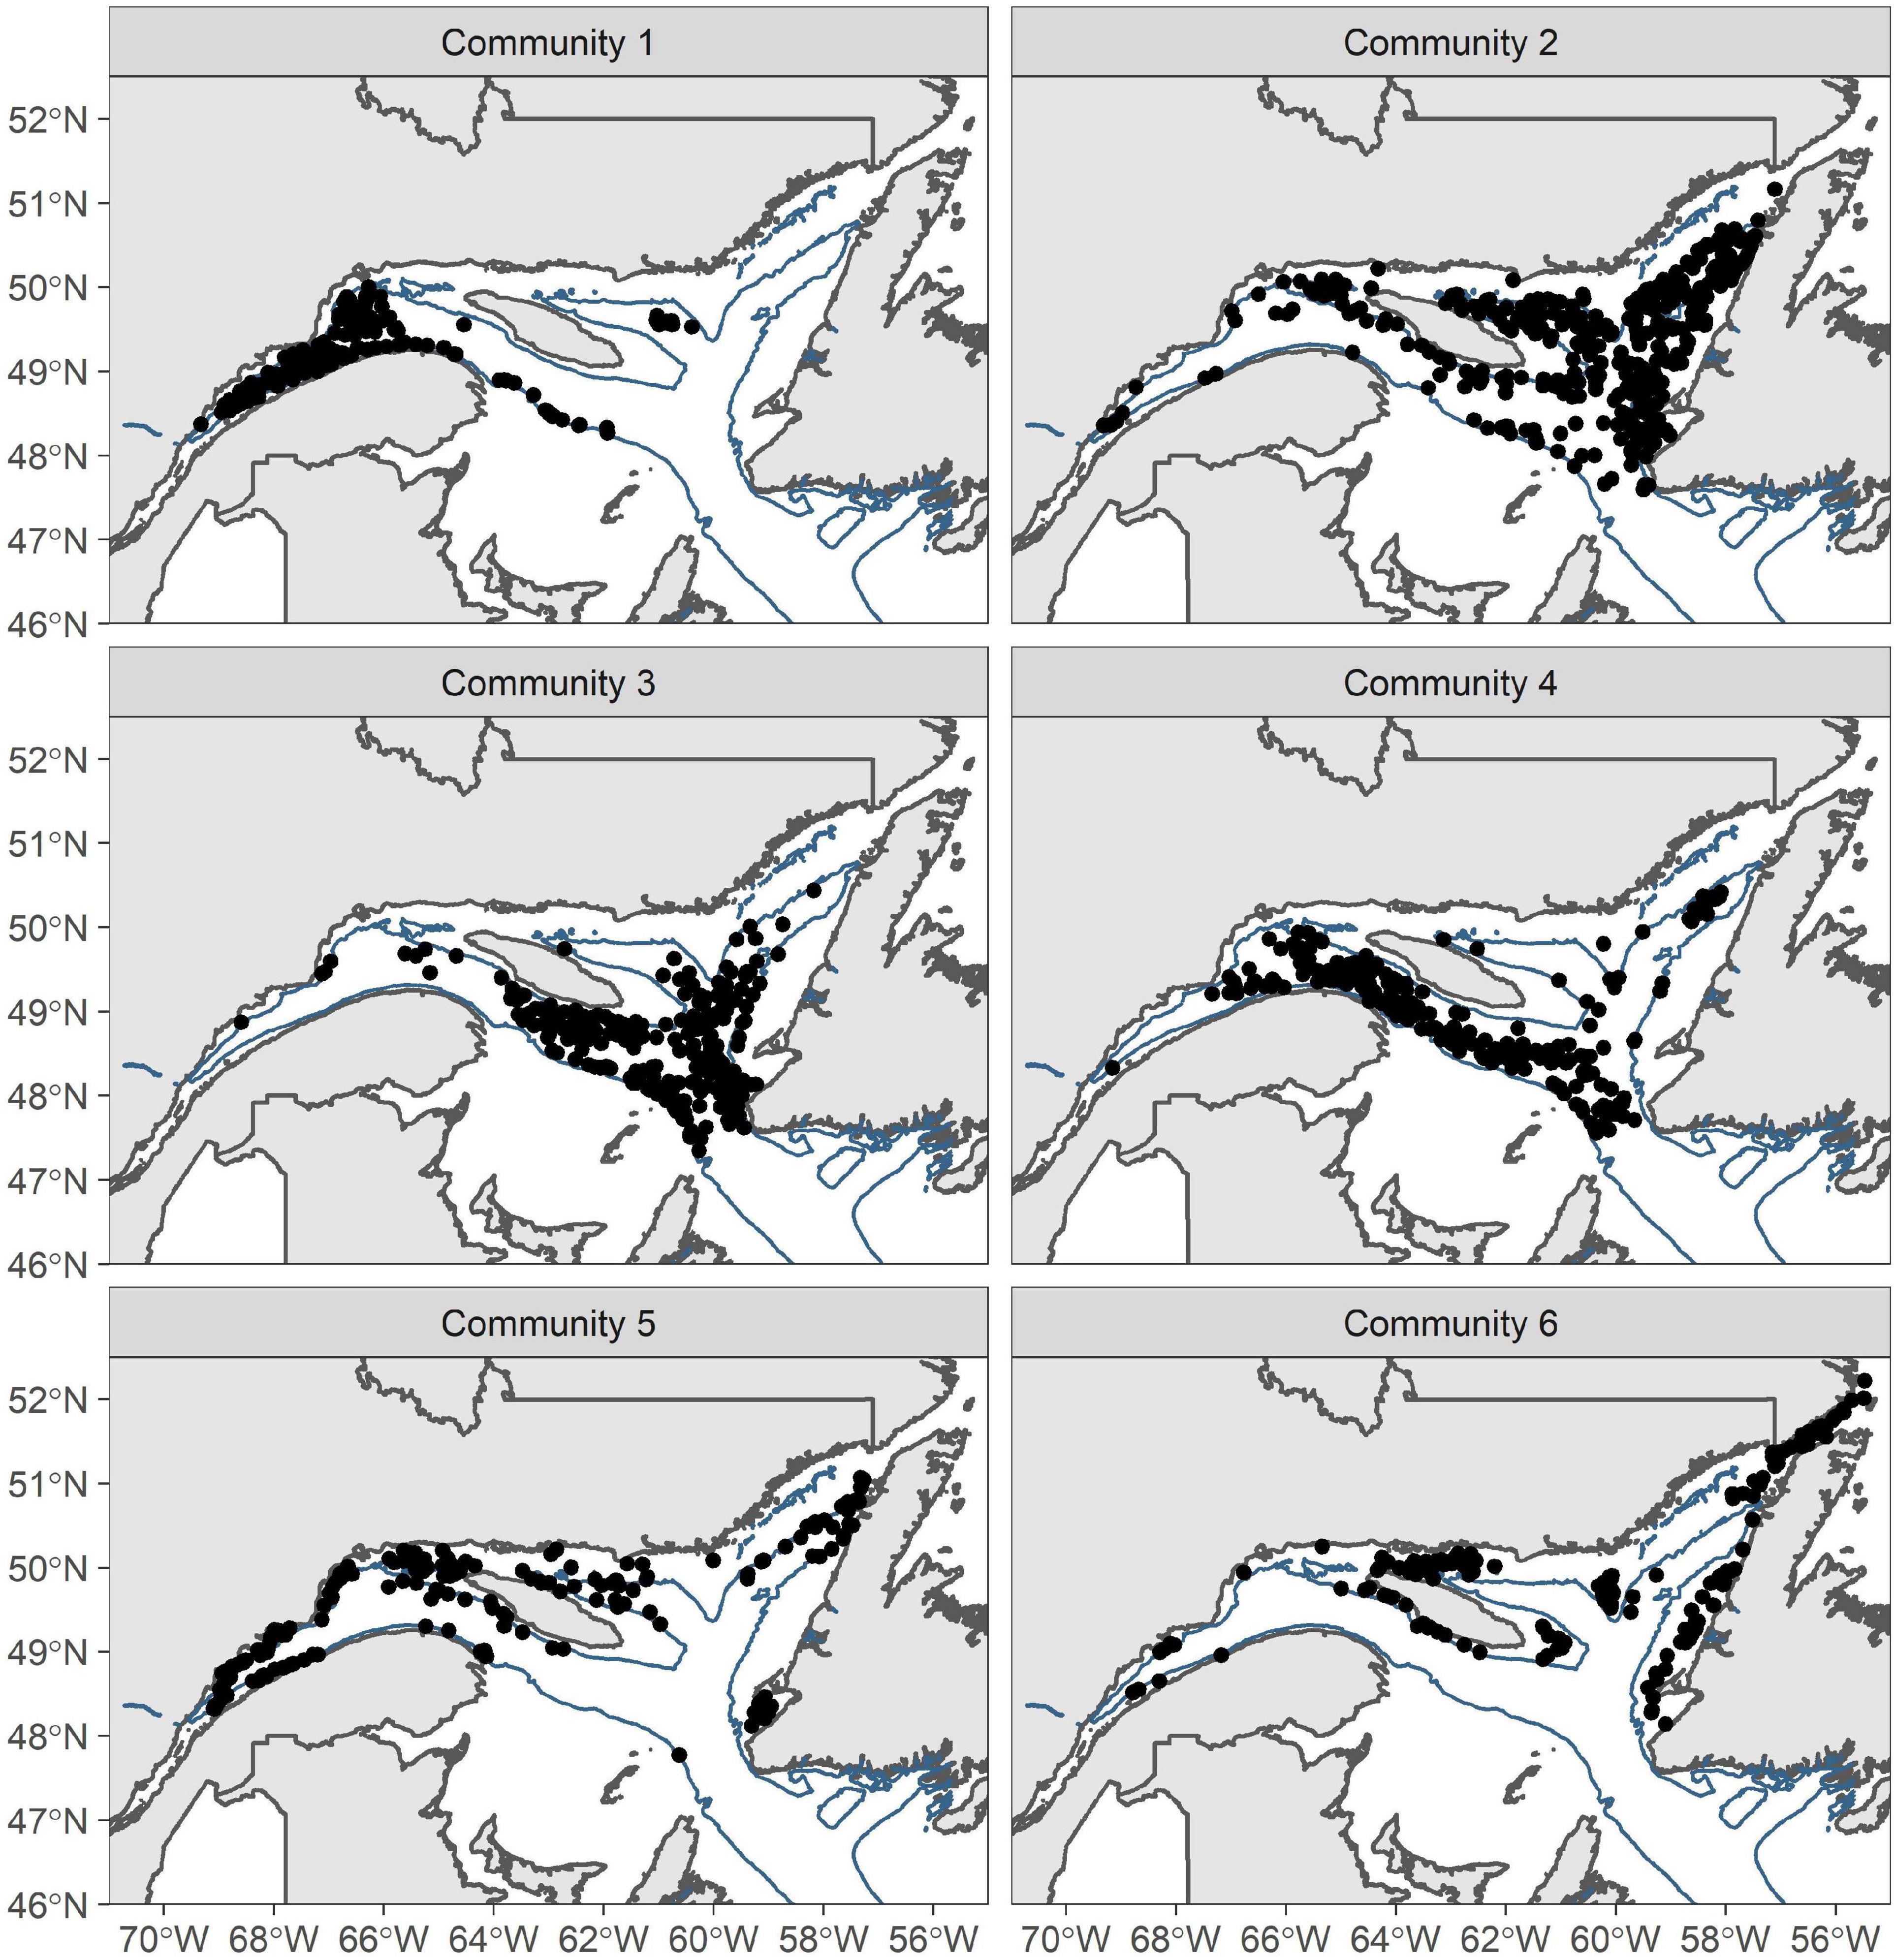
Figure 2. Location of the six epibenthic community types in the Estuary and Gulf of St. Lawrence identified by hierarchical cluster analysis with biomass data collected from 2011 to 2018. Deep channels are shown in blue (depth > 200 m).
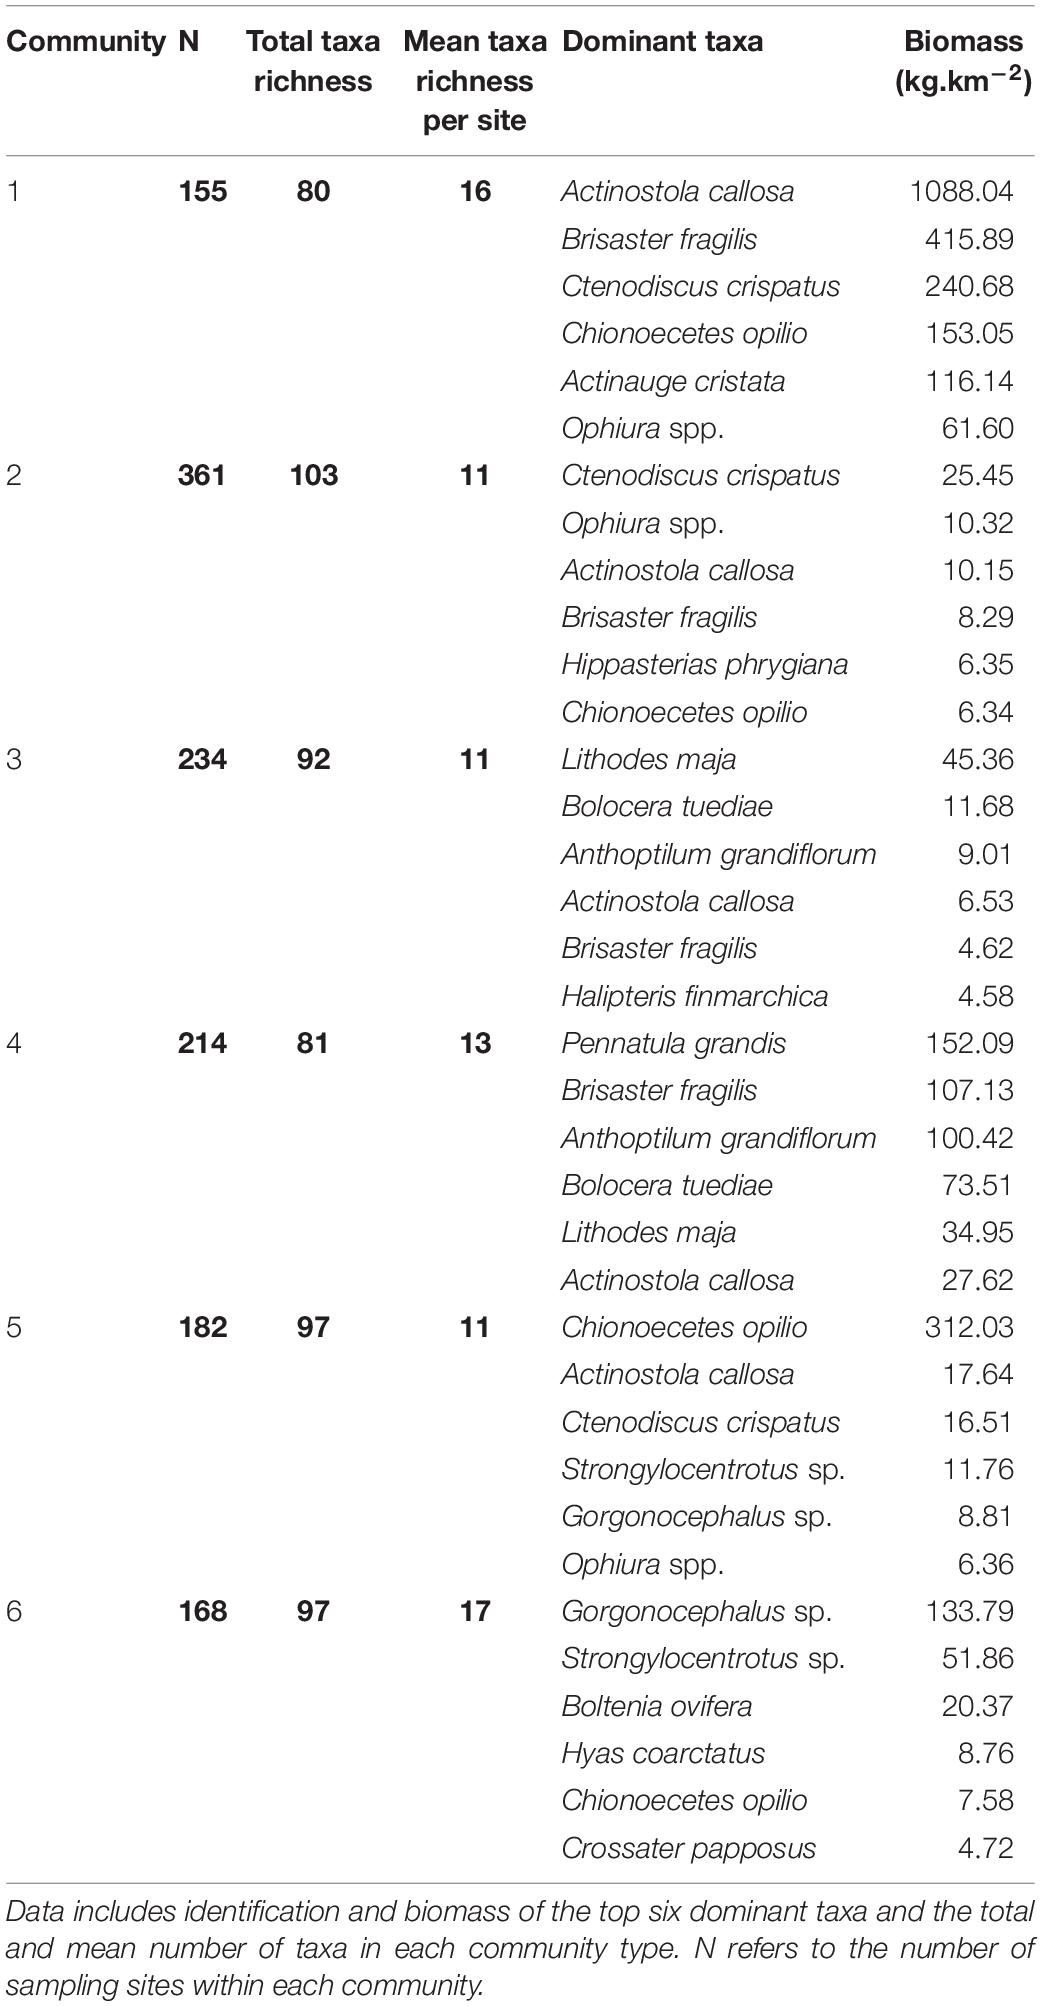
Table 1. Summary statistics for six epibenthic community types identified in the estuary and Gulf of St. Lawrence.
The second community type was found in the Esquiman and Anticosti channels and at the border of the Laurentian Channel in the Gulf of St. Lawrence. It was mainly composed of C. crispatus, brittle stars Ophiura spp. and A. callosa. The top six dominant taxa were very similar to community 1, but with different dominant taxa. The average benthic biomass captured per station was ca. 87 kg.km–2, about 25 times lower than for community 1. It was the most diverse community in terms of total taxa recorded but among the least diverse in terms of the mean number of taxa found at a single site.
The third community type was also found in deep waters but mainly near the outlets of the three channels. Dominant taxa differed from those of communities 1 and 2 with Norway king crab Lithodes maja, the anemone Bolocera tuediae, and the sea pen Anthoptilum grandiflorum with the highest biomass. B. tuediae and A. callosa were also dominant taxa present with a similar biomass as that of community 2.
The fourth community type was found almost exclusively in the Laurentian Channel. This community was dominated by a high biomass of the sea pens Pennatula grandis and A. grandiflorum. Some sites also contained a high biomass of B. fragilis.
The fifth community type was mainly located on the edges of the channels. Dominant taxa were similar to community 1 with C. opilio, A. callosa, and C. crispatus being top 3. However, this community also contained high biomasses of sea urchins Strongylocentrotus sp. and brittle stars Gorgonocephalus sp. that are considered more coastal taxa. Together with community 6, this community ranked second, with a total of 97 taxa.
The sixth community type was scattered throughout the EGSL in sites near the coast. It was dominated by high biomass of Gorgonocephalus sp. and Strongylocentrotus sp. Other dominant taxa included the sea potato Boltenia ovifera, the crab Hyas coarctatus, and the sea star Crossaster papposus. All these taxa were considered mainly coastal, which suggests that community 6 may represent a coastal community. It was also the most diverse community in terms of the mean number of taxa recorded at each site.
Environmental Clustering
Six environmental clusters were identified as characterized by distinct sets of environmental conditions, using k-means cluster analysis (Figure 3 and Table 2). Habitats 1 and 2 were spatially segregated in deep-water EGSL channels. Habitat 1, restricted to the Laurentian Channel, was characterized by low oxygen concentration and warm water. Habitat 2 bypassed habitat 1 on its edges in the Gulf portion of the EGSL and includes the head of the Laurentian Channel in the estuary and the Anticosti and Esquiman channels in the northern Gulf. Habitat 2 displayed similar conditions to Habitat 1 but with lower oxygen concentrations and a high aragonite index (Acidification). Habitat 3 was concentrated along the slopes of the deep-water channels and had variable temperature, although generally characterized by warm waters and intermediate depths (around 100 m), salinity, and oxygen concentrations. Habitats 4 was characterized by high levels of fisheries activities—especially DNH. In addition to fisheries activities, this habitat was also characterized by heterogeneous environmental conditions. Habitat 5 was concentrated along the coastline, especially in the Gulf, and was characterized by very well-oxygenated water with a mean depth of 92 m; it was thus located either in the surface or intermediate cold layers, as evidenced by temperatures reaching below 0°C in this habitat. Habitat 6 was not characterized by any clearly evident environmental regime.
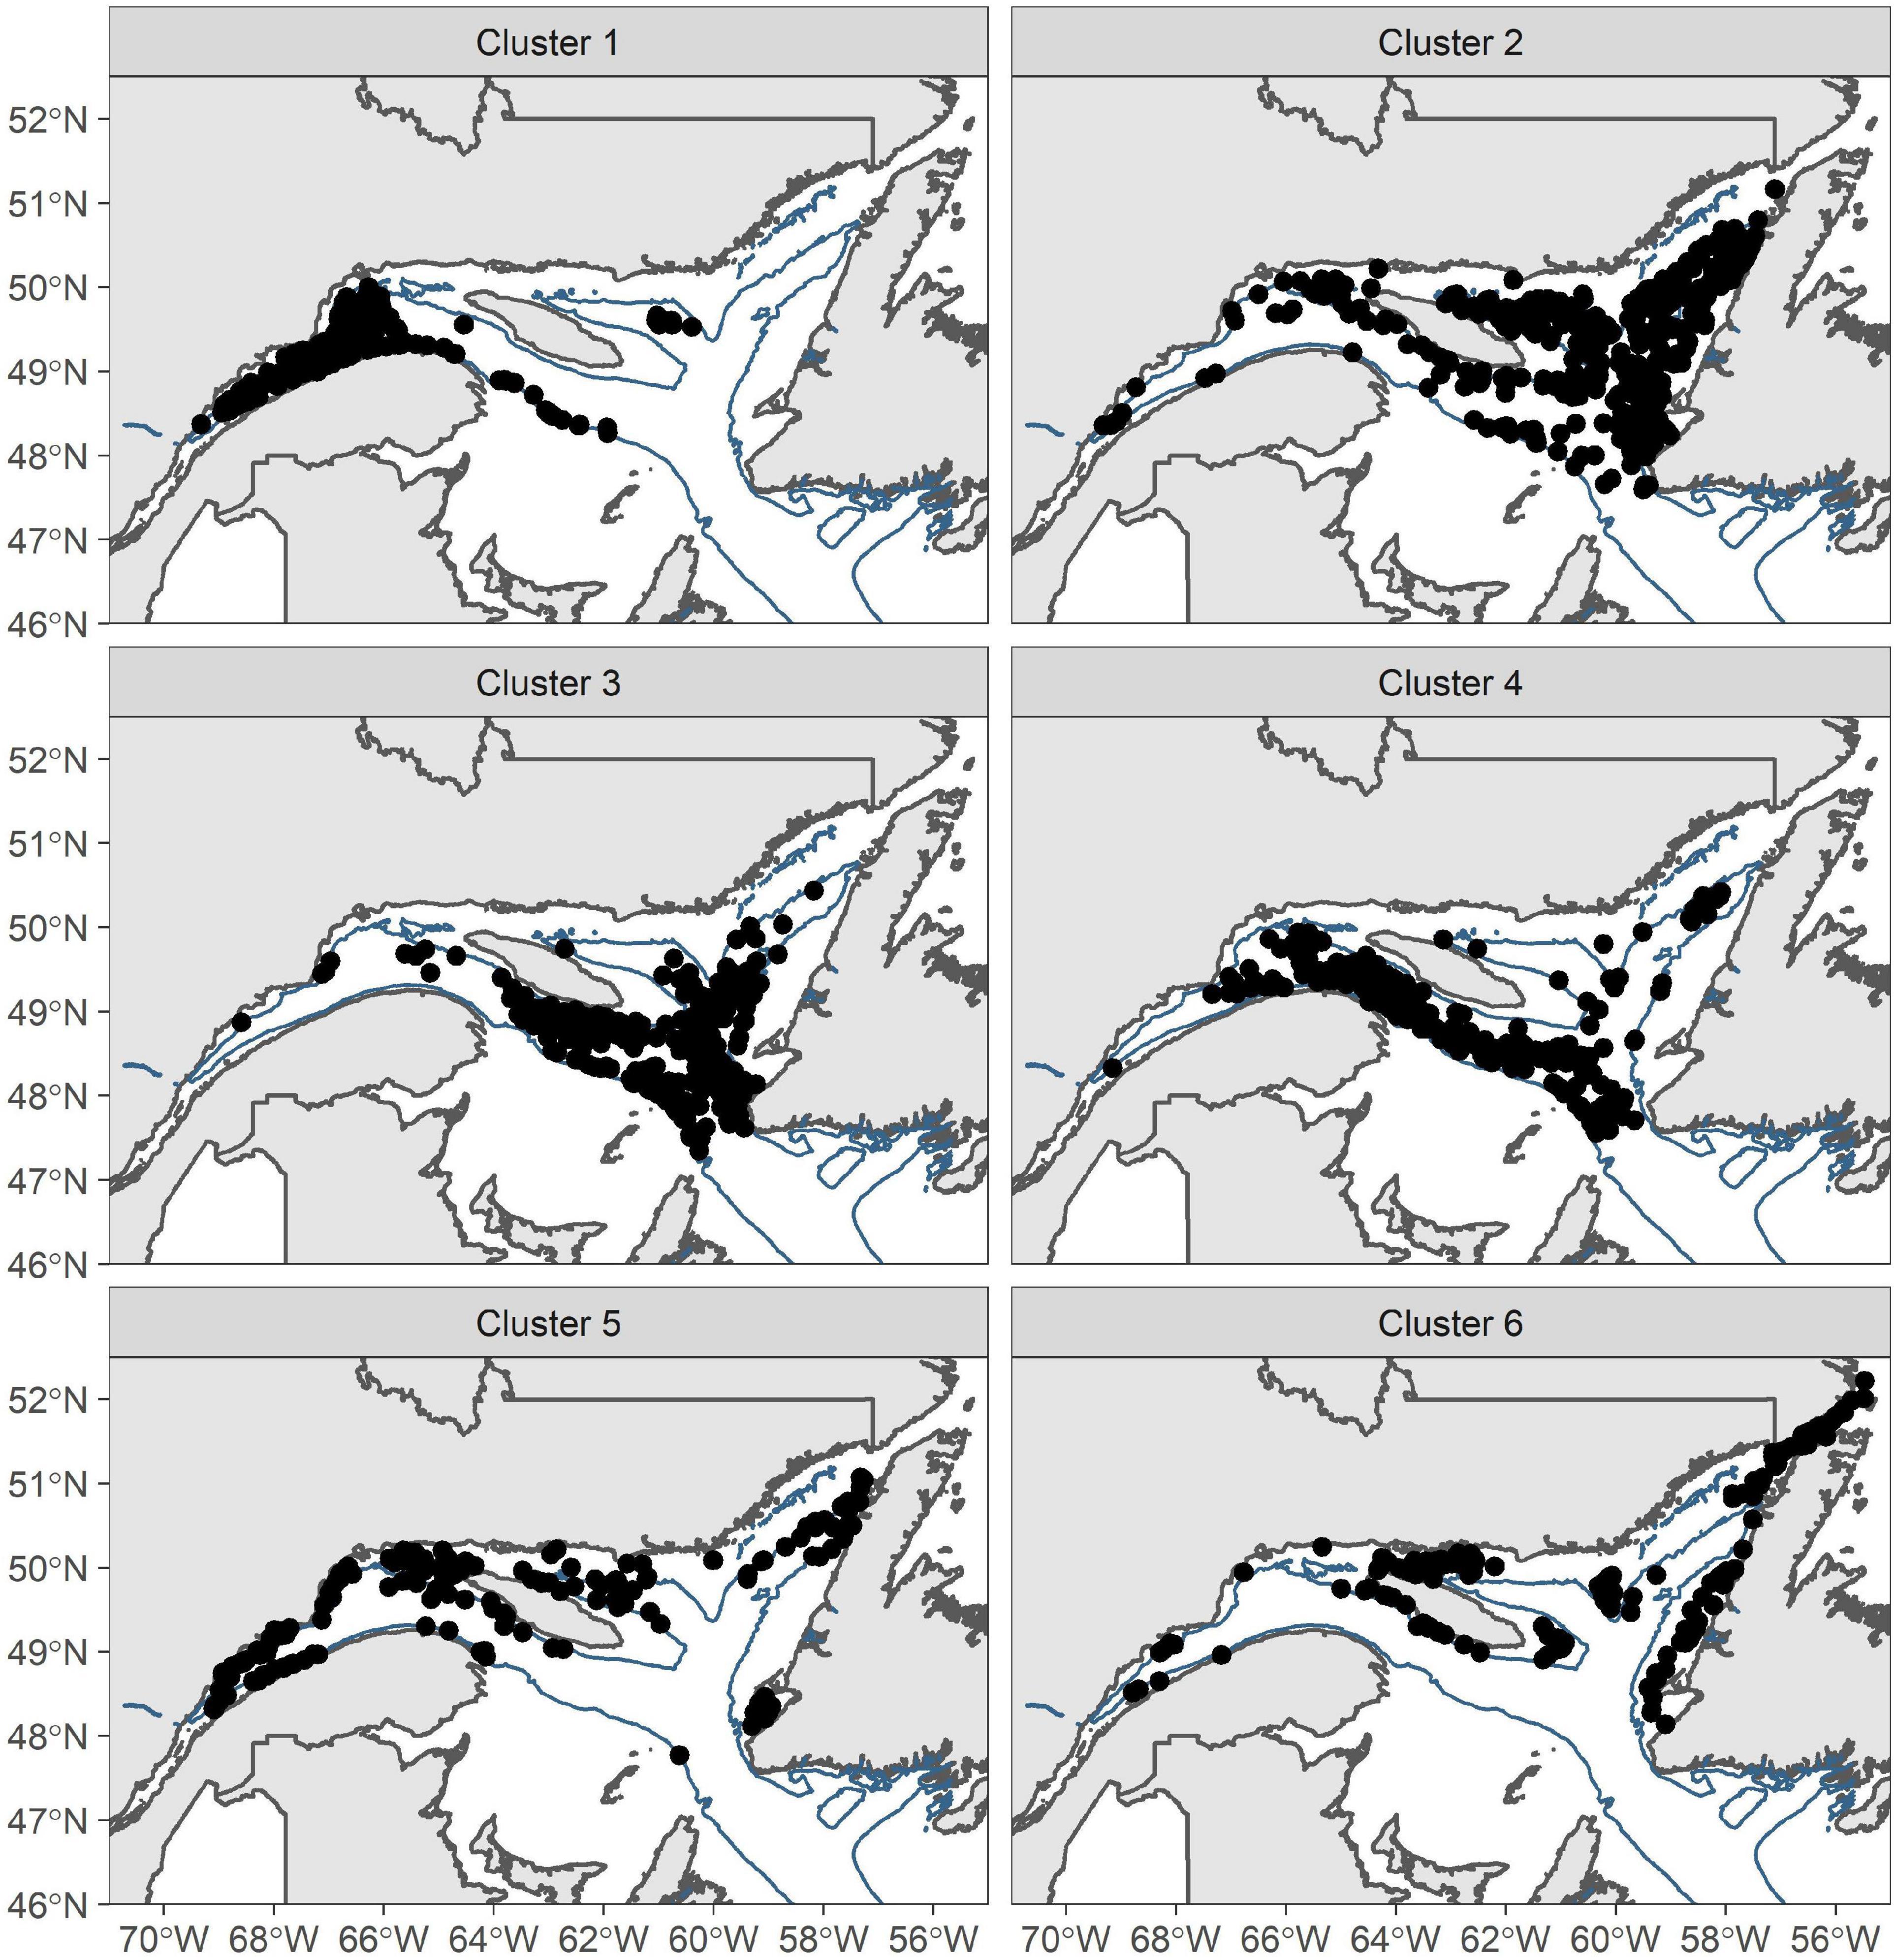
Figure 3. Location of the six habitats in the Estuary and Gulf of St. Lawrence identified by k-means clustering with environmental data ranging from 2011 to 2018. Deep channels are shown in blue (depth > 200 m).
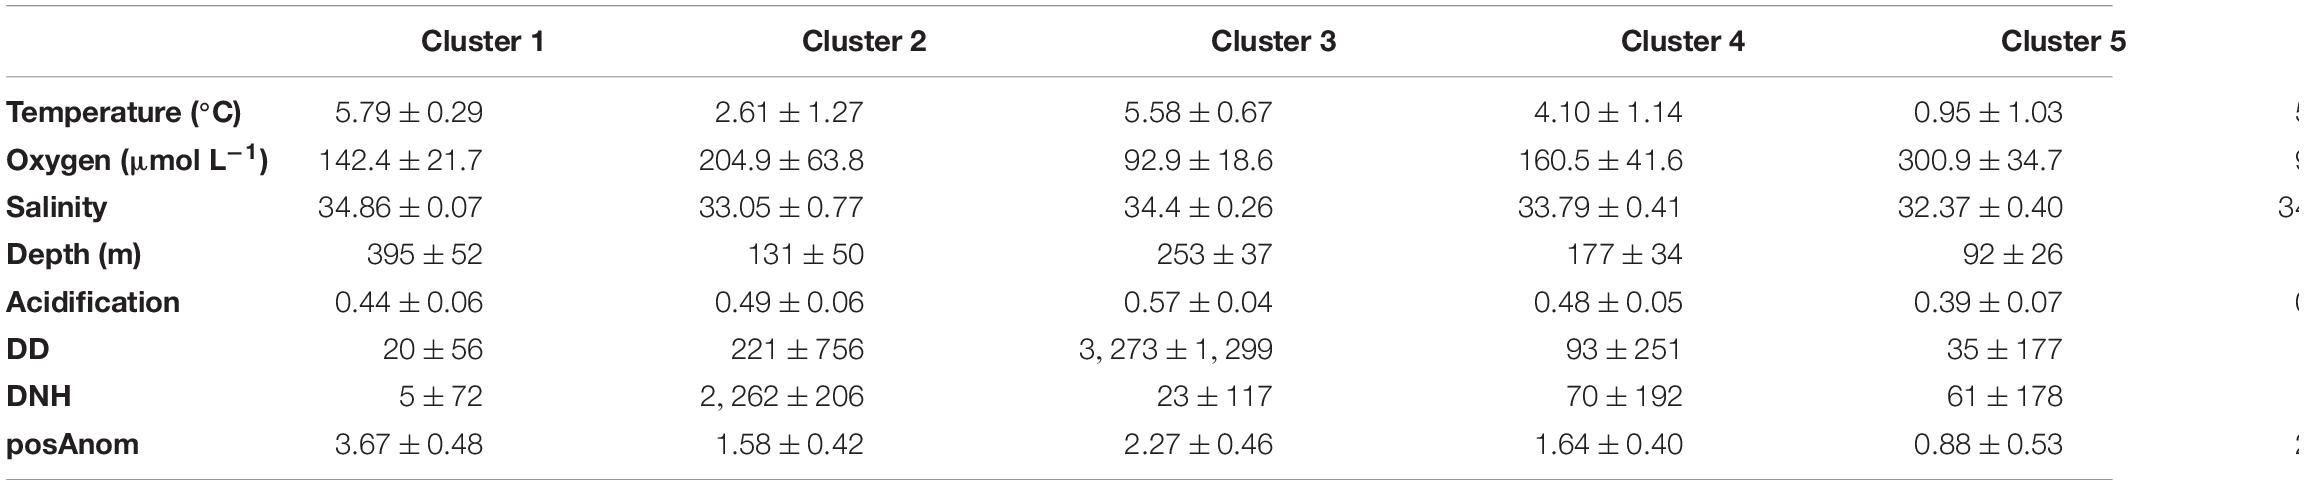
Table 2. Summary of environmental clusters environmental values (mean ± SD).
Detection of Thresholds
Depth, salinity, oxygen, and positive temperature anomalies (posAnom), were the best predictors of taxa assemblages (Figure 4). Fisheries predictors (DD and DNH) had very low overall importance. The splits density and the taxa cumulative importance plots (Figure 5) showed where the compositional change occurs along predictors ranges and their respective importance (Ellis et al., 2012). The most important predictor was depth. Four important splits were detected for depth from 50 to 100 m, 325 to 350 m, 400 to 425 m, and the strongest from 450 to 525 m, although sample size was small for this latter split (Figure 5A). This last split was caused by relatively few taxa reacting strongly to this depth change; it also showed that many taxa have a threshold reaction between 50 and 100 m, but that the response was relatively weak for all taxa (Figure 5B). Splits around 325–350 m and 400–425 m seemed to indicate a continuous split with a high concentration of taxa thresholds between 300 and 400 m.
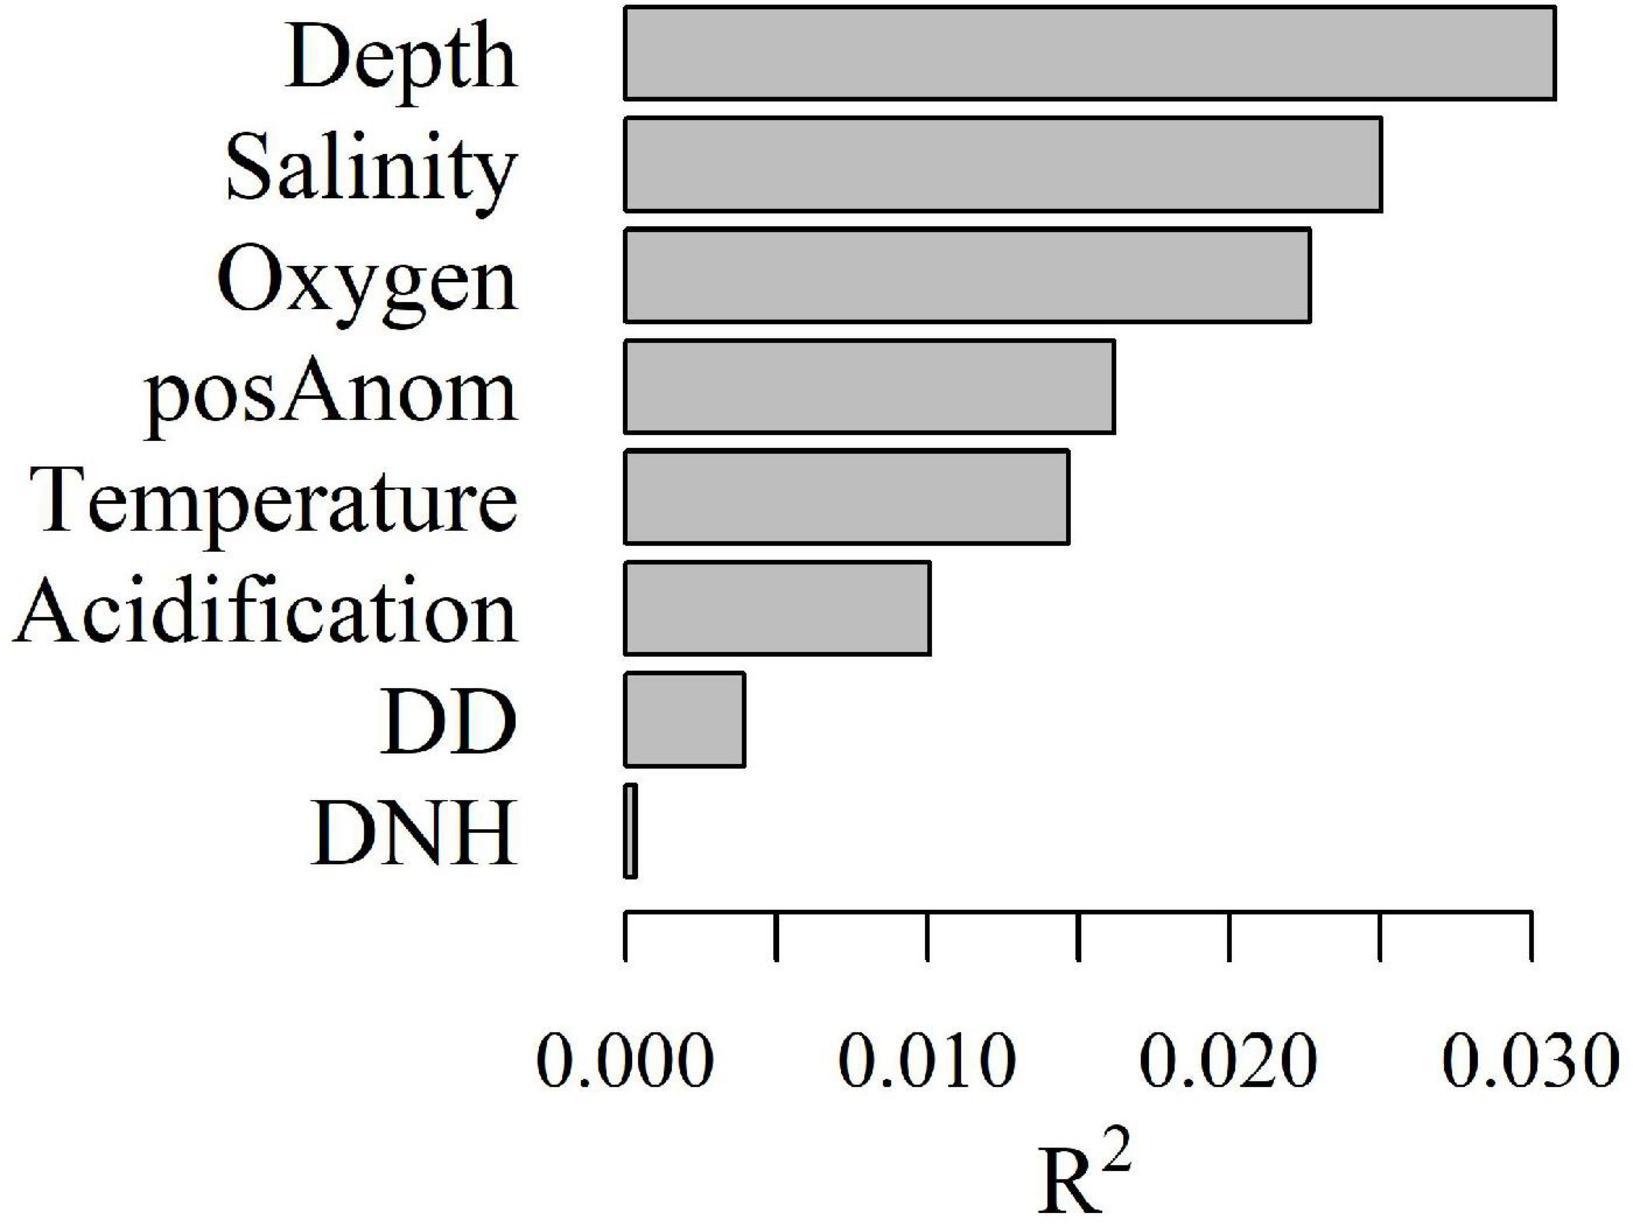
Figure 4. Overall importance, R2p, of each predictor p included in the gradient forest analysis.
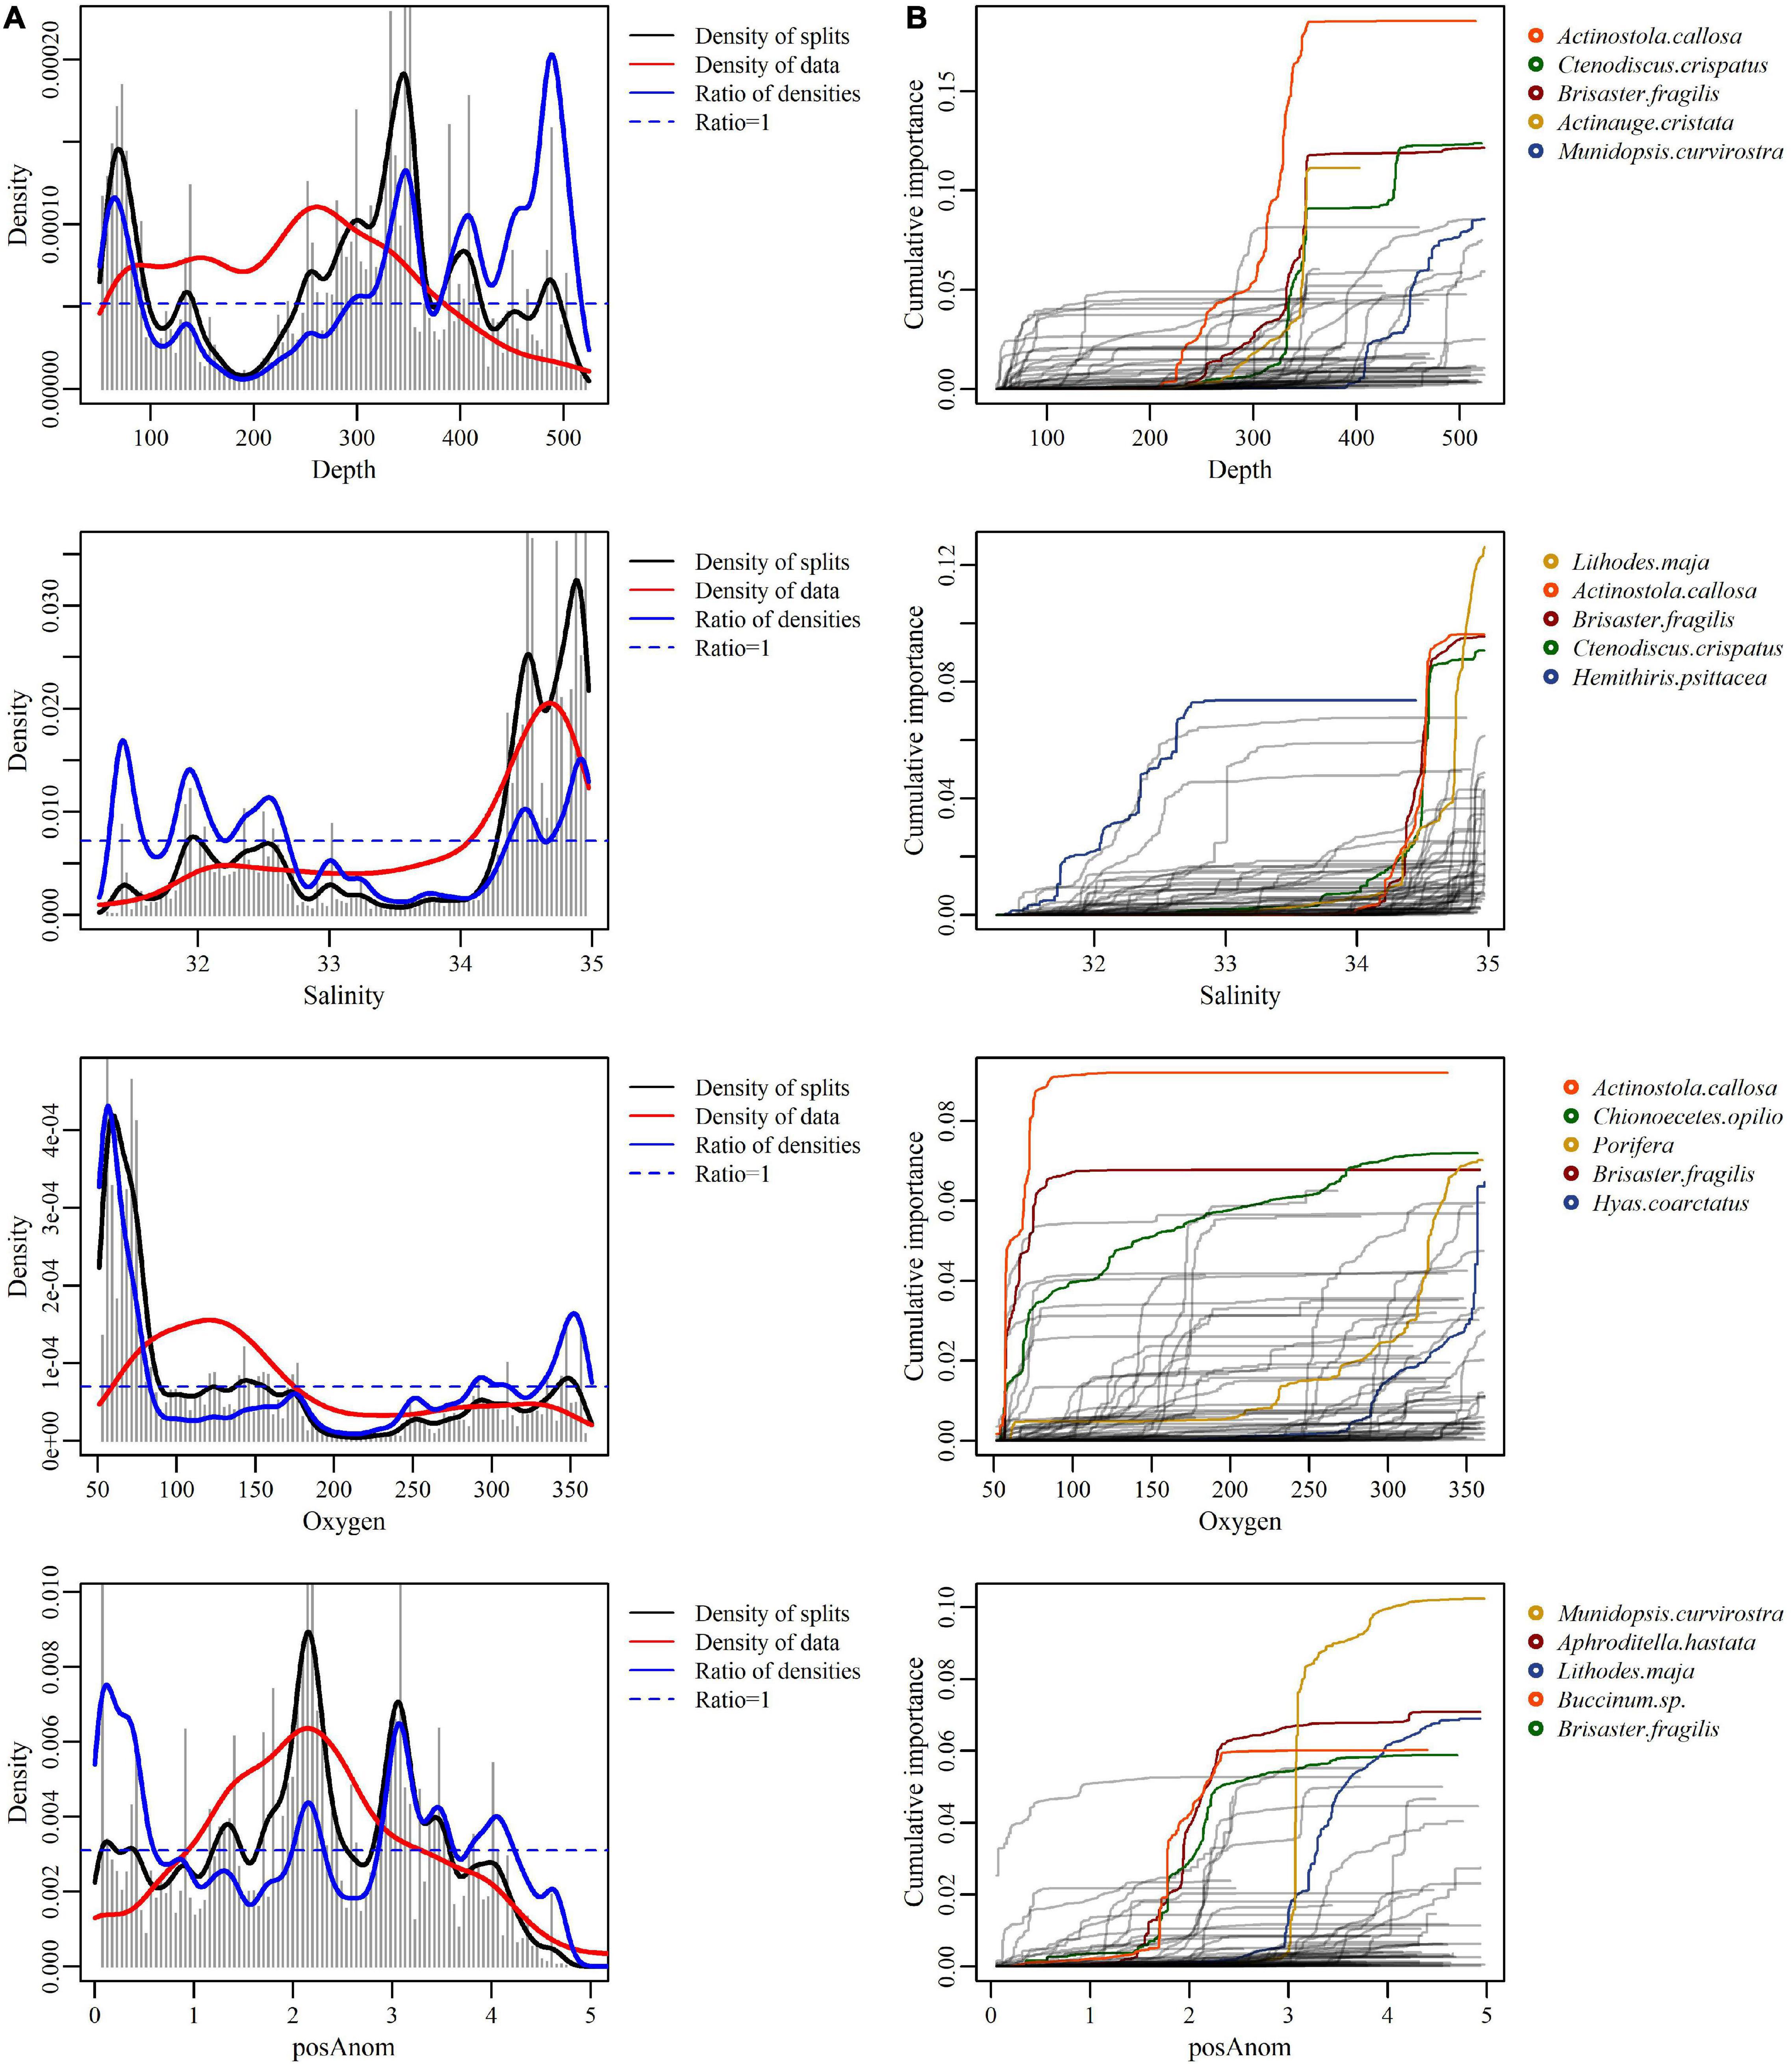
Figure 5. Splits density (A) and cumulative distributions of the standardized splits importance (B) for each taxon scaled by R2 of the four most important predictors of the distribution of epibenthic taxa in the estuary and Gulf of St. Lawrence. (A) Each curve represents an individual taxon (number of taxa = 104). Only the 5 species the most responsive to each predictor are displayed in color. (B) Density plots contain four components: gray vertical bars represent the binned raw importance of a predictor, the black line shows the density of splits estimated by kernel density, the red line indicates the density of actual predictor values (Beazley et al., 2015). The blue line is a combination of these two last components—the expected density of splits if the predictor had been sampled in uniform density, calculated as the density of splits standardized by the density of predictor values (i.e., the black line standardized by the red line) (Beazley et al., 2015).
Salinity was the second most important predictor. Multiple successive splits were observed (Figure 5A). The first three splits had similar strength and represented little of the data and are observed between 31 and 33. No clear distinction between these three splits was observed; rather, few taxa react strongly to variable salinities within this range. Two further splits were observed around 34.3 and 35. They represented much of the data and were stronger than the first set of three splits. Indeed, most of the taxa had their threshold between these values and exhibited strong responses to variations in salinity (Figure 5B).
Oxygen was the third most important predictor and displayed three splits (Figure 5A). A major split occurred around 50–100 μmol O2 L–1. This strong threshold was caused by the response of approximately ten taxa, including A. callosa, A. cristata, C. crispatus, Aphroditella hastata, Buccinum sp., B. fragilis, and C. opilio (Figure 5B). Three much smaller splits occurred at higher oxygen concentrations: one around 175–200 μmol O2 L–1 and three successive ones between 250 and 375 μmol O2 L–1. Many taxa had thresholds at these ranges of oxygen concentration although the strength of the thresholds was much lower than for taxa at the 50–100 μmol O2 L–1 split (Figure 5B).
Positive temperature anomalies were also an important predictor. The density plot showed multiple successive strong splits. The first one was observed around −1 to 0°C but represents little of the total data. Two thresholds occur between 1.5 and 2.5°C. and around 4°C. The taxa cumulative importance plot showed that all splits seemed to be caused by the strong reaction of a few taxa. The strength of the response varied between taxa but was generally weak.
Taxa Reactions to Oxygen Thresholds
There was an important increase in the biomass of 8 taxa at and below the first oxygen threshold (50–100 μmol O2 L–1) as indicated by partial dependence plots (Figure 6): A. callosa (% variance explained by the model: 58.15%), A. cristata (35.33%), C. crispatus (36.25%), A. hastata (26.03%), Buccinum sp. (23.06%), B. fragilis (41.65%), C. opilio (21.72%), and Ophiura spp. (12.88%). All taxa at this threshold displayed low biomass at higher oxygen concentrations but it increased drastically when oxygen concentration approaches the hypoxic condition threshold of 62.5 μmol O2 L–1 (Gilbert et al., 2005). In contrast, the biomass of several other species showed the opposite pattern as O2 levels approach 125–150 and 275–325 μmol O2 L–1 increasing as oxygen levels increase. The taxa P. andromeda (25.01%), M. curvirostra (32.86%), Flabellum alabastrum (25.07%), Ciliatocardium ciliatum (14.18%), H. coarctatus (27.02%), Porifera (25.10%), Rhachotropis aculeata (10.54%), and Strongylocentrotus sp. (21.44%) were absent at low oxygen concentration but increased in biomass as oxygen concentration increases (Figure 7). The oxygen concentrations at which biomass begins to increase varied among taxa, ranging from 125 to 325 μmol O2 L–1.
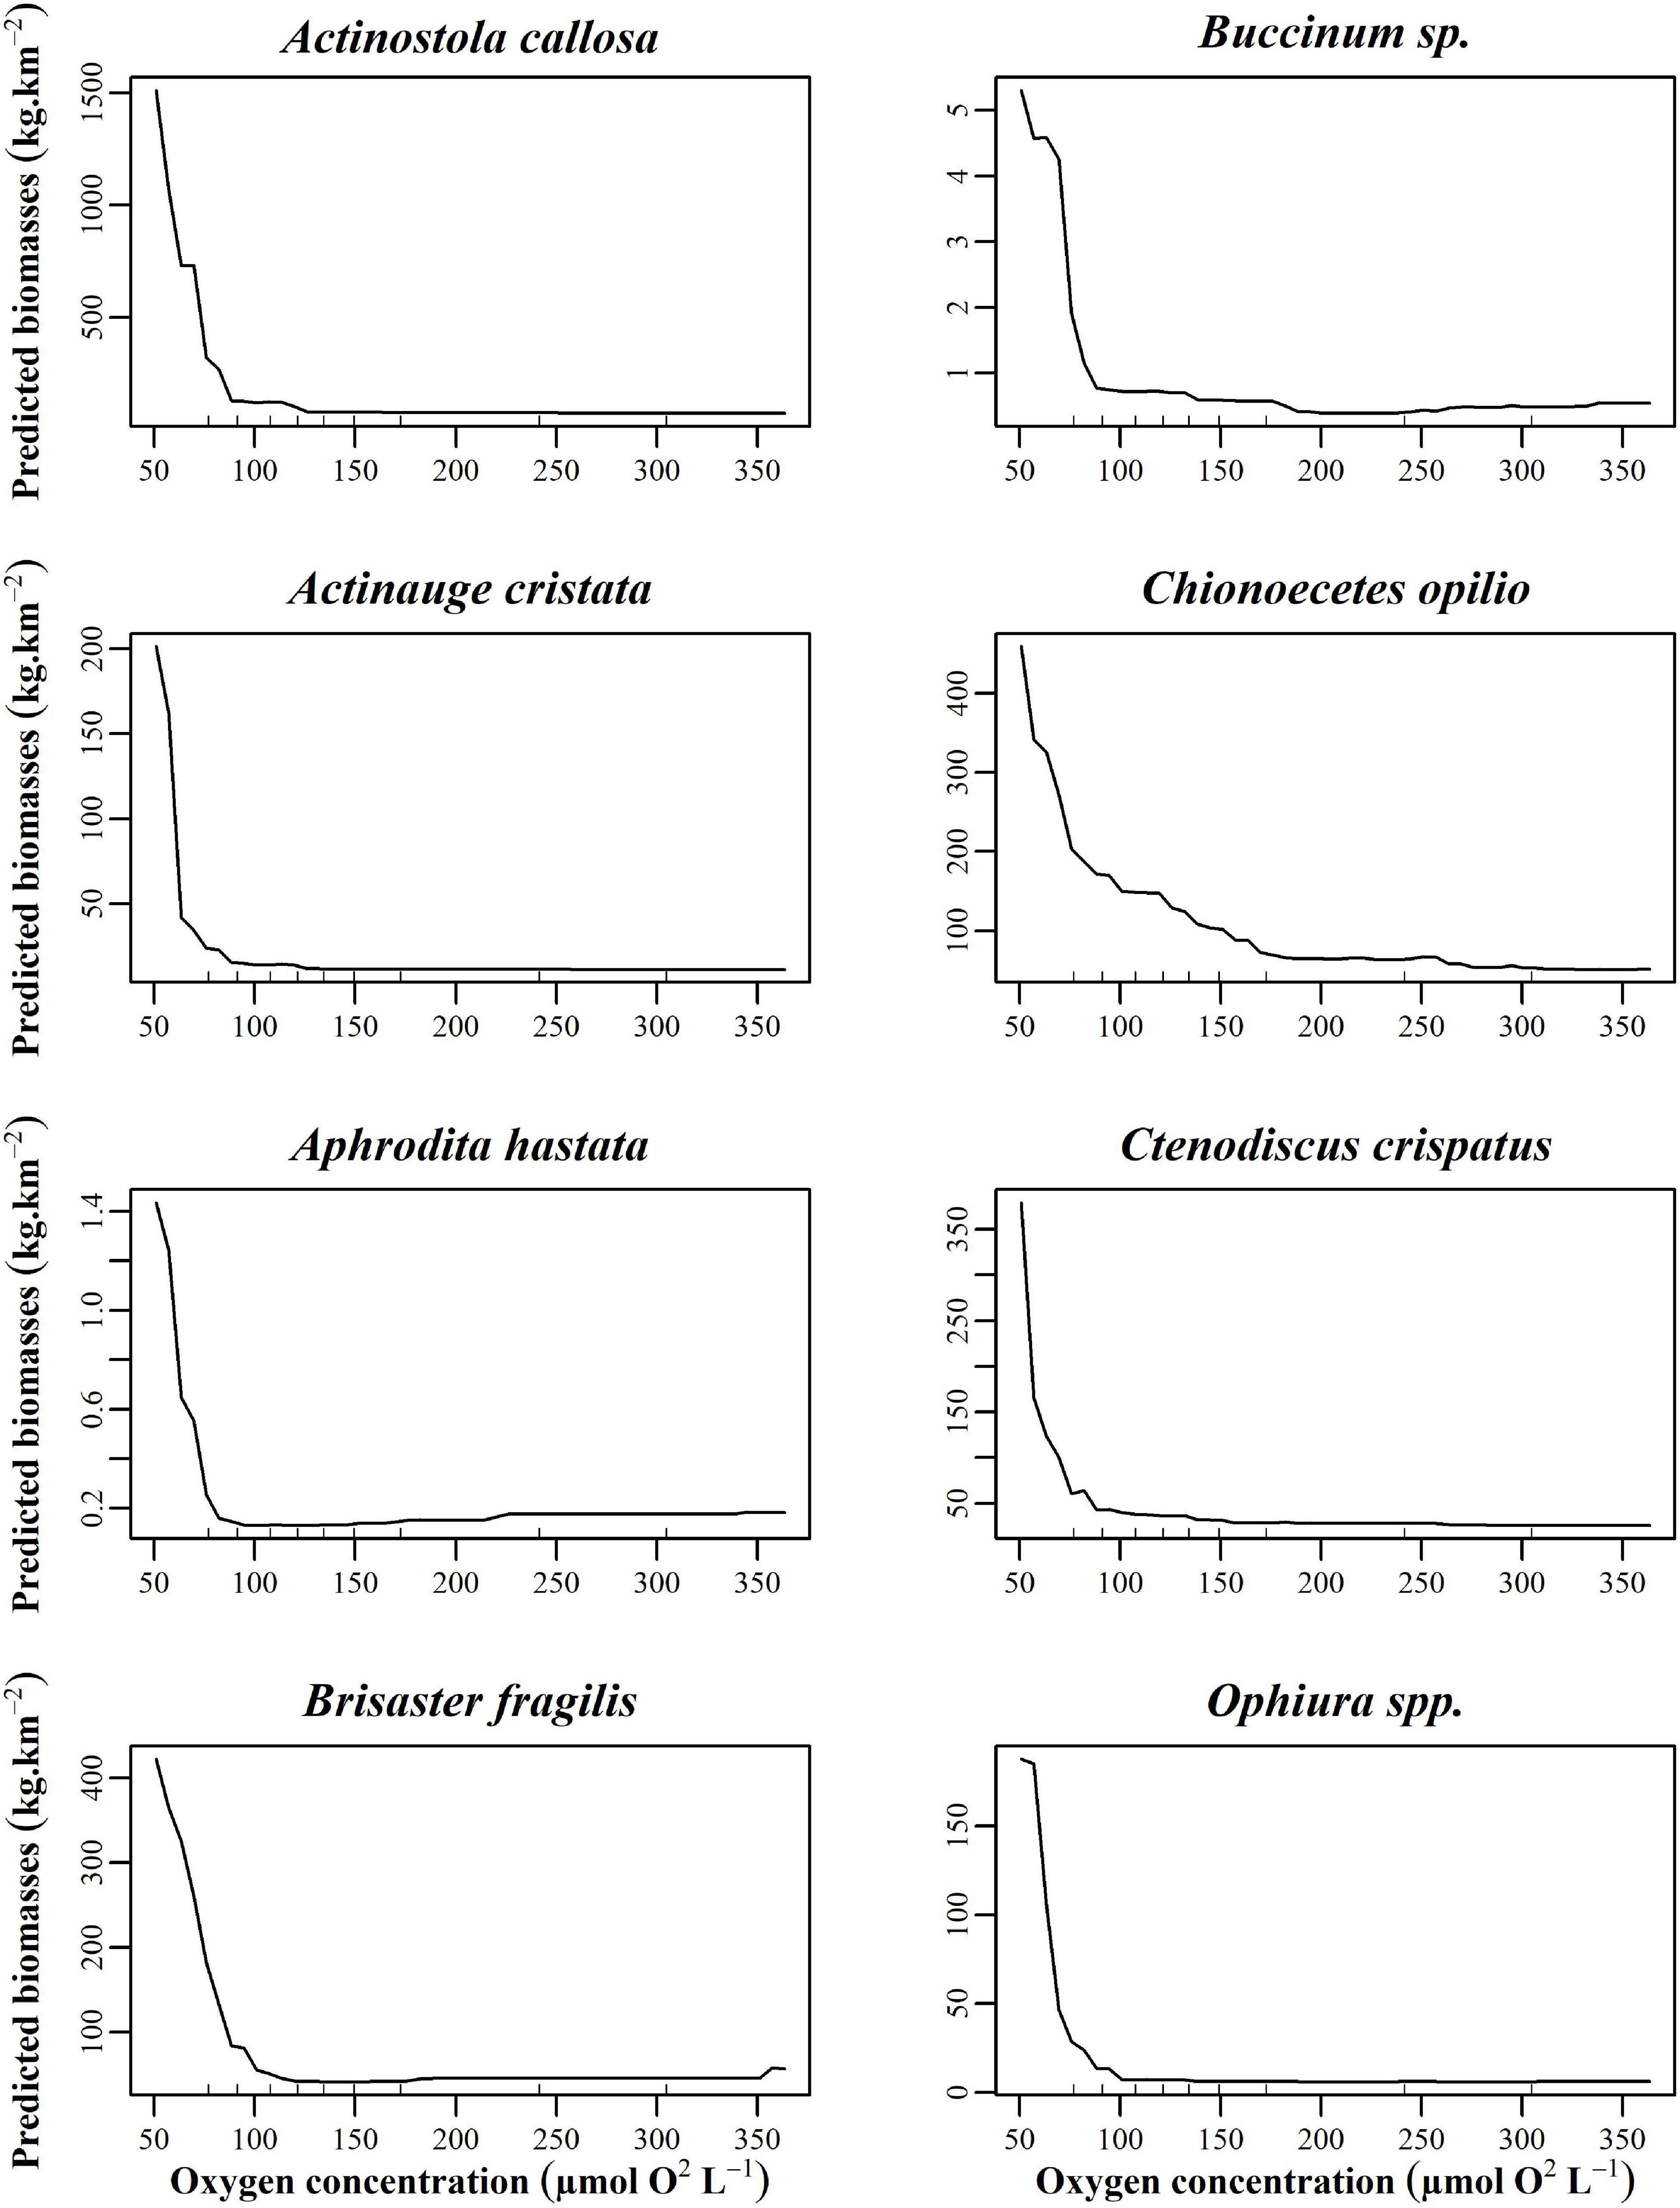
Figure 6. Partial dependence plots of the top eight taxa with the highest R2 at the 50–100 μmol O2 L– 1 threshold build from the random forest biomass regressions of taxa for oxygen.
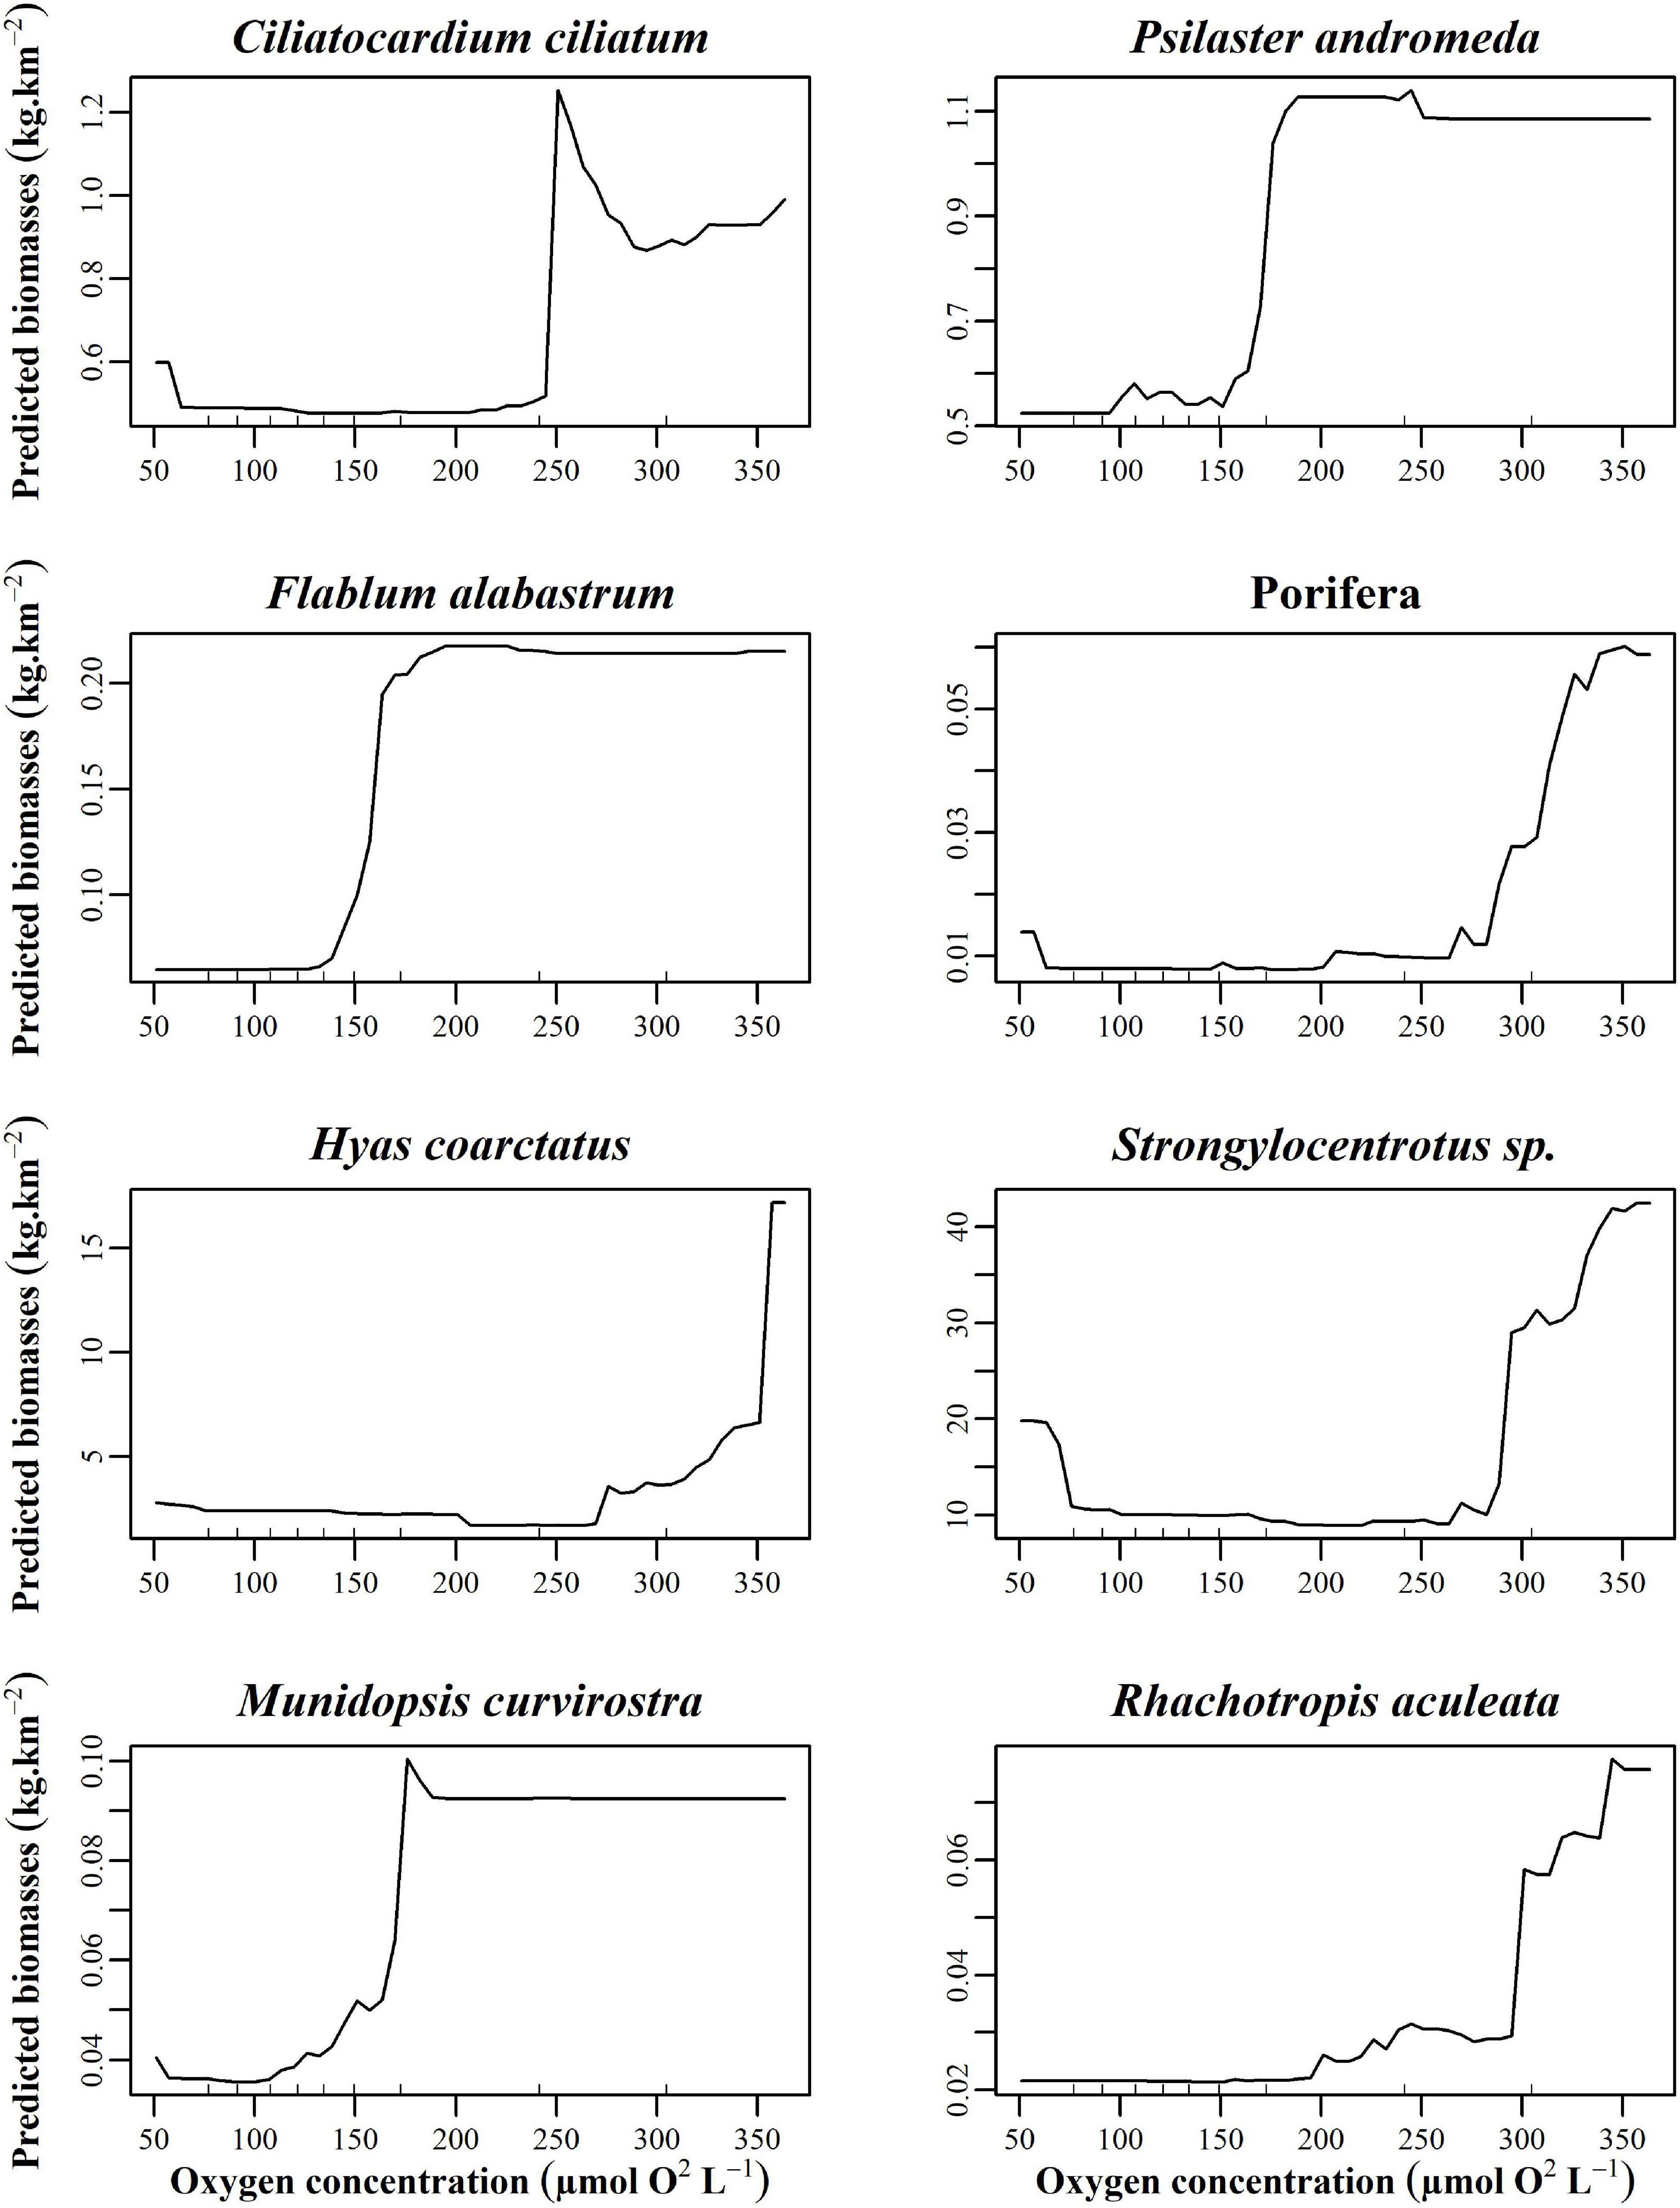
Figure 7. Partial dependence plots of the top eight taxa with the highest R2 from oxygen concentrations of 175–300 μmol O2 L– 1 thresholds build from the random forest biomass regressions of taxa for oxygen.
Indicator Taxa
There is no established threshold for what indicator values should be for a given taxon to be considered a good indicator of a community. In this study, we selected taxa with indicator values of 0.50 or greater, considering values below this as weak. Taxa selected as potential indicators (Table 3) for community 1 were the anemones A. cristata and A. callosa, the sea star C. crispatus, the sea urchin B. fragilis, and the brittle star Ophiura spp. No taxa met the 0.50 threshold for communities 2 and 3, whereas a single taxon was identified for community 4: the sea pen A. grandiflorum. For community 5, the crab C. opilio was the only taxa that met the 0.5 threshold. For community 6, 5 taxa were selected as potential indicators: Strongylocentrotus sp., H. coarctatus, C. papposus, O. aculeata, and Gorgonocephalus sp. The four following taxa were selected by the analysis as indicator species and display strong reactions to hypoxic conditions: A. cristata, A. callosa, C. crispatus, and B. fragilis. They were thus retained as indicator taxa of benthic conditions for EGSL epibenthic communities potentially exposed to hypoxia.
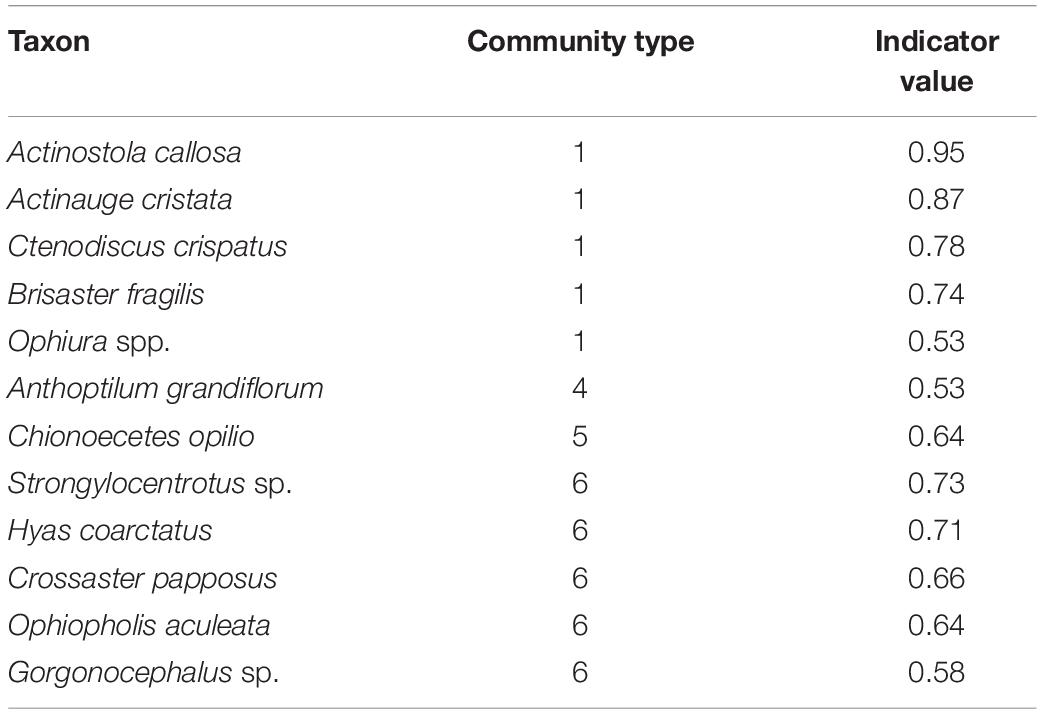
Table 3. Indicative values of taxa with indicator values > 0.5, for each community.
Discussion
The great heterogeneity of oceanographic and geological conditions in the EGSL creates diverse habitats that are favorable to diverse benthic communities. This study identified distinct communities that seem to be in some way structured by their environment. Depth, salinity, oxygen, and positive temperature anomalies were the main predictors of community composition and distribution. A strong threshold influencing community structure was observed around 50–100 μmol O2 L–1, which corresponds to a hypoxic condition threshold (Gilbert et al., 2005). A great biomass of opportunistic taxa with fast growth and high reproductive rates was observed below this threshold; sensitive taxa, meanwhile, were largely absent in those conditions and became abundant only when oxygen concentration increased to greater levels. Temperature and oxygen levels in the ESGL are predicted to increase and decrease, respectively, in the future, which may impact EGSL benthic communities if the hypoxic threshold is reached (Lavoie et al., 2019). Actinostola callosa, Actinauge cristata, Ctenodiscus crispatus, and Brisaster fragilis were identified as indicator taxa because their relationship with hypoxia conditions reflects the response of the whole community. Detection of these thresholds and the identification of indicator taxa are essential to help monitor important changes in community composition; one that could lead to important structural changes in the ecosystem, since other taxa may be affected by these pressures as their habitat is modified.
Epibenthic Communities of the Estuary and the Gulf of St. Lawrence
Epibenthic communities of the EGSL are influenced by a variety of environmental conditions (Bourget et al., 2003; Lévesque et al., 2010; Moritz et al., 2013). Six distinct, partially spatially segregated, communities were identified in this study. Moritz et al. (2013) also identified six distinct epibenthic communities in the EGSL based on the results of trawl surveys from 2006 to 2009 using approaches similar to those in the present study. Site groupings were quite similar to those observed in the present study with a clear distinction between deep-water and shallow-water assemblages and the estuary being identified as a unique community in both analyses. In contrast to Moritz et al. (2013), who included the highly dominant shrimp Pandalus borealis with specific environmental requirements in the analysis (Ouellet et al., 2007), the present study did not include shrimp, likely, explaining in part differences between the two studies.
The present study defines six distinct habitats using eight predictors. Epibenthic communities identified in the EGSL did not fully match these potential habitats. The grouping reveals distinct communities in the Laurentian Channel relative to those in the Esquiman and Anticosti channels, even though they are all classified as being from the same habitat type. The heads of all EGSL deep-water channels are characterized by low oxygen concentrations, with the Laurentian Channel being the lowest. Deep waters in the EGSL are isolated from the atmosphere by a permanent pycnocline which prevents the renewal of oxygen as it travels from Cabot Strait to the heads of the channels (Petrie et al., 1996). Since the Laurentian Channel is the longest of the three, water residence time is longer, resulting in lower oxygen levels in the estuary. This could indicate that a threshold for the community to react to low oxygen concentration exists between the heads of the three channels. Oxygen concentrations at the head of the Esquiman and Anticosti channels are low but still above the hypoxia threshold (Gilbert et al., 2007; Thibodeau et al., 2013). Taxa may not yet have reacted to decreased oxygen concentrations but may if levels continue to decrease, perhaps becoming similar to community 1. Another explanation could be the human-induced hypoxic condition at the head of the Laurentian Channel. This is due, in part, to high anthropogenic inputs of organic matter resulting in high decomposition rates. Both these factors may influence the benthic community differently than low oxygen concentration alone. It remains poorly known if anthropogenic-induced hypoxia will affect fauna differently than natural hypoxia alone as they often co-occur (Levin et al., 2009). Future monitoring of benthic communities at the head of the Anticosti and Esquiman channels may indicate if these two sources of hypoxia induce similar or distinct changes in epibenthic community composition.
The Gulf of St. Lawrence is characterized by multiple habitats. No distinct communities are present in habitats with high fishing activities. This agrees with Moritz et al. (2015) who found that there was no longer a detectable effect of trawling on EGSL epibenthic communities. They suggested that the recurring passage of fishing gear may have irreversibly damaged epibenthic communities by removing taxa that are sensitive to physical disturbances, thus switching communities to an alternate equilibrium state such that trawling activities no longer have detectable impacts.
Predictor Importance
Four variables seem to be the main predictors of epibenthic assemblage distributions in the EGSL: depth, salinity, oxygen, and to a lesser extent, positive temperature anomalies. These predictors were also identified as being important in past EGSL epibenthic studies (Bourget et al., 2003; Moritz et al., 2013). Habitat suitability models based on 2006–2009 DFO trawl survey data suggested that depth and temperature were the most important variables affecting epibenthic community structure (Lévesque et al., 2010). In contrast, DNH and DD fisheries, and aragonite were identified as weak predictors of EGSL epifaunal assemblage structure.
Collinearity Between Predictors
The most important predictor was depth. Although depth zonation has been observed in multiple studies worldwide, it is difficult to determine which related factor causes this. Strong variation in taxonomic composition due to depth is one of the most difficult problems for ecologists to solve (Gage and Tyler, 1991). Depth correlates with many variables, including primary production, nutrient levels, temperature, oxygen, and salinity, making effects due to depth per se difficult to interpret. Thus, the observed zonation is often attributed to variables and their interactions other than depth per se (Carney, 2005). In the EGSL, depth is tightly linked with water masses that display a strong coupling between salinity and temperature (Saucier et al., 2003; Blais et al., 2019), the second and fourth most important predictors, respectively. Indeed, the compositional change threshold observed around 50–100 m corresponds roughly to the transition between the surface and the cold intermediate water layers, where many environmental conditions change (Saucier et al., 2003; Galbraith, 2006). Thus, the strong response of EGSL benthic communities to depth could indicate the influence of multiple predictors. Some authors suggest removing predictors that are strongly correlated from analyses while others prefer to keep all predictors under the assumption that most predictors are in some way correlated and it is unknown which are actually linked to the response evaluated (Murray and Conner, 2009; Ellis et al., 2012). Comparison of taxonomic assemblage thresholds shows that some taxa shift at co-occurring salinity, temperature, and depth thresholds, underlying the difficulty to discriminate between the effects of salinity and temperature from depth on epibenthic assemblages. For example, the depth threshold of A. callosa (highest curve in red in Figure 5) is located around 350 m, which corresponds to a temperature of 5.5°C and salinity of 34.5. The cumulative importance plots show that the temperature and salinity thresholds for A. callosa are located exactly at these values.
Disentangling the individual effects of these correlated predictors on community assemblages is thus difficult. Salinity is known to affect the distribution of benthic taxa in coastal and estuarine ecosystems where strong salinity gradients are found (Dauer et al., 1987; Dauer, 1993; Zettler et al., 2007; Bleich et al., 2011). However, salinity gradients in the EGSL vary between 31 and 35 and are restricted to the euhaline zone of salinity class boundaries (Venice System., 1958). Temperature is also known to have an important influence on benthic community structure (Schiel et al., 2004). Temperature thresholds, however, are not very strong and taxa responses are dispersed along the temperature gradient resulting in multiple small thresholds. Indeed, temperature requirements vary greatly among taxa, depending on physiological and competitive adaptations (Hale et al., 2011).
Thresholds and Indicators for Hypoxia
As observed in previous EGSL studies, oxygen concentration has an important impact on community structure and has often been hypothesized as a key pressure on benthic community structure and function (Rosenberg et al., 2001; Levin, 2003; Lévesque, 2009; Belley et al., 2010; Moritz et al., 2013). Decreased oxygen concentrations and hypoxia may affect entire ecosystems and biogeochemical cycles (Rabalais et al., 2010). It may cause some taxa to avoid areas or face high mortality, which may reduce taxonomic richness and alter community structure and function (Diaz and Rosenberg, 1995, 2008; Wu, 2002; Levin et al., 2009). Low oxygen and hypoxic waters occur naturally in many marine environments but have recently been exacerbated by human activities, resulting in historically high numbers of hypoxic areas (Diaz and Rosenberg, 1995, 2008; Helly and Levin, 2004; Vaquer-Sunyer and Duarte, 2008; Gooday et al., 2009).
Oxygen thresholds observed for benthic communities in the EGSL display two taxa-specific reaction patterns. The first threshold shows taxa biomass increasing substantially below 100 μmol O2 L–1. Conversely, two other thresholds show very low taxa biomass at oxygen concentrations below 100 μmol O2 L–1 and then increasing biomass as oxygen concentration increases, starting at around 125 μmol O2 L–1. Alteration of taxa biomass has been observed by Dauer (1993) where “sensitive” and equilibrium taxa add low biomass in hypoxic areas while opportunistic taxa displayed higher dominance of the community composition. Multiple studies have shown that opportunistic taxa often dominate under hypoxic conditions, with taxa-specific responses based on their tolerances (Dauer et al., 1992; Rosenberg et al., 2001; Levin et al., 2009). Taxa exhibit very different responses to hypoxic stress depending on their tolerance and physical requirement (Vaquer-Sunyer and Duarte, 2008). Taxa tolerant to hypoxic conditions may have developed adaptive strategies that allow them to rapidly colonize disturbed areas vacated by sensitive species through high recruitment (Dauer, 1993). Less hypoxia-tolerant taxa, found at the 175–200 and 275–375 μmol O2 L–1 oxygen thresholds, need higher oxygen concentrations to survive and will leave or die if oxygen levels decrease to a point that no longer supports reproduction and survival (Diaz and Rosenberg, 1995; Wu, 2002).
Opportunistic taxa generally display high larval availability, rapid growth, small body sizes, and short generation times that allow them to quickly recolonize disturbed areas (Levinton, 1970; Wu, 2002). As physiological generalists, opportunistic taxa can generally live under a wide range of oxygen concentrations (Levinton, 1970). Opportunistic taxa identified in the present study display a variety of characteristics that make them well suited to hypoxic environments. Ophiura spp. and C. crispatus are both tolerant to hypoxia (Shick, 1976; Vistisen and Vismann, 1997). Indeed, C. crispatus is one of the most tolerant echinoderms to low oxygen concentrations (Shick, 1976). Ophiura spp. has previously been observed in high abundance in hypoxic areas of the EGSL (Belley et al., 2010). Further, high abundances of Ophiura spp. were linked to eutrophic conditions in European sea areas (Diaz and Rosenberg, 1995). Molluscs and cnidarians are known to be particularly tolerant to decreased oxygen concentrations, perhaps explaining the high abundance of the gastropods Buccinum sp. and the sea anemones A. callosa and A. cristata in the estuary (Vaquer-Sunyer and Duarte, 2008). Belley et al. (2010) only found Actinauge sp. at hypoxic sites. Acclimation to hypoxia has been observed for Buccinum sp., which increases oxygen-carrying capacity when environmental oxygen concentrations decrease (Brix et al., 1979). Feeding ecology also plays a major role in hypoxic areas, where dominance by deposit-feeders over suspension-feeders is often observed (Wu, 2002; Levin et al., 2009). This dominance was associated with increased food supplies (organic matter) for deposit-feeders caused by organic enrichment-induced hypoxia (Levin, 2003). Indeed, the deposit feeders C. crispatus and B. fragilis were among the most abundant taxa found in hypoxic areas.
Notwithstanding the clear effects of depth and salinity, EGSL epibenthic communities are clearly impacted by hypoxic conditions. Indicator taxa analysis identified four taxa that are representative of this community that may be potential indicators of hypoxic conditions and gross community changes: A. callosa, A. cristata, C. crispatus, and B. fragilis. High densities of these species are observed in the EGSL estuary, which is known for its persistent hypoxic conditions that result from a mix of climate-induced and anthropogenic decreased oxygen concentrations over the last 60 years (Gilbert et al., 2005, 2007). However, the co-occurrence of many pressures in this region of the EGSL may have caused cumulative changes that were not detected by threshold analysis as combinations of pressures may not account for cumulative changes (Large et al., 2015). Multiple pressures are inclined to combine and push the ecosystem toward the threshold (Foley et al., 2015). Benthic communities may have reacted to a combination of multiple pressures such as increased organic matter, acidification, and hypoxia. Data on organic matter were not available and thus not included in the models, preventing us from evaluating the importance of this pressure on benthic communities. However, it is probably an important predictor of benthic assemblage, as demonstrated by Pearson and Rosenberg (1978). Although aragonite was not identified as an important predictor, values available from eDrivers were derived from a single year of data and therefore the interpolation was made from a much more limited coverage of the EGSL than for the other predictors; perhaps explaining its weak ability to predict benthic community assemblages. The indicator taxa selected could reflect not only the impact of hypoxia but more generally the complex impacts of eutrophication of deep waters (Thibodeau et al., 2006). Indicators may provide more information than environmental variables in these cases as the case is too complex to be captured by models. Ecological indicators are generally stronger when multiple taxa that exhibit different life histories are considered, instead of focusing on a single taxon, to be as representative as possible of the whole community (Karr, 1991; Kremen, 1994; Carignan and Villard, 2002). They also provide a cost- and time-effective way to assess the ecological condition of communities facing environmental pressures that would otherwise be too complex to measure directly (Kreisel, 1984; Davis, 1989; di Castri et al., 1992; Hilty and Merenlender, 2000).
Conclusion
Our analyses detected an important oxygen threshold link with hypoxia for EGSL epibenthic communities. Hypoxic conditions in the estuary were correlated with a major shift in epibenthic community composition that was clearly visible in the clustering analysis. The estuary seems largely dominated by a high biomass of fast colonizers, quick-growing, small-sized opportunistic taxa. However, multiple pressures overlap in the estuary and it remains difficult to differentiate the individual impact of single pressure since interaction patterns are unknown. Indeed, this threshold is most probably caused by hypoxic conditions and more broadly by pressures related to eutrophication, such as acidification and increased organic loading. This study also fills a major gap in the conservation of benthic communities in the EGSL, namely the absence of indicators to monitor the condition of epibenthic communities. Four taxa, Actinostola callosa, Actinauge cristata, Ctenodiscus crispatus, and Brisaster fragilis were identified as good indicators to detect the major threshold in community composition observed in the gradient forest analysis. Indicator species act as sentinels of the state of a community by reducing the complexity of the system under study (Borja et al., 2000). These indicators will allow spatial and temporal monitoring of EGSL epibenthic communities and could be used as part of research, evaluation, or monitoring program to make conservation and preservation decisions. This study is a first step toward obtaining indicators to establish the condition of epibenthic communities in the EGSL. Further development of more complex indicators combining the abundance of several species in a formula would be interesting to ultimately create a chart of the state of benthic communities based on the results obtained for these indicators. As models predict that temperatures of EGSL deep-waters will continue to rise and lead to decreased oxygen concentrations in the near future, indicators will be essential to make informed management decisions and environmental policies to protect the integrity of EGSL epibenthic communities.
Data Availability Statement
Publicly available datasets were analyzed in this study. This data can be found here: https://obis.org/dataset/ce3c5c7d-daa0-42ed-9cdb-7100b1274b55.
Author Contributions
PA and CM developed this project for the “Canadian Healthy Ocean Network (CHONe),” a strategic research program funded by NSERC. The sampling campaigns were managed by the Fisheries and Oceans Canada (DFO), Quebec region, onboard the research vessel CCGS Teleost. This mission has taken place every year in August since 2004. LI participated in missions in 2017 and 2018, as a master student. DB contributed to the acquisition of data of environmental variables. All authors contributed to data, analyses, and writing based on their respective expertise and contributed to the revision of the manuscript.
Funding
This research was sponsored by the Natural Sciences and Engineering Research Council of Canada attributed to the Canadian Healthy Oceans Network and its Partners: Fisheries and Oceans Canada and INREST (representing the Port of Sept-Îles and City of Sept-Îles). Québec-Océan also provided financial support for workshops, conferences, and research activities.
Conflict of Interest
The authors declare that the research was conducted in the absence of any commercial or financial relationships that could be construed as a potential conflict of interest.
Publisher’s Note
All claims expressed in this article are solely those of the authors and do not necessarily represent those of their affiliated organizations, or those of the publisher, the editors and the reviewers. Any product that may be evaluated in this article, or claim that may be made by its manufacturer, is not guaranteed or endorsed by the publisher.
Acknowledgments
We thank all the crew members of the CCGS Teleost from Newfoundland and Institut Maurice-Lamontagne for sampling campaigns. We also thank Denis Bernier from DFO Institut Maurice-Lamontagne who provided the data from the fishery surveys.
Supplementary Material
The Supplementary Material for this article can be found online at: https://www.frontiersin.org/articles/10.3389/fmars.2021.720710/full#supplementary-material
References
Alexander, D. W., Sooley, D. R., Mullins, C. C., Chiasson, M. I., Cabana, A. M., Klvana, I., et al. (2010). Gulf of St. Lawrence: Human Systems Overview Report. Oceans. Habitat and Species at Risk Publication Series, Newfoundland and Labrador Region. Available online at: https://publications.gc.ca/site/eng/9.619705/publication.html (accessed February 9, 2020).
Aller, R. C. (1982). “The effects of macrobenthos on chemical properties of marine sediment and overlying water,” in Animal-Sediment Relations, eds P. L. McCall and M. J. S. Tevesz (New York, NY: Plenum Press), 53–102. doi: 10.1007/978-1-4757-1317-6_2
Andersen, T., Carstensen, J., Hernandez-Garcia, E., and Duarte, C. M. (2009). Ecological thresholds and regime shifts: approaches to identification. Trends Ecol. Evol. 24, 49–57. doi: 10.1016/j.tree.2008.07.014
Baker, M. E., and King, R. S. (2010). A new method for detecting and interpreting biodiversity and ecological community thresholds. Methods Ecol. Evol. 1, 25–37. doi: 10.1111/j.2041-210X.2009.00007.x
Beauchesne, D., Daigle, R. M., Vissault, S., Gravel, D., Bastien, A., Belanger, S., et al. (2020). Characterizing exposure to and sharing knowledge of drivers of environmental change in the St. Lawrence system in Canada. Front. Mar. Sci. 7:383. doi: 10.3389/fmars.2020.00383
Beazley, L., Kenchington, E., Yashayaev, I., and Murillo, F. J. (2015). Drivers of epibenthic megafaunal composition in the sponge grounds of the Sackville Spur, northwest Atlantic. Deep Sea Res. Part I Oceanogr. Res. Pap. 98, 102–114. doi: 10.1016/j.dsr.2014.11.016
Belley, R., Archambault, P., Sundby, B., Gilbert, F., and Gagnon, J. M. (2010). Effects of hypoxia on benthic macrofauna and bioturbation in the Estuary and Gulf of St. Lawrence, Canada. Cont. Shelf Res. 30, 1302–1313. doi: 10.1016/j.csr.2010.04.010
Benoît, H. P., Gagné, J. A., Savenkoff, C., Ouellet, P., and Bourassa, M.-N. (2012). State of the Ocean Report for the Gulf of St. Lawrence Integrated Management (GOSLIM). Can. Man. Rep. Fish. Aquat. Sci. 2986, ix+73.
Bholowalia, P., and Kumar, A. (2014). EBK-Means: a clustering technique based on Elbow Method and K-Means in WSN. Int. J. Comput. Appl. 105, 17–24.
Blais, M., Galbraith, P. S., Plourde, S., Scarratt, M., Devine, L., and Lehoux, C. (2019). Chemical and biological oceanographic conditions in the estuary and Gulf of St. Lawrence during 2017. Can. Tech. Rep. Fish. Aquat. Sci. 2019/009, iv+56.
Bleich, S., Powilleit, M., Seifert, T., and Graf, G. (2011). β-diversity as a measure of species turnover along the salinity gradient in the Baltic Sea, and its consistency with the Venice System. Mar. Ecol. Prog. Ser. 436, 101–118. doi: 10.3354/meps09219
Borja, A., Franco, J., and Perez, V. (2000). A marine biotic index to establish the ecological quality of soft-bottom benthos within European estuarine and coastal environments. Mar. Pollut. Bull. 40, 1100–1114. doi: 10.1016/S0025-326X(00)00061-8
Bourdages, H., Brassard, C., Desgagnés, M., Galbraith, P., Gauthier, J., Nozères, C., et al. (2018). Preliminary results from the groundfish and shrimp multidisciplinary survey in August 2017 in the Estuary and northern Gulf of St. Lawrence. DFO Can. Sci. Advis. Sec. Res. Doc. 2018/036, iv+90.
Bourget, E., Ardisson, P. L., Lapointe, L., and Daigle, G. (2003). Environmental factors as predictors of epibenthic assemblage biomass in the St. Lawrence system. Estuar. Coast. Shelf Sci. 57, 641–652. doi: 10.1016/s0272-7714(02)00404-3
Bray, J. R., and Curtis, J. T. (1957). An ordination of the upland forest of Southern Wisconsin. Ecol. Monogr. 27, 326–349.
Brenden, T. O., Wang, L. Z., and Su, Z. M. (2008). Quantitative identification of disturbance thresholds in support of aquatic resource management. Environ. Manage. 42, 821–832. doi: 10.1007/s00267-008-9150-2
Brix, O., Lykkeboe, G., and Johansen, K. (1979). Reversed bohr and root shifts in hemocyanin of the marine prosobranch, Buccinum undatum: adaptations to a periodically hypoxic habitat. J. Comp. Physiol. A 129, 97–103. doi: 10.1007/bf00798171
Buhl-Mortensen, L., Vanreusel, A., Gooday, A. J., Levin, L. A., Priede, I. G., Buhl-Mortensen, P., et al. (2010). Biological structures as a source of habitat heterogeneity and biodiversity on the deep ocean margins. Mar. Ecol. 31, 21–50. doi: 10.1111/j.1439-0485.2010.00359.x
Bundy, A., Lilly, G. R., and Shelton, P. A. (2000). A mass-balance model of the Newfoundland-Labrador Shelf. Can. Tech. Rep. Fish. Aquat. Sci. 2310, 14–157.
Carignan, V., and Villard, M. A. (2002). Selecting indicator species to monitor ecological integrity: a review. Environ. Monit. Assess. 78, 45–61. doi: 10.1023/a:1016136723584
Carney, R. S. (2005). Zonation of deep biota on continental margins. Oceanogr Mar. Biol. Annu. Rev. 43, 211–278. doi: 10.1201/9781420037449.ch6
Carrier-Belleau, C., Drolet, D., McKindsey, C. W., and Archambault, P. (2021). Environmental stressors, complex interactions and marine benthic communities’ responses. Sci. Rep. 11:4194. doi: 10.1038/s41598-021-83533-1
Claret, M., Galbraith, E. D., Palter, J. B., Bianchi, D., Fennel, K., Gilbert, D., et al. (2018). Rapid coastal deoxygenation due to ocean circulation shift in the northwest Atlantic. Nat. Clim. Change 8, 868–872. doi: 10.1038/s41558-018-0263-1
Côté, I. M., Darling, E. S., and Brown, C. J. (2016). Interactions among ecosystem stressors and their importance in conservation. Proc. R. Soc. Lond. Ser. B. Biol. Sci. 283:20152592. doi: 10.1098/rspb.2015.2592
Crain, C. M., Kroeker, K., and Halpern, B. S. (2008). Interactive and cumulative effects of multiple human stressors in marine systems. Ecol. Lett. 11, 1304–1315. doi: 10.1111/j.1461-0248.2008.01253.x
Dauer, D. M. (1993). Biological criteria, environmental-health and estuarine macrobenthic community structure. Mar. Pollut. Bull. 26, 249–257. doi: 10.1016/0025-326x(93)90063-p
Dauer, D. M., Ewing, R. M., and Rodi, A. J. (1987). Macrobenthic distribution within the sediment along an estuarine salinity gradient - Benthic studies of the Lower Chesapeake Bay. Int. Rev. Gesamten Hydrobiol. 72, 529–538. doi: 10.1002/iroh.19870720502
Dauer, D. M., Rodi, A. J., and Ranasinghe, J. A. (1992). Effects of low dissolved-oxygen events on the macrobenthos of the Lower Chesapeake Bay. Estuaries 15, 384–391. doi: 10.2307/1352785
Davis, G. E. (1989). Design of a long-term ecological monitoring program for Channel Islands National Park, California. Nat. Areas J. 9, 80–89.
De Cáceres, M., Legendre, P., and Moretti, M. (2010). Improving indicator species analysis by combining groups of sites. Oikos 119, 1674–1684. doi: 10.1111/j.1600-0706.2010.18334.x
DFO (2002). Shrimp of the Estuary and Gulf of St. Lawrence. Mont-Joli, QC: Fisheries and Oceans Canada (DFO)
DFO (2016). Zonal Interchange File Format (ZIFF) Data. A Compilation of Landing Data From Logbook Data Between 2010 and 2015. Mont-Joli, QC: Fisheries and Oceans Canada (DFO).
di Castri, F., Vernhes, J. R., and Younés, T. (1992). Inventorying and monitoring biodiversity: a proposal for an international network. Vegetatio 103, 1–28.
Diaz, R. J., and Rosenberg, R. (1995). Marine benthic hypoxia: a review of its ecological effects and the behavioural responses of benthic macrofauna. Oceanogr Mar. Biol. Annu. Rev. 33, 245–303.
Diaz, R. J., and Rosenberg, R. (2008). Spreading dead zones and consequences for marine ecosystems. Science 321, 926–929. doi: 10.1126/science.1156401
Dufour, R., and Ouellet, P. (2007). Estuary and Gulf of St. Lawrence marine ecosystem overview and assessment report. Can. Tech. Rep. Fish. Aquat. Sci. 2744E, vii + 112.
Dufrêne, M., and Legendre, R. (1997). Species assemblages and indicator species: the need for a flexible asymmetrical approach. Ecol. Monogr. 67, 345–366. doi: 10.2307/2963459
Ellis, N., Smith, S. J., and Pitcher, C. R. (2012). Gradient forests: calculating importance gradients on physical predictors. Ecology 93, 156–168. doi: 10.1890/11-0252.1
El-Sabh, M. I., and Silverberg, N. (1990). Oceanography of a Large-Scale Estuarine System. The St Lawrence. New York, NY: Springer-Verlag.
Foley, M. M., Marton, R. G., Fox, M. D., Kappel, C. V., Mease, L. A., Erickson, A. L., et al. (2015). Using ecological thresholds to inform resource management: current options and future possibilities. Front. Mar. Sci. 2:95. doi: 10.3389/fmars.2015.00095
Gage, J. D., and Tyler, P. A. (1991). Deep-Sea Biology: A Natural History of Organisms at the Deep-Sea Floor. Cambridge: Cambridge University Press.
Gagnon, P. (1991). Optimisation des campagnes d’échantillonnage: les programmes REGROUPE et PARTS. Rapp. Tech. Can. Sci. Halieut. Aquat. 1818, 3–20.
Galbraith, P. S. (2006). Winter water masses in the Gulf of St. Lawrence. J. Geophys. Res. Oceans 111:C06022. doi: 10.1029/2005jc003159
Galbraith, P. S., Chassé, J., Caverhill, C., Nicot, P., Gilbert, D., Lefaivre, D., et al. (2019). Physical oceanographic conditions in the Gulf of St. Lawrence during 2018. DFO Can. Sci. Advis. Sec. Res. Doc. 2019/046, 4–79.
Galbraith, P. S., Chassé, J., Shaw, J.-L., Dumas, J., Caverhill, C., Lefaivre, D., et al. (2020). Physical oceanographic conditions in the Gulf of St. Lawrence during 2019. DFO Can. Sci. Advis. Sec. Res. Doc. 2020/030, 4–84.
Gilbert, D., Chabot, D., Archambault, P., Rondeau, B., and Hébert, S. (2007). Appauvrissement en oxygène dans les eaux profondes du Saint-Laurent marin: causes possibles et impacts écologiques. Le Natur. Can. 131, 67–75.
Gilbert, D., Sundby, B., Gobeil, C., Mucci, A., and Tremblay, G. H. (2005). A seventy-two-year record of diminishing deep-water oxygen in the St. Lawrence estuary: the northwest Atlantic connection. Limnol. Oceanogr. 50, 1654–1666. doi: 10.4319/lo.2005.50.5.1654
Gooday, A. J., Jorissen, F., Levin, L. A., Middelburg, J. J., Naqvi, S. W. A., Rabalais, N. N., et al. (2009). Historical records of coastal eutrophication-induced hypoxia. Biogeosciences 6, 1707–1745. doi: 10.5194/bg-6-1707-2009
Groffman, P., Baron, J., Blett, T., Gold, A., Goodman, I., Gunderson, L., et al. (2006). Ecological thresholds: the key to successful environmental management or an important concept with no practical application? Ecosystems 9, 1–13. doi: 10.1007/s10021-003-0142-z
Groom, M. J., Meffe, G. K., and Carroll, C. R. (1997). Principles of Conservation Biology. Sunderland, MA: Sinauer Associates.
Hale, R., Calosi, P., McNeill, L., Mieszkowska, N., and Widdicombe, S. (2011). Predicted levels of future ocean acidification and temperature rise could alter community structure and biodiversity in marine benthic communities. Oikos 120, 661–674. doi: 10.1111/j.1600-0706.2010.19469.x
Halpern, B. S., Frazier, M., Potapenko, J., Casey, K. S., Koenig, K., Longo, C., et al. (2015). Spatial and temporal changes in cumulative human impacts on the world’s ocean. Nat. Commun. 6:7615. doi: 10.1038/ncomms8615
Halpern, B. S., Walbridge, S., Selkoe, K. A., Kappel, C. V., Micheli, F., D’Agrosa, C., et al. (2008). A global map of human impact on marine ecosystems. Science 319, 948–952. doi: 10.1126/science.1149345
Helly, J. J., and Levin, L. A. (2004). Global distribution of naturally occurring marine hypoxia on continental margins. Deep Sea Res. Part I Oceanogr. Res. Pap. 51, 1159–1168. doi: 10.1016/j.dsr.2004.03.009
Hilty, J., and Merenlender, A. (2000). Faunal indicator taxa selection for monitoring ecosystem health. Biol. Conserv. 92, 185–197. doi: 10.1016/s0006-3207(99)00052-x
Hoegh-Guldberg, O., and Bruno, J. F. (2010). The impact of climate change on the world’s marine ecosystems. Science 328, 1523–1528. doi: 10.1126/science.1189930
Huggett, A. J. (2005). The concept and utility of ‘ecological thresholds’ in biodiversity conservation. Biol. Conserv. 124, 301–310. doi: 10.1016/j.biocon.2005.01.037
Jamieson, G., O’Boyle, R., Arbour, J., Cobb, D., Courtenay, S., Gregory, R., et al. (2001). Proceedings of the national workshop on objectives and indicators for ecosystem-based management. DFO Can. Sci. Advis. Sec. Proc. Ser. 200:140.
Jouffray, J.-B., Blasiak, R., Norström, A., Österblom, H., and Nyström, M. (2020). The Blue Acceleration: the Trajectory of Human Expansion into the Ocean. One Earth 2, 43–54. doi: 10.1016/j.oneear.2019.12.016
Karr, J. R. (1991). Biological integrity - A long-neglected aspect of water-resource management. Ecol. Appl. 1, 66–84. doi: 10.2307/1941848
Kelly, R. P., Erickson, A. L., and Mease, L. A. (2014). How not to fall off a cliff, or using tipping points to improve environmental management. Ecol. Law Q. 41, 843–886.
Kreisel, W. E. (1984). Representation of the environmental-quality profile of a metropolitan area. Environ. Monit. Assess. 4, 15–33. doi: 10.1007/bf01047618
Kremen, C. (1994). Biological inventory using target taxa: a case study of the butterflies of Madagascar. Ecol. Appl. 4, 407–422. doi: 10.2307/1941946
Landres, P. B., Verner, J., and Thomas, J. W. (1988). Ecological uses of vertebrate indicator species: a critique. Conserv. Biol. 2, 316–328. doi: 10.1111/j.1523-1739.1988.tb00195.x
Large, S. I., Fay, G., Friedland, K. D., and Link, J. S. (2015). Critical points in ecosystem responses to fishing and environmental pressures. Mar. Ecol. Prog. Ser. 521, 1–17. doi: 10.3354/meps11165
Lavoie, D., Lambert, N., and Gilbert, D. (2019). Projections of future trends in biogeochemical conditions in the Northwest Atlantic using CMIP5 Earth System Models. Atmos. Ocean 57, 18–40. doi: 10.1080/07055900.2017.1401973
Lehmann, M. F., Barnett, B., Gelinas, Y., Gilbert, D., Maranger, R. J., Mucci, A., et al. (2009). Aerobic respiration and hypoxia in the Lower St. Lawrence Estuary: stable isotope ratios of dissolved oxygen constrain oxygen sink partitioning. Limnol. Oceanogr. 54, 2157–2169. doi: 10.4319/lo.2009.54.6.2157
Lévesque, M. (2009). Caractérisation de la Macrofaune Épibenthique de L’estuaire et du Nord du Golfe du Saint-Laurent (Québec-Canada) en Relation avec les Paramètres Environnementaux: Analyses Multivariées et Approche de Géostatistique. Master’s thesis. Rimouski, QC: Université du Québec à Rimouski.
Lévesque, M., Archambault, P., McKindsey, C. W., Vaz, S., and Archambault, D. (2010). Predictive benthic habitat suitability model for the Estuary and the northern Gulf of St. Lawrence (2006). Can. Tech. Rep. Fish. Aquat. Sci. 2893, vii+20.
Levin, L. A. (2003). Oxygen minimum zone benthos: adaptation and community response to hypoxia. Oceanogr. Mar. Biol. Annu. Rev. 41, 1–45.
Levin, L. A., Ekau, W., Gooday, A. J., Jorissen, F., Middelburg, J. J., Naqvi, S. W. A., et al. (2009). Effects of natural and human-induced hypoxia on coastal benthos. Biogeosciences 6, 2063–2098. doi: 10.5194/bg-6-2063-2009
Levinton, J. S. (1970). The paleoecological significance of opportunistic taxa. Lethaia 3, 69–78. doi: 10.1111/j.1502-3931.1970.tb01264.x
MacCraken, M., Escobar Briones, E., Gilbert, D., Korotaev, G., Naqvi, W., Perillo, G. M. E., et al. (2008). “Vulnerability of semi-enclosed marine systems to environmental disturbances,” in Watersheds, Bays, and Bounded Seas: The Science and Management of Semi-Enclosed Marine Systems, eds P. M. Rizzoli, J. M. Melillo, B. Sundby, and E. R. Urban Jr. (Washington, DC: Island Press), 8–23.
Moritz, C., Gravel, D., Savard, L., McKindsey, C. W., Brethes, J. C., and Archambault, P. (2015). No more detectable fishing effect on Northern Gulf of St Lawrence benthic invertebrates. ICES J. Mar. Sci. 72, 2457–2466. doi: 10.1093/icesjms/fsv124
Moritz, C., Levesque, M., Gravel, D., Vaz, S., Archambault, D., and Archambault, P. (2013). Modelling spatial distribution of epibenthic communities in the Gulf of St. Lawrence (Canada). J. Sea Res. 78, 75–84. doi: 10.1016/j.seares.2012.10.009
Mucci, A., Starr, M., Gilbert, D., and Sundby, B. (2011). Acidification of Lower St. Lawrence estuary bottom waters. Atmos. Ocean 49, 206–218. doi: 10.1080/07055900.2011.599265
Murillo, F. J., Kenchington, E., Beazley, L., Lirette, C., Knudby, A., Guijarro, J., et al. (2016). Distribution Modelling of sea pens, sponges, stalked tunicates and soft corals from research vessel survey data in the Gulf of St. Lawrence for use in the identification of significant benthic areas. DFO Can. Sci. Advis. Sec. Res. Doc. 3170, vi+132.
Murray, K., and Conner, M. M. (2009). Methods to quantify variable importance: implications for the analysis of noisy ecological data. Ecology 90, 348–355. doi: 10.1890/07-1929.1
Myers, R. A., and Worm, B. (2003). Rapid worldwide depletion of predatory fish communities. Nature 423, 280–283. doi: 10.1038/nature01610
Newell, R. I. E. (2004). Ecosystem influences of natural and cultivated populations of suspension-feeding bivalve molluscs: a review. J. Shellfish Res. 23, 51–61.
Oksanen, J., Blanchet, F. G., Friendly, M., Kindt, R., Legendre, P., McGlinn, D., et al. (2019). vegan: Community Ecology Package. Available online at: https://CRAN.R-project.org/package=vegan (accessed January 16, 2020).
Oshiro, T. M., Perez, P. S., and Baranauskas, J. A. (2012). “How many trees in a random forest?,” in Machine Learning and Data Mining in Pattern Recognition, ed. P. Perner (New York, NY: Springer), 154–168. doi: 10.1007/978-3-642-31537-4_13
Ouellet, P., Savard, L., and Larouche, P. (2007). Spring oceanographic conditions and northern shrimp Pandalus borealis recruitment success in the north-western Gulf of St. Lawrence. Mar. Ecol. Prog. Ser. 339, 229–241. doi: 10.3354/meps339229
Pearson, T. H., and Rosenberg, R. (1978). Macrobenthic succession in relation to organic enrichment and pollution of the marine environment. Oceanogr. Mar. Biol. Annu. Rev. 16, 229–234.
Petrie, B., Drinkwater, K., Sandstrom, A., Pettipas, R., Gregory, D., Gilbert, D., et al. (1996). Temperature, salinity and sigma-t atlas for the Gulf of St. Lawrence. DFO Can. Tech. Rep. Hydrogr. Ocean Sci. 178, v+256.
Poitevin, P., Thebault, J., Siebert, V., Donnet, S., Archambault, P., Dore, J., et al. (2019). Growth response of Arctica Islandica to North Atlantic oceanographic conditions Since 1850. Front. Mar. Sci. 6:483. doi: 10.3389/fmars.2019.00483
R Core Team (2018). R: A Language and Environment for Statistical Computing. Available online at: https://www.R-project.org/ (accessed December 8, 2020).
Rabalais, N. N., Diaz, R. J., Levin, L. A., Turner, R. E., Gilbert, D., and Zhang, J. (2010). Dynamics and distribution of natural and human-caused hypoxia. Biogeosciences 7, 585–619. doi: 10.5194/bg-7-585-2010
Rhoads, D. C. (1974). Organism-sediment relations on the muddy seafloor. Oceanogr. Mar. Biol. Annu. Rev. 12, 263–300.
Rosenberg, R., Nilsson, H. C., and Diaz, R. J. (2001). Response of benthic fauna and changing sediment redox profiles over a hypoxic gradient. Estuar. Coast. Shelf Sci. 53, 343–350. doi: 10.1006/ecss.2001.0810
Samhouri, J. F., Levin, P. S., James, C. A., Kershner, J., and Williams, G. (2011). Using existing scientific capacity to set targets for ecosystem-based management: a Puget Sound case study. Mar. Policy 35, 508–518. doi: 10.1016/j.marpol.2010.12.002
Saucier, F. J., Roy, F., Gilbert, D., Pellerin, P., and Ritchie, H. (2003). Modeling the formation and circulation processes of water masses and sea ice in the Gulf of St. Lawrence, Canada. J. Geophys. Res. Oceans 108:3269. doi: 10.1029/2000jc000686
Savenkoff, C., Gagne, J. A., Gilbert, M., Castonguay, M., Chabot, D., Chasse, J., et al. (2017). Le concept d’approche écosystemique appliqué à l’estuaire maritime du Saint-Laurent (Canada). Environ. Rev. 25, 26–96. doi: 10.1139/er-2015-0083
Schiel, D. R., Steinbeck, J. R., and Foster, M. S. (2004). Ten years of induced ocean warming causes comprehensive changes in marine benthic communities. Ecology 85, 1833–1839. doi: 10.1890/03-3107
Shick, J. M. (1976). Physiological and behavioral responses to hypoxia and hydrogen sulfide in the infaunal asteroid Ctenodiscus crispatus. Mar. Biol. 37, 279–289. doi: 10.1007/bf00387613
Sonderegger, D. L., Wang, H. N., Clements, W. H., and Noon, B. R. (2009). Using SiZer to detect thresholds in ecological data. Front. Ecol. Environ. 7, 190–195. doi: 10.1890/070179
Suding, K. N., and Hobbs, R. J. (2009). Threshold models in restoration and conservation: a developing framework. Trends Ecol. Evol. 24, 271–279. doi: 10.1016/j.tree.2008.11.012
Therriault, J. C. (1991). The Gulf of St. Lawrence: Small ocean or big estuary? DFO Can. Spec. Publ. Fish. Aquat. Sci. 113:359.
Thibodeau, B., de Vernal, A., and Limoges, A. (2013). Low oxygen events in the Laurentian Channel during the Holocene. Mar. Geol. 346, 183–191. doi: 10.1016/j.margeo.2013.08.004
Thibodeau, B., De Vernal, A., and Mucci, A. (2006). Enhanced primary productivity, organic carbon fluxes and the development of hypoxic bottom waters in the Lower St. Lawrence estuary, eastern Canada: micropaleontological and geochemical evidence. Mar. Geol. 231, 37–50. doi: 10.1016/j.margeo.2006.05.010
Toms, J. D., and Lesperance, M. L. (2003). Piecewise regression: a tool for identifying ecological thresholds. Ecology 84, 2034–2041. doi: 10.1890/02-0472
Vaquer-Sunyer, R., and Duarte, C. M. (2008). Thresholds of hypoxia for marine biodiversity. Proc. Natl. Acad. Sci. U.S.A. 105, 15452–15457. doi: 10.1073/pnas.0803833105
Venice System. (1958). The Venice System for the classification of marine waters according to salinity. Limnol. Oceanogr. 3, 346–347. doi: 10.4319/lo.1958.3.3.0346
Vistisen, B., and Vismann, B. (1997). Tolerance to low oxygen and sulfide in Amphiura filiformis and Ophiura albida (Echinodermata: Ophiuroidea). Mar. Biol. 128, 241–246. doi: 10.1007/s002270050088
Walsh, S. J., and McCallum, B. R. (1997). Performance of the Campelen 1800 shrimp trawl during the 1995 Northwest Atlantic Fisheries Centre autumn Groundfish Survey. Available online at: https://www.infona.pl/resource/bwmeta1.element.elsevier-9b39731f-fb07-30ea-a6c9-0a69e96714e8/tab/contributors (accessed January 16, 2021).
Walther, G. R., Post, E., Convey, P., Menzel, A., Parmesan, C., Beebee, T. J. C., et al. (2002). Ecological responses to recent climate change. Nature 416, 389–395. doi: 10.1038/416389a
Ward, J. H. (1963). Hierarchical grouping to optimize an objective function. J. Am. Stat. Assoc. 58, 236–244. doi: 10.2307/2282967
Weisberg, S. B., Ranasinghe, J. A., Schaffner, L. C., Diaz, R. J., Dauer, D. M., and Frithsen, J. B. (1997). An estuarine benthic index of biotic integrity (B-IBI) for Chesapeake Bay. Estuaries 20, 149–158. doi: 10.2307/1352728
Worm, B., Barbier, E. B., Beaumont, N., Duffy, J. E., Folke, C., Halpern, B. S., et al. (2006). Impacts of biodiversity loss on ocean ecosystem services. Science 314, 787–790. doi: 10.1126/science.1132294
Wu, R. S. S. (2002). Hypoxia: from molecular responses to ecosystem responses. Mar. Pollut. Bull. 45, 35–45. doi: 10.1016/s0025-326x(02)00061-9
Keywords: biodiversity, ecological thresholds, epibenthic communities, estuary and Gulf of St. Lawrence, multiple pressures, climate change, indicator taxa
Citation: Isabel L, Beauchesne D, McKindsey C and Archambault P (2021) Detection of Ecological Thresholds and Selection of Indicator Taxa for Epibenthic Communities Exposed to Multiple Pressures. Front. Mar. Sci. 8:720710. doi: 10.3389/fmars.2021.720710
Received: 04 June 2021; Accepted: 20 September 2021;
Published: 08 October 2021.
Edited by:
Jose Manuel Guerra-García, Seville University, SpainReviewed by:
Thadickal V. Joydas, King Fahd University of Petroleum and Minerals, Saudi ArabiaPål Buhl-Mortensen, Norwegian Institute of Marine Research (IMR), Norway
Copyright © 2021 Isabel, Beauchesne, McKindsey and Archambault. This is an open-access article distributed under the terms of the Creative Commons Attribution License (CC BY). The use, distribution or reproduction in other forums is permitted, provided the original author(s) and the copyright owner(s) are credited and that the original publication in this journal is cited, in accordance with accepted academic practice. No use, distribution or reproduction is permitted which does not comply with these terms.
*Correspondence: Laurie Isabel, Laurie.Isabel@dfo-mpo.gc.ca