Seasonal Predictions of Holopelagic Sargassum Across the Tropical Atlantic Accounting for Uncertainty in Drivers and Processes: The SARTRAC Ensemble Forecast System
 Robert Marsh1*
  Kwasi Appeaning Addo2
  Philip-Neri Jayson-Quashigah2
  Hazel A. Oxenford3
  Ava Maxam4
  Romario Anderson4
  Nikolaos Skliris1
  Jadu Dash5
  Emma L. Tompkins5
- 1School of Ocean and Earth Science, University of Southampton, Southampton, United Kingdom
- 2Institute for Environment and Sanitation Studies, University of Ghana, Accra, Ghana
- 3Centre for Resource Management and Environmental Studies (CERMES), University of the West Indies, Bridgetown, Barbados
- 4Mona Geoinformatics Institute, University of the West Indies, Kingston, Jamaica
- 5School of Geography and Environmental Science, University of Southampton, Southampton, United Kingdom
The holopelagic macroalgae sargassum has proliferated across the tropical Atlantic since 2011, of consequence for coastal populations from West Africa to the Caribbean with limited early warning of major beaching events. As part of an interdisciplinary project, ‘Teleconnected SARgassum risks across the Atlantic: building capacity for TRansformational Adaptation in the Caribbean and West Africa’ (SARTRAC), an ensemble forecast system, SARTRAC-EFS, is providing seasonal predictions of sargassum drift. An eddy-resolving ocean model hindcast provides the winds and currents necessary to generate ensemble members. Ensemble forecasts are then obtained for different combinations of ‘windage’, the fractional influence of winds on sargassum mats, and in situ rates of growth, mortality, and sinking. Forecasts for north and south of Jamaica are evaluated with satellite-observed distributions, associated with beaching events in specific years of heavy inundation, 2015 and 2018-20. These seasonal forecasts are evaluated, on lead times of up to 180 days. Forecasts are subject to leading modes of tropical climate variability, in particular the Atlantic Meridional Mode (AMM). More accurate forecasts for a given year are obtained with ensemble members from hindcast years with a similar spring AMM-index. This is most clearly evident during negative AMM phases in spring of 2015 and 2018, when positive sea surface temperature anomalies and anomalously weak trade winds were established across the northern tropics. On this evidence, SARTRAC-EFS is potentially useful in providing early warning of high sargassum prevalence. Extended to sargassum drift off West Africa, extensive cloud cover limits availability of the satellite data needed for full application and evaluation of SARTRAC-EFS in this region, although experimental forecasts off the coast of Ghana are found highly sensitive to the windage that is associated with strong onshore winds during boreal summer. Alongside other forecast systems, SARTRAC-EFS is providing useful early warnings of sargassum inundation at seasonal timescale.
Introduction
In recent years, holopelagic sargassum macroalgae (seaweed) has been increasingly recorded far beyond the Sargasso Sea – named after the prevalent seaweed – in the western subtropical gyre in the North Atlantic (Fidai et al., 2020). Large quantities of sargassum notably appeared across the tropical Atlantic during the summer of 2011 (Franks et al., 2012). Proliferation of sargassum in most years since 2011 has been consequential, as it accumulates and decomposes on beaches, causing damage to ecosystems (van Tussenbroek et al., 2017) and adversely impacting human health and livelihoods (UNEP, 2018). A wide range of uses for sargassum has meanwhile been identified, providing business opportunities (Desrochers et al., 2020). The unpredictable supply of sargassum is however identified as one of five challenges that face stakeholders concerned with potential opportunities for sargassum reuse and valorisation (Oxenford et al., 2021). For resilient adaptation to this environmental challenge, we therefore need to better understand and predict the annual influxes of sargassum to beaches throughout the tropical Atlantic.
Like the Sargasso Sea, pelagic sargassum in the Caribbean comprises two species, Sargassum natans and S. fluitans, including several morphotypes or forms. Early inundations, however, were dominated by a form considered rare in the Sargasso Sea, Sargassum natans VIII (Schell et al., 2015; García-Sánchez et al., 2020). S. fluitans and S. natans have also been sampled along the coast of Ghana since 2009 and not being indigenous to the Gulf of Guinea, were considered to have originated in the Sargasso Sea (Addico and deGraft-Johnson, 2016). These species of sargassum were also identified further to the east, off the coast of Nigeria, in 2012 (Oyesiku and Egunyomi, 2014). The basin-scale extent of these species has led to recognition of the ‘great Atlantic Sargassum belt’ (Wang et al., 2019).
Hydrometeorological processes such as currents and wind not only drive oceanic movement of sargassum but also influence beaching along coastlines. These wide-scale oceanic processes however give way to local tidal, coastal currents, and prevailing wind and wave conditions, that further determine beaching events. In the Caribbean during 2019, for example, beached sargassum was mapped by the Mona Geoinformatics Institute using remote sensing and field validation techniques around the coastline of Jamaica (Anderson et al., 2021). Results revealed those particular shorelines to experience inundation, with much of the east and south coasts seeing some of the highest frequency of sargassum beaching that year (see Figure 1).
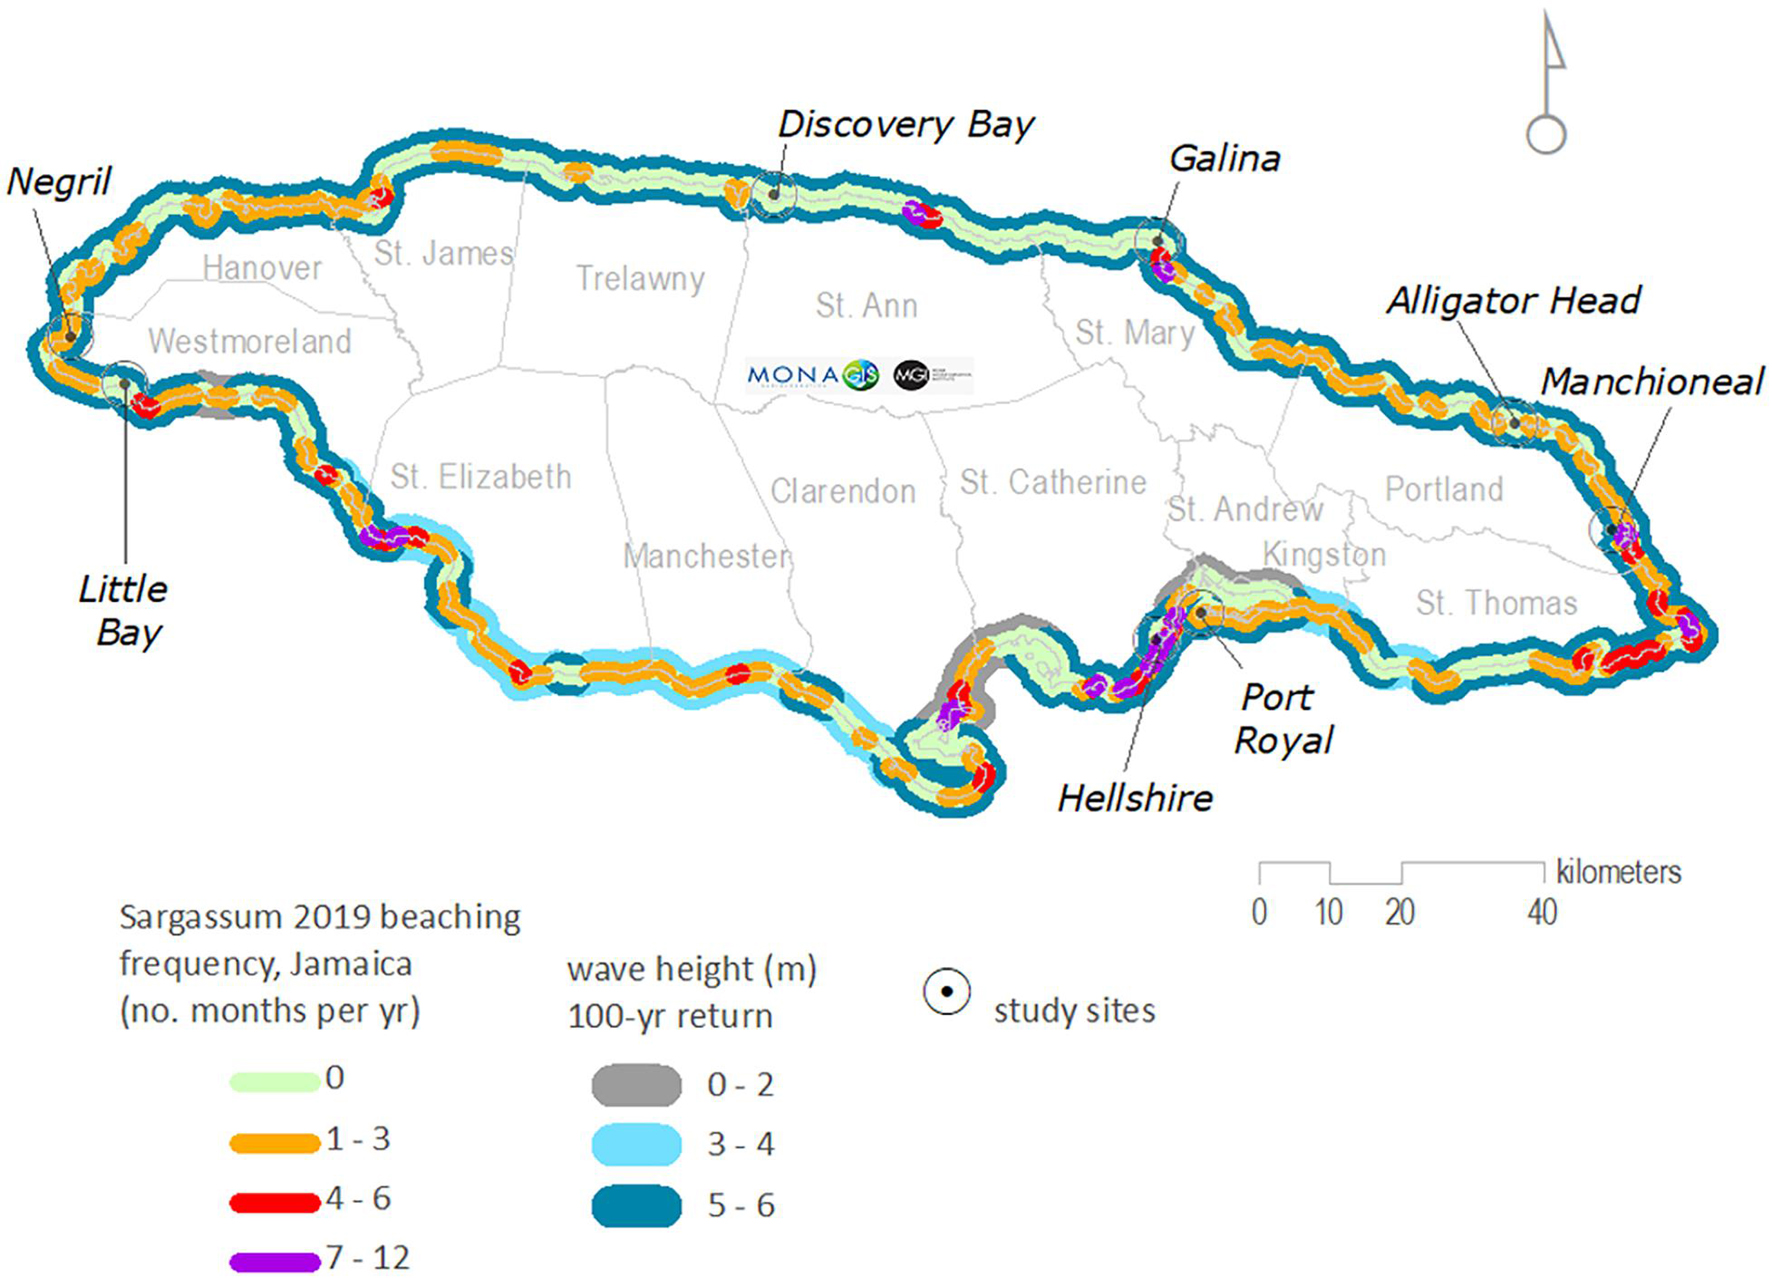
Figure 1. Sargassum beaching locations and frequency for Jamaica, 2019, mapped for every 1-km segment of coastline and overlain on average wave height (100-year return, source: Caribbean Disaster Mitigation Project, 2000). Eastern and southern locations such as Manchioneal (Portland) and Hellshire (St Catherine), respectively, were observed to have undergone particularly frequent sargassum inundation as a result of a combination of local hydrometeorological and geomorphological conditions favourable to beaching.
Trade winds from the north-east are attenuated by local changes in terrain such as high mountain ranges to the east of Jamaica. Offshore waves undergo refraction and significant energy dissipation on encountering wide, gentle-sloping shelf areas south of the island but far less so to the north of the island where the shelf is predominantly narrow and steep. Combined with a local diurnal wind regime, microtidal conditions and seasonal swells, various coasts are exposed to strong wind and wave conditions at different times of the year (Maxam and Webber, 2010).
While these hydrometeorological conditions will account for some of the beaching observed, some areas were shown on the map to experience significant inundation in both relatively active and calm wave environments. The shoreline of Clarendon (the central coast of south Jamaica – see Figure 1) notably exhibits this paradox. It is expected therefore that local shelf and shoreline changes will provide complexities in coastal geomorphology that will be significant in driving finer-scale processes and intensity of sargassum beaching in specific areas.
The west African coastline, from Senegal to Nigeria is likewise subject to highly variable quantities of beached sargassum, with notable beaching events recorded along the coast of Ghana, especially the western coast (Rhein-Knudsen et al., 2017), in late June of 2020 – see Figures 2A,B. This has been observed along the shore of many fishing villages (Ackah-Baidoo, 2013). Observations indicate that landings are prevalent on gently sloping beaches, especially along the western coast of Ghana. The focus here on large-scale processes should be appreciated in the context of local processes in our oceanographic regions of interest, around Jamaica and off Ghana.
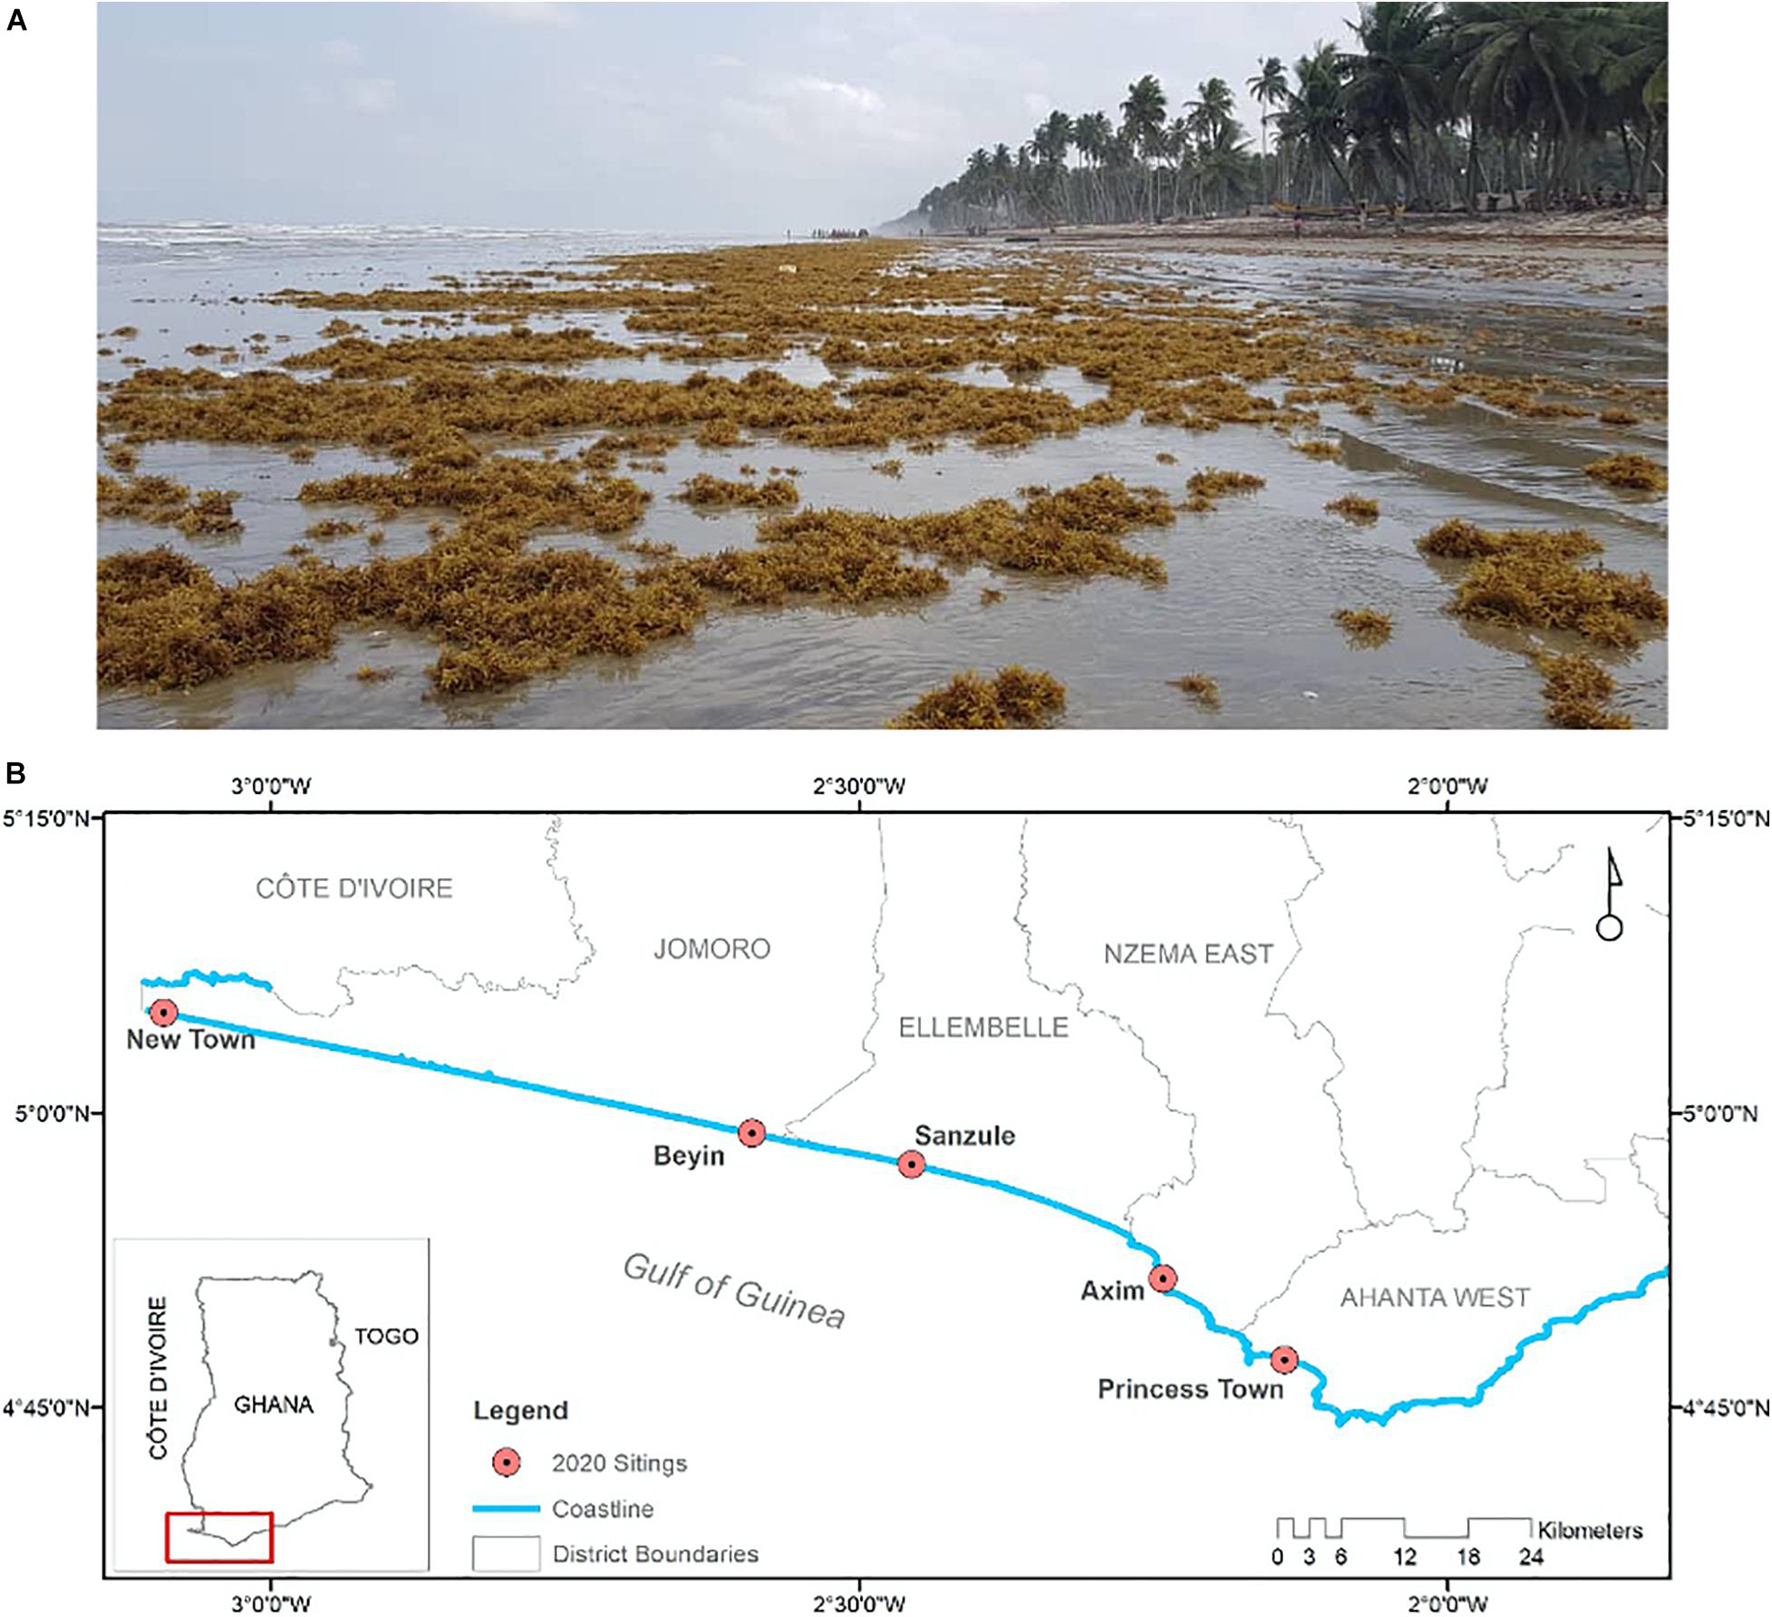
Figure 2. (A) Beached sargassum at Sanzule, on 20 June 2020, located in the centre of (B), which shows sites on the western coast of Ghana recording beached sargassum in June 2020.
Complementary to monitoring for sargassum at beaches, throughout the region, is remote sensing. Since 2011, innovative satellite remote sensing analysis has provided strong evidence for initial growth and establishment of sargassum in the equatorial Atlantic (Gower et al., 2013; Franks et al., 2016; Wang and Hu, 2016). Based on an ‘Alternative Floating Algae Index’ (AFAI), ‘FA_density’ maps are now provided daily, as the mean of the previous 7 days. The AFAI is an ocean colour index, obtained by utilising the spectral reflectance in red, near infrared and shortwave infrared of floating vegetation per 1-km pixel in images from the Moderate Resolution Imaging Spectroradiometer (MODIS) instrument that is currently onboard the Terra and Aqua satellite, translated as a fractional (or %) area covered by floating algae (Hu, 2009). Across the “Central Atlantic Region,” or “Central West Atlantic” (CWA), encompassing 38-63°W, 0-22°N (see Figure 3), the FA_density data can be summed to obtain a total area of sargassum, daily since February 2000, shown here in Figure 3. The inception of summer sargassum blooms in 2011 is clear, with considerable seasonal variability unfolding over subsequent years. Most extensive areas of sargassum developed through 2015, 2018, 2019 and 2020.
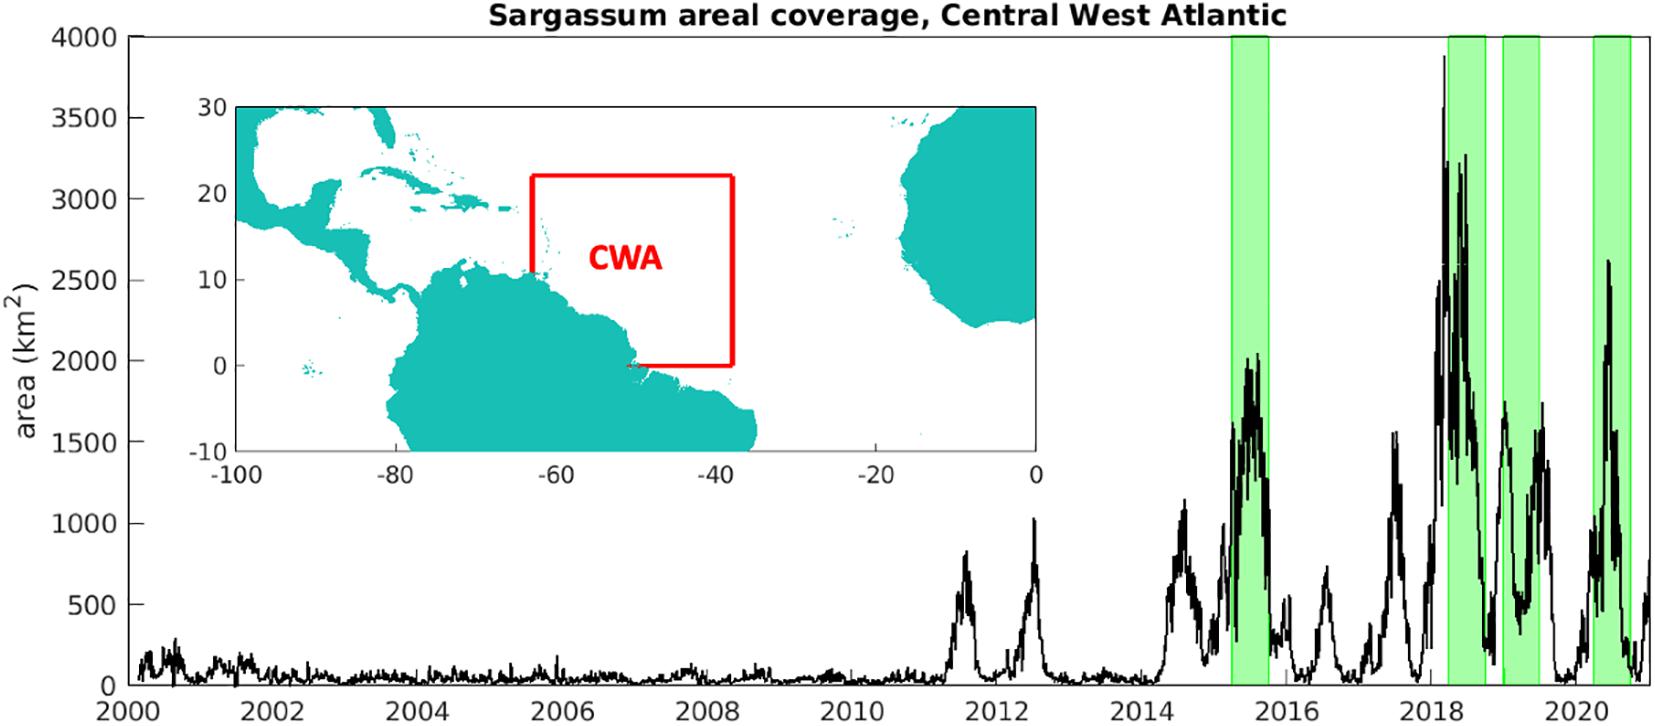
Figure 3. Total area of sargassum across CWA (km2), integrating areal fraction over 38–63°W, 0–22°N (see inset map), 2000-20. Area is inferred from satellite images provided by the Optical Oceanography Laboratory at the University of South Florida (https://optics.marine.usf.edu). The highlighted peaks correspond to four years (2015, 2018-20) when sargassum was present in large quantities around Jamaica, chosen to test our seasonal prediction system.
Recent proliferation of sargassum across the tropical Atlantic has attracted considerable scientific attention in the marine science community. A series of studies have established that increased presence of sargassum in the Caribbean can be traced back to the equatorial Atlantic, several months earlier (Franks et al., 2016; Brooks et al., 2018; Wang et al., 2019). Subsequent drift calculations based on currents from numerical models and a nominal 1% ‘windage’, provided compelling evidence for the drift of this sargassum from the equatorial Atlantic to the eastern Caribbean (Putman et al., 2018).
Johns et al. (2020) provide an extensive review and update on our understanding of the proliferation of sargassum since 2011. A basin-scale, tropical-extratropical perspective is now established. It is proposed that a historic climate anomaly in 2010 – an exceptionally negative phase of the North Atlantic Oscillation (weak Icelandic low and Azores high pressure centres) – drove sargassum from the western subtropics (the Sargasso Sea) to the northeast, as far as Gibraltar. Swept south in the Canary Current, the hypothesis is that the subsequent appearance of sargassum in the eastern central tropical Atlantic was the trigger for spring growth and the first Caribbean inundation of summer 2011. The sargassum has subsequently been recirculating in the North Equatorial Recirculation Region (NERR) (Franks et al., 2014), forming a belt across the northern tropical Atlantic that follows seasonal migration of the Intertropical Convergence Zone (ITCZ). Seasonal releases from the NERR, in most years since 2011, supply sargassum that subsequently beaches throughout the Lesser Antilles and the Caribbean. Drifter data provide evidence that the NERR also supplies the sargassum that beaches along West Africa (Johnson et al., 2020), consistent with basin-wide extent of the North Equatorial Counter Current in the approximate zone 5–10°N, during the second half of the year. Sargassum may thus be conveyed eastward, joining the Guinea Current to be delivered to west African coastlines from Senegal to Nigeria.
The challenge of predicting sargassum has grown alongside studies of how and why these blooms are developing. On short timescales, of up to several days, satellite imagery and operational 7-day ocean current forecasts are used to predict beaching events (e.g., Maréchal et al., 2017). On much longer timescales, other approaches must be adopted, involving the use satellite observations (Wang and Hu, 2017), drifters (Johnson et al., 2020) and models (Jouanno et al., 2020). Berline et al. (2020) use satellite data to initialise sargassum distributions in an ocean model, subsequently tracked forwards to provide a seasonal hindcast for 2017.
We adopt a similar approach to Berline et al. (2020), extended to forecasting with uncertainty. As part of the interdisciplinary project, Teleconnected SARgassum risks across the Atlantic: building capacity for TRansformational Adaptation in the Caribbean and West Africa (SARTRAC), remote sensing and modelling are being used to develop a wider early warning system for the arrival of sargassum at specific locations on both sides of the tropical Atlantic: Caribbean and West Africa. For fast and practical capacity building and operational implementation, we have developed a forecast system based on data available in the public domain, and hindcast winds and currents obtained with an ocean model of spatial resolution sufficiently high to simulate realistic movement and dispersal of sargassum. We thus address the basin-scale movement of sargassum, subject to complex and chaotic currents, and highly variable winds, at seasonal timescale. The effects on drifting sargassum of growth, mortality and sinking are retrospectively calculated, to refine the predicted quantities of sargassum at specific locations and times. Here, we demonstrate the application of SARTRAC-EFS to years of extensive beach inundation at two different locations, Jamaica and Ghana, exploring the sensitivity of forecasts to variable ocean and climate states, windage, growth and decay.
The paper is organised as follows. In section “MATERIALS AND METHODS,” we outline the use of satellite observations, ocean model hindcasts, particle tracking and basic algorithms for growth mortality and sinking. In section “RESULTS,” with a focus on the Caribbean and Jamaica, we present the basis for initializing sargassum distributions and results of several test predictions, of sargassum inundations in four selected years, 2015, 2018, 2019, and 2020. We further present exploratory predictions for the west African region, and Ghana in particular, although this is currently restricted by more limited satellite observations in the eastern tropical Atlantic. In section “DISCUSSION,” we discuss our proposed framework for seasonal forecasting alongside several quite different methods proposed by others, emphasizing a complementary approach to long-range prediction of annual sargassum conditions across the tropical Atlantic.
Materials and Methods
Predictions are initialised and also evaluated with satellite observations of floating vegetation through the use of FA_density data. Central to predictions is a high-resolution ocean model hindcast, providing datasets used to efficiently track large numbers of particles that are representative of drifting sargassum mats. Using currents and winds from a hindcast spanning 1988-2010, we obtain 23-member ensembles per forecast, amounting to a basic Ensemble Forecast System (EFS). Hence, we refer to the system as SARTRAC-EFS. We describe in turn the datasets and methods that underpin SARTRAC-EFS, concluding this section with a summary of SARTRAC-EFS and brief comments on practical aspects.
Satellite Observations
A range of Satellite Data Products are provided by the Optical Oceanography Laboratory at the University of South Florida, via the website https://optics.marine.usf.edu, including daily ‘FA_density,’ calculated as a mean of the 7 past days (including that day), following the method described in Wang and Hu (2016). In addition to the Central Atlantic Region, we consider FA_density for the Eastern Caribbean (60-75°W, 10-23°N) and around Jamaica (75-82°W, 15-22°N). Together with the Central Atlantic region, these data guide the initialisation of particles, to track sargassum at seasonal timescale. In Figure 4, we show FA_density distributions across the Central Atlantic, Eastern Caribbean and Jamaica, during the high-prevalence years of 2015, 2018, 2019, and 2020, during the summer peaks. In each case, high areal fractions of sargassum are prevalent across the region. In the absence of FA_density, we use AFAI images for the Gulf of Guinea (east of 16°W, 0-7°N) to initialise particle locations for experimental predictions, with a focus on the pathways via which sargassum arrives off Ghana.
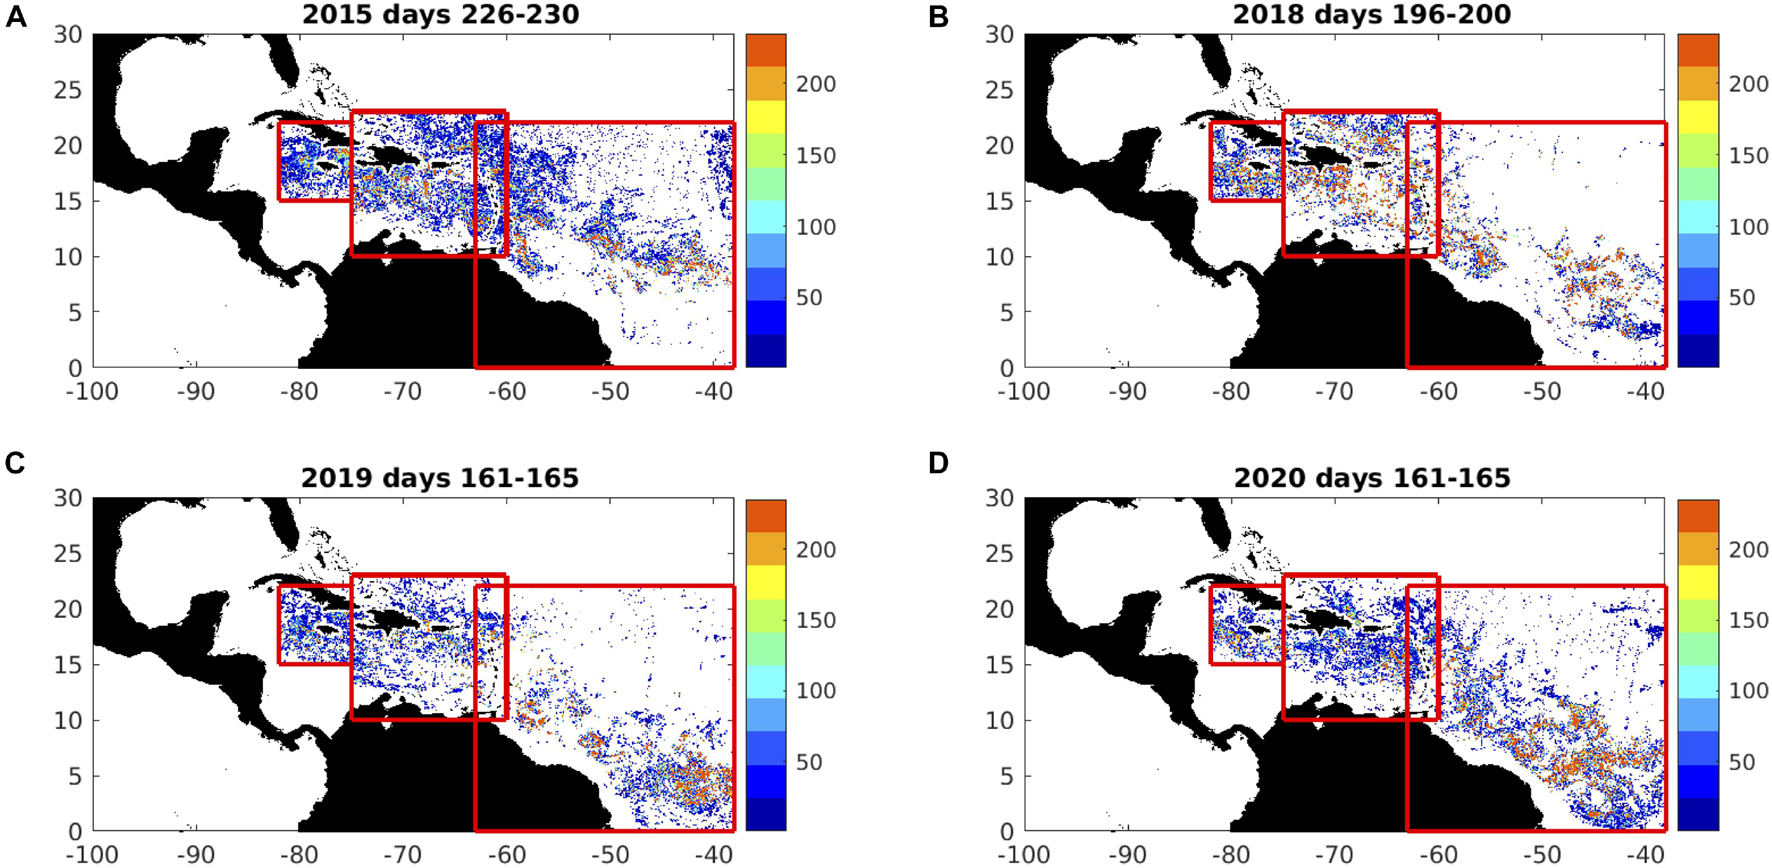
Figure 4. Composites of FA_density images (1-km resolution, non-dimensional units) during summer sargassum peaks, selecting maxima during: (A) days 226-230 (mid-August) of 2015; (B) days 196-200 (mid-July) of 2018; (C) days 161-165 (mid-June) of 2019; (D) days 161-165 (mid-June) of 2020. Limits of Central Atlantic, Eastern Caribbean, and Jamaica regions are indicated by the red boxes.
With a focus on Jamaica, we aggregate daily (7-day averaged) area fraction data to the north and south of the island, bounded by 18-20°N, 75-80°W and 16-18°N, 75-80°W respectively. The corresponding time series in Figure 5 reveal that the early 2011 and 2012 prevalence of sargassum in the eastern Caribbean did not extend to Jamaican waters. Only in late 2014 did sargassum start to appear around Jamaica, with subsequent peaks in 2015, 2018, 2019 and 2020, highlighted in Figure 5. These four peak years present a range of tests for our seasonal predictions.
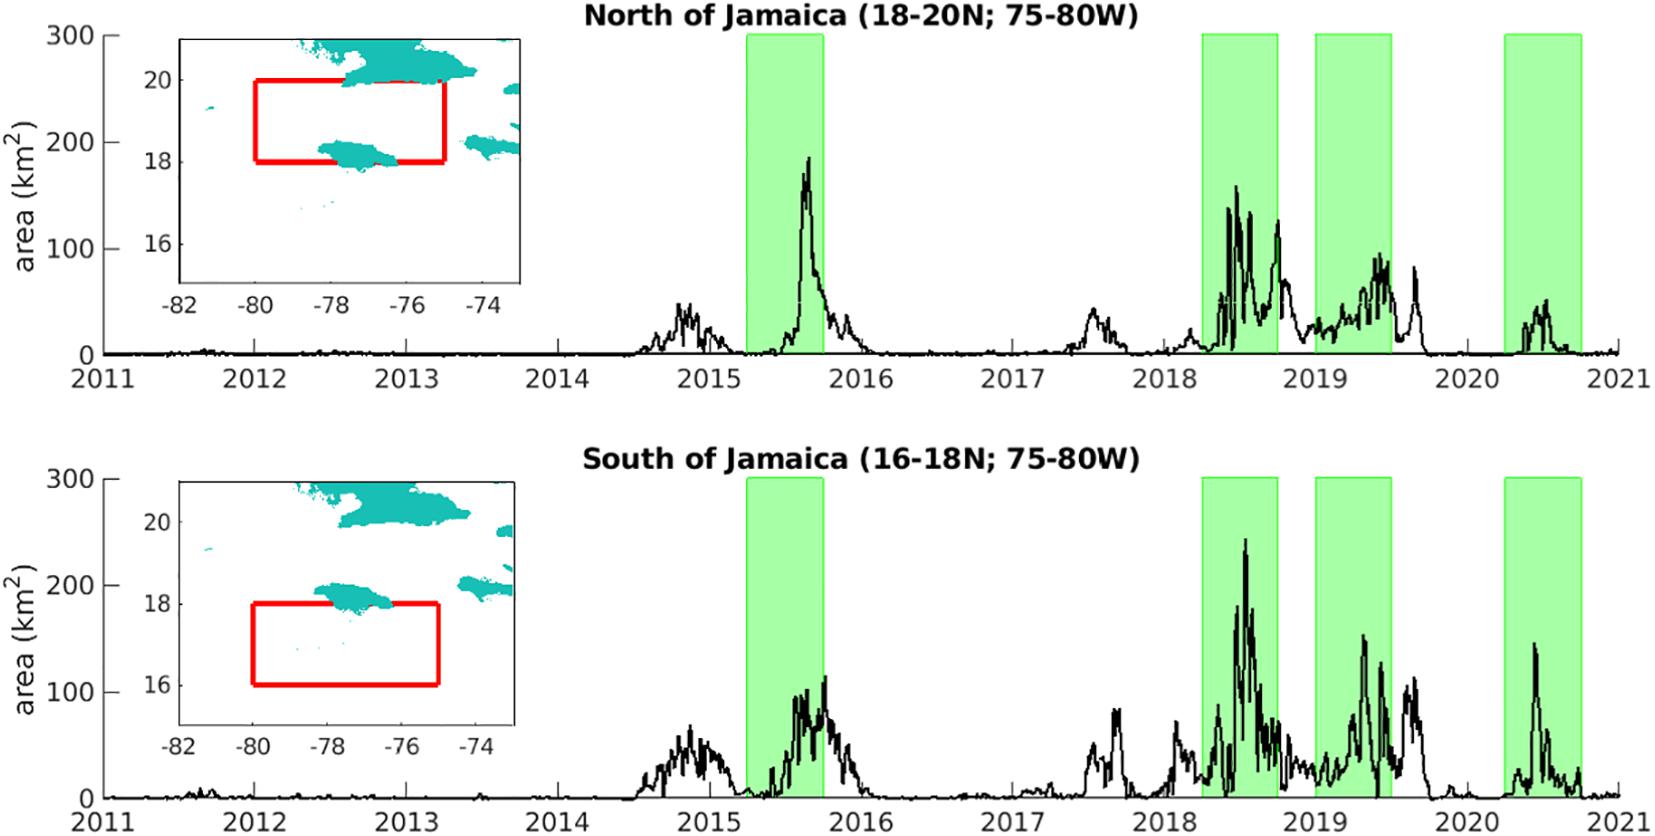
Figure 5. Time series of the total area of sargassum (km2), north and south of Jamaica (for areas indicated in inset maps) over 2011-20, highlighting notable peak events.
Ocean Model Hindcast
The hindcast data used for our drift calculations comprises 5-day averages of surface winds (for windage), temperature, salinity and surface currents from a hindcast spanning 1988-2010, obtained with the Nucleus for European Modelling of the Ocean (NEMO) ocean model (Madec, 2008) in eddy-resolving global configuration (ORCA12), henceforth NEMO-ORCA12. The ORCA12 configuration of NEMO has a horizontal resolution at the Equator of 1/12°, or 9.277 km. This high resolution is similar to that used in previous offline sargassum drift calculations (Brooks et al., 2018; Putman et al., 2018; Johns et al., 2020), and is essential to best represent the swift and narrow boundary currents that dominate the region.
NEMO-ORCA12 is forced with surface datasets produced by the DRAKKAR project (Brodeau et al., 2010), comprising 6-hourly mean 10 m winds, 2 m air temperature, 2 m humidity, daily mean heat and radiative fluxes, and monthly mean precipitation fields, adjusted from ERA40 reanalysis (Uppala et al., 2005). The hindcast used here is obtained with NEMO v3.2 and the following DRAKKAR Forcing Sets (DFS): DFS4.1 forcing up to the end of 2007, switching to NEMO v3.3.1 and DFS5.1.1 forcing in an extension to the end of 2010. Details of model parameterisation and initialisation are outlined in Blaker et al. (2015).
The high horizontal resolution of NEMO-ORCA12 ensures that we advect and disperse particles with realistically swift and eddying currents. In Figure 6, we illustrate the basin-wide system of currents and prevailing winds, for selected time slices at the start of quarters 2 and 3 of 1988 (1-5 April and 1-5 July, respectively). Broad westward flows of the South Equatorial Current (SEC) span much of the tropical Atlantic, beneath the trade winds that are associated with subtropical high-pressure and equatorial low-pressure systems. As the ITCZ migrates north in boreal summer, the SEC strengthens, and a northward branch develops. Northward of this SEC branch, eastward flow is established – the North Equatorial Counter Current (NECC). Extending further to the east into the Gulf of Guinea, along the coastlines of Côte d’Ivoire, Ghana, Togo, Benin and Nigeria, the NECC strengthens the Guinea Current (GC) in boreal summer. Another important flow pathway is clearly evident in elevated mean speed (> 50 cm s–1) along the north coast of South America, as far as the Caribbean. This flow takes various names with progression away from the Equator, as the North Brazil Current (NBC) becomes the Guyana (Guiana) Current (GyC), and finally the Caribbean Current (CC). In sampling currents and winds from 23 hindcast years, we account for the chaotic character of these eddying flows, additional to anomalies associated with interannual variability in large-scale atmospheric and ocean circulation.
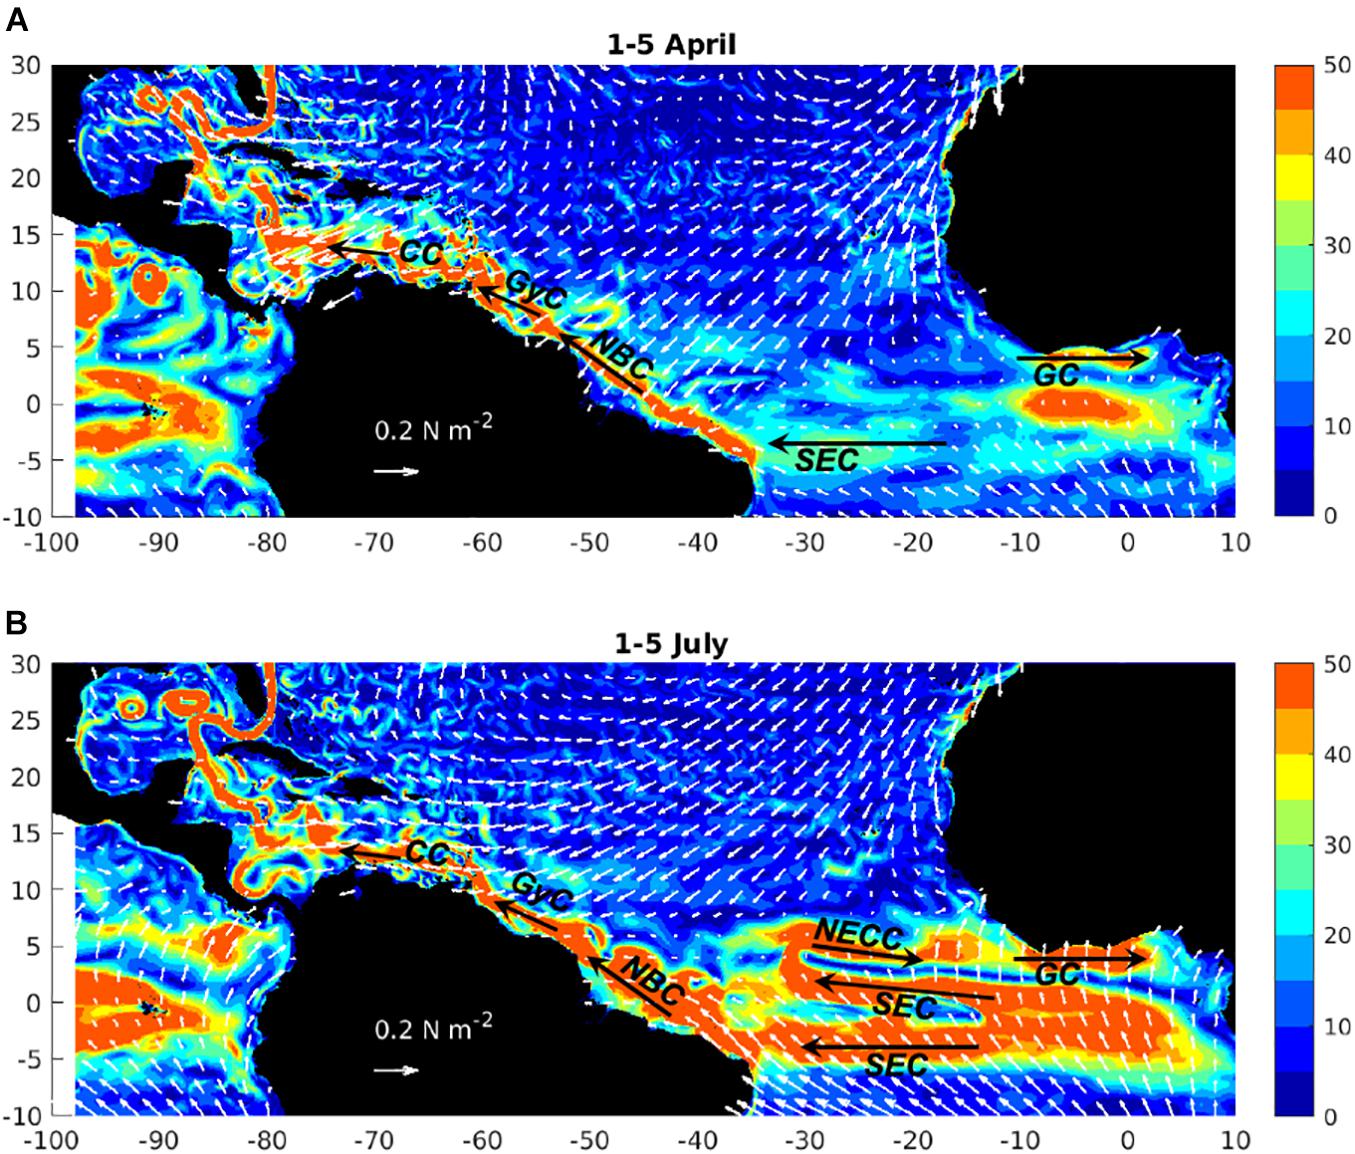
Figure 6. Example 5-day average of currents (speed, cm s–1, colours) and wind stress vectors (white arrows, length proportional to magnitude, units N m–2), in the tropical Atlantic region, indicating key currents (SEC, South Equatorial Current; NECC, North Equatorial Counter Current; GC, Guinea Current; NBC, North Brazil Current; GyC, Guyana Current; CC, Caribbean Current), for (A) 1-5 April, and (B) 1-5 July, of 1988.
Particle Tracking
Drifting sargassum is tracked with virtual “particles,” subject to winds and ocean currents from NEMO-ORCA12. These particles are released at selected locations, proportional to the areal fraction extracted from the FA_density images, with subsequent positions recorded at daily or 5-daily intervals for up to 180 days. The particle trajectories are calculated using the off-line Lagrangian ARIANE mass-preserving algorithm (Blanke and Raynaud, 1997) in “qualitative mode,” with the 5-day mean horizontal velocity fields of NEMO-ORCA12. ARIANE is based on an analytical solution for curvilinear particle trajectories across model grid cells. In this study, particles are constrained to drift with surface currents and the trajectories are hence 2-dimensional in the latitude-longitude plane.
Previous particle tracking studies have emphasised windage as a crucial factor in explaining the drift of sargassum (Putman et al., 2018; Johns et al., 2020; Putman et al., 2020; Van Sebille et al., 2021). Any part of an object exposed above the sea surface will be forced by the wind in the same direction as the wind blows. This windage force is a combination of skin drag and form drag. Skin drag is a frictional force, proportional to “surface roughness” of the object. Form drag is related to wind pressure on the object, which is a function of shape and buoyancy. These factors determine the surface area presented to the wind, relative to that below the surface, which is in turn exposed to the net surface current.
In calculating the trajectory of a given object, windage can be related to a small percentage of the wind speed. ARIANE is thus modified to include windage, subject to the 5-day averaged winds. To obtain near-surface currents from drifter data, Pazan and Niiler (2001) developed a regression model for the quality control of drifting buoy data; analysing global datasets, the undrogued buoy response to wind, expressed as a ratio of difference between undrogued and drogued buoy velocity, relative to the wind velocity, was determined to be 0.0097 ± 0.005. A windage factor of 0.01, or 1%, is therefore typical for a variety of partially submerged objects, including sargassum, and has been specified in a number of drift calculations – e.g., Johns et al. (2020) and references therein, Berline et al. (2020); Johnson et al. (2020), Putman et al. (2020). If 1% of the wind vector is added to the surface current vector for the purpose of trajectory calculations, then for typical wind speed ranging 5-10 m s–1 (trade winds) coincident with typical current speed ranging 0.1–0.2 m s–1 (surface flow in the tropics, away from boundary currents), we are adding 1% of 5–10 m s–1 (0.05–0.1 m s–1) to the current, which is equivalent to 50% of the current speed.
An attractive feature of ARIANE is the efficiency of calculation for potentially large numbers of particle trajectories. We initialise particles in the following steps:
1. extract areal fraction at 1-km resolution from selected FA_density images
2. aggregate these data per NEMO-ORCA12 gridcell (approximately 9 × 9 km), calculating a total sargassum area for that gridcell
3. allocate one particle per fixed unit area of sargassum across gridcells and evenly distribute these particles across each gridcell, so the FA_density data are used to weight the number of particles per 9 × 9 km gridcell
To represent a typical sargassum raft and ensuring a large number of particles that does not overwhelm subsequent tracking and post-processing calculations, we choose a fixed unit area of 10 m2. In proportion to the extent of sargassum in satellite images, we thus initialise up to 300,000 particles for Jamaican forecasts. Repeating the 180-day trajectory calculations for this number of particles, using each hindcast year of 1988-2010, an efficient approach is essential if we are to experiment with alternative start times, windage, etc. An additional feature of particle tracking, with ARIANE and similar schemes, is the possibility to track particles backwards through time. This is a useful means of determining the extent to which Central Atlantic, Eastern Caribbean, and Jamaica regions (Figure 4) capture the upstream locations of the sargassum bound for selected locations, for a given forecast timescale – we return to this issue in section “Upstream Sources of Sargassum and Limits on Seasonal Forecasts for Jamaica.” Finally, in addition to position along trajectories, ARIANE records the environmental conditions, specifically temperature and salinity – of potential use in determining in situ growth and mortality (see section “Growth, Mortality and Sinking of Sargassum”).
From the forward and backward tracking experiments, we record particle location and properties every 5 days. Subsequent to these drift calculations, particle data are statistically analysed at selected times (e.g., every 30 days) on a grid of resolution 0.5° × 0.5° for areal fraction (percent cover of sea surface) and mean age (days adrift, since the experiment started). Over selected areas of interest – south and north of Jamaica, off western and eastern Ghana – we further calculate the total area of sargassum as forecast time series, providing early warning of the quantities of beached sargassum that may be expected. Particles subject to windage may “virtually beach,” evident in output data as terminated before day 180. We separately identify the corresponding last oceanic location of these beaching particles, although we note that NEMO-ORCA12 does not include the localised coastal processes (tides, waves, etc.) that likely play an important role in beaching events.
Growth, Mortality and Sinking of Sargassum
At timescales beyond even a few days, the extent of sargassum may increase or decrease, subject to three factors: growth, mortality and sinking. In terms of growth, doubling times can be between 9-20 days (Lapointe, 1986; Hanisak and Samuel, 1987). Mortality, including partial mortality and/or loss of buoyancy (senescence), leads to sinking of the sargassum thalli. The sinking factor here refers to a physical process, associated with vertical motions in the surface layer. In biological models, these growth and loss terms can be applied to a carbon pool, C, that represents drifting sargassum. Here, we equivalently apply these terms to the area per particle, initially 10 m2, following selected formulations and parameter baseline values in Jouanno et al. (2020). In the absence of in situ nutrient data (nitrate, phosphate) and light availability, we limit these terms accordingly to temperature dependence, such that
Growth is formulated according to μmax, the maximum uptake rate of carbon, with baseline value 0.069 day–1 (ranging 0.05-0.09 day–1), multiplied by factors related to temperature, light, nitrogen and phosphorus. The latter three factors are here assumed constant. The temperature factor is obtained as
where Tx = Tmin for T ≤ Topt, Tx = Tmax for T > Topt, given Topt = 26.0°C (ranging 22-28°C), Tmin = 10.8°C, and Tmax = 43.2°C.
Mortality is formulated according to a temperature-dependent mortality rate,
given m = 0.04 [0.05-0.1], λm = 0.62 [0.2-0.7].
A maximum sinking rate of 0.057 day–1 (ranging 0.05–0.1 day–1), in Jouanno et al. (2020), is ideally related to Stokes drift and Langmuir circulation (for a review, see Van Sebille et al., 2020), but is here assumed constant at this baseline value.
The temperature factors for growth and mortality are shown graphically in Supplementary Figure 1. Using baseline parameters, optimal growth at 26°C falls by 10% at temperatures higher or lower by around 5°C. The mortality factor becomes important only at high temperature, indicating an important influence in particular during summer (June-August), when climatological sea surface temperatures typically exceed 28°C across the region. We note here that the temperature range in Supplementary Figure 1 is typical for the subtropical gyre, specifically the Sargasso Sea, the focus of sargassum growth studies on which the corresponding parametrisation is based. In our context, Caribbean and equatorial waters rarely drop below 26°C, and a more regionally specific parameterisation – currently unavailable – would be preferable.
Ambient temperature and salinity are recorded along each ARIANE trajectory. We therefore post-process each trajectory, increasing or decreasing the area attributed to each particle (initially 10 m2) according to a net change related to the temperature-dependent growth and mortality rates and a constant sinking rate. While this approach is idealised, assuming several constant factors, it provides a useful first-order representation of the in situ biological and physical processes that drive changes in sargassum biomass, and hence areal fraction.
Summary of SARTRAC-EFS
We summarize the five steps involved in a single SARTRAC-EFS forecast in Figure 7, with reference to software elements, and elaborating here on some practical perspectives. Substantial amounts of data are transferred and manipulated in steps (1) and (2). At step (3), further large datasets of daily or 5-daily particle positions may be generated. In the case of Jamaican forecasts, we track 150,000-300,000 particles (allocating one particle per 10 m2 of sargassum), resulting in position files of size ranging 400-800 Mbytes. In steps (4) and (5), we select particles within specific ranges of longitude and latitude, every 5 days through each 180-day prediction. For given growth and loss factors, applied at step (4), we thus obtain cumulative areas of sargassum for target locations (e.g., north and south of Jamaica). For evaluation of our predictions, we obtain the corresponding cumulative areas from FA_density maps. With 23 individual 180-day forecasts (using the winds and currents for each of 1988-2010), we further obtain ensemble means and standard deviations, along with root mean square (rms) error, based on differences between predictions and observations. These ensemble statistics and evaluations are implicit in step (5).
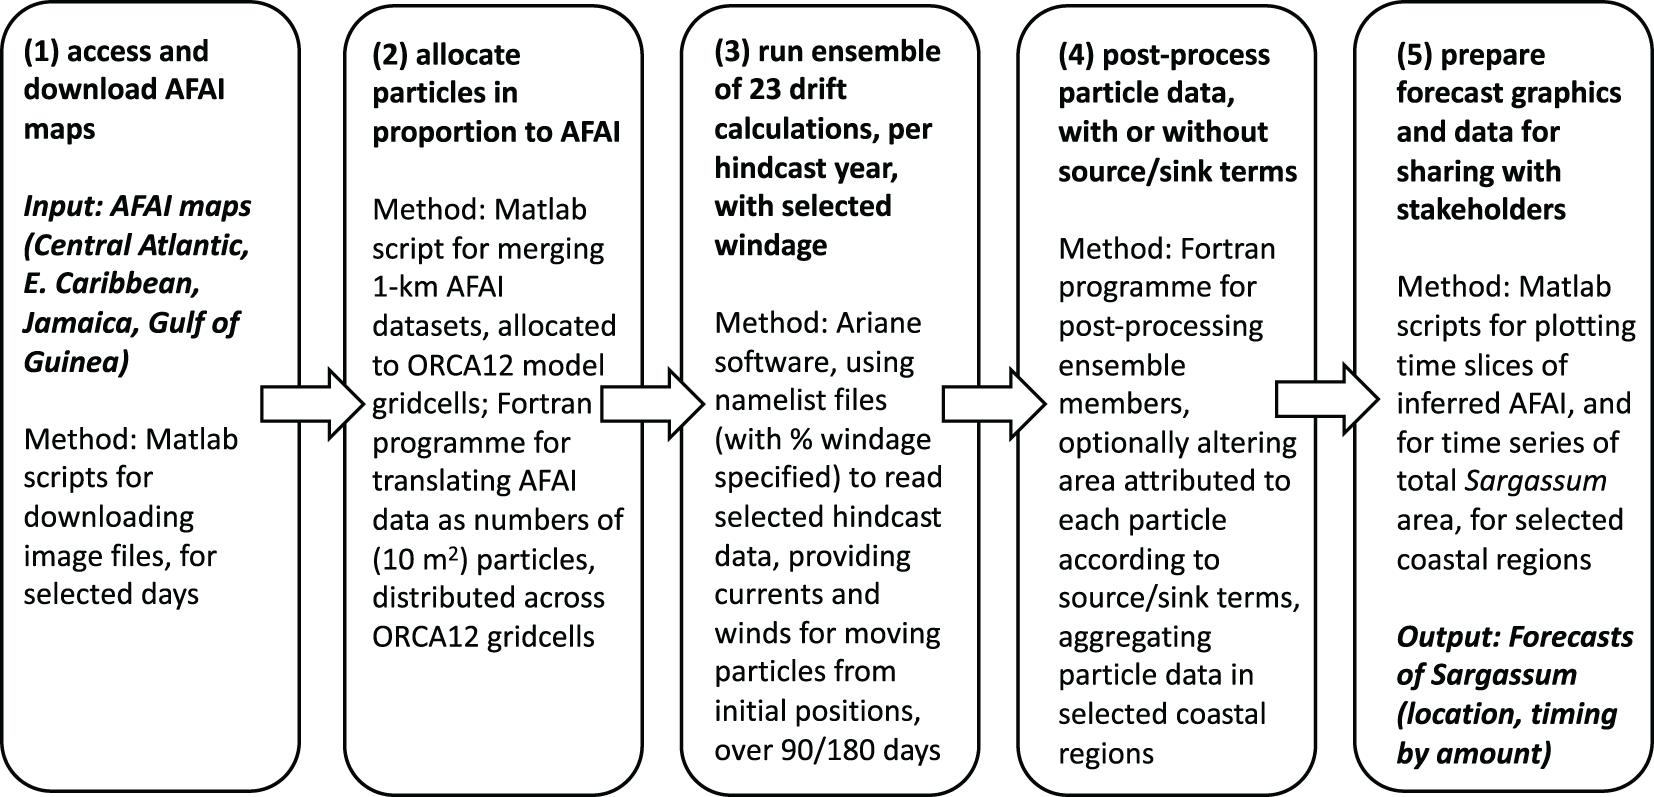
Figure 7. The five steps involved in a single SARTRAC-EFS forecast: (1) access and download FA_density maps; (2) allocate particles in proportion to FA_density; (3) run ensemble of 23 drift calculations, with selected windage, with each of the hindcast years; (4) post-process particle data, with or without source/sink terms; (5) prepare forecast graphics and data for sharing with stakeholders.
Results
Given the availability of FA_density data coverage, we focus on the Caribbean region and the waters around Jamaica in particular, first illustrating the initialisation of particles in proportion to the observed sargassum across a region encompassing the Jamaican, Eastern Caribbean and Central Atlantic ‘boxes’ (see Figure 4). In a series of 180-day predictions, we consider four recent years when sargassum was prevalent around Jamaica and beached in large quantities around much of the island. With evidence of a role for the Atlantic Meridional Mode of climate variability in two major inundations (2015 and 2018), this influence is further examined in selected ensemble members. Despite the constraints of satellite observation in the eastern tropical Atlantic, a more limited set of predictions are undertaken for this region, indicating wider prospects for seasonal predictions of the arrival of sargassum in coastal waters, across the tropical Atlantic. In two of the figures shown below (Figures 8, 9), we randomly select an example hindcast year, to illustrate time-slice distributions of sargassum areal fraction predicted by SARTRAC-EFS; these selected years are broadly representative of the full 23-year ensemble.
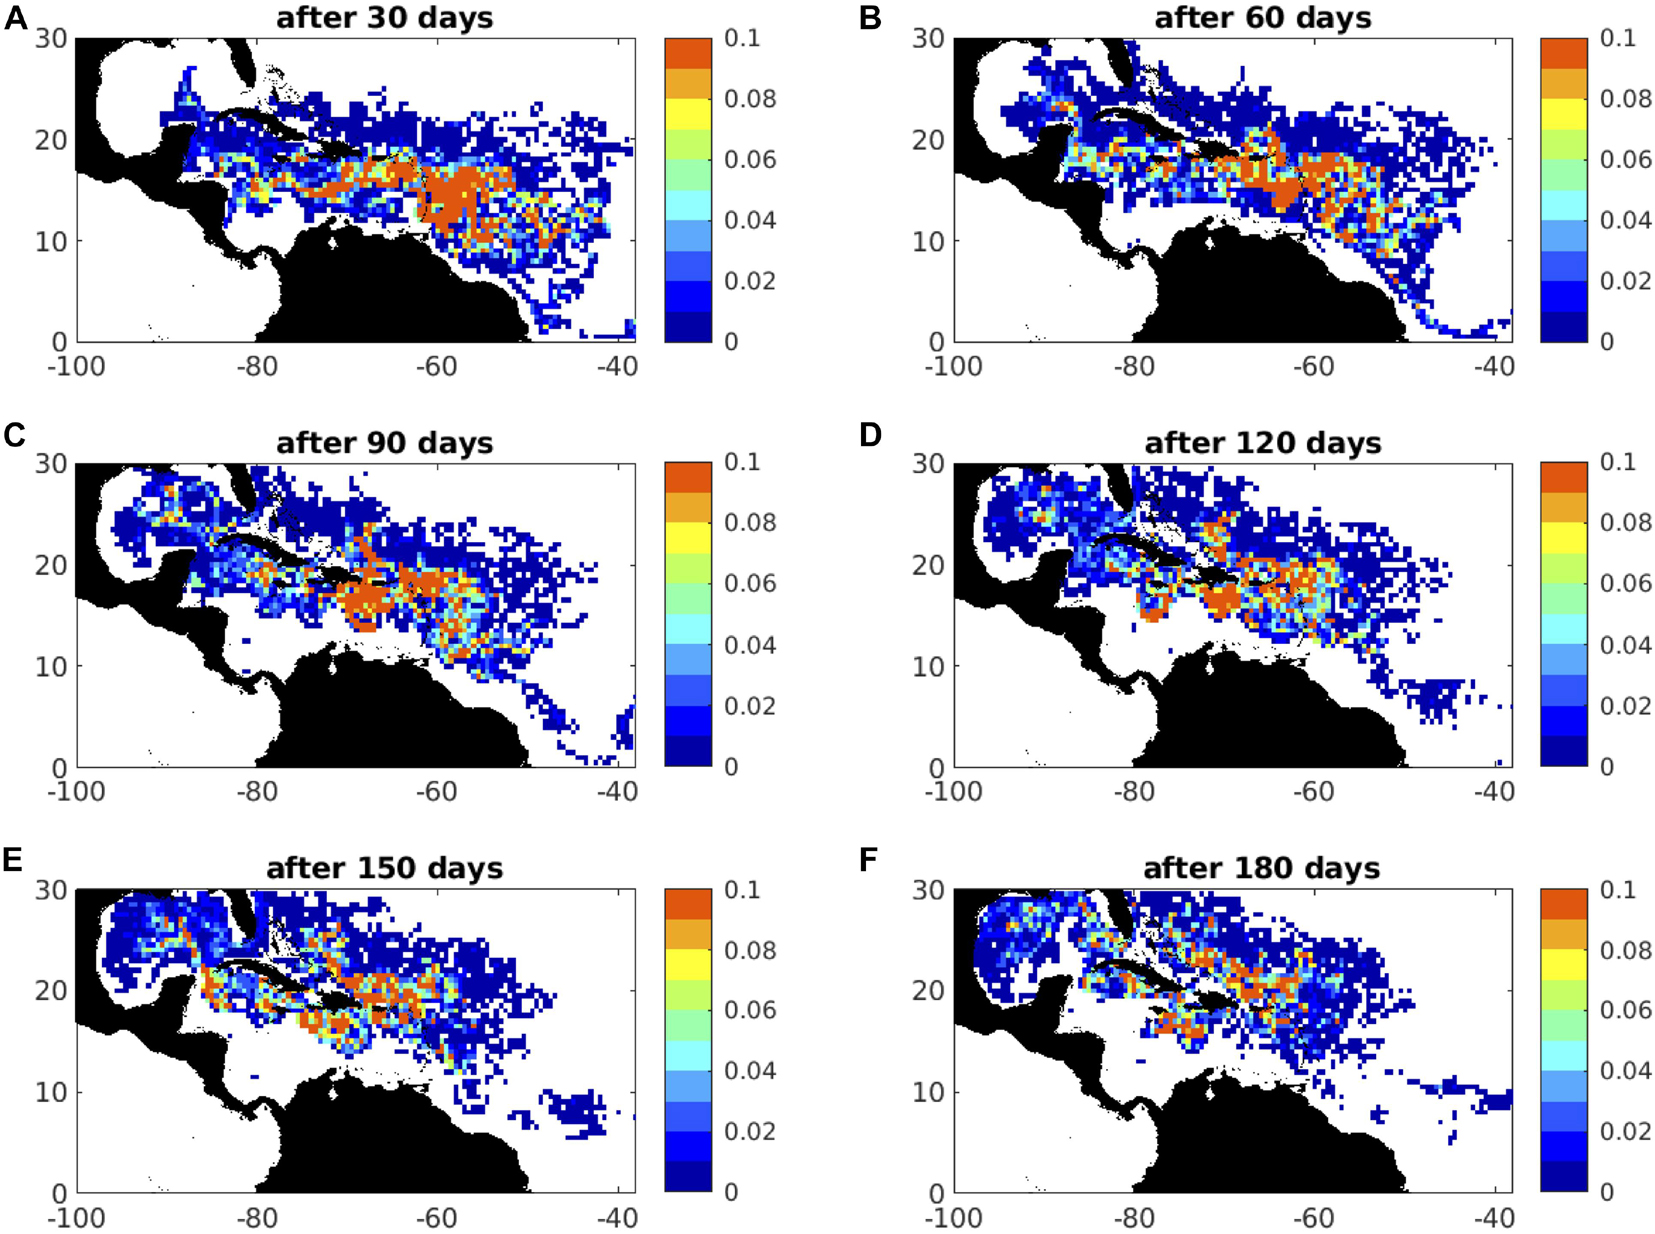
Figure 8. Example forecast distributions of areal fraction (km2) after: (A) 30 days; (B) 60 days; (C) 90 days; (D) 120 days; (E) 150 days; (F) 180 days; this is for days 91-275 of 2018, drift only under 1% windage; winds and currents are from the hindcast year 2002.
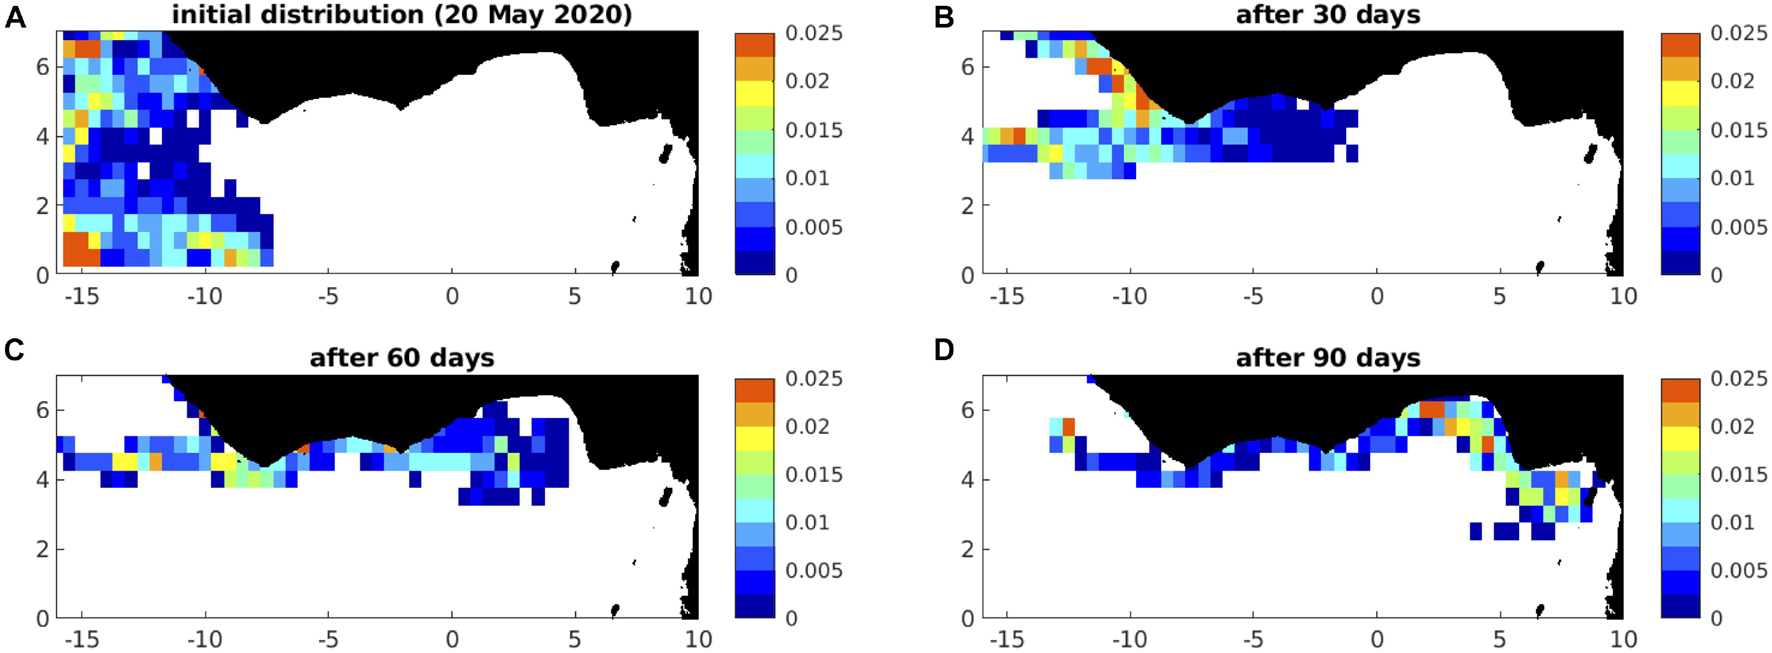
Figure 9. Example 2020 forecast distributions off west Africa, (A) initially, and after (B) 30 days (19 June), (C) 60 days (l9 July), and (D) 90 days (18 August); this example is drift only, under 0% windage; winds and currents are from the hindcast year of 1989.
The Caribbean
Downstream of the North Brazil Current, the Caribbean naturally receives sargassum drifting with the North Brazil Current, Guyana Current and Caribbean Current, aided by the prevailing trade winds – see Figure 6. In the following analyses, results are interpreted in the context of these major influences, and the interannual variability inherent in tropical climate.
Upstream Sources of Sargassum and Limits on Seasonal Forecasts for Jamaica
The geographical extent over which we initialize particles – representative of sargassum – determines the time horizon for seasonal forecasts, which is consequently limited by the spatial coverage of satellite data (see section “Satellite Observations”). To first quantify this influence on predictability, we investigate the origin of particles around Jamaica (in the region 16-20°N, 75-80°W), sampling sargassum on day 270 of 2015 when a large total area is evident (see Figure 5). Particles that each represent 10 m2 of sargassum are tracked backwards for 180 days. Calculations are undertaken with currents and winds for each year of the NEMO-ORCA12 hindcast, and ensemble-mean results obtained accordingly. In Figure 10, we summarize the results of this experiment, sampling particles on an 0.5° grid for equivalent fractional area of sargassum at selected time slices and mean particle age. Similar maps are obtained for 2018, also back-tracking from day 270 (not shown).
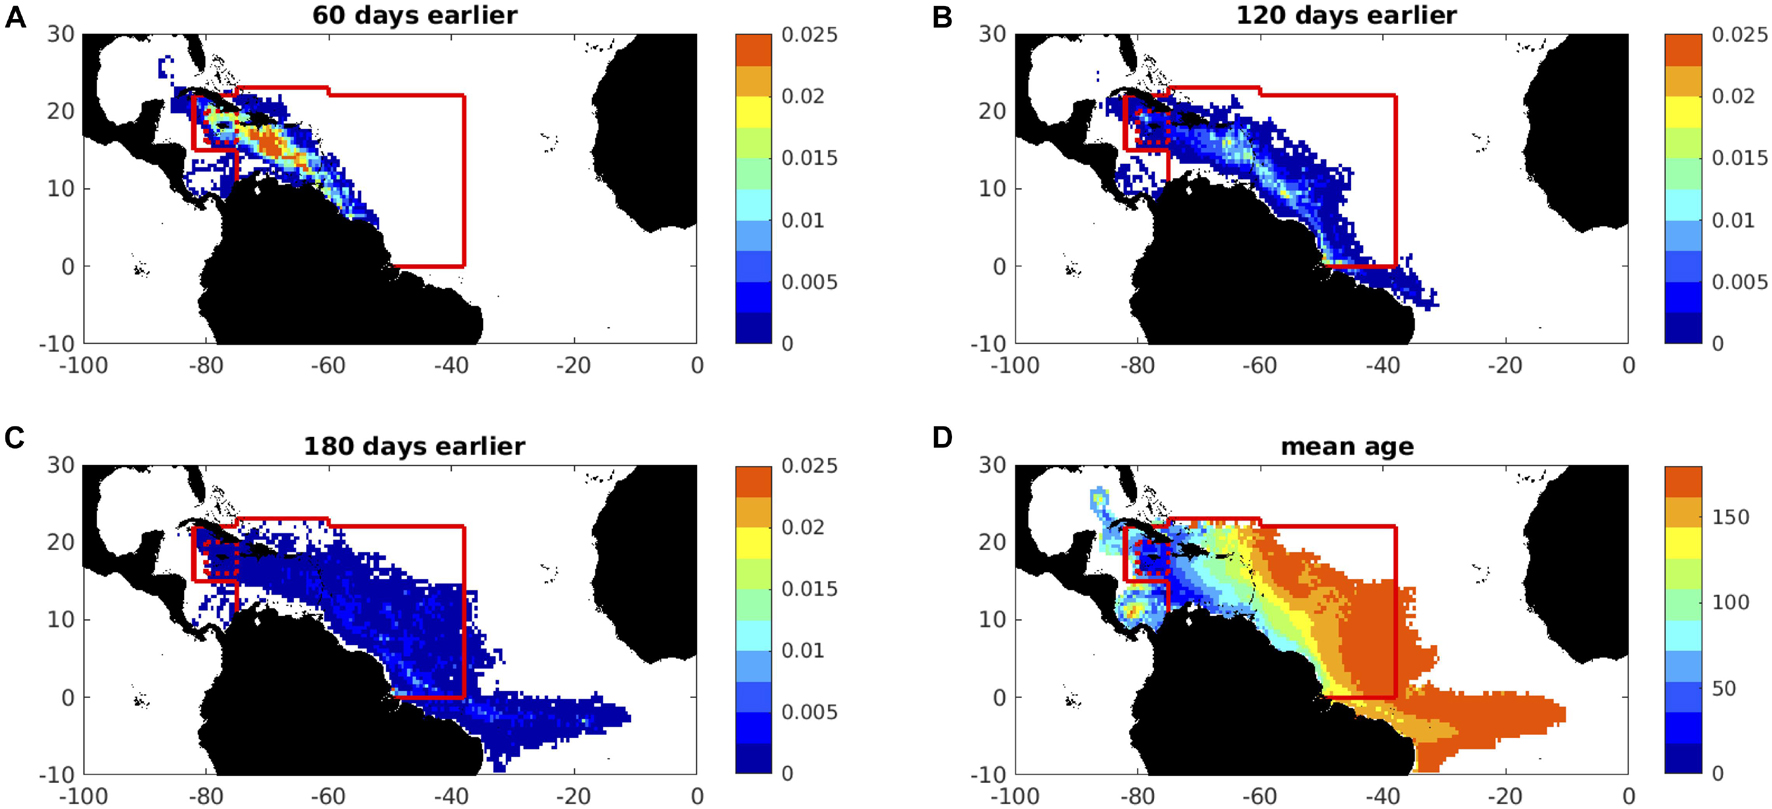
Figure 10. Back-trajectories from Jamaica ‘box’ (the red dotted square) for 180 days, initialised on day 270 (late September) in 2015, showing in (A,B) the ensemble-mean areal fraction of sargassum (colour-coded in the range 0–0.025%), (A) 60 days earlier (late July), (B) 120 days earlier (late May), (C) 180 days earlier (late March), and in (D) the ensemble-mean age (days before arrival around Jamaica, colour-coded in the range 0-180 days). Areal fraction is gridded at 0.5° grid. Back-trajectories are here subject to 1% windage. The “catchment area” for initialisation of forward trajectories is within the solid red boundary. Particles are traced backwards from a small area around Jamaica, within the red dotted square. The ensemble means are averages of 23 back-trajectory experiments computed with winds and currents for 1988-2010.
Within the first 60 days, almost all particles remain within the solid red boundary (Figure 10A), which we define as the ‘catchment area’ for initialisation in our forward calculations. By 120 days earlier, only a small number of particles are present outside the catchment area, south of the Equator in the North Brazil Current (Figure 10B). A more substantial number of particles lies outside the catchment area 180 days earlier, tracing a broad zonal inflow to the western boundary, just south of the Equator in the South Equatorial Current (Figure 10C). A few particles can be traced to an origin south of 10°S, outside the domain in Figure 10, being carried northward in the upstream North Brazil Current. Particle mean-age, considering all particles during the entire experiment, indicates a progressive aging towards the east, in the range 150-180 days for particles moving towards the initialisation catchment area with equatorial flows (Figure 10D).
To further quantify the timescales on which particles originate from within or beyond the catchment area, Supplementary Figure 2 shows the percentage of particles remaining in the catchment, every 5 days, up to 180 days prior to arrival around Jamaica. Here, we show analyses for initial distributions (around Jamaica) in both 2015 (Supplementary Figure 2a) and 2018 (Supplementary Figure 2b). From the individual ensemble members (green lines), considerable variation in these percentages is evident, although similar ensemble means and standard deviations (mauve lines) indicate that a little over 50% of particles remain within the catchment area up to 120 days earlier, and 30–40% of particles by 180 days earlier.
On the basis of these results, given the available catchment area and advective timescales, we qualify predictions of sargassum presence around Jamaica on timescales of up to 180 days. It is evident, however, that as the forecast time horizon increases, we increasingly lack information on sargassum that originated outside the catchment area, which will reduce forecast accuracy, in particular at timescales beyond 120 days. To the extent that ensemble forecast accuracy is proportional to the fraction of particles still within domain for a given time horizon, the accuracy of 180-day forecasts is approximately halved compared to 60-day forecasts.
Initializing Sargassum to Forecast Selected Peak Events
Accounting for the limits on seasonal prediction, we focus on the four peak events around Jamaica (Figure 5) to test predictions over the second and third quarters of 2015, 2018, and 2020, and over the first and second quarters of 2019. We therefore sample sargassum distributions on days 91-95 of 2015, 2018, and 2020, and on days 1-5 of 2019. As cloud cover may limit the extent of initialisation on any given day, we select the maximum value (over the five sampled days) of FA_density, per pixel. We further note that the FA_density maps for each day are means of the past 7 days. Taken together, we thus account for some synoptic variability in the satellite data availability.
To specify initial particle distributions for the ARIANE experiments, we aggregate the 1-km FA_density data per 1/12° (9 × 9 km) NEMO-ORCA12 gridcell. These initial distributions are illustrated in Figure 11, confirming high areal fraction (% ocean surface covered by sargassum) across much of the central Atlantic region. Year-to-year variations are also evident: high areal fraction extends from the Lesser Antilles to the eastern boundary, across much of the central Atlantic region, in 2015 (Figure 11A); the most extensive areal coverage in 2018 is already reaching the eastern Caribbean by day 91 (Figure 11B); a band of high areal fraction is located further to the north at the start of 2019 (Figure 11C); high areal fraction is confined to the boundary current, closer to the Brazilian coast, in 2020 (Figure 11D).
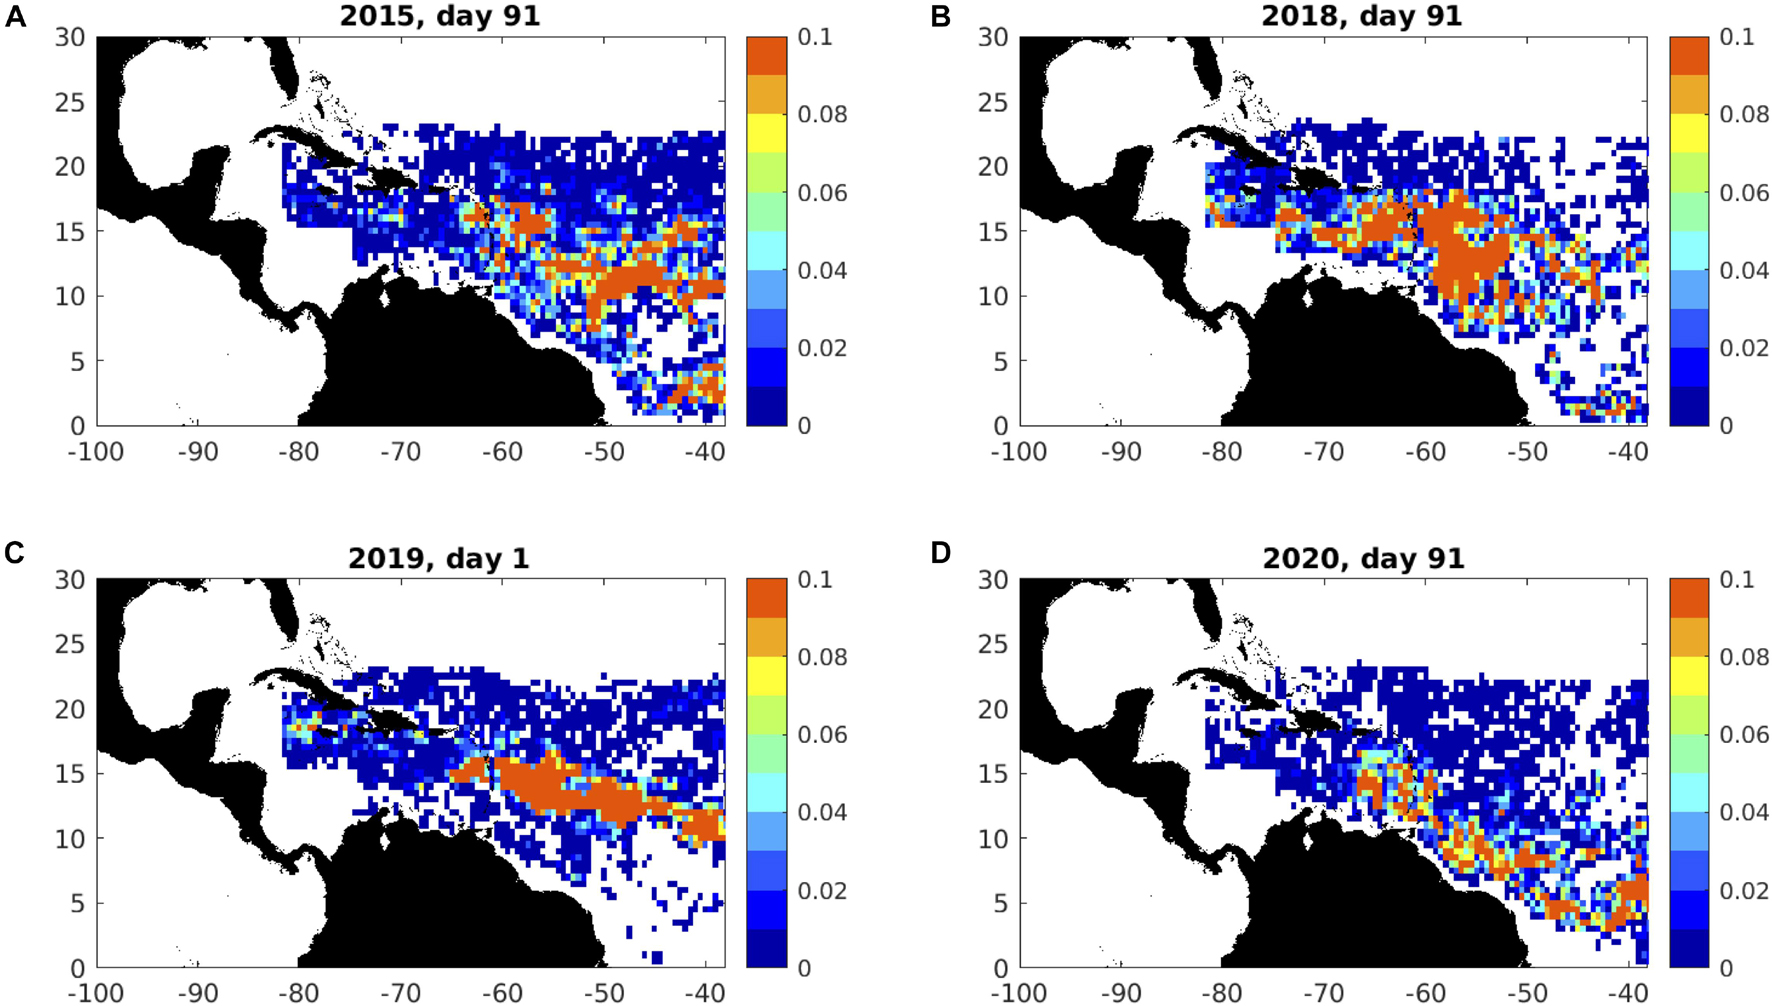
Figure 11. Initial distributions of areal fraction (km2), spanning Jamaica, eastern Caribbean and Central Atlantic regions, for the four forecast years initialised on: (A) day 91 of 2015; (B) day 91 of 2018; (C) day 1 of 2019; (D) day 91 of 2020. Day 91 is the start of April. To reduce the limiting influence of cloud cover on synoptic timescales, these day-specific distributions are obtained as maxima over days 1-5 and days 91-95 of source satellite data that are provided as averages of the preceding 7 days (see text for details).
We then specify a number of particles per gridcell, in proportion to the fractional area value (see section “Particle Tracking”). Where rounded-up gridcell area equals or exceeds 20 m2, multiple particles are located on a sub-grid array per NEMO-ORCA12 gridcell, such that the number of particles is proportional to FA_density. Particles that start at slightly different initial locations within gridcells may follow quite distinct trajectories in the strongly eddying currents of NEMO-ORCA12. Particles are thus strongly dispersed on a 180-day timescale.
Seasonal Predictions
With particles initialised as in Figure 11, we obtain particle positions every 5 days, up to 180 days after release. To illustrate typical advection and dispersion, in Figure 8 we present maps of inferred sargassum areal fraction every 30 days, for days 91-275 of 2018, subject to 1% windage. We choose this year as characterised by the most extensive proliferation of sargassum to date, although similar results are obtained in the other three years (2015, 2019, and 2020), distinguishing days 1-185 for 2019.
Several general features are apparent. After 30 days, a ribbon of high areal fraction has advected across the central Caribbean Sea (Figure 8A), consistent with the Guyana Current and the Caribbean Current that are a downstream continuation of the North Brazil Current. Some westward movement is also attributed to the prevailing winds. Over the subsequent 150 days (Figures 8B–F), ongoing westward advection is evident, superimposed on which is a degree of northward drift. This is consistent with surface Ekman currents at 45° to the right of prevailing easterly trade winds. Note also that particles are progressively leaving the domain by 60 days, via the Gulf Stream flowing along the coast of Florida at 30°N. The combined consequence of large-scale circulation, Ekman drift and windage is to convey a substantial number of particles to the waters around Jamaica, notably to the south of Jamaica after 60 days (Figure 8B), 120 days (Figure 8D) and 180 days (Figure 8F).
Turning now to seasonal predictions for arrival of sargassum around Jamaica, we present time series of observed and predicted areal fraction for days 91-275 of 2015 (Supplementary Figure 3), 2018 (Supplementary Figure 4) and 2020 (Supplementary Figure 6), and days 1-185 of 2019 (Supplementary Figure S5). For each year, we separately consider waters south of Jamaica (16-18°N, 75-80°W, left panels) and north of Jamaica (18-20°N, 75-80°W, right panels). For these two areas, we undertake four ensembles:
• Drift only, 0% windage.
• Drift only, 1% windage.
• Temperature-dependent growth and mortality, constant sinking (‘growth/loss’), 0% windage.
• Growth/loss, 1% windage.
For each ensemble, we calculate the ensemble mean and standard deviation, every 5 days. We further calculate a root mean square error (km2), between predicted and observed time series, presented in Supplementary Tables 1–4.
Referring to Supplementary Tables 1–4, we summarize here the best fit of ensemble-mean predictions, based on minimum root mean square (rms) error, based in turn on differences between predictions and observation, per experiment:
• For days 91-275 of 2015, the best fit to observations, south and north of Jamaica is obtained with 1% windage, drift only.
• For days 91-275 of 2018, the best fit to observations south of Jamaica is obtained with 1% windage plus growth and loss; north of Jamaica, the best fit is obtained with 1% windage, drift only.
• For days 1-185 of 2019, the best fit to observations south of Jamaica is obtained with 1% windage, drift only; north of Jamaica, the best fit is obtained with 0% windage, drift only.
• For days 91-275 of 2020, the best fit to observations, south of Jamaica is obtained with 1% windage plus growth and loss; north of Jamaica, the best fit is obtained with 0% windage plus growth and loss.
Best-fit ensemble-mean predictions are evidently obtained with different combinations of drift, growth/loss and windage, for each year, south or north of Jamaica. Some general patterns do however emerge. In 75% of the predictions, better fits are obtained with 1% windage, consistent with previous studies (Putman et al., 2018; Johns et al., 2020). On the other hand, the possibility that optimal predictions are obtained with different windage and growth/loss factors, in different years, is consistent with the parameter sensitivity experiment and optimisation analysis of Jouanno et al. (2020) who interpret ‘either low sensitivity to parameters … or interdependency between them’. It is more likely that shortcomings in our predictions are attributed to overlooked factors, such as the influence of salinity, sea state and unresolved boundary current dynamics, alongside the use of inappropriate parameterisation, arising from inadequate knowledge of the physiology of sargassum.
Some insight may nevertheless be gained with scrutiny of improvements in specific years. It is noteworthy that 1% windage improves predictions north of Jamaica in 2015 and 2018, compared to 2019 and 2020. With sargassum generally most extensive in 2015 and 2018 (see Figure 3), this suggests that winds more influentially force the drift of larger mats, that preferentially drifted to the north of Jamaica in these years. Furthermore, the inclusion of a growth/loss term clearly improves the fit to observations in summer 2020. Comparing Supplementary Figures 6c,d,g,h, we conclude that a combination of relatively high mortality and sinking rates, and relatively low growth rates, prevent the sustained high areal fraction. This suggests that the sargassum arriving around Jamaica in this year was subject to particularly high temperatures. While the specific conditions of 2020 are not used in the predictions, we note from Figure 11D that the initial distribution on day 91 of 2020 was located further south than in the other three years, subject to higher climatological sea surface temperatures during April-June – and hence higher mortality rates.
Given a better fit to observed coverage with 1% windage in 2015 and 2018, we further illustrate the potential beaching of particles in Supplementary Figures 7–9, as outlined in section “Particle tracking.” Across the western tropics, particle locations prior to beaching (Supplementary Figure 7) cluster around selected coastlines and islands, notably the Lesser and Greater Antilles. Extending our focus on Jamaica, and accumulating particles thus defined, we obtain a range of total areas, using the currents and winds of each hindcast over 1988-2010 (Supplementary Figure 8). Taking means and standard deviations of each 23-member ensemble, areas of beached sargassum over days 90-275 of 2015 are thus predicted as 102 ± 74 km2 and 61 ± 47 km2, north and south of Jamaica, respectively. For 2018, the corresponding totals are 261 ± 192 km2 and 153 ± 96 km2. Considering the ensemble-mean beaching area 5-daily over days 90-275 (Supplementary Figure 9), we predict peak beached areas in 2015 of 3.5 km2 over days 245-250, and 2.1 km2 over days 240-245, north and south of Jamaica, respectively. The corresponding beached areas for 2018 are 12.4 km2 over days 235-240 and 8.8 km2 over days 240-245. We therefore predict peak beaching rates, north and south of Jamaica from mid-July to early August.
One final point we note is the different influence of windage for forecasts south and north of Jamaica in some years, such as 2019 and 2020. This may be related to a general strengthening of trade winds moving equatorward across the region of sargassum drift (see Figure 6), such that higher % windage is more appropriate for forecasts south of Jamaica, in years when there is a clear equatorward strengthening of the trade winds. This may be in turn related to basin-scale climate variability, which we consider next.
The Influence of Regional Climate Variability
Some of the uncertainty in seasonal forecasts of the drift, growth and loss of sargassum is related to the winds, currents and sea surface temperatures used in the forecast calculations. Noting the considerable spread in some ensembles, in particular those for which the ensemble-mean better fits the observations, we therefore consider how and why some individual ensemble members fit the observations particularly well. With this objective, we note also the apparent influence of regional modes of climate variability on sargassum. Two specific modes are the Atlantic Meridional Mode (AMM) and the Atlantic Niño.
The Atlantic Meridional Mode (AMM) is associated with anomalies in the cross-equatorial meridional gradient of SST anomalies in the Atlantic, which tend to peak in boreal spring (Xie and Carton, 2004). A positive phase of the AMM is characterised by positive SST anomalies centred around 10°N and anomalously weak trade winds centred around 5°N, via an influence on the latitude of the Atlantic ITCZ (Doi et al., 2010). Interannual variability associated with the Atlantic Niño is similar to the better known El Niño in the Pacific, positive modes being characterised by surface warming along the Equator during boreal summer, with peak warming at around 10°W (Xie and Carton, 2004; Lübbecke et al., 2018). Accompanying this positive mode are stronger easterly trade winds in the 10-15°N of the central Atlantic. An Atlantic Niño index is calculated by averaging SST anomalies over 3°N–3°S, 0°–20°W (Zebiak, 1993).
In Figure 12, we show monthly indices for the AMM and the Atlantic Niño spanning 1988-2020, and highlighting the predicted quarters of 2015, 2018, 2019, and 2020. Of particular relevance here, the stand-out sargassum seasons of 2015 and 2018 coincide with negative excursions of the AMM index (blue line), with a secondary influence from the Atlantic Niño in positive mode (red line).

Figure 12. Atlantic Meridional Mode (AMM) and Atlantic Niño indices, monthly, 1988-2020, highlighting predicted quarters with vertical green bars and pre-2011 negative excursions of the March-May AMM-index (averaging below –3, dashed blue line) with vertical blue bars.
Given the off-equatorial AMM influences on winds and wind-driven currents, this mode of variability is of particular interest in sargassum predictions, while Atlantic Niño variability may influence initial distributions through temperature effects on growth of sargassum early in the season in equatorial latitudes. We therefore consider the potential for improved predictions by selecting individual ensemble members from years in the NEMO-ORCA12 hindcast that most closely match the predicted year, in terms of the AMM-index. We consider the two years when sargassum blooms most clearly coincide with a negative phase of the AMM. For individual ensemble members, we calculate the rms error between predicted and observed time series. We further obtain the AMM-index averaged for the peak period of March, April and May (MAM), for each ensemble member (1988-2010). A significant positive correlation between rms error and AMM-index, for a predicted year characterised by negative AMM-index, then confirms that lower rms error is associated with ensemble members that share that negative index.
This approach is tested with two predictions of sargassum total area south of Jamaica, for which the AMM-index is negative, and ensemble-mean rms is minimum (see Supplementary Tables 1, 2):
• days 91-275 of 2015, with 1% windage and drift only
• days 91-275 of 2018, with 1% windage and growth/loss
In MAM of 2015, the AMM-index averages -4.653, and the correlation between rms error and AMM index is 0.499. In MAM of 2018, the AMM-index averages -2.353, and the correlation between rms error and AMM index is 0.414. These significantly positive correlations are consistent with more accurate predictions (lower rms errors) for ensemble members based on hindcast winds and currents from years subject to similar negative AMM conditions as observed in 2015 and 2018.
In Figure 13, we show time series of the predicted total area of sargassum south of Jamaica, selecting forecasts based on four ensemble members (per prediction) for which the March-May averaged AMM-index is below -3.0 (thin blue lines, averaged to obtain sub-ensemble means as thick blue lines), for days 91-275 of 2015 and 2018. These ensemble members are obtained with hindcast winds and currents for 1989, 1991, 1994 and 2009 – indicated with blue bars in Figure 12.
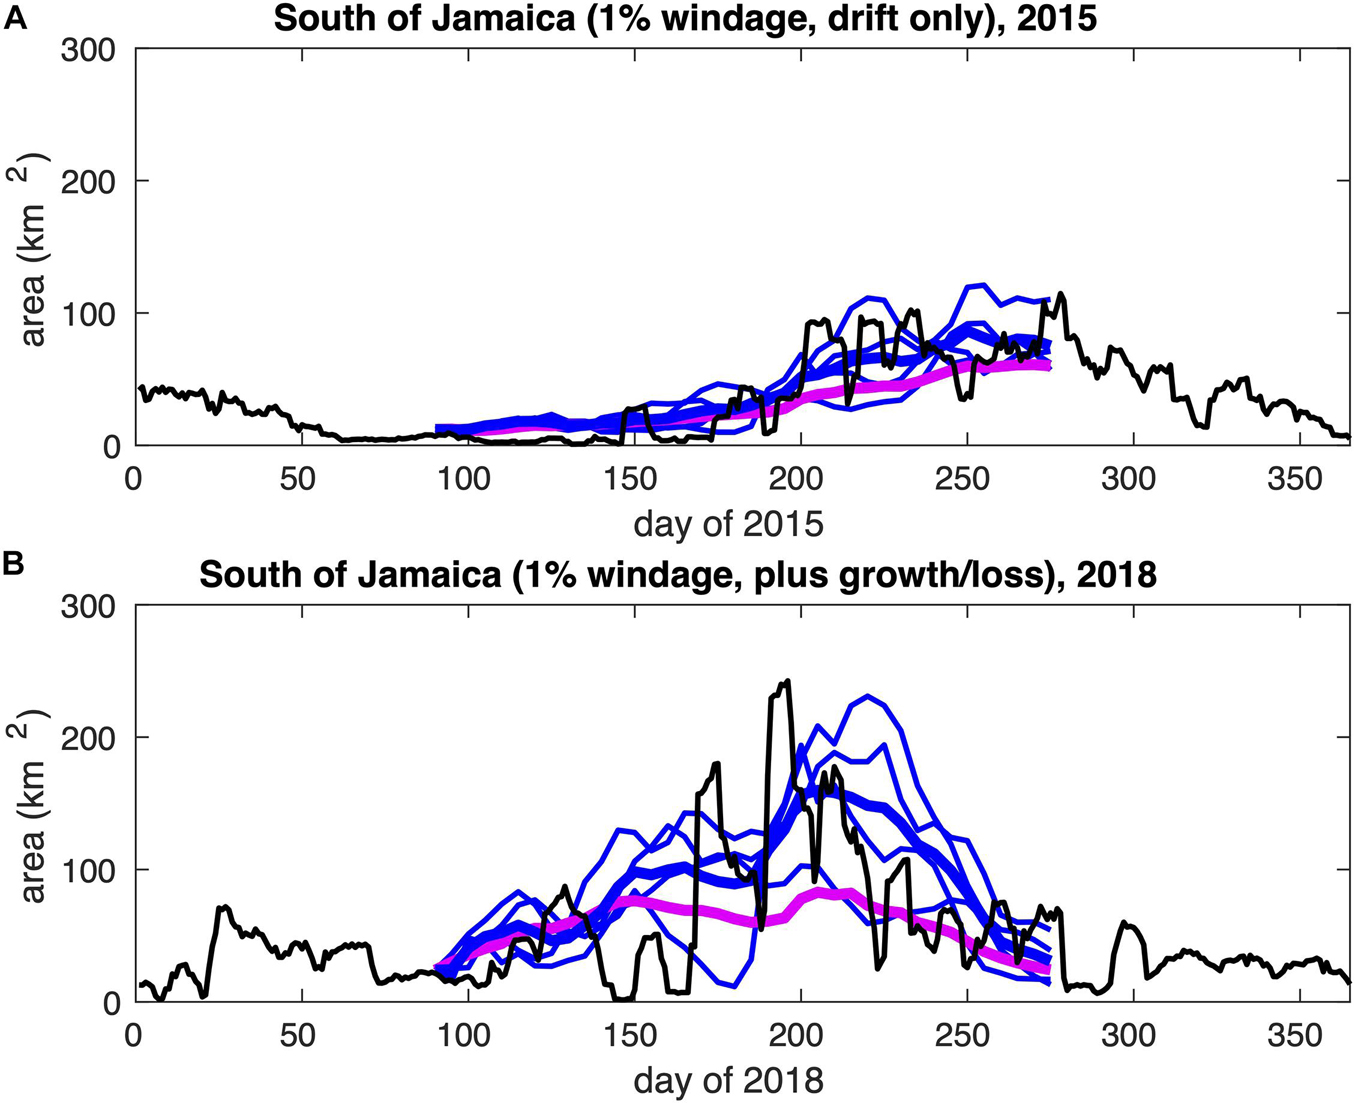
Figure 13. Predicted total area of sargassum south of Jamaica, selecting forecasts based on ensemble members for which AMM index < –3.0 (thin blue lines, averaged to obtain the thick blue lines): (A) days 91-275 of 2015, with 1% windage and drift only; (B) days 91-275 of 2018, with 1% windage and growth/loss. The full ensemble mean is also plotted (thick mauve line). Observed areas are indicated by the black lines.
Improvements over the full ensemble mean (thick mauve line) are gained by averaging ensemble members from hindcast years with a closely matching (negative) AMM-index. Over the 180-day forecasts, rms errors (considering ensemble means with respect to observations) are reduced from 22.23 km2 (see Supplementary Table 1) to 16.54 km2 for 2015, and from 50.87 km2 (see Supplementary Table 2) to 48.00 km2 for 2018. More specifically, the observed peak in sargassum area at around day 200 of 2018 is more accurately predicted, by approximately doubling the ensemble-mean prediction, while the summer 2015 peak is closer to observations by around 50% of the ensemble-mean prediction.
Further improvements of sargassum predictions at seasonal timescale may be gained through association of reduced rms errors in ensemble members sharing phases (with the forecast year) for other modes of climate variability, although utility of this advantage will depend on corresponding predictability for these modes at seasonal timescale. In the case of the AMM, interannual variability is linked via air-sea interaction to an upwelling structure in the northeast tropical Atlantic, known as the Guinea Dome; springs and summers characterised by a negative AMM, leading to extensive sargassum, are preceded by a strong Guinea Dome in late fall of the preceding year (Doi et al., 2010). This AMM predictability may assist seasonal sargassum forecasts.
Example Forecasts for Spring and Summer of 2021
We have prepared forecasts for days 91-275 of 2021, shared with SARTRAC partners in Jamaica. To provide an example of a summary SARTRAC-EFS forecast, we show in Figure 14 and Supplementary Table 5 the graphical and tabulated “dashboard” information that can be provided to stakeholders. The highest peak area of sargassum south of Jamaica (65.9 ± 19.2 km2) is obtained if we include growth and loss terms, which also delays the peak by 5 days, compared to assuming drift only. Forecast areas north of Jamaica are less sensitive to the choice of forecast, although the peaks are delayed by 4-5 weeks compared to south of Jamaica. As was evident for previous years (see section “Seasonal Prediction”), late-season area estimates are suppressed in the forecasts that include growth and loss factors.
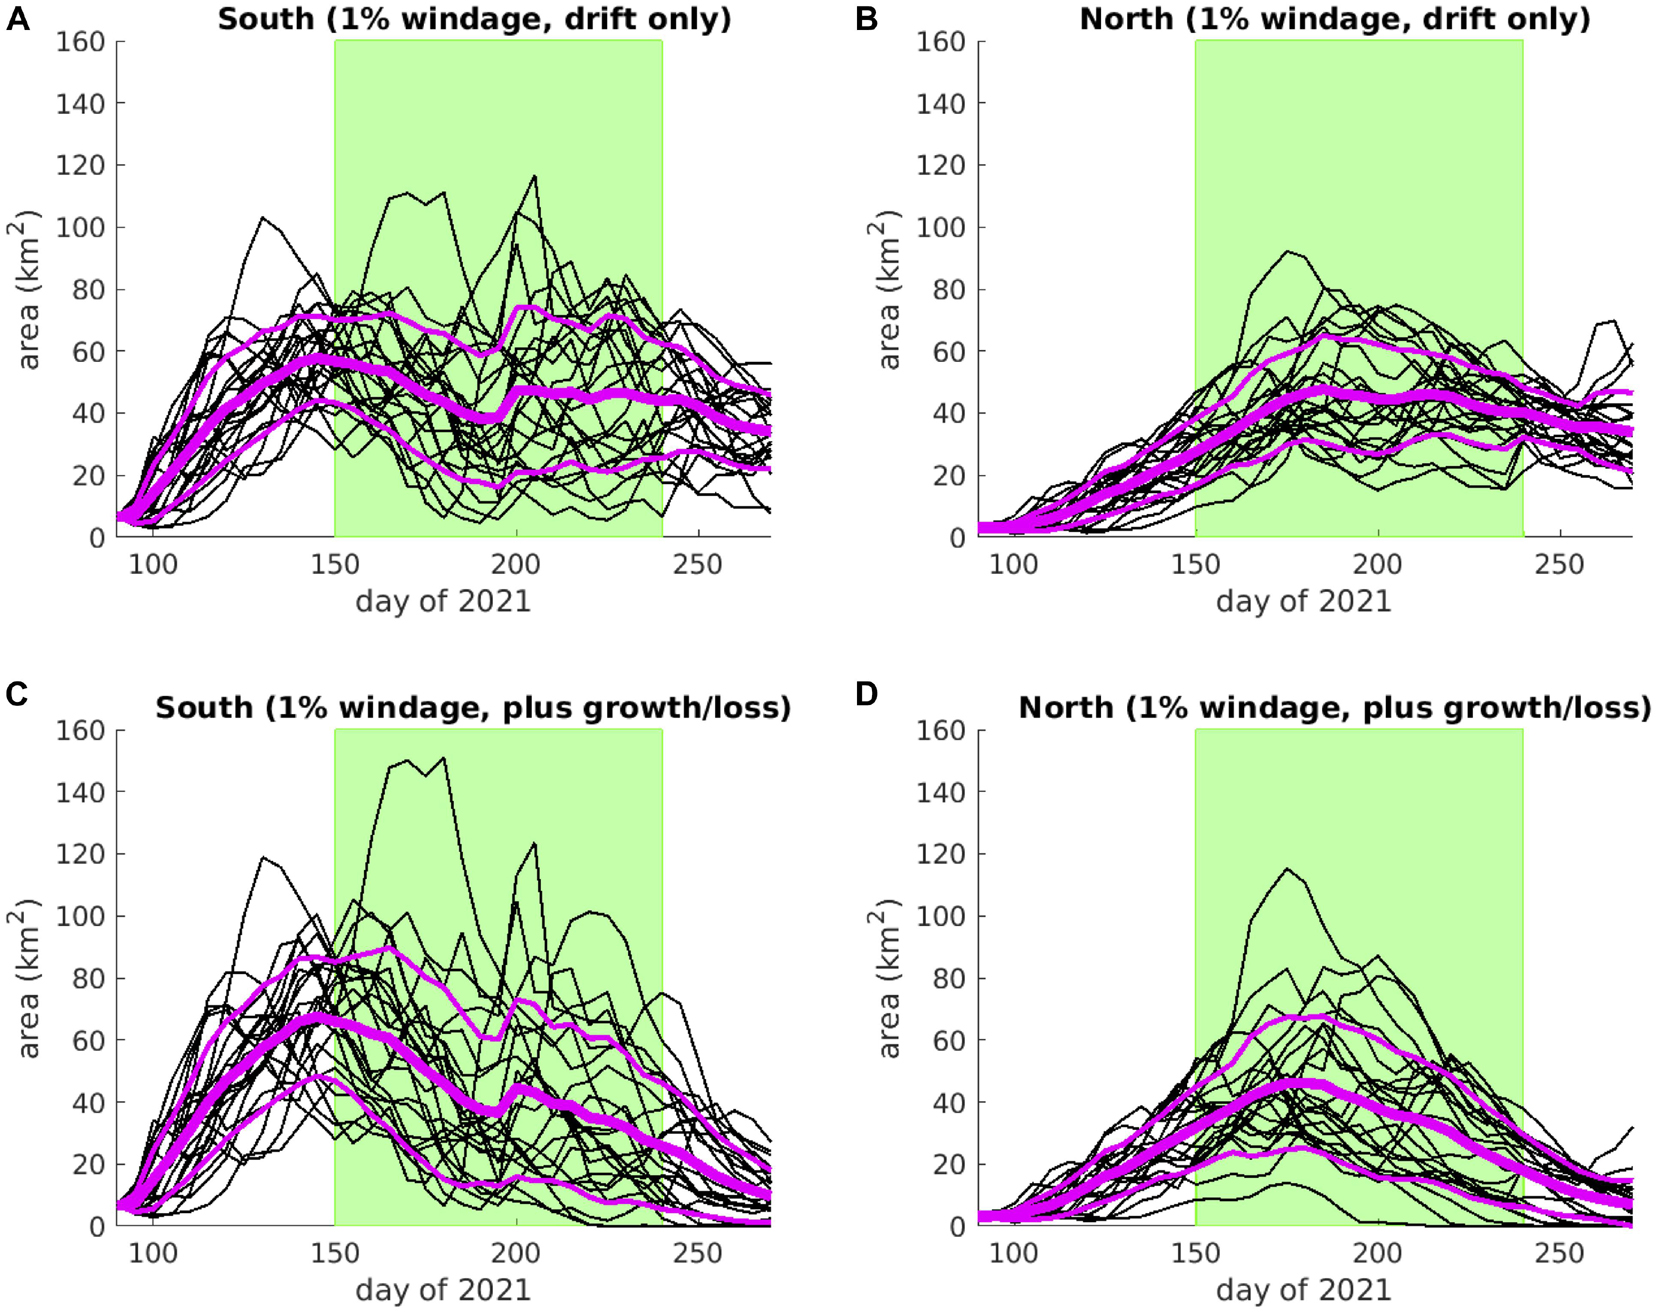
Figure 14. Forecasts for the total area of sargassum present south (A,C) and north (B,D) of Jamaica for days 91-275 of 2021, assuming 1% windage and drift only (A,B) and including growth and loss factors (C,D). The green shading highlights a planned survey period; individual ensemble members are indicated with thin black lines; the ensemble-mean is indicated with the thick mauve line; one standard deviation above and below the mean is indicated with a thin mauve line; total area is obtained by aggregating the area represented by each particle, south and north of Jamaica, accounting for growth and loss terms in (C) and (D).
West Africa
Shifting our focus to the eastern tropical Atlantic, and the prevalence of sargassum along the coast of west Africa, we are confronted with the challenge of limited satellite data due to cloud cover. To explore the potential for seasonal forecasts in this region, with a focus on the coastal waters of Ghana, we apply the same approach as for predictions around Jamaica, initializing particle locations with a single clear AFAI image for 20 May 2020, followed by an experimental analysis of the catchment area for sargassum arriving off Ghana.
Seasonal Predictions for Summer 2020
Initialising particles in a limited Gulf of Guinea catchment area (see section “Satellite Observations”), and subject to quite different currents and winds compared to the central and western tropical Atlantic, predictions for west African region are limited to just 90 days. In Figure 9, we illustrate the initial distribution (Figure 9A), and example forecast distributions, after 30, 60, and 90 days (Figures 9B–D), under 0% windage, with winds and currents here from the hindcast year of 1989.
With particles initially confined to the west of the domain, rapid eastward advection in the Guinea Current is striking (Figures 9B,C), with considerable accumulation of particles in the eastern Gulf of Guinea after 90 days (Figure 9D). As for Jamaica, we assemble time series in Figure 15 for the predicted total area of sargassum, here for coastal waters of western and eastern Ghana, defined poleward of 4°N in the longitude ranges 1-3°W (left panels) and 1°W to 1°E (right panels) respectively.
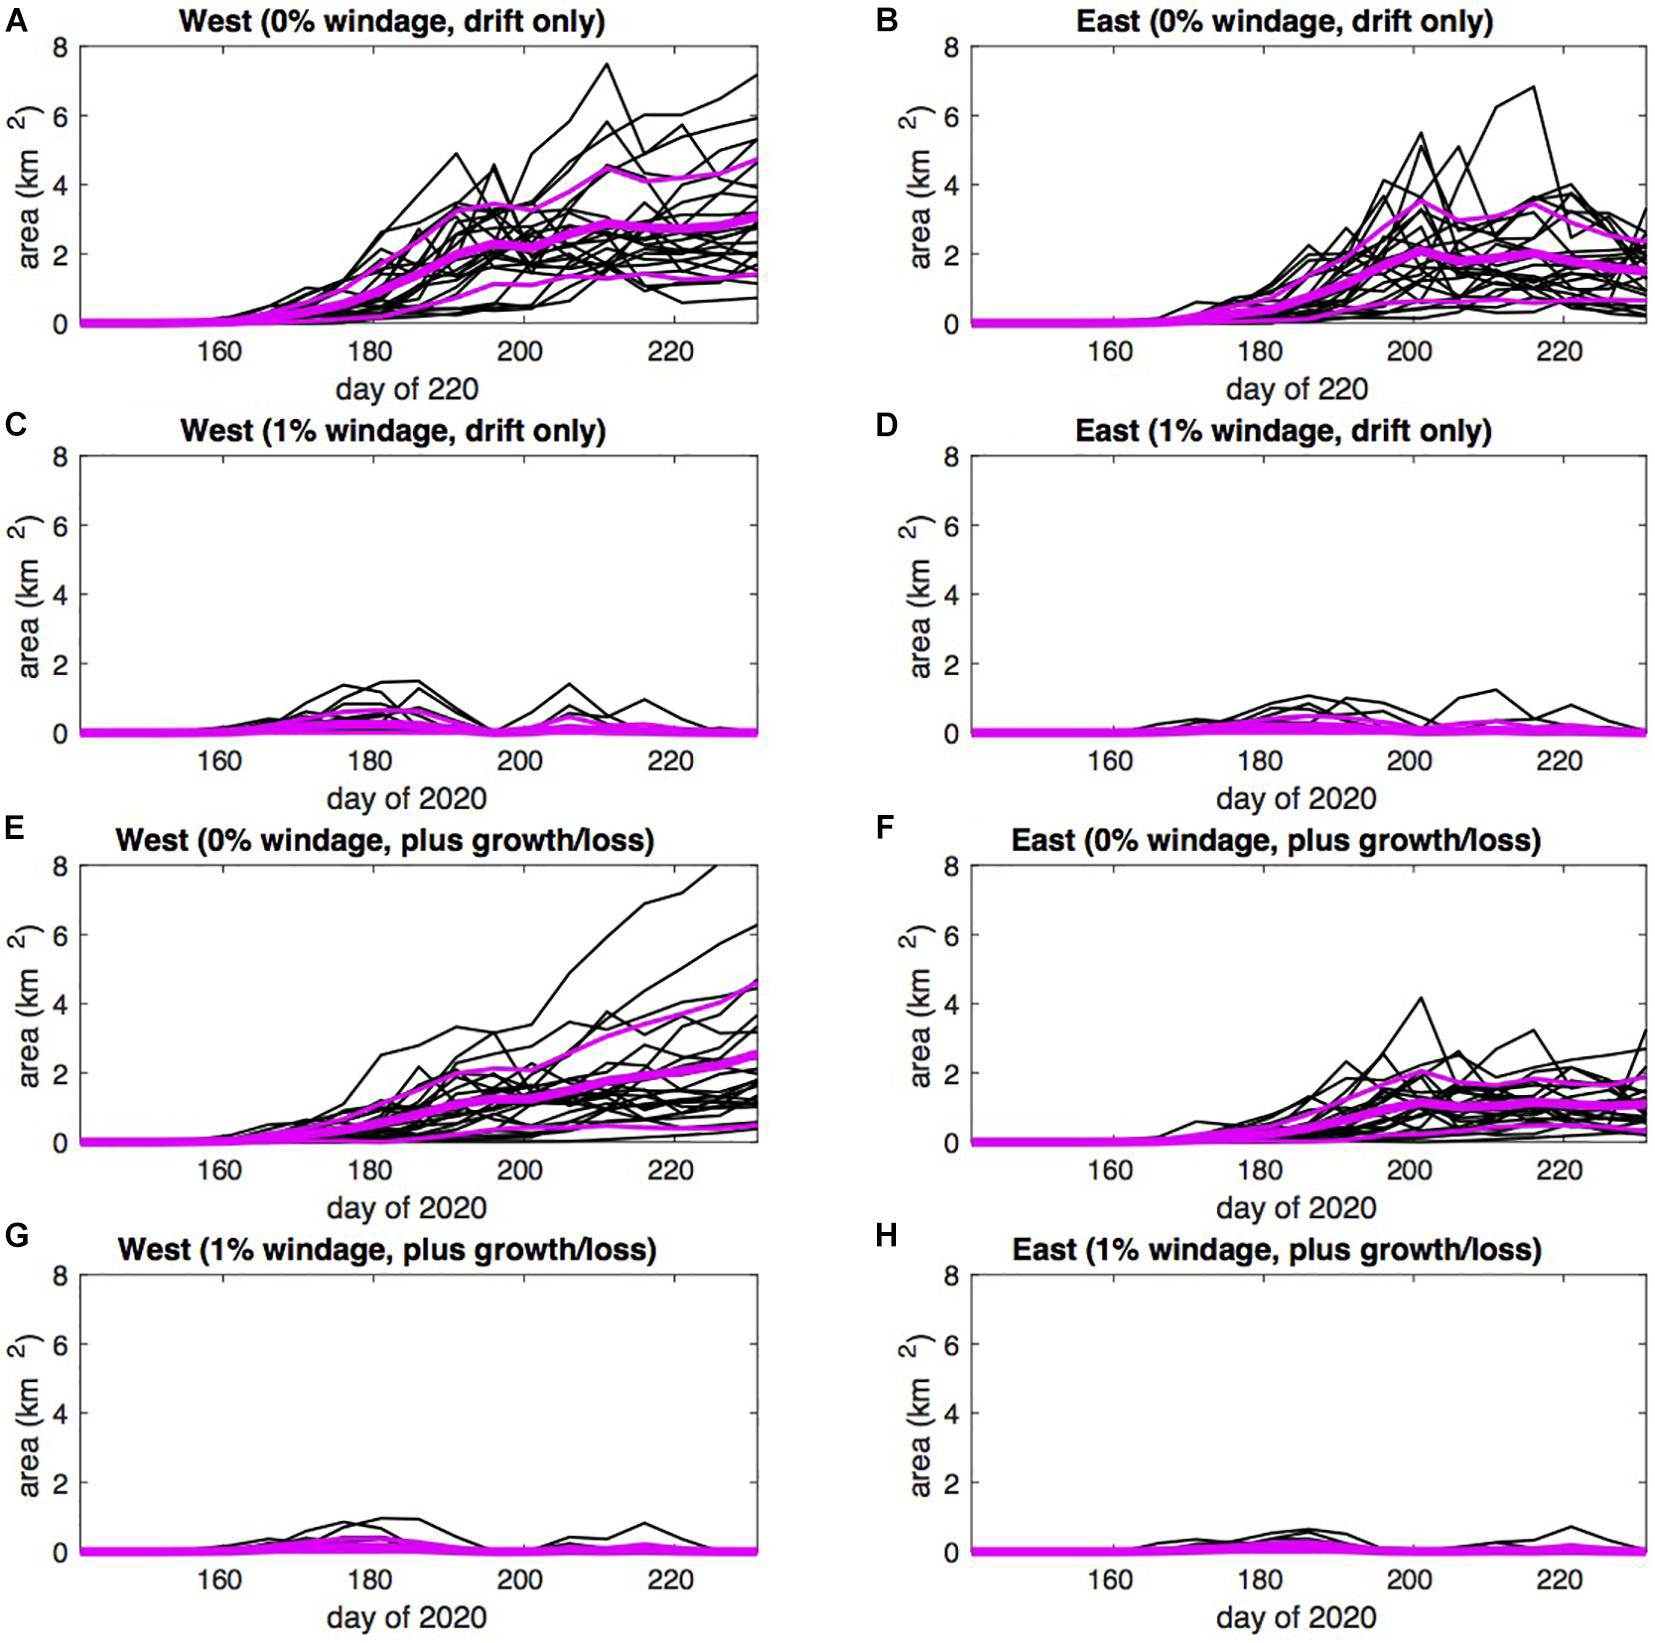
Figure 15. Time series of total area of sargassum poleward of 4°N off west Ghana in the longitude range 1-3°W (A,C,E,G), and off east Ghana in the longitude range 1°W to 1°E (B,D,F,H), predicted for May-August 2020: (A,B) 0% windage, drift only; (C,D) 1% windage, drift only; (E,F) 0% windage, drift plus growth and loss; (G,H) 1% windage, drift plus growth and loss; individual ensemble members are indicated with green lines; the ensemble mean is indicated with the mauve lines; note the much reduced area range (0–8 km2), compared to Supplementary Figures 3–6, 13, 14.
We repeat the same combination of four experiments, finding a quite different influence of windage. With prevailing onshore winds during summer (see Figure 6B), the majority of sargassum is driven ashore to the west and very little sargassum reaches coastal waters of Ghana under 1% windage, compared to 0% windage. In the latter experiments, compared to east Ghana, first arrival of sargassum off west Ghana is earlier by around 10 days and total area is generally higher after day 200. This is consistent with western provenance of the sargassum, and progressive dispersal with conveyance eastward.
Upstream Sources of Sargassum and Limits on Seasonal Forecasts for Ghana
To examine the catchment area for sargassum arriving off Ghana in mid-summer, at timescales up to 90 days, we use the same approach as for the sargassum arriving around Jamaica (see section “Upstream Sources of Sargassum and Limits on Seasonal Forecasts for Jamaica”). With limited coverage of satellite observations across the region, we evenly distribute particles off Ghana (one per NEMO-ORCA12 gridcell) in the area defined for the forecasts in Figure 15 (poleward of 4°N, 3°W-1°E), at day 192 (early July). Recognising the impact of windage in section “Seasonal Predictions for Summer 2020,” we examine upstream sources under windages of 0% and 1%. Results are presented in Supplementary Material (Supplementary Figures 10–12).
Under 0% windage (Supplementary Figure 10), the majority of particles are back-tracked due west over the first 60 days, with some particles previously traced back eastward to equatorial Africa. A wide range of provenance is evident in the geographical spread of particle mean ages that exceed 60 days (Supplementary Figure 10D). Under 1% windage (Supplementary Figure 11), westward backtracking is curtailed (compared to 0% windage), with the majority of particles swiftly advected from southeast to northwest over days 20-60 (Supplementary Figure 11D). Under 0% windage, most (> 50%) of the particles remain within the Gulf of Guinea catchment area (enclosed with the solid red boundary) within 60 days. Under 1% windage, the time horizon for which most particles are still in catchment falls to around 50 days (Supplementary Figure 12). In summary, analysis of back-trajectories confirms that the Gulf of Guinea catchment area provides initial locations appropriate to forecasts up to 50-60 days, and that extension of this area westward to ∼25°W and southward to ∼5°S is necessary to initialise 90-day forecasts.
Discussion
We have used a range of available datasets and methods to develop SARTRAC-EFS, a prototype ensemble forecast system to predict the seasonal arrival of sargassum in selected coastal waters, here around Jamaica and off Ghana. In our hybrid approach, use satellite observations to initialise the location of virtual particles in proportion to the sargassum, across upstream sources. The particles are tracked forwards in time, subject to a plausible range of winds and surface currents from a 23-year hindcast spanning 1988-2010. Forecasts are obtained as time series of the mean and standard deviation in the total area of sargassum, inferred from the aggregation of particles in selected areas. One limitation of this study concerns the unavailability of synoptic wind and current data for more recent years – specifically 2015 and 2018-20 – although we consider that the available hindcast samples a range of ocean and climate variability that is suitably representative, for ensemble forecasting at seasonal timescale.
Tracking particles subject to surface currents under varying degrees of windage (here 0% or 1%) follows the pioneering work of Putman et al. (2018), and we reflect here on specific issues raised by that study in the context of our findings. In broad agreement with Putman et al. (2018), we find that particles initialised in proportion to sargassum in the Central Atlantic region move generally westward to arrive in the Caribbean on a seasonal timescale. Some of the variability between ensemble members of SARTRAC-EFS is likely related to differences in the balance of direct and indirect connectivity between the equatorial Atlantic and the Caribbean that are related to changes in the North Brazil Current system, noting implicit interannual variability in five identified transport routes (Figure 10 in Putman et al., 2018). A variable role of windage across the Caribbean, as suggested by Putman et al. (2018), may explain why windage both improves and degrades forecasts, in different years. Finally, the close correspondence between satellite observations of sargassum coverage in the equatorial Atlantic and subsequent inundations in the eastern Caribbean is consistent with predicted arrivals around Jamaica that are roughly proportional to initialised distributions, in each of our four study years. Other points raised in Putman et al. (2018), regarding the need to more fully account for physical and biological processes, are covered later in our discussion.
This expedient use of model hindcast data and ensemble statistics enables us to account for the uncertainty inherent in winds and currents on timescales from synoptic to seasonal. In this respect, SARTRAC-EFS is complementary to alternative prediction systems, based on statistics of satellite observations (Wang and Hu, 2017), climatological drift observations (Johnson et al., 2020), and a deterministic, physical-biogeochemical model (Jouanno et al., 2020). Each method has advantages and caveats. To the extent that satellite data is an accurate measure of sargassum abundance at basin-scale, past satellite observations can guide the development of a statistical model, but without process-level detail. In situ drift observations, of undrogued drifters, provide the most authentic dynamical description of how sargassum moves through the region, but relies on climatology as a “best guess” of where sargassum will drift in any year, and drifters are known to under-sample some of the flow. Fully coupled models provide a process-rich representation of physical and biogeochemical processes, but the realism may be compromised by a large number of highly uncertain parameters, and multiple interactions can lead to large errors. The pragmatic approach of SARTRAC-EFS blends aspects of these established approaches, and as such we share some strengths and weaknesses. An improved assessment of sargassum developing on seasonal timescales may be best informed by a suite of predictions, accommodating each approach.
Testing SARTRAC-EFS for four recent years, when sargassum proliferated throughout much of the tropical Atlantic, we show that the seasonal forecast in a given year should ideally account for appropriate windage, growth, mortality, sinking and regional climate variability. Improved agreement with observations may be gained in several ways:
• Adding more functionality to our trajectory calculations (further discussed below).
• Monitoring the physical and biological processes that drive the growth, movement and mortality of sargassum, across the tropical Atlantic, to improve our understanding of how best to include these processes in our forecasts.
• Continued application of SARTRAC-EFS and other prediction systems to future sargassum influxes, learning from each seasonal forecast.
Our forecasts are ultimately limited by the availability and quality of satellite derived distribution of sargassum to both initialize and evaluate predictions. In particular, extension of daily FA_density images substantially to the east of 38°W would potentially extend the Jamaica forecast time horizon well beyond 120–180 days. Likewise, westward and southward extensions of the satellite data available for forecasts off west Africa are necessary for Ghana forecasts of up to 90 days. There are now prospects for wider satellite monitoring of sargassum via the Sentinel-2 and Sentinel-3 satellites, with free and open access to Sentinel-3 products via the Copernicus Online Data Access (CODA) Web Service. Météo France, the French national meteorological service, is now using these satellite data to develop sargassum forecasts for the French Caribbean islands. More critically, major improvements in the remote sensing of sargassum in the eastern tropics is necessary to validate seasonal predictions off west Africa. With both Sentinel 2 and Sentinel 3 satellites in orbit, there is now an opportunity to improve temporal coverage and probability of obtaining cloud free images. Furthermore, as indicated in earlier studies (e.g., Gower et al., 2013), the availability of red edge spectral bands in both sensors could be highly useful in detecting the sargassum optical signature and, in turn, accuracy in detection.
On a fundamental level, there is also an urgent need for better understanding of the growth and loss of sargassum in the tropical Atlantic, with existing parameterisations and parameters based on analysis of sargassum from the Sargasso Sea. In the meantime, we highlight scope for improvement of our framework by incorporating more processes in the offline growth algorithm. Different nutrient sources may determine the annual growth rates (Oviatt et al., 2019), depending on pathways followed by sargassum mats in a given year. This growth factor may be incorporated into our seasonal predictions by associating nutrient levels with physical water properties, temperature and salinity.
Regardless of nutrient limitations, sargassum growth is a function of not just temperature – as included here – but also salinity. In laboratory experiments, the growth rate for S. natans increases substantially, from ∼0.1 to ∼0.5 doubling day–1, as salinity is increased from 24 to 36 psu (Hanisak and Samuel, 1987). Sargassum drifting with the North Brazil Current may encounter salinity variations in this range, associated with the highly variable Amazon plume. Including a functional dependence on salinity, saved along with temperature along each trajectory, therefore offers the prospect for further refinement of predictions. We can furthermore accommodate variable light levels, in relation to local irradiance. Finally, the sinking rate may be varied in relation to local wind conditions, by including Stokes drift in the trajectory calculations.
In addition to in situ processes, seasonal predictions of sargassum movement must account for the interannual variability of winds and currents across the tropical Atlantic. In addition to the Atlantic Meridional Mode and Atlantic Niño that we have identified here, other modes of interannual climate variability may be influential in determining the transport, growth and loss of sargassum in any given year. The North Atlantic Oscillation appears to have exerted a remote influence on the tropical Atlantic in 2010/11 (Johns et al., 2020), but the region is also subject to some influence from the El Niño (Saravanan and Chang, 2000; Xie and Carton, 2004).
Interplay between modes of natural variability and anthropogenic climate change will likely determine the future prevalence of sargassum. Over 2031-50, regional expression of projected global-mean sea surface temperature rises in the range 0.64-0.95°C, (Table CB1.1 in IPCC, 2019), will impact both the growth and mortality of sargassum. Meanwhile, sea surface salinity is subject to ‘pattern amplification’ under an intensifying hydrological cycle, now evident over a long timescale (Gould and Cunningham, 2021). Given the multiple dependencies of sargassum growth and mortality on temperature and salinity, the overall consequence of climate change and variability for sargassum are highly uncertain on a multidecadal timescale.
At a practical level, we finally stress the need to couple the open ocean forecasting systems such as SARTRAC-EFS with coastal nearshore prediction models/frameworks. Only then can the forecasts serve all sector stakeholders, such as those managing sargassum beaching events to protect tourism, coastal livelihoods and health, providing advance warning for fisheries sector and businesses using or planning to use sargassum.
Further experiments and analysis to determine the relative importance of different modes of climate variability, on the prevalence and drift of sargassum, are ongoing. Meanwhile, forecasts with SARTRAC-EFS for summer of 2021 indicate that substantial quantities of sargassum will once again be present north and south of Jamaica, providing useful early warning of beaching events throughout May-August, with peak quantities most likely during June.
Data Availability Statement
Publicly available datasets were analysed in this study. This data can be found here: The satellite datasets analysed for this study can be found at the website of the Optical Oceanography Laboratory at the University of South Florida (https://optics.marine.usf.edu), selecting ‘Satellite Data Products’, and further selecting: ‘E. Caribbean’ and ‘Jamaica’ from ‘Caribbean’; ‘Central Atlantic’ from ‘South America’; ‘Gulf of Guinea’ from ‘West Africa.’ To download all daily AFAI images for the ‘E. Caribbean’, ‘Jamaica’ and ‘Central Atlantic’ regions, we used Matlab scripts that are archived on Zenodo (published with a link to this article, when a DOI is available). Analyzed satellite data, example tracking data, along with past seasonal prediction and prototype forecast data, will be likewise archived on Zenodo, on publication. The hindcast ORCA12 model datasets used in SARTRAC-EFS (surface currents, temperatures, salinities and winds) are archived on a filesystem at the National Oceanography Centre, Southampton, and are available on request. The AMM index data used here can be found at https://www.aos.wisc.edu/_dvimont/MModes/Data.html, while the Atlantic Niño index was computed from NOAA Optimum Interpolation SST (v2) monthly fields, found at https://psl.noaa.gov/data/gridded/data.noaa.oisst.v2.html.
Author Contributions
RM undertook the calculations and developed the manuscript. KA, P-NJ-Q, HO, AM, and RA provided input on regional contexts in the Caribbean and West Africa and including associated analysis and text. NS provided climate index calculations and accompanying text. JD contributed to text on remote sensing. ET and HO suggested improvements that improved clarity of the manuscript throughout. All authors contributed to the article and approved the submitted version.
Funding
This publication is supported by the United Kingdom Economic and Social Research Council through the Global Challenges Research Fund (GCRF) project, Teleconnected SARgassum risks across the Atlantic: building capacity for TRansformational Adaptation in the Caribbean and West Africa (SARTRAC), grant number ES/T002964/1.
Conflict of Interest
The authors declare that the research was conducted in the absence of any commercial or financial relationships that could be construed as a potential conflict of interest.
Publisher’s Note
All claims expressed in this article are solely those of the authors and do not necessarily represent those of their affiliated organizations, or those of the publisher, the editors and the reviewers. Any product that may be evaluated in this article, or claim that may be made by its manufacturer, is not guaranteed or endorsed by the publisher.
Acknowledgments
We acknowledge the Optical Oceanography Laboratory at the University of South Florida, for freely providing FA_density images via https://optics.marine.usf.edu. The NEMO-ORCA12 hindcast simulation was carried out by the Marine Systems Modelling group at the National Oceanography Centre (NOC). The version of ARIANE used here was developed by George Nurser of NOC and implemented by Jeff Blundell of the University of Southampton. RM acknowledges funding from the European Research Council (ERC) under the European Union’s Horizon 2020 Research and Innovation Programme under grant agreement No 759677. We are grateful to two anonymous reviewers for a wide range of insightful comments that helped us to substantially improve the manuscript.
Supplementary Material
The Supplementary Material for this article can be found online at: https://www.frontiersin.org/articles/10.3389/fmars.2021.722524/full#supplementary-material
References
Ackah-Baidoo, A. (2013). Fishing in troubled waters: oil production, seaweed and community-level grievances in the Western Region of Ghana. Commun. Dev. J. 48, 406–420. doi: 10.1093/cdj/bst022
Addico, G. N. D., and deGraft-Johnson, K. A. A. (2016). Preliminary investigation into the chemical composition of the invasive brown seaweed Sargassum along the West Coast of Ghana. Afr. J. Biotechnol. 15, 2184–2191. doi: 10.5897/AJB2015.15177
Anderson, R., Maxam, A., Bissick, A., and Lyew-Ayee, P. (2021). Characterisation of Physical Conditions Prevalent During Local Sargassum Beaching Events for Jamaica.
Berline, L., Ody, A., Jouanno, J., Chevalier, C., André, J.-M., Thibaut, T., et al. (2020). Hindcasting the 2017 dispersal of Sargassum algae in the Tropical North Atlantic. Mar. Pollut. Bull. 158:111431. doi: 10.1016/j.marpolbul.2020.111431
Blaker, A. T., Hirschi, J. J. M., McCarthy, G., Sinha, B., Taws, S., Marsh, R., et al. (2015). Historical analogues of the recent extreme minima observed in the Atlantic meridional overturning circulation at 26 N. Clim. Dyn. 44, 457–473. doi: 10.1007/s00382-014-2274-6
Blanke, B., and Raynaud, S. (1997). Kinematics of the Pacific equatorial undercurrent: an eulerian and lagrangian approach from GCM results. J. Phys. Oceanogr. 27, 1038–1053. doi: 10.1175/1520-0485(1997)027<1038:KOTPEU>2.0.CO;2
Brodeau, L., Barnier, B., Treguier, A.-M., Penduff, T., and Gulev, S. (2010). An ERA40-based atmospheric forcing for global ocean circulation models. Ocean Model. 31, 88–104. doi: 10.1016/j.ocemod.2009.10.005
Brooks, M. T., Coles, V. J., Hood, R. R., and Gower, J. F. R. (2018). Factors controlling the seasonal distribution of pelagic Sargassum. Mar. Ecol. Prog. Ser. 599, 1–18. doi: 10.3354/meps12646
Caribbean Disaster Mitigation Project (2000). Atlas of Probable Storm Effects in the Caribbean Sea. Implemented by the Organization of American States, Unit of Sustainable Development and Environment for the USAID Office of Foreign Disaster Assistance and the Caribbean Regional Program. Powerpoint presentation file downloadable from: CDMP: Atlas of Probable Storm Effects in the Caribbean Sea (oas.org). Washington, DC: Organization of American States.
Desrochers, A., Cox, S.-A., Oxenford, H. A., and van Tussenbroek, B. (2020). Sargassum uses guide: a resource for Caribbean researchers, entrepreneurs and policy makers. FAO-GEF CC4FISH Report. CERMES Technical Report (Special Edition) 97. Wanstead: CERMES, 172.
Doi, T., Tozuka, T., and Yamagata, T. (2010). The Atlantic meridional mode and its coupled variability with the Guinea Dome. J. Clim. 23, 455–475. doi: 10.1175/2009JCLI3198.1
Fidai, Y. A., Dash, J., Tompkins, E. L., and Tonon, T. (2020). A systematic review of floating and beach landing records of Sargassum beyond the Sargasso Sea. Environ. Res. Commun. 2:122001. doi: 10.1088/2515-7620/abd109
Franks, J. S., Johnson, D. R., and Ko, D.-S. (2014). “Retention and growth of pelagic Sargassum in the North Equatorial Recirculation Region (NERR) of the Atlantic Ocean,” in Proceedings of the 67th Gulf and Caribbean Fisheries Institute, Christ Church.
Franks, J. S., Johnson, D. R., and Ko, D.-S. (2016). Pelagic Sargassum in the tropical North Atlantic. Gulf Caribb. Res. 27, SC6–SC11. doi: 10.18785/gcr.2701.08
Franks, J. S., Johnson, D. R., Ko, D.-S., Sanchez-Rubio, G., Hendon, J. R., and Lay, M. (2012). “Unprecedented influx of pelagic Sargassum along Caribbean island coastlines during summer 2011,” in Proceedings of the Gulf and Caribbean Fisheries Institute, Vol. 64, Mexico, 6–8.
García-Sánchez, M., Graham, C., Vera, E., Escalante-Mancera, E., Álvarez-Filip, L., and van Tussenbroek, B. I. (2020). Temporal changes in the composition and biomass of beached pelagic Sargassum species in the Mexican Caribbean. Aquat. Bot. 167:103275. doi: 10.1016/j.aquabot.2020.103275
Gould, W. J., and Cunningham, S. A. (2021). Global-scale patterns of observed sea surface salinity intensified since the 1870s. Commun. Earth Environ. 2:76. doi: 10.1038/s43247-021-00161-3
Gower, J., Young, E., and King, S. (2013). Satellite images suggest a new Sargassum source region in 2011. Remote Sens. Lett. 4, 764–773. doi: 10.1080/2150704X.2013.796433
Hanisak, M. D., and Samuel, M. A. (1987). Growth rates in culture of several species of Sargassum from Florida. USA. Hydrobiologia 151-152, 399–404. doi: 10.1007/BF00046159
Hu, C. (2009). A novel ocean color index to detect floating algae in the global oceans. Remote Sens. Environ. 113, 2118–2129. doi: 10.1016/j.rse.2009.05.012
IPCC (2019). IPCC Special Report on the Ocean and Cryosphere in a Changing Climate, eds H.-O. Pörtner, D. C. Roberts, V. Masson-Delmotte, P. Zhai, M. Tignor, E. Poloczanska, et al. Geneva: IPCC.
Johns, E. M., Lumpkin, R., Putman, N. F., Smith, R. H., Muller-Karger, F. E., Rueda-Roa, D. T., et al. (2020). The establishment of a pelagic Sargassum population in the tropical Atlantic: biological consequences of a basin-scale long distance dispersal event. Prog. Oceanogr. 182:102269. doi: 10.1016/j.pocean.2020.102269
Johnson, D. R., Franks, J. S., Oxenford, H. A., and Cox, S. L. (2020). Pelagic Sargassum prediction and marine connectivity in the tropical Atlantic. Gulf Caribb. Res. 31, GCFI20–GCFI30. doi: 10.18785/gcr.3101.15
Jouanno, J., Benshila, R., Berline, L., Soulié, A., Radenac, M.-H., Morvan, G., et al. (2020). A NEMO-based model of Sargassum distribution in the tropical Atlantic: description of the model and sensitivity analysis (NEMO-Sarg1.0). Geosci. Model Dev. Discuss 14, 4069–4086. doi: 10.5194/gmd-2020-383
Lapointe, B. E. (1986). Phosphorus-limited photosynthesis and growth of Sargassum natans and Sargassum fluitans (Phaeophyceae) in the western North Atlantic. Deep Sea Res. A 33, 391–399. doi: 10.1016/0198-0149(86)90099-3
Lübbecke, J. F., Rodríguez-Fonseca, B., Richter, I., Martín-Rey, M., Losada, T., Polo, I., et al. (2018). Equatorial Atlantic variability–modes, mechanisms, and global teleconnections. WIREs Clim. Change 9:e527. doi: 10.1002/wcc.527
Madec, G. (2008). NEMO Reference Manual, Ocean Dynamic Component: NEMO-OPA. Rep. 27, Note du ple de Modlisation. France: Institut Pierre Simmon Laplace (IPSL).
Maréchal, J.-P., Hellio, C., and Hu, C. (2017). A simple, fast, and reliable method to predict Sargassum washing ashore in the Lesser Antilles. Remote Sens. Appl. Soc. Environ. 5, 54–63. doi: 10.1016/j.rsase.2017.01.001
Maxam, A., and Webber, D. F. (2010). The influence of wind-driven currents on the circulation and bay dynamics of a semi-enclosed reefal bay, Wreck Bay, Jamaica. Estuar. Coast. Shelf Sci. 87, 535–544. doi: 10.1016/j.ecss.2010.02.007
Oviatt, C. A., Huizenga, K., Rogers, C. S., and Miller, W. J. (2019). What nutrient sources support anomalous growth and the recent Sargassum mass stranding on Caribbean beaches? A review. Mar. Pollut. Bull. 145, 517–525. doi: 10.1016/j.marpolbul.2019.06.049
Oxenford, H. A., Cox, S.-A., van Tussenbroek, B. I., and Desrochers, A. (2021). Challenges of turning the Sargassum crisis into gold: current constraints and implications for the Caribbean. Phycology 1, 27–48. doi: 10.3390/phycology1010003
Oyesiku, O. O., and Egunyomi, A. (2014). Identification and chemical studies of pelagic masses of Sargassum natans (Linnaeus) Gaillon and S. fluitans (Borgessen) Borgesen (brown algae), found offshore in Ondo State, Nigeria. Afr. J. Biotechnol. 13, 1188–1193. doi: 10.5897/AJB2013.12335
Pazan, S. E., and Niiler, P. P. (2001). Recovery of near-surface velocity from undrogued drifters. J. Atmos. Ocean. Technol. 18, 476–489. doi: 10.1175/1520-0426(2001)018<0476:RONSVF>2.0.CO;2
Putman, N. F., Goni, G. J., Gramer, L. J., Hu, C., Johns, E. M., Trinanes, J., et al. (2018). Simulating transport pathways of pelagic Sargassum from the Equatorial Atlantic into the Caribbean Sea. Prog. Oceanogr. 165, 205–214. doi: 10.1016/j.pocean.2018.06.009
Putman, N. F., Lumpkin, R., Olascoaga, M. J., Trinanes, J., and Goni, G. J. (2020). Improving transport predictions of pelagic Sargassum. J. Exper. Mar. Biol. Ecol. 529:151398. doi: 10.1016/j.jembe.2020.151398
Rhein-Knudsen, N., Ale, M. T., Ajalloueian, F., and Meyer, A. S. (2017). Characterization of alginates from Ghanaian brown seaweeds: Sargassum spp. and Padina spp. Food Hydrocoll. 71, 236–244. doi: 10.1016/j.foodhyd.2017.05.016
Saravanan, R., and Chang, P. (2000). Interaction between tropical Atlantic variability and El Niño–Southern Oscillation. J. Clim. 13, 2177–2194. doi: 10.1175/1520-0442(2000)013<2177:IBTAVA>2.0.CO;2
Schell, J. M., Goodwin, D. S., and Siuda, A. N. S. (2015). Recent Sargassum inundation events in the Caribbean: shipboard observations reveal dominance of a previously rare form. Oceanography 28, 8–10. doi: 10.5670/oceanog.2015.70
UNEP (2018). “Sargassum white paper - Sargassum outbreak in the Caribbean: Challenges, opportunities and regional situation. UNEP(DEPI)/CAR WG.40/INF8,” in Proceedings of the 8th Meeting of the Scientific and Technical Advisory Committee (STAC) to the Protocol Concerning Specially Protected Areas and Wildlife (SPAW) in the Wider Caribbean Region, Panama City, 14.
Uppala, S. M., KÅllberg, P. W., Simmons, A. J., Andrae, U., Da Costa Bechtold, V., Fiorino, M., et al. (2005). The ERA-40 Reanalysis. Q. J. R. Meteorol. Soc. 131, 2961–3012. doi: 10.1256/qj.04.176
Van Sebille, E., Aliani, S., Law, K. L., Maximenko, N., Alsina, J. M., Bagaev, A., et al. (2020). The physical oceanography of the transport of floating marine debris. Environ. Res. Lett. 15:023003. doi: 10.1088/1748-9326/ab6d7d
Van Sebille, E., Zettler, E., Wienders, N., Amaral-Zettler, L., Elipot, S., and Lumpkin, R. (2021). Dispersion of surface drifters in the tropical Atlantic. Front. Mar. Sci. 7:607426. doi: 10.3389/fmars.2020.607426
van Tussenbroek, B. I., Arana, H. A. H., Rogriguez-Martinez, R. E., Espinoza-Avalos, J., Canizales-Flores, H. M., Gonzalez-Godoy, C. E., et al. (2017). Severe impacts of brown tides caused by Sargassum spp. on near-shore Caribbean seagrass communities. Mar. Poll. Bull. 122, 272–281. doi: 10.1016/j.marpolbul.2017.06.057
Wang, M., and Hu, C. (2016). Mapping and quantifying Sargassum distribution and coverage in the Central West Atlantic using MODIS observations. Remote Sens. Environ. 183, 356–367. doi: 10.1016/j.rse.2016.04.019
Wang, M. Q., and Hu, C. M. (2017). Predicting Sargassum blooms in the Caribbean Sea from MODIS observations. Geophys. Res. Lett. 44, 3265–3273. doi: 10.1002/2017GL072932
Wang, M. Q., Hu, C. M., Barnes, B. B., Mitchum, G., Lapointe, B., and Montoya, J. P. (2019). The great Atlantic Sargassum belt. Science 365, 83–87. doi: 10.1126/science.aaw7912
Xie, S.-P., and Carton, J. A. (2004). “Tropical Atlantic variability: patterns, mechanisms, and Impacts,” in Earth’s Climate, eds C. Wang, S.-P. Xie, and J. A. Carton (Washington, DC: American Geophysical Union).
Keywords: sargassum, currents, windage, seasonal, prediction, Jamaica, Ghana
Citation: Marsh R, Addo KA, Jayson-Quashigah P-N, Oxenford HA, Maxam A, Anderson R, Skliris N, Dash J and Tompkins EL (2021) Seasonal Predictions of Holopelagic Sargassum Across the Tropical Atlantic Accounting for Uncertainty in Drivers and Processes: The SARTRAC Ensemble Forecast System. Front. Mar. Sci. 8:722524. doi: 10.3389/fmars.2021.722524
Received: 08 June 2021; Accepted: 09 September 2021;
Published: 04 October 2021.
Edited by:
Jacopo Chiggiato, National Research Council (CNR), ItalyReviewed by:
Leo Berline, Aix-Marseille Université, FranceAndrea Cucco, National Research Council (CNR), Italy
Copyright © 2021 Marsh, Addo, Jayson-Quashigah, Oxenford, Maxam, Anderson, Skliris, Dash and Tompkins. This is an open-access article distributed under the terms of the Creative Commons Attribution License (CC BY). The use, distribution or reproduction in other forums is permitted, provided the original author(s) and the copyright owner(s) are credited and that the original publication in this journal is cited, in accordance with accepted academic practice. No use, distribution or reproduction is permitted which does not comply with these terms.
*Correspondence: Robert Marsh, rm12@soton.ac.uk