Pragmatic Assignment of Species Groups Based on Primary Species Hypotheses: The Case of a Dominant Component of the Southern Ocean Benthic Fauna
 Chester J. Sands
 Timothy D. O’Hara
 Rafael Martín-Ledo
- 1British Antarctic Survey, Cambridge, United Kingdom
- 2Museums Victoria, Melbourne, VIC, Australia
- 3Área de Zoología, Facultad de Ciencias, Universidad de Extremadura, Badajoz, Spain
Ecological studies that enhance our understanding of the structure and function of the natural world rely heavily on accurate species identification. With rapid sample accumulation and declining taxonomic expertise, cladistics, phylogenetics and coalescent-based analyses have become key tools for identification or discrimination of species. These tools differ in effectiveness and interpretation depending on researcher perspective and the unique evolutionary histories of the taxa. Given the cost and time required for taxonomic assessment of ambiguous species groups, we advocate a pragmatic approach to clarify species assignment. We carried out a case-study on species from the diverse ophiuroid genus Ophiacantha common in shelf habitats around the Southern Ocean. Although several of the species are formally described with clear and distinctive morphological characters and reproductive strategies (O. vivipara, O. pentactis, O. densispina, O. antarctica, and O. wolfarntzi), recent molecular data has highlighted issues with these morphospecies, the characters that formally define them and their evolutionary histories. Here we provide evidence that key morphological features of species can be deceptive and show that six-armed O. vivipara, for example, is not a widely distributed Southern Ocean species as currently accepted, rather, three disparate clades. Ophiacantha pentactis, described as having five arms, frequently has six arms and the six-armed form is mistakenly classified as O. vivipara. All six-armed specimens collected from the Antarctic continental shelf fall into the O. pentactis species clade. Molecular tools designed for species delimitation appear to fail to reflect the “true” species composition. Rather than rely on a single tool for species recognition, we advocate an integrated approach using traditional detailed taxonomic morphology, summary statistics of molecular sequence data from populations, robust phylogenies, sufficient geographical sampling and local biological knowledge to ensure that species hypotheses can be built on mutually supporting lines of evidence.
Introduction
The field of molecular systematics exists to place taxonomy into an evolutionary context, from which inferences can then be made regarding relationships, timing of divergences, biogeographic phenomena and diversity. Of all the taxonomic ranks used to help make some sense in ordering life, only one has real biological meaning and has been generally adopted as the base unit for measuring diversity and richness, and that is the “species.” Given the importance of the species unit, particularly in key areas such as conservation management, food security, or pathogen identification, it is clearly beneficial to be able to obtain accurate and consistent species identifications (Packer et al., 2018).
Obtaining accurate species identifications is not straightforward. At the outset it has been estimated that 86% of species are yet to be described from across all of the Earths habitats (Mora et al., 2011), and this proportion is very uneven across the higher level taxonomic groups. Of those that have been described perhaps as many as 30% (Coddington et al., 2009) have only been collected and identified once (Lim et al., 2012). Many apparently common and widespread described species are now being identified as complexes of cryptic or unrecognized species (Bickford et al., 2007; Janosik and Halanych, 2010). The existence of cryptic or unrecognized species is important not least as it results in underestimation of diversity and overestimation of species ranges and niche requirements. To compound the problem with species identifications, the process of identifying a species differs between the morphological taxonomic specialists in any specific group—where each character of each individual is rigorously checked against the original description—and the non-specialists who use the group in their research, where general information and shape is the principle means of identification (Lourenço, 2016).
Reliable species identifications rely heavily on good species descriptions. Providing accurate species descriptions has also been a challenge, particularly prior to affordable DNA-related assays and integrative taxonomy (Dayrat, 2005; Will et al., 2005). Describing a species without sufficient sampling to encompass the range of possible phenotypes, and without accounting for sexual dimorphism or ontogeny can lead to incomplete or ambiguous descriptions (Wolf and Markiw, 1984; Johnson et al., 2009).
There are philosophical issues that further complicate the definition and identification of species. That, generally, we as biologists can all refer to a species without confusion suggests that we do share a common ideology regarding the existence of the species unit (Hey, 2006). However there is no universally accepted species definition, rather there are many (22 according to Mayden, 1997) species concepts (De Queiroz, 2007). The morphological or typological species concept embraced by taxonomists introduces ambiguity in the presence of potential cryptic species (e.g., Martín-Ledo et al., 2013). The biological species concept (Mayr, 1942) that until very recently was the most widely accepted in zoological circles is only applicable to the very limited number of species where sexual reproduction occurs. Even within these species, this concept is used primarily based on phenotype as testing reproductive compatibility is rarely possible between extant populations and impossible with extinct populations (Sokal and Crovello, 1970). The various forms of the phylogenetic species concept, in theory at least, are easy to test and widely applicable, as they require the basic criterion of monophyly. However, they are confounded on the one hand by incomplete lineage sorting (or retained ancestral polymorphism), which is relatively common between species (Bulgin et al., 2003; Suh et al., 2015; Yasuda et al., 2015; Alexander et al., 2016; Scornavacca and Galtier, 2016; Zhou et al., 2016) and, on the other hand, by deeply divergent lineages that may or may not constitute cryptic species (Wilson et al., 2009; Cicconardi et al., 2010; Bull et al., 2013; Faurby and Barber, 2015). De Queiroz (2007) discussed the difficulties in species delimitation based on species concepts constructed on various, often conflicting, assumptions and suggested the unified species concept. This concept embraces the common acceptance of biologists that a species is an evolving metapopulation unit, and relies on justifying the assignment of specific units as species based on whichever species concept criterion or assumption is most relevant (secondary species criteria).
In efforts to sidestep the problems posed by the “species,” other units have been devised such as evolutionary significant units (Ryder, 1986), management units (Moritz, 1995) and operational taxonomic units (e.g., Blaxter et al., 2005) to produce easily definable groupings of diversity with which to inform management decisions. However, although definable, and in some ways comparable, these methods fail to take into account the inequality of an arbitrarily set percentage nucleotide difference among taxa that are evolving at different rates along different evolutionary trajectories. The development of species delimitation methods—computational techniques based on coalescent theory and evolutionary expectations (Fujisawa and Barraclough, 2013; Zhang et al., 2013; Kapli et al., 2016)—attempts to circumvent these failings and can rapidly sort large datasets into objective, repeatable groupings that may help define species boundaries. The fundamental concept of a species has persisted in ecological, biodiversity and management related studies, and so a pragmatic solution is required when dealing with species level data in the case where species identification is uncertain.
In light of these issues, it is prudent to treat species as hypotheses, which can be tested over time by a range of available techniques, also known as an integrated approach (Dayrat, 2005; Will et al., 2005; Wheeler, 2018). This applies not just to the taxonomic classification itself, but also to the samples collected for a specific study allocated to that classification. Pante et al. (2015b) provide some guidelines to account for the possibility of error in assuming a species-level classification, suggesting some reasonable background research is required into the biology of the organisms, and familiarization with the taxonomy of the wider group such that variation within the target group can be compared to the variation among all related groups. Sufficient sampling effort should be made to encompass the realistic spatial and ecological range of the target and closely related species so the full spectrum of variation is available to be assessed, and variation should be assessed using multiple independent characters.
With these challenges in mind we turn to the widespread and speciose brittle star genus Ophiacantha Müller and Troschel, 1842, as a model where some confusion exists over species identifications and distributions. The World Ophiuroid Database (Stör et al., 2017) lists 131 extant species belonging to this genus, several of which occur in or adjacent to the Southern Ocean (Martín-Ledo and López-González, 2013; Sands et al., 2013). There are four species in particular that are common in the Southern Ocean and, according to current distribution descriptions on the relevant public databases (e.g., GBIF, SCAR-MarBIn, WORMS etc.) they co-occur on the Antarctic continental shelf: Ophiacantha antarctica Koehler, 1900, Ophiacantha vivipara Ljungman, 1871, Ophiacantha pentactis Mortensen, 1936, and Ophiacantha densispina Mortensen, 1936. While O. antarctica is relatively easy to distinguish from other ophiacanthids, O. densispina, O. vivipara, and O. pentactis are remarkably similar. The five-armed species O. densispina and O. pentactis are both more robust in appearance compared with O. vivipara. Ophiacantha densispina has long slender disc spines and characteristic diamond shaped arm plates compared to oval shaped in O. vivipara and O. pentactis, and a more simple arrangement of jaw papillae, but as O. densispina is generally found north of the Antarctic Polar Front and O. pentactis is generally found south of the polar front it has been assumed there is little chance of confusion.
The primary diagnostic character separating O. vivipara and O. pentactis is the number of arms (O. vivipara six to eight but usually six, O. pentactis defined as having five). Mortensen (1936) observed that the five-armed form of what was then the single species O. vivipara, was found mostly in the southern parts of the Southern Ocean (i.e., the Antarctic continental shelf) and rarely in the north. He noted that the five-armed form had a proportion of male individuals (O. vivipara are female, probably parthenogenetic), and did not have the typical two to three juveniles in the bursae that are common in O. vivipara, indicating a differing reproductive strategy. He used these characters to assign the five-armed form to its own variety distinct from the six-, seven-, and eight- armed forms, and suggested it to be a separate species. Interestingly, although Mortensen discusses the six armed O. vivipara occurring in sympatry with O. pentactis on the Antarctic continental shelf, none of the specimens he lists in his description were collected from Antarctica (rather, most were from around the Patagonian shelf near Falkland Islands, sub-Antarctic Marion Island and the shelf around South Georgia).
With the application of DNA sequencing, complications in these taxonomic generalizations have arisen that Mortensen and peers could not have foreseen. These have introduced some confusion in the recent literature, particularly between O. vivipara and O. pentactis, their distributions, and their primary morphological identification. In the description of a new ophiacanthid species, O. wolfarntzii Martín-Ledo et al., 2013, from Shag Rocks, a shelf area to the west of South Georgia (Martín-Ledo et al., 2013), the authors used partial mitochondrial cytochrome c oxidase subunit 1 sequences to demonstrate the magnitude of difference between the new species being described and the other morphologically similar ophiacanthids from the Southern Ocean. They also demonstrated that there was variation within the newly described species that could amount to a second co-occurring cryptic species. As both O. vivipara and O. pentactis also occur at Shag Rocks it was important to demonstrate that the new species was genetically as well as morphologically distinct from these superficially similar species. With these new sequences publicly available it became clear that there was some confusion with existing collection identifications, particularly those of O. vivipara and O. pentactis from the Antarctic continental shelf.
A study of biodiversity patterns along and across the Antarctic Peninsula attempted to use O. vivipara and O. pentactis to identify different biogeographic regions (Ambroso et al., 2016). The authors noted that the difficulties in morphologically distinguishing between the two species were such that they were forced to recognize a pool of morphotypes. Previously, O’Hara et al. (2013, 2014) examined the phylogeographic patterns of selected ophiuroids across broad geographic scales. One taxon they focused on in both studies was O. vivipara, with collections available spanning the entire Southern Ocean as far north as the Patagonian shelf, New Zealand shelf and southern Australian shelf. They described a phylogeographic structure consisting of a southern (Antarctic) clade (Clade A) and two more northerly clades (Clades B and C). As Clade B was sampled from the assumed type locality (Falkland Islands/Malvinas, Patagonian Shelf) it is assumed to be O. vivipara sensu stricto. Large average pairwise distances between clades indicated that the other two clades should be treated as cryptic species. In a revision of ophiuroid records from Argentinian waters, Brogger and O’Hara (2015) examined the various published clades of O. vivipara and noted that the Antarctic Clade A of O’Hara et al. (2014) that consisted of both five- and six-armed individuals equated to the O. pentactis clade of Martín-Ledo et al. (2013).
Having a good understanding of species identity and distribution clearly impacts studies and is essential for good conservation management. In light of the difficulties described in identifying species and of the current confusion regarding species identification and distribution of ophiacanthids across the Southern Ocean, in this study we have used the available morphological and molecular data in order to objectively assess the species status of Southern Ocean ophiacanthids, specifically focusing on O. vivipara and O. pentactis. We have used a variety of approaches including traditional morphological taxonomy, phylogenetics and some rarely used associated diagnostic tools, as well as modern species delimitation techniques. We demonstrate that, even with sophisticated software analyses, a pragmatic approach, similar to that suggested by De Queiroz (2007), based on all available evidence, is perhaps the best way to clarify species identity in these taxa, at least as proposed hypotheses (Pante et al., 2015b) allowing for further clarification as time and resources become available.
Materials and Methods
Sampling took place on various Southern Ocean expeditions on board the RRS James Clark Ross (JR144, JR179, JR230, JR262, JR275) and the FV Polarstern (PS77, PS82). Brittle star samples were collected using Agassiz trawls (1 cm mesh net) from stations around the Antarctic continental shelf, as well as shelf areas of the Scotia Arc, Bouvetøya, and Patagonia. Individuals were sorted to morphotype on board and stored in cold (−20°C) 96% ethanol for transportation to United Kingdom. Individuals were sorted to species level with notes on morphological deviations from taxonomic descriptions (Martín-Ledo et al., 2013; Sands et al., 2013). Individuals were sequenced for the bar-coding region (CO1 or COX1) by the Canadian Centre for DNA Barcoding (CCDB). Further sequence data were obtained from BOLD systems v4 and NCBI GenBank, which allowed comparison with other collections and between different regions. Figure 1 provides information regarding the locations of the specimens. All data used in this study are publicly available. A full list of specimens used including collection information and raw sequences are available from BOLD DataCite: (dx.doi.org/10.5883/DS-306223). All NCBI GenBank sequences and metadata are available as GenBank Flat Files in supplementary information.
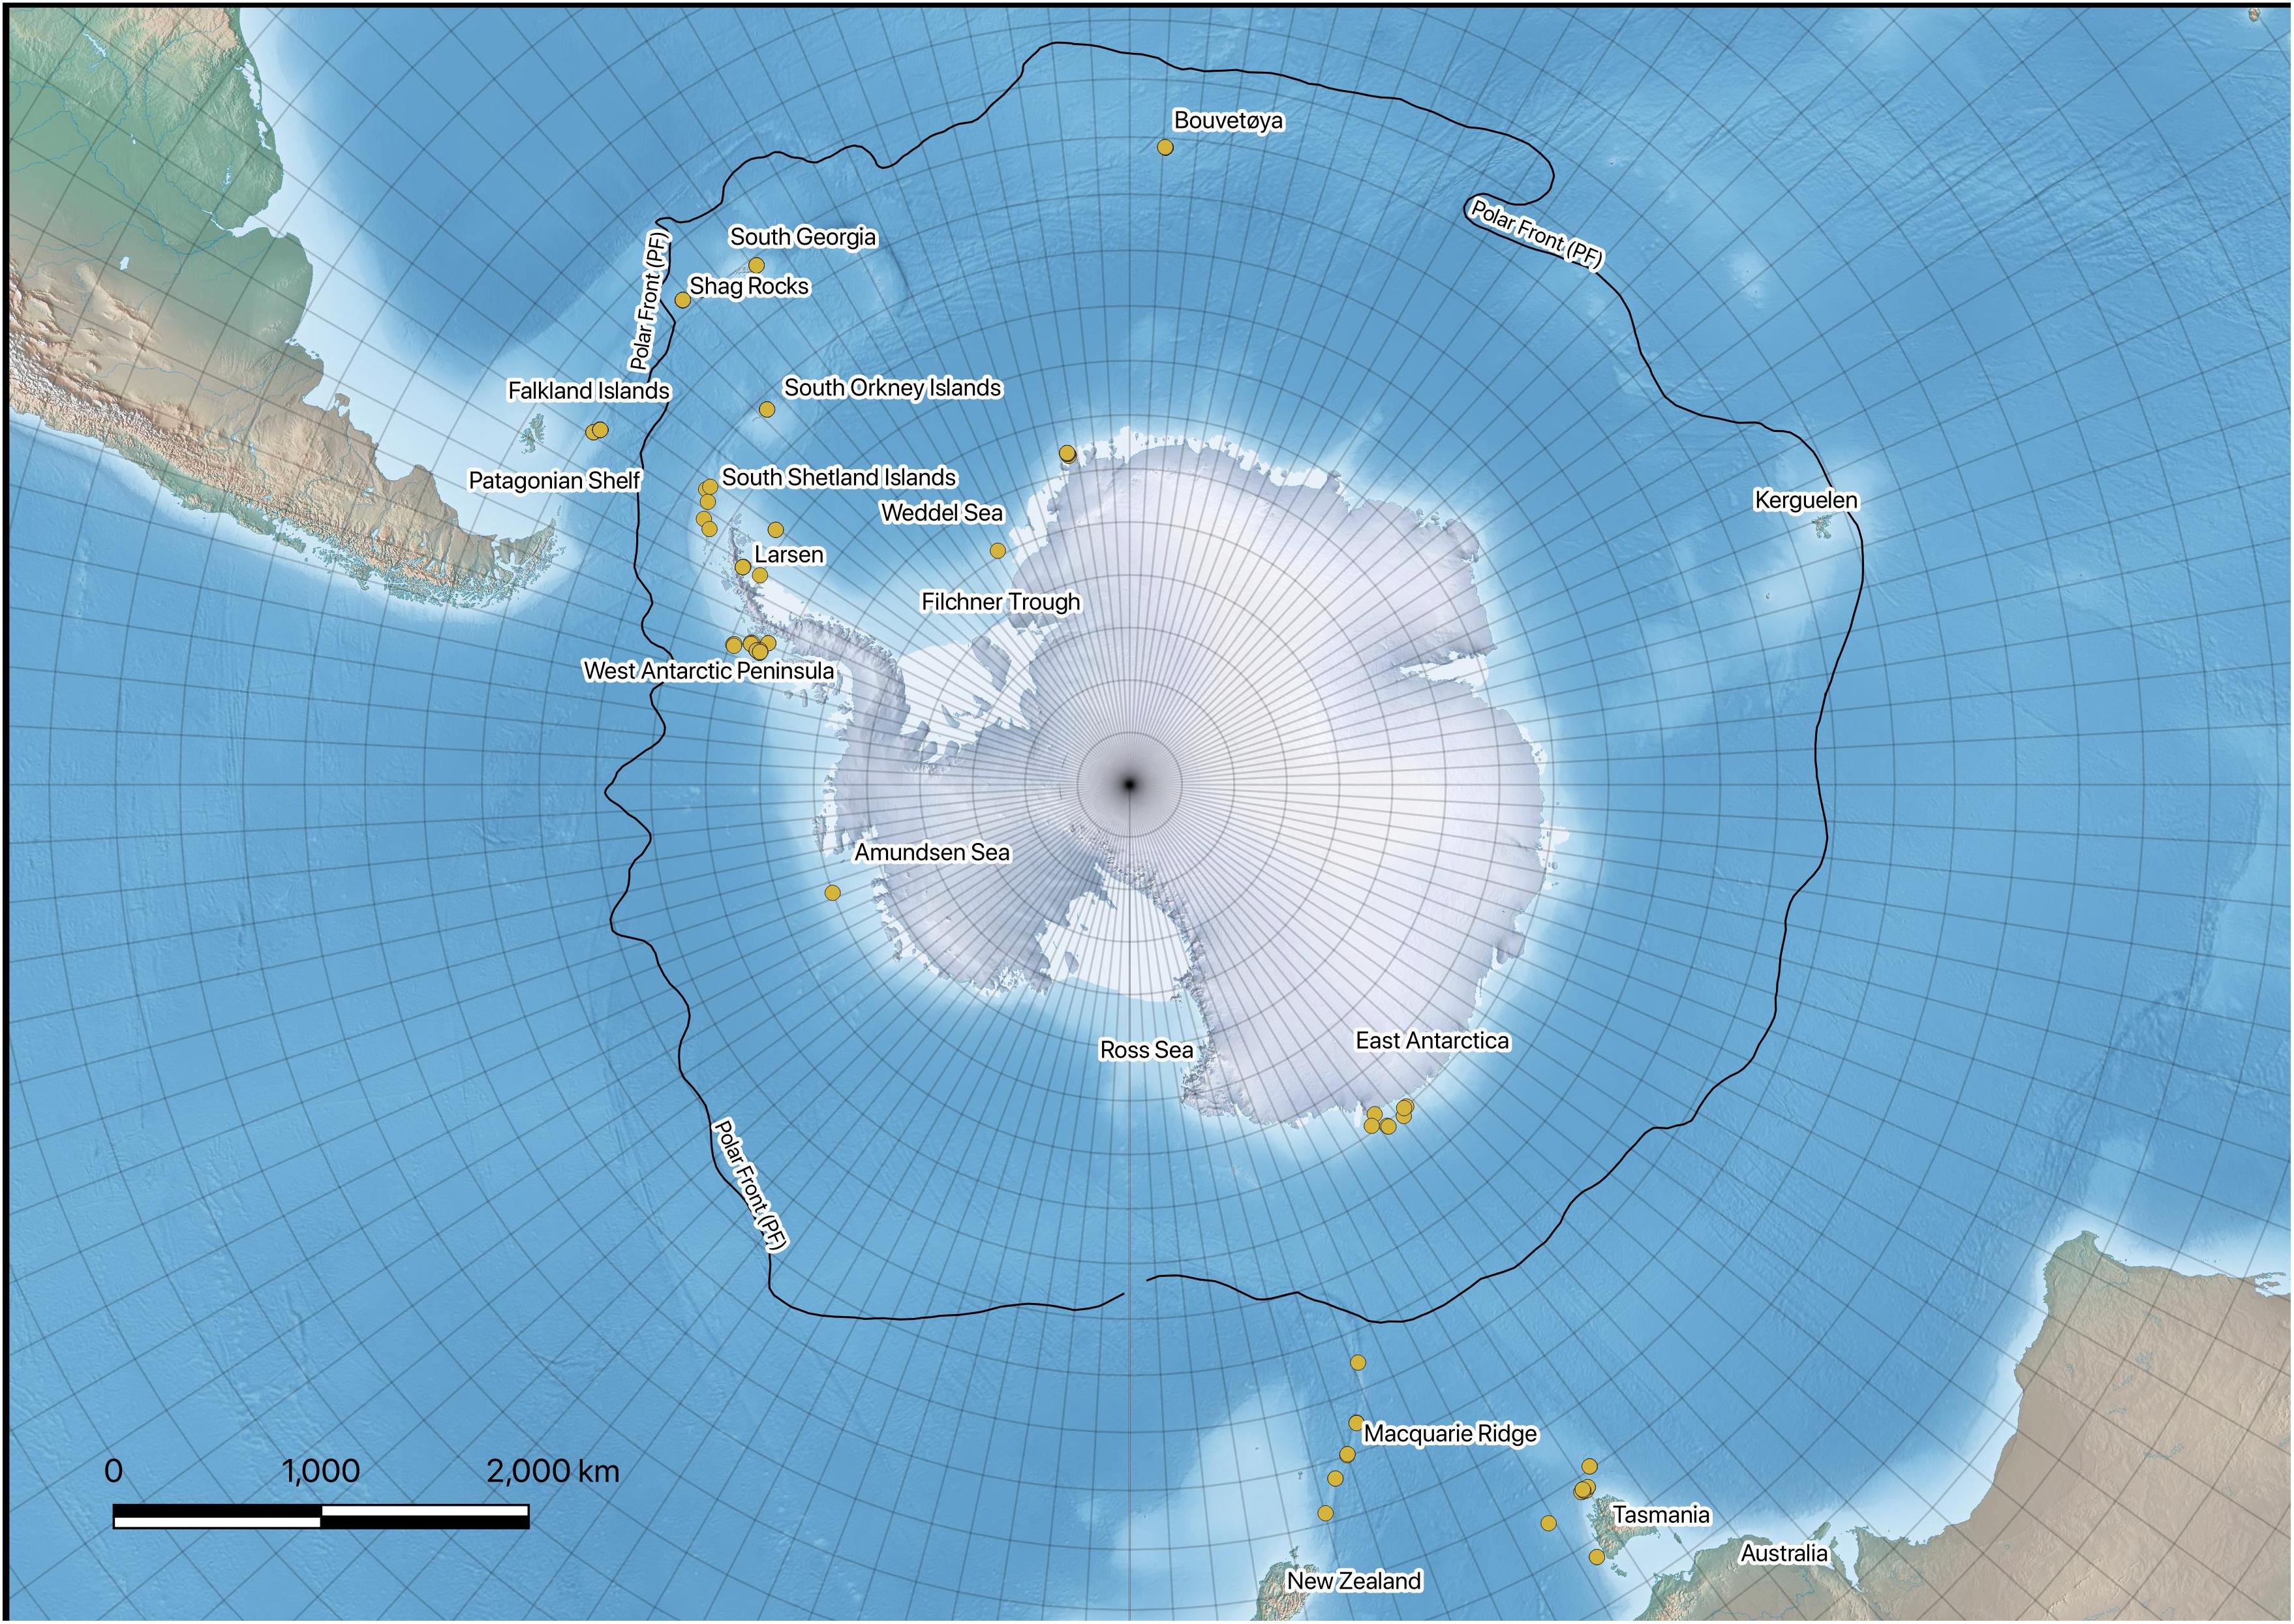
Figure 1. Map of the Southern Ocean showing the regions sampled over several cruises.
Sequence trace files from CCDB were downloaded from BOLD (Ratnasingham and Hebert, 2007) and imported into CodonCode Aligner v5 where they were base called, trimmed and aligned into contigs for each individual. Contig sequences were then checked by eye and associated with the morpho-taxonomically derived name for the individual the sequence was derived from. Each consensus sequence was trimmed of primer sequence and translated into amino acids to ensure an open reading frame. Cleaned consensus sequences of species belonging to the genera Ophiacantha and Ophiocamax were aligned using MUSCLE (Edgar, 2004). Ophiocamax gigas Koehler (1900) is from a family within the Ophiacanthina suborder but outside of the family Ophiacanthidae, and is used in the phylogenetic reconstructions as outgroup to orientate the relationships within the Ophiacanthidae individuals sampled. To test for departure from base compositional homogeneity sequences were imported to SeqVis (Ho et al., 2006), first as a whole dataset, then as subsets to examine the extent of base composition heterogeneity within and between groupings of sequences based on morphotype identification and then on groupings based on phylogenetic identifications (total evidence).
Summary statistics for “species” based on morphological identifications and our primary species hypotheses were calculated in DNAsp v5 (Librado and Rozas, 2009). Within and between clade distances were estimated in MEGA v5.2.2 (Tamura et al., 2011).
Phylogenetic inference was conducted using Maximum Parsimony, Maximum Likelihood and Bayesian frameworks. Attempts were made to account for base compositional heterogeneity—a key assumption in phylogenetics—using PHASE 3. A phylogeny was constructed using a mixed model in the module “mcmcphase”: the first codon position was modeled on a three state matrix (A,G,Y), the second position used the TN93 model and at the third codon position a two state model (R,Y) was implemented. As the simpler models implemented in the first and third position effectively negate the effects of base compositional heterogeneity, the resulting conservative phylogeny can be used to compare with, and better scrutinize, the more familiar phylogenetic reconstructions. Maximum Parsimony analysis was conducted in PAUP∗ 4b10 (Swofford, 2002) using a heuristic search with support gained through 1,000 bootstrap pseudoreplicates. Maximum likelihood tree estimation was conducted in RAxML v8 (Stamatakis, 2014) with 10 replicate runs and 1,000 bootstrap pseudo replicates using the “thorough” option to estimate node support. We used JModeltest v2 (Darriba et al., 2012) to determine the most appropriate model (GTR + I + G). Due to strong correlation between “I” (proportion of invariant sites) and “G” (gamma distribution) we used the simplified GTR + G substitution model in our analyses. Bayesian tree estimation was produced by MrBayes v3.2 (Huelsenbeck and Ronquist, 2001; Ronquist and Huelsenbeck, 2003; Ronquist et al., 2012). The dataset was partitioned into codons to better account for substitution rates across sites and lineages. Each partition was set to estimate all parameters (nst = 6) effectively allowing for a GTR model with a gamma distribution (rates = gamma). Four replicates, each with four heated chains, were run over 5 × 10⁸ generations with a 25% burnin that ensured trees were sampled only once split frequencies fell below 0.001. To ensure that the runs converged, TRACER v1.6 (Rambaut and Drummond, 2007; Rambaut et al., 2014) was used to diagnose the runs sampling characteristics. Tree editing was conducted in FigTree v1.4 (Rambaut, 2009) and final cosmetic touch-ups in GRAPHIC v3.1 (Audiodesk).
Species delimitation was explored using the General Mixed Yule Coalescent (GMYC—single and multiple threshold) and multi rate Poisson tree process (mPTP) (Kapli et al., 2016), a more sophisticated upgrade of the original PTP (Zhang et al., 2013) that allows for the possibility of different levels of intraspecific divergence among clades similar to the multiple threshold allowance of GMYC. mPTP requires a phylogenetic tree as input and uses “relative evolutionary placement” (Zhang et al., 2013) of lineages to determine the likelihood of lineage diversification being intra- or inter- specific. We ran mPTP on both our ML and Bayesian trees using the mPTP package downloaded from https://github.com/Pas-Kapli/mptp. The Bayesian consensus tree was converted to a bifurcating tree using the package APE in the R statistical programming environment. As this process inserts very small non-zero branches in polytomies a correction was added to the mPTP analyses by first running the command –minbr_auto to determine the minimum branch length. Both the Bayesian (–mcmc) and likelihood (–ml) versions of the process were run on both Mr. Bayes and RAxML estimated trees. GMYC requires an ultrametric tree as input so the dataset was analyzed in the package BEAST v1.8.1 (Drummond and Rambaut, 2007) using the GTR model and an uncorrelated relaxed molecular clock. Several runs were conducted using 5 × 10⁷ generations, including one run without data, to test and tweak the performance of the priors and to ensure the priors were not swamping the signal in the data. The results were checked for mixing, convergence and the behavior of priors in TRACER v1.6. Tree files were combined in LogCombiner to produce a consensus tree, which was then annotated in TreeAnnotator (both part of the BEAST v1.8.1 package). The resulting ultrametric tree was used by the R package SPLITS which performed both single and multiple threshold GMYC analyses.
Results
Fourteen described species of Ophiacantha were included in this study, as well as five previously identified morphotypes (O. sp. TAS, O. sp. MoV 4532, O. sp. MoV 4536, O. sp. MoV 4537, and O. cf wolfarntzi sp.1, which has been identified but not formally described Martín-Ledo et al. (2013). Sequences of samples of these species, undescribed morphotypes and outgroups were included in the molecular dataset comprised of an alignment of 354 individual CO1 sequences, 658 bp long (the standard “bar coding” region). Summary statistics were calculated for the described species based on both morphotype and mitochondrial clade (Table 1). Both showed some deviations from neutral expectations, particularly Tajima’s D, Fu’s S and Ramos Onsin and Roza’s R2. Tajima’s D and Fu’s S were both significantly negative for O. densispina, O. pentactis and O. vivipara, indicating purifying selection or population expansion. Fu’s S is more sensitive to population expansion and in this case the very negative values suggest expansion is more likely than selection. Significant Ramos Onsin and Roza’s R2, itself an indication of population size change, adds more weight to population expansion over purifying selection, although it is probable that both forces play a part.
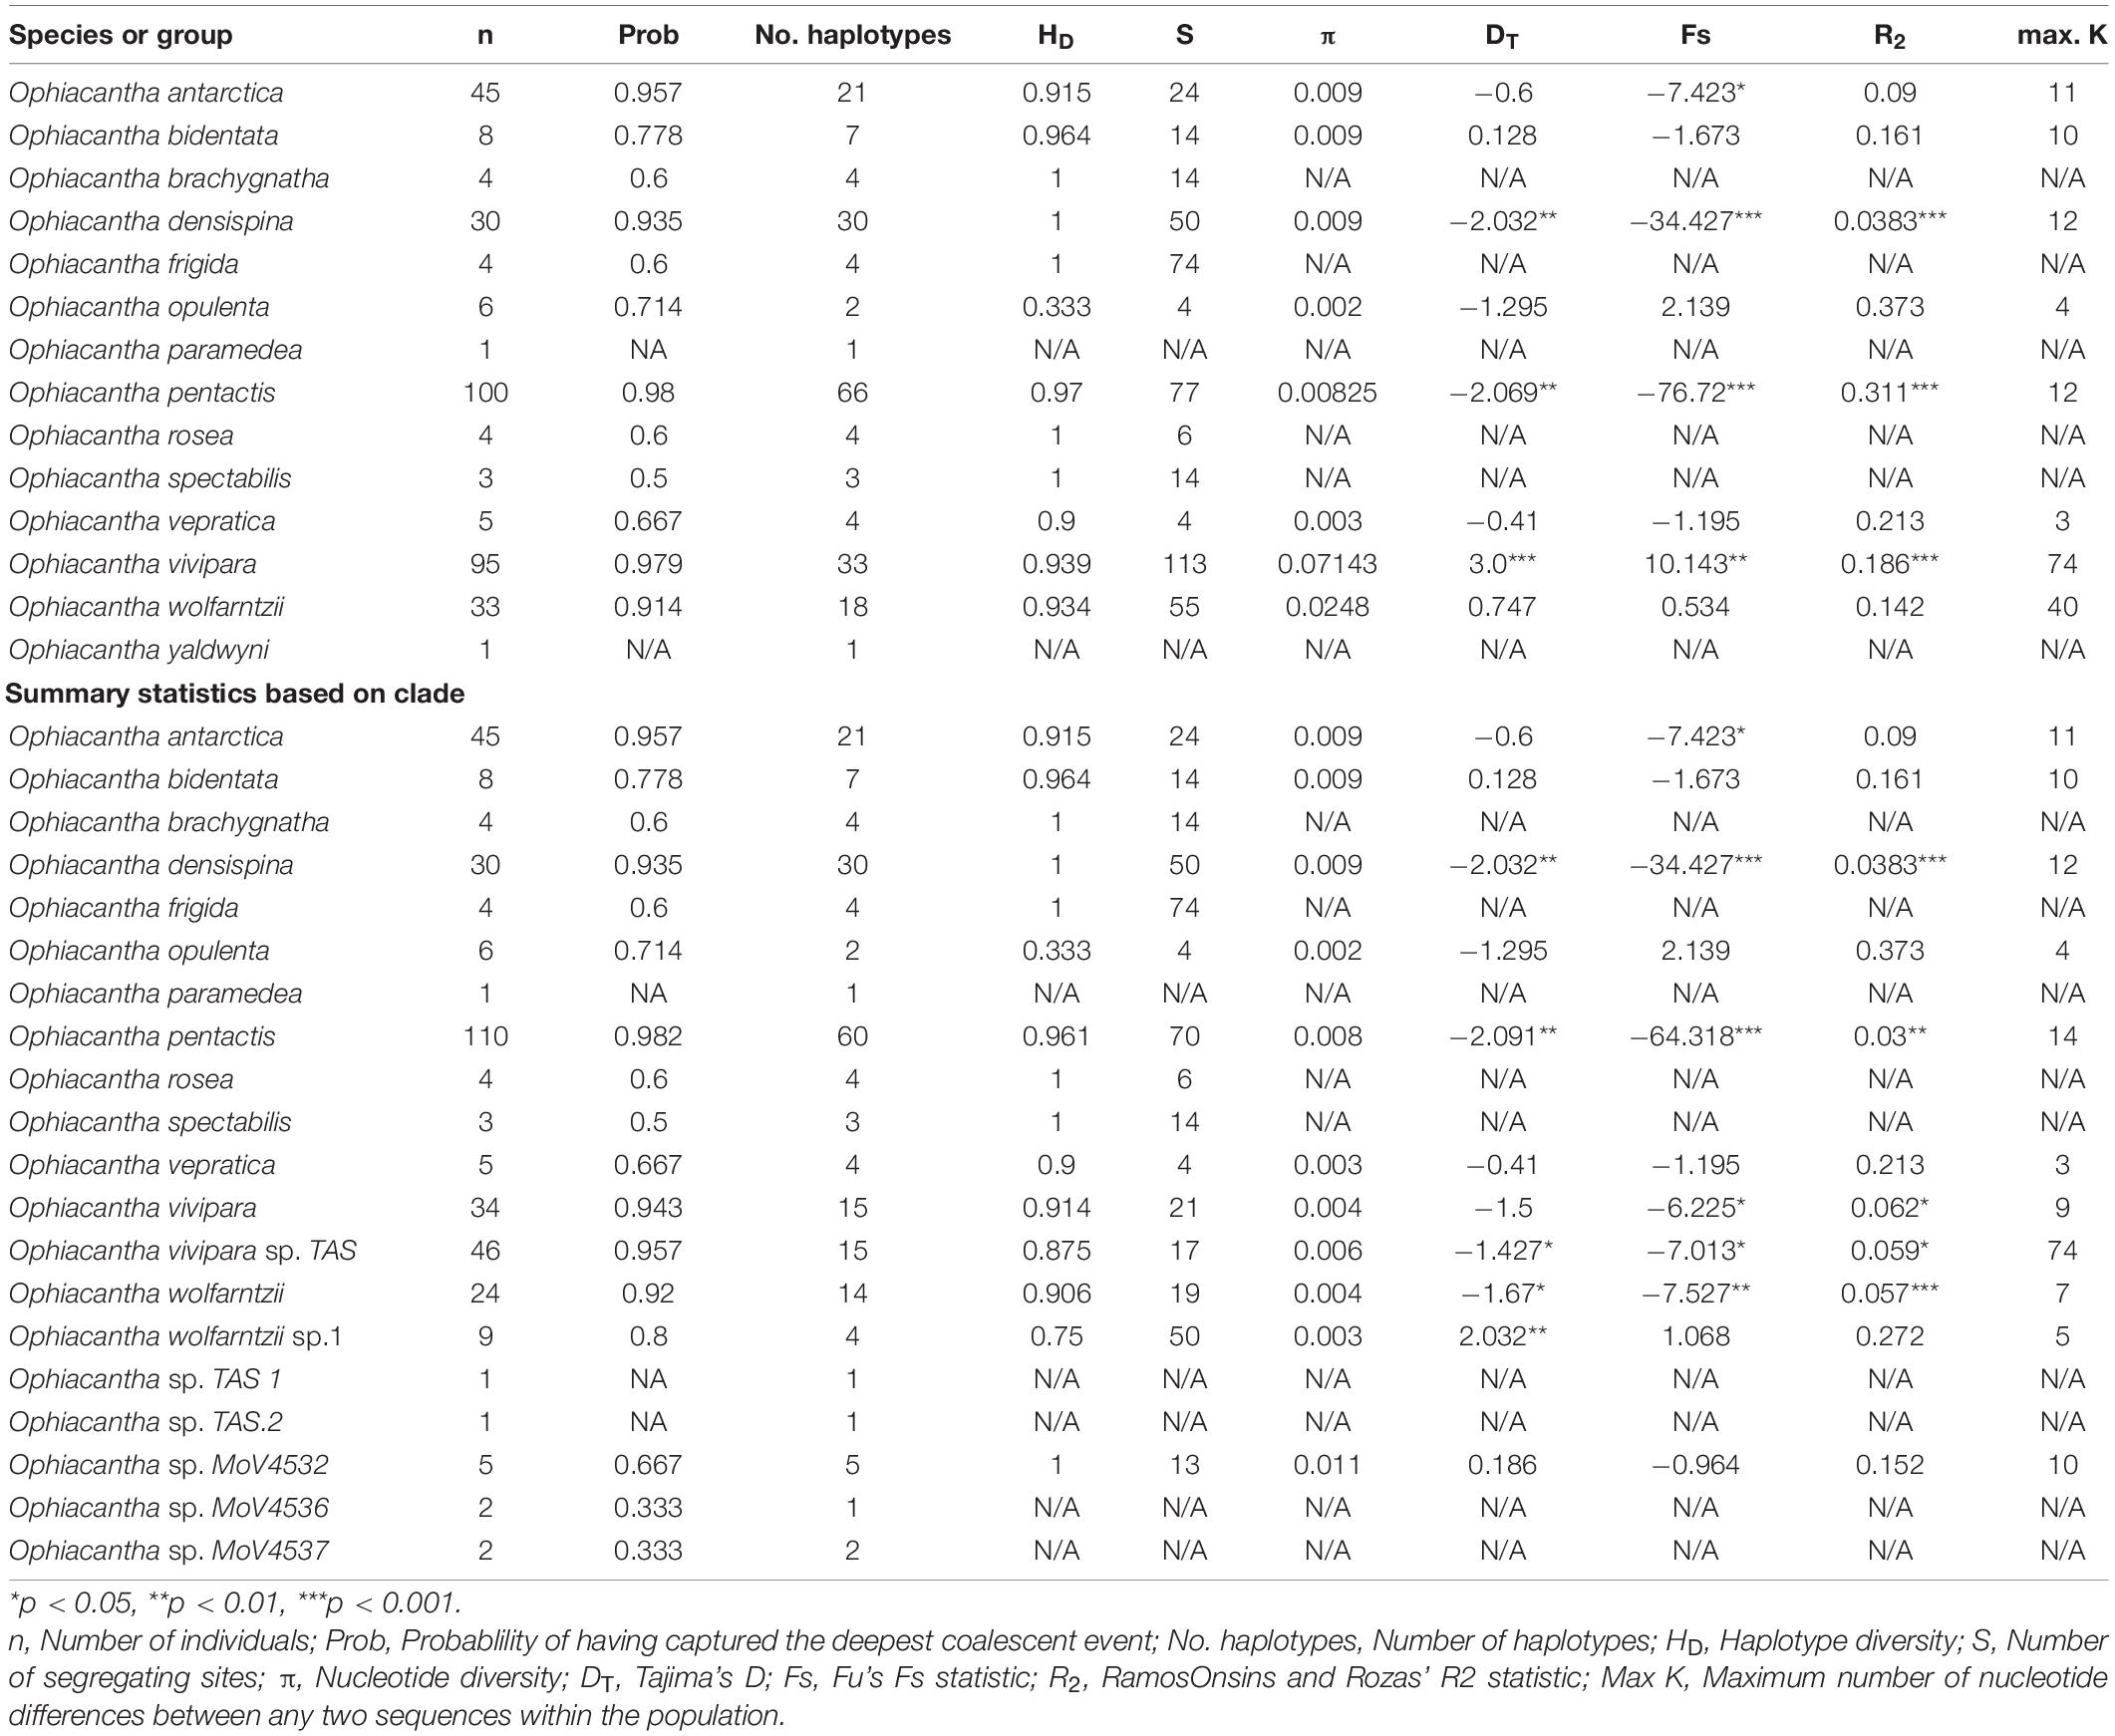
Table 1. Summary statistics of CO1 sequences generated from morphologically grouped specimens and clade grouped specimens.
When all samples identified as O. vivipara based solely on morphology are considered (n = 95), HD is quite high (0.939) and π is extremely high (0.07—expected to be less than 0.006 ± 0003 to fit the model presented in Goodall-Copestake et al., 2012) indicating that there is likely to be a mix of divergent lineages—possibly cryptic species—pooled into the morphologically accepted taxon. Further investigation of the relationship between sequences indicates that there are distinct haplotype groups that more or less match geographically distinct regions (1. Southern Australia + New Zealand + Macquarie Ridge; 2. Patagonian Shelf + South Georgia shelf + Macquarie Ridge; 3. Antarctic Shelf + South Georgia + Macquarie Ridge). When the analysis is repeated on the three corresponding clades (O. vivipara sp. TAS, O. vivipara sensu stricto, and six-armed O. pentactis) the corresponding HD vs. π values are brought back to expectations under the model. This is despite the O. pentactis clade including individuals that have the principal character (six arms) of O. vivipara, suggesting that arm number is not a good indicator of this species. Similarly, when the two morphologically indistinguishable clades of O. wolfarntzi and O. cf. wolfarntzi sp. 1 are pooled (n = 33), π again is high (0.0248). However, in this case it has already been noted that there are likely to be two different species involved. Ophiacantha sp. MoV4532 (n = 5) also had higher than expected π (0.011). Close scrutiny of the individual sequences in this case found two samples from Macquarie Ridge had consistent variation (grouped together), separating them from the three from south of Tasmania. This statistic is strongly influenced by small sample size and it is likely that more sampling of this morphotype, even a single non-unique sequence, would result in π being within expectations.
Significant base compositional heterogeneity was identified within the dataset: Match paired tests found > 55% of the pairwise combinations significantly deviated from null expectations (P < 0.05) and 49% of the pairwise combinations showed highly significant deviations (P < 0.0001). The third codon position was largely responsible for the differing evolution of base composition, with some contribution from the first codon position (graphically depicted in Supplementary Figure 1). Although there was considerable variation in base composition, two general clusters were identified indicating two differing compositional biases. These two clusters equate to two major clades identified in the phylogenetic reconstructions. Although it is possible that base composition bias can affect phylogenetic reconstruction, it is likely that, despite the violation of homogeneity, the topology of the phylogenies are reasonable estimates as base composition bias is lineage-specific. The phylogeny produced using the conservative mixed models in PHASE to better account for base composition heterogeneity was very similar in topology to those produced by Mr. Bayes and RAxML (Figure 2 and Supplementary Figure 2), indicating that the base compositional heterogeneity was contributing to the genuine phylogenetic signal rather than driving a false topological signal. There were some minor topological differences between Maximum Parsimony and the three model-based analyses (Supplementary Figures 2, 3), demonstrating that although the model-based analyses were all computationally different, the use of a model, despite the way it is implemented, leads to a consistent result compared with pure parsimony.
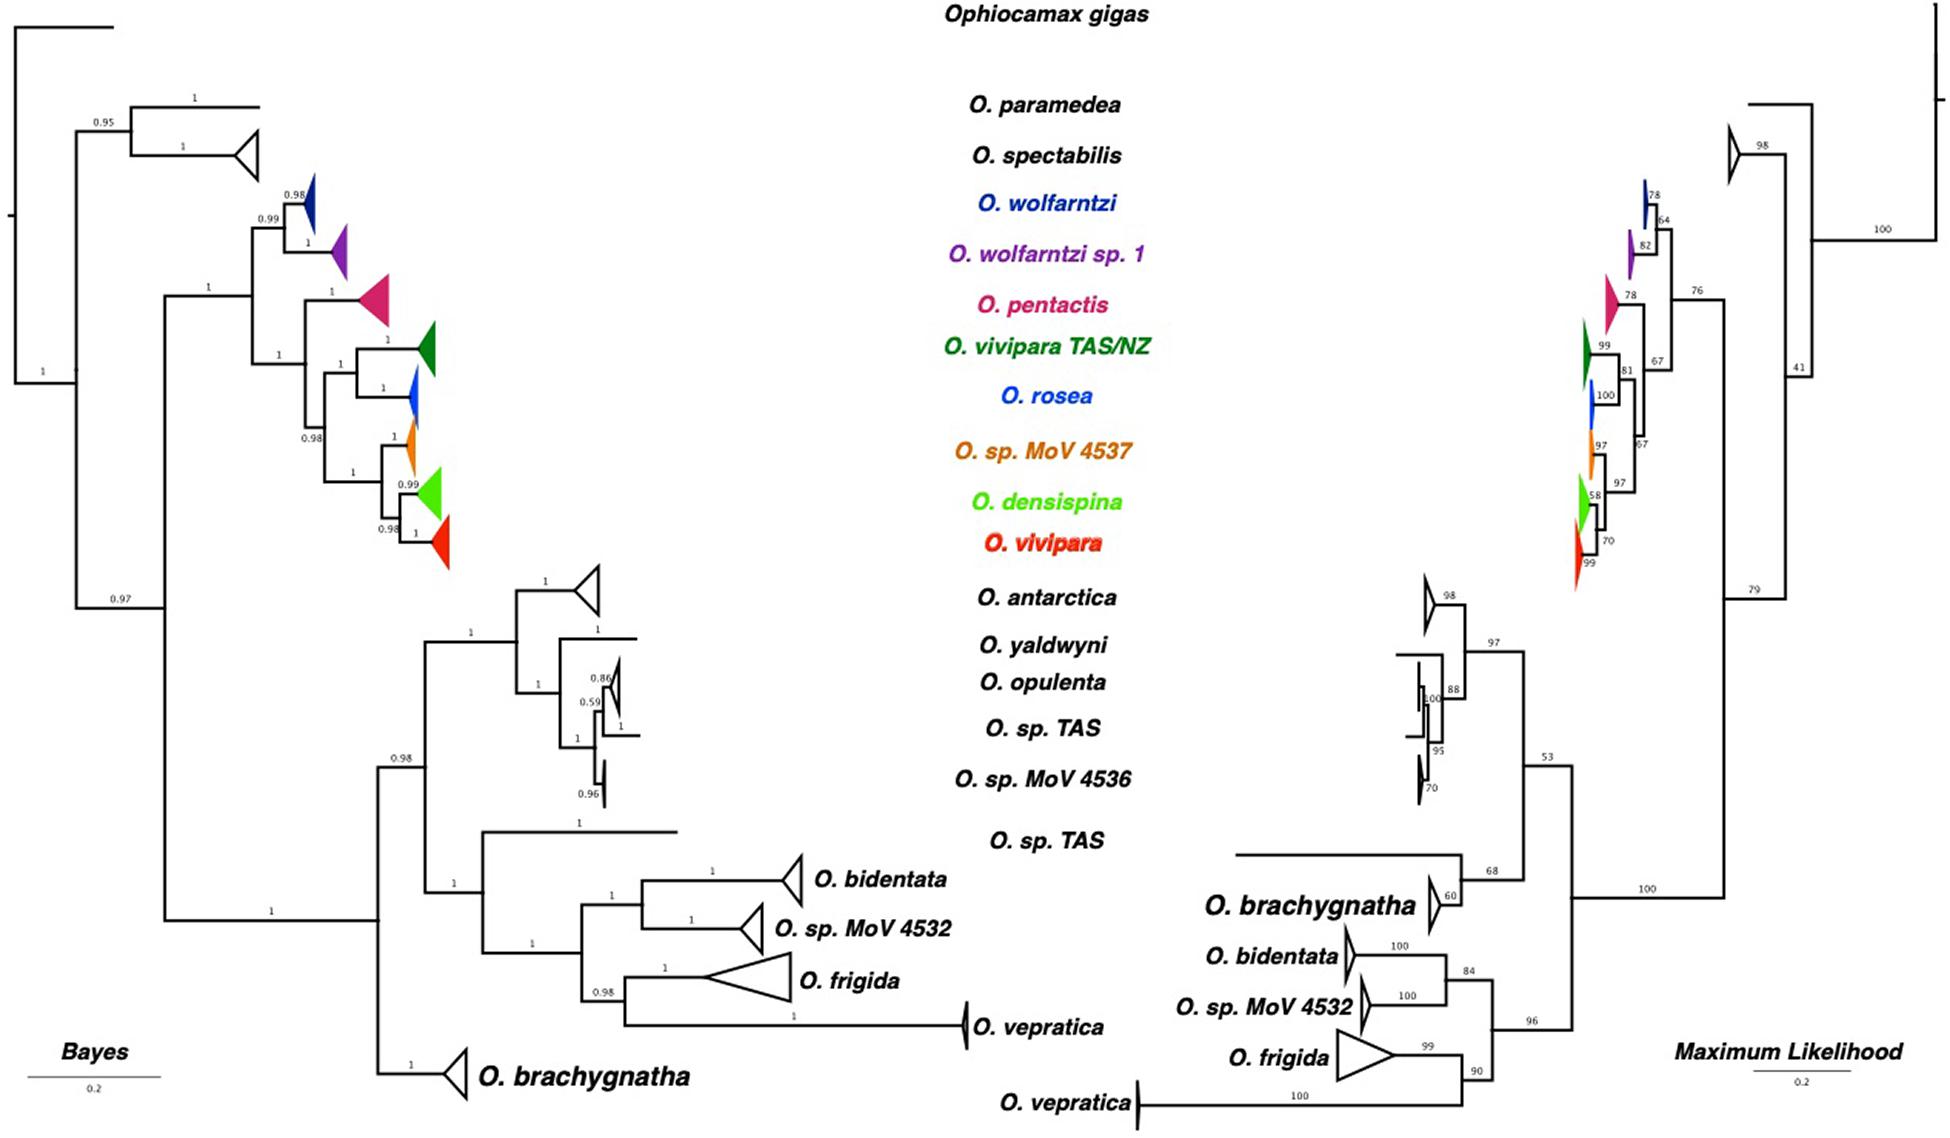
Figure 2. Phylogenetic trees estimated using Bayesian and Maximum Likelihood methods. Node confidence is given by posterior probabilities for the Bayesian tree, and bootstrap pseudo-replicates.
Both Bayesian and Maximum Likelihood reconstruction resulted in well resolved phylogenies with the only conflict being the placement of O. bachygnatha (Figure 2). When base compositional heterogeneity is accounted for (two and three state models using Phase 3.0, Supplementary Figure 2), O. paramedea and O. spectabilis are more closely allied with the outgroup Ophiocamax gigas. There are clear, well-supported phylogenetic clades that unambiguously resolve most of the described species. The exception was morphotype O. vivipara that was spread across three clades, one of which included all the five-armed O. pentactis.
Multi rate Poisson tree process (mPTP) was run using both –ml and –mcmc methods on both ML (RAxML) and Bayesian (Mr. Bayes) trees. The two different methods of running mPTP (–ml and –mcmc) produced similar results, although the results differed depending on the input tree. Using the Bayesian tree, 20 “species” (including the outgroup) were identified, whereas 26 were identified in the ML tree. The difference was largely due to the handling of O. cf. wolfarntzi sp1 which was identified as a separate “species” with the Bayesian tree input, but as six different “species” with the RAxML tree input. Running the command –minbr_auto on the RAxML tree and using the returned minimum branch length did not change the result. The ML version also combined O. opulenta (from the Antarctic continental shelf), O. sp. MoV4536 (southern Tasmania) and one of the O. sp. TAS (also southern Tasmania) individuals into a single “species” grouping.
Both single and multiple threshold GMYC analyses produced a much larger number of nominal “species” [single: 68 clusters (CI 65–75), 82 entities (CI 77–90); multiple: 62 clusters (61–69), 75 entities (CI 70–86)]. Both GMYC methods identified sufficient variation within O. antarctica, O. densispina, O. pentactis, O. vivipara, and O. wolfarntzi to break them each into several clusters and entities (multiple threshold: 9, 8, 21, 7, and 7, respectively). The multiple threshold analysis grouped O. paramedia with the outgroup Ophiocamax gigas as a single “species” cluster.
To link individuals used in this study to morphological identifications, clade and species delimitation methods, a phylogram and table is provided as Supplementary Material.
Discussion
Our data highlight a number of issues with the “true” identity of current species records of Ophiacantha species in the Southern Ocean, in particular O. vivipara (Patagonian Shelf), O. vivipara (southern Australia/New Zealand) and six-armed specimens of O. pentactis. In order to help resolve these issues, we use the available data and a common sense approach to provide species hypotheses that can be further tested using more sophisticated methods including careful morphological re-evaluation in the future.
The presence of cryptic species in the morphotype “O. vivipara” appears clear, as there is unambiguous genetic divergence between the Patagonian and the Australian samples. If a phylogeny consisting solely of O. vivipara is considered (see Figure 2B in O’Hara et al., 2014) there are three distinct clades, but whether these clades are equivalent to three species is difficult to judge without context. Summary statistics, particularly the relationship between haplotype diversity and nucleotide diversity, give a strong indication that, when pooled into morphotype, these three clades are not consistent with an accepted model of within-species genetic diversity (Goodall-Copestake et al., 2012). The relationship between haplotype diversity (HD) and nucleotide diversity (π) is a much neglected summary statistic particularly useful in flagging excess diversity in a group of haplotypes assumed to be a species. The model was generated from HD and π values from 127 population samples that indicated a close relationship between HD and π (see Figure 2 in Goodall-Copestake et al. (2012). As HD approached 1, π approached 0.01. Under this model outlier species (or populations)—usually with higher than expected π—should be viewed with suspicion regarding species composition.
When considered in a phylogenetic perspective, and in context of other morphospecies, the three clades that make up morphospecies O. vivipara (O. vivipara, O. vivipara TAS/NZ, and six-armed O. pentactis) in Figure 2, do not form a monophyletic group, and rather are more divergent from each other than each is to other well characterized morphospecies. In the case of O. pentactis this species description includes only a five-armed morphotype (Mortensen, 1936), however, our data make it clear that genetically very similar (identical in many cases) six-armed specimens also fall within this species and have therefore been misidentified historically as O. vivipara in existing Antarctic collections. Different geographic ranges, although with some overlap, also helps reconcile these clades to different species groups, particularly where discrete genetic groups are present in regions of sympatry (e.g., Patagonia version of O. vivipara and O. pentactis are both found around South Georgia, see Sands et al. (2013), and all three versions can be found on Macquarie Ridge).
The holotype of Ophiacantha vivipara sensu stricto, housed at the Naturhistoriska Riksmuseet, Sweden, was described from the Pacific coast of Mexico. This has since been considered an error by taxonomists (Brogger and O’Hara, 2015) and is recorded as such on the type specimen documentation. The Patagonian Shelf is considered the true locality of the specimen. Type specimens are essential as the primary reference for a species name and comparisons should be made with the holotype and its description. In this case, as pointed out by Mortensen (1936), the primary difference between Ljungman’s description of his holotype and Mortensen’s description of his variation pentactis lies in arm number and possibly reproductive strategy. With taxonomy, as any other science discipline, species descriptions should be treated as hypotheses that are falsifiable. When subsequent complementary evidence indicates that the primary character distinguishing species is inappropriate, reappraisal of the species definition using all available information—the integrative approach (Dayrat, 2005; Will et al., 2005)—is required. Patagonian Shelf (Falkland Islands/Malvinas) specimens have been sequenced using mtDNA CO1 sequence by Martín-Ledo et al. (2013), and as O. vivipara Clade B by O’Hara et al. (2013, 2014). Based on our analyses here any material currently identified as O. vivipara from the Antarctic continental shelf is likely to be O. pentactis, despite having more than five arms. Around South Georgia there is a strong skew toward six-armed individuals being O. pentactis (4:30 O. vivipara:O. pentactis). The morphotype similar to O. vivipara sampled from southern Tasmania and New Zealand waters is genetically distinct from O. vivipara sensu stricto and deserves more detailed taxonomic appraisal.
The specific status of O. cf wolfarntzi sp.1 remains unclear. As mentioned in the original study (Martín-Ledo et al., 2013), the distribution of both clades identified within the nominate species is limited to Shag Rocks, an isolated shelf region west of the South Georgia shelf (ongoing sorting of material collected from around South Georgia supports this limited distribution; Sands and Giles unpublished data). Individuals from both clades have been collected in a single trawl, indicating sympatry, and there are substantial between-clade genetic differences (5.4% uncorrected P, see Martín-Ledo et al., 2013) but as yet no identifiable morphological characters differentiate the two clades. Codominant genetic markers are required to better understand the species evolution of these two clades. We could suggest considering them different in the context of conservation management units (Moritz, 1999) or evolutionary significant units (Ryder, 1986), but these are rarely used in practical conservation management. The mPTP species delimitation technique identifies the two clades as separate species groups and, as the combined CO1 dataset also does not fit the haplotype/nucleotide diversity species model, we propose that they should be regarded as two distinct hypothetical species.
Thorough taxonomic reinvestigation of these species groups (and others where cryptic species are inferred, such as Sands et al., 2015; Jossart et al., 2019) is likely to have significant lag time as investment in taxonomic expertise is declining in general (Wägele et al., 2011). Expert (taxonomic) species identification is essential in studies of biodiversity and ecology (Bortolus, 2008) as identification failures due to crypsis and unappreciated errors in identification may result in poor management decisions, erroneous interpretations of experimental results and inaccurate species distributions in large databases. However, universally accepted species identifications are difficult to achieve, particularly when species descriptions are inaccurate or incomplete (Packer et al., 2018). DNA taxonomy has been posed as an alternative to traditional taxonomy (Tautz et al., 2002; Blaxter, 2004; Hebert and Gregory, 2005). In the current study focussing on Antarctic Ophiacantha species the use of DNA taxonomic approaches could be viewed as successful in that, in most cases, discrete clades identify either geographically distinct or morphologically distinct groups.
DNA taxonomy through vouchered “bar codes” is increasingly regarded as an excellent tool for the conservation biologist and is relatively cost effective (approximately £5 per individual at current value). However, given the unequal depth of variation among species, the inefficiencies of lineage sorting (resulting in retained ancestral polymorphisms) and the length of time over which one would expect speciation to occur, DNA taxonomy is not always sufficient to confirm species from a radiating complex. As a result there has been a growing reliance on DNA-based species delimitation methods (Fujita et al., 2012; Carstens et al., 2013; Pante et al., 2015a; Yang and Rannala, 2017; Dellicour and Flot, 2018; Luo et al., 2018). These require careful consideration of the assumptions underlying the basis of the delimitation. For example, monophyly is assumed in some single locus species delimitation even though monophyly is not essential for the speciation process (Weber et al., 2019), or a minimum threshold is required a priori to determine the level of genetic distance between clades that is acceptable as indicating speciation. Multi locus delimitation techniques that are likely to be more robust in species delimitation (Yang and Rannala, 2010; Carstens et al., 2013), but require substantial budgets and specific bioinformatic expertise often beyond the skills available to conservation biologists and managers.
Notwithstanding such issues and uncertainties, a range of analytical methods dedicated to species delimitation are available and considerable confidence is placed in the accuracy of these methods. Of these methods GMYC and mPTP have strong theoretical bases taking into account coalescent processes (Reid and Carstens, 2012; Fujisawa and Barraclough, 2013; Zhang et al., 2013; Kapli et al., 2016). In the current study both methods—particularly GMYC—have overestimated the number of “real” or pragmatic species. For example, the species status of O. antarctica and O. densispina are not in doubt: they are morphologically well characterized with little chance of misidentification by specialist researchers, they each form a monophyletic clade with a moderate degree of within clade variation (0.01 and 0.008 average divergence within O. antarctica and O. densispina, respectively). There is no biological or ecological reason to assume either of these are harboring cryptic species, and yet GMYC has broken O. antarctica into 7 different species groups. These methods are useful and may often capture true species groups, however, they should be treated as another source of information that together captures the likely species diversity rather than a plug and play device that produces incontrovertible results.
The use of multi-locus co-dominant genotypes to infer species is a more robust method, as linkage disequilibrium (LD) and allele fixation occurs relatively quickly compared to lineage sorting to monophyly, and the greater the replication (number of loci) the more likely the signals of LD and cluster specific alleles will be detected. However, the traditional population genetic methods used to generate multi-locus datasets (microsatellites, single nucleotide polymorphisms such as Restriction Associated DNA -RAD) become less effective with greater divergence rendering them generally unsuitable for detecting speciation. Target enrichment of exons or ultra-conserved elements is the technique of choice as these techniques are effective across taxonomic groups, yet sensitive enough to detect allelic variation within individuals (Eytan et al., 2015; Hugall et al., 2015). Unfortunately, the budget required for robust multi-locus studies using target enrichment is as yet beyond most taxonomy/conservation biology laboratories.
For this reason we highlight the need for pragmatism in species delimitation, taking into account easily available data (morphology, mtDNA, distributions, ecological factors) and methodology, taking careful consideration of assumptions before interpreting results, and then proposing species hypotheses to be further tested by taxonomic specialists and/or multi-locus codominant molecular studies.
Having clear means of species assignment is an important prerequisite for many working in all areas of biological sciences, and in the wider fields of conservation, environmental management and policy. Increasingly scarce specialist taxonomic expertise combined with the chronic challenges imposed by funding requirements have resulted in an over-reliance and lack of ability to challenge historical species descriptions. Where the increasing use of molecular studies challenges existing taxonomic understanding, a pragmatic solution based on maximizing the value of the available evidence is required, underpinning future redescription or further testing of primary species hypotheses.
Data Availability Statement
The datasets presented in this study can be found in online repositories. The names of the repository/repositories and accession number(s) can be found in the article/Supplementary Material.
Author Contributions
CS designed the study, collected material, conducted laboratory work, preformed the analyses, and wrote the manuscript. TO’H contributed to the study design, contributed specimens, and sequence, assisted with final manuscript preparation. RM-L formally identified the vast majority of the material, contributed to the study design, and assisted with final manuscript preparation. All authors contributed to the article and approved the submitted version.
Funding
This study was funded as BAS Biodiversity Evolution and Adaptation core science.
Conflict of Interest
The authors declare that the research was conducted in the absence of any commercial or financial relationships that could be construed as a potential conflict of interest.
Publisher’s Note
All claims expressed in this article are solely those of the authors and do not necessarily represent those of their affiliated organizations, or those of the publisher, the editors and the reviewers. Any product that may be evaluated in this article, or claim that may be made by its manufacturer, is not guaranteed or endorsed by the publisher.
Acknowledgments
We thank the captains and crews of the RRS James Clark Ross and FS Polarstern for the assistance in collecting many of the samples used in this study. These samples were collected during cruises JR144, JR179, JR230, JR262, JR275, and PS77. We are grateful for text suggestions made by Peter Convey, David Barnes, and William Goodall-Copestake. We would also like to thank Jeroen Ingels (as editor) and four reviewers for constructive comments and suggestions that further improved the manuscript. We thank Rachel Downey, Camille Moreau and Adriana Giles for assistance in sorting specimens.
Supplementary Material
The Supplementary Material for this article can be found online at: https://www.frontiersin.org/articles/10.3389/fmars.2021.723328/full#supplementary-material
Supplementary Figure 1 | Graphical output of the software SeqVis demonstrating strong base compositional heterogeneity at the third codon position and moderate heterogeneity at the second position.
Supplementary Figure 2 | Phylogenetic trees estimated using Bayesian and Phase 3 methods.
Supplementary Figure 3 | Phylogenetic trees estimated using Maximum Parsimony and Phase 3 methods. Node support for Maximum Parsimony was generated by bootstrap pseudo-replicates.
References
Alexander, A. M., Su, Y.-C., Oliveros, C. H., Olson, K. V., Travers, S. L., and Brown, R. M. (2016). Genomic data reveals potential for hybridization, introgression, and incomplete lineage sorting to confound phylogenetic relationships in an adaptive radiation of narrow-mouth frogs. Evolution 71, 475–488. doi: 10.1111/evo.13133
Ambroso, S., Böhmer, A., López-González, P., and Teixidó, N. (2016). Ophiuroid biodiversity patterns along the Antarctic Peninsula. Polar Biol. 39, 881–895. doi: 10.1007/s00300-016-1911-4
Bickford, D., Lohman, D. J., Sodhi, N. S., Ng, P. K. L., Meier, R., Winker, K., et al. (2007). Cryptic species as a window on diversity and conservation. Trends Ecol. Evol. 22, 148–155. doi: 10.1016/j.tree.2006.11.004
Blaxter, M. L. (2004). The promise of a DNA taxonomy. Philos. Trans. R. Soc. Lond. B Biol. Sci. 359, 669–679. doi: 10.1098/rstb.2003.1447
Blaxter, M. L., Mann, J., Chapman, T., Thomas, F., Whitton, C., Floyd, R., et al. (2005). Defining operational taxonomic units using DNA barcode data. Philos. Trans. R. Soc. Lond. BBiol. Sci. 360, 1935–1943.
Bortolus, A. (2008). Error cascades in the biological sciences: the unwanted consequences of using bad taxonomy in ecology. AMBIO J. Hum. Environ. 37, 114–119.
Brogger, M. I., and O’Hara, T. D. (2015). Revision of some ophiuroid records (Echinodermata: Ophiuroidea) from Argentina. Zootaxa 3972, 432–440.
Bulgin, N. L., Gibbs, H. L., Vickery, P., and Baker, A. J. (2003). Ancestral polymorphisms in genetic markers obscure detection of evolutionarily distinct populations in the endangered Florida grasshopper sparrow (Ammodramus savannarum floridanus). Mol. Ecol. 12, 831–844. doi: 10.1046/j.1365-294X.2003.01774.x
Bull, J. K., Sands, C. J., Garrick, R. C., Gardner, M. G., Tait, N. N., Briscoe, D. A., et al. (2013). Environmental complexity and biodiversity: the multi-layered evolutionary history of a log-dwelling velvet worm in montane temperate Australia. PLoS One 8:e84559. doi: 10.1371/journal.pone.0084559
Carstens, B. C., Pelletier, T. A., Reid, N. M., and Satler, J. D. (2013). How to fail at species delimitation. Mol. Ecol. 22, 4369–4383. doi: 10.1111/mec.12413
Cicconardi, F., Nardi, F., Emerson, B. C., Frati, F., and Fanciulli, P. P. (2010). Deep phylogeographic divisions and long-term persistence of forest invertebrates (Hexapoda: Collembola) in the North-Western Mediterranean basin. Mol. Ecol. 19, 386–400. doi: 10.1111/j.1365-294X.2009.04457.x
Coddington, J. A., Agnarsson, I., Miller, J. A., Kuntner, M., and Hormiga, G. (2009). Undersampling bias: the null hypothesis for singleton species in tropical arthropod surveys. J. Anim. Ecol. 78, 573–584. doi: 10.1111/j.1365-2656.2009.01525.x
Darriba, D., Taboada, G. L., Doallo, R., and Posada, D. (2012). jModelTest 2: more models, new heuristics and parallel computing. Nat. Methods 9, 772–772. doi: 10.1038/nmeth.2109
Dayrat, B. (2005). Towards integrative taxonomy. Biol. J. Linn. Soc. 85, 407–417. doi: 10.1111/j.1095-8312.2005.00503.x
De Queiroz, K. (2007). Species concepts and species delimitation. Syst. Biol. 56, 879–886. doi: 10.1080/10635150701701083
Dellicour, S., and Flot, J.-F. (2018). The hitchhiker’s guide to single-locus species delimitation. Mol. Ecol. Resour. 18, 1234–1246. doi: 10.1111/1755-0998.12908
Drummond, A., and Rambaut, A. (2007). BEAST: Bayesian evolutionary analysis by sampling trees. BMC Evol. Biol. 7:214. doi: 10.1186/1471-2148-7-214
Edgar, R. C. (2004). MUSCLE: a multiple sequence alignment method with reduced time and space complexity. BMC Bioinformatics 5:113. doi: 10.1186/1471-2105-5-113
Eytan, R. I., Evans, B. R., Dornburg, A., Lemmon, A. R., Lemmon, E. M., Wainwright, P. C., et al. (2015). Are 100 enough? Inferring acanthomorph teleost phylogeny using anchored hybrid enrichment. BMC Evol. Biol. 15:113. doi: 10.1186/s12862-015-0415-0
Faurby, S., and Barber, P. H. (2015). Extreme population subdivision despite high colonization ability: contrasting regional patterns in intertidal tardigrades from the west coast of North America. J. Biogeogr. 42, 1006–1017. doi: 10.1111/jbi.12500
Fujisawa, T., and Barraclough, T. G. (2013). Delimiting species using single-locus data and the generalized mixed yule coalescent approach: a revised method and evaluation on simulated data sets. Syst. Biol. 62, 707–724. doi: 10.1093/sysbio/syt033
Fujita, M. K., Leaché, A. D., Burbrink, F. T., McGuire, J. A., and Moritz, C. (2012). Coalescent-based species delimitation in an integrative taxonomy. Trends Ecol. Evol. 27, 480–488. doi: 10.1016/j.tree.2012.04.012
Goodall-Copestake, W. P., Tarling, G. A., and Murphy, E. J. (2012). On the comparison of population-level estimates of haplotype and nucleotide diversity: a case study using the gene cox1 in animals. Heredity 109, 50–56. doi: 10.1038/hdy.2012.12
Hebert, P. D. N., and Gregory, T. R. (2005). The promise of DNA barcoding for taxonomy. Syst. Biol. 54, 852–859. doi: 10.1080/10635150500354886
Hey, J. (2006). On the failure of modern species concepts. Trends Ecol. Evol. 21, 447–450. doi: 10.1016/j.tree.2006.05.011
Ho, J. W. K., Adams, C. E., Lew, J. B., Matthews, T. J., Ng, C. C., Shahabi-Sirjani, A., et al. (2006). SeqVis: visualization of compositional heterogeneity in large alignments of nucleotides. Bioinformatics 22, 2162–2163. doi: 10.1093/bioinformatics/btl283
Huelsenbeck, J. P., and Ronquist, F. (2001). MRBAYES: Bayesian inference of phylogenetic trees. Bioinformatics 17, 754–755.
Hugall, A. F., O’Hara, T. D., Hunjan, S., Nilsen, R., and Moussalli, A. (2015). An exon-capture system for the entire class Ophiuroidea. Mol. Biol. Evol. 33, 281–294. doi: 10.1093/molbev/msv216
Janosik, A. M., and Halanych, K. M. (2010). Unrecognized Antarctic biodiversity: a case study of the Genus Odontaster (Odontasteridae; Asteroidea). Integr. Comp. Biol. 50, 981–992. doi: 10.1093/icb/icq119
Johnson, G. D., Paxton, J. R., Sutton, T. T., Satoh, T. P., Sado, T., Nishida, M., et al. (2009). Deep-sea mystery solved: astonishing larval transformations and extreme sexual dimorphism unite three fish families. Biol. Lett. 5, 235–239. doi: 10.1098/rsbl.2008.0722
Jossart, Q., Sands, C. J., and Sewell, M. A. (2019). Dwarf brooder versus giant broadcaster: combining genetic and reproductive data to unravel cryptic diversity in an Antarctic brittle star. Heredity 123, 622–633. doi: 10.1038/s41437-019-0228-9
Kapli, P., Lutteropp, S., Zhang, J., Kobert, K., Pavlidis, P., Stamatakis, A., et al. (2016). Multi-rate poisson tree processes for single-locus species delimitation under maximum likelihood and Markov Chain Monte Carlo. bioRxiv [Preprint]. bioRxiv 063875
Koehler, R. (1900). Note preliminaire sur les Echinides et les Ophiures de l’Expédition Antarctique Belge. Bulletin Academie Royale Belgique. 11, 814–820.
Librado, P., and Rozas, J. (2009). DnaSP v5: a software for comprehensive analysis of DNA polymorphism data. Bioinformatics 25, 1451–1452. doi: 10.1093/bioinformatics/btp187
Lim, G. S., Balke, M., and Meier, R. (2012). Determining species boundaries in a world full of rarity: singletons, species delimitation methods. Syst. Biol. 61, 165–169. doi: 10.1093/sysbio/syr030
Ljungman, A. V. (1871). Om tvänne nya arter Ophiurider. Öfversigt af Kungliga Vetenskapsakademiens Förhandlingar 5, 471–476.
Lourenço, W. R. (2016). Scorpion incidents, misidentification cases and possible implications for the final interpretation of results. J. Venom. Anim. Toxins Trop. Dis. 22:21. doi: 10.1186/s40409-016-0075-6
Luo, A., Ling, C., Ho, S. Y. W., and Zhu, C. D. (2018). Comparison of methods for molecular species delimitation across a range of speciation scenarios. Syst. Biol. 67, 830–846. doi: 10.1093/sysbio/syy011
Martín-Ledo, R., and López-González, P. J. (2013). Brittle stars from Southern Ocean (Echinodermata: Ophiuroidea). Polar Biol. 37, 73–88. doi: 10.1007/s00300-013-1411-8
Martín-Ledo, R., Sands, C. J., and López-González, P. J. (2013). A new brooding species of brittle star (Echinodermata: Ophiuroidea) from Antarctic waters. Polar Biol. 36, 115–126. doi: 10.1007/s00300-012-1242-z
Mayden, R. L. (1997). “A hierarchy of species concepts: the denouement in the saga of the species problem,” in Species: The Units of Diversity, eds M. F. Claridge, H. A. Dawah, and M. R. Wilson (London: Chapman and Hall), 381–423.
Mayr, E. (1942). Systematics and the Origin of Species, From the Viewpoint of a Zoologist. Harvard University Press. Available online at: https://books.google.co.uk/books?hl=en&lr=&id=mAIjnLp6r_MC&oi=fnd&pg=PR9&dq=Systematics+and+the+Origin+of+Species&ots=TSLsHmwkOF&sig=jMFaAV4D0S89PgYM8luf2a3EYdY (accessed December 14, 2016).
Mora, C., Tittensor, D. P., Adl, S., Simpson, A. G. B., and Worm, B. (2011). How many species are there on earth and in the ocean? PLoS Biol. 9:e1001127. doi: 10.1371/journal.pbio.1001127
Moritz, C. (1995). Uses of molecular phylogenies for conservation. Philos. Trans. R. Soc. Lond. B Biol. Sci. 349, 113–118. doi: 10.1098/rstb.1995.0097
Moritz, C. (1999). Conservation units and translocations: strategies for conserving evolutionary processes. Hereditas 130, 217–228.
Mortensen, T. (1936). “Echinoidea and Ophiuroidea,” in Discovery Reports. (London: Cambridge University Press), 199–348.
Müller, J., and Troschel, F. H. (1842). System der Asteriden. 1. Asteriae. 2. Ophiuridae. Vieweg: Braunschweig. 134:12.
O’Hara, T. D., England, P. R., Gunasekera, R. M., and Naughton, K. M. (2014). Limited phylogeographic structure for five bathyal ophiuroids at continental scales. Deep Sea Res. Part Oceanogr. Res. Pap. 84, 18–28. doi: 10.1016/j.dsr.2013.09.009
O’Hara, T. D., Smith, P. J., Mills, V. S., Smirnov, I., and Steinke, D. (2013). Biogeographical and phylogeographical relationships of the bathyal ophiuroid fauna of the Macquarie Ridge, Southern Ocean. Polar Biol. 36, 321–333. doi: 10.1007/s00300-012-1261-9
Packer, L., Monckton, S. K., Onuferko, T. M., and Ferrari, R. R. (2018). Validating taxonomic identifications in entomological research. Insect Conserv. Divers. 11, 1–12. doi: 10.1111/icad.12284
Pante, E., Puillandre, N., Viricel, A., Arnaud-Haond, S., Aurelle, D., Castelin, M., et al. (2015b). Species are hypotheses: avoid connectivity assessments based on pillars of sand. Mol. Ecol. 24, 525–544. doi: 10.1111/mec.13048
Pante, E., Abdelkrim, J., Viricel, A., Gey, D., France, S. C., Boisselier, M. C., et al. (2015a). Use of RAD sequencing for delimiting species. Heredity 114, 450–459. doi: 10.1038/hdy.2014.105
Rambaut, A. (2009). FigTree v1.3.1. Computer Program. Available online at: http://tree.bio.ed.ac.uk/software/figtree/ (accessed June, 2012)
Rambaut, A., and Drummond, A. J. (2007). Tracer v1. 4. Available Left Angle Bracket Httpbeast Bio Ed Ac UkTracer Right-Pointing Angle Bracket.
Rambaut, A., Suchard, M. A., Xie, D., and Drummond, A. (2014). Tracer v1.6. Available online at: http://beast.bio.ed.ac.uk/Tracer (accessed Aug 30, 2021)
Ratnasingham, S., and Hebert, P. D. N. (2007). BOLD: the barcode of life data system (http://www.barcodinglife.org). Mol. Ecol. Notes 7, 355–364. doi: 10.1111/j.1471-8286.2007.01678.x
Reid, N. M., and Carstens, B. C. (2012). Phylogenetic estimation error can decrease the accuracy of species delimitation: a Bayesian implementation of the general mixed Yule-coalescent model. BMC Evol. Biol. 12:196. doi: 10.1186/1471-2148-12-196
Ronquist, F., and Huelsenbeck, J. P. (2003). MrBayes 3: Bayesian phylogenetic inference under mixed models. Bioinformatics 19, 1572–1574. doi: 10.1093/bioinformatics/btg180
Ronquist, F., Teslenko, M., van der Mark, P., Ayres, D. L., Darling, A., Höhna, S., et al. (2012). MrBayes 3.2: efficient Bayesian phylogenetic inference and model choice across a large model space. Syst. Biol. 61, 539–542. doi: 10.1093/sysbio/sys029
Ryder, O. A. (1986). Species conservation and systematics: the dilemma of subspecies. Trends Ecol. Evol. 1, 9–10. doi: 10.1016/0169-5347(86)90059-5
Sands, C. J., Griffiths, H. J., Downey, R. V., Barnes, D. K. A., Linse, K., and Martín-Ledo, R. (2013). Observations of the ophiuroids from the West Antarctic sector of the Southern Ocean. Antarct. Sci. 25, 3–10. doi: 10.1017/S0954102012000612
Sands, C. J., O’Hara, T., Barnes, D. K. A., and Martín-Ledo, R. (2015). Against the flow: evidence of multiple recent invasions of warmer continental shelf waters by a Southern Ocean brittle star. Evol. Popul. Genet. 3:63. doi: 10.3389/fevo.2015.00063
Scornavacca, C., and Galtier, N. (2016). Incomplete lineage sorting in mammalian phylogenomics. Syst. Biol. 66:syw082. doi: 10.1093/sysbio/syw082
Sokal, R. R., and Crovello, T. J. (1970). The biological species concept: a critical evaluation. Am. Nat. 104, 127–153.
Stamatakis, A. (2014). RAxML version 8: a tool for phylogenetic analysis and post-analysis of large Phylogenies. Bioinformatics 30, 1312–1313. doi: 10.1093/bioinformatics/btu033
Stör, S., O’Hara, T. D., and Thuy, B. (2017). The World Ophiuroidea Database. World Ophiuroid Database. Available online at: http://www.marinespecies.org/ophiuroidea/index.php (accessed September 7, 2017).
Suh, A., Smeds, L., and Ellegren, H. (2015). The dynamics of incomplete lineage sorting across the ancient adaptive radiation of neoavian birds. PLoS Biol. 13:e1002224. doi: 10.1371/journal.pbio.1002224
Swofford, D. L. (2002). PAUP∗: Phylogenetic Analysis Using paRsimony (∗ And Other Methods). 4.0 b10 ed. Sunderland, MA: Sinauer Associates, Inc.
Tamura, K., Peterson, D., Peterson, N., Stecher, G., Nei, M., and Kumar, S. (2011). MEGA5: molecular evolutionary genetics analysis using maximum likelihood, evolutionary distance, and maximum parsimony methods. Mol. Biol. Evol. 28, 2731–2739. doi: 10.1093/molbev/msr121
Tautz, D., Arctander, P., Minelli, A., Thomas, R. H., and Vogler, A. P. (2002). DNA points the way ahead in taxonomy. Nature 418:479. doi: 10.1038/418479a
Wägele, H., Klussmann-Kolb, A., Kuhlmann, M., Haszprunar, G., Lindberg, D., Koch, A., et al. (2011). The taxonomist - an endangered race. A practical proposal for its survival. Front. Zool. 8:25. doi: 10.1186/1742-9994-8-25
Weber, A. A.-T., Stöhr, S., and Chenuil, A. (2019). Species delimitation in the presence of strong incomplete lineage sorting and hybridization: lessons from Ophioderma (Ophiuroidea: Echinodermata). Mol. Phylogenet. Evol. 131, 138–148. doi: 10.1016/j.ympev.2018.11.014
Wheeler, Q. (2018). Blank canvas: the case for descriptive taxonomy. Integr. Comp. Biol. 58, 1118–1121. doi: 10.1093/icb/icy067
Will, K. W., Mishler, B. D., and Wheeler, Q. D. (2005). The perils of DNA barcoding and the need for integrative taxonomy. Syst. Biol. 54, 844–851. doi: 10.1080/10635150500354878
Wilson, N. G., Schrodl, M., and Halanych, K. M. (2009). Ocean barriers and glaciation: evidence for explosive radiation of mitochondrial lineages in the Antarctic sea slug Doris kerguelenensis (Mollusca, Nudibranchia). Mol. Ecol. 18, 965–984. doi: 10.1111/j.1365-294X.2008.04071.x
Wolf, K., and Markiw, M. E. (1984). Biology contravenes taxonomy in the myxozoa: new discoveries show alternation of invertebrate and vertebrate hosts. Science 225, 1449–1452. doi: 10.1126/science.225.4669.1449
Yang, Z., and Rannala, B. (2010). Bayesian species delimitation using multilocus sequence data. Proc. Natl. Acad. Sci. U.S.A. 107, 9264–9269. doi: 10.1073/pnas.0913022107
Yang, Z., and Rannala, B. (2017). Bayesian species identification under the multispecies coalescent provides significant improvements to DNA barcoding analyses. Mol. Ecol. 26, 3028–3036. doi: 10.1111/mec.14093
Yasuda, N., Taquet, C., Nagai, S., Fortes, M., Fan, T.-Y., Harii, S., et al. (2015). Genetic diversity, paraphyly and incomplete lineage sorting of mtDNA, ITS2 and microsatellite flanking region in closely related Heliopora species (Octocorallia). Mol. Phylogenet. Evol. 93, 161–171. doi: 10.1016/j.ympev.2015.07.009
Zhang, J., Kapli, P., Pavlidis, P., and Stamatakis, A. (2013). A general species delimitation method with applications to phylogenetic placements. Bioinformatics 29, 2869–2876. doi: 10.1093/bioinformatics/btt499
Keywords: marine management, conservation, cryptic species, Ophiuroidea, primary species hypothesis, Southern Ocean, taxonomy, unrecognized diversity
Citation: Sands CJ, O’Hara TD and Martín-Ledo R (2021) Pragmatic Assignment of Species Groups Based on Primary Species Hypotheses: The Case of a Dominant Component of the Southern Ocean Benthic Fauna. Front. Mar. Sci. 8:723328. doi: 10.3389/fmars.2021.723328
Received: 10 June 2021; Accepted: 01 September 2021;
Published: 30 September 2021.
Edited by:
Jeroen Ingels, Florida State University, United StatesReviewed by:
Thomas Saucede, Université Bourgogne Franche-Comté, FranceChris Mah, National Museum of Natural History (SI), United States
Adrian Glover, Natural History Museum, United Kingdom
Copyright © 2021 Sands, O’Hara and Martín-Ledo. This is an open-access article distributed under the terms of the Creative Commons Attribution License (CC BY). The use, distribution or reproduction in other forums is permitted, provided the original author(s) and the copyright owner(s) are credited and that the original publication in this journal is cited, in accordance with accepted academic practice. No use, distribution or reproduction is permitted which does not comply with these terms.
*Correspondence: Chester J. Sands, cjsan@bas.ac.uk