ADV-Based Investigation on Bed Level Changes Over a Meso-Macro Tidal Beach
 Wenhong Pang
 Xiaoyan Zhou1
  Zhijun Dai
- 1State Key Laboratory of Estuarine and Coastal Research, East China Normal University, Shanghai, China
- 2College of Resources and Environment, Beibu Gulf University, Qinzhou, China
- 3Key Laboratory of Coastal Science and Engineering, Beibu Gulf University, Qinzhou, China
- 4School of Marine Sciences, Sun Yat-sen University, Zhuhai, China
- 5Southern Marine Science and Engineering Guangdong Laboratory (Zhuhai), Zhuhai, China
Beach intra-tidal bed level changes are of significance to coastal protection amid global climate changes. However, due to the limitation of instruments and the disturbance induced by wave motions superimposed on water levels, it was difficult to detect the high-frequency oscillation of the submerged beach bed level. In this study, an observation, lasting for 12 days and covering the middle tide to the following spring tide, was conducted on a meso-macro tidal beach, Yintan Beach, to simultaneously detect the characteristics and influence mechanism of bed level changes at intra-tidal and tidal cycle scales. The collected data included water depth, suspended sediment concentration (SSC), waves, high-frequency three-dimensional (3-D) velocity, and the distance of the seabed to the acoustic Doppler velocimeter (ADV) probe, which were measured by an optical backscatter sensor, two Tide & Wave Recorder-2050s, and an ADV, respectively. The results showed that the tidal cycle-averaged bed level decreased by 58.8 mm, increased by 12.6 mm, and increased by 28.9 mm during neap, middle, and spring tides in succession, respectively, compared with the preceding tidal regimes. The net erosion mainly resulted from large incident wave heights and the consequent strong offshore-directed sediment transport induced by undertows. Moreover, the variations in the bed level were more prominent during a neap to middle tides than during middle to spring tides, which were jointly caused by the wave-breaking probability regulated by water depth and the relative residence times of shoaling wave, breaker, and surf zones that were determined by relative tidal range. In terms of the intra-tidal bed level, it displayed an intra-tidal tendency of increase during floods and decrease during ebb tides, i.e., the intra-tidal bed level changes were controlled by water depth, which modulated the effects of waves on sediment resuspension and vertical sediment exchange. To be specific, waves and SSC were responsible for the intra-tidal bed level changes under low-energy wave conditions, while mean current and bedform exerted important influences on the variations of the intra-tidal bed level under moderate wave conditions, which broke the foregoing interrelation between bed level, waves, and SSC. This study, therefore, emphasizes the usage of ADV measurement to investigate bed level changes in sandy coasts.
Introduction
The beach is a highly dynamic and active morphological system that connects the land and the ocean and is affected by the combined actions of intense coastal forces including waves, tides, and currents, which constitute over 30% of the world's ice-free coastlines (Luijendijk et al., 2018; Vousdoukas et al., 2020). At the same time, the beach serves as a natural barrier, a soft defense compared with human-made hard structures, to protect the coastal hinterland against flooding and extreme storm surges using wave energy dissipation (Rijn, 2009, 2010; Slobbe et al., 2013; Stive et al., 2013). Hence, more and more concerns have been revealed on the mechanism of beach bed level changes since the twentieth century in the context of the higher frequency and greater intensity of extreme hydrological events (Vellinga, 1982; Rijn, 2011; Li et al., 2014; Masselink and Heteren, 2014; Hu et al., 2015) coupled with global sea-level rise (Nerem et al., 2018; Zhang et al., 2020), especially for low-lying coastal and island countries (Nicholls and Cazenave, 2010; Stive et al., 2013; Pucino et al., 2021).
So far, the major researches on bed level changes concerning meso-macro tidal and macro-tidal beaches (mean spring tidal range >3 m) were reported from the northern coasts of Australia, northwestern coasts of Netherlands, France, and Belgium, northern coasts of New Zealand, and almost all the coasts of England excluding its northern coasts (Kroon and Masselink, 2002; Austin and Masselink, 2006; Sedrati and Anthony, 2007; Masselink et al., 2008; Poate et al., 2014; Biausque and Senechal, 2019). For meso-macro tidal and macro-tidal beaches, which are mainly featured with gentle beach slopes and dissipative beach states, the bed level changes were suppressed and were at the level of <5 cm for most of the cases over one tidal cycle, even after going through a storm surge event (Aagaard et al., 1998b; Anthony et al., 2004; Masselink et al., 2007; Puleo et al., 2014). Meanwhile, there tend to be no conspicuous patterns in the amplitudes of bed level changes for different tidal regimes (i.e., neap to spring tides), as larger bed level change amplitudes could occur during either spring or neap tides erratically (Brand et al., 2020). Specifically, the subdued bed level changes in response to large tide ranges were associated with larger morphological relaxation times caused by the small residence time of wave-related swash and surf zone processes on account of the larger horizontal tidal translation for meso-macro tidal beaches (Kroon and Masselink, 2002; Anthony et al., 2004; Reichmüth and Anthony, 2007). On the other hand, it was suggested that the limited net bed level changes of meso-macro tidal beaches over one tidal cycle resulted from the compensation of onshore sediment transport-induced accretion, which was derived from swash zone processes during low tides, for the strong offshore sediment transport-induced erosion under surf zone conditions (Aagaard et al., 2005). In contrast, it was reported that the significant bed level changes occurring over micro-tidal beaches were owing to the strong offshore-directed undertows resulting from the sudden release of incident wave energy on steep slopes (Coco et al., 2004; Agredano et al., 2019). Hence, to find out the main factor dominating the mechanism of bed level changes, a comprehensive analysis of intra-tidal bed level changes throughout different tidal cycles and incident wave conditions over a meso-macro tidal beach is needed.
It is generally acknowledged that two different patterns of beach bed level change exist under low-energy waves and stormy conditions (Aagaard et al., 1998a, 2006; Houser and Greenwood, 2007). Under low-energy wave conditions, when bar-trough systems prevailed, the beach face shoreward of the bar crest tended to accrete due to mean onshore flows across the bar surface at relatively shallow water depths (Masselink et al., 2008; Capo et al., 2009). It was suggested that the mechanism of bed level accretion was associated with three-dimensional (3-D) cell circulation (Aagaard et al., 1998a, 2006), during which the onshore sediments transported by incident waves were not returned straightly seaward by weak offshore mean flows, but through alongshore feeders and rip channels, which eventually contribute to the infill of runnels landward of the bar crest and the weld of the bar to the beach face (Kroon and Masselink, 2002; Houser et al., 2006; Falqués et al., 2008). Under energetic wave conditions or stormy conditions, larger asymmetric incident waves broke at deeper locations once the breaker indices were approached, which lead to a wider and highly dissipative surf zone with high-energy water motions (Gallagher et al., 1998; Vidal-Ruiz and de Alegría-Arzaburu, 2020). As a result, the bed level at upper or whole beaches featured by the bar-trough system was strongly eroded, which was related to vertical undertow circulation (Quartel et al., 2008; Ribeiro et al., 2012; Brand et al., 2019). Specifically, a great amount of eroded sediments stirred up by incident waves and enhanced infra-gravity waves were transported offshore to the lower beach or the subtidal zone by a strong offshore-directed undertow (Beach and Sternberg, 1991; Russell, 1993; Aagaard et al., 2006, 2012, 2013), which led to a relatively plane cross profile. Since mean currents contributed inversely to the bed level changes under different wave conditions, further explorations need to be conducted to evaluate the role of mean currents on vertical sediment exchange and intra-tidal bed level changes.
For the studies about bed level changes concerning different geomorphic units over a meso-macro tidal beach, a portion of them focused on the measurement and prediction of intertidal bar evolution under different wave conditions (Vousdoukas et al., 2011; Ge et al., 2017; López-Dóriga and Ferreira, 2017; Brand et al., 2020), as the intertidal bar is a common feature of meso-macro tidal beaches, which are commonly short of other secondary morphological features such as beach cusps, low-tide terraces, skew bars, and rip morphology (Wright et al., 1987; Short, 1991; Masselink et al., 2007). Additionally, in recent years, more and more studies have attempted to distinguish the respective features of bed level changes within different wave zones (i.e., shoaling wave zone, surf zone, and swash zone). Specifically, net bed levels tended to increase persistently as a result of onshore-directed sediment transport by incident shoaling waves within the shoaling wave zone, where incident wave components dominate the net sediment transport direction (Russell et al., 1995; Tinker et al., 2009). At the surf zone, where wave break-induced turbulent eddies and undertows prevail, beach face erosion occurred persistently due to significant offshore-directed sediment transport induced by strong offshore-directed mean currents coupled with large amounts of suspended sediments resulting from turbulence-enhanced bed shear stresses (Saulter et al., 2003; Masselink, 2004; Ruessink et al., 2016). Hence, the surf zone is the most dynamics-sensitive zone when it comes to bed level changes at the beach profile (Aagaard et al., 2002; Mariño-Tapia et al., 2007). Furthermore, in the swash zone, which is featured by cycled asymmetric uprush and backwash processes (Pritchard and Hogg, 2005), the net bed level changes were vitally determined by incident wave strength, during which the bed level gradually increased due to the uprush-dominated onshore-directed pre-suspended sediment transport during relatively low-energy wave conditions, while the beach face was eroded as backwashes became more efficient transporters of local sediments under energetic waves or stormy conditions (Masselink et al., 2005; Ruessink et al., 2016). Hence, a study analyzing the features of intra-tidal bed level changes within the surf zone under different wave conditions is also necessary.
Although much attention has been paid to beach bed level changes, only a few researchers accurately obtained the intra-tidal variations of bed levels as their data on bed levels were commonly obtained during low tides (beach face was exposed in the air) or the way that the bed levels were measured using inserted rods would, to some extent, affect the accuracy of the bed level (Arnaud et al., 2011; Ge et al., 2017; Agredano et al., 2019; van Bemmelen et al., 2020). Hence, in this study, we carried out an observation to measure the intra-tidal variations of bed levels using an alternative way, i.e., acoustic Doppler velocimeter (ADV) measurement, within the surf zone from shoaling wave conditions to surf conditions on a meso-macro tidal beach, Yintan Beach, with the aims (1) to detect the characteristics of bed level changes at intra-tidal and tidal cycle scales, respectively and (2) to analyze the influence mechanism of intra-tidal bed level changes under different wave conditions.
Methodology
Field Sites Setting
Comprehensive field observation was conducted at Yintan Beach (Figures 1A–C), Beihai City, China, from May 28 to June 9, 2016. The beach is defined as a meso-macro tidal beach with a mean spring tidal range of 3.6 m, and it experiences diurnal tidal conditions during middle and spring tides, whereas semidiurnal tides operate during neap tides (Huang et al., 2011). According to Huang et al. (2011), the mean values of the flood and ebb tidal currents in the spring tide within Lianzhou Bay are 0.13 and 0.31 m/s, respectively. The mean wave height in the nearshore of Yintan Beach is ~0.5 m and varies significantly in different seasons (Zhou et al., 2015). In addition, the wave direction is northward during winter and southwest during summer under the impacts of the southwest monsoon. Especially, strong southwest wind waves attack the beach periodically for consecutive days each month during summer, according to the local inhabitants.
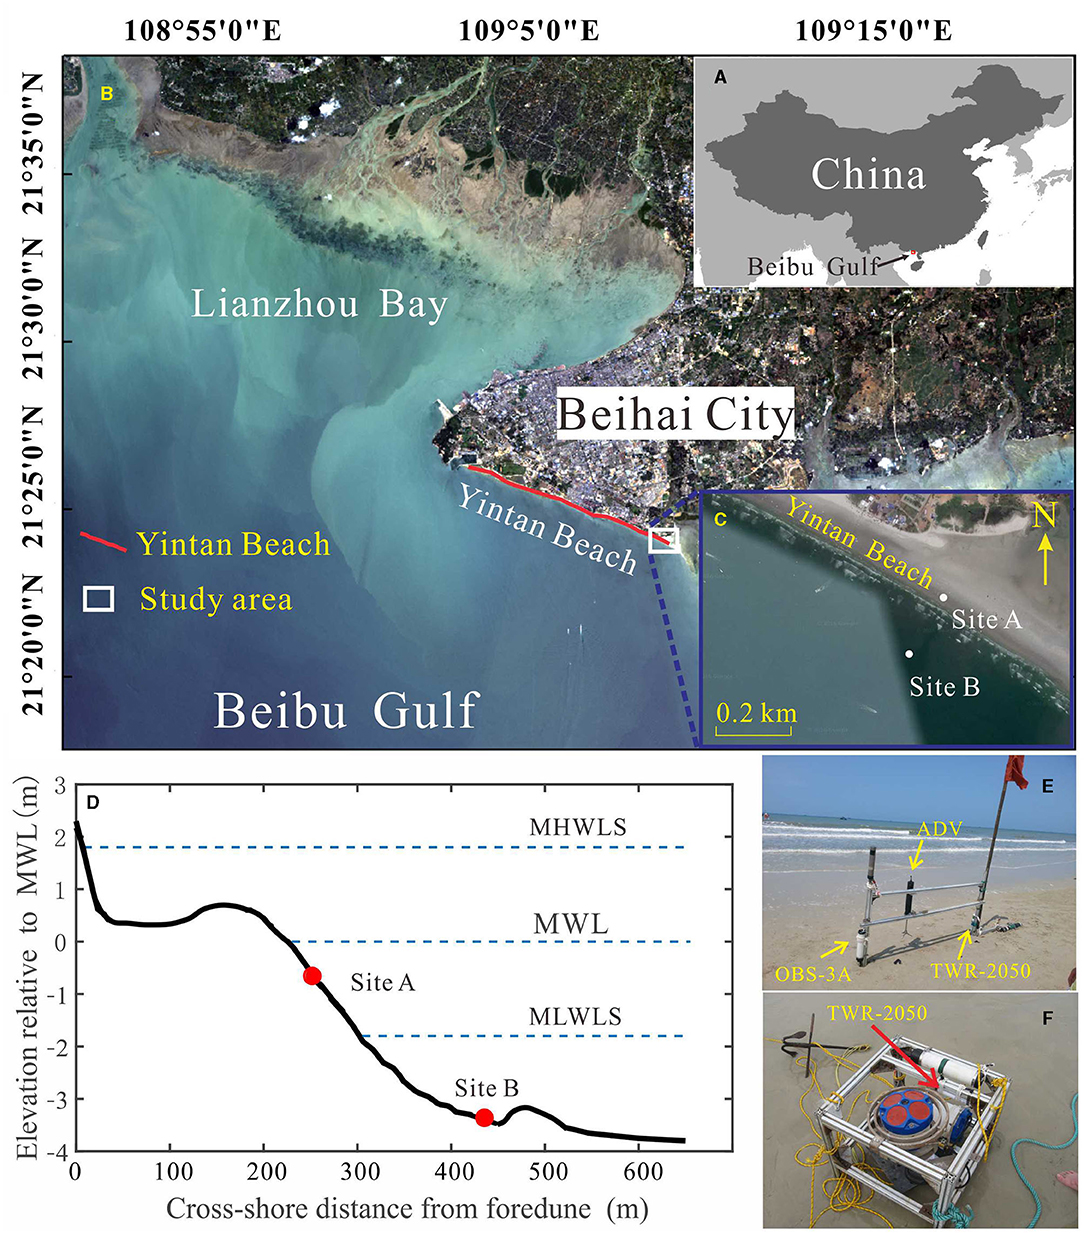
Figure 1. Study area and instrument deployment. (A) The location of Beibu Gulf; (B) the location of Yintan Beach and (C) the study area of Yintan Beach with the location of instrument sites. (D) Beach profile of the instrument sites at the beginning of the field observation and the cross-shore location of Site A and Site B (x = 0 indicated the foot of foredune), with the three horizontal, dashed lines representing the mean high water level of spring tides (MHWLS), mean water level (MWL), and mean low water level of spring tides (MLWLS), respectively; (E) instrument deployment upon the aluminum frame at Site A and (F) the deployment of Tide & Wave Recorder-2050 (TWR-2050) upon the aluminum quadripod at Site B.
Bar-trough systems develop in both the intertidal and subtidal zones of Yintan Beach (Ge et al., 2017). An obvious and straight sandbar exists in the middle tide zone during the observation with an angle of 28° between the sandbar and latitude direction. The sediments here mainly consist of unconsolidated quartz sands, and the median grain size varies from 0.125 to 0.233 mm (Ma et al., 2019) across the intertidal zone, which leads to a whole averaged slope of 8‰ over the intertidal zone of Yintan Beach (Pang et al., 2019). Meanwhile, the beach face would suffer from tropical cyclones (typhoons) from May to November each year, which lead to the significant morphological changes of the intertidal beach (Ji, 2007; Ge et al., 2017).
Instrument Setup
The field measurement was conducted at the middle part (surf zone) and subtidal area of Yintan Beach synchronously (Figures 1C,D), which lasted from middle tide to neap tide, and finally, to spring tide (Figure 2A). During the observation, for the instrument site at the middle part of Yintan Beach (Site A, Figures 1D,E), an aluminum frame was equipped with an ADV (6-MHz vector current meter, Nortek AS, Rud, Norway) to record the distance from the seabed to the ADV probe (DSP) (at an accuracy of ±1 mm, Andersen et al., 2006; Zhu et al., 2019) and the high-resolution 3-D flow velocity (u, v, and w), an optical backscatter sensor (OBS-3A) (D&A Instrument Company, Port Townsend, Washington, USA) was used to measure the water depth (h) and turbidity (transferred to suspended sediment concentration, SSC), and a Tide & Wave Recorder-2050 (TWR-2050) (Company, RBR Ltd., Ottawa, Canada) was used to obtain wave heights. For the instrument site at the subtidal area (Site B, Figures 1D,F) which was ~180 m seaward from Site A, another TWR-2050 was fixed within an aluminum quadripod to measure the wave heights.
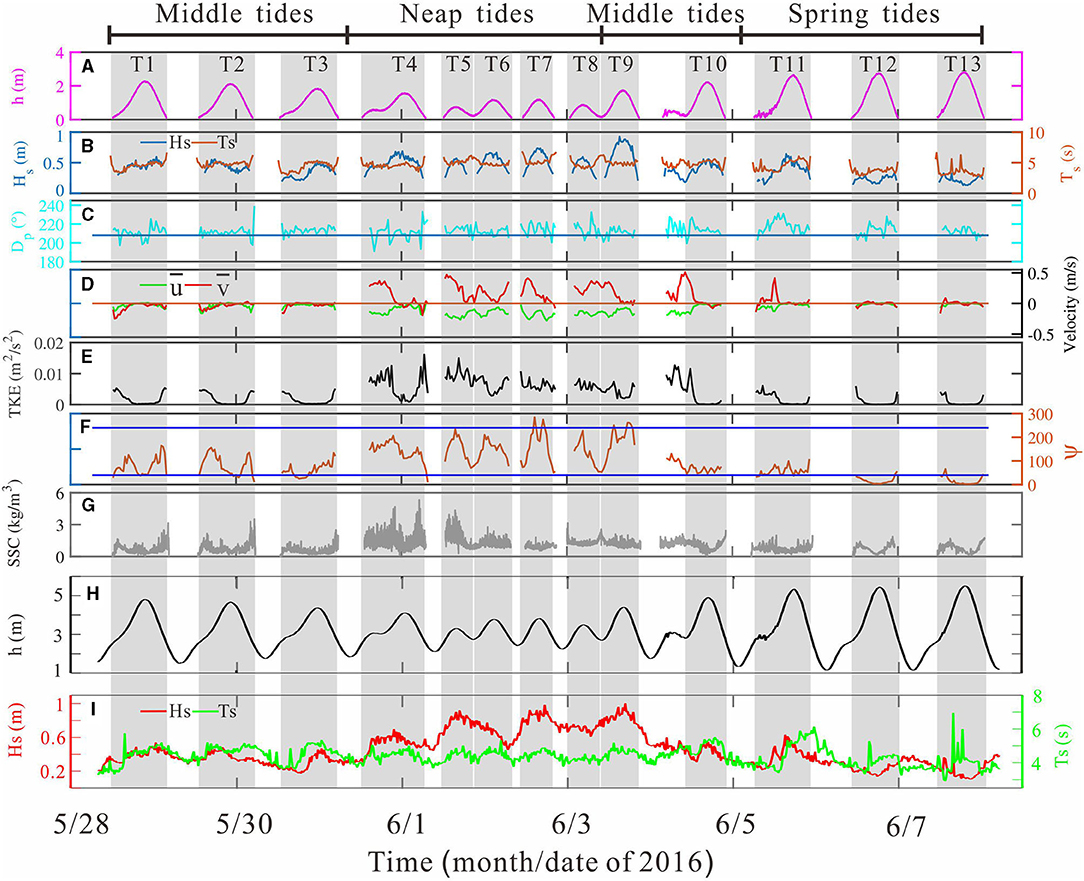
Figure 2. Time series of (A) water depth, h; (B) significant wave height, Hs (blue line), and significant wave period, Ts (red line); (C) peak wave direction, Dp, and horizontal line indicated the normal direction (208°); (D) mean cross-shore velocity, (green line), and alongshore velocity, (red line); (E) turbulent kinetic energy, TKE; (F) mobility number, ψ (orange line), and two blue lines indicated ψ = 240 and 40, respectively; (G) suspended sediment concentration, SSC at Site A. Time series of (H) water depth, h; (I) significant wave height, Hs (red line) and significant wave period, Ts (green line) at Site B.
To be specific, at Site A, two vertical rods of the aluminum frame were inserted into the ground for ~1.2 m. Hence, it was assumed that the aluminum frame equipped with the ADV was stable and that the measurement of the bed level was hardly influenced by gravity-induced sink over the short-term 12-day observation. The ADV was fixed onto two horizontal rods with the sensors facing downward and the measurement volume located 7 cm above the seabed at the beginning of the observation (Figure 1E). Meanwhile, the ADV recorded 19,200 measurements at a frequency of 64 Hz every 10 min for the first three tidal cycles (Table 1). In the remaining tidal cycles, the ADV was sampling at 2 Hz for consecutive 1,024 s per 30 min. At the same time, the distance between the seabed and the DSP was recorded at the start and end of the real-time measurement. For the convenient analysis of bed level changes and velocity throughout the time series, the velocity data from the ADV for the first three tidal cycles were resampled at 2 Hz. It is worth noting that the way the bed level was obtained using ADV measurement in our study was acoustic and non-intrusive, which would hardly affect the natural characteristics of the bed level changes. Thus, it was deduced that using ADV measurement on bed levels is a better way than the classical methods (e.g., inserted rod method) with better accuracy.
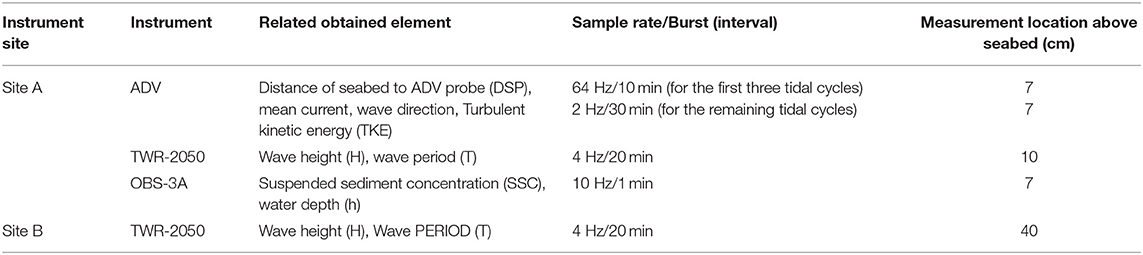
Table 1. Overview of instrument setup and related obtained elements during the observation.
In addition, at Site A, the OBS-3A was attached to a vertical pod and it obtained h and SSC at intervals of 1 min, with its turbidity probe being 7 cm above the seabed as well (Table 1). Moreover, the TWR-2050 at Site A was attached to the other vertical pod, with its pressure sensor placed 0.1 m above the seabed, and was logged at 4 Hz to record the pressure over a consecutive period of 512 s every 20 min (Table 1). Afterward, the recorded pressure was converted to wave height and wave period by linear wave theory (Gibbons et al., 2005). In addition, at Site B, the TWR-2050 was sampling with the same measurement parameters as that of the TWR-2050 at Site A, and its probe was ~0.4 m above the seabed (Table 1).
Data Processing
Estimate of Turbulent Kinetic Energy
Turbulent kinetic energy was used to describe the strength of the water turbulent velocity fluctuation and has a potential effect on the sediment suspension in the nearshore area (Alsina and Cáceres, 2011; Yoon and Cox, 2012; Christensen et al., 2019). Turbulent kinetic energy (TKE) was calculated following Svendsen (1987):
where u, v, and w refer to the x, y, and z components of velocity, respectively, and ′ indicates the turbulent oscillation component. Moreover, the turbulent fluctuations were obtained by separating the turbulent velocity (u′), off mean velocity (), and velocity due to waves (uw), since the measured high-frequency velocity (u (t)) can be written as:
where was the mean cross-shore velocity and the overbar of indicated the time average, uw was obtained by bandpass filtering (with a cut-off frequency of 0.5 and 0.005 Hz) the detrended and mean-subtracted u time series, wherein initially, the data quality was checked, the outliers were replaced, and the high-frequency noise was removed.
Calculation of Mean Daily Relative Tide Range and Horizontal Tidal Translation Rate
The mean daily relative tide range (MDRTR), modified from the relative tide range (RTR), which was a dimensionless parameter to reflect the relative importance of the shoaling wave, surf zone, and swash processes (Masselink and Short, 1993) over the sandy beach, was calculated by the ratio of the daily tide range (TRD) to the mean breaker wave height (Hb) over a tidal cycle:
where Hb was estimated following Komar and Gaughan (1972):
where g was gravity acceleration, Ts was significant wave period, and H0 was the deep-water wave height. In the study, H0 was replaced with the significant wave height (Hs) from the instrument site at the subtidal area (Site B).
The horizontal tidal translation rate [Vtide(t)], which determined the duration of the wave zone processes and influenced the relaxation time of beach morphological changes, was calculated using the following equation modified from Anthony et al. (2004):
where h(t + dt) and h(t − dt) were the water depth at (t + dt) s and (t – dt) s. tanβ was the local beach slope, which was ~2.2% during the observation.
Bed Shear Stress Induced by Wave and Current
Bed shear stress is a characteristic index for the seabed hydrodynamic condition, which is related to the near-bed sediment mobilization (Grant and Madsen, 1979). In the study, the bed shear stress due to current (τc) was estimated following the vertical TKE method (e.g., Kim et al., 2000; Hu et al., 2020), given by
where ρ = 1,025 kg/m3 was the density of the seawater, w′ was the vertical turbulent velocity referring to the current contribution, and c = 0.9 was the constant of proportionality under diverse conditions.
The bed shear stress due to waves (τw) was obtained by Soulsby (1997):
where fw was the wave friction factor and Uw was the maximum instantaneous horizontal wave-induced orbital velocity, which was calculated by
where uw and vw were the maximum cross-shore and alongshore wave orbital velocity, respectively. Moreover, fw was estimated by
where ks was the bed roughness height given by 2.5D50 (D50 = 0.125 mm was the median grain size) and A was the bottom orbital semi-excursion, which was estimated by
where Um was the maximum wave orbital velocity over the incident wave cycle, which was determined by wave height, h, and wave period and was roughly equal to Uw of Equation (8). T was the individual wave period defined as the interval of two adjacent points by zero-down crossing.
Thus, the bed shear stress under combined wave and current (τcw) was calculated following Grant and Madsen (1979):
where φcw was the angle between the wave and the current. The current direction (φc) was obtained by cross-shore and alongshore mean velocity (um and vm):
The wave direction (φw) was derived from the maximum number of direction counts of each measurement burst, where the instantaneous wave direction was acquired by instantaneous cross-shore and alongshore wave orbital velocity (uw and vw) in the form similar to Equation (12).
Calculation of Sediment Mobility Number
The sediment mobility number (ψ), which was defined as the ratio of the driving force to the resisting force on the sands over the seabed, was usually used to reflect the dynamics of the bottom boundary layer and the bedform morphology (Dingler and Inman, 1976; Nielsen, 1981). The mobility number was defined as
where s = 2.65 was the specific density of the sand, and Um and D50 were the maximum wave orbital velocity and median grain size, respectively.
Normalization of Data Time Series
To detect the relationship between the intra-tidal variations of SSC, bed shear stress (τ), h, and bed level (reflected by the distance of the seabed to the DSP), the data on these parameters were normalized against relative tidal phases, , and then phase-averaged. The obtained normalized data (y(k)) were expressed as follows:
where x(k) were the original measured data, k = 1, 2, 3,…n was the burst sequence of within tidal cycle, and max(x(k)) and min(x(k)) were the maximum and minimum values, respectively, of the original data of each tidal cycle.
Then, the normalized data mentioned above were divided into 20 ensembles, and the ensembles at the same normalized time () were averaged to obtain the relative data set of DSP, SSC, τw, and τc.
Results
Hydrodynamics and Suspended Sediment Concentration Variations
The measured data went through 13 tidal cycles (marked as T1 to T13, respectively, where one tidal cycle was defined from low tide to the following low tide, Figure 2A), during which the highest h of each tide cycle ranged between 0.75 and 2.81 m throughout the observation. Additionally, h ranged between 1.12 and 5.55 m at Site B (Figure 2H). Accordingly, T1–T3 and T9–T10 were subjected to middle tide regimes, and T4–T8 was under neap tide regimes, while T11–T13 were encountered with spring tide regimes (Figure 2A).
At Site A, the Hs varied between 0.16 and 0.6 m during the first three tidal cycles (T1 to T3), and it did not show a positive relationship with h. The Hs increased abruptly over the following six tidal cycles due to the breakout of local wind. The maximum h reached 0.94 m at the high water level of T9. Then, the Hs began to decrease, and the minimum h of 0.12 m occurred at a high tide of T13. It was noted that the averaged tidal-cycle Hs ranged between 0.21 and 0.65 m during the observation (Table 2). At Site B, Hs ranged from 0.10 to 1.01 m and showed a similar variation trend compared with Site A during the observation (Figures 2B,I). Thus, we considered that the beach experienced two kinds of wave conditions (Masselink et al., 2006, 2007), i.e., moderate wave conditions (T4 to T9, tidal cycle-averaged Hs approximately >0.5 m) and low-energy wave conditions (T1 to T3 and T10 to T13, tidal cycle-averaged Hs < 0.5 m). Accordingly, both the significant wave period (Ts) fluctuated between 2.7 and 6.8 s at Sites A and B. However, the Ts seemed to display no significant variation trend at Site A, while it showed a positive correlation with the h at Site B (Figures 2B,I). During the observation, the incident wave direction ranged between 182 and 240°, and the average of 212° (Figure 2C) indicated that Yintan Beach was dominated by southwest waves, which advanced obliquely with the alongshore sandbar (208°, relative to the north direction).
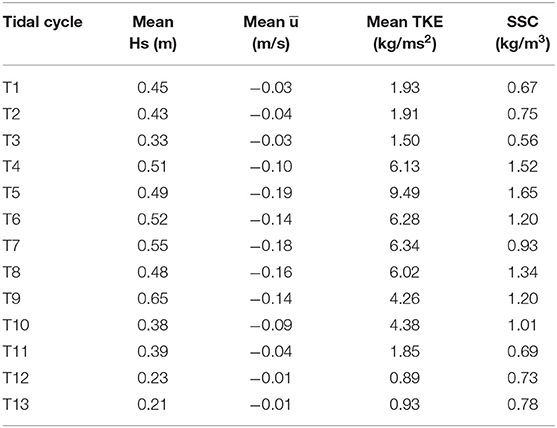
Table 2. Tidal cycle-averaged significant wave height (Hs), cross-shore velocity (), turbulent kinetic energy (TKE), and near-bed suspended sediment concentration (SSC) of the observation at Site A.
The mean cross-shore velocity () and alongshore velocity () were weak and showed similar variation trends during the initial three tidal cycles (T1 to T3) and the last two tidal cycles (T12 and T13), during which the corresponding maximum values were negative and no more than 0.25 m/s (oriented northwest and offshore for and , respectively). However, from T4 to T11, both and increased obviously and tended to maintain large levels at low h, with the peaks up to −0.29 and 0.50 m/s, respectively. At Site A, the averaged tidal-cycle ranged between −0.01 and −0.19 m/s during the observation.
The TKEs were relatively small in T1–T3 and T11–T13, and they ranged between 4 × 10⁻⁵ and 0.006 m2/s2 at Site A (Figure 2E). Meanwhile, higher TKEs occurred at a relatively low h. During T4 and T10, the TKEs tended to be generated constantly in the water column, corresponding to large Hs and neap tides, during which the peak TKE (close to 0.016 m2/s2) occurred at the end of the ebb tide of T4 and the high tide of T5.
The ψ mainly varied between 40 and 240 for T1, T2, T3, T10, and T11 (ψ ranged from 3 to 203), while it was primarily lower than 40 for T12 and T13 (0–63) at Site A (Figure 2F). During the rest of the tidal cycles, almost all the ψ were larger than 40 and the ψ were even >240 during T7 and T9, where large Hs and relatively low tidal ranges coincided. The variations of ψ indicate that three kinds of seabed morphology existed during the observation, including vortex ripple, post-vortex ripple, and plane seabed.
The near-bed SSCs showed two kinds of variations in magnitude during the observation; for instance, SSCs mainly ranged between 0.4 and 5.3 kg/m3 during T4 to T10 and varied from 0 to 3.4 kg/m3 for the rest of the tides. It is noteworthy that fewer sediments were suspended into the water column during high tide, while more large SSCs occur at low h (0.4–0.8 m) for the beach face that commonly suffered from relatively strong surf zone processes within such h ranges. In summary, larger sediments were suspended into the water column by larger Hs as larger SSCs (SSC = 0.93–1.65 kg/m3) occurred under moderate wave conditions (Hs = 0.48–0.65 m).
Bed Level Changes Under Different Tidal Cycles
The bed level changes could be well-reflected by the distances between the seabed and the DSP, which were recorded by the ADV at the beginning and the end of each burst. As shown in Figure 3A, the distances between the seabed and the DSP (note that a larger DSP indicated a lower bed level and vice versa) ranged between 163.4 mm at the high tide of T3 and 330.3 mm at the start of the flood tide of T4. By comparing the tidal cycle-averaged DSP, the temporal variations of bed level changes could be identified. As shown in Table 3, the variations of the adjacent tidal cycle-averaged DSPs ranged between −45.7 and +30.1 mm throughout the 13 tidal cycles. Reflected by the SD of intra-tidal bed level changes over each tidal cycle (Table 3), the largest amplitude (SD = 23.39) of tidal-cycle bed level changes occurred over T5, which was under the combination of neap tide and moderate wave conditions, while the smallest amplitude (SD = 3.73) of tidal-cycle bed level changes occurred over T13, which was subjected to spring tide coupled with low energy wave conditions.
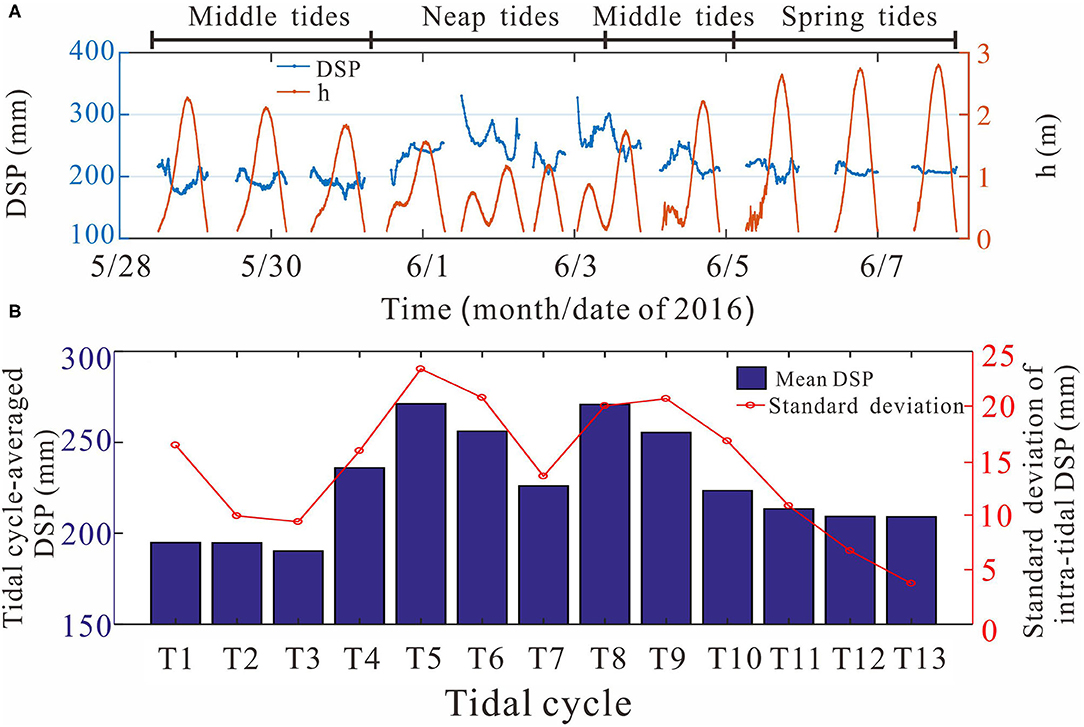
Figure 3. Time series of (A) distance of seabed to acoustic Doppler velocimeter (ADV) probe (DSP, blue line) against h (red line); (B) tidal cycle-averaged distance of the seabed to the ADV probe (DSP, blue bars) and the SD of the intra-tidal distance of the seabed to the ADV probe of each tidal cycle (red circles and lines).
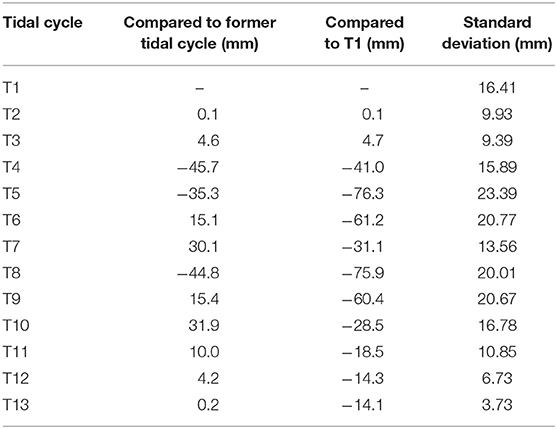
Table 3. The comparison of tidal cycle-averaged DSPs between different tidal cycles (negative value indicated erosion and positive value indicated accretion for beach bed level), and the standard deviation of intra-tidal bed level changes of each tidal cycle.
The variations of tidal-cycle bed levels showed distinctive characteristics in different tidal regimes and wave conditions (Table 4). During T4 and T8, which were subjected to neap tide regimes, the tidal cycle-averaged DSP was 252.1 mm, which meant that the bed level decreased by 58.8 mm compared with the preceding middle tides. During T9–T10, which were in middle tide regimes, the tidal cycle-averaged DSP was 239.5 mm, which indicated that the bed level increased by 12.6 mm compared with the preceding neap tides. Finally, during T11–T13, which were subjected to spring tide regimes, the tidal cycle-averaged DSP was 210.6 mm, which indicated that the bed level further increased by 28.9 mm compared with the preceding middle tides. Noticeably, the tidal cycle-averaged DSP of T13 was 14.4 mm smaller than that of T1, which indicated that the beach face was eroded as a whole throughout the entire field observation. Moreover, larger amplitudes (SD = 18.72) of tidal-cycle bed level changes occurred under both neap and middle tides, while the smaller amplitudes (SD = 7.11) of tidal-cycle bed level changes occurred under spring tides by comparing the SDs of their tidal-cycle bed level changes.
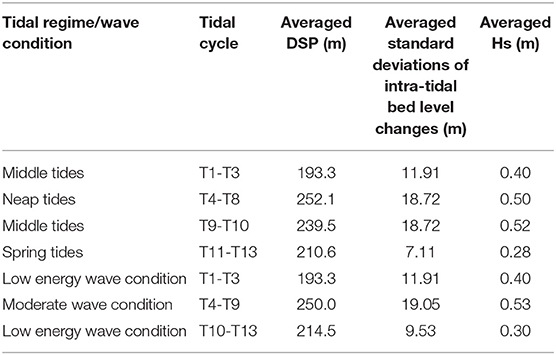
Table 4. The statistics of distances of seabed to ADV probe over tidal cycles (averaged DSPs), standard deviations of intra-tidal bed level changes, and averaged significant wave heights (averaged Hs) classified by tidal regimes and wave conditions.
According to the wave conditions, the variations of the tidal cycle-averaged DSPs were mainly classified as three stages (Table 4), and the three stages correspond to T1–T3 (middle tides, mean Hs = 0.4 m, low-energy wave conditions), T4–T9 (neap tides to middle tides, mean Hs = 0.53 m, moderate wave conditions), and T10–T13 (middle tides to spring tides, mean Hs = 0.3 m, low-energy wave conditions), with the mean DSP equal to 193.3, 250, and 214.5 mm, respectively. The time series of the DSPs indicated that the bed levels experienced an overall erosion (−56.7 mm) during T4–T9 (moderate wave conditions) relative to T1–T3 (low-energy wave conditions), followed by a gradual deposition (+35.5 mm) during T10–T13 (low-energy wave conditions) until the end of the observation. Hence, it was suggested that the beach face tended to gain accretion under low-energy wave conditions and erode under moderate wave conditions. Meanwhile, the averaged SD of the tidal-cycle bed level changes over T4–T9, which were subjected to moderate wave conditions and neap to middle tides, was 19.05. In contrast, the averaged SDs over T1–T3 (middle tides) and over T10–T13 (middle to spring tides) were 11.91 and 9.53, respectively, which were merely 0.63 and 0.5 times as large as that over T4–T9 (Table 4). Hence, the comparison of the SDs of bed level changes indicated that bed level changes during relatively smaller tidal ranges (neap tides) were more pronounced and were sensitive to breaking wave and surf zone processes, while the variations of bed level changes under larger tidal ranges (spring tides) were limited (Figure 3B).
Comparison of Bed Level Variations Between Flood and Ebb Tides
Figure 4 shows the detailed time series of DSP during the flood and ebb processes of the observed 13 tidal cycles, respectively. For almost all the flood tides, the variations of DSP displayed a significant negative linear correlation (R ranged from −0.73 to −0.99) with h, despite of the increasing trends occurring during the low h, except T4 (Figure 4D). The negative linear correlation between DSP and h still existed during the ebb tides for all the tidal cycles (Figures 4N–Z). However, the correlation between DSP and h was slightly poorer in terms of the correlation coefficients, which varied between −0.54 and −0.91. The significant negative correlation between DSP and h during both flood and ebb tides indicated the intra-tidal tendency of bed level changes as the bed level increased during the flood and then decreased as ebb tide proceeded.
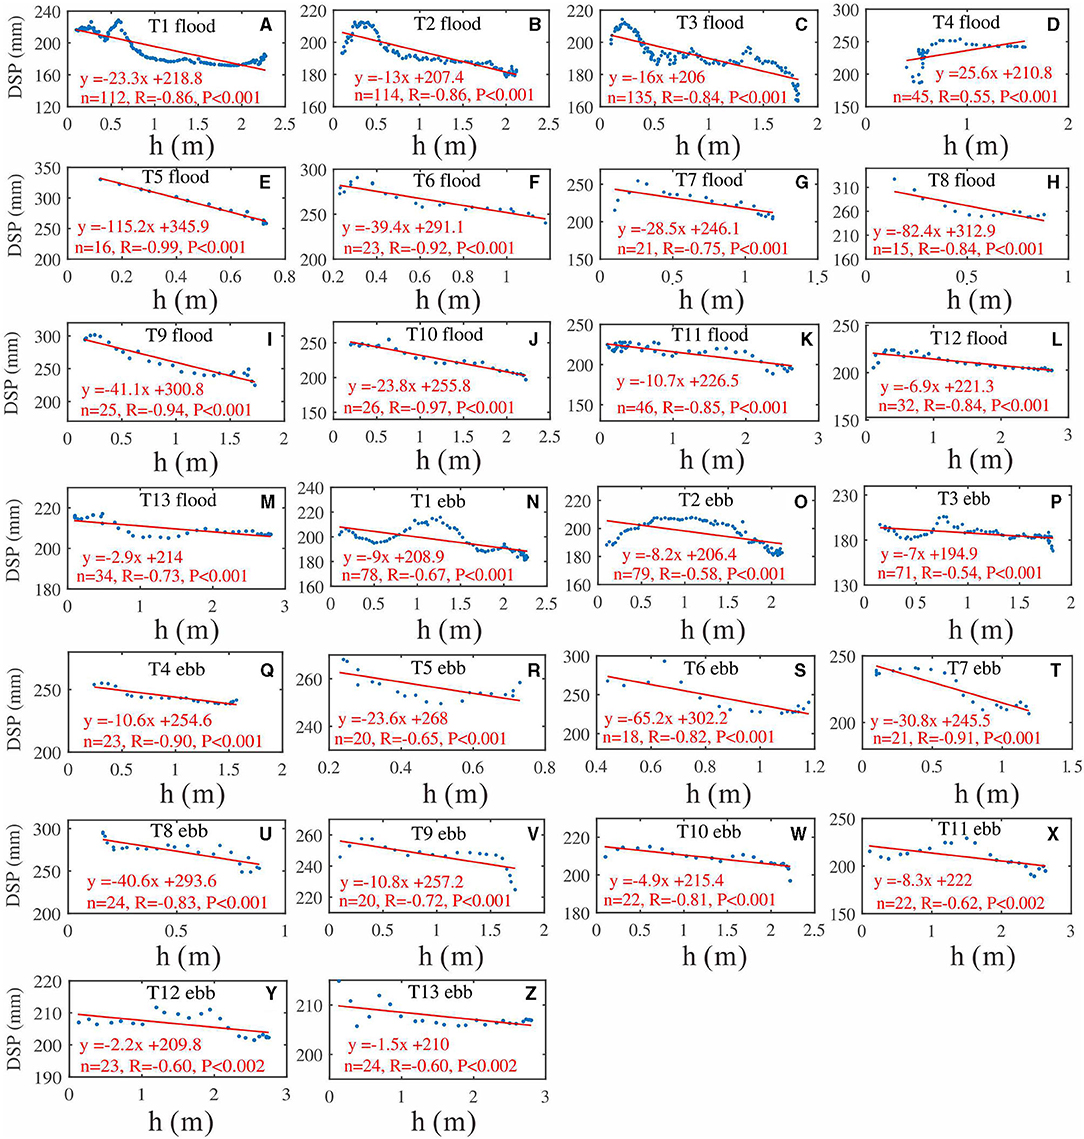
Figure 4. DSP against water depth during the flood processes of (A) T1, (B) T2, (C) T3, (D) T4, (E) T5, (F) T6, (G) T7, (H) T8, (I) T9, (J) T10, (K) T11, (L) T12, (M) and T13 and during the ebb processes of (N) T1, (O) T2, (P) T3, (Q) T4, (R) T5, (S) T6, (T) 7, (U) T8, (V) T9, (W) T10, (X) T11, (Y) T12, and (Z) T13.
By statistics, the bed level showed a net increase during flood tides for all the tidal cycles except T4, where bed level changes were equal to −31.2 mm (Figure 5). Additionally, the larger net bed level changes occurred at T5 and T8–T10, accompanied by their values over 50 mm. In contrast, the bed level always showed a net reduction during the ebb tide for all the tidal cycles when the seabed was submerged. The maximum net bed level change during ebb tides was −41.1 mm, which occurred at T8. All the other net bed level changes during the ebb tides were smaller than −30 mm. On the other hand, the larger amplitude of bed level variations occurred more during flood tides (mean SD of bed level variations = 15.26 mm) than ebb tides (mean SD of bed level variations = 8.68 mm) since the larger SDs of DSP were obtained during flood tides for almost all the tidal cycles except T6. However, the relative magnitude of the net bed level changes between flood and ebb tides did not decide the net bed level changes over an entire tidal cycle, as not all the submerged bed level data were included, but qualitatively indicated the intra-tidal tendency of bed level changes.
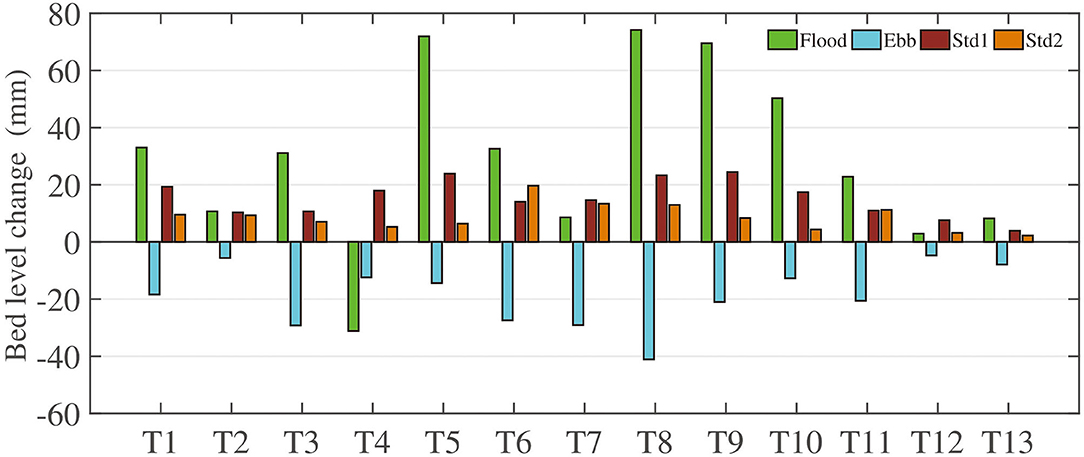
Figure 5. Net bed level changes of the flood tide (green bar) and ebb tide (light blue bar) of each tidal cycle, and the SD of bed level changes during the flood tide (Std1, brown bar) and ebb tide (Std2, orange bar) of each tidal cycle. Note that not all the submerged bed level data were included.
Discussions
The Factors Affecting Bed Level Changes Under Different Tidal Ranges
Distinct characteristics of bed level changes under different tidal ranges existed widely in the coastal area, which resulted from the coupling tides, wave processes, and beach slope, etc. In this study, it has been found that the bed level changes during neap tides were more pronounced than those under spring tides (Figure 3). To further detect the responsive features of bed level changes under tides and waves, we compared the bed level changes for a successive 30 min (burst time of ADV) against different Hs (Figure 6A) based on the recorded DSP series (Figure 3A). In general, the mean magnitude of the bed level changes at the interval of 0.4 m of h was not significant (<2 mm), and the maximum variation amplitude (SD = 10.28) occurred at a relatively low h (at an h of 0.4–0.8 m). At the same time, the minimum variation amplitude (SD = 3.45) of bed level changes occurred at an h of 1.2–1.6 m which were beyond the high water level of the neap tides. In addition, the secondary minimum variation amplitude (SD = 4.01) of the bed level changes existed at an h of 2.4–2.8 m, which was the highest water depth during the observation and took place only with the arrival of spring tides. The responsive characteristics of the beach bed level changes under different Hs might be consistent with the aforementioned results that bed level changes during a neap to middle tides were more pronounced than those under middle to spring tides, which was associated with the tide-related horizontal tidal translation rate (Vtide), h, tidal range, wave processes, etc.
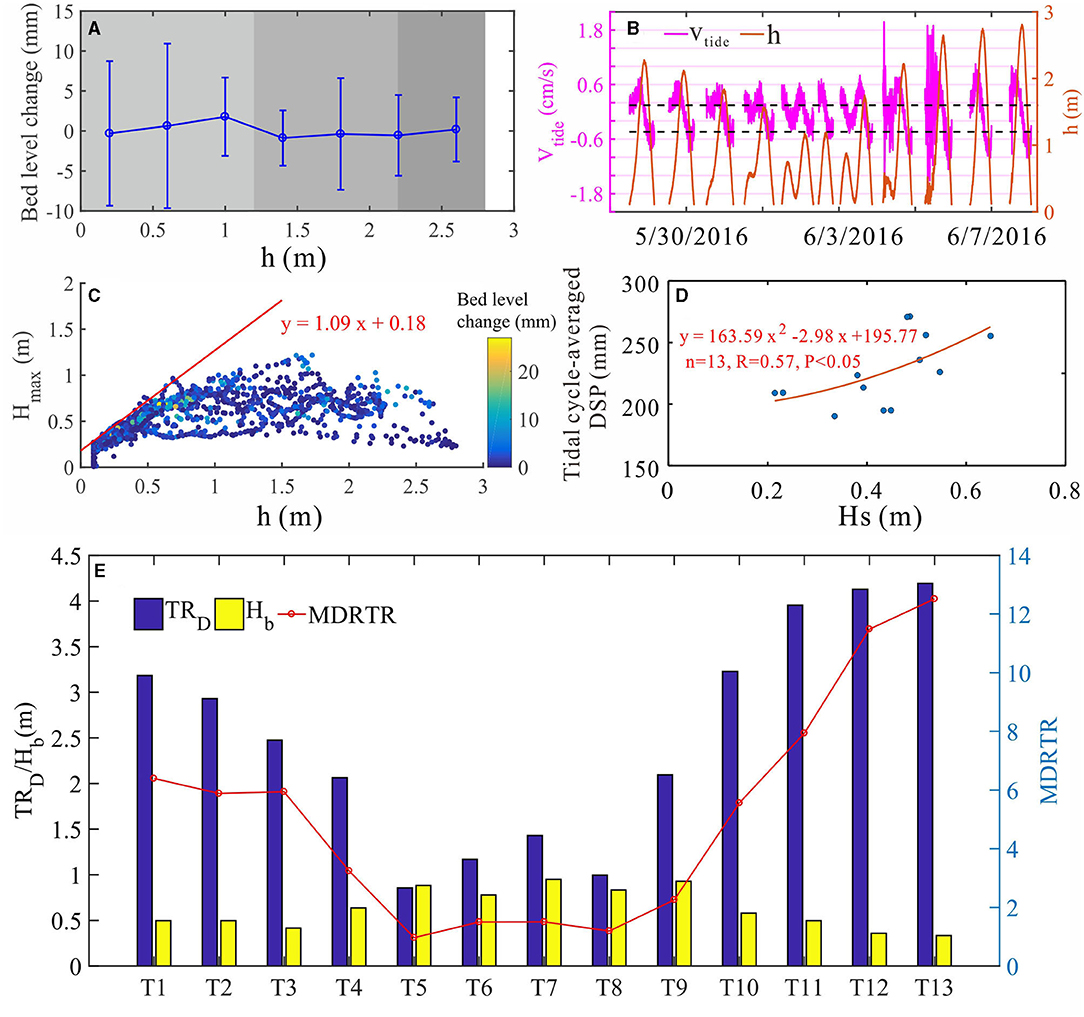
Figure 6. (A) Bed level changes and the corresponding SD of the bed level for each 30 min against mean h and the three boundaries of different areas at h = 1.2, 2.2, and 2.8 m indicate the highest h of the neap tide, middle tide, and spring tide, respectively; (B) time series of averaged horizontal tidal translation rate (Vtide, magenta line) and h (red line). Two horizontal dashed lines indicate h = 1.2 and 1.6 m. Note that Vtide was abnormal at the start of the flood tide during June 4 (T10) and June 5 (T11) due to the high-frequency fluctuation of h; (C) maximum wave height (Hmax) and bed level changes of each 30 min against water depth (h), the red line indicates the limitation of h on maximum wave heights (Hmax); (D) tidal cycle-averaged DSP against tidal cycle-averaged Hs over the observation; (E) daily tide range (TRD, blue bar), breaker height (Hb, yellow bar), and mean daily relative tide range (MDRTR, red circle and red line) of each tidal cycle.
The horizontal tidal translation rate, a variable obtained by h and local beach slope, decided the residence times of the different wave processes (shoaling, breaking, and surf processes in this study), which would influence the duration of the wave reworking on the beach seabed and the relaxation time of the bed level changes (Masselink and Anthony, 2001). For spring tides (T11–T13), all the maximum averaged Vtide exceeded 0.6 cm/s and reached 1 cm/s, which were significantly larger than those (smaller than 0.6 cm/s) under neap tides (T5–T8) (Figure 6B). The larger tidal range during spring tides induced a large Vtide during fast flooding and ebbing tides, which led to the rapid shifting of the three kinds of wave processes and enhancing the beach morphological relaxation at the measurement location. As a result, the bed level changes were subdued and limited during the middle tide level of spring tide (1.2–1.6 m of h, Figure 6B) where Vtide was largest, which was consistent with the results depicted in Figure 6A and demonstrated that the bed level changes under spring tides were limited.
Tide-modulated water depth (h) conducted a limitation on the incident wave heights (identified by the red line, y = 1.09x + 0.18) through energy dissipation and wave breaking, etc., by which the tide exerted influence on the beach bed level changes (i.e., Kroon and Masselink, 2002). As shown in Figure 6C, for relatively low h, especially h < 0.8 m, the maximum wave height (Hmax) has a high possibility to reach the extremity where the wave breaker occurred. At the same time, the wave height was positively correlated with the h where the wave break occurred (Figure 6C), which was consistent with the relationship between Hs and h during neap tides (T4–T8, Figures 2A,B). In contrast, at an h > 2.2 m, which showed up only at spring tides, the Hmax was far from the extremity under non-storm conditions, which meant that, during normal wave conditions, the beach was seldom subjected to breaking wave conditions during spring tides for a fixed location. Hence, at neap tides whose tide-modulated h and tidal ranges were both smaller (largest h was 1.2 m during neap tides in the measurement location) than middle and spring tides, pronounced bed level changes would take place due to the prolonged wave reworking associated with breaking wave and surf zone processes. Therefore, both the occurrences of the maximum and secondary minimum variation amplitudes of bed level changes in Figure 6A could be reasonably explained.
Wave height played an important role in the bed level changes at the surf zone, which was directly demonstrated by the larger DSP under moderate wave conditions (T4–T9, Table 4). According to the relationship between averaged tidal-cycle Hs and DSP, the larger the Hs was, the larger the mean DSP was over a tidal cycle (Figure 6D). Hence, it was indicated that incident wave height was a decisive factor for the variation tendency of the beach face. Larger Hs would lead to the tendency of the beach face to erode at the surf zone since more SSCs produced by larger Hs were transported seaward by large offshore-directed mean currents (Table 2).
The relative tide range (modified as mean daily relative tide range, i.e., MDRTR in this study) was frequently used to characterize the relative importance of the swash, surf zone, and shoaling wave processes on the beach profiles, which synthesized the influence of tide range (modified as daily tide range, TRD) and breaker height (Hb) on bed level changes (Masselink and Short, 1993; Qi et al., 2010). During the observation, the calculated TRD decreased continually from 3.19 m at T1 to its minimum, 0.86 m, at T5, and then fluctuated over neap tides (0.85 m at T5 to 1.43 m at T7), followed by a gradual increase with a maximum of 4.19 m at T13 (Figure 6E). However, the variations of the mean Hb displayed an opposite tendency relative to TRD and Hb, ranging between 0.34 and 0.95 m. As a result, the synthetic MDRTR varied between 0.97 and 12.52, with a similar variation trend relative to TRD (Figure 6E). During the neap tides (T5–T8) in the observation, the maximum MDRTR was merely 1.51, which is significantly lower than 3, while the MDRTRs were primarily between 3 and 7 during middle tide (T1–T4 and T9–T10) except T9 (MDRTR = 2.26), and that varied between 7 and 13 (7.94–12.52) under spring tides (T11–T13). Thus, it was deduced that, during the neap tides where MDRTR < 2, the entire beach profile was dominated by surf wave conditions (Masselink and Short, 1993), and the bed level changes were pronounced due to the wave breaking-induced high SSCs and strong undertows (Longuet-Higgins and Stewart, 1964; Rafati et al., 2021). However, the bed level changes would be limited and subdued during spring tides where 7 < MDRTR < 13, for the breaking wave and surf zone processes operated for <50% of the time near the mean sea level where the instruments were located and the bed level changes were mainly subjected to shoaling wave processes and gentle wave reworking.
Factors on Intra-Tidal Bed Level Variation
The intra-tidal variations of bed levels resulted from a combination of complex hydrodynamics (tide-modulated h, waves, mean current, and turbulent motions) and suspended sediment concentration in the water column. Illustrated by the time series of the DSP during flood and ebb tides, the significant negative correlations between the DSP and h during both flood and ebb tide processes for each tidal cycle except T4, where the incident waves were enhanced abruptly (Figure 4), indicating an intra-tidal tendency of increase during flood tides and decrease during ebb tides in the bed level variations. Hence, it was implied that tide-modulated h might affect the variations of bed levels. As expected, the relative DSPs were highly correlated (R = −0.72, p < 0.001, Figure 7) with relative h in terms of all the tidal cycles not including T4, where the sediment suspension mechanism and sediment transport pattern have been changed, induced by suddenly enhanced wave climates (Grasso and Ruessink, 2011), which is consistent with the results depicted in Figure 5 that overall net accretion and erosion occurred during flood and ebb tides, respectively. The periodic behavior of the overall net accretion followed by the overall net erosion in the bed level, which was controlled by tide-modulated h, could be easily understood since h regulated the temporal variations of bed shear stress, wave motions, currents, TKEs, and SSCs in the near bottom.
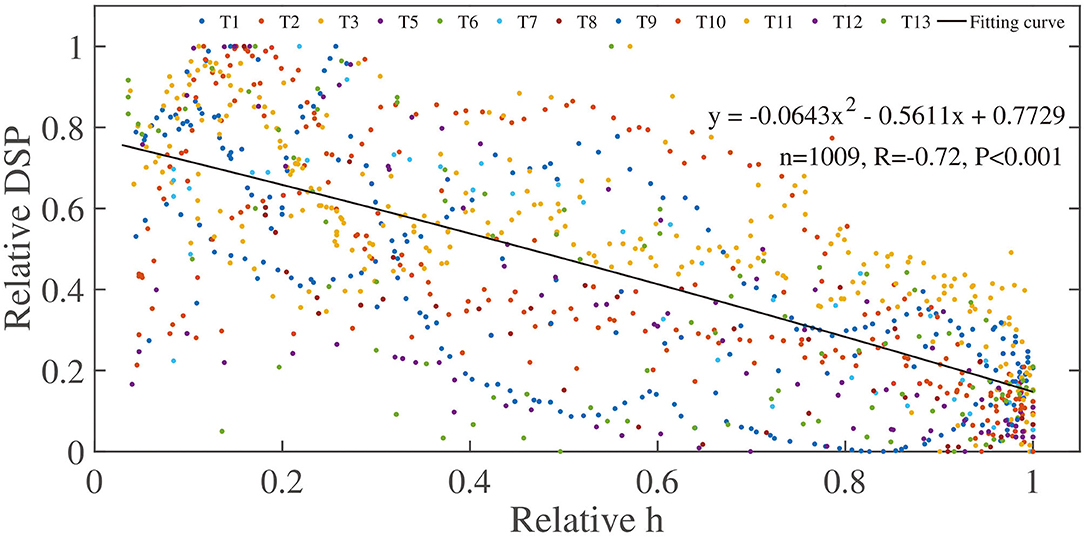
Figure 7. The distribution of the relative DSP against the relative h from all tidal cycles, except T4 where wave climate was enhanced abruptly.
To be specific, the wave-induced bed shear stress (τw) tended to be bimodal and exceeded critical shear stress (τcr) for the majority of the time, except at T12 and T13 (Figure 8A), while the current-induced bed shear stress was smaller than the τcr for most of the time excluding the moments where h was in extremely low values and the beach was subjected to moderate wave conditions (T4–T9, Figure 8A). Under this circumstance, the mean current might not be the main factor affecting the bed level changes and τw could be used to stand for the strength of the near-bottom boundary layer. Moreover, the DSPs were positively correlated with τw (R = 0.59, p < 0.001, Figure 8B), which meant that wave height was a major dynamic factor driving the occurrence of bed level changes. Thus, the larger τw near the seabed indicated a larger DSP (i.e., lower bed level) and overall erosion of bed level, since the waves acted as a stirring mechanism, separated the sediments from the seabed, and then suspended it into the water column (Dally and Dean, 1984; Winterwerp and van Kesteren, 2004; Pang et al., 2020).
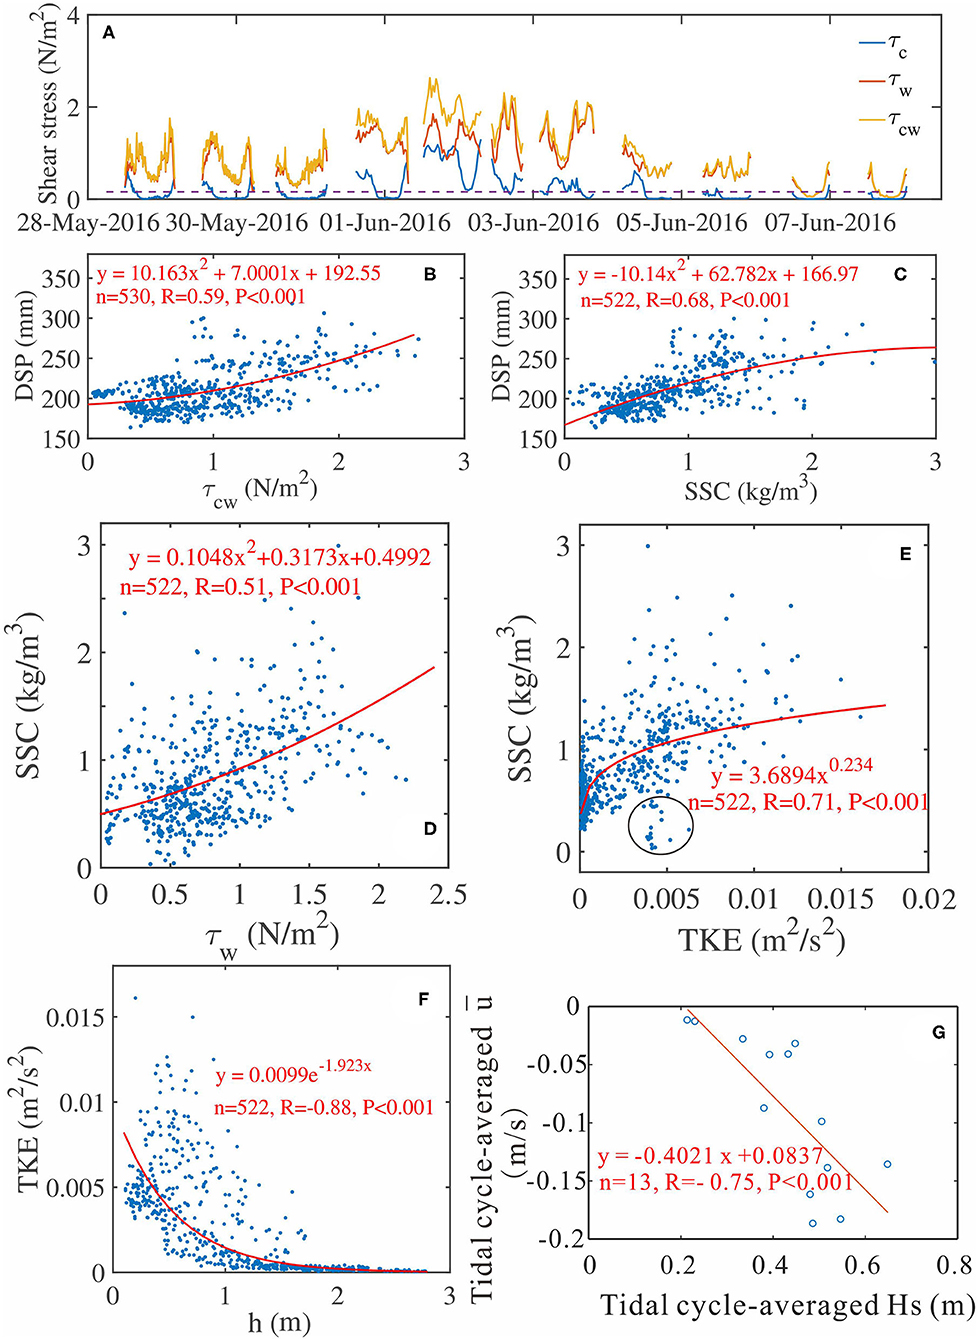
Figure 8. (A) Variations of bed shear stress induced by combined wave and current (τcw, yellow line), induced by wave (τw, red line), and induced by current (τc, blue line), respectively. The horizontal dashed line indicated the critical bed shear stress (0.16 N/m2); (B) DSP against bed shear stress induced by wave (τw) from all tidal cycles; (C) DSP against suspended sediment concentration (SSC) from all tidal cycles. (D) Relationship between suspended sediment concentration (SSC) and bed shear stress induced by wave (τw) for all tidal cycles; (E) relationship between SSC and TKE for all tidal cycles. The data points within the black circle indicated surface-generated TKE did not reach the seabed and stirred up the sediments into the measurement elevation at extremely low h; (F) relationship between TKE and h; (G) tidal cycle-averaged cross-shore velocity () against tidal cycle-averaged Hs throughout the observation.
However, the bed level changes were not only affected by hydrodynamics but also by the suspended sediment concentration near the seabed, for the net bed level changes were determined by the balance between the sediment erosion flux induced by bed shear stress and the sediment deposition flux associated with the amount of settling suspended sediments (Winterwerp and van Kesteren, 2004; Shi et al., 2017). In this study, large SSCs tended to occur at a relatively low h (0.4–0.8 m) and maintained a high level during moderate wave conditions (Figure 2G and Table 2), which was in accordance with the variations of DSPs (Figure 3A). Hence, SSC was considered to be a better indicator for the variations of bed levels than waves, for the variation pattern of the SSC was similar to that of DSP (Figures 2G, 3A), which was demonstrated by the better correlation between them (R = 0.68, p < 0.001, Figure 8C). Hence, as the SSC gradually increased, more sediments were suspended into the water column along with the seabed erosion, which led to a larger DSP on account of the effect of a lag deposition, associated with turbulent vortices releasing processes (Guillen and Palanques, 1996; Vincent and Hanes, 2002).
Though τw was the primary force driving sediment grain movement and explained parts of suspended sediment concentrations within the water (R = 0.51, p < 0.001, Figure 8D), a poor correlation between SSC and τw might occur under moderate wave conditions (Figure 11C) where the mean current was strong (maximum and increased up to −0.29 and 0.5 m/s, respectively) and bedforms might have transformed (ψ was over 240 for parts of time, which indicated a plane seabed, Dingler and Inman, 1976). The TKE originating from the wave breaking or friction between the flow and the seabed ejected and pumped sand-laden vortices into higher elevations (Aagaard and Jensen, 2013). Hence, TKE was a direct factor determining the level of SSCs, being the most important dynamic factor affecting the bed level change, and this was illustrated by the high correlation coefficient (R = 0.71, p < 0.001) between TKE and SSC, except some moments that surface-generated TKE did not approach the seabed and stirred up the sediments into the measurement elevation at an extremely low h (black circle, Figure 8E). In addition, the distribution of TKE was highly modulated by h, regardless of wave conditions (Figure 8F), it provided further evidence to support the deduction that tide-generated h was a controller on the variations of the bed level associated with Figure 7.
Patterns of Intra-Tidal Bed Level Variation Under Different Wave Conditions
Though the bed level showed an overall increasing trend during flood tides and a decreasing trend during ebb tides for both low-energy and moderate wave conditions (Figures 4, 9A,B), the influence mechanisms on intra-tidal bed level variation were different. During low-energy wave conditions, where the wave height was seldom broken and reached the limitation for short time (Figure 10A), the relative DSP displayed an overall decreasing trend during flood tides and an increasing trend during ebb tides, along with two maximum values during the flood and ebb tides over the normalized tidal cycle (T1–T3 and T10–T13 were normalized and averaged against relative tidal phases to reflect the variation pattern of the intra-tidal bed level), with the largest relative DSP at 0.15 t/T of the tidal cycle, while the relative DSP maintained a low level at high tide (0.5 < t/T <0.7). At the same time, the variation pattern of the relative SSC and τw behaved similarly to the relative DSP (Figures 9A,C,E), which indicated that waves and the related SSC were responsible for the intra-tidal variation of the bed level under low-energy wave conditions. Under this circumstance where both u and the horizontal advection process were weak, the similar variation pattern between the relative DSP and SSC might be explained by a lag deposition of suspended sediments, which indicated that, as SSC increased with decreasing water depth, more sediments were stirred up into water from the seabed and a larger DSP and seabed erosion, and vice versa (Guillen and Palanques, 1996; Vincent and Hanes, 2002). Hence, the intra-tidal variation trend of bed levels was explained.
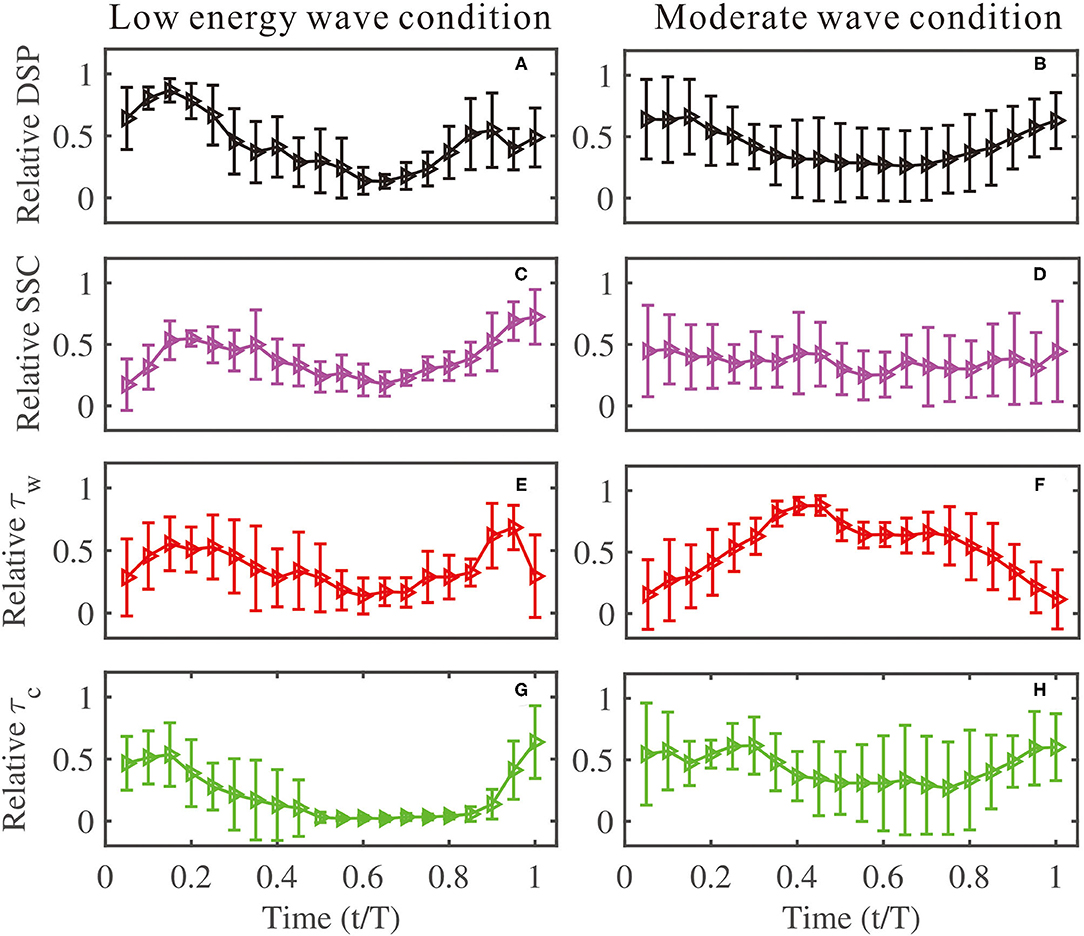
Figure 9. Normalized time series of the DSP (relative DSP, black lines), SSC (relative SSC, magenta lines), bed shear stress induced by wave (relative τw, red lines), and bed shear stress induced by current (relative τc, green lines) against normalized tidal cycle (t/T) under (A,C,E,G) low-energy and (B,D,F,H) moderate wave conditions, respectively. The vertical segments indicated ± one SD.
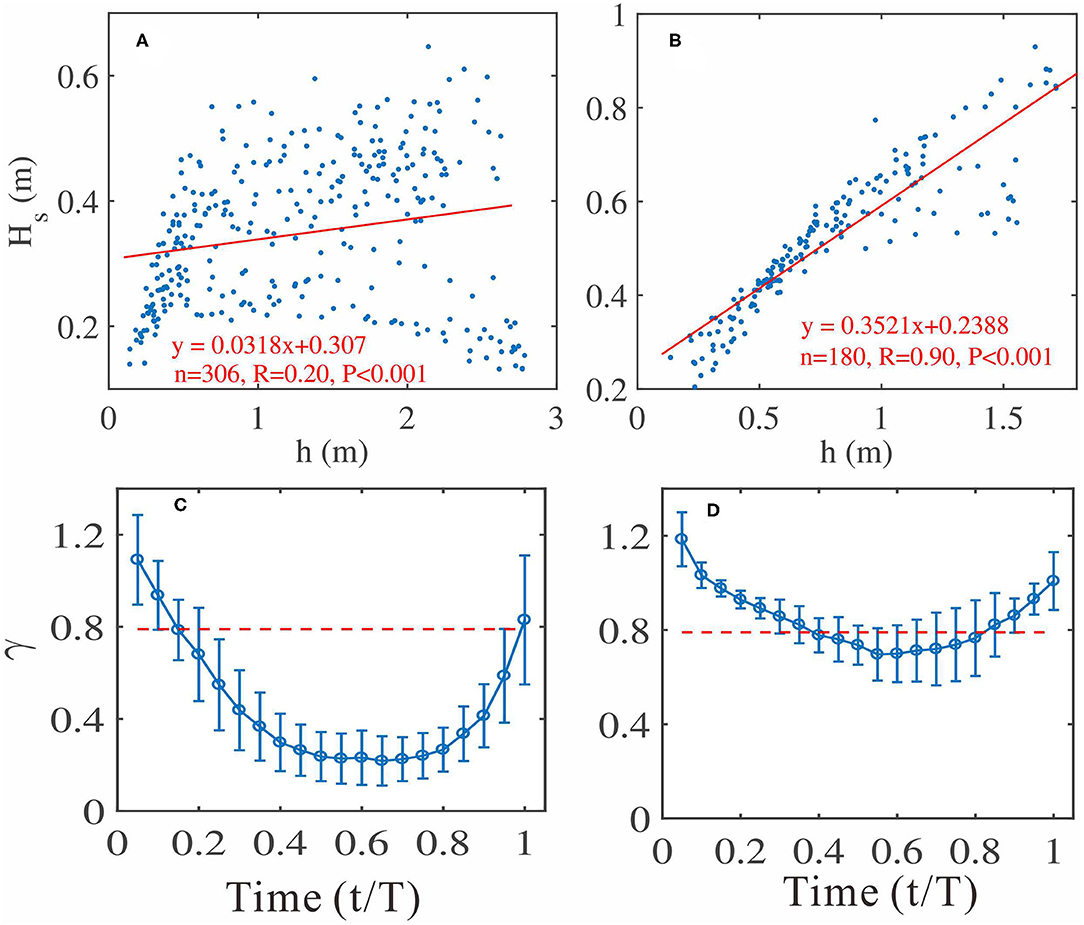
Figure 10. Hs against h under (A) low-energy and (B) moderate wave conditions. Averaged relative wave height (γ) against normalized tidal cycle (t/T) under (C) low-energy wave conditions and (D) moderate wave conditions.
Moreover, extra sediments transported by offshore-directed mean currents from the emersed beach led to the net beach face accretion under low-energy wave conditions, which emphasized the importance of sediment sources for bed level changes. Specifically, at t/T = 0.15, where both relative SSC and τw were at maximum level, the lowest bed level (largest relative DSP) resulted from the balance between the bed shear stress (erosion flux) and large settling SSCs (deposition flux) since the measurement location was close to the breakpoint where the relative wave height (γ) was approximate to 0.78 (t/T = 0.15, Figure 10C) and strong wave-induced bed shear stress occurred as ascribed to the breaker of highly skewed and asymmetric waves (Elgar et al., 2001). On the other hand, though the variation of relative τc showed two maximums at the start and end of the tidal cycle, mean currents would not play an important role in bed level changes under low-energy wave conditions because the τc was lower than the critical bed shear stress (0.16 N/m2) for most of the time.
Under moderate wave conditions, where wind waves were fully developed and limited by h (R = 0.9, Figure 10B), the relative DSP likewise showed a gradually declining trend followed by a gradually increasing trend all along the tidal cycle (T4–T9 were normalized and averaged against relative tidal phases to reflect the variation pattern of the intra-tidal bed level). Meanwhile, the relative SSC showed a similar but inconspicuous variation trend referring to the relative DSP with the correlation coefficient R = 0.54 (Figure 11A), which implied that SSC maintained a good indicator on bed level changes despite wave conditions. In contrast, two maximums occurred along the relative τw at a time of t/T approximately equal to 0.4 and 0.75, which was also ascribed to wave breaking (γ = 0.78 at t/T = 0.4 and 0.75, Figure 10D). Hence, it was implied that wave height was not an indicator for bed level changes in terms of all the wave conditions, based on the inconsistent correlation (R = −0.50, Figure 11B) between them under moderate wave conditions, though waves acted as a stirring mechanism for sediment motions.
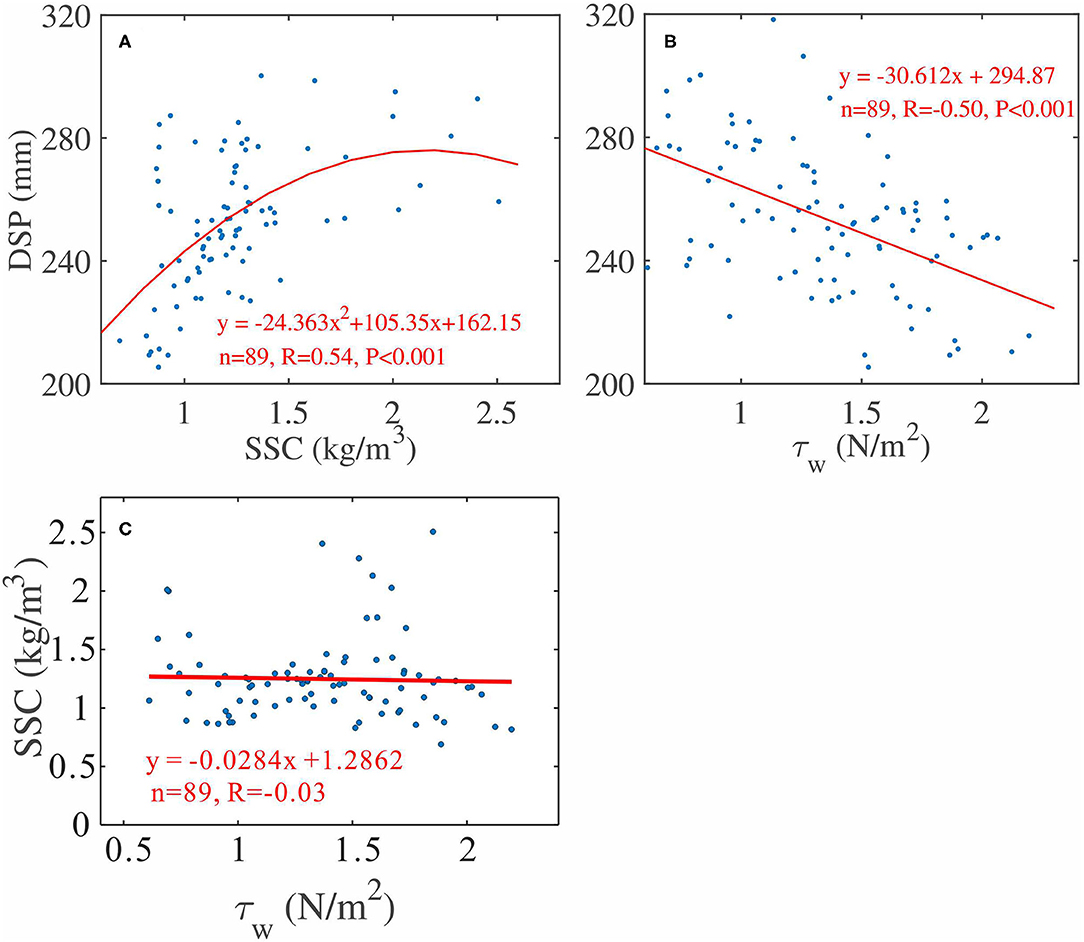
Figure 11. (A) DSP against SSC; (B) DSP against bed shear stress induced by wave (τw); (C) SSC against bed shear stress induced by wave (τw) under moderate wave conditions.
In fact, under moderate wave conditions (T4–T9), the ψ, which originated from the modulation of h on waves, was greater than that under low-energy wave conditions most of the time and even exceeded 240 at T7 and T9. Thus, the dominant way of vertical sediment exchange between the seabed and higher elevation turned to the diffusion process from the advection process, which was due to the bedform transformation from a steep ripple (vortex ripple) to a less steep ripple (post-vortex ripple) or a plane seabed under strong wave-induced currents, characterized by high reference concentrations in the vicinity of the seabed and limited suspended sediments at higher elevations (Dingler and Inman, 1976; Chalmoukis et al., 2020). At this moment, the lag deposition effect of the suspended sediments and the intensity of vertical sediment exchange was weakened compared with a low-energy steeper ripple environment (Lee and Hanes, 1996; Osborne and Vincent, 1996), which broke the foregoing interrelation between waves, measured SSCs, and bed level (Figure 11) and caused different variation patterns among them (Figures 9B,D,F). During these processes, the bed shear stress induced by mean current (τc) exceeded the critical bed shear stress most of the time (Figure 8A), and the current was capable of altering the bedform and dominating the way of the vertical sediment exchange (Chalmoukis et al., 2020). Hence, the influences of mean currents and bedforms on bed level changes were enhanced and highlighted under energetic wave conditions.
However, though the sediment deposition flux induced by the lag deposition effect of suspended sediments was weak during moderate wave conditions, the wave-breaking processes induced strong offshore-directed mean currents (undertow, Figure 2D), which added a great number of extra sediments from the emersed beach to the measurement site, leading to the gradual accretion of the bed level (i.e., a declining trend of the relative DSP). Throughout the course of the ebb tide, the lack of extra sediments from the emersed beach due to the decline in water level would make the strong offshore-directed mean currents (undertows) the main erosive force for the beach face. As a result, the gradual erosion of the bed level (gradual increasing trend of relative DSP) occurred during ebb tides, though weakened τw might bring little deposition flux to the beach face. In summary, h controlled the intra-tidal bed level changes by modulating the effects of waves on sediment resuspension (SSC variation) and vertical sediment exchange (mobility number) under different wave conditions. In addition, the net erosion of bed level over the entire tidal cycle occurred under energetic wave conditions, which mainly resulted from the coupling between larger incident wave-induced strong offshore-directed mean currents (Figure 8G) and large SSCs (Aagaard et al., 2012), associated with the lack of extra sediments from the emersed beach during ebb tides.
Conclusions
An observation, lasting for 12 days and covering the middle tide to and the following spring tide, was conducted over a meso-macro tidal beach, Yintan Beach, which is north of Beibu Gulf, China. The purposes of the study were to detect the characteristics of bed level changes with ADV measurement at intra-tidal and tidal cycle scales, respectively, and to explore the patterns and influence mechanisms of bed level changes under different wave conditions.
1) The variations of the intra-tidal bed level were more prominent during a neap to middle tides (overall erosion of 56.7 mm) than during middle to spring tides (overall accretion of 35.5 mm), which was jointly caused by the wave-breaking probability regulated by h and the relative residence times of the shoaling wave zone, breaker zone, and surf zone that were determined by relative tidal range. The net erosion over the entire tidal cycle mainly resulted from large incident wave heights and the consequent strong offshore-directed sediment transport by mean currents (undertows).
2) The bed level displayed an intra-tidal tendency of increase during flood tides and decrease during ebb tides throughout the course of the tidal cycle. Generally, the variations of the intra-tidal bed level were controlled by h, which modulated the effects of waves on sediment resuspension (SSC variation) and vertical sediment exchange (mobility number) under low-energy and moderate wave conditions.
3) Under low-energy wave conditions, waves and the related SSCs were responsible for the intra-tidal variation of the bed level, and the lowest intra-tidal bed level occurring at 0.15 t/T was ascribed to wave breaking. Under moderate wave conditions, the interrelation between intra-tidal bed level, SSCs, and wave height was broken due to the transformation of vertical sediment exchange from the advection process to the diffusion process, during which the influence of the mean current and bedform on bed level changes was highlighted.
Data Availability Statement
The original contributions presented in the study are included in the article/supplementary material, further inquiries can be directed to the corresponding author/s.
Author Contributions
Every author has seen and contributed to the final draft. HH, YL, and ZD conceived of this research. WP, XZ, ZD, and SL conducted the field observations. WP performed the main data analysis. WP, XZ, and ZD wrote this paper. XZ, ZD, HH, and YL contributed to the discussion. All authors discussed the results and commented on the manuscript.
Funding
This study was supported by the National Natural Science Foundation of China (NSFC) (41930537 and 41866001) and the Key Projects of Science and Technology of Guangxi Province (AB21076016).
Conflict of Interest
The authors declare that they have no known competing financial interests or personal relationships that could have appeared to influence the work reported in this paper.
Publisher's Note
All claims expressed in this article are solely those of the authors and do not necessarily represent those of their affiliated organizations, or those of the publisher, the editors and the reviewers. Any product that may be evaluated in this article, or claim that may be made by its manufacturer, is not guaranteed or endorsed by the publisher.
Acknowledgments
The authors thank Jinghua Gu, Zhenpeng Ge, Jie Wang, and Binbin Ma for their assistance in the field.
References
Aagaard, T., Black, K. P., and Greenwood, B. (2002). Cross-shore suspended sediment transport in the surf zone: a field-based parameterization. Mar. Geol. 185, 283–302. doi: 10.1016/S0025-3227(02)00193-7
Aagaard, T., Greenwood, B., and Hughes, M. (2013). Sediment transport on dissipative, intermediate and reflective beaches. Earth Sci. Rev. 124, 32–50. doi: 10.1016/j.earscirev.2013.05.002
Aagaard, T., Hughes, M., and Andersen, M. S. (2006). Hydrodynamics and sediment fluxes across an onshore migrating intertidal bar. J. Coast. Res. 22, 247–259. doi: 10.2112/04-0214.1
Aagaard, T., Hughes, M., Baldock, T., Greenwood, B., Kroon, A., and Power, H. (2012). Sediment transport processes and morphodynamics on a reflective beach under storm and non-storm conditions. Mar. Geol. 326–328. doi: 10.1016/j.margeo.2012.09.004
Aagaard, T., and Jensen, S. G. (2013). Sediment concentration and vertical mixing under breaking waves. Mar. Geol. 336, 146–159. doi: 10.1016/j.margeo.2012.11.015
Aagaard, T., Kroon, A., Andersen, S., Sørensen, R. M., Quartel, S., and Vinther, N. (2005). Intertidal beach change during storm conditions; Egmond, the Netherlands. Mar. Geol. 218, 65–80. doi: 10.1016/j.margeo.2005.04.001
Aagaard, T., Nielsen, J., Davidson-Arnott, R. G. D., Greenwood, B., and Nielsen, N. (1998b). Coastal morphodynamics at Skallingen, SW Denmark: high energy conditions. Dan. J. Geogr. 98, 20–30. doi: 10.1080/00167223.1998.10649407
Aagaard, T., Nielsen, J., and Greenwood, B. (1998a). Suspended sediment transport and nearshore bar formation on a shallow intermediate-state beach. Mar. Geol. 148, 203–225. doi: 10.1016/S0025-3227(98)00012-7
Agredano, R., Cienfuegos, R., Catalán, P., Mignot, E., Bonneton, P., Bonneton, N., et al. (2019). Morphological changes in a cuspate sandy beach under persistent high-energy swells: Reaca Beach (Chile). Mar. Geol. 417:105988. doi: 10.1016/j.margeo.2019.105988
Alsina, J. M., and Cáceres, I. (2011). Sediment suspension events in the inner surf and swash zone. Measurements in large-scale and high-energy wave conditions. Coast. Eng. 58, 657–670. doi: 10.1016/j.coastaleng.2011.03.002
Andersen, T. J., Pejrup, M., and Nielsen, A. A. (2006). Long-term and high-resolution measurements of bed level changes in a temperate, microtidal coastal lagoon. Mar. Geol. 226, 115–125. doi: 10.1016/j.margeo.2005.09.016
Anthony, E. J., Levoy, F., and Monfort, O. (2004). Morphodynamics of intertidal bars on a megatidal beach, Merlimont, Northern France. Mar. Geol. 208, 73–100. doi: 10.1016/j.margeo.2004.04.022
Arnaud, G., Mory, M., Abadie, S., and Morichon, D. (2011). “Measurements of bed level oscillation cycles in the surf zone of a sandy beach,” in OCEANS, IEEE – Spain (Santander: IEEE), 1–8. doi: 10.1109/Oceans-Spain.2011.6003636
Austin, M. J., and Masselink, G. (2006). Observations of morphological change and sediment transport on a steep gravel beach. Mar. Geol. 229, 59–77. doi: 10.1016/j.margeo.2006.02.003
Beach, R. A., and Sternberg, R. W. (1991). “Infragravity driven suspended sediment transport in the swash, inner and outer-surf zone,” in Proc. Coastal Sediments'91. ASCE (New York, NY), 114–128.
Biausque, M., and Senechal, N. (2019). Seasonal morphological response of an open sandy beach to winter wave conditions: the example of Biscarrosse beach, SW France. Geomorphology 332, 157–169. doi: 10.1016/j.geomorph.2019.02.009
Brand, E., Montreuil, A. L., Houthuys, R., and Chen, M. (2020). Relating hydrodynamic forcing and topographic response for tide-dominated sandy beaches. J. Mar. Sci. Eng. 8:151. doi: 10.3390/jmse8030151
Brand, E., Sloover, L. D., Wulf, A. D., Montreuil, A. L., and Chen, M. (2019). Cross-shore suspended sediment transport in relation to topographic changes in the intertidal zone of a macro-tidal beach (Mariakerke, Belgium). J. Mar. Sci. Eng. 7:172. doi: 10.3390/jmse7060172
Capo, S., Parisot, J. P., Bujan, B., and Senechal, S. B. (2009). Short time morphodynamics response of the Truc Vert Beach to storm conditions. J. Coast. Res. 56, 1741–1745. doi: 10.2307/25738088
Chalmoukis, I. A., Dimas, A. A., and Grigoriadis, D. (2020). Large-eddy simulation of turbulent oscillatory flow over three dimensional transient vortex ripple geometries in quasiquilibrium. J. Geophys. Res. Earth Surf. 125:e2019JF005451. doi: 10.1029/2019JF005451
Christensen, D. F., Brinkkemper, J., Ruessink, G., and Aagaard, T. (2019). Field observations of turbulence in the intertidal and shallow subtidal zones. Continent. Shelf Res. 170, 21–32. doi: 10.1016/j.csr.2018.10.002
Coco, G., Burnet, T. K., and Werner, B. T. (2004). The role of tides in beach cusp development. J. Geophys. Res. Oceans 109:C04011. doi: 10.1029/2003JC002154
Dally, W. R., and Dean, R. G. (1984). Suspended sediment transport and beach profile evolution. J. Waterway Port Coast. Ocean Eng. 110, 15–33. doi: 10.1061/(ASCE)0733-950X(1984)110:1(15)
Dingler, J. R., and Inman, D. L. (1976). Wave-formed ripples in nearshore sands. Coast. Eng. Proc. 1:122. doi: 10.9753/icce.v15.122
Elgar, S., Gallagher, E. L., and Guza, R. T. (2001). Nearshore sandbar migration. J. Geophys. Res. Atmos. 106, 11623–11628. doi: 10.1029/2000JC000389
Falqués, A., Dodd, N., Garnier, R., Ribas, F., and Sancho, F. (2008). Rhythmic surf zone bars and morphodynamic self-organization. Coast. Eng. 55, 622–641. doi: 10.1016/j.coastaleng.2007.11.012
Gallagher, E. L., Elgar, S., and Guza, R. T. (1998). Observations of sand bar evolution on a natural beach. J. Geophys. Res. Oceans 103, 3203–3215. doi: 10.1029/97JC02765
Ge, Z. P., Dai, Z. J., Pang, W. H., Li, S. S., Wei, W., Mei, X. F., et al. (2017). LIDAR-based detection of the post-typhoon recovery of a meso-macro-tidal beach in the Beibu Gulf, China. Mar. Geol. 391, 127–143. doi: 10.1016/j.margeo.2017.08.008
Gibbons, D. T., Jones, G., Siegel, E., Hay, A., and Johnson, F. (2005). “Performance of a new submersible Tide-Wave recorder, Oceans,” in Proceedings of MTS/IEEE. Vol. 2 (New York, NY: IEEE), 1057–1060.
Grant, W. D., and Madsen, O. S. (1979). Combined wave and current interaction with a rough bottom. J. Geophys. Res. Oceans Atmos. 84, 1797–1808. doi: 10.1029/JC084iC04p01797
Grasso, F., and Ruessink, B. G. (2011). Vertical structure of turbulence dissipation rate in the shallow-water surf zone. J. Coast. Res. 64, 90–94.
Guillen, J., and Palanques, A. (1996). Short- and medium-term grain size changes in deltaic beaches (Ebro Delta, NW Mediterranean). Sediment. Geol. 101, 55–67. doi: 10.1016/0037-0738(95)00021-6
Houser, C, and Greenwood, B. (2007). Onshore migration of a swash bar during a storm. J. Coast. Res. 23, 1–14. doi: 10.2112/03-0135.1
Houser, C, Greenwood, B., and Aagaard, T. (2006). Divergent response of an intertidal swash bar. Earth Surf. Proc. Landforms 31, 1775–1791. doi: 10.1002/esp.1365
Hu, B. P., Xie, J., Li, W., He, Z., and Wu, W. (2020). A rans numerical study of experimental swash flows and its bed shear stress estimation. Appl. Ocean Res. 100, 102145. doi: 10.1016/j.apor.2020.102145
Hu, Z., Wang, Z. B., Zitman, T. J., Stive, M. J. F., and Bouma, T. J. (2015). Predicting long-term and short-term tidal flat morphodynamics using a dynamic equilibrium theory. J. Geophys. Res. Earth Surf. 120, 1803–1823. doi: 10.1002/2015JF003486
Huang, H., Dai, Z. J., Shi, W. Y., and Sheng, K. (2011). Deposition characteristics of beach profile in strong-tidal environment ? A case study of Yintan, Guangxi during spring. J. Trop. Oceanogr. 30, 71–76. doi: 10.3969/j.issn.1009-5470.2011.04.011
Ji, Y. X. (2007). Study on Storm Surges Disasters of the Guangxi Coastal Areas in Beibu Gulf and Its Preventive Counter Measurements. Nanning: Guangxi University.
Kim, S. C., Friedrichs, C. T., Maa, J. P. Y., and Wright, L. D. (2000). Estimating bottom stress in tidal boundary layer from Acoustic Doppler Velocimeter data. J. Hydraul. Eng. ASCE 126, 399–406. doi: 10.1061/(ASCE)0733-9429(2000)126:6(399)
Komar, P. D., and Gaughan, M. K. (1972). “Airy wave theory and breaker height prediction,” in Proceedings of the 13th International Conference on Coastal Engineering ASCE (Vancouver, BC), 405–418. doi: 10.1061/9780872620490.023
Kroon, A., and Masselink, G. (2002). Morphodynamics of intertidal bar morphology on a macrotidal beach under low-energy wave conditions, North Lincolnshire, England. Mar. Geol. 190, 591–608. doi: 10.1016/S0025-3227(02)00475-9
Lee, T. H., and Hanes, D. M. (1996). Comparison of field observations of the vertical distribution of suspended sand and its prediction by models. J. Geophys. Res. 101, 3561–3572. doi: 10.1029/95JC03283
Li, F., van Gelder, P. H. A. J.M., Ranasinghe, R., Callaghan, D. P., and Jongejan, R. B. (2014). Probabilistic modelling of extreme storms along the Dutch coast. Coast. Eng. 86, 1–13. doi: 10.1016/j.coastaleng.2013.12.009
Longuet-Higgins, M. S., and Stewart, R. W. (1964). Radiation stresses in water waves; a physical discussion, with applications. Deep Sea Res. Oceanogr. Abstr. 11, 529–562. doi: 10.1016/0011-7471(64)90001-4
López-Dóriga, U., and Ferreira, O. (2017). Longshore and cross-shore morphological variability of a Berm–Bar system under low to moderate wave energy. J. Coast. Res. 335, 1161–1171. doi: 10.2112/JCOASTRES-D-16-00050.1
Luijendijk, A., Hagenaars, G., Ranasinghe, R., Baart, F., Donchyts, G., and Aarninkhof, S. (2018). The state of the world's beaches. Sci. Rep. 8:6641. doi: 10.1038/s41598-018-24630-6
Ma, B. B., Dai, Z. J., Pang, W. H., Ge, Z. P., Li, S. S., Mei, X. F., et al. (2019). Dramatic typhoon-induced variability in the grain size characteristics of sediments at a meso-macrotidal beach. Continent. Shelf Res. 191:104006. doi: 10.1016/j.csr.2019.104006
Mariño-Tapia, I. J., Russell, P. E., O'Hare, T. J., Davidson, M. A., and Huntley, D. A. (2007). Cross-shore sediment transport on natural beaches and its relation to sandbar migration patterns: 1. Field observations and derivation of a transport parameterization. J. Geophys. Res. Oceans 112, 1–15. doi: 10.1029/2005JC002893
Masselink, G. (2004). Formation and evolution of multiple intertidal bars on macrotidal beaches: application of a morphodynamic model. Coast. Eng. 51, 713–730. doi: 10.1016/j.coastaleng.2004.07.005
Masselink, G., and Anthony, E. J. (2001). Location and height of intertidal bars on macrotidal ridge and runnel beaches. Earth Surf. Proc. Landforms 26, 759–774. doi: 10.1002/esp.220
Masselink, G., Auger, N., Russell, P., and O'Hare, T. (2007). Short-term morphological change and sediment dynamics in the intertidal zone of a macrotidal beach. Sedimentology 54, 39–53. doi: 10.1111/j.1365-3091.2006.00825.x
Masselink, G., Austin, M., Tinker, J., O'Hare, T., and Russell, P. (2008). Cross-shore sediment transport and morphological response on a macrotidal beach with intertidal bar morphology, Truc Vert, France. Mar. Geol. 251, 141–155. doi: 10.1016/j.margeo.2008.01.010
Masselink, G., Evans, D., Hughes, M. G., and Russell, P. (2005). Suspended sediment transport in the swash zone of a dissipative beach. Mar. Geol. 216, 169–189. doi: 10.1016/j.margeo.2005.02.017
Masselink, G., and Heteren, S. (2014). Response of wave-dominated and mixed-energy barriers to storms. Mar. Geol. 352, 321–347. doi: 10.1016/j.margeo.2013.11.004
Masselink, G., Kroon, A., and Davidson-Arnott, R. G. D. (2006). Morphodynamics of intertidal bars in wave-dominated coastal settings — a review. Geomorphology 73, 33–49. doi: 10.1016/j.geomorph.2005.06.007
Masselink, G., and Short, A. D. (1993). The effect of tide range on beach morphodynamics and morphology: a conceptual beach model. J. Coast. Res. 9, 785–800.
Nerem, R. S., Beckley, B. D., Fasullo, J. T., Hamlington, B. D., and Mitchum, G. T. (2018). Climate-change–driven accelerated sea-level rise detected in the altimeter era. Proc. Natl. Acad. Sci. U.S.A. 115:201717312. doi: 10.1073/pnas.1717312115
Nicholls, R. J., and Cazenave, A. (2010). Sea-level rise and its impact on coastal zones. Science 328, 1517–1520. doi: 10.1126/science.1185782
Nielsen, P. (1981). Dynamics and geometry of wave-generated ripples. J. Geophys. Res. 86, 6467–6472. doi: 10.1029/JC086iC07p06467
Osborne, P. D., and Vincent, C. E. (1996). Vertical and horizontal structure in suspended sand concentrations and wave-induced fluxes over bedforms. Mar. Geol. 131, 195–208. doi: 10.1016/0025-3227(95)00002-X
Pang, W. H., Dai, Z. J., Ge, Z. P., Li, S. S., Mei, X. F., Gu, J. H., et al. (2019). Near-bed cross-shore suspended sediment transport over a meso-macro tidal beach under varied wave conditions. Estuar. Coast. Shelf Sci. 217, 69–80. doi: 10.1016/j.ecss.2018.11.007
Pang, W. H., Dai, Z. J., Ma, B. B., Wang, J., and Li, S. S. (2020). Linkage between turbulent kinetic energy, waves and suspended sediment concentrations in the nearshore zone. Mar. Geol. 425:106190. doi: 10.1016/j.margeo.2020.106190
Poate, T., Masselink, G., Russell, P., and Austin, M. (2014). Morphodynamic variability of high-energy macrotidal beaches, Cornwall, UK. Mar. Geol. 350, 97–111. doi: 10.1016/j.margeo.2014.02.004
Pritchard, D., and Hogg, A. J. (2005). On the transport of suspended sediment by a swash event on a plane beach. Coast. Eng. 52, 1–23. doi: 10.1016/j.coastaleng.2004.08.002
Pucino, N., Kennedy, D. M., Carvalho, R. C., Allan, B., and Ierodiaconou, D. (2021). Citizen science for monitoring seasonal-scale beach erosion and behaviour with aerial drones. Sci. Rep. 11:3935. doi: 10.1038/s41598-021-83477-6
Puleo, J. A., Lanckriet, T., and Blenkinsopp, C. (2014). Bed level fluctuations in the inner surf and swash zone of a dissipative beach. Mar. Geol. 349, 99–112. doi: 10.1016/j.margeo.2014.01.006
Qi, H., Cai, F., Lei, G., Cao, H., and Shi, F. (2010). The response of three main beach types to tropical storms in South China. Mar. Geol. 275, 244–254. doi: 10.1016/j.margeo.2010.06.005
Quartel, S., Kroon, A., and Ruessink, B. G. (2008). Seasonal accretion and erosion patterns of a microtidal sandy beach. Mar. Geol. 250, 19–33. doi: 10.1016/j.margeo.2007.11.003
Rafati, Y., Hsu, T. J., Elgar, S., Raubenheimer, B., and Dongeren, A. V. (2021). Modeling the hydrodynamics and morphodynamics of sandbar migration events. Coast. Eng. 166:103885. doi: 10.1016/j.coastaleng.2021.103885
Reichmüth, B., and Anthony, E. J. (2007). Tidal influence on the intertidal bar morphology of two contrasting macrotidal beaches. Geomorphology 90, 101–114. doi: 10.1016/j.geomorph.2007.01.015
Ribeiro, M., Ferreira, F., Rodrigues, A., Oliveira, A., and Pinto, J. P. (2012). “Seasonal morphological variation at the So Torpes beach: decoupling longshore and crossshore sediment transport components,” in VII Simpósio sobre a Margem Ibérica Atlantica (Lisbon).
Rijn, L. (2009). Prediction of dune erosion due to storms. Coast. Eng. 56, 441–457. doi: 10.1016/j.coastaleng.2008.10.006
Rijn, L. C. (2010). Coastal Erosion Control Based on the Concept of Sediment Cells. EU-Project CONSCIENCE. Delft: Deltares.
Rijn, L. V. (2011). Coastal erosion and control. Ocean Coast. Manag. 54, 867–887. doi: 10.1016/j.ocecoaman.2011.05.004
Ruessink, B. G., Blenkinsopp, C., Brinkkemper, J. A., Castelle, B., Dubarbier, B., Grasso, F., et al. (2016). Sandbar and beach-face evolution on a prototype coarse sandy barrier. Coast. Eng. 113, 19–32. doi: 10.1016/j.coastaleng.2015.11.005
Russell, P. E. (1993). Mechanisms for beach erosion during storms. Continent. Shelf Res. 13, 1243–1265. doi: 10.1016/0278-4343(93)90051-X
Russell, P. E., Foote, Y., and Huntley, D. A. (1995). “An energetics approach to sand transport on beaches,” in Proc. Coastal Dynamics' 95, ASCE (New York, NY), 829–840.
Saulter, A. N., Russell, P. E., Gallagher, E. L., and Miles, J. R. (2003). Observations of bed level change in a saturated surf zone. J. Geophys. Res. Oceans 108:3112. doi: 10.1029/2000JC000684
Sedrati, M., and Anthony, E. J. (2007). Storm-generated morphological change and longshore sand transport in the intertidal zone of a multi-barred macrotidal beach. Mar. Geol. 244, 209–229. doi: 10.1016/j.margeo.2007.07.002
Shi, B. W., Yang, S. L., Wang, Y. P., Li, G. C., Li, M. L., Li, P., et al. (2017). Role of wind in erosion-accretion cycles on an estuarine mudflat. J. Geophys. Res. Oceans 122, 193–206. doi: 10.1002/2016JC011902
Short, A. D. (1991). Macro-meso tidal beach morphodynamics - an overview. J. Coast. Res. 7, 417–436.
Slobbe, E. V., Vriend, H., Aarninkhof, S., Lulofs, K., and Dircke, P. (2013). Building with nature: in search of resilient storm surge protection strategies. Nat. Hazards 66, 947–966. doi: 10.1007/s11069-012-0342-y
Soulsby, R. (1997). Dynamics of Marine Sands: a Manual for Practical Applications. London: Thomas Telford.
Stive, M. J. F., Schipper, M. A. D., Luijendijk, A. P., Aaninkhof, S. G. J., and Ranasinghe, R. (2013). A new alternative to saving our beaches from sea-level rise: the Sand Engine. J. Coast. Res. 29, 1001–1008. doi: 10.2112/JCOASTRES-D-13-00070.1
Svendsen, I. A. (1987). Analysis of surf zone turbulence. J. Geophys. Res. 92, 5115–5124. doi: 10.1029/JC092iC05p05115
Tinker, J., O'Hare, T., Masselink, G., Butt, T., and Russell, P. (2009). A cross-shore suspended sediment transport shape function parameterisation for natural beaches. Continent. Shelf Res. 29, 1948–1960. doi: 10.1016/j.csr.2009.03.011
van Bemmelen, C. W. T., de Schipper, M. A., Darnall, J., and Aarninkhof, S. G. J. (2020). Beach scarp dynamics at nourished beaches. Coast. Eng. 160:103725. doi: 10.1016/j.coastaleng.2020.103725
Vellinga, P. (1982). Beach and dune erosion during storm surges. Coast. Eng. 6, 361–387. doi: 10.1016/0378-3839(82)90007-2
Vidal-Ruiz, J. A., and de Alegría-Arzaburu, A. R. (2020). Modes of onshore sandbar migration at a single-barred and swell-dominated beach. Mar. Geol. 426:106222. doi: 10.1016/j.margeo.2020.106222
Vincent, C. E., and Hanes, D. M. (2002). The accumulation and decay of nearbed suspended sand concentration due to waves and wave groups. Continent. Shelf Res. 22, 1987–2000. doi: 10.1016/S0278-4343(02)00051-1
Vousdoukas, M. I., Almeida, L. P., and Ferreira, Ó. (2011). “Modelling storminduced beach morphological change in a meso-tidal, reflective beach using XBeach,” in Proceedings 11th International Coastal Symposium, ed K. Furmańczyk (Szczecin: Journal of Coastal Research), 1916–1920.
Vousdoukas, M. I., Ranasinghe, R., Mentaschi, L., Plomaritis, T. A., Athanasiou, P., Luijendijk, A., et al. (2020). Sandy coastlines under threat of erosion. Nat. Clim. Change 10, 260–263. doi: 10.1038/s41558-020-0697-0
Winterwerp, J. C., and van Kesteren, W. G. M. (2004). Introduction to the Physics of Cohesive Sediment in the Marine Environment. Amsterdam: Elsevier. doi: 10.1016/S0070-4571(04)80004-9
Wright, L. D., Short, A. D., Iii, J. D. B., Hayden, B., Kimball, S., and List, J. H. (1987). The morphodynamic effects of incident wave groupiness and tide range on an energetic beach. Mar. Geol. 74, 1–20. doi: 10.1016/0025-3227(87)90002-8
Yoon, H. D., and Cox, D. T. (2012). Cross-shore variation of intermittent sediment suspension and turbulence induced by depth-limited wave breaking. Continent. Shelf Res. 47, 93–106. doi: 10.1016/j.csr.2012.07.001
Zhang, X., Leonardi, N., Donatelli, C., and Fagherazzi, S. (2020). Divergence of sediment fluxes triggered by sea-level rise will reshape coastal bays. Geophys. Res. Lett. 47:e2020GL087862. doi: 10.1029/2020GL087862
Zhou, G., Huang, J., Tao, Y., Luo, Q., and Zhang, G. (2015). Temporal-spatial distribution of wave energy: a case study of Beibu Gulf, China. Renew. Energy 74, 344–356. doi: 10.1016/j.renene.2014.08.014
Keywords: bed level change, intra-tidal variation, wave conditions, meso-macro tidal beach, ADV measurement
Citation: Pang W, Zhou X, Dai Z, Li S, Huang H and Lei Y (2021) ADV-Based Investigation on Bed Level Changes Over a Meso-Macro Tidal Beach. Front. Mar. Sci. 8:733923. doi: 10.3389/fmars.2021.733923
Received: 30 June 2021; Accepted: 01 September 2021;
Published: 13 October 2021.
Edited by:
Zeng Zhou, Hohai University, ChinaReviewed by:
Shiqiang Yan, City University of London, United KingdomZhiguo He, Zhejiang University, China
Zhenghong Tang, University of Nebraska-Lincoln, United States
Copyright © 2021 Pang, Zhou, Dai, Li, Huang and Lei. This is an open-access article distributed under the terms of the Creative Commons Attribution License (CC BY). The use, distribution or reproduction in other forums is permitted, provided the original author(s) and the copyright owner(s) are credited and that the original publication in this journal is cited, in accordance with accepted academic practice. No use, distribution or reproduction is permitted which does not comply with these terms.
*Correspondence: Zhijun Dai, zjdai@sklec.ecnu.edu.cn; Yaping Lei, eeslyp@mail.sysu.edu.cn