Intensification of Downslope Nutrient Transport and Associated Biological Responses Over the Northeastern South China Sea During Wind-Driven Downwelling: A Modeling Study
 Aiqin Han
 Jianping Gan
 Minhan Dai
 Zhongming Lu
 Linlin Liang3,4
 - 1Third Institute of Oceanography, Ministry of Natural Resources, Xiamen, China
- 2State Key Laboratory of Marine Environmental Science, Xiamen University, Xiamen, China
- 3Department of Ocean Science, Hong Kong University of Science and Technology, Kowloon, Hong Kong SAR, China
- 4Department of Mathematics, Hong Kong University of Science and Technology, Kowloon, Hong Kong SAR, China
Coastal downwelling is generally considered to have a limited biological effect compared with coastal upwelling. In this study, downslope transport of nearshore, nutrient-enriched waters during downwelling is found to induce distinct biological productivity in the water column over the northeastern South China Sea (NSCS). By conducting a process-driven study over a widened shelf with intensified downwelling in the NSCS, we investigated the biophysical processes associated with strong nutrient enrichment in the water column of downwelled waters. These processes and underlying mechanisms are largely unreported and remain unclear. Field measurements and a three-dimensional coupled physical-biological model incorporating nitrate (N), phytoplankton (P), zooplankton (Z), and detritus (D) were utilized to investigate distinct cross-shore nutrient transport over the uniquely widened NSCS shelf. We revealed that intensified downwelling circulation, dynamically induced by the widened shelf topography, enhanced chlorophyll a and biological productivity in a strip of well-mixed water over the inner shelf as well as in the downwelled water over the mid-shelf. Strong time lags and spatial differences existed among N, P, and Z because of the physical transport and the ensuing biogeochemical response. The intensified downslope transport of nutrient-rich coastal water formed distinct cross-shore wedge-shaped P, Z, and D structures, while N was rapidly consumed in the water column. This study illustrates the underlying coupled physical-biogeochemical processes associated with the observed biogeochemical response to wind-driven downwelling circulation over the variable shelf, which are commonly found in coastal oceans worldwide.
Introduction
Nutrient-rich waters over continental shelves are mainly provided by river input, coastal upwelling, and submarine groundwater discharge, and these waters have high biological productivity (Walsh, 1991; Jickells, 1998; Gan et al., 2010; Han et al., 2013). Nutrient distributions and the associated biogeochemical responses over the shelf are spatiotemporally variable and transported by wind-driven alongshore and cross-shore transport (Yanagi et al., 1994; Hung et al., 1999; Traykovski et al., 2000; Ma et al., 2006).
In contrast to the upslope upwelling motion, downwelling-induced downslope transport provides a conduit for offshore transport of sediment and larvae (Epifanio and Garvine, 2001; Corbett et al., 2004; Castelao et al., 2008). Coastal downwelling is less frequently studied than coastal upwelling (Allen and Newberger, 1996; Liu C. et al., 2010; Gan et al., 2013), and there are few biogeochemical studies on downwelling circulation in particular. Unlike upwelling, which supplies nutrient-rich subsurface waters to the euphotic zone and serves to stimulate biological productivity, downwelling generally carries nutrient-depleted surface water downward and is presumed to have little biological effect (Hanson et al., 2005; Guenther et al., 2008).
The northeastern South China Sea (NSCS) has a complex coastline and shelf topography that is characterized by a prominent eastward widened shelf (Figure 1) indicated by an abrupt offshore extension of the 50 m isobath east of 115°E. Gan et al. (2013) first reported the existence of intensified seaward cross-shelf transport over the NSCS widened shelf in winter, a robust phenomenon differing from other shelf systems with relatively uniform shelf topography (Hanson et al., 2005; Guenther et al., 2008). Gan et al. (2013) also identified the underlying physical mechanisms for the amplified downslope cross-isobath transport. During winter, a northeasterly monsoon drives the flow of the China Coastal Current (CCC) southwestward along the coast, supplying the NSCS shelf with water masses that contain nutrient-rich waters discharged from the Changjiang River (Chen, 2008; Han et al., 2013). Linking to the CCC, the downslope cross-shore transport can be associated with pronounced downslope biogeochemical fluxes (Liu S. et al., 2010) and stimulate various picoplankters (Pan et al., 2005) during downwelling circulation.
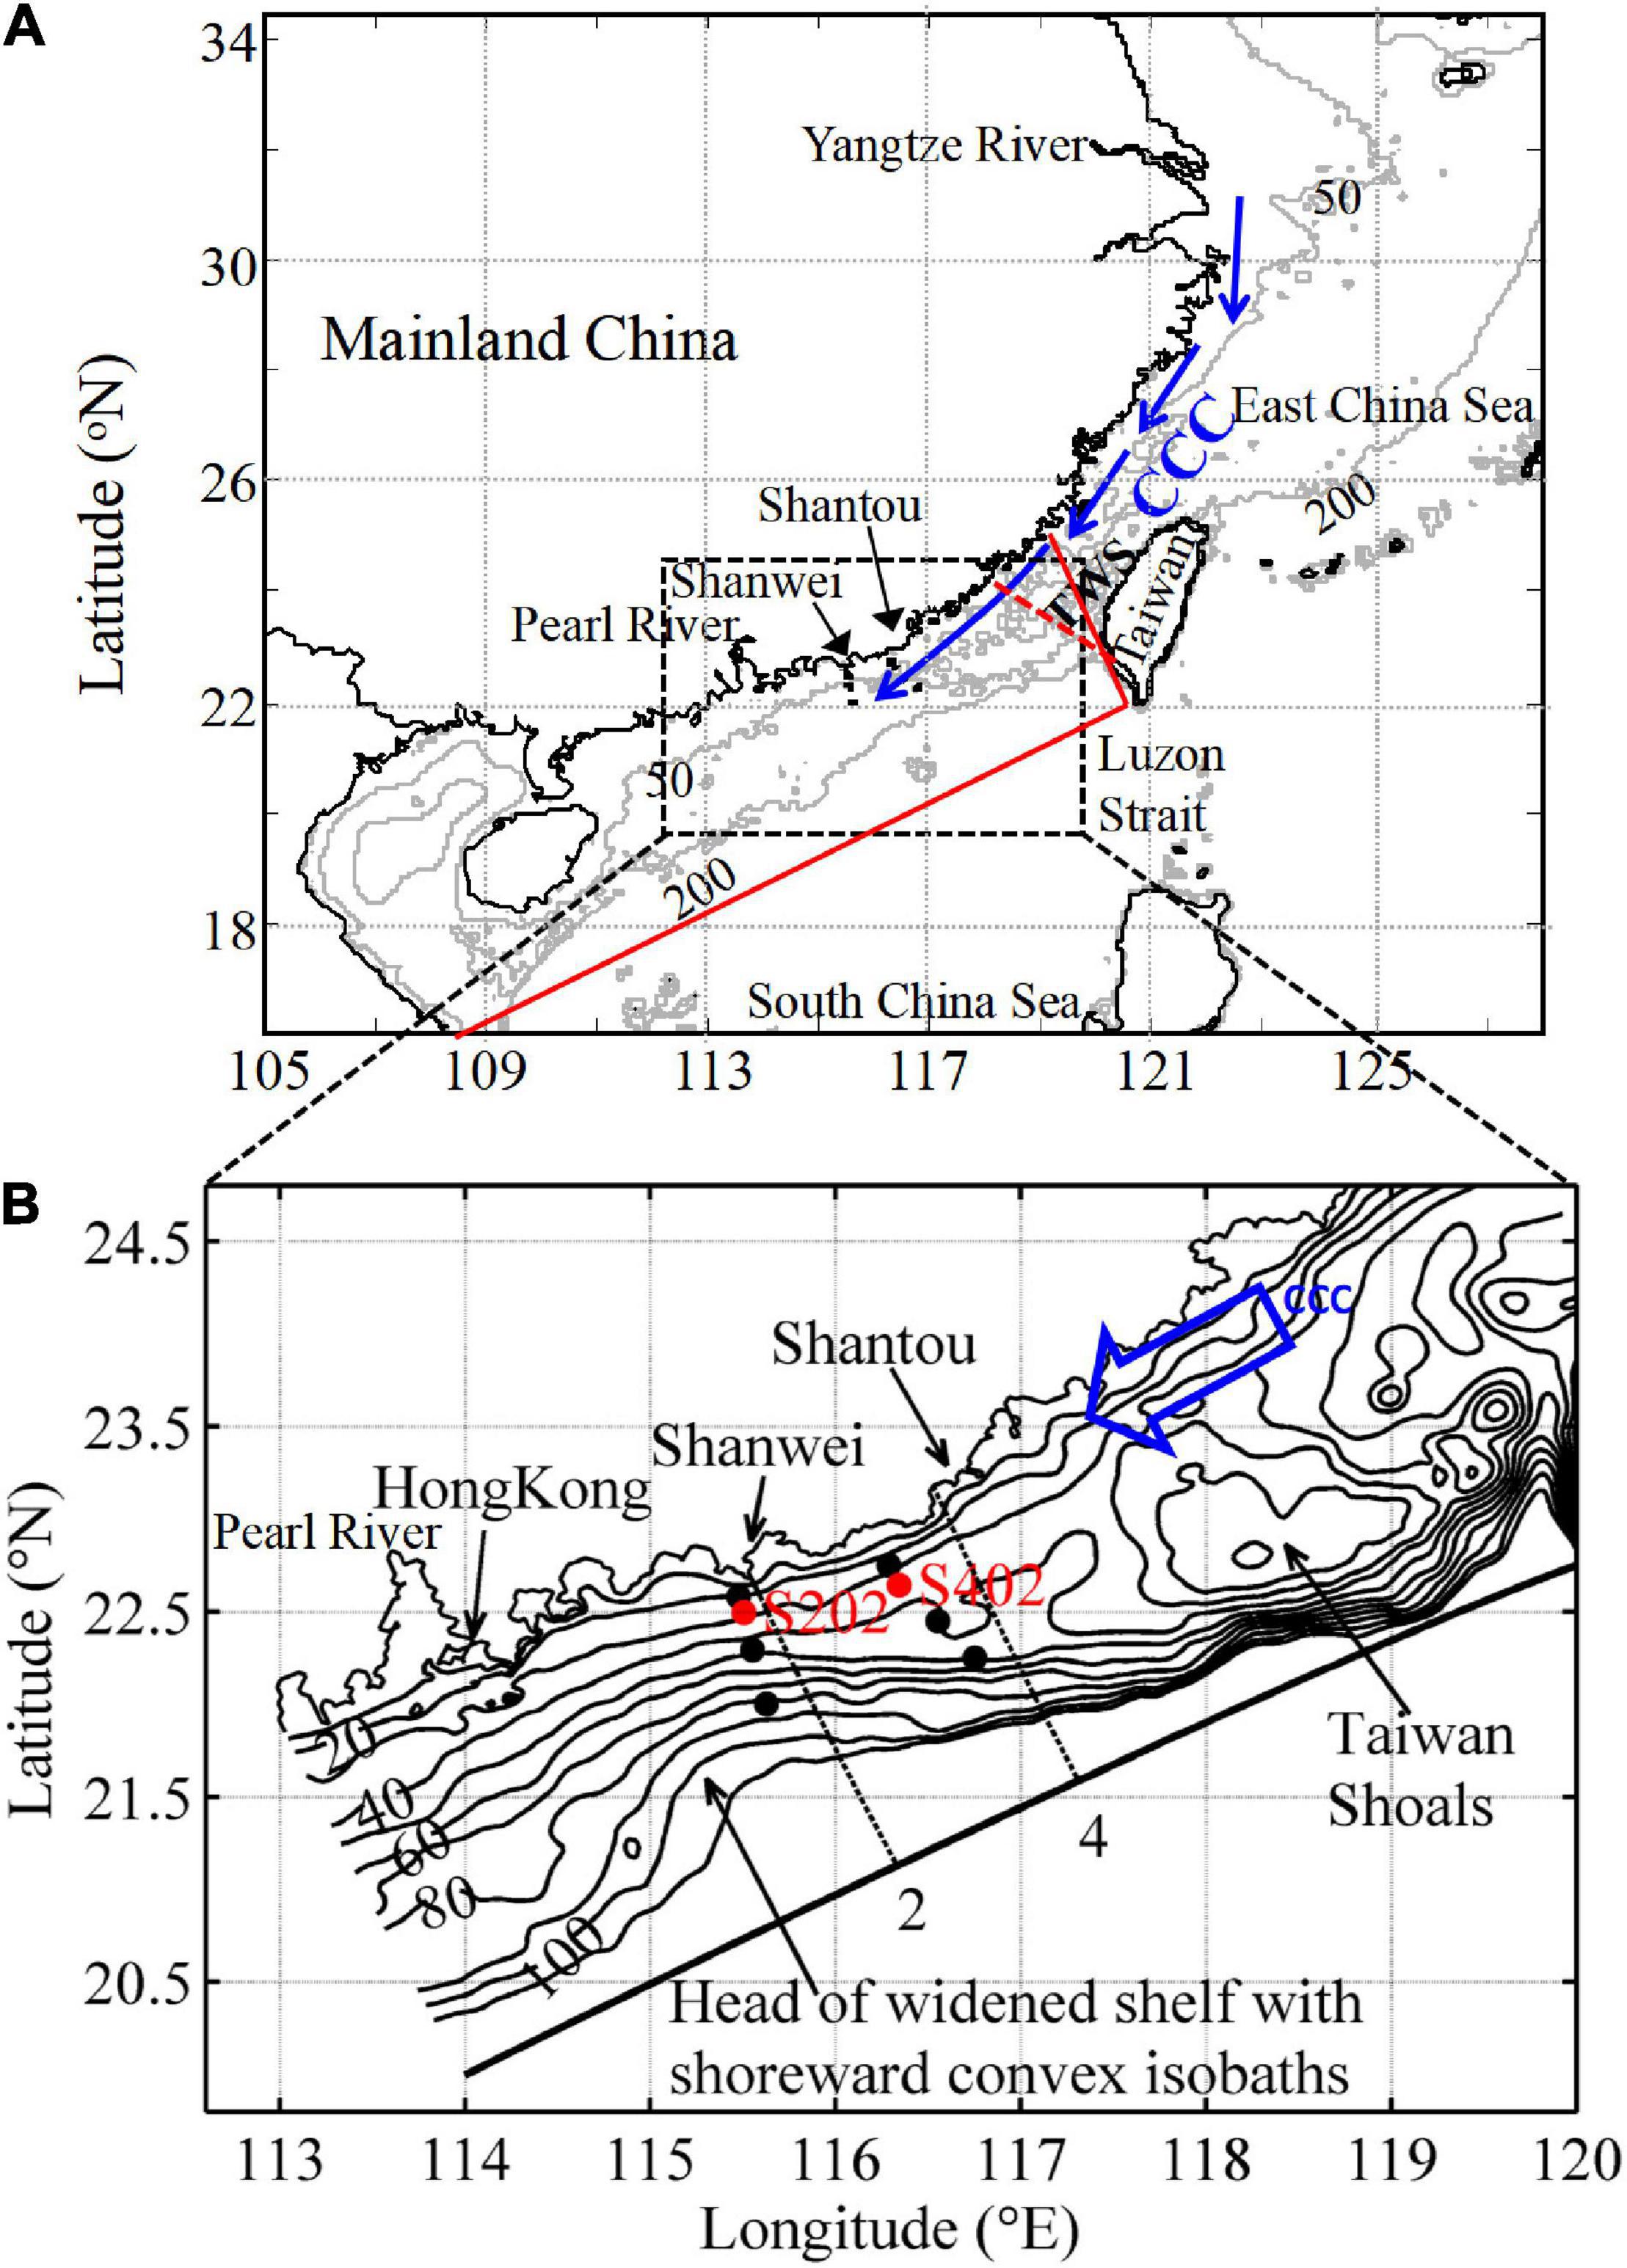
Figure 1. (A) Map of the study area in the northeastern South China Sea (NSCS) and the adjacent East China Sea (ECS) and the Taiwan Strait (TWS). The schematic China Coastal Current (CCC) introduced by Han et al. (2013) is indicated by blue arrows. The Regional Ocean Modeling System (ROMS) model domain is indicated by red solid lines and biological forcing along the southern TWS boundary in winter (Naik and Chen, 2008) is marked by the red dashed line. (B) Bathymetry (in m) of the NSCS shelf. The dashed lines represent Transects 2 and 4 offshore of Shanwei and Shantou, respectively. Solid circles show the location of the field survey stations, with stations s202 and s402 shown in red. The shoreward convex isobath is at the head of the widened shelf, ∼0.5o southwest of Shanwei. Horizontal maps are zoomed in to clearly show the region of interest. The blue arrow again indicates the southward CCC.
So far, the time-dependent, three-dimensional responses of the ecosystem to cross-isobath nutrient transport and the associated biological responses in the downwelling circulation, which are quite different from those operating in upwelling circulation, have not been adequately studied. In a previous study, we showed that inter-shelf nutrient transport from the East China Sea (ECS) via the CCC contributes a major nutrient source to the NSCS shelf (Han et al., 2013). In this study, we further investigate nutrient cross-shore transport in the CCC and its potential biological responses in the downwelling circulation.
Combined with field measurements, coupled physical-biological modeling is an efficient approach in biophysical studies of the ocean. Modeling compensates for temporally and spatially limited measurements and facilitates the dynamic conceptual analysis of trophic associations with circulation (e.g., Spitz et al., 2005; Gan et al., 2010). Gan et al. (2010) used a coupled physical-biological model to simulate two high-chlorophyll centers that were enriched by nutrients from both intense upwelling over the NSCS shelf and summertime river plumes. They found that nutrient enrichment exhibited strong alongshore variability during upwelling. Nevertheless, very few studies over the NSCS shelf have used field observations or modeling to investigate coupled physical-biological effects of downwelling circulation, especially during winter, and there is a general lack of understanding of the underlying coupled physical-biogeochemical processes and dynamics of intensified downwelling systems such as in the NSCS.
In this study, based on our previous in situ observations (Han et al., 2013), we construct a three-dimensional, coupled physical-biological, nitrogen-based ecosystem model to investigate time-dependent, three-dimensional biological responses to the intensified coastal downwelling circulation over a unique widened shelf in the NSCS.
Coupled Physical-Biological Model
The Regional Ocean Modeling System (ROMS; Shchepetkin and McWilliams, 2005) is adopted here to study the three-dimensional, time-dependent oceanographic flows governed by hydrostatic primitive equations. The Mellor-Yamada Level 2.5 turbulence closure sub-model, which constitutes a bulk-flux formulation for air–sea exchanges and the benthic boundary layer, is embedded within ROMS. The biological model embedded in ROMS is the nutrient, phytoplankton, zooplankton, and detritus (NPZD) ecosystem model (Fasham et al., 1990; Fennel et al., 2006; Hofmann, 2008), which includes variables such as nitrate (N), ammonium (A), chlorophyll a (Chl a), phytoplankton (P), zooplankton (Z), large detritus (LD), and small detritus (SD) (where D = LD + SD).
Our model domain extended from 15.99°N, 108.17°E in the southwest to around 25.81°N, 119.54°E in the northeast, with a central axis directed 23° anticlockwise from true east. We zoomed in the domain to overlay field survey stations (Figure 1A). The model domain had an average horizontal grid size of 3 km and 30 levels of stretched generalized terrain-following coordinates in the vertical.
The process-oriented simulation, with simplified but representative forcing implementations of the model, is widely adopted to provide an efficient means to isolate and identify complex oceanic processes such as the biogeochemical response to wind-driven downwelling circulation in this study. Thus, it was our advantage to force the model with spatially uniform northeasterly wind stress with a typical regional magnitude of 0.1 Pa and a wind speed of ∼10 m s–1. It was equally sensible, in this process-oriented simulation, to initialize the model with horizontally uniform biophysical profiles. The initial temperature and salinity were obtained from the mean winter values of the World Ocean Atlas (2001).1 Initial nitrate and Chla concentrations were obtained from field measurements, and initial profiles for other biogeochemical parameters were derived from a one-dimensional model after a 1-year run with a small background diffusivity and without phytoplankton sinking (Spitz et al., 2005). Since pelagic ecosystem studies in the NSCS are fairly limited, most of the biological parameters applied in the biological model were taken from ROMS (Fennel et al., 2006).
We used open boundary conditions (Gan and Allen, 2005; Gan et al., 2005) to accommodate forcing in the eastern boundary and obtained the biophysical forcing along the eastern boundary from winter field observations (Naik and Chen, 2008). An oblique horizontal radiation condition (Marchesiello et al., 2001) was applied along the southern boundary for velocity, temperature, salinity, and biological tracers. The winter discharge rate, salinity, and temperature of the Pearl River were set at 5,000 m3 s–1, 30.0, and 13.0°C, respectively, which are typical values for that river in winter. Under the prevailing northeasterly monsoon in the NSCS during winter, a substantial supply of nutrients is advected by the CCC into the NSCS from the eastern boundary. The dissolved inorganic nitrogen [DIN, nitrate + nitrite (NO3– + NO2–)] influx was estimated at 1,430 ± 1,024 mol s–1 by combining the field observations (see section “Spatial-Temporal Disparities of N, P, Z, and D”) of DIN with CCC volume transport, as reported in a previous study (Han et al., 2013).
The coupled physical-biological model has been successfully applied to the NSCS, and additional details regarding the configuration, implementation, and validation of the coupled physical-biogeochemical model in the NSCS are shown by Gan et al. (2009), Lu et al. (2010), and Gan et al. (2010). We ran the model for 60 days and used the daily averaged output for our analyses.
In the coupled physical-biological model, the seaward cross-isobath fluxes of water (My), nutrient (Ny), and detritus (Dy) were obtained as follows:
and
where U is the cross-isobath velocity (>0 shoreward), h1 and h2 are the free surface and bottom of the integrated layers, respectively, and the subscript y refers to the direction normal to the isobath.
The evolving N, P, Z, and D in the ecosystem were defined by
where V is the volume of the water mass, representing nearshore waters between the coast and the 30 m isobath from 114°E to 120°E, and the bottom waters within the bottom boundary layer between the 50 and 100 m isobaths from Shanwei to Shantou (Figure 1), where the temperature ranged from 20 to 21°C, respectively.
Observational Features
From December 2008 to January 2009, field observations encompassing both the ECS and the NSCS were conducted to examine the long-range southward transport of nutrients from the ECS to the NSCS carried by the northeasterly driven CCC in winter. The prevailing northeasterly wind speed was about 10–13 m s–1.2 Han et al. (2013) described the basic hydrology and nutrient characteristics of the CCC (alongshore current) based on fieldwork. The CCC water mass was characterized by a wide salinity range of 26.7–31.4 in the inner shelf of the ECS and 32.9–33.0 in the nearshore of the NSCS, and relatively narrow temperature ranges of 12.1–13.0°C and 17.5–17.9°C, respectively. Meanwhile, CCC nutrients were abundant with DIN concentrations of ∼35.0–8.0 μmol L–1.
In the NSCS shelf, downwelling circulation is generally characterized by the strong southwestward alongshore CCC in nearshore waters and downslope cross-isobath transport in the mid-shelf. Since the intensified downslope transport occurred between Shantou and Shanwei where the distinctly widened shelf is located (Gan et al., 2013), our study concentrated on Transects 2 and 4 (Figure 1B) to illustrate the biophysical characteristics over the NSCS shelf during downwelling.
Unique downslope transport over the NSCS is shown by the downward-tilted cold-water tongue along with the bottom boundary layer across both Transects 2 and 4 (Figures 2A, 3A). This distinct downslope transport is caused by the dynamics of the flow-widened shelf interaction (Gan et al., 2013). In the nearshore region of Transect 2 (Figure 2), the colder and fresher waters advected southward by the CCC also led to very high concentrations of DIN (8.0–7.8 μmol L–1), phosphate (PO43–; 0.54–0.51 μmol L–1), and silicate [Si(OH)4; 17.6–16.6 μmol L–1], while the concentration of Chl a was ∼1.0 mg m–3 (Figures 2C–F). Although observed at a different time (1 week later), the variables along Transect 4 (Figures 3C–F) exhibited similar downwelling features to those of Transect 2. These were associated with the alongshore transport of the CCC and with intensified downslope cross-shore transport over the widened shelf. Transect 4 had the concentration values of 2.6–0.4 μmol L–1, ∼0.15 μmol L–1, 6.4–3.1 μmol L–1, and 2.0–0.5 mg m–3 for DIN, PO43–, Si(OH)4, and Chl a, respectively (Figures 3C–F). Along Transect 4 (Figure 3B), the downslope salinity signals appeared less pronounced due to weak downwelling strength over the less steep shelf slope (Gan et al., 2013), in addition to the mixing with the ambient saline oceanic water (Han et al., 2013).
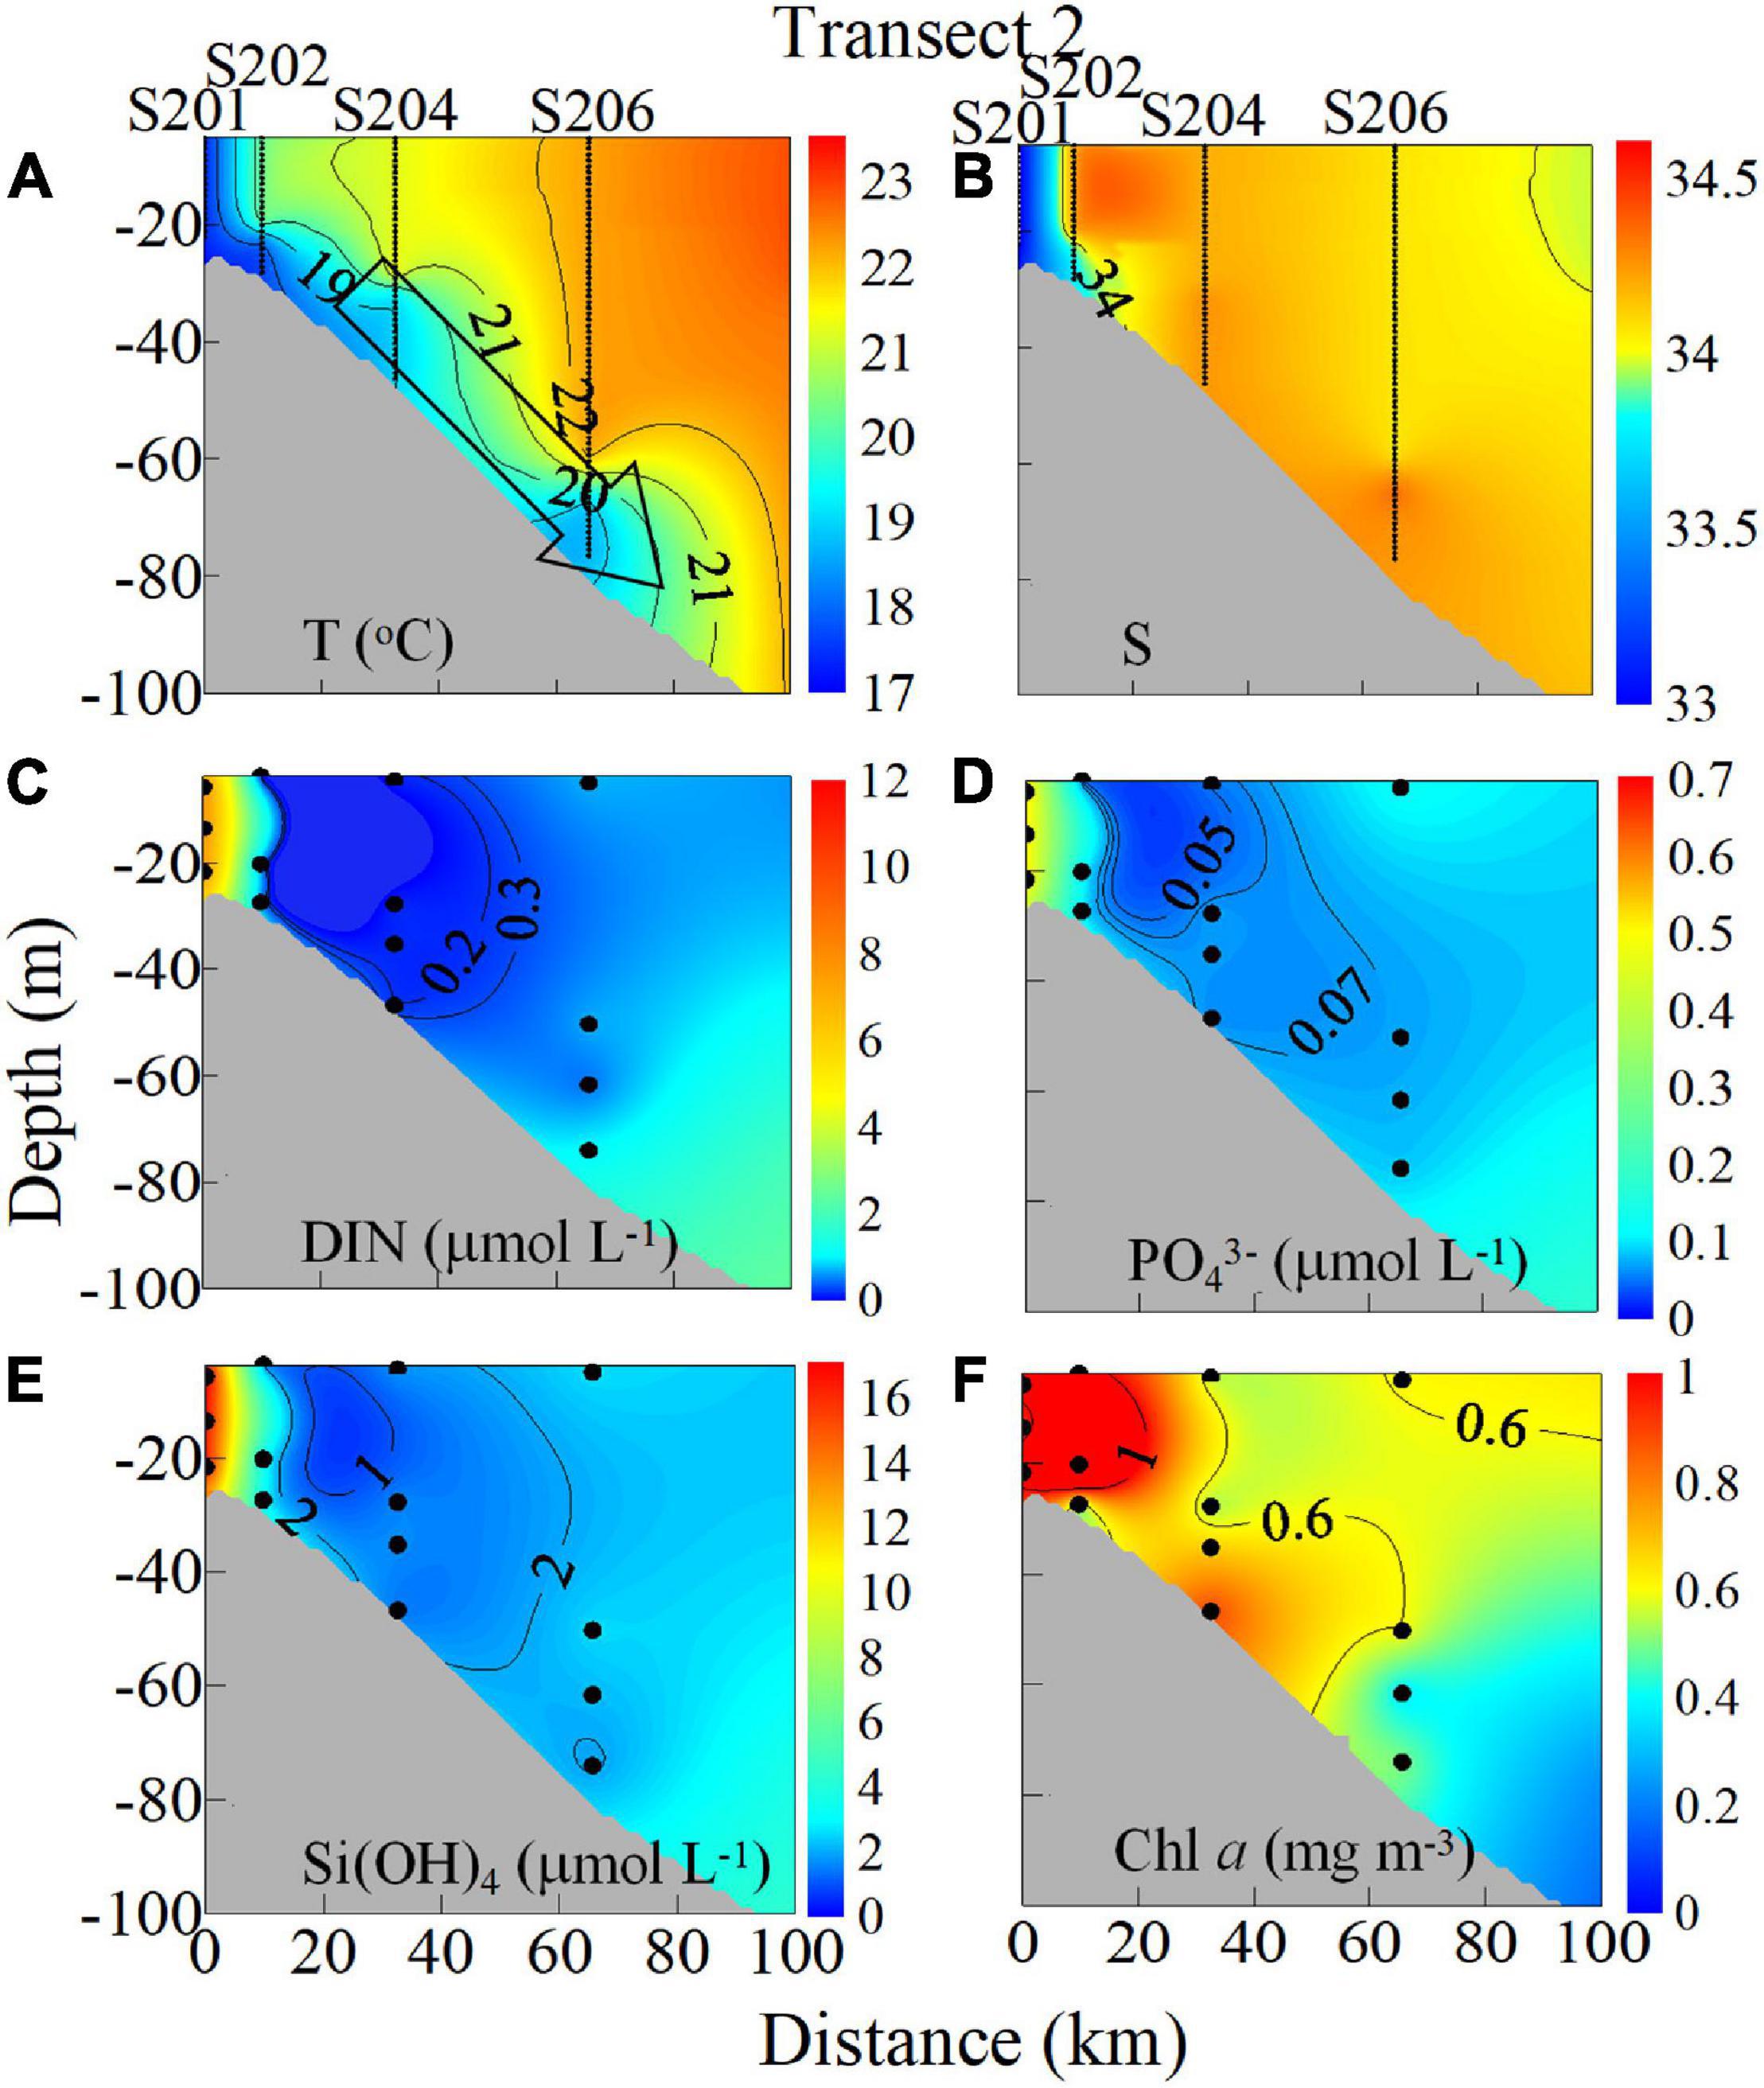
Figure 2. Vertical distributions of (A) temperature (T) (°C), (B) salinity (S) (C) dissolved inorganic nitrogen (DIN) (NO3− + NO2−, μmol L–1), (D) phosphate (PO43–) (μmol L–1), (E) silicate (Si(OH)4) (μmol L–1), and (F) chlorophyll a (Chl a) (mg m–3) along Transect 2 in the NSCS shelf during winter 2008 [redrawn from Figure 5 by Han et al. (2013)].
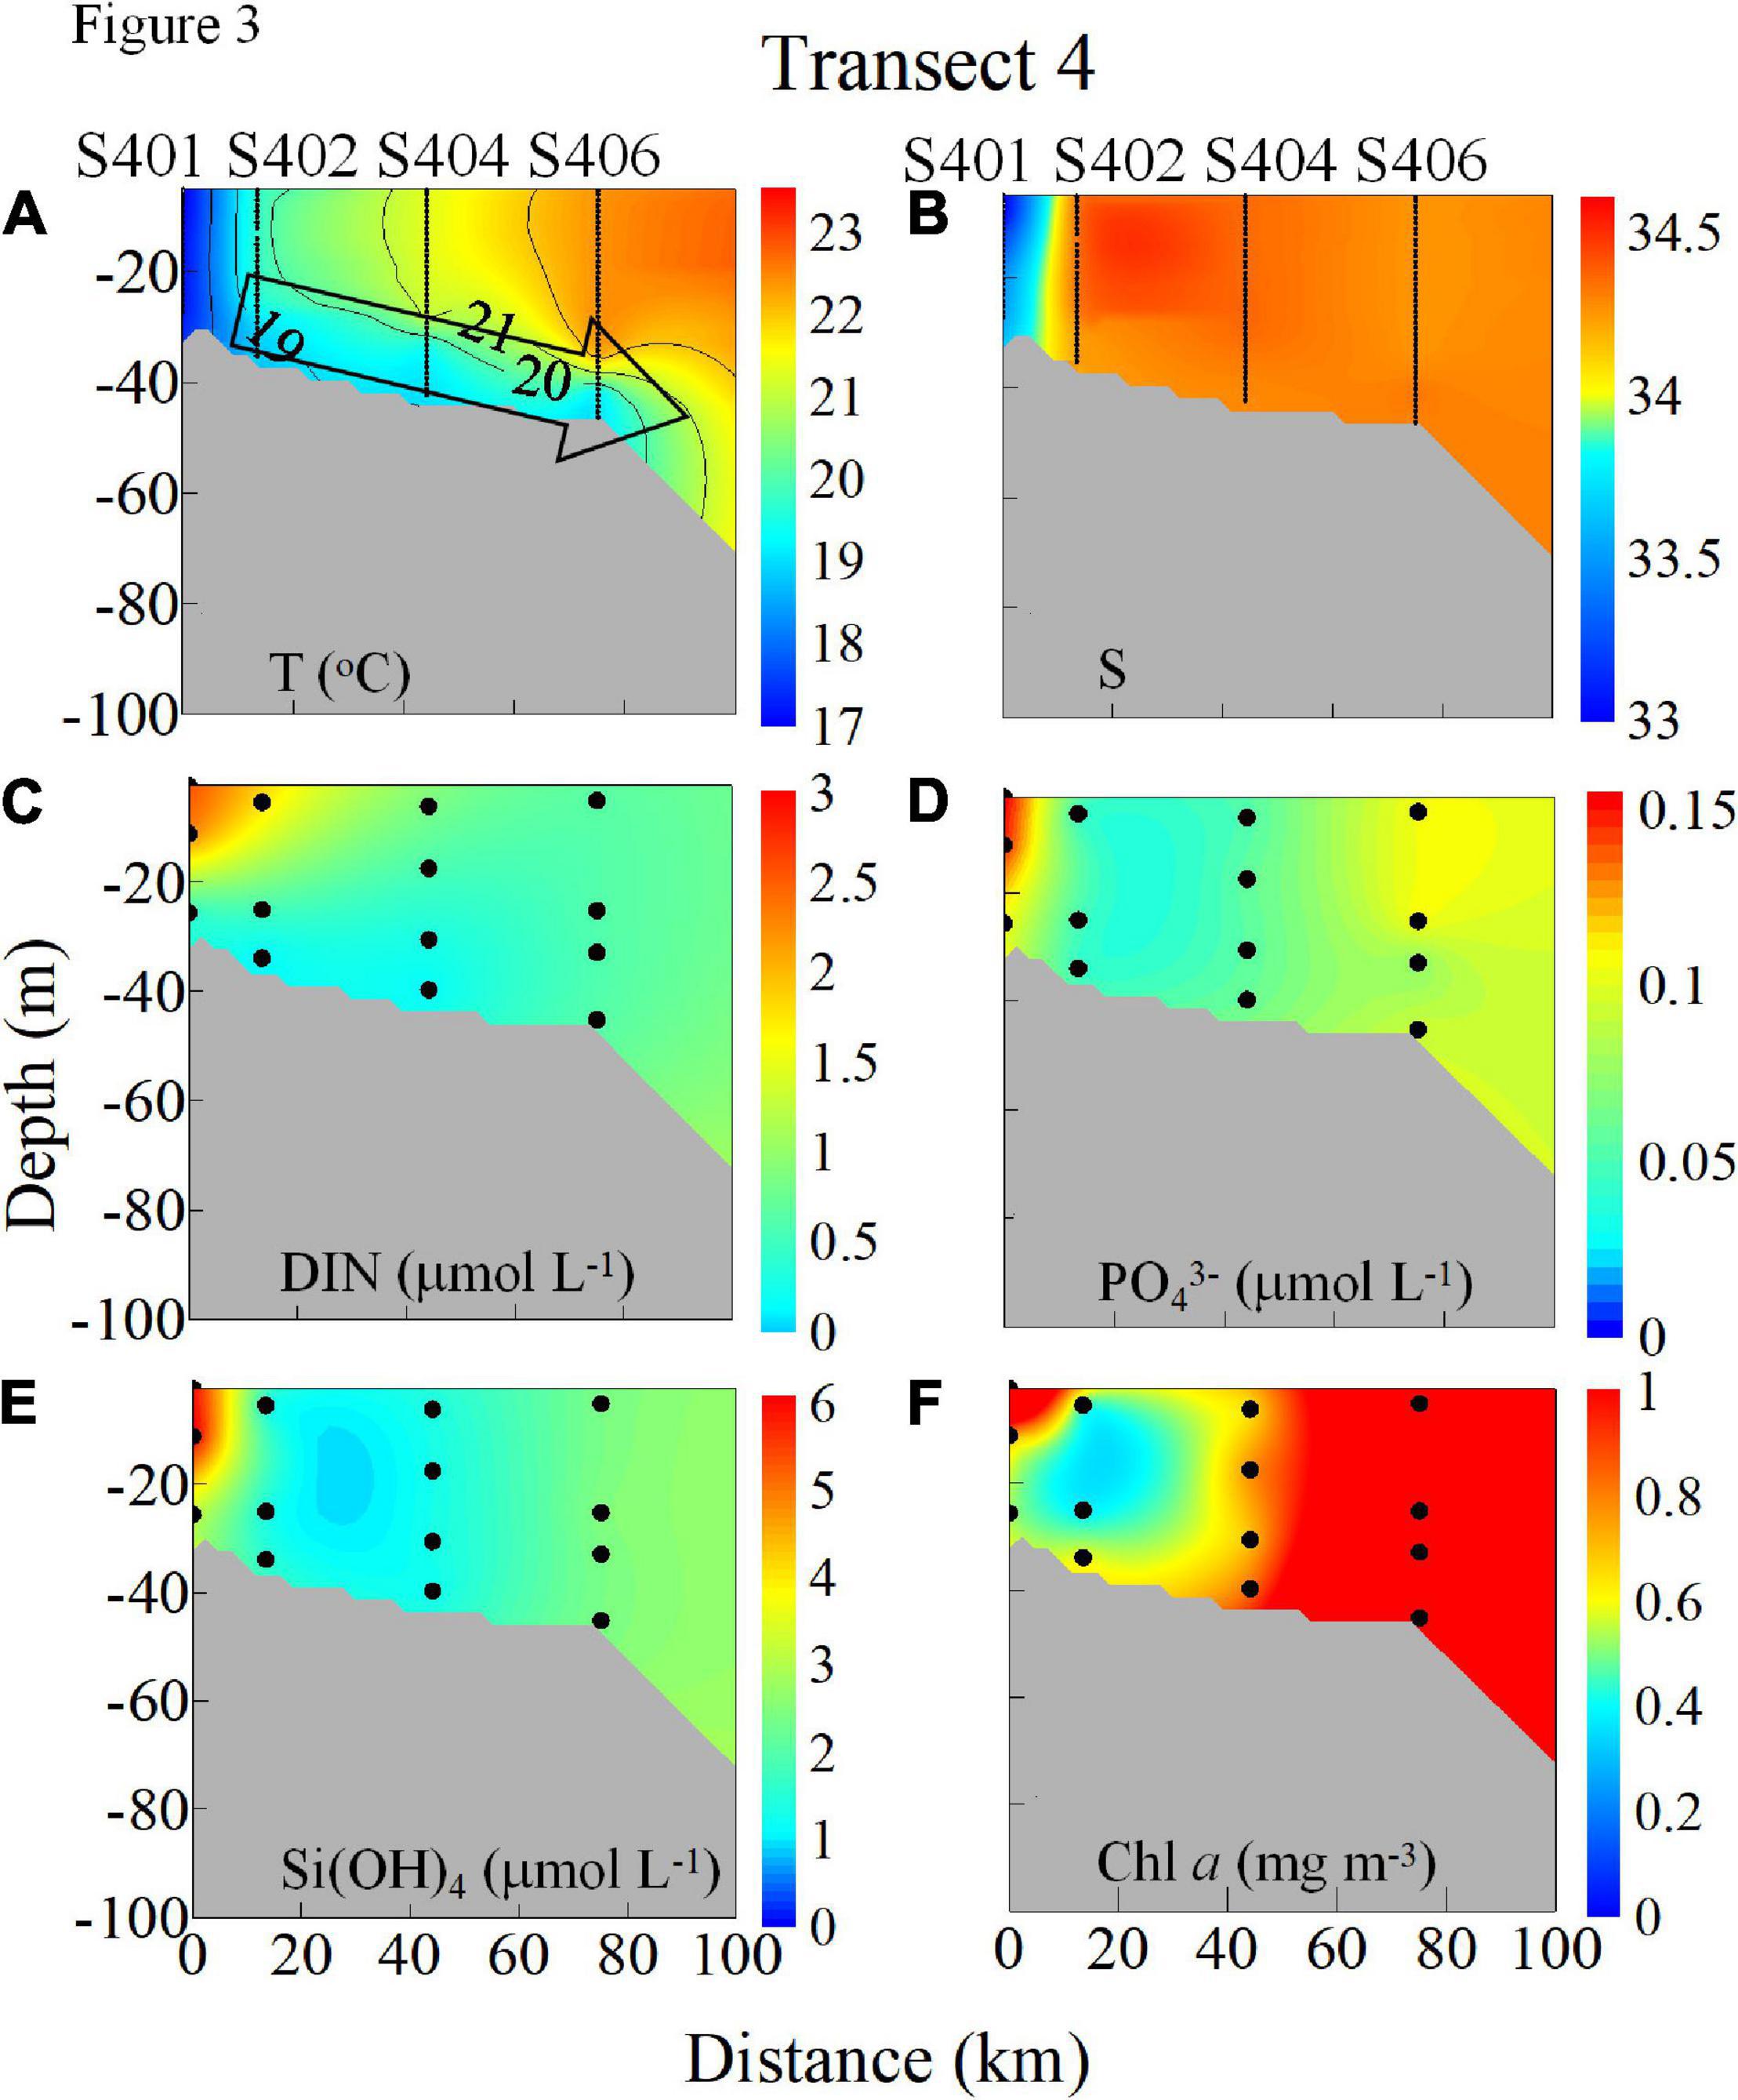
Figure 3. Vertical distributions of (A) T (°C), (B) S, (C) DIN (NO3− + NO2−, μmol L–1), (D) PO43– (μmol L–1), (E) Si(OH)4 (μmol L–1), and (F) Chl a (mg m–3) along Transect 4 in the NSCS shelf in winter 2008.
As shown in Figures 2, 3, the upper water column in stations 202 and 402 was vertically well mixed and seaward downslope transport occurred in bottom water. The vertical profiles of temperature, salinity, DIN, PO43–, Si(OH)4, NO2–, and Chl a concentrations at s202 and s402 along Transects 2 and 4 are shown in Figure 4. The DIN concentration in the surface layer at s202 (Figure 4B) was limited to 0.1 μmol L–1 but was quite high in the bottom layer, which reflects the nitrogen stratification caused by downwelling. A similar condition was shown by NO2– at s402 where the NO3– concentration at s402 (Figure 4D) was too low to be measured.
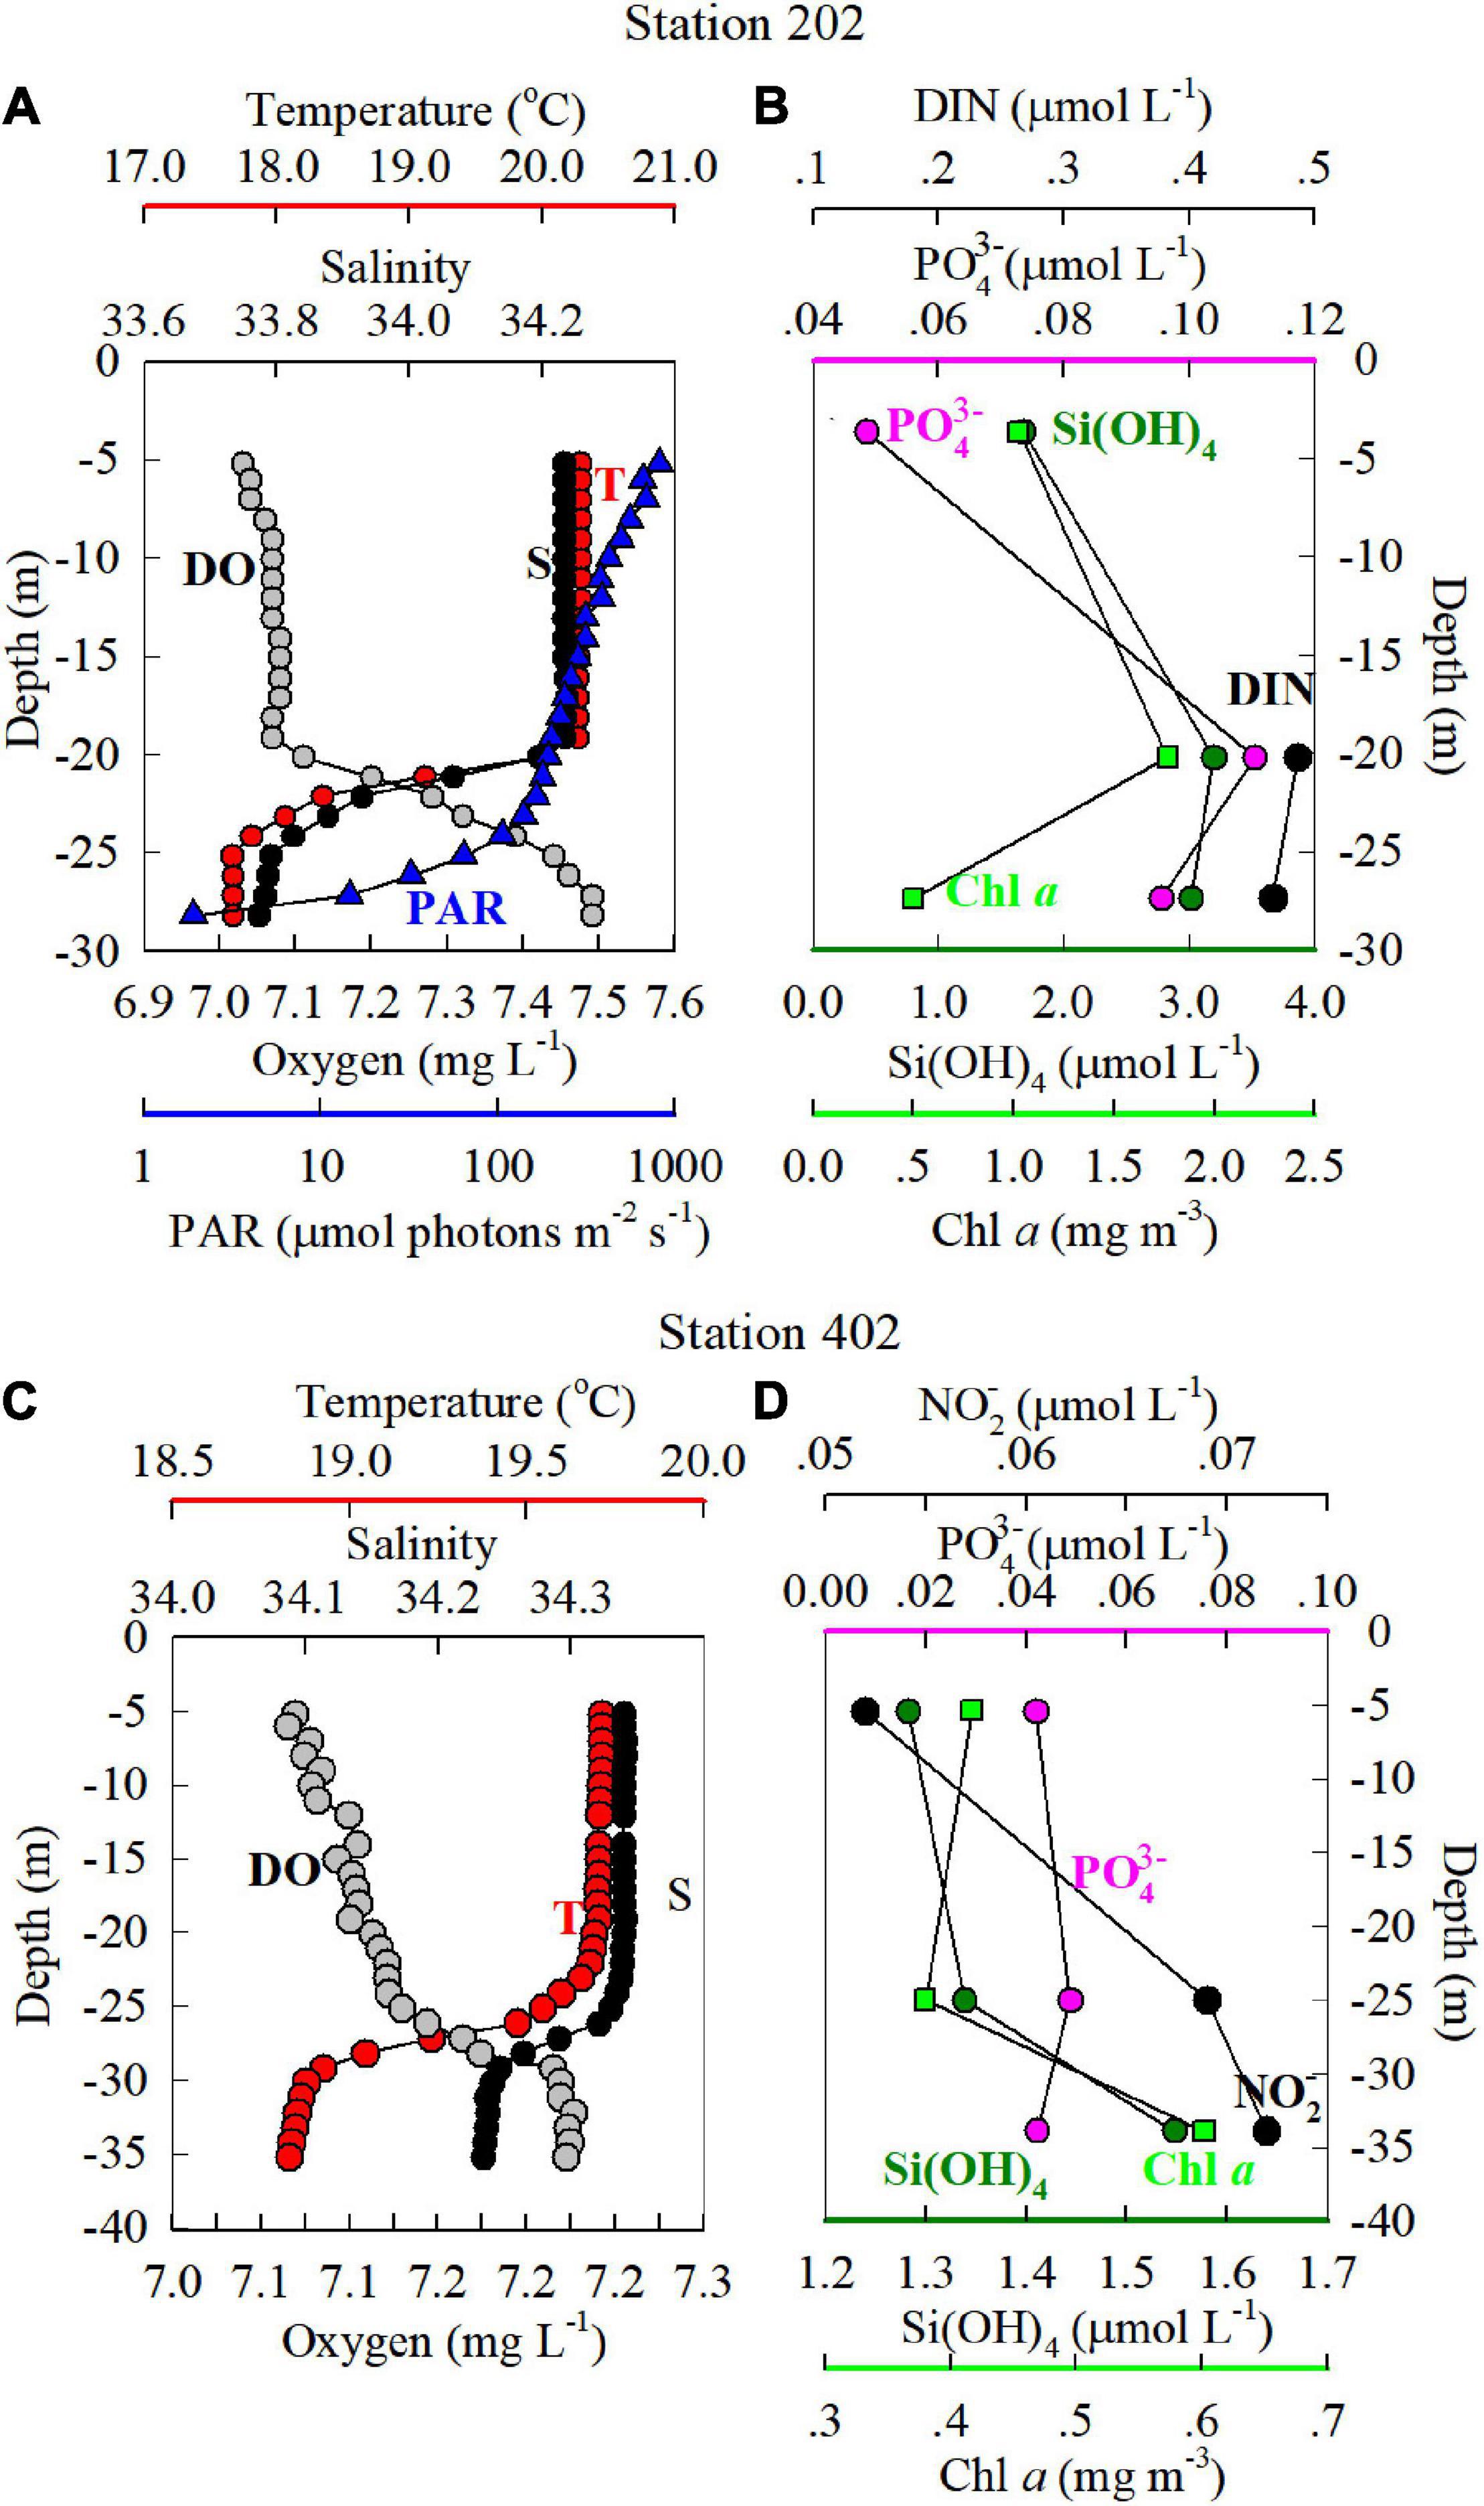
Figure 4. Vertical profiles of T (°C), S, dissolved oxygen (DO, mg L–1) (A,C), DIN, PO43−, and Si(OH)4 (μmol L–1) and Chl a (mg m–3) (B,D) at stations s202 and s402 (see Figure 1) in the NSCS shelf, winter 2008. Chl a concentrations were determined using a Turner fluorometer fitted with a red-sensitive photomultiplier (Parsons et al., 1984). The irradiance (photosynthetically active radiation, PAR, in μmol photons m–2 s–1) at station s202 sampled at 12:40 (GTM + 8) in the afternoon is also shown in Figure 4C; PAR at station s402 is not shown as the sampling time was at 19:20 (GTM + 8) in the evening. The blue dashed line indicates the 27 m depth where the irradiance was 1% of surface PAR which could support about half of the light-saturated primary productivity (Xie et al., 2015). Values of T, S, DO, and PAR were determined using a conductivity-temperature-depth (CTD) recorder per meter throughout the whole water column. The DIN concentration in the surface layer at s202 (Figure 4B) was below the limit of 0.1 detections, but it was quite high in the bottom layer.
Reflecting the nature of downwelling circulation, the upper portion of the water column was well mixed, whereas the bottom was stratified. These characteristics are shown in the profiles of all variables at these two stations (Figure 4). In addition, we estimated that the vertical photosynthetically active radiation (PAR) gradient at s202, which was 106 μmol photons m–2 s–1 near the bottom of the water column (24 m depth) and 9% of surface irradiance (Figure 4A), supporting about half of light-saturated primary productivity (Xie et al., 2015). We do not show PAR at station s402 because sampling took place at 19:20 (GTM + 8). Clearly, the enhanced nutrient and Chl a concentrations with increasing depth at these two stations provide further evidence of the strong downslope nutrient and Chl a supply from nearshore waters.
Results and Discussion
Characteristics of the Ecosystem Response
The spatiotemporal variability of the observed biogeochemical responses to the intensified downwelling circulation is illustrated by the model outputs. Figure 5 shows the development of the velocities and temperature in the surface layer from initial to mature downwelling stages on Days 10 and 40, respectively. The conditions in the bottom layer are shown in Figure 6. The general flow response to the northeasterly winds over the shelf was characterized by gradually enhanced downwelling circulation from Days 10 to 40, as the northeasterly wind spun up the downwelling circulation. Surface currents flowed mainly following the isobaths (Figure 5), and bottom currents tended to cross the isobaths, and transport waters downslope (Figure 6), particularly over the widened shelf near Transects 2 and 4. Within the downwelling circulation, the alongshore current from the ECS with lower temperatures of ∼18.0–20.0°C initially formed a long-range, narrow pathway along the coast and subsequently spread seaward across the isobaths at the bottom (Figures 5C,D, 6C,D) due to the widened shelf dynamics outlined by Gan et al. (2013). Our simulated downwelling circulation and temperature distributions agree well with the features revealed by field observations (Figures 2–4).
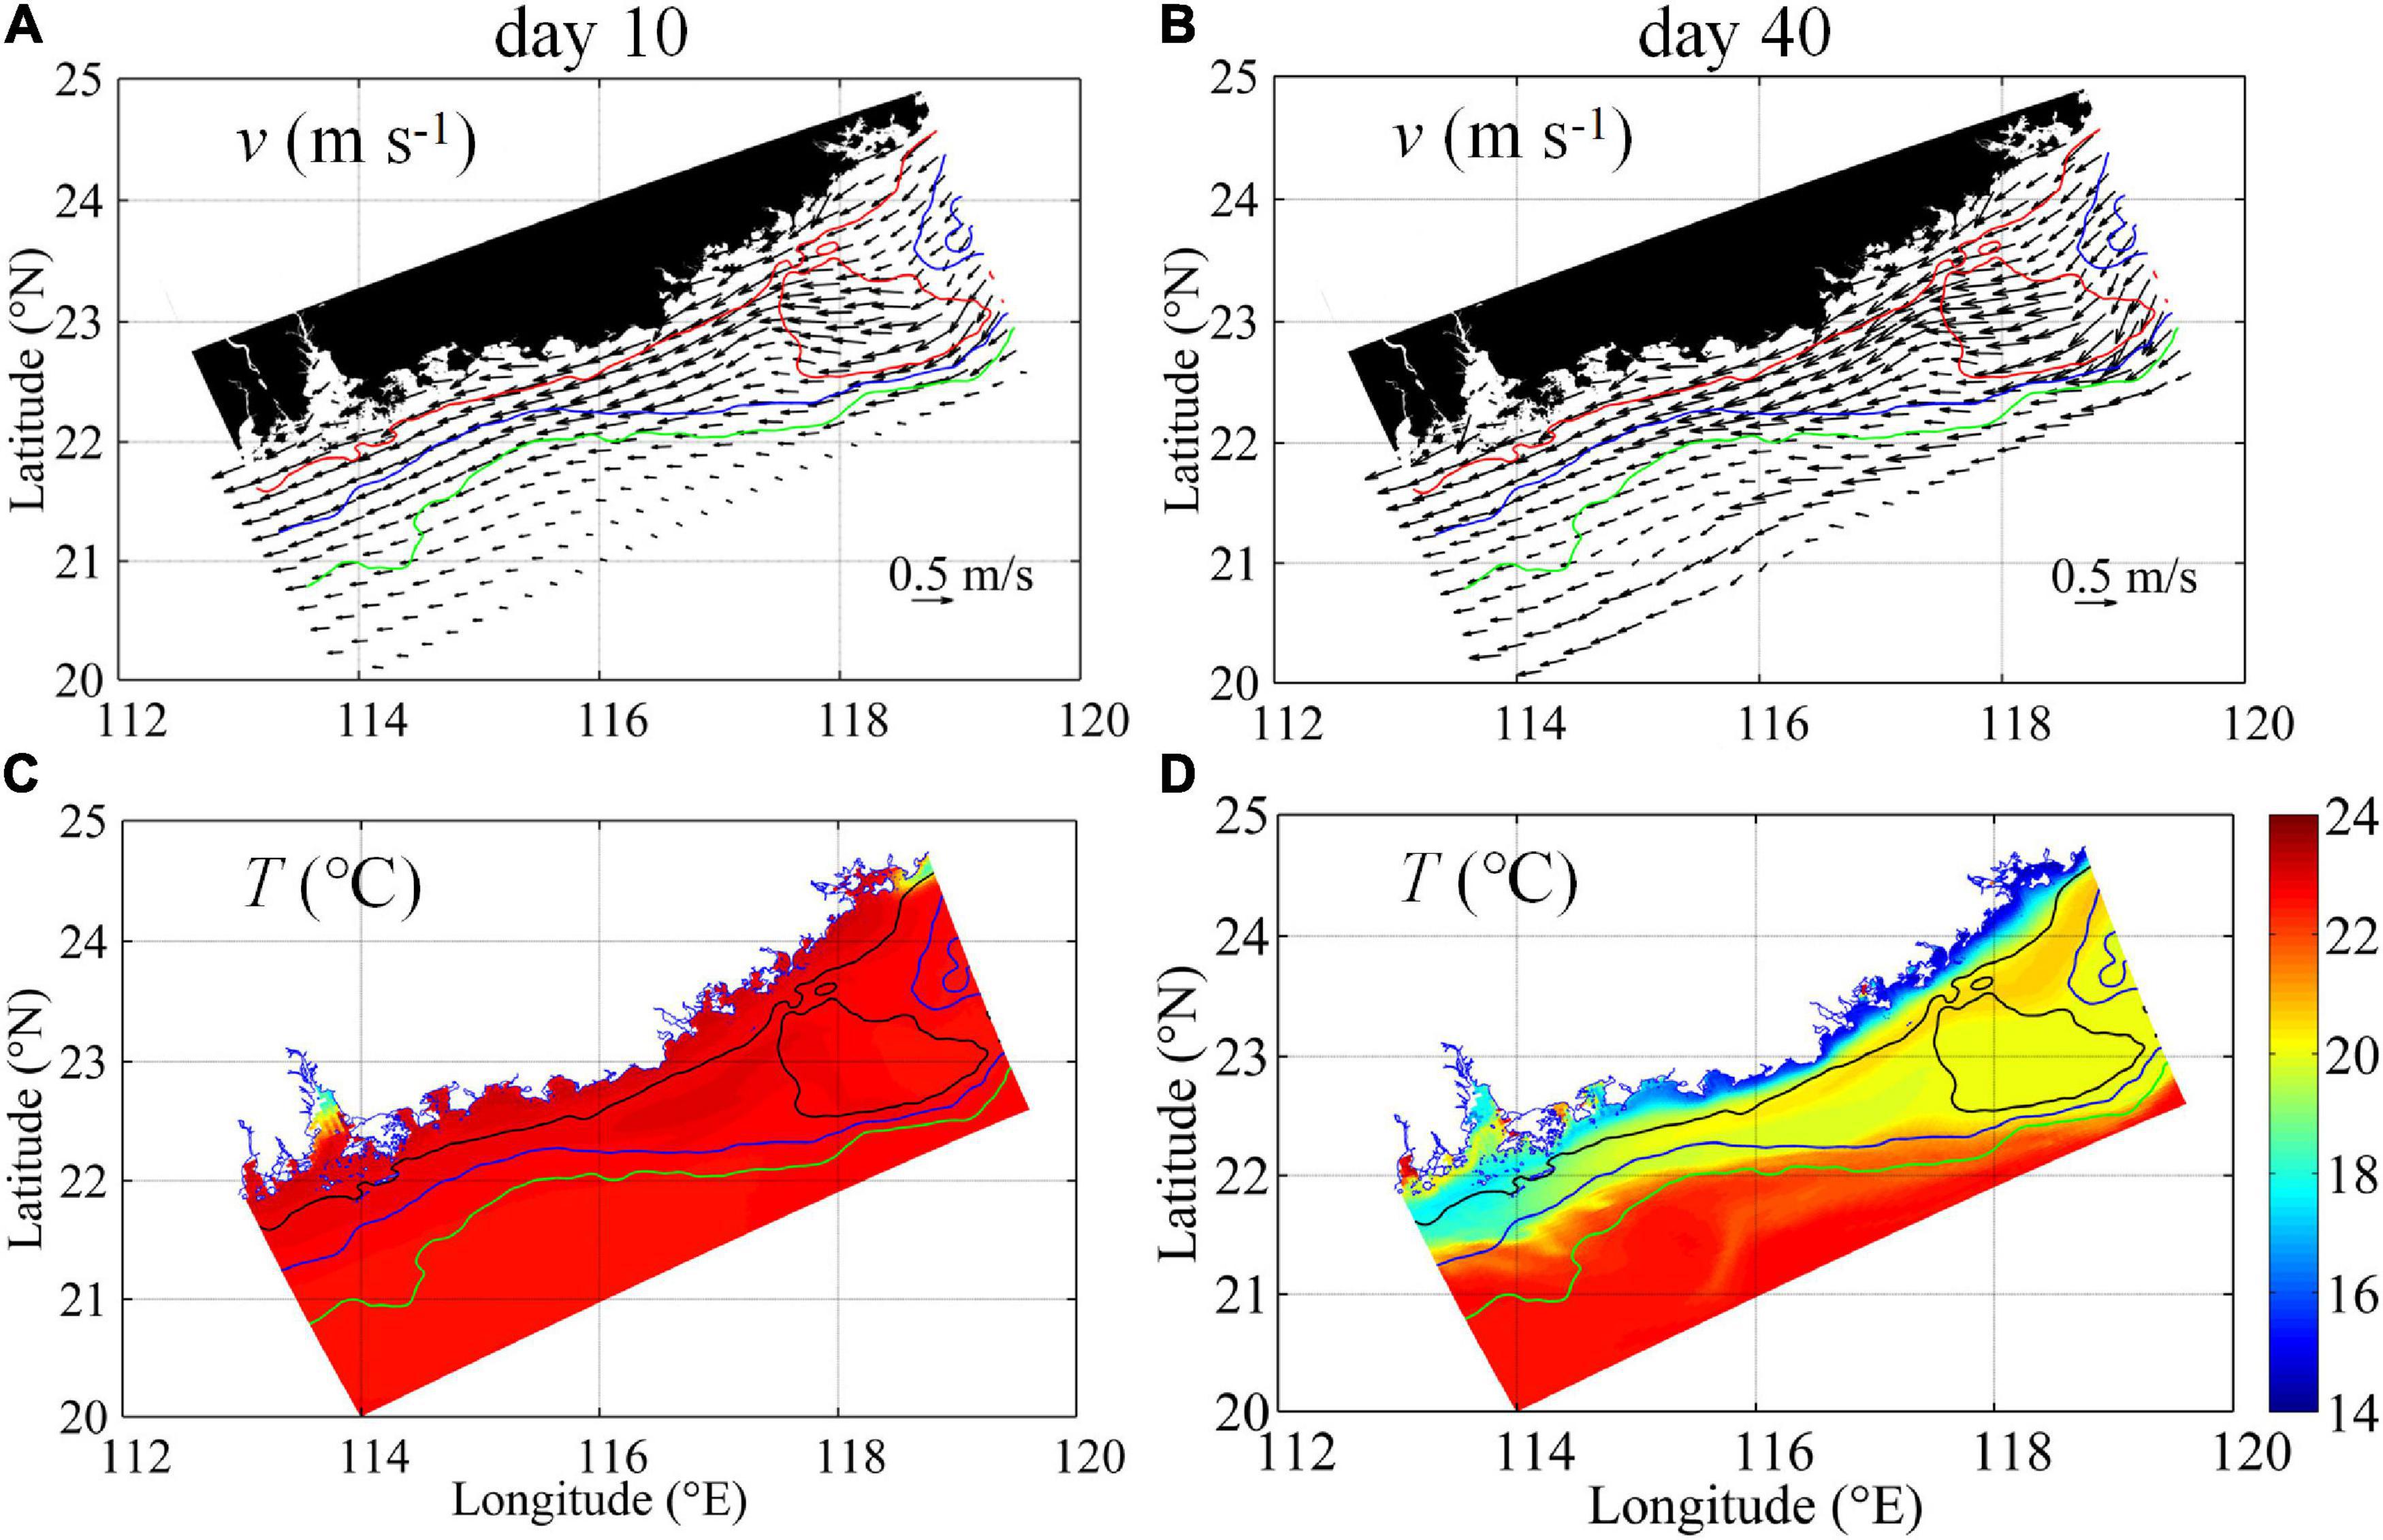
Figure 5. Surface velocity vectors (m s–1) (A,B) and temperature (°C) (C,D) on Day 10 (left) and on Day 40 (right). The red, blue, and green lines mark the 30, 50, and 80 m isobaths (A,B), and the black, blue, and green lines indicate the 30, 50, and 80 m isobaths (C,D), respectively.
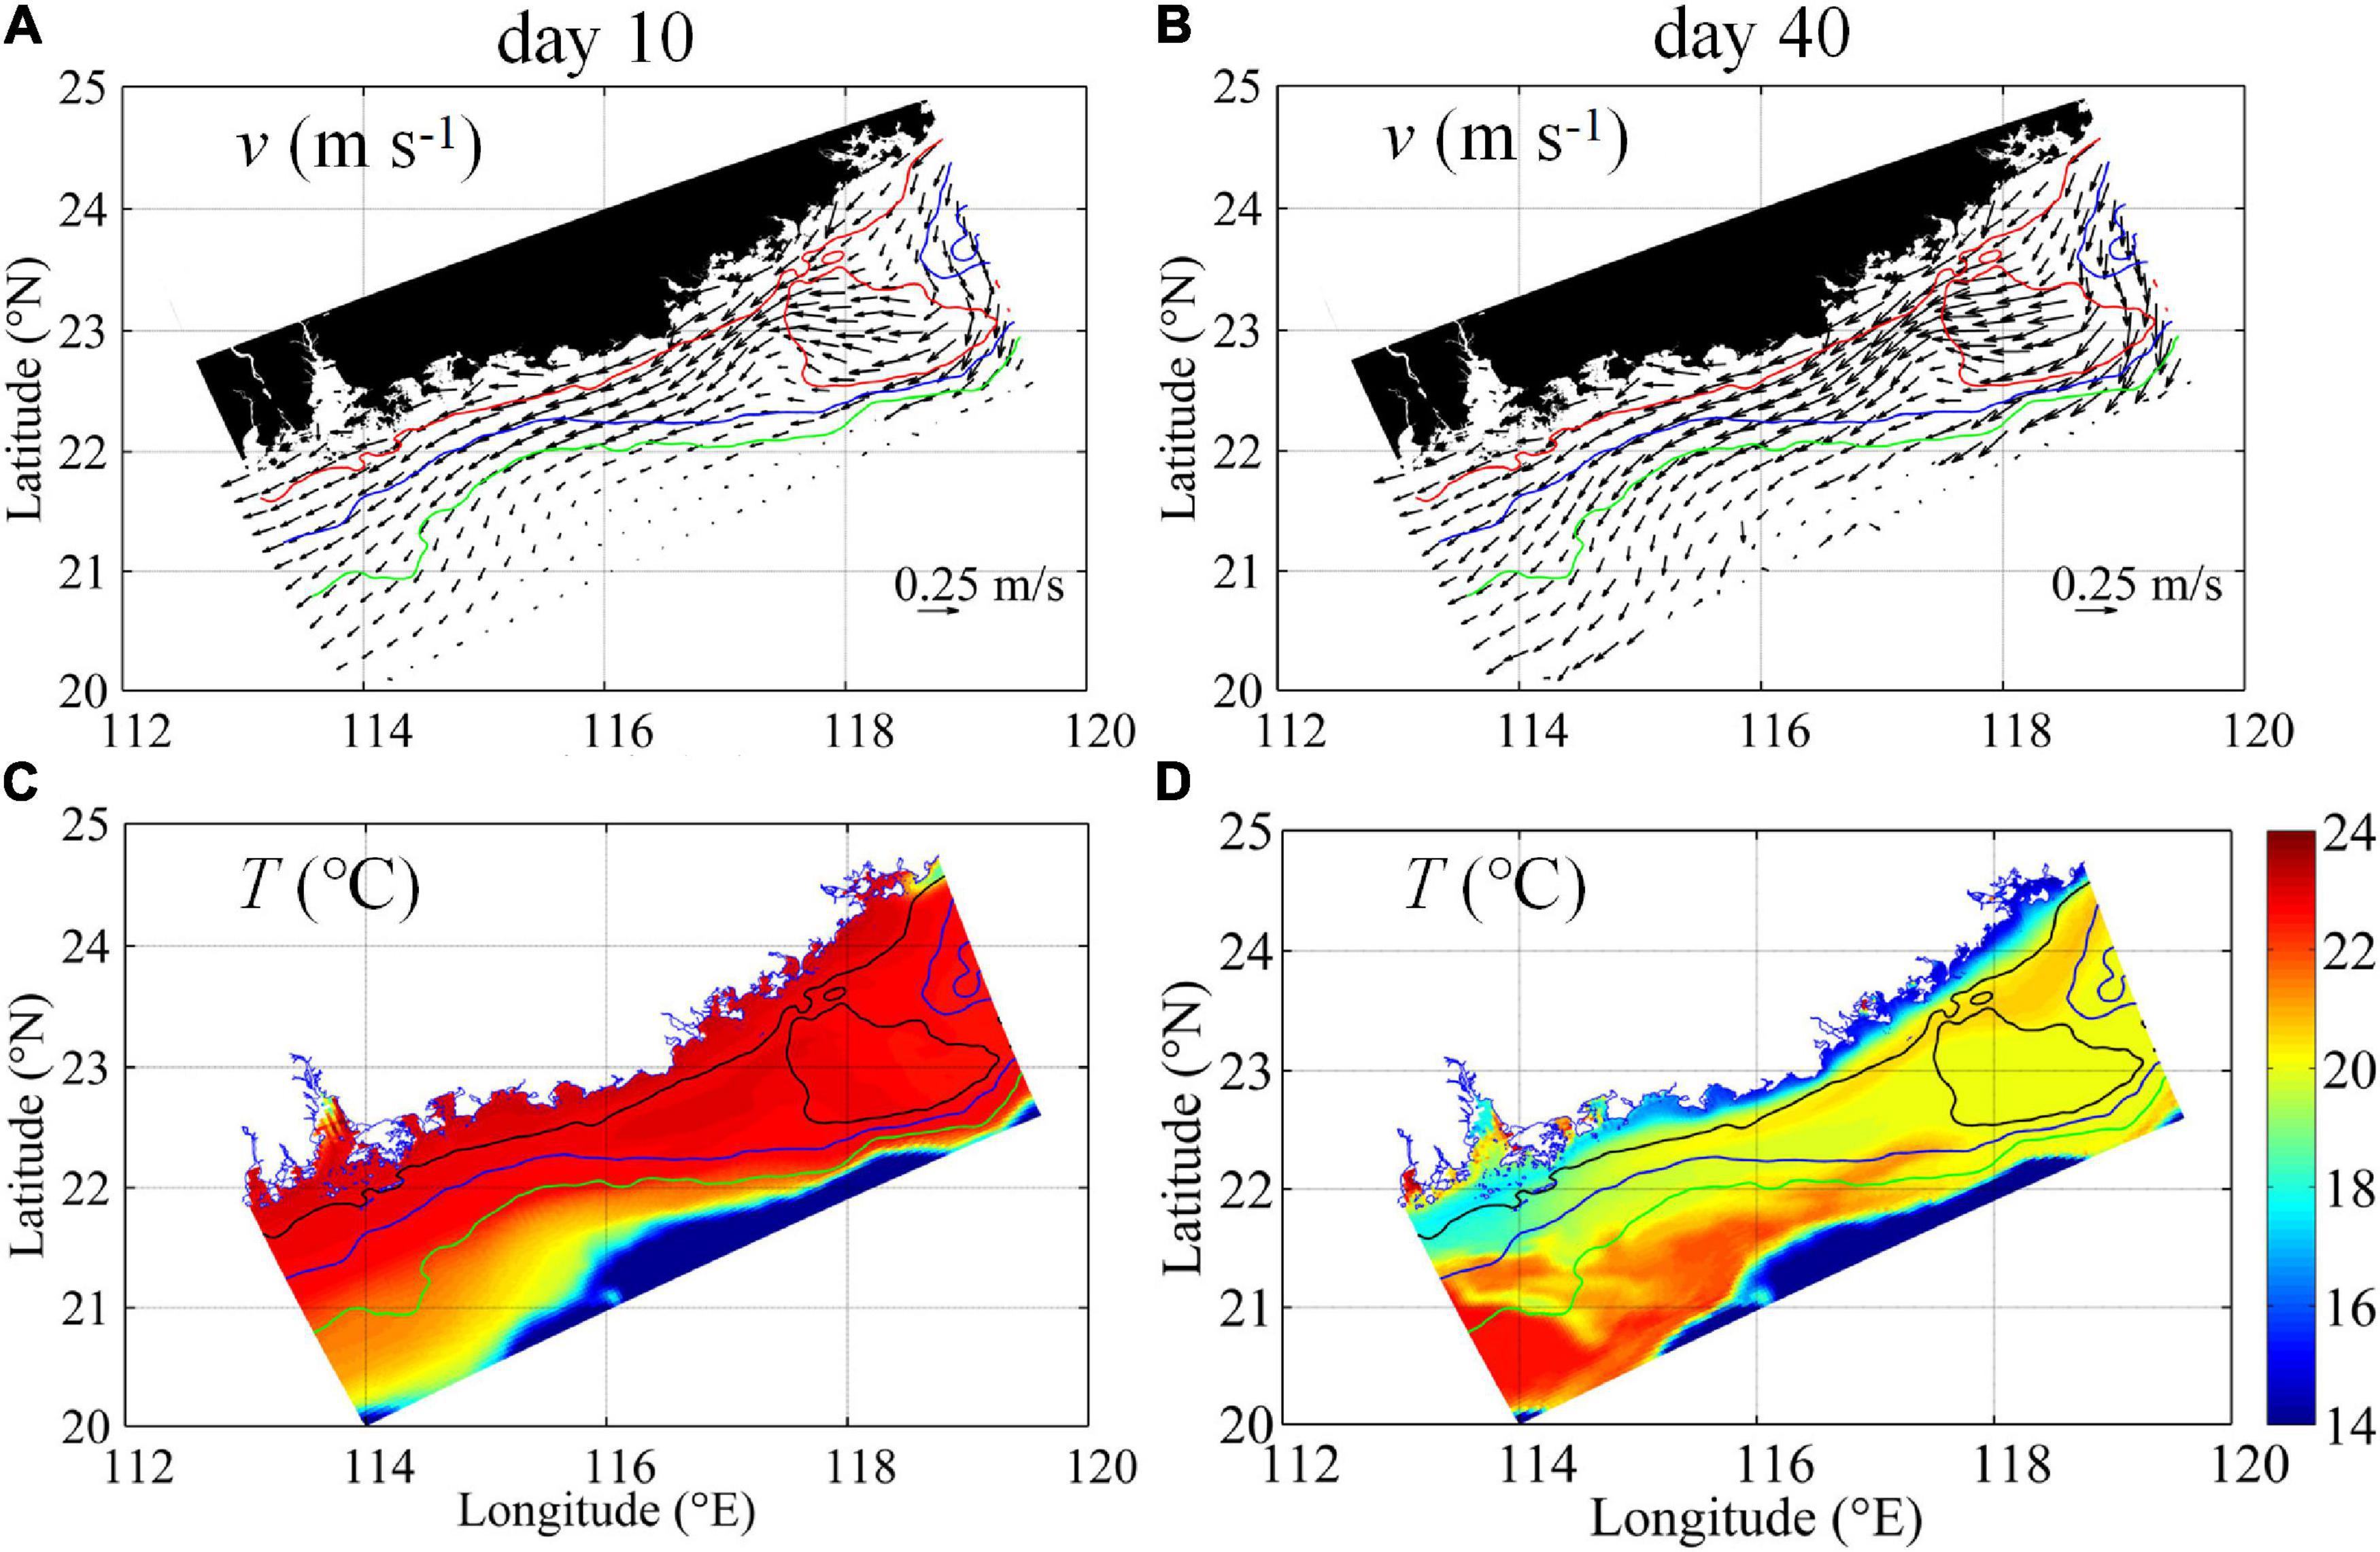
Figure 6. Bottom velocity vectors (m s–1) (A,B) and temperature (°C) (C,D) on Day 10 (left) and on Day 40 (right). The red, blue, and green lines mark the 30, 50, and 80 m isobaths (A,B), and the black, blue, and green lines indicate the 30, 50, and 80 m isobaths (C,D), respectively.
The physical characteristics of downwelling circulation control the nutrient distribution/transport and shape of the distributions of biological variables in the NSCS shelf. In general, waters with high N concentrations from the Changjiang River were transported southward along the coast within the 30 m isobath (Figure 7). Phytoplankton (shown as chlorophyll) during the initial and mature stages correlated with the N distribution but extended further offshore (to the ∼50 m isobath). Because of the time lag between P and Z (Spitz et al., 2005; Gan et al., 2010) and the movement of the coastal current, relatively high Z and D concentrations correlated spatially with N and P concentrations, with the maximal P and D concentrations occurring farther downstream. These N, P, Z, and D distributions demonstrate that alongshore downwelling circulation is one of the major controllers of the biomass distribution in the NSCS shelf, as originally noted by Chen (2008) and Han et al. (2013).
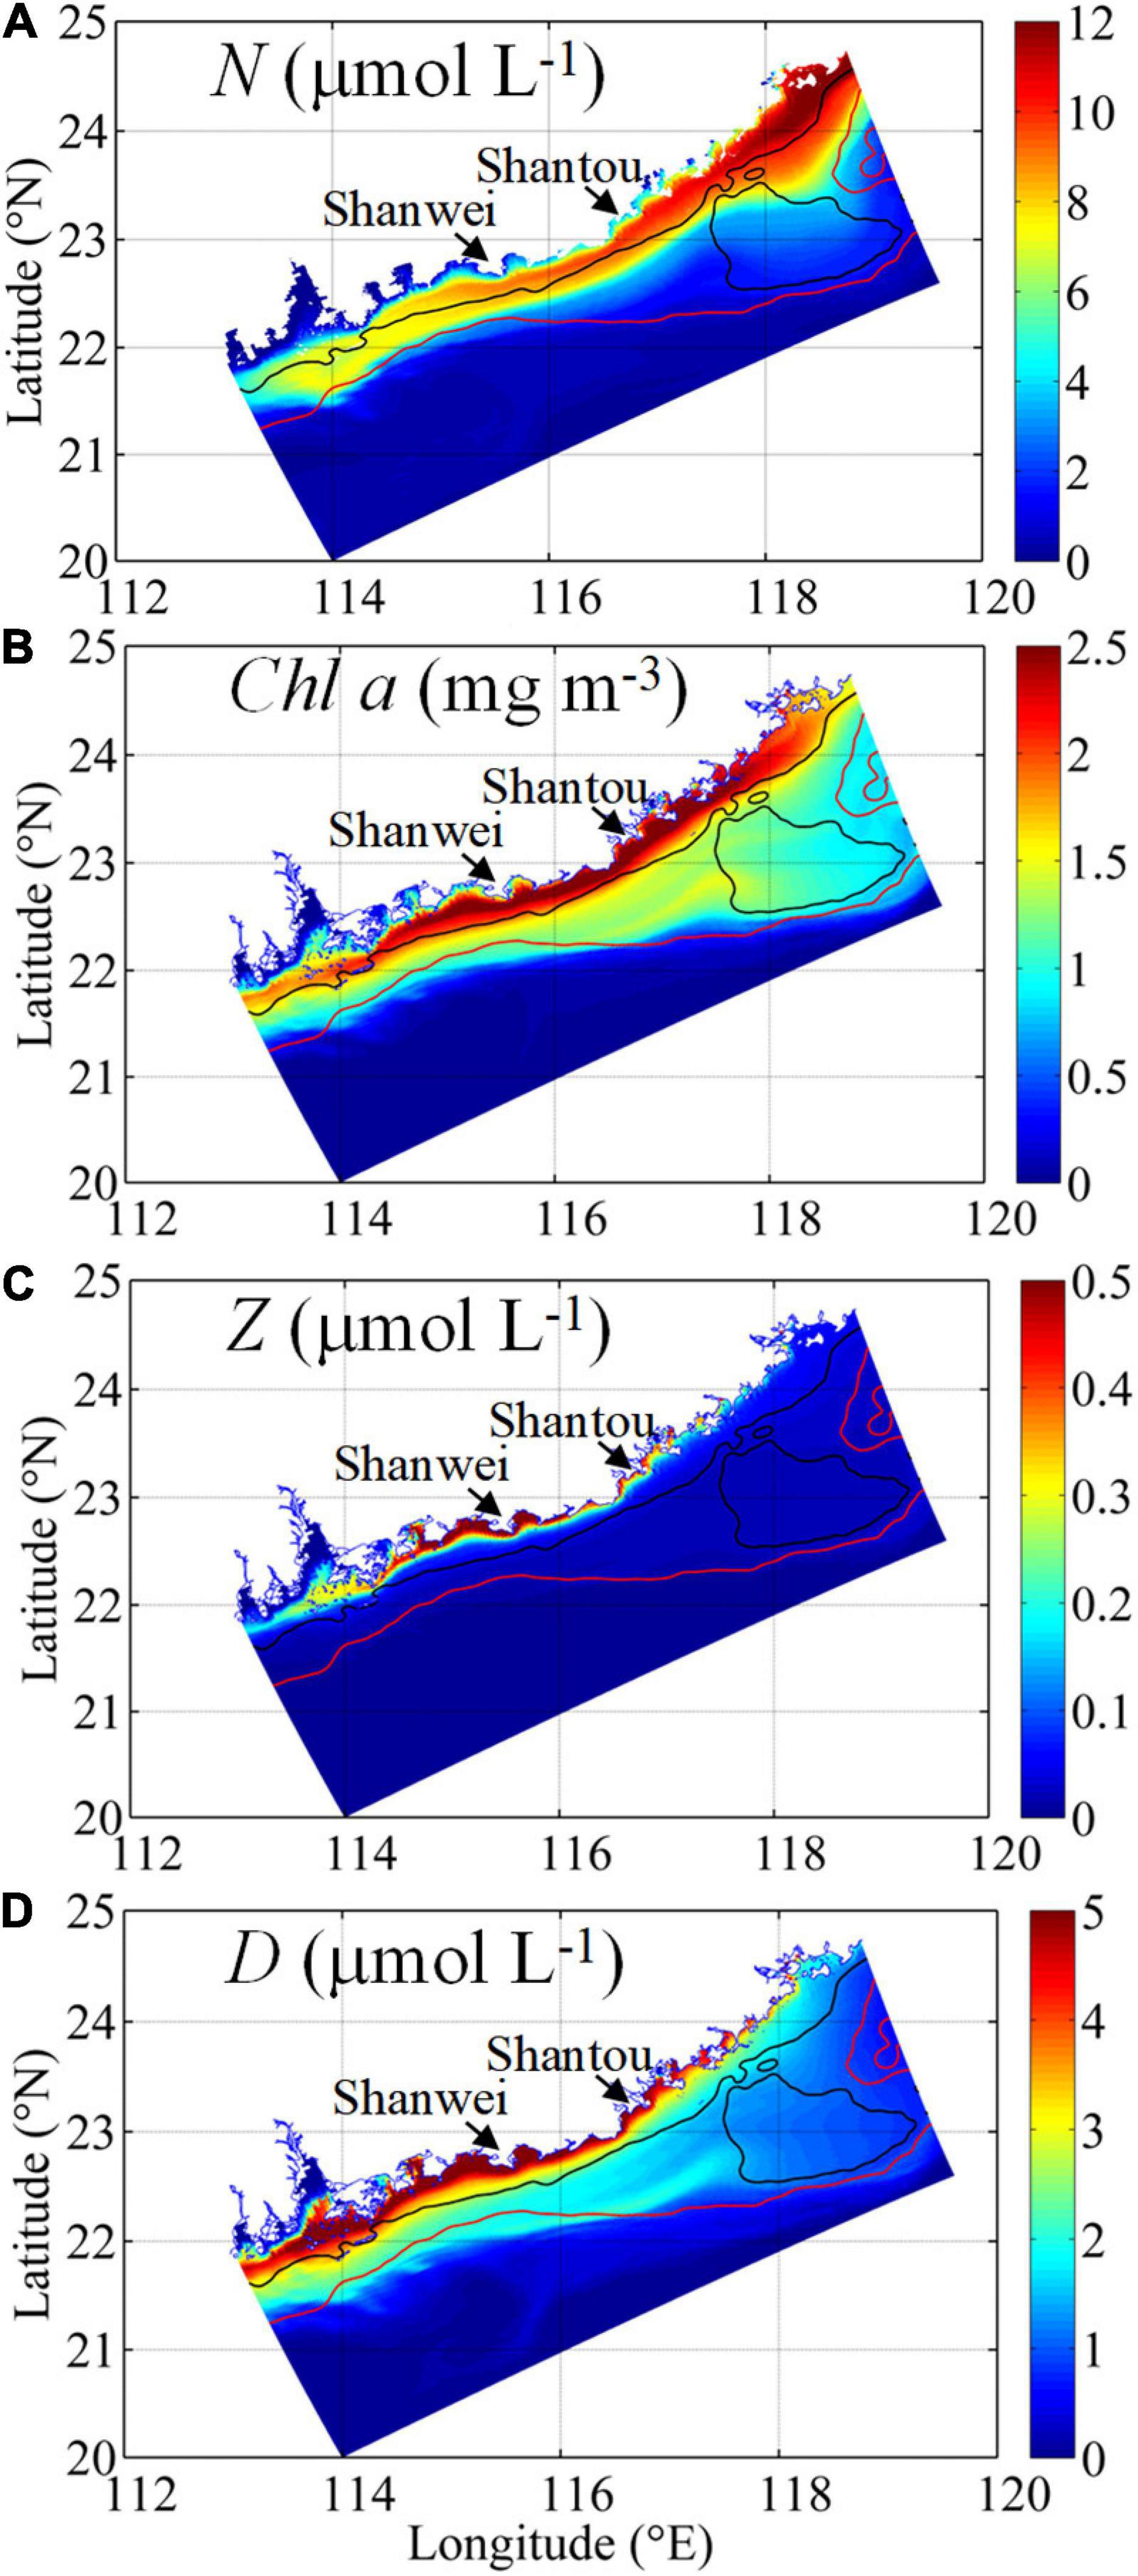
Figure 7. Surface (A) nitrate, NO3 (N, μmol L–1), (B) chlorophyll (Chl a, mg m–3), (C) zooplankton (Z, μmol L–1), and (D) detritus (D, μmol L–1) on Day 40.
Vertical Ecosystem Response
Figure 8 shows the physical and biological variables in the cross-shelf Transects 2 and 4 for Day 40 to illustrate the variable three-dimensional response of the ecosystem to downwelling circulation. In Transect 2, the southward downwelling alongshore current formed a cold and nutrient-rich water zone in the inner shelf, which was subsequently advected downslope in the oligotrophic surface. The downslope transport was stronger and reached about the 100 m isobath along Transect 2 near the head of the widened shelf where the strongest downwelling occurred (Gan et al., 2013; Figures 8A,C). Weaker downwelling was evidenced in Transect 4 due to the less steep shelf slope.
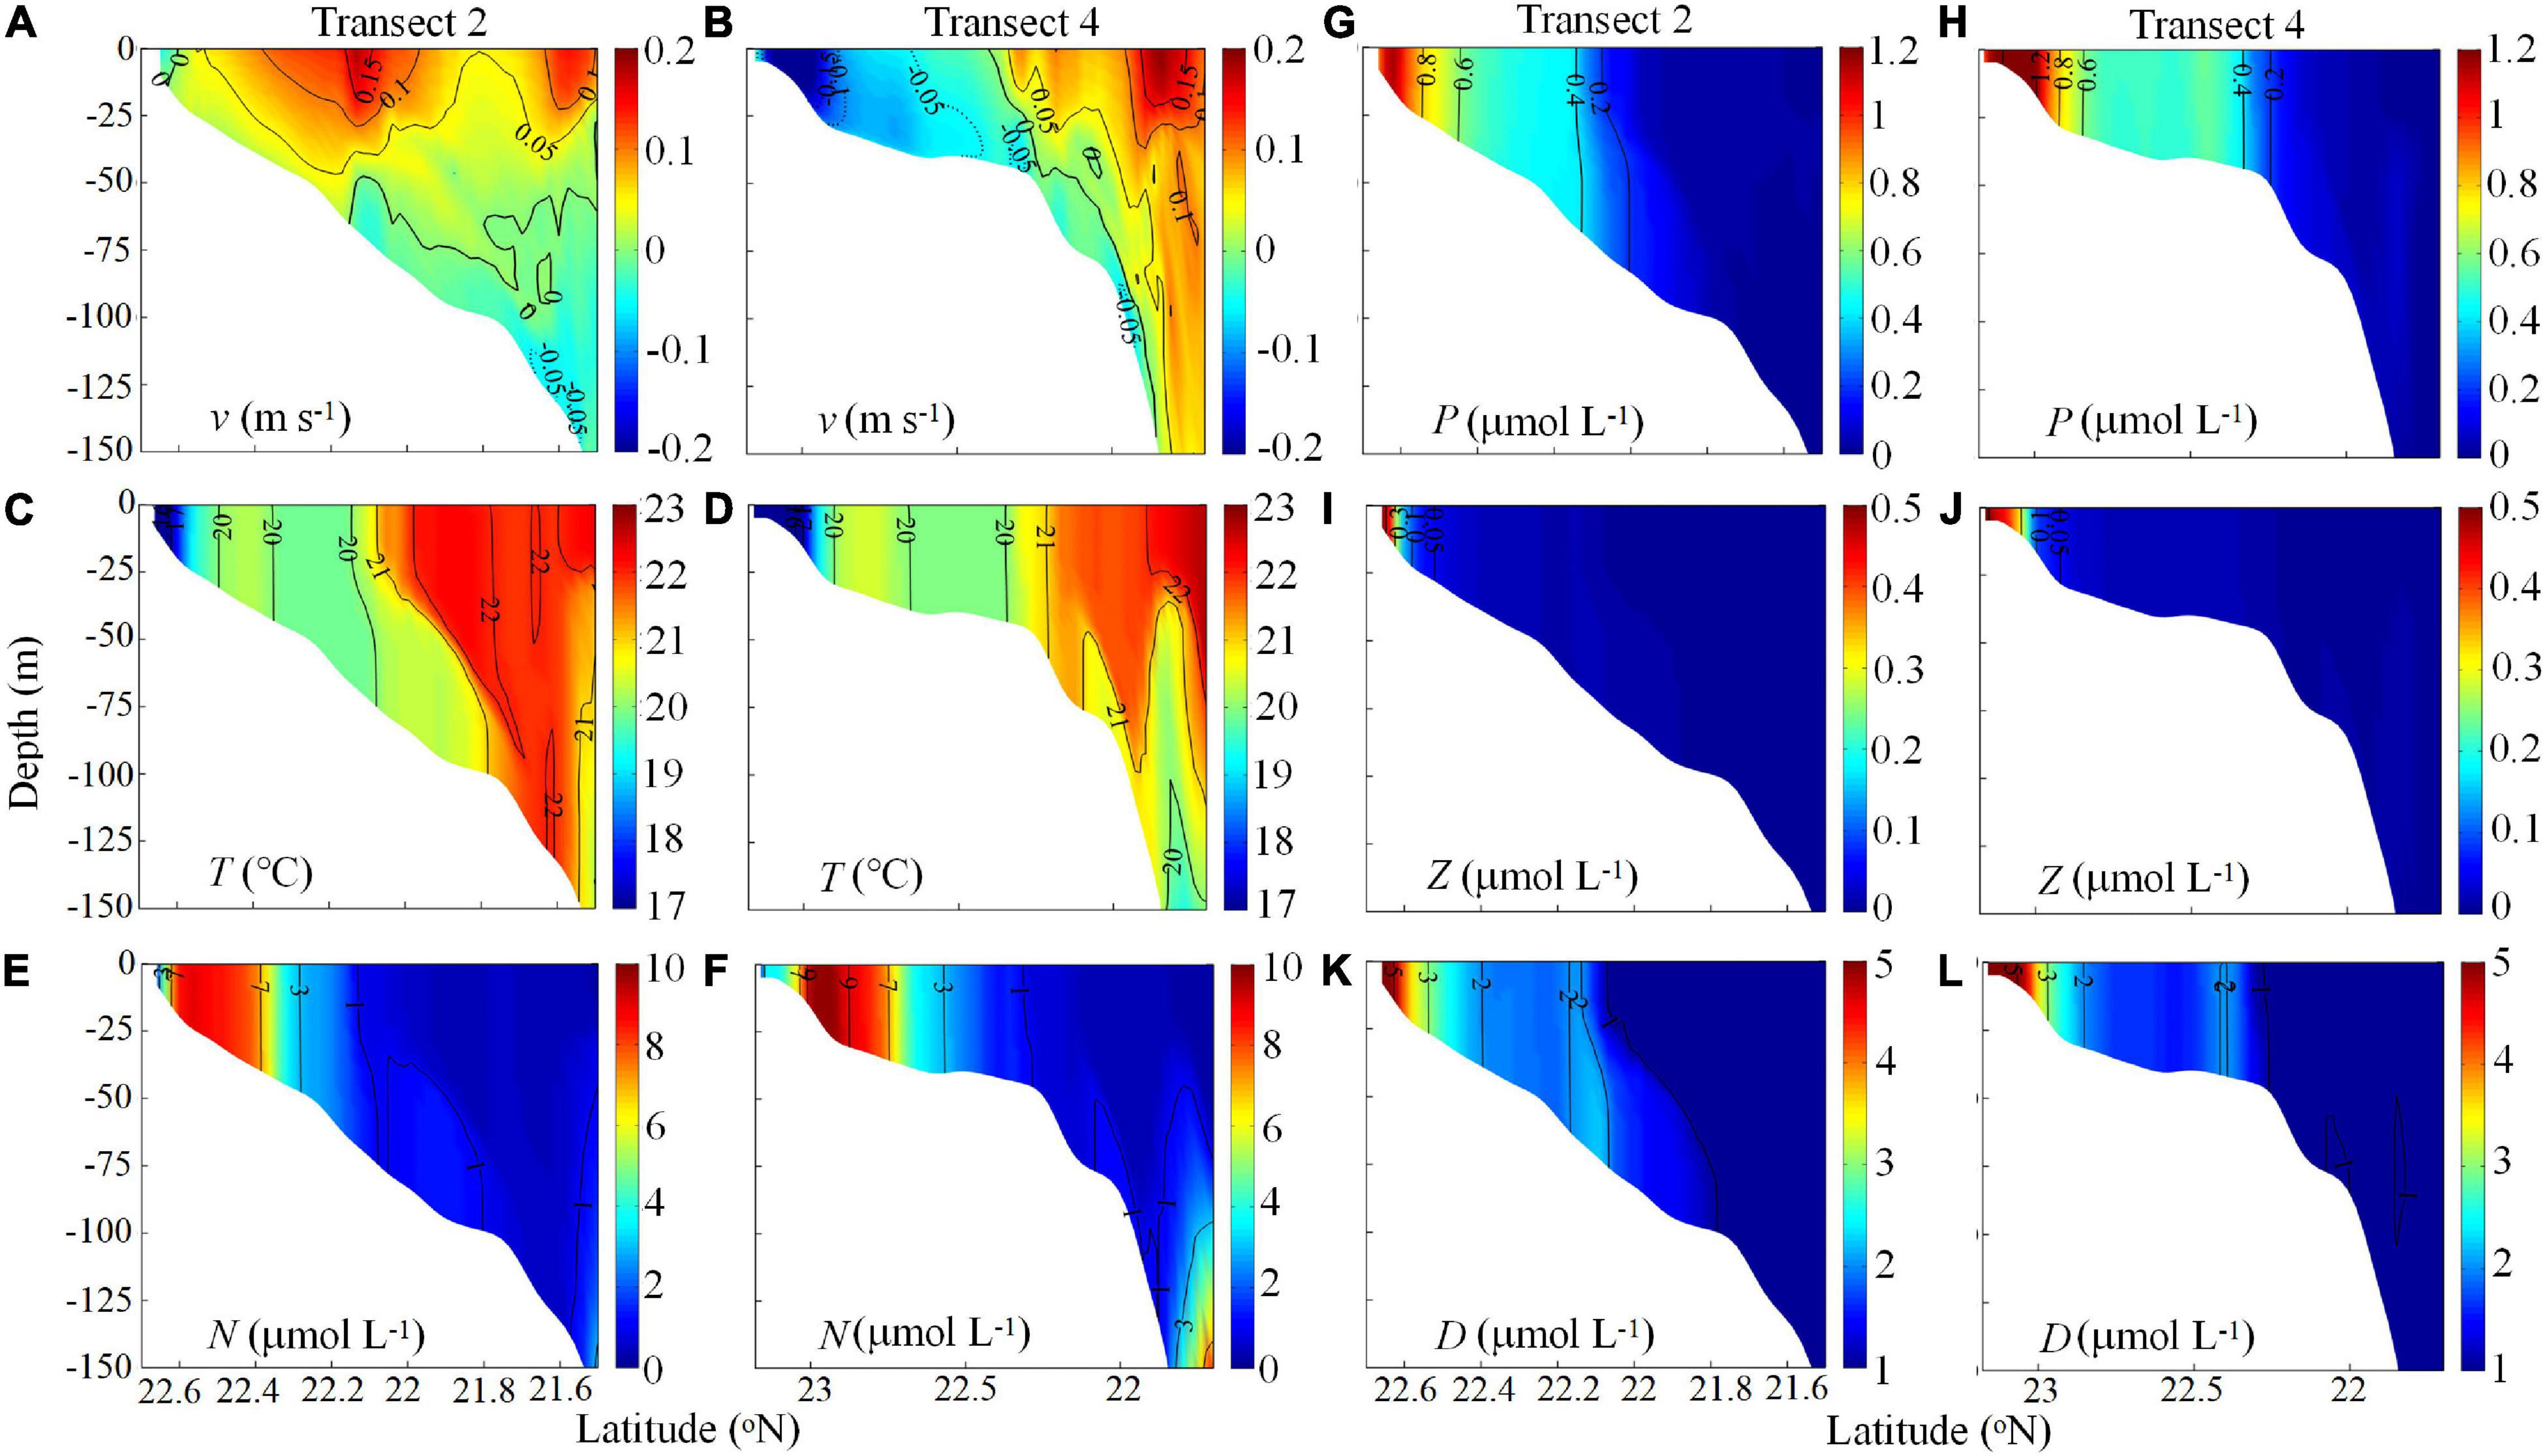
Figure 8. Cross-shelf velocity (v, m s–1) (negative seaward) (A,B), T (°C) (C,D), NO3 (N, μmol L–1) (E,F), phytoplankton (P, μmol L–1) (G,H), Z (μmol L–1) (I,J), and D (μmol L–1) (K,L) along Transects 2 and 4 on Day 40.
The locations of high P along Transects 2 and 4 were consistent with the nutrient distributions. In addition to the phytoplankton bloom being advected southward by the intensified CCC along Transect 2, the downslope transport of high-nutrient waters resulted in a marked phytoplankton bloom in the bottom-trapped cold water. With increasing depth, however, the phytoplankton bloom tended to diminish due to decreased nutrient concentrations and irradiance limitation. Unlike Transect 2, the bloom in the bottom along Transect 4 was weaker due to the weaker cross-shore transport. These results resemble the observed chlorophyll concentrations shown in Figures 2, 3.
As the CCC not only transported nutrients and particles (Chen, 2008; Han et al., 2013) but also advected the phytoplankton biomass nearshore, we estimated that the southward CCC stimulated 33–74% of new production and 14–22% of primary production of the NSCS shelf at depths below 100 m (Han et al., 2013). In a parallel study at the same location, Meng et al. (2017) estimated that the total dissolved organic carbon (DOC) in downwelling cross-isobath transport was slightly higher than that advected by the CCC. Considering the necessary conditions of sufficient light irradiance and nutrients in the cross-shore current, we believe that downwelling may enhance chlorophyll and biological productivity due to stimulation by the downslope transport of nutrients.
In general, the Z and D distributions also followed the N and P distributions and were positively correlated with the intensity of downwelling circulation along both transects. This positive correlation reflects the combined effects of cross-shelf circulation and the responses to nutrients and P. In particular, D, representing detritus productivity in the downwelled wedge, indicates potential production in this region. Field observations also indicated the dominance of diatoms in the phytoplankton community (∼80% of total biomass, B. Q. Huang, unpublished data) and much higher biogenic silica (M. H. Dai, unpublished data) in the downwelling circulation. Intensified DOC export via downwelling was also found by Meng et al. (2017). In addition, picoplankters were abundant; Pan et al. (2005) reported growth of Synechococcus and Prochlorococcus in cold, fresh downwelling circulation.
Spatial-Temporal Disparities of N, P, Z, and D
Figure 9 shows the time series of the depth-integrated average physical and biological properties along the 20 m isobath. The general velocity response to northeasterly winds on the shelf was characterized by gradual enhancement of the alongshore current, which reached a quasi-steady state from Days 10 to 20 (Figure 9A).
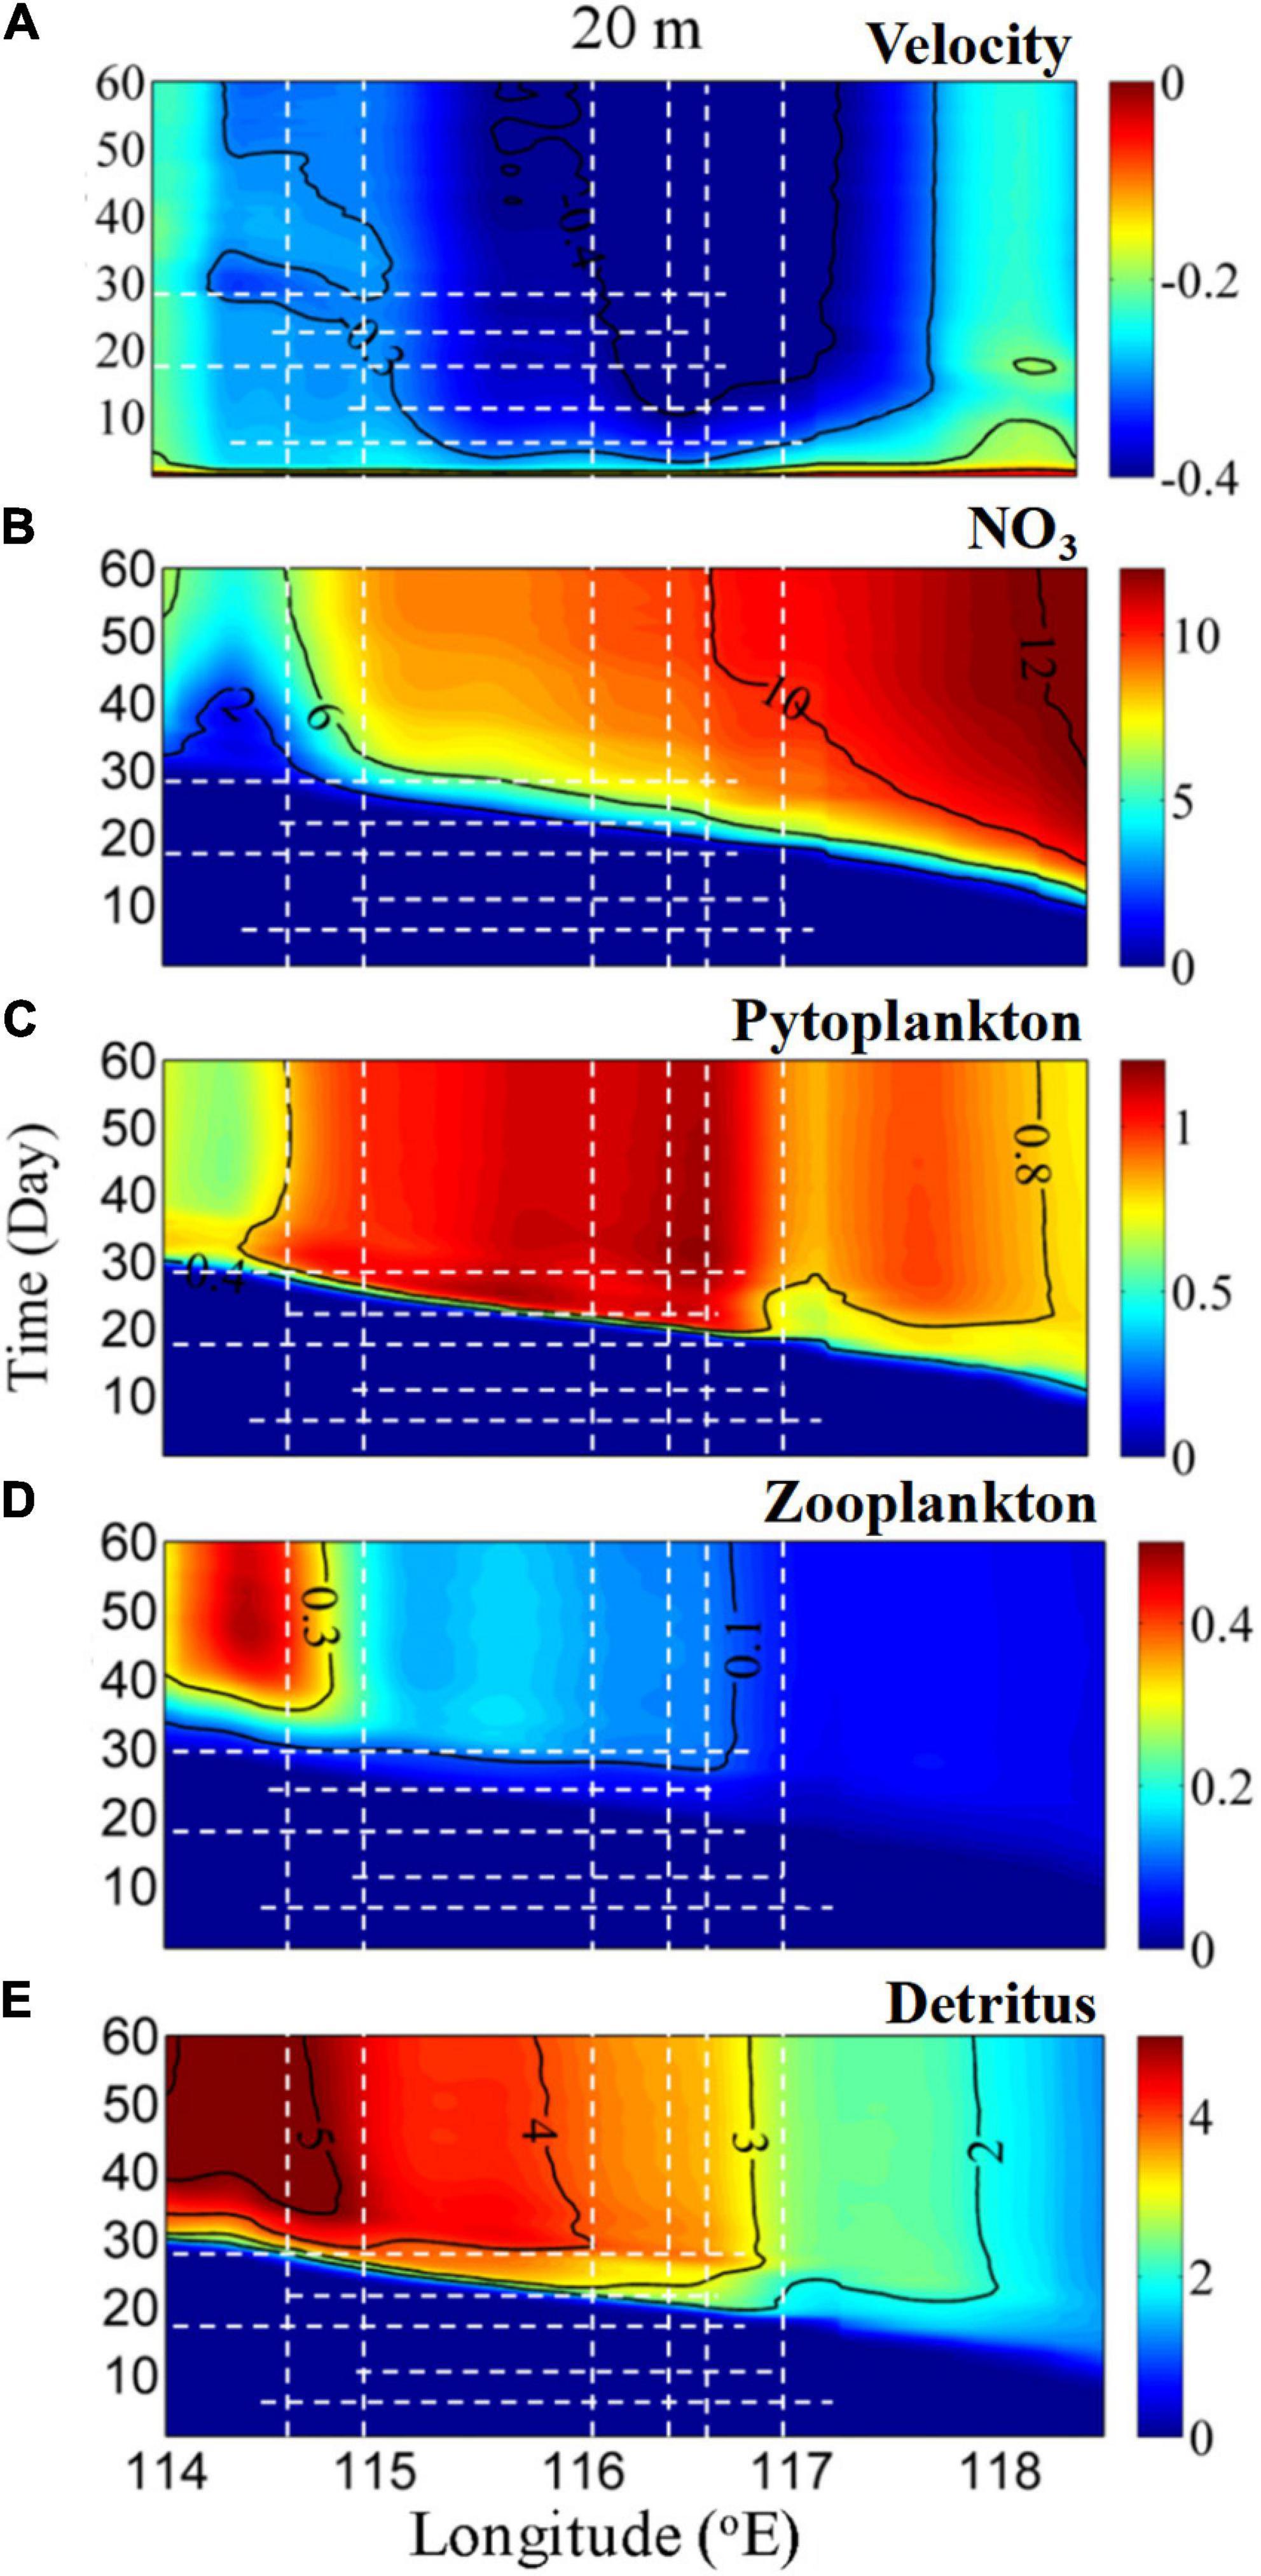
Figure 9. Time series of the alongshore depth-integrated average (A) v (m s–1; positive and negative values represent shoreward and seaward, respectively), (B) NO3 (N, μmol L–1), (C) P (μmol L–1), (D) Z (μmol L–1), and (E) D (μmol L–1) as a function of the longitudinal distance along the 20 m isobath. The dashed white lines indicate the days of major events as mentioned in the main text.
In general, N was abundant and increased progressively with time and from the western part toward the eastern part of the shelf, as the alongshore current advected nutrient-rich water upstream (Figures 9A,B). The N flux by the alongshore current was ∼1,312–2,310 mol s–1, which was comparable with a value of 1,430 ± 1,024 mol s–1 estimated by Han et al. (2013). A similar response occurred in P as productivity was stimulated by N (Figure 9C). This is in agreement with our in situ observed spatial nutrient and Chl a variability, which also resembled the features of satellite-derived chlorophyll a measurements reported by Han et al. (2013).
High Z concentrations appeared from Days 20 to 30 and reached a maximum in the west of 115°E (Figure 9D). The time lag between P and Z was of about 5 days, which was comparable with the 3- to 9-day lag reported for an upwelling ecosystem (Spitz et al., 2005; Gan et al., 2010). As a result of the high P and Z concentrations, downstream-advected D generally increased after Day 10 and was transported westward with a pattern comparable with that of Z (Figure 9E). The concomitant effects of the alongshore currents and the embedded food web dynamics play an important role in the transport of these variables. Similar spatial disparities in the biological response occurred in the cross-shore direction (Figure 8) because of the joint effects of surface cross-shore currents and food web dynamics. Physical and biological forcing characterized the biological responses in the alongshore downwelling circulation, in agreement with prior studies (Spitz et al., 2005; Baird et al., 2007; Gan et al., 2010).
Cross-Isobath Nutrient Transport
In the downwelling circulation, the alongshore current transports nutrient-rich coastal water downstream, and the cross-shore downslope transport delivers high N and D to deeper waters, which would be stored at greater depth and potentially support P utilization. We evaluated the respective seaward cross-isobath My, Ny, and Dy along the 30 and 50 m isobaths over 60 days (Figure 10).
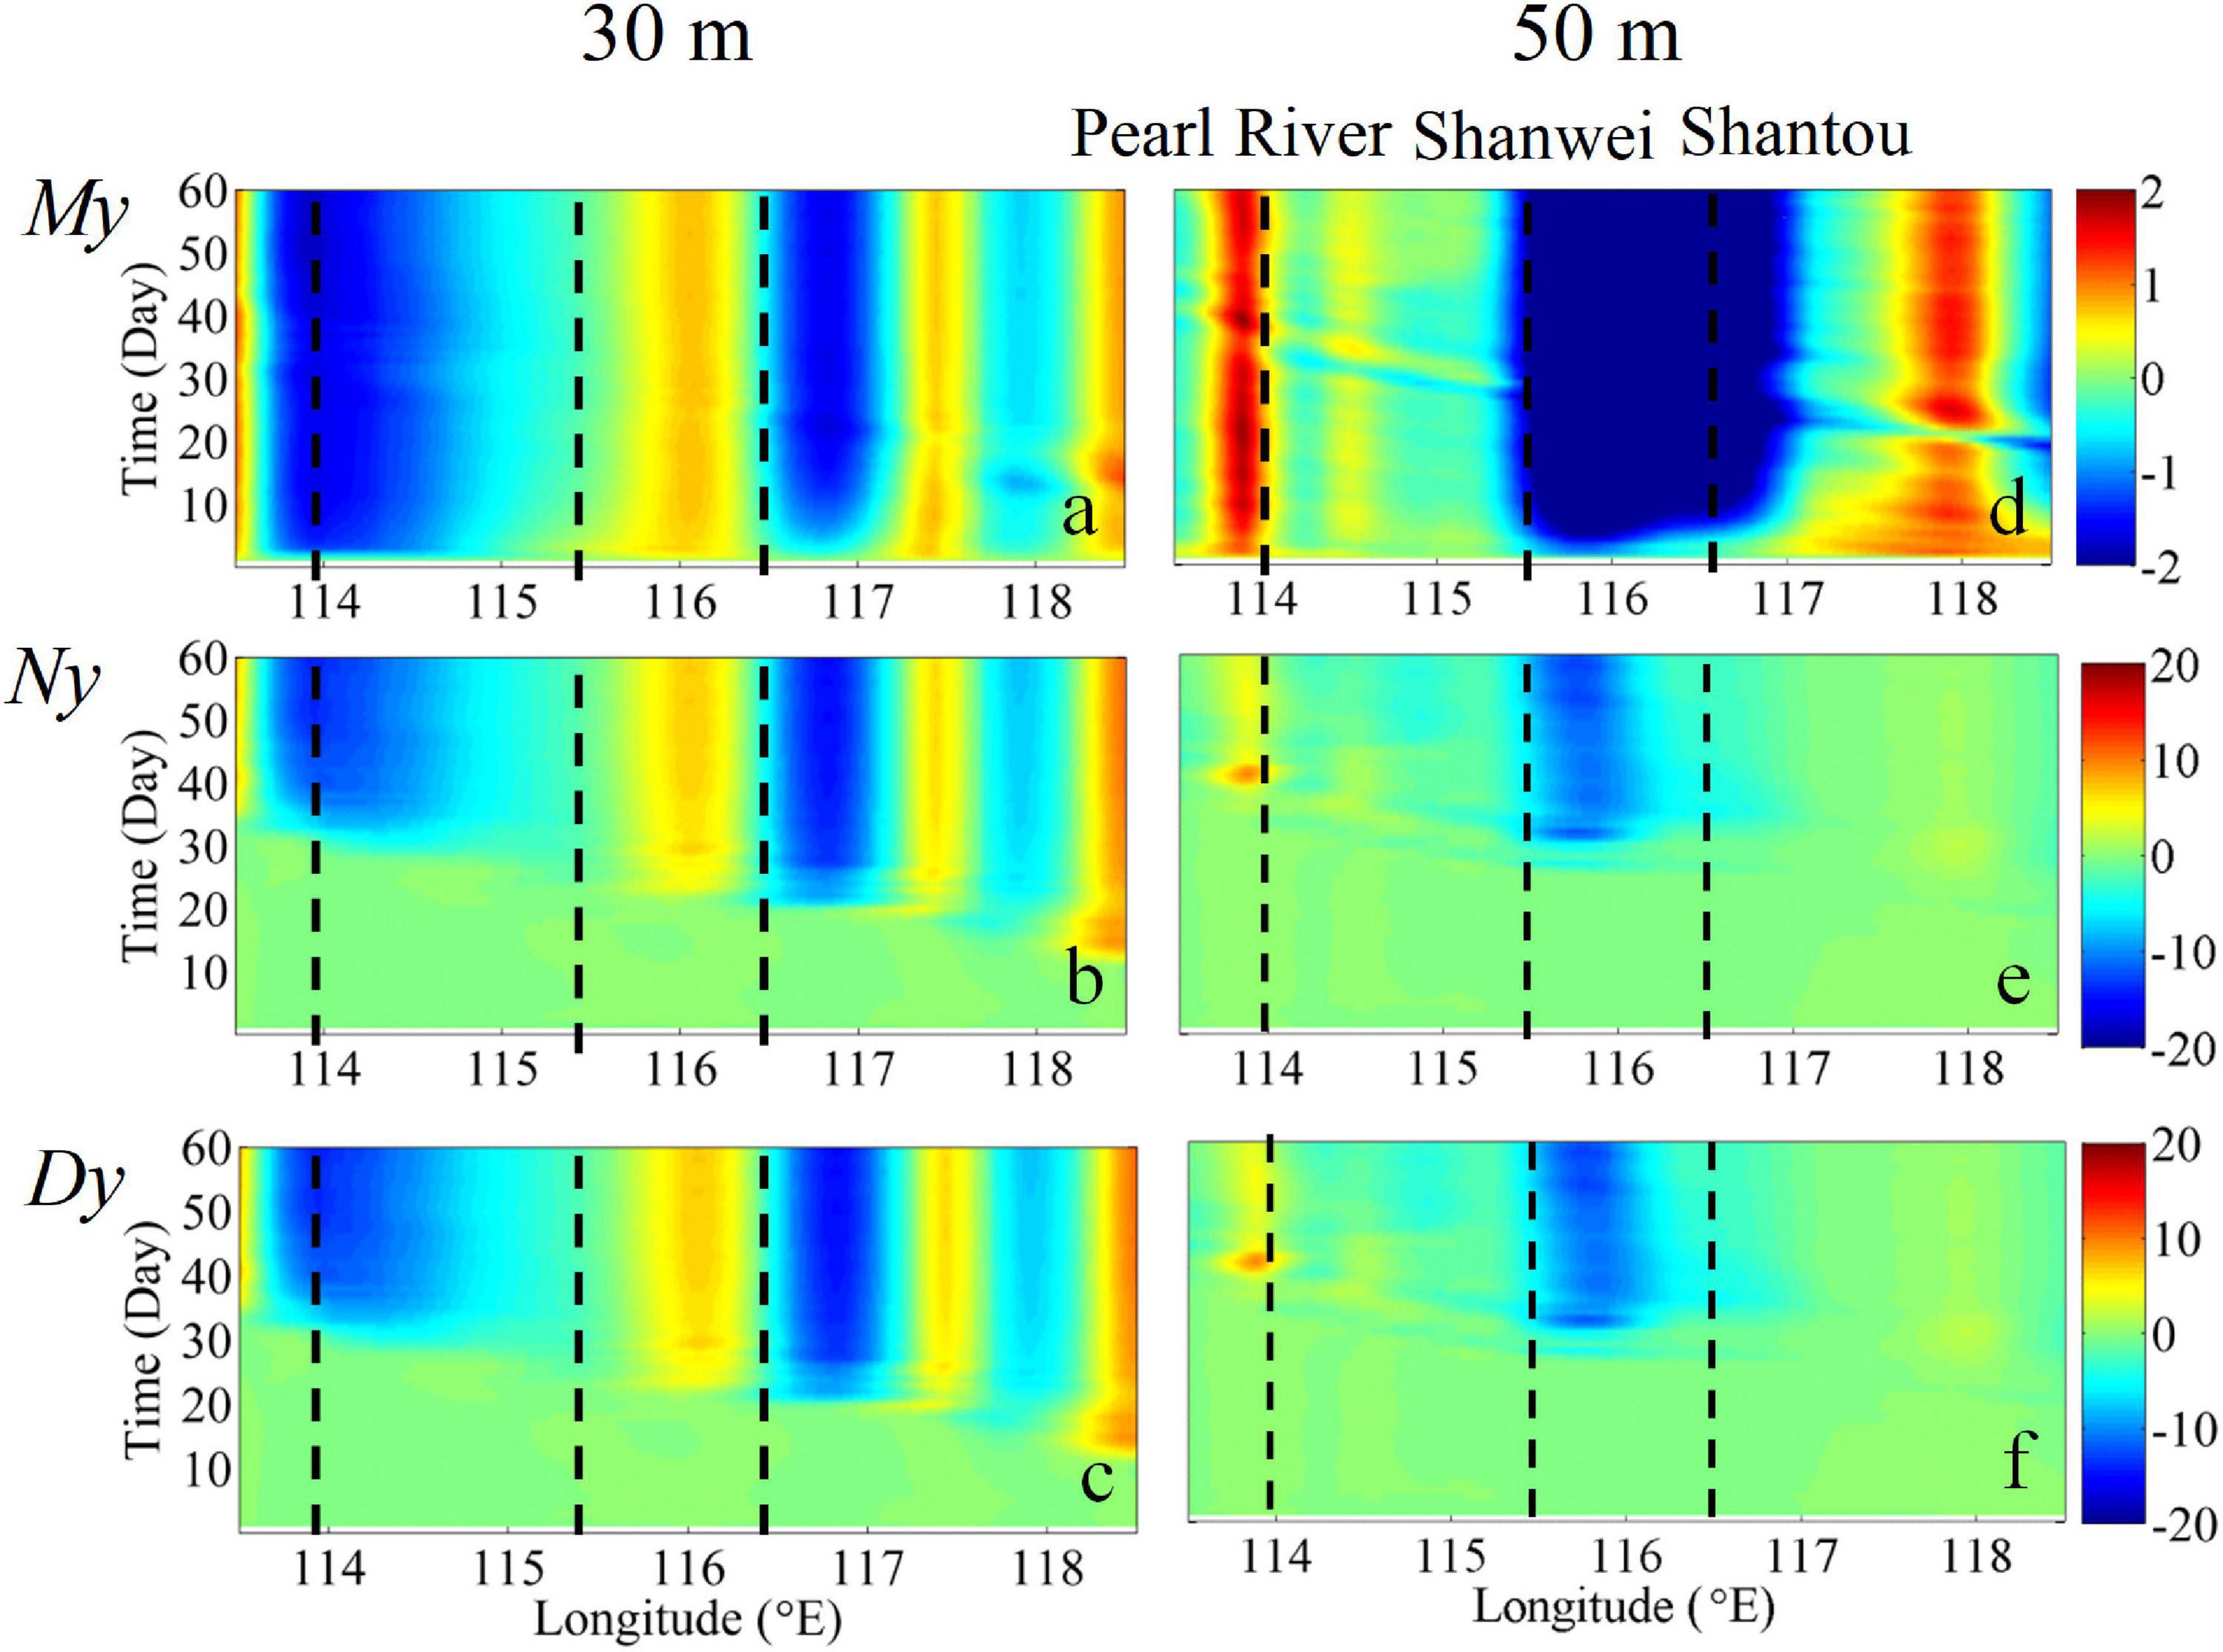
Figure 10. Time series of the depth-integrated volume flux (m2 s–1) (upper panel), nitrate flux (mmol m–1 s–1) (middle panel), and detritus flux (mmol m–1 s–1) (lower panel) across the (a–c) 30 m and (d–f) 50 m isobaths during downwelling. Positive and negative fluxes point shoreward and seaward, respectively. The black dashed lines indicate the Pearl River, Shanwei, and Shantou.
Within the first 2 days following the onset of northeasterly winds, the spatially variable cross-isobath My appeared over the inner and mid-shelves. Along the 30 m isobath, My, Ny, and Dy alternated between flowing seaward and shoreward (Figures 10a–c), which was primarily due to the response of the current to the concave/convex variations of the coastline (Gan et al., 2009). Along the 50 m isobath, the strongest seaward transport occurred over the widened shelf between Shantou and Shanwei (Gan et al., 2013).
Temporal evolution shows that both Ny and Dy first appeared over the eastern portion of the shelf near Taiwan Strait on Day 10 and reached the western portion of the shelf on Day 35. This indicates that nutrient transport and the associated enhanced biological productivity were advected by the alongshore transport.
These features resemble those captured by our observations (Figures 2–4). In contrast to upwelling conditions during summer (Gan et al., 2010), the transport of My, Ny, and Dy during winter reversed direction from the 30 m isobath to the 50 m isobath outside the Pearl River Estuary. Considering the role of downwelling in the sequestration/transport of material, and assuming that all the nutrients (a concentration of 1,430 ± 1,024 mol s–1) carried by the CCC from the ECS to the NSCS shelf (Han et al., 2013) were completely transported downward within the cross-shore downwelling circulation (Han et al., 2013), and based on a modeled Ny of ∼10 mmol m–1s–1 (Figure 10e), the length of the downwelling circulation over the NSCS shelf would be 40–245 km. Given that the cross-isobath seaward Ny along the 50 m isobath occurred from ∼115.5 to 116.8°E (Figure 10e), i.e., over 142.35 km, this finding matches our estimate.
Evolution of the Ecosystem
In addition to physical forcing, variation in nutrient concentrations and the evolution of the ecosystem are also controlled by the underlying biogeochemical processes within the downwelling circulation (Figure 11).
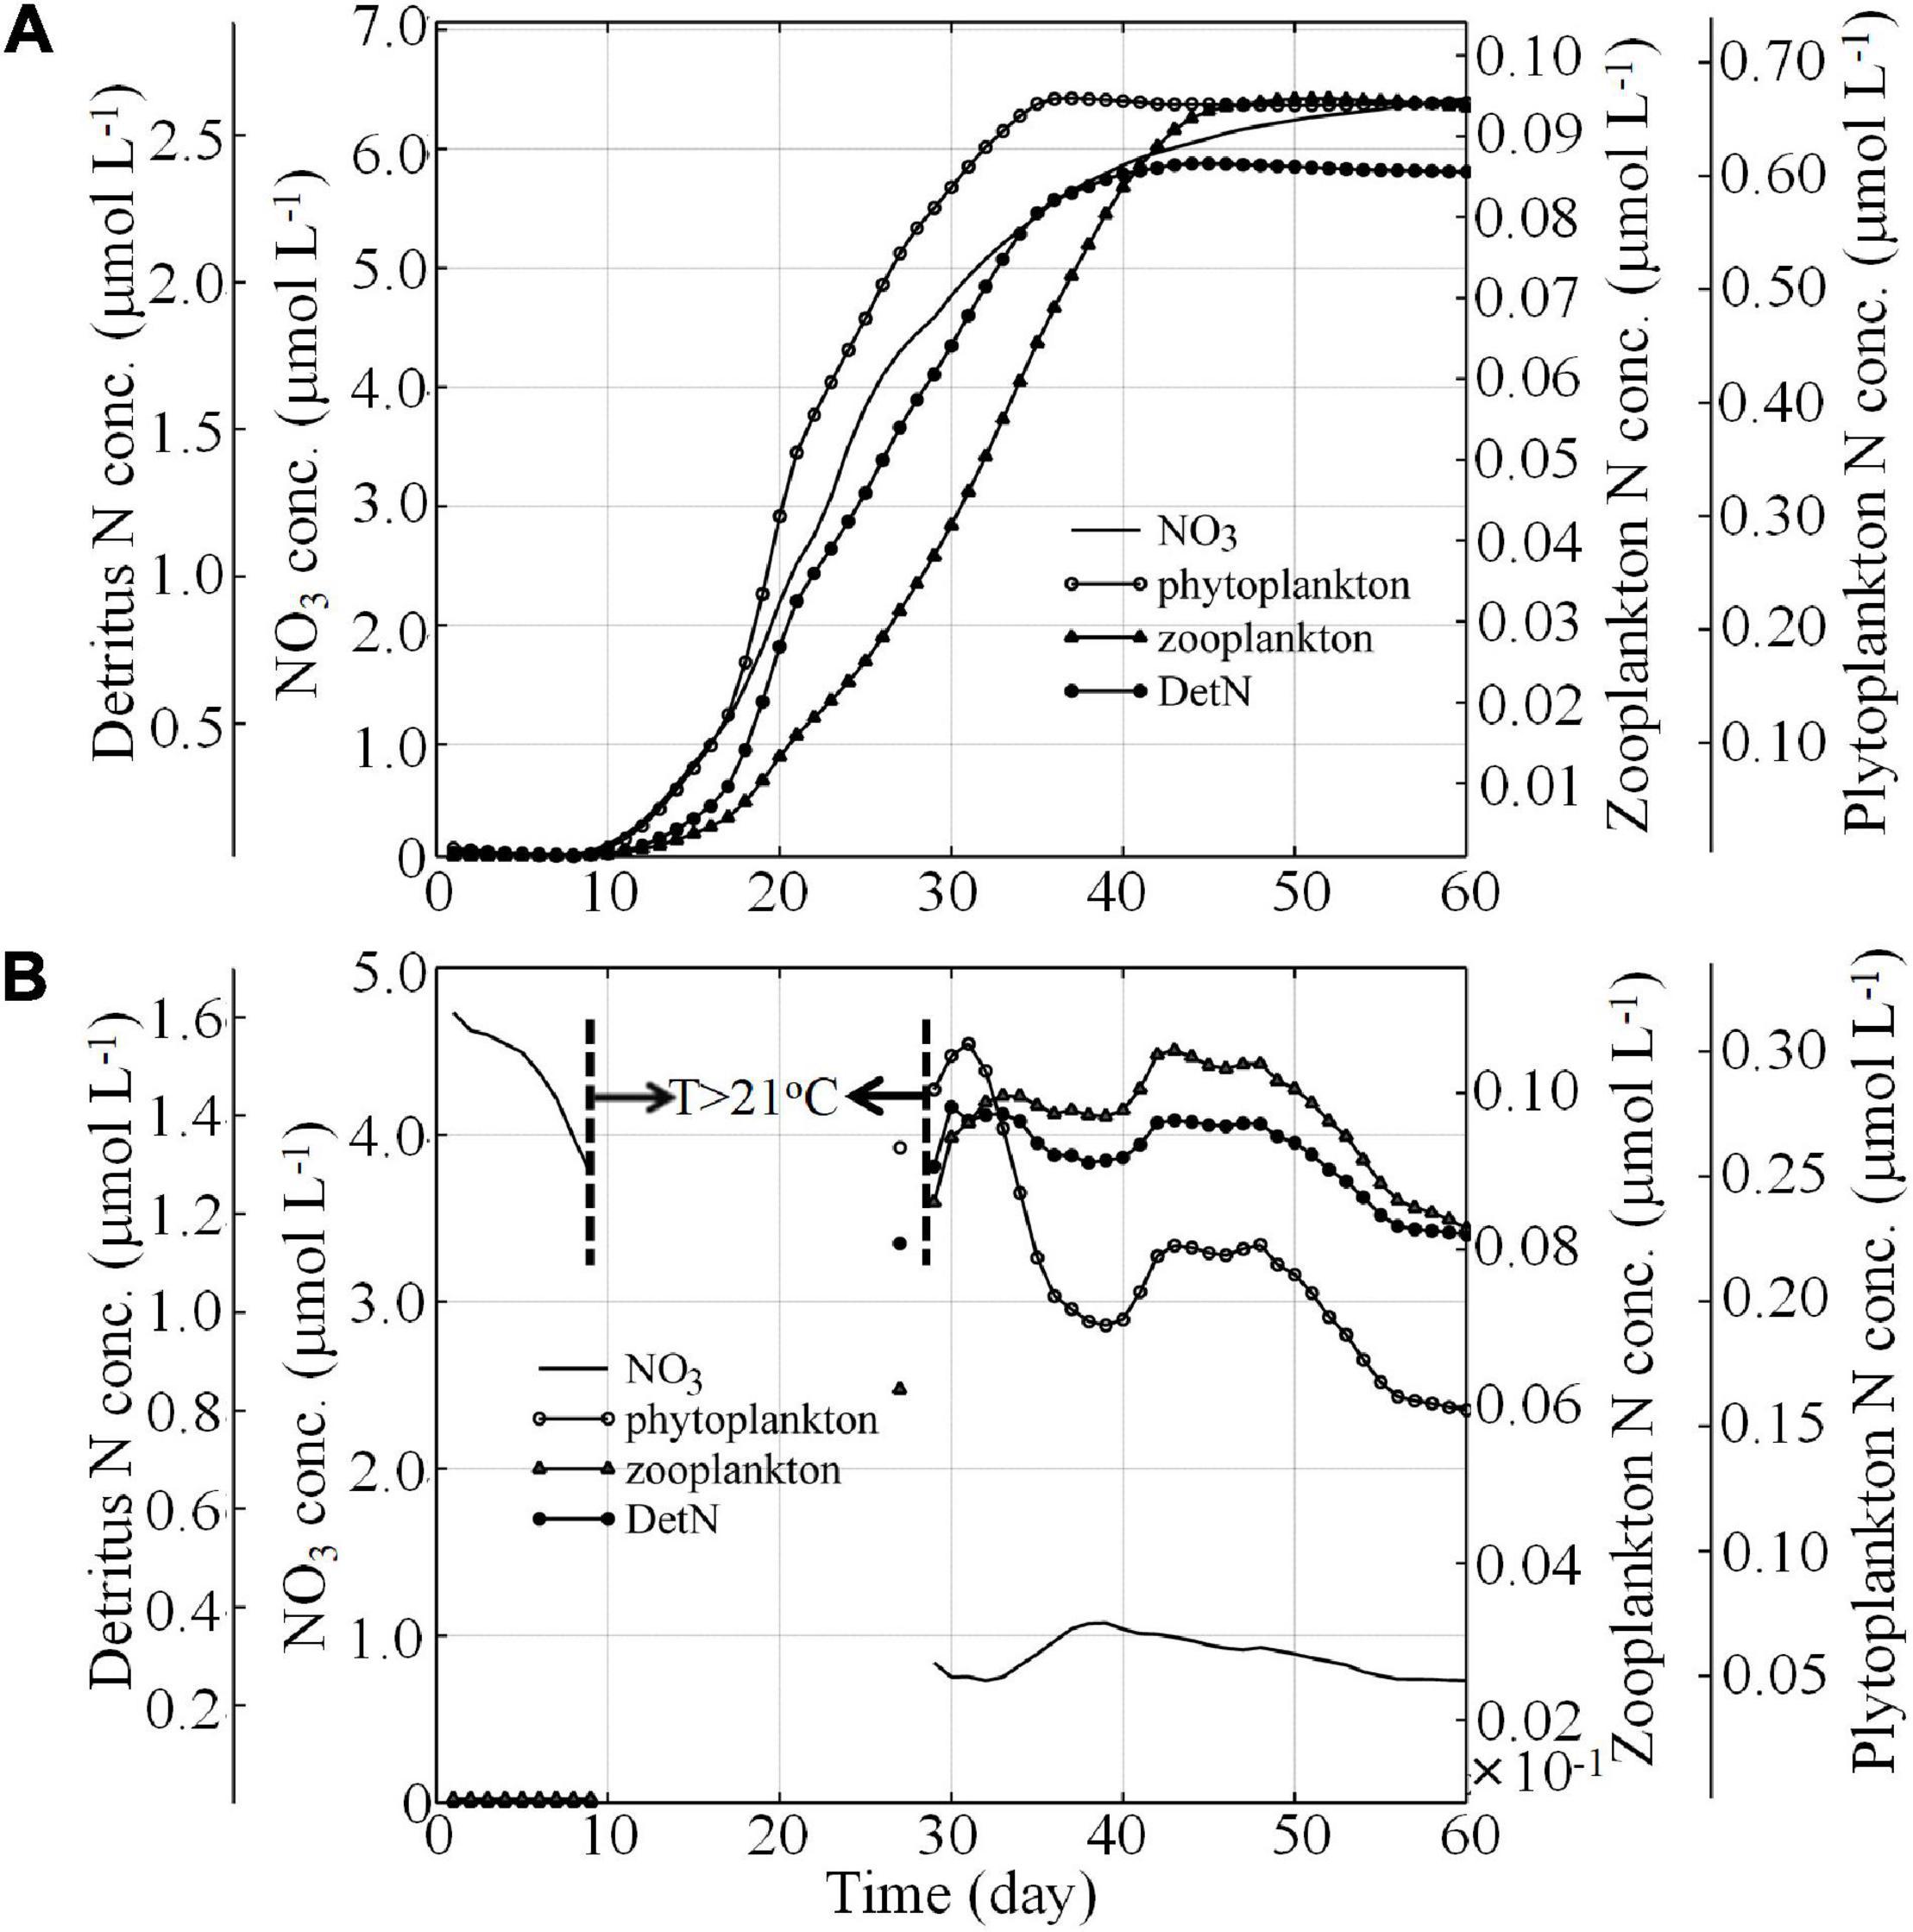
Figure 11. Time series of the average N, P, Z, and D (A) in the nearshore waters and (B) in the bottom waters between the 50 and 100 m isobaths from Shanwei to Shantou.
Figure 11A shows the nutrient concentrations and the associated biological processes in alongshore coastal current waters. The time-dependent response was associated with high nutrient transport by the alongshore coastal current and subsequent phytoplankton growth when the volume of nutrient-rich waters became relatively stable after Day 35 (attaining 6.0–6.5 μmol L–1). Consequently, the biological variables appeared around Day 10 and increased markedly during the following 25 days. This increase occurred because the nutrient-rich waters advected by the CCC reached the NSCS shelf from the ECS through the Taiwan Strait (TWS) and stimulated phytoplankton growth via N uptake.
The P concentration peaked around Day 38 and stabilized thereafter. Similarly, after about Day 38, the increase in N slowed down in parallel with the uptake by P even though the upstream region supplied continuous N. As a result of the high P concentration and the relatively low Z grazing rate, Z increased monotonically and peaked at ∼0.09 μmol L–1 before it reached dynamic equilibrium after Day 45. This zooplankton biomass was consistent with field observations from the South China Sea (∼0.05 μmol L–1 for microzooplankton biomass in winter, Chen et al., 2013).
Detritus (D) includes the contributions from both P and Z. In this study, D reached a maximum on Day 38, which coincided with the time when P peaked. Our field observations indicated that large-sized P, such as diatoms (∼80%, B. Q., Huang, unpublished data), dominated the P community in the nearshore region, where biogenic silica reached concentrations as high as 16.0–44.0 mg L–1 (M. H., Dai, unpublished data). These findings suggest that the P biomass was the most important source of D in the alongshore coastal current water.
The averaged time series of the biological variables in downwelled bottom waters is shown in Figure 11B. Unlike the evolution of the biological response in nearshore waters, downwelled waters were highly variable over time. Before Day 10, the N concentration in the bottom layer was high and was not being taken up by P. This water mass was the initial bottom NSCS shelf water with relatively low irradiance. From Days 10 to 30, as the downslope transport developed, the warm (>22.0°C) NSCS surface water diverged offshore (Figures 5C,D) and was transported downslope, crossing the isobaths across the shelf (Figures 6C,D). This physical evolution of downslope transport produced a bottom water mass with a temperature >21°C and led to the blank record shown in Figure 11B from Days 10 to 30.
Around Day 30, due to the development of downwelling circulation, cold waters reached the nearshore region of Shantou and Shanwei and flowed downslope. Due to biological uptake (as high as ∼2.2 μmol L–1, Figure 11B) and dilution by nutrient-poor ambient seawater, the average N concentration in the downwelled waters decreased to ∼0.9 μmol L–1, a value comparable with the observed nutrient concentrations (Han et al., 2013). The P, Z, and D concentrations in the downwelled waters had high values on Day 30 because of the downslope transport.
From Days 30 to 40, P decreased rapidly to support relatively high Z and D levels. At the same time, Z and D concentrations decreased due to the mixing of downwelled water with ambient NSCS shelf water during downslope flow. Approximately from Days 40 to 50, P, Z, and D concentrations began to increase after N had peaked around Day 40, indicating that they mirrored N concentrations before Day 50 (Figure 11B). This finding demonstrated that the ecosystem in nutrient-depleted downwelled water responded very rapidly to the prevailing N concentration.
Thereafter, P, Z, and D concentrations decreased again and attained relative equilibrium by Day 55. This time-dependent P response may be associated with the N supply and the grazing pressure from Z. After Day 55, there was a balance between the P growth and Z grazing as the volume of the downwelling water became relatively stable.
Conclusion
Downwelling circulation has long been postulated to have a minimal biological effect. In this study, field observations and a validated three-dimensional coupled physical-NPZD ecosystem model were used to conduct a process-oriented investigation of biological responses to downwelling circulation characterized by a strong alongshore coastal current and intensified downslope cross-shore transport over the distinct widened NSCS shelf. By combining field observations with coupled physical-biological modeling, this study revealed the characteristics of the physically controlled biological responses in the downwelling circulation. The intensified wind-driven downwelling circulation and the nutrient, phytoplankton, zooplankton, and detritus responses over the widened NSCS shelf are schematically summarized in Figure 12.
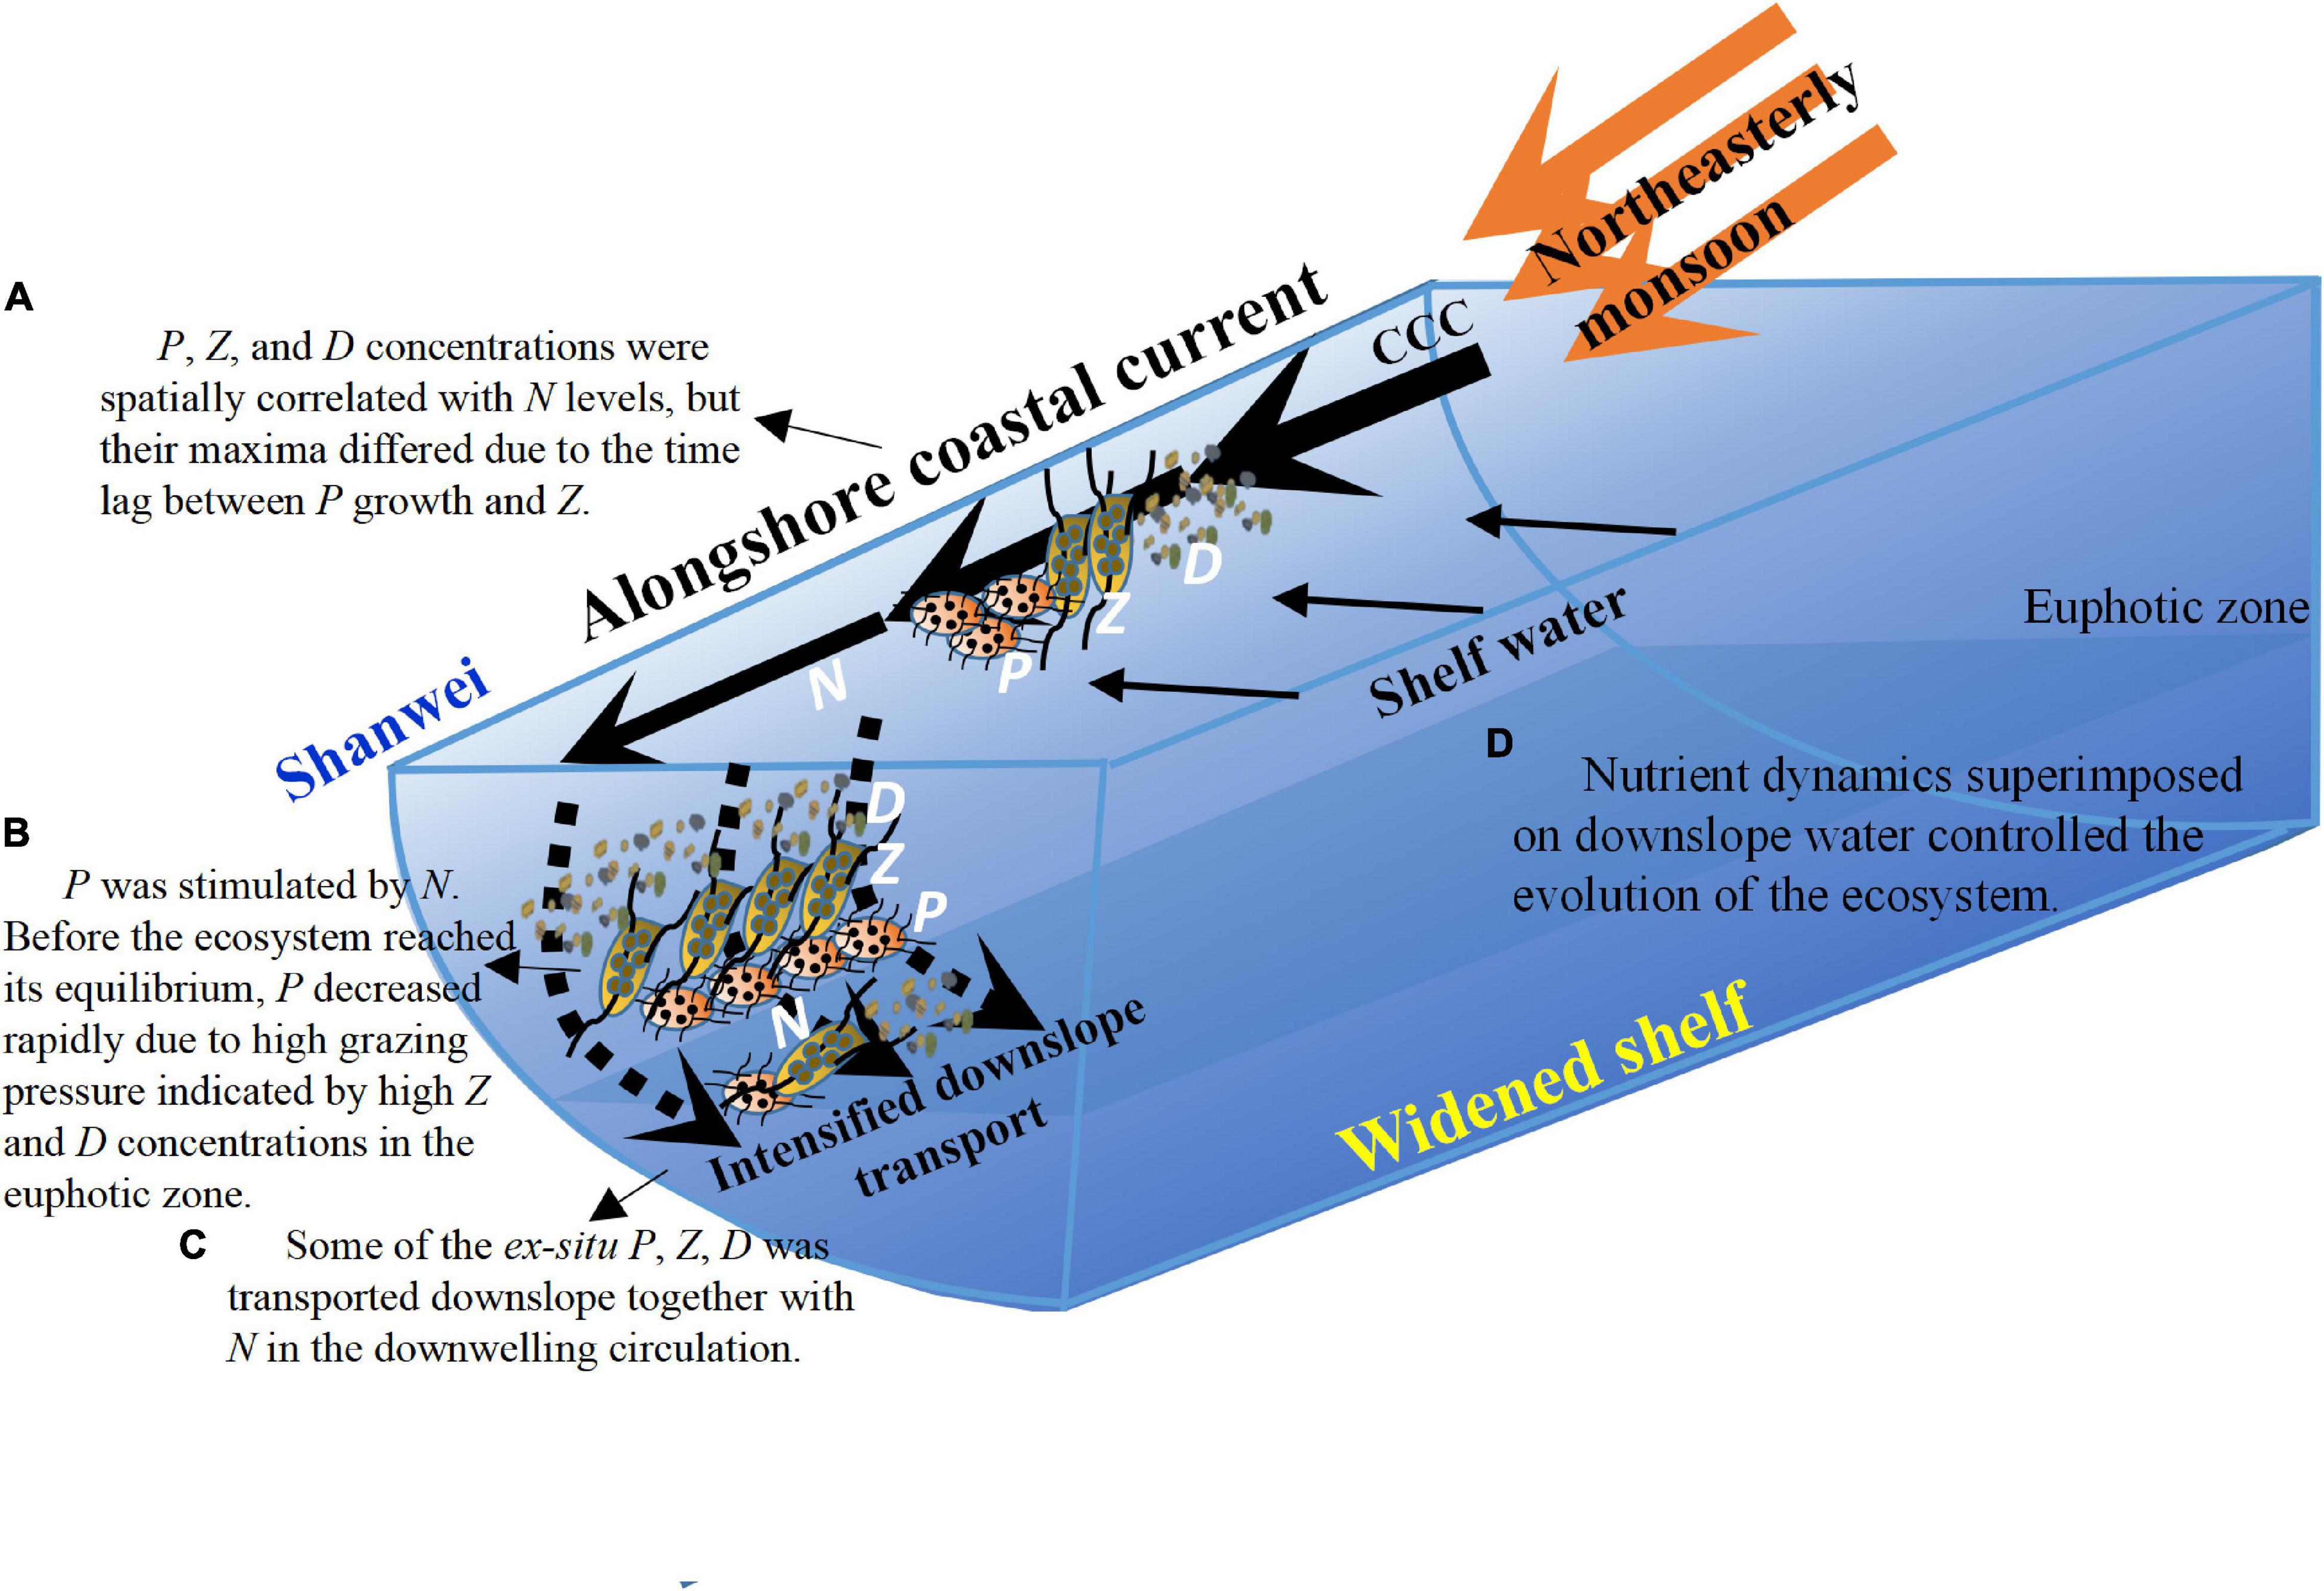
Figure 12. Schematic diagram showing the responses of nutrient transport and associated biological processes to the intensified downwelling-favorable wind over the widened NSCS shelf. N, P, Z, and D stand for nitrogen, phytoplankton, zooplankton, and detritus, respectively. (A–D) List the key biophysical processes.
Driven by an idealized, representative downwelling-favorable northeasterly wind, the model successfully simulated the observed characteristics of coastal downwelling circulation and the associated biogeochemical responses. Analysis of observations and successful model simulation of the observed ecosystem in the NSCS revealed nutrient enrichment by the alongshore coastal current and downslope nutrient transport. First, a strong, southwestward, nutrient-rich flux traveled along the coast from the ECS to the NSCS shelf through the TWS. Second, the developing coastal current crossed the steep mid-shelf at the head of the widened shelf and transported nutrient-rich waters downslope. Thus, highly productive regions formed within the coastal current water and in downwelled waters at the seafloor.
The ecosystem in the alongshore coastal current matured by about 38 days after the onset of the northeasterly winds, and the N concentration remained relatively stable due to the persistent southwestward nutrient supply originating upstream. The P, Z, and D concentrations in the alongshore coastal water were spatially correlated with the nutrient levels, but their maxima differed due to the time lag between the growth of P and Z. Nutrient-rich downwelled water formed a falling wedge along the sloping seafloor, but its nutrient concentration decreased drastically due to biological uptake. With increasingly efficient downwelling transport over the widened shelf, algal blooms in the downwelled water moved seaward (i.e., offshore).
The nutrient flux originating from the alongshore coastal current drove the biogeochemical responses in the cross-shore downwelled water. The related D flux and the spatiotemporal patterns of P, Z, and D concentrations were controlled by the nutrient flux that was, in turn, largely determined by the intensity of downwelling circulation. Before the ecosystem reached its equilibrium, P decreased rapidly due to high grazing pressure indicated by high Z and D concentrations. In addition, there was a mirror relationship among P, Z, D, and N. Thus, nutrient dynamics superimposed on the downslope water controlled the evolution of the ecosystem (as reflected by P, Z, and D).
Data Availability Statement
The raw data supporting the conclusions of this article will be made available by the authors, without undue reservation.
Author Contributions
JG: conceptualization, funding acquisition, project administration, and writing – review and editing. AH: data curation, visualization, and writing – original draft, review and editing. MD: conceptualization and writing – review and editing. ZL: conceptualization. LL and XZ: visualization. All authors contributed to the article and approved the submitted version.
Funding
This research was supported by the National Natural Science Foundation of China (grant 41361164001) and the Theme-Based Research Scheme of the Hong Kong Research Grants Council (T21-602/16-R). Bangqin Huang kindly provided the Chl a data.
Conflict of Interest
The authors declare that the research was conducted in the absence of any commercial or financial relationships that could be construed as a potential conflict of interest.
Publisher’s Note
All claims expressed in this article are solely those of the authors and do not necessarily represent those of their affiliated organizations, or those of the publisher, the editors and the reviewers. Any product that may be evaluated in this article, or claim that may be made by its manufacturer, is not guaranteed or endorsed by the publisher.
Acknowledgments
We are grateful for the comments from two reviewers and Jianfang Chen.
Footnotes
References
Allen, J. S., and Newberger, P. A. (1996). Downwelling circulation on the Oregon continental shelf. Part I: response to idealized forcing. J. Phys. Oceanogr. 26, 2011–2035. doi: 10.1175/1520-0485(1996)026<2011:dcotoc>2.0.co;2
Baird, M. E., Leth, O., and Middleton, J. F. (2007). Biological response to circulation driven by mean summertime winds off central Chile: a numerical model study. J. Geophys. Res. 112:C07031. doi: 10.1029/2006JC003655
Castelao, R., Schofield, O., Glenn, S., Chant, R., and Kohut, J. (2008). Cross-shelf transport of freshwater on the New Jersey shelf. J. Geophys. Res. 113:C07017. doi: 10.1029/2007JC004241
Chen, B., Zheng, L., Huang, B., Song, S., and Liu, H. (2013). Seasonal and spatial comparisons of phytoplankton growth and mortality rates due to microzooplankton grazing in the northern South China Sea. Biogeosciences 10, 2775–2785. doi: 10.5194/bg-10-2775-2013
Chen, C.-T. A. (2008). Distributions of nutrients in the East China Sea and the South China Sea connection. J. Oceanogr. 64, 737–751. doi: 10.1007/s10872-008-0062-9
Corbett, D. R., McKee, B., and Duncan, D. (2004). An evaluation of mobile mud dynamics in the Mississippi River deltaic region. Mar. Geol. 209, 91–112.
Epifanio, C. E., and Garvine, R. W. (2001). Larval transport on the Atlantic continental shelf of North America: a review. Estuar. Coast. Shelf Sci. 52, 51–77. doi: 10.1006/ecss.2000.0727
Fasham, M. J. R., Ducklow, H. W., and McKelvie, S. M. (1990). A nitrogen-based model of plankton dynamics in the oceanic mixed layer. J. Mar. Res. 48, 591–639.
Fennel, K., Wilkin, J., Levin, J., Moisan, J., O’Reilly, J., and Haidvogel, D. (2006). Nitrogen cycling in the Middle Atlantic Bight: results from a three-dimensional model and implications for the North Atlantic nitrogen budget. Global Biogeochem. Cycles 20:GB3007. doi: 10.1029/2005GB002456
Gan, J., and Allen, J. S. (2005). On open boundary conditions for a limited-area coastal model off Oregon. Part 1: response to idealized wind forcing. Ocean Model. 8, 115–133. doi: 10.1016/j.ocemod.2003.12.006
Gan, J., Allen, J. S., and Samelson, R. M. (2005). On open boundary conditions for a limited-area coastal model off Oregon. Part 2: response to wind forcing from a regional mesoscale atmospheric model. Ocean Model. 8, 155–173. doi: 10.1016/j.ocemod.2003.12.007
Gan, J., Ho, H. S., and Liang, L. (2013). Dynamics of intensified downwelling circulation over a widened shelf in the northeastern South China Sea. J. Phys. Oceanogr. 43, 80–94. doi: 10.1175/jpo-d-12-02.1
Gan, J., Li, L., Wang, D., and Guo, X. (2009). Interaction of a river plume with coastal upwelling in the northeastern South China Sea. Cont. Shelf Res. 29, 728–740.
Gan, J., Lu, Z., Dai, M., Cheung, A., Liu, H., and Harrison, P. (2010). Biological response to intensified upwelling and to a river plume in the northeastern South China Sea: a modeling study. J. Geophys. Res. 115:C09001. doi: 10.01029/02009JC005569
Guenther, M., Gonzalez-Rodriguez, E., Carvalho, W. F., Rezende, C. E., Mugrabe, G., and Valentin, J. L. (2008). Plankton trophic structure and particulate organic carbon production during a coastal downwelling-upwelling cycle. Mar. Ecol. Prog. Ser. 363, 109–119.
Han, A., Dai, M., Gan, J., Kao, S.-J., Zhao, X., Jan, S., et al. (2013). Inter-shelf nutrient transport from the East China Sea as a major nutrient source supporting winter primary production on the northeast South China Sea shelf. Biogeosciences 10, 8159–8170. doi: 10.5194/bg-10-8159-2013
Hanson, C. E., Pattiaratchi, C. B., and Waite, A. M. (2005). Sporadic upwelling on a downwelling coast: phytoplankton responses to spatially variable nutrient dynamics off the Gascoyne region of Western Australia. Cont. Shelf Res. 25, 1561–1582. doi: 10.1016/j.csr.2005.04.003
Hofmann, E. (2008). Eastern US continental shelf carbon budget integrating models, data assimilation, and analysis. Oceanography 21, 86–104.
Hung, J. J., Lin, C. S., Hung, G. W., and Chung, Y. C. (1999). Lateral transport of lithogenic particles from the continental margin of the Southern East China Sea. Estuar. Coast. Shelf Sci. 49, 483–499. doi: 10.1006/ecss.1999.0520
Jickells, T. D. (1998). Nutrient biogeochemistry of the coastal zone. Science 281, 217–222. doi: 10.1126/science.281.5374.217
Liu, C., Xia, H., and Wang, D. (2010). The observation and analysis of eastern Guangdong coastal downwelling in the winter of 2006. Acta Oceanol. Sin. 32, 1–9. (in Chinese),Google Scholar
Liu, S., Guo, X., Chen, Q., Zhang, J., Bi, Y., Luo, X., et al. (2010). Nutrient dynamics in the winter thermohaline frontal zone of the northern shelf region of the South China Sea. J. Geophys. Res. 115:C11020. doi: 10.1029/2009JC005951
Lu, Z., Gan, J., Dai, M., and Cheung, A. Y. Y. (2010). The influence of coastal upwelling and a river plume on the subsurface chlorophyll maximum over the shelf of the northeastern South China Sea. J. Mar. Syst. 82, 35–46. doi: 10.1016/j.jmarsys.2010.1003.1002
Ma, H., Grassle, J. P., and Chant, R. J. (2006). Vertical distribution of bivalve larvae along a cross-shelf transect during summer upwelling and downwelling. Mar. Biol. 149, 1123–1138.
Marchesiello, P., McWilliams, J. C., and Shchepetkin, A. (2001). Open boundary conditions for long-term integration of regional oceanic models. Ocean Model. 3, 1–20.
Meng, F., Dai, M., Cao, Z., Wu, K., Zhao, X., Li, X., et al. (2017). Seasonal dynamics of dissolved organic carbon under complex circulation schemes on a large continental shelf: the northern South China Sea. J. Geophys. Res. 122, 9415–9428. doi: 10.1002/2017JC013325
Naik, H., and Chen, C.-T. A. (2008). Biogeochemical cycling in the Taiwan Strait. Estuar. Coast. Shelf Sci. 78, 603–612. doi: 10.1371/journal.pone.0197382
Pan, L., Zhang, J., Chen, Q., and Deng, B. (2005). Picoplankton community structure at a coastal front region in the northern part of the South China Sea. J. Plankton Res. 28, 337–343. doi: 10.1093/plankt/fbi117
Parsons, T. R., Maita, Y., and Lalli, C. M. (1984). A manual of chemical and biological methods for seawater analysis. Pergamon.
Shchepetkin, A. F., and McWilliams, J. C. (2005). The regional oceanic modeling system (ROMS): a split-explicit, free-surface, topography-following-coordinate oceanic model. Ocean Model. 9, 437–404. doi: 10.1029/2007JC004602
Spitz, Y. H., Allen, J. S., and Gan, J. P. (2005). Modeling of ecosystem processes on the Oregon shelf during the 2001 summer upwelling. J. Geophys. Res. 110:C10S17. doi: 10.1029/2005JC002870
Traykovski, P., Geyer, W. R., Irish, J. D., and Lynch, J. F. (2000). The role of wave-induced density-driven fluid mud flows for cross-shelf transport on the Eel River continental shelf. Cont. Shelf Res. 20, 2113–2140.
Walsh, J. J. (1991). Importance of continental margins in the marine biogeochemical cycling of carbon and nitrogen. Nature 350, 53–55. doi: 10.1038/350053a0
World Ocean Atlas (2001). Objective Analyses, Data Statistics, and Figures. National Oceanographic Data Center Internal Report 17.2002. Silver Spring, ML: National Oceanographic Data Center.
Xie, Y., Huang, B., Lin, L., Law, E., Wang, L., Shang, S., et al. (2015). Photosynthetic parameters in the northern South China Sea in relation to phytoplankton community structure. J. Geophys. Res. 120, doi: 10.1002/2014JC010415
Keywords: nutrients, biological responses, northeastern South China Sea, downwelling circulation, numerical modeling
Citation: Han A, Gan J, Dai M, Lu Z, Liang L and Zhao X (2021) Intensification of Downslope Nutrient Transport and Associated Biological Responses Over the Northeastern South China Sea During Wind-Driven Downwelling: A Modeling Study. Front. Mar. Sci. 8:772586. doi: 10.3389/fmars.2021.772586
Received: 08 September 2020; Accepted: 30 November 2021;
Published: 31 December 2021.
Edited by:
Jianfang Chen, Second Institute of Oceanography, Ministry of Natural Resources, ChinaReviewed by:
Ruihuan Li, South China Sea Institute of Oceanology, Chinese Academy of Sciences (CAS), ChinaZhixuan Feng, East China Normal University, China
Copyright © 2021 Han, Gan, Dai, Lu, Liang and Zhao. This is an open-access article distributed under the terms of the Creative Commons Attribution License (CC BY). The use, distribution or reproduction in other forums is permitted, provided the original author(s) and the copyright owner(s) are credited and that the original publication in this journal is cited, in accordance with accepted academic practice. No use, distribution or reproduction is permitted which does not comply with these terms.
*Correspondence: Jianping Gan, magan@ust.hk