Polar Region Bathymetry: Critical Knowledge for the Prediction of Global Sea Level Rise
 Martin Jakobsson
 Larry A. Mayer
- 1Department of Geological Sciences, Stockholm University, Stockholm, Sweden
- 2Center for Coastal and Ocean Mapping/Joint Hydrographic Center, University of New Hampshire, Durham, NH, United States
The ocean and the marine parts of the cryosphere interact directly with, and are affected by, the seafloor and its primary properties of depth (bathymetry) and shape (morphology) in many ways. Bottom currents are largely constrained by undersea terrain with consequences for both regional and global heat transport. Deep ocean mixing is controlled by seafloor roughness, and the bathymetry directly influences where marine outlet glaciers are susceptible to the inflow relatively warm subsurface waters - an issue of great importance for ice-sheet discharge, i.e., the loss of mass from calving and undersea melting. Mass loss from glaciers and the Greenland and Antarctic ice sheets, is among the primary drivers of global sea-level rise, together now contributing more to sea-level rise than the thermal expansion of the ocean. Recent research suggests that the upper bounds of predicted sea-level rise by the year 2100 under the scenarios presented in IPCC’s Special Report on the Ocean and Cryosphere in a Changing Climate (SROCCC) likely are conservative because of the many unknowns regarding ice dynamics. In this paper we highlight the poorly mapped seafloor in the Polar regions as a critical knowledge gap that needs to be filled to move marine cryosphere science forward and produce improved understanding of the factors impacting ice-discharge and, with that, improved predictions of, among other things, global sea-level. We analyze the bathymetric data coverage in the Arctic Ocean specifically and use the results to discuss challenges that must be overcome to map the most remotely located areas in the Polar regions in general.
Introduction
The Intergovernmental Panel on Climate Change’s (IPCC) Special Report on the Ocean and Cryosphere in a Changing Climate (SROCC) 2019 published summarized observed rates of Global Mean Sea Level (GMSL) rise from tide gauges and satellite altimetry between 1901 and 2015 (Oppenheimer et al., 2019). Their summary shows that the rate of GMSL rise has increased from 1.4 mm yr–1 over the period 1901–1990 to 3.6 mm yr–1 over 2006–2015. Several GMSL rise studies have been published since SROCC (e.g., Dangendorf et al., 2019; Frederikse et al., 2020) supporting this general view of the trend of GMSL rise (Fox-Kemper et al., 2021).
There are two main contributors to the GMSL rise: (1) Thermal expansion of the ocean due to the steric effect from an increase in water temperature, i.e., the thermosteric contribution (Fasullo and Gent, 2017), and (2) meltwater from glaciers and ice sheets that experienced a net mass loss due to warming, i.e., barystatic contribution (Siegert et al., 2020). Pre-1993, the thermosteric component was the major contributor to GMSL rise, however, since 1993, the mass-loss of glaciers and ice sheets have dominated, contributing approximately 49% of the observed GMSL rise of 3.35 mm yr–1, with the Greenland ice sheet being the single largest contributor with 19%, which is roughly equal to all glaciers taken together (Frederikse et al., 2020).
While measuring GMSL rise is difficult in itself, predicting the future rise of GMSL is even more challenging and has large error bars (Bamber et al., 2019; Oppenheimer et al., 2019) associated with both uncertainties related to the thermosteric component (e.g., how to determine the impact of a warming climate on the temperature structure in the ocean) and the prediction of the meltwater component. As the relative contribution of meltwaters from glaciers and ice sheets increases, more and more attention is being paid to the processes responsible for enhanced melting of glaciers and ice sheets. Here we look at those processes and explain why bathymetry is a critical parameter for predictions of the sea-level rise contribution from glaciers and ice sheets and discuss the status of the bathymetric mapping in the Polar regions in general, and in the Arctic Ocean and around Greenland in particular. It should be noted that our Arctic focus does not imply that we are of the opinion that mapping is more urgent in the Arctic Ocean than around Antarctica. Instead, it simply reflects our heavier engagement in bathymetric mapping and data compilation in the Arctic region.
Our discussion of the critical role of bathymetry in understanding and predicting the contribution of melting glaciers and ice sheets to global sea-level rise, is presented in the context of a renewed effort to see complete mapping of the global seafloor through the Nippon Foundation-GEBCO Seabed 2030 Project (Mayer et al., 2018). This effort, which is an endorsed Program of the U.N. Decade of Ocean Science for Sustainable Development, is driven by the recognition that detailed bathymetric information of the Earth’s seabed is essential for establishing the fundamental geospatial context required for a range of scientific, environmental and engineering endeavors. Nowhere is this more evident than in the role that bathymetry can play in determining the melt rates of glaciers and ice sheets.
Mapping in the Polar Regions benefits from two well-established regional synthesis groups—the International Bathymetric Chart of the Arctic Ocean (IBCAO) (Jakobsson et al., 2020a) and the International Bathymetric Chart of the Southern Ocean (IBCSO) (Arndt et al., 2013). While both of these organizations continue, their efforts and products are now part of the Nippon Foundation-GEBCO Seabed 2030 Project (GEBCO; General Bathymetric Chart of the Oceans).
The current depth data coverage of the Arctic Ocxean seafloor in IBCAO 4.1 is 21.3%, which corresponds to an increase of 1.5% since IBCAO 4.0 was released in July 2020 (Jakobsson et al., 2020a). The Southern Ocean depth data coverage has been calculated in 2021 by the Seabed 2030 project to be 19.3%, however, Version 2 of IBCSO will soon be made publicly available [Dorschel et al., 2021 (in review)] and this percentage coverage should increase somewhat. In comparison to global coverage, the latest GEBCO global compilation, i.e., the GEBCO 2021 Grid (GEBCO Compilation Group, 2021), compiled by the Seabed 2030 project now has coverage of 20.6% of the world’s seafloor. Details of the current state of Arctic mapping and the impact of the sparsity of these data will be discussed in more detail below.
The Need for Bathymetry to Assess the Future of Marine Glaciers and Ice Sheets
The Earth’s marine cryosphere is commonly defined as marine outlet glaciers in contact with the ocean, including their floating ice tongues/shelves or grounded ice cliffs, and ice sheets resting on bedrock below sea level, together with icebergs, sea ice, and subsea permafrost (Figure 1; Holland, 2013). Gas hydrates may also be considered as forming a part of the marine cryosphere. The marine cryosphere forms a critical and dynamic component of the Earth system that interacts with climate, the ocean, and the seafloor. Effects from amplified global warming in the Polar regions (Goosse et al., 2018) are manifested by, e.g., rapid break-up and retreat of marine outlet glaciers (Holland et al., 2008; Mouginot et al., 2015; Münchow et al., 2016), declining sea ice (Overland and Wang, 2013; Serreze and Meier, 2019) and thawing subsea permafrost (Sayedi et al., 2020).
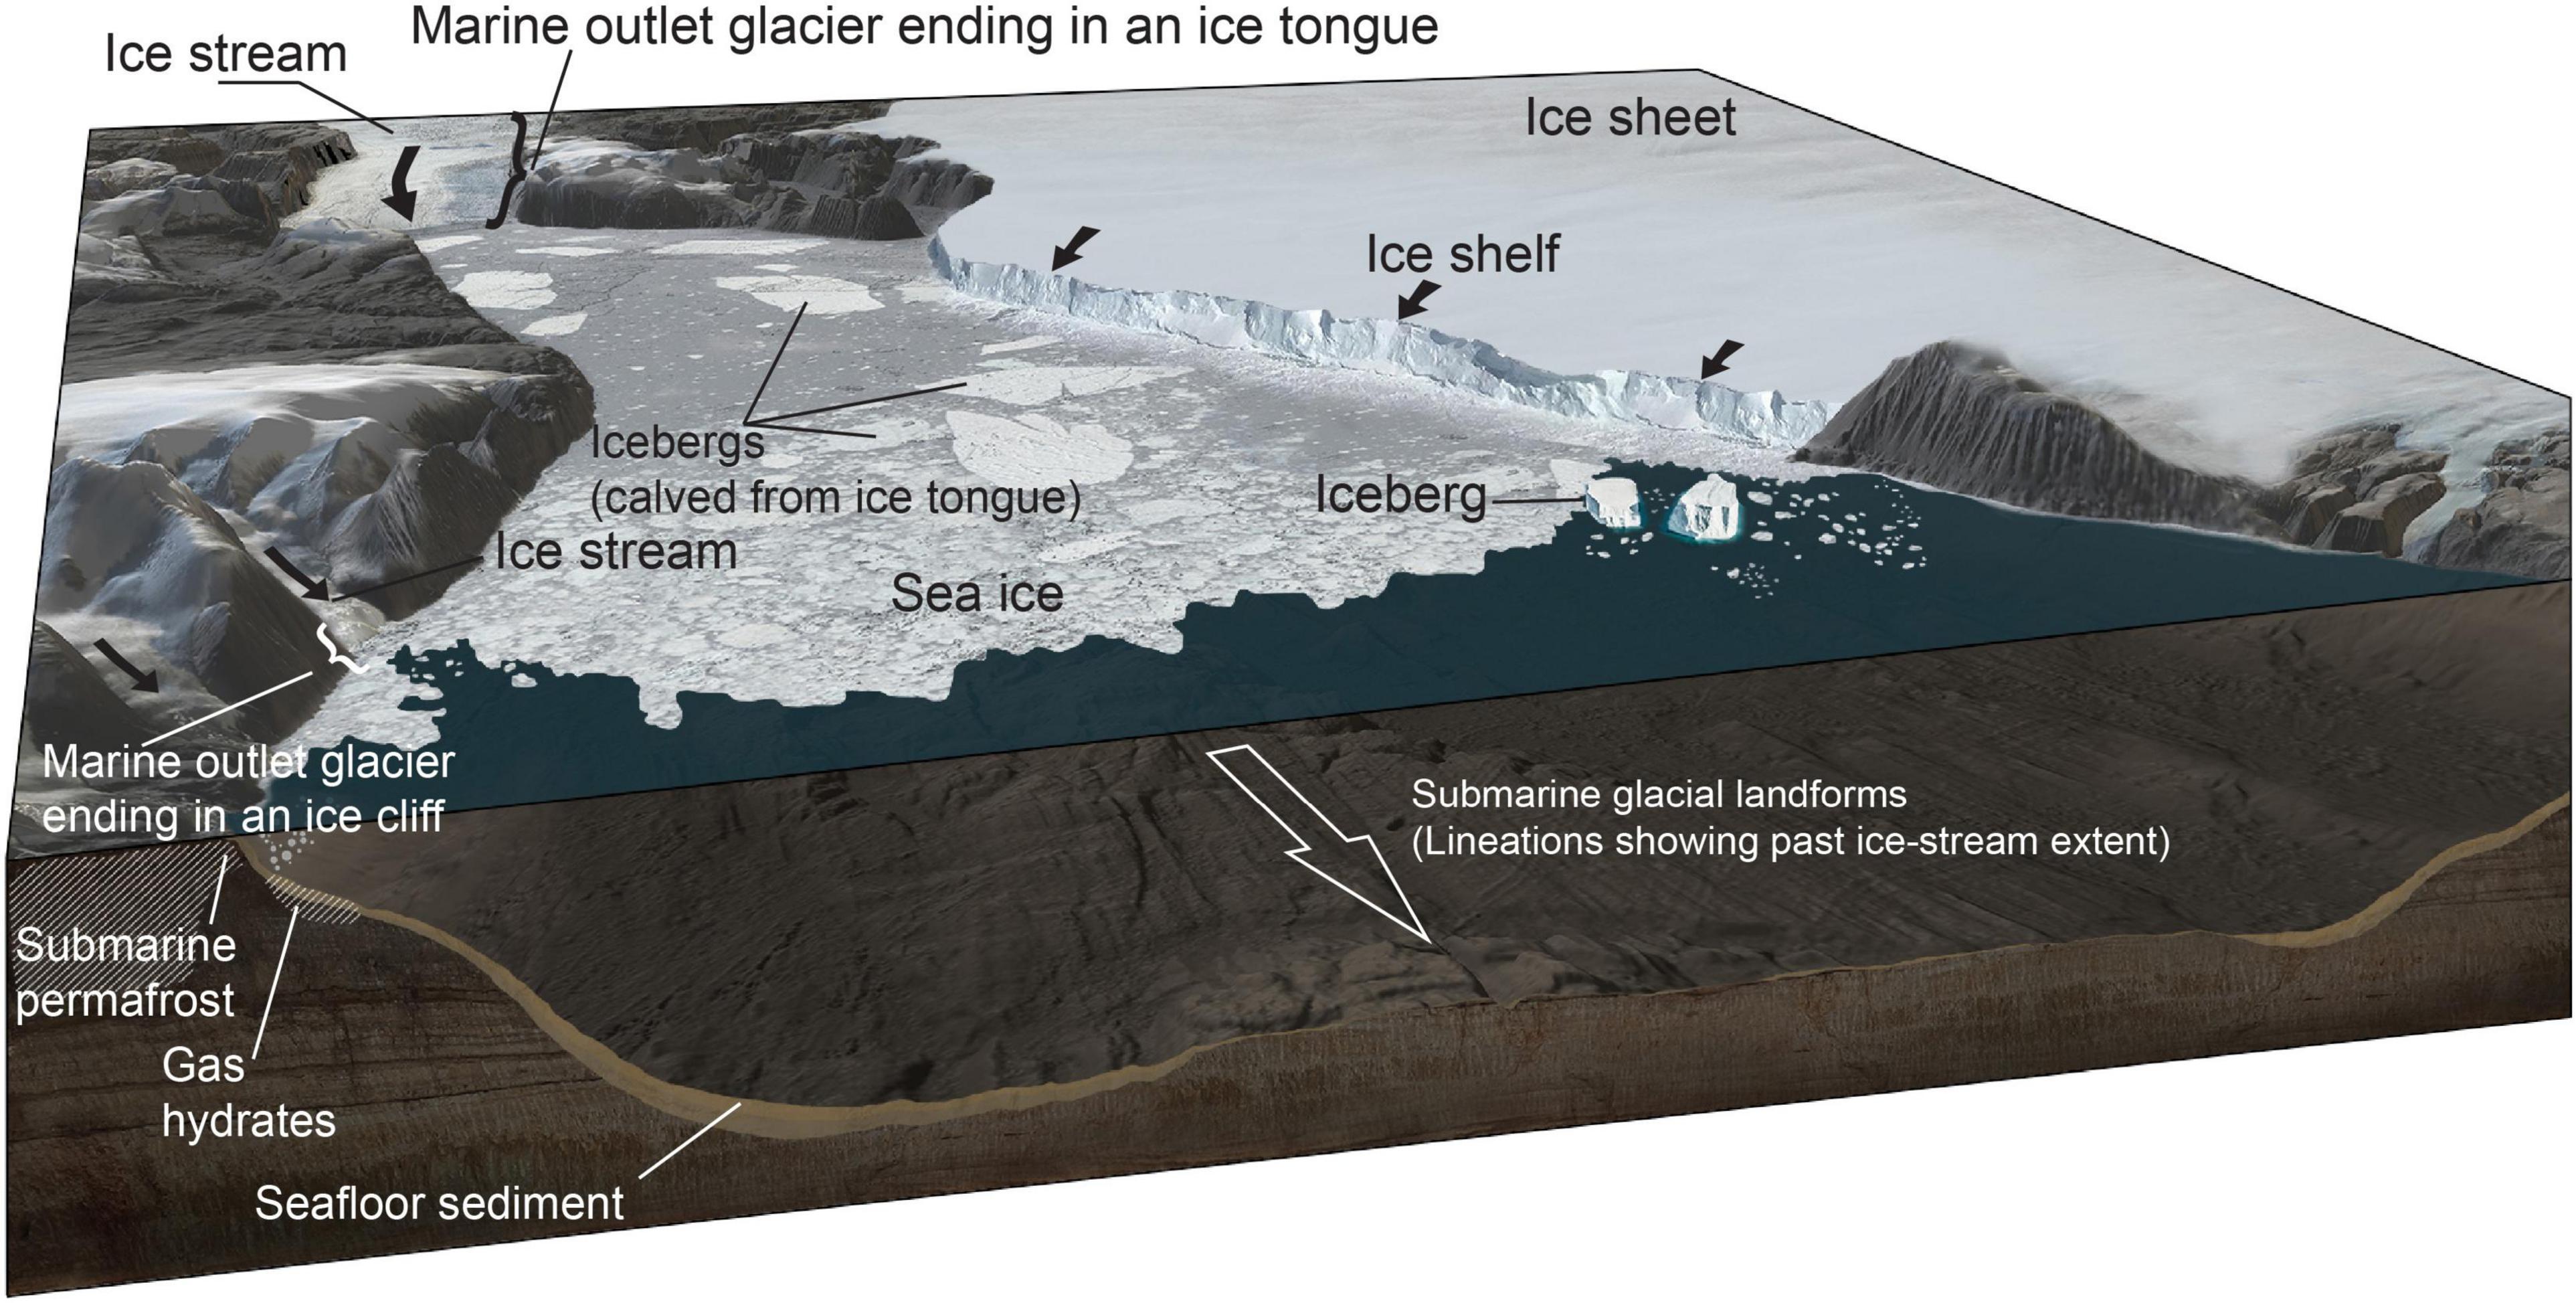
Figure 1. The main components of the “marine cryosphere,” here defined as including marine outlet glaciers ending in floating ice tongues/shelves or grounded ice cliffs, icebergs, ice sheets with their base suppressed below sea level, sea ice, gas hydrates and submarine permafrost. The floating extensions of marine outlet glaciers found in fjords are here referred to as ice tongues, while the wider floating extensions, primarily existing today in Antarctica, are called ice shelves. Permafrost and gas hydrates are part of the marine cryosphere, but not discussed much further in this work.
The marine cryosphere’s responses to a warming ocean are difficult to predict due to the non-linear and complex feedback-processes involved (Eisenman and Wettlaufer, 2009; Golledge et al., 2019). We will here focus on the sensitivity of marine glaciers and ice sheets with their base suppressed below sea level to continued global warming and the specific need to understand their bathymetric context when assessing their future, which is a critical component of the prediction of future GMSL rise.
While linear relations exist between climate warming and mass-loss for some glaciers (Cowton et al., 2018), the vast majority of studies reveal complex non-linearities and document marine outlet glaciers that suddenly begin to retreat rapidly (Holland et al., 2008; Mouginot et al., 2015). This is not only a phenomenon seen in modern observations of marine glaciers. High-resolution seafloor mapping of areas occupied by marine glaciers and ice sheets in the past has revealed seafloor morphology demonstrating the near instant break-up or rapid retreat of ice (Jakobsson et al., 2011, 2018; Wise et al., 2017; Dowdeswell et al., 2020). A well-documented explanation for sudden thinning of a marine outlet glaciers, specifically those that have floating extensions in the form of ice tongues (or shelves), is inflow of relatively warm, salty and dense subsurface water that comes in contact with the underside of the ice and causes melting (Figure 2) (e.g., Jacobs et al., 1996; Münchow et al., 2014). Bathymetry plays a critical role in this process. Bathymetric mapping beneath Pine Island Glacier in West Antarctica using an Autonomous Underwater Vehicle (AUV) revealed that when the glacier thinned enough to unground from a transverse ridge, warmer water could flow over the ridge and exert further melting (Jenkins et al., 2010). Furthermore, gravity-derived bathymetry of the cavity under Pine Island Glacier by NASA’s Operation IceBridge showed that seafloor shape greatly influences the sub-ice shelf circulation and thereby the glacier’s submarine melt rates (Schodlok et al., 2012). If a shallow bathymetric sill is located in front of the outlet glacier in a fjord, it may partly or completely prevent the warmer subsurface water from reaching the glacier as illustrated in Figure 2. Here we present documented examples of this phenomenon from Greenland, where a few marine outlet glaciers still have floating ice tongues (Figure 3) and where the Greenland Ice Sheet is pressing down the underlying bedrock below sea level in three major areas making them particularly sensitive to ocean warming. These marine based parts of the ice sheet are clearly seen in the compiled under ice topography BedMachine V3 (Morlighem et al., 2017; Figure 3).
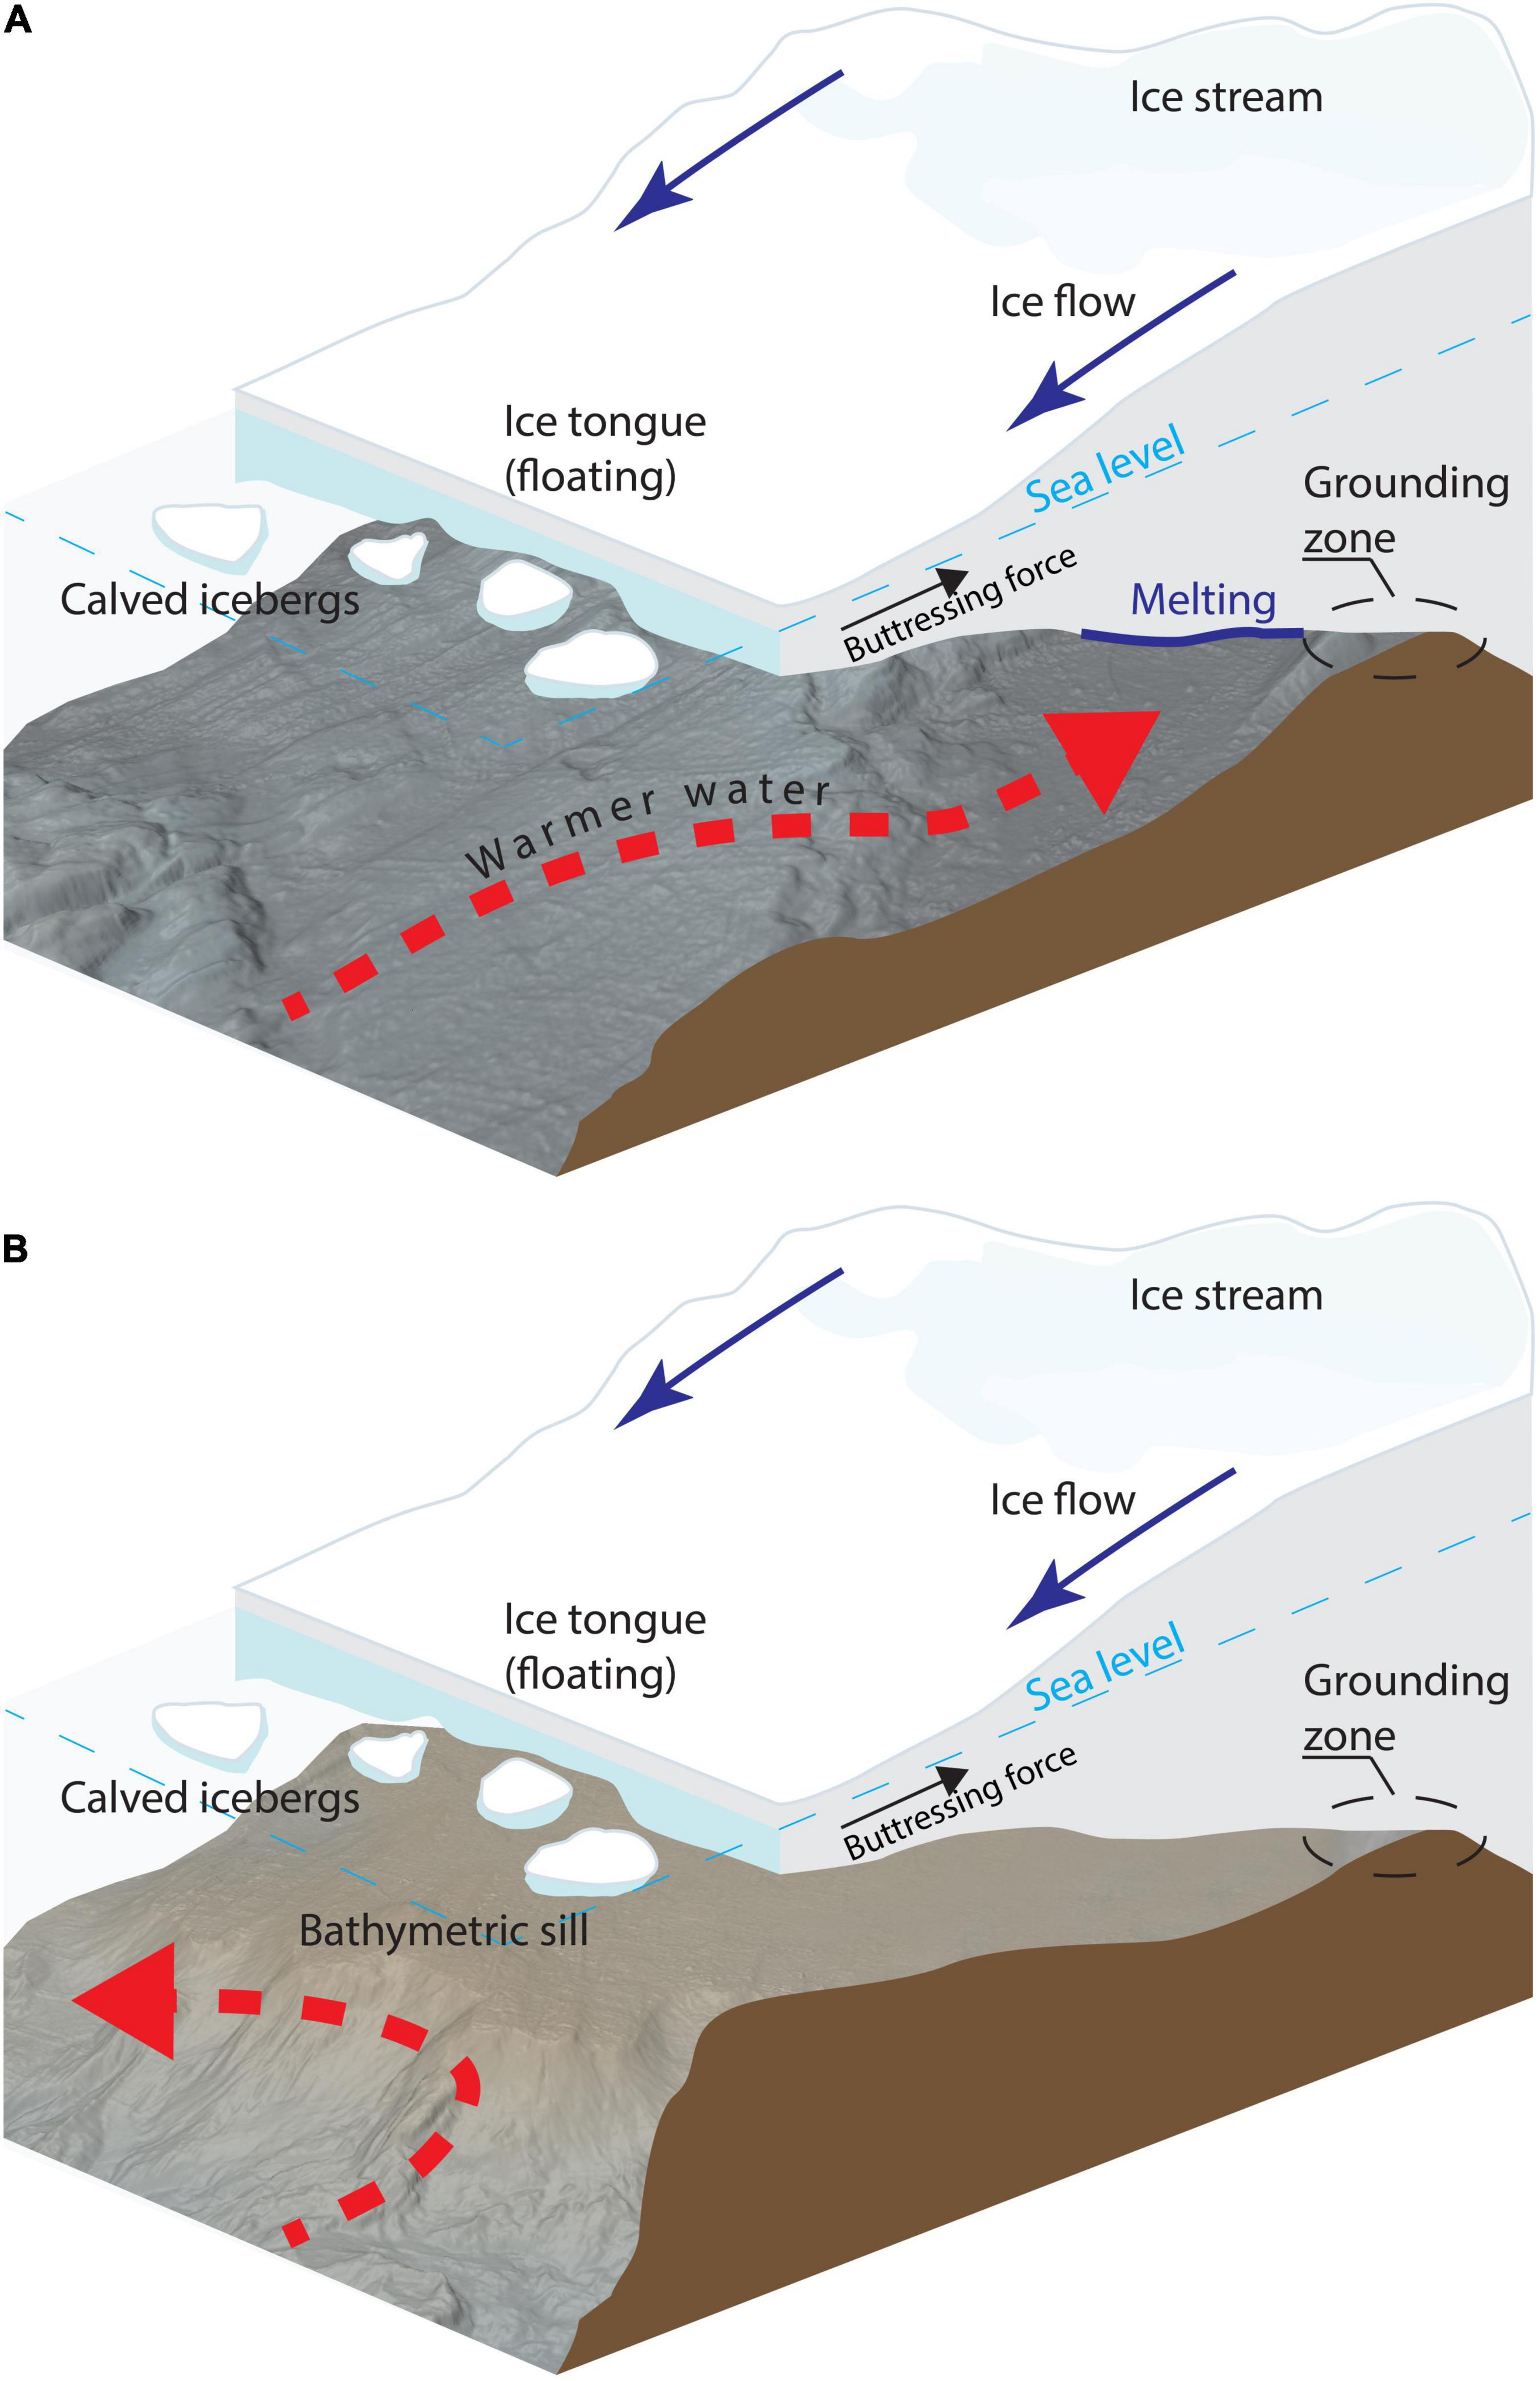
Figure 2. Schematic illustrations of how bathymetry may influence the inflow of subsurface warmer water in a fjord hosting a marine outlet glacier. (A) A seafloor without any bathymetric feature preventing warmer water from entering and reaching the underside of the glacier to exert melting. (B) A bathymetric sill shielding the glacier by preventing the warmer sub-surface water from flowing in underneath the glacier. In addition, scenarios exist with smaller sills only partly shielding the glacier as further discussed in the main text.
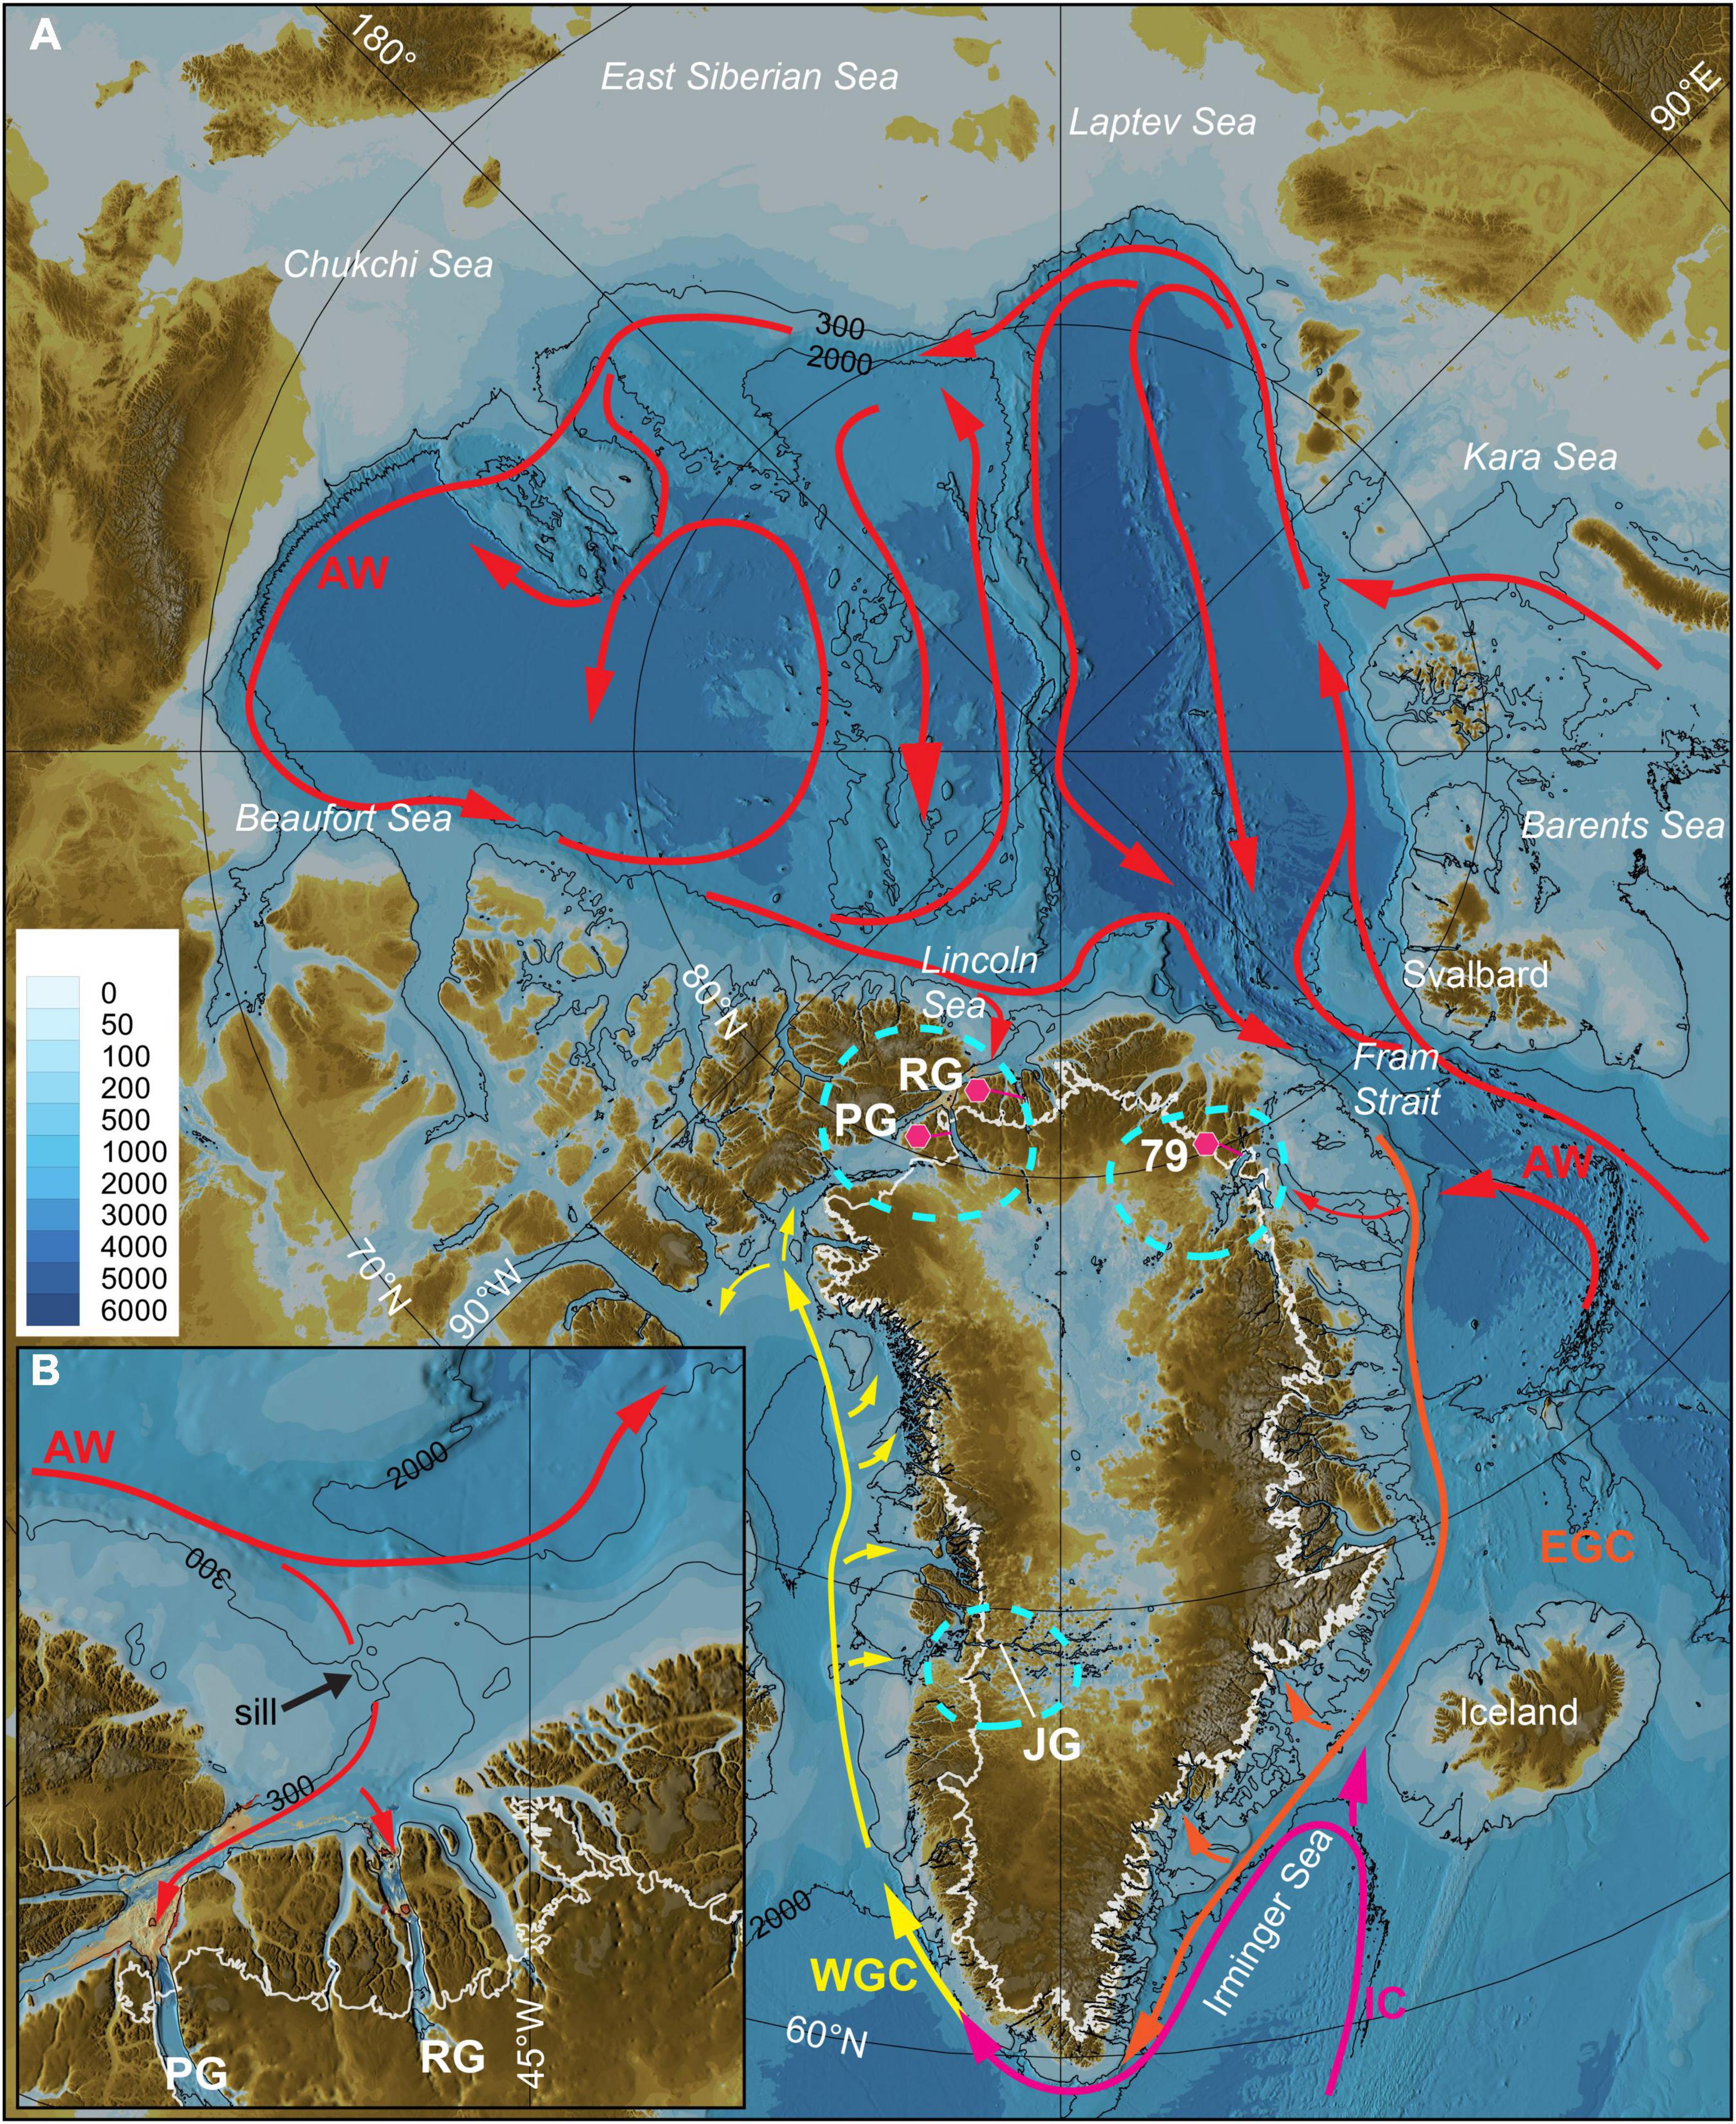
Figure 3. Bathymetric map of the Arctic Ocean based on the International Bathymetric Chart of the Arctic Ocean (IBCAO) Version 4 (Jakobsson et al., 2020a). The under-ice topography in IBCAO Version 4 is based on BedMachine V3 (Morlighem et al., 2017). (A) Circulation of key water masses with respect to transport of warmer subsurface water toward marine outlet glaciers draining the Greenland Ice Sheet: Atlantic Water (red: AW), Irminger Current (purple: IC), East Greenland Current (orange: EGC) and West Greenland Current (yellow: WGC) (currents are inferred from: Rudels et al., 2012; Lin et al., 2018). Examples of where these warmer waters have been found to flow toward marine outlet glaciers are taken from Schaffer et al. (2017) (79°N Glacier), Khazendar et al. (2019) (Greenland west coast including Jakobshavn Glacier), and (Fenty et al., 2016) (all around Greenland). The three main “marine sections” of the Greenland Ice Sheet (white line shows ice-sheet extent) are encircled with a blue stippled line. Within these, the ice sheet has pressed the underlying bedrock below sea level implying an increased sensitivity with respect to ice-ocean interaction. The purple hexagonal symbols indicate remaining larger ice tongues. PG = Petermann Glacier; RG = Ryder Glacier; 79 = 79° North Glacier; JG = Jakobshavn Glacier. (B) Close up on North Greenland. The multibeam bathymetry collected in Petermann Fjord and Sherard Osborn Fjord is shown with rainbow color table (see Figure 4 for a full display). The 300 m depth contour in the Lincoln Sea indicate where there is a bathymetric sill influencing the general inflow of AW toward outlet glacier of North Greenland.
Jakobshavn Glacier (a.k.a. Ilulissat Glacier) is a marine outlet glacier draining the Central Western sector of the Greenland Ice Sheet (Rignot and Mouginot, 2012; Figure 3). This glacier began to thin after a sudden increase in subsurface water temperature observed in 1997 (Holland et al., 2008). There is a bathymetric sill at the entrance of the Illulisat Icefjord where the glacier drains with the sill depth between about 200–245 m (Holland et al., 2008). This sill was apparently not shallow enough to prevent inflow of warm subsurface water that migrated from the Irminger Sea (the portion of the North Atlantic off Southeast Greenland), up the west coast of Greenland and reached Disko Bay by 1997 (Holland et al., 2008). When the warmer subsurface water entered, the Jakobshavn Glacier begun losing its floating ice tongue rapidly and in 1999, the glacier’s forward motion accelerated (Joughin et al., 2004), not slowing down until after 2014, when there appears to have been a cooling of the waters flowing into Disko Bay (Khazendar et al., 2019). Khazendar et al. (2019) attribute this ocean cooling to anomalous heat loss during wintertime in the boundary current flowing along southern Greenland. There are other cases where sills are able to control warm water inflow and have had a direct impact on the fate of marine outlet glaciers. In a recent study on the role of ocean forcing for the retreat of Greenland’s glaciers, 74 glaciers in deep fjords were identified where the intrusion of warmer Atlantic water contributed to mass loss, representing 49% of the total mass loss of the Greenland Ice Sheet (Wood et al., 2021). In each of these fjords, the bathymetry plays a key role.
The two largest outlet glaciers draining the North Sector of the Greenland Ice Sheet are Petermann and Ryder glaciers (Rignot and Mouginot, 2012; Figure 3). Petermann Glacier showed an average net retreat of 311 m a–1 between 1948 and 2015 (Hill et al., 2018) and lost about 40% of its floating ice tongue in two large calving events in 2010 and 2012 (Johannessen et al., 2013; Münchow et al., 2014). A speed-up of the glacier’s advance has been associated with the second calving event (Rückamp et al., 2019). Warm, subsurface water of Atlantic origin, partly exceeding 0.3°C, has been documented in Petermann Fjord and underneath the floating ice tongue (Münchow et al., 2016). This warmer water is proposed to be the main reason behind the thinning that eventually led up to the large calving events. The dynamics of Ryder Glacier dramatically contrast that of Petermann Glacier over the time interval 1948–2015 as analyzed by Hill et al. (2018). Instead of retreating, Ryder Glacier showed a net advance of 43 m a–1. It should, however, be noted that it also behaved differently from Petermann Glacier in that Ryder Glacier appears to be characterized by advance and retreat cycles, which not is the case for Petermann Glacier (Hill et al., 2018).
Petermann Fjord and Sherard Osborn Fjord (in which Ryder Glacier drains) were almost completely mapped with multibeam echosounder during expeditions with the Swedish icebreaker Oden in 2015 and 2019, respectively (Jakobsson et al., 2020b). The detailed bathymetry revealed striking differences between the two fjords’ seafloor morphologies. Both have bathymetric sills located at the fjord mouths, but Sherard Osborn Fjord has a second shallower sill at its inner (landward) end located just in front of the current ice tongue margin (Figure 4; Jakobsson et al., 2020b). Temperature and salinity measurements in Sherard Osborn Fjord showed that like Petermann Fjord, there is warm (>0.3°C) water of Atlantic origin entering, but that the shallow inner sill partly shields Ryder Glacier from this warmer water (Jakobsson et al., 2020b).
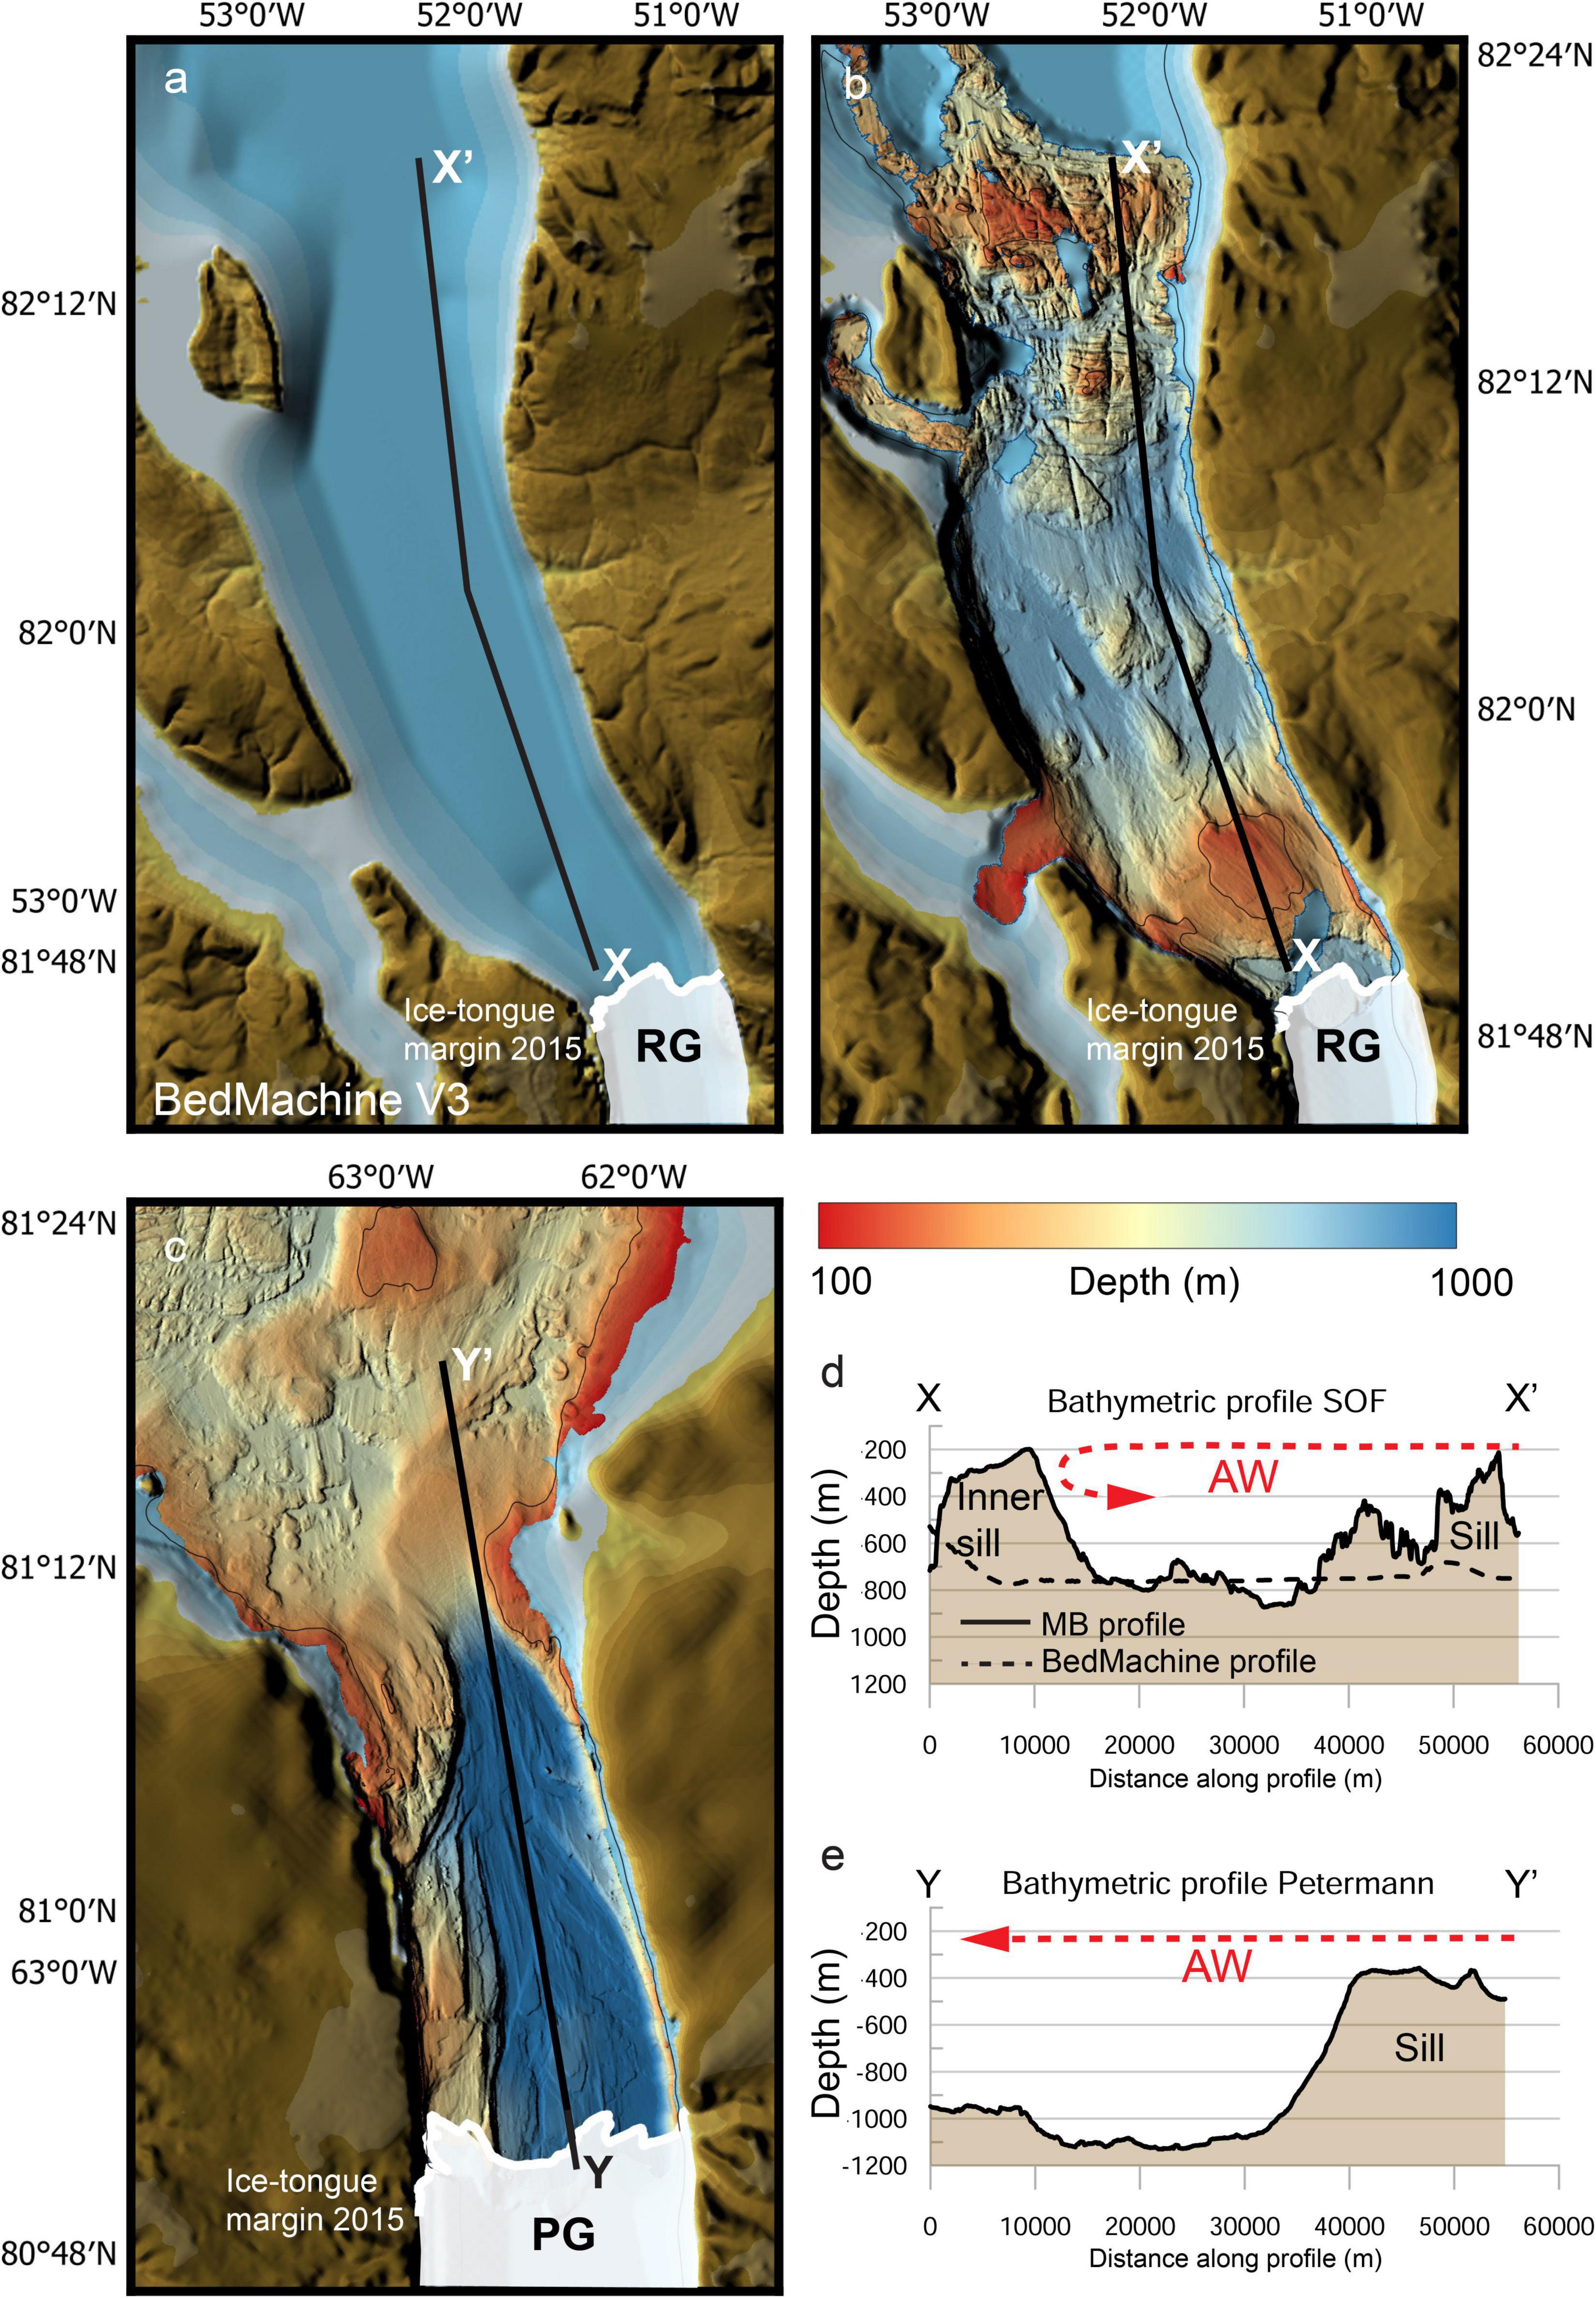
Figure 4. Comparison between the bathymetry of Sherard Osborn Fjord hosting Ryder Glacier and Petermann Fjord where Petermann Glacier drains. (a) The BedMachine V3 gridded bathymetry of Sherard Osborn Fjord, which due to the complete absence of depth data at the time of compilation solely is based on extrapolating the depth of the Ryder Glacier’s grounding line to the first available depth soundings outside the fjord (Morlighem et al., 2017). (b) Multibeam bathymetry of Sherard Osborn Fjord revealing a complex seafloor morphology including an inner less than 200 m deep sill, which shields Ryder Glacier from inflowing warmer Atlantic water (Jakobsson et al., 2020b). (c) Multibeam bathymetry of Petermann Fjord, showing an outer prominent sill, which does not provide any significant protection from the inflowing Atlantic water. (d,e) Bathymetric profiles along Sherard Osborn and Petermann fjords based on the multibeam bathymetry visualize the different sill configurations. The effects from the sills on the inflowing warmer Atlantic water in both fjords are illustrated by red arrows. A bathymetric profile constructed in Sherard Osborn Fjord from BedMachine is shown with a stippled line in panel (d) to highlight the importance of knowing the seafloor when accessing the critical ice-ocean interactions for predictions of future sea-level rise.
The demonstration of the importance of the role of intruding warmer waters in the nature of melting of marine glaciers and the dependence of this intrusion on the bathymetry in the fjord, also implies that bathymetry will have critical control in determining the overall access of these warm waters to the fjords. In the case of Petermann Glacier and Ryder Glaciers, warm Atlantic water makes its way all around the central Arctic Ocean flowing anti-clockwise along the continental slope after entering through the Fram Strait and across the Barents Sea (Figure 3). This implies that the depth of the continental shelf of Lincoln Sea matters since that will dictate whether or not the Atlantic layer is able to spill over and flow toward North Greenland fjords. The deepest known connection is slightly deeper than 300 m (Figure 3), although it should be pointed out that the bathymetric database of northern Lincoln Sea is very poor, which will be discussed below.
A bathymetric sill has also been found to constrain the inflow of warm Atlantic water toward the large 79°N Glacier draining the Northeast Sector of the Greenland Ice Sheet (Schaffer et al., 2020; Figure 3). The authors concluded that the sill, which they mapped with multibeam sonar, together with the bathymetric channel configuration in front of the glacier’s calving front controls the amount of heat transported into the ice cavity and thereby controls the melt at the base of the ice. On the other hand, the bathymetry off the nearby Zachariae Isstrøm Glacier provides a pathway for warmer subsurface waters, which has been suggested to partly explain its recent larger mass loss compared to 79°N Glacier (Yang et al., 2020; An et al., 2021).
In addition, the bathymetry of the Northeast Greenland shelf further offshore from the 79°N Glacier plays an important role as it permits warmer Atlantic water to enter the region through a channel, i.e., Norske Trough. This can be seen as analog to the Lincoln Sea where the shelf bathymetry controls the general inflow of Atlantic water toward North Greenland’s marine outlet glaciers.
History and Status of Polar Mapping
As outlined in the introduction, mapping of the Polar regions has been organized through the two regional mapping projects, the International Bathymetric Chart of the Arctic Ocean (IBCAO) initiated in 1997 in St Petersburg Russia (Macnab and Grikurov, 1997) and the International Bathymetric Chart of the Southern Ocean (IBCSO) started in 2006 (Arndt et al., 2013). The IBC (International Bathymetric Chart) concept was introduced in the 1970s by the Intergovernmental Oceanographic Commission (IOC) as a regional framework for depth data compilation with the goal of producing detailed bathymetric maps. Both IBCAO and IBCSO initially established Editorial Boards endorsed by IOC and consisting of representatives of countries and institutions with specific interests in seafloor mapping of the Polar regions. The Editorial Board of IBCSO also constituted an Expert Group of the Geoscience Standing Scientific Group (GSSG) of the Scientific Committee on Antarctic Research (SCAR) while the IBCAO Editorial Board initially had formal endorsement from the International Arctic Science Committee (IASC). IBCAO and IBCSO now are integral parts of the Nippon Foundation—GEBCO Seabed 2030 project implying that they operate under the auspices of the IOC as well as International Hydrographic Commission (IHO). The Editorial Boards have been expanded to include a broader set of members and are now referred to as Mapping Committees of the Seabed 2030 project.
IBCAO released Version 1.0 of the gridded bathymetric compilation in 2000 (Jakobsson et al., 2000) and followed up with Versions 2.0, 3.0 and 4.0 in 2008, 2012 and 2020, respectively (Jakobsson et al., 2008, 2012, 2020a). The grid cell-size resolution on a Polar Stereographic projection has increased from 2 km × 2 km in Version 1.0 to 200 m × 200 m in Version 4.0. IBCSO released Version 1.0 in 2013 as Polar Stereographic grid with a cell-size of 500 m × 500 m (Arndt et al., 2013), which remains the cell-size of the soon to be released Version 2.0.
The topography under the ice sheets connects directly with the seafloor bathymetry in fjords where marine outlet glaciers drain and is thus a critical parameter for the assessment of ice dynamics. The BedMachine effort has, in a fashion similar to IBCAO and IBCSO, compiled the under-ice topography of the Greenland and Antarctic ice sheets using all available data, mainly consisting of airborne radar measurements detecting the ice/bed interface (Morlighem et al., 2017, 2020). Where data are lacking, the BedMachine compilations are based on a mass conservation approach described by Morlighem et al. (2011). With IBCAO 4.0 a collaboration was initiated with the BedMachine project to ensure that the two gridded compilations are synchronized. BedMachine contributes the under-ice topography to IBCAO and bathymetric data along the coasts are shared between the projects. The same collaboration has been setup with IBCSO.
Mapping Status of Arctic Waters
Analysis of the latest IBCAO depth database (IBCAO 4.1; available for download from https://www.gebco.net/data_and_products/gridded_bathymetry_data/arctic_ocean/) reveals two large areas where the digital bathymetric grid is particularly poorly constrained by depth soundings: Area A off Northern Greenland and the Canadian Arctic Archipelago and Area B encompassing the outer continental shelves and slopes of the western Chukchi, East Siberian, Laptev, Kara and Barents seas (Figure 5).
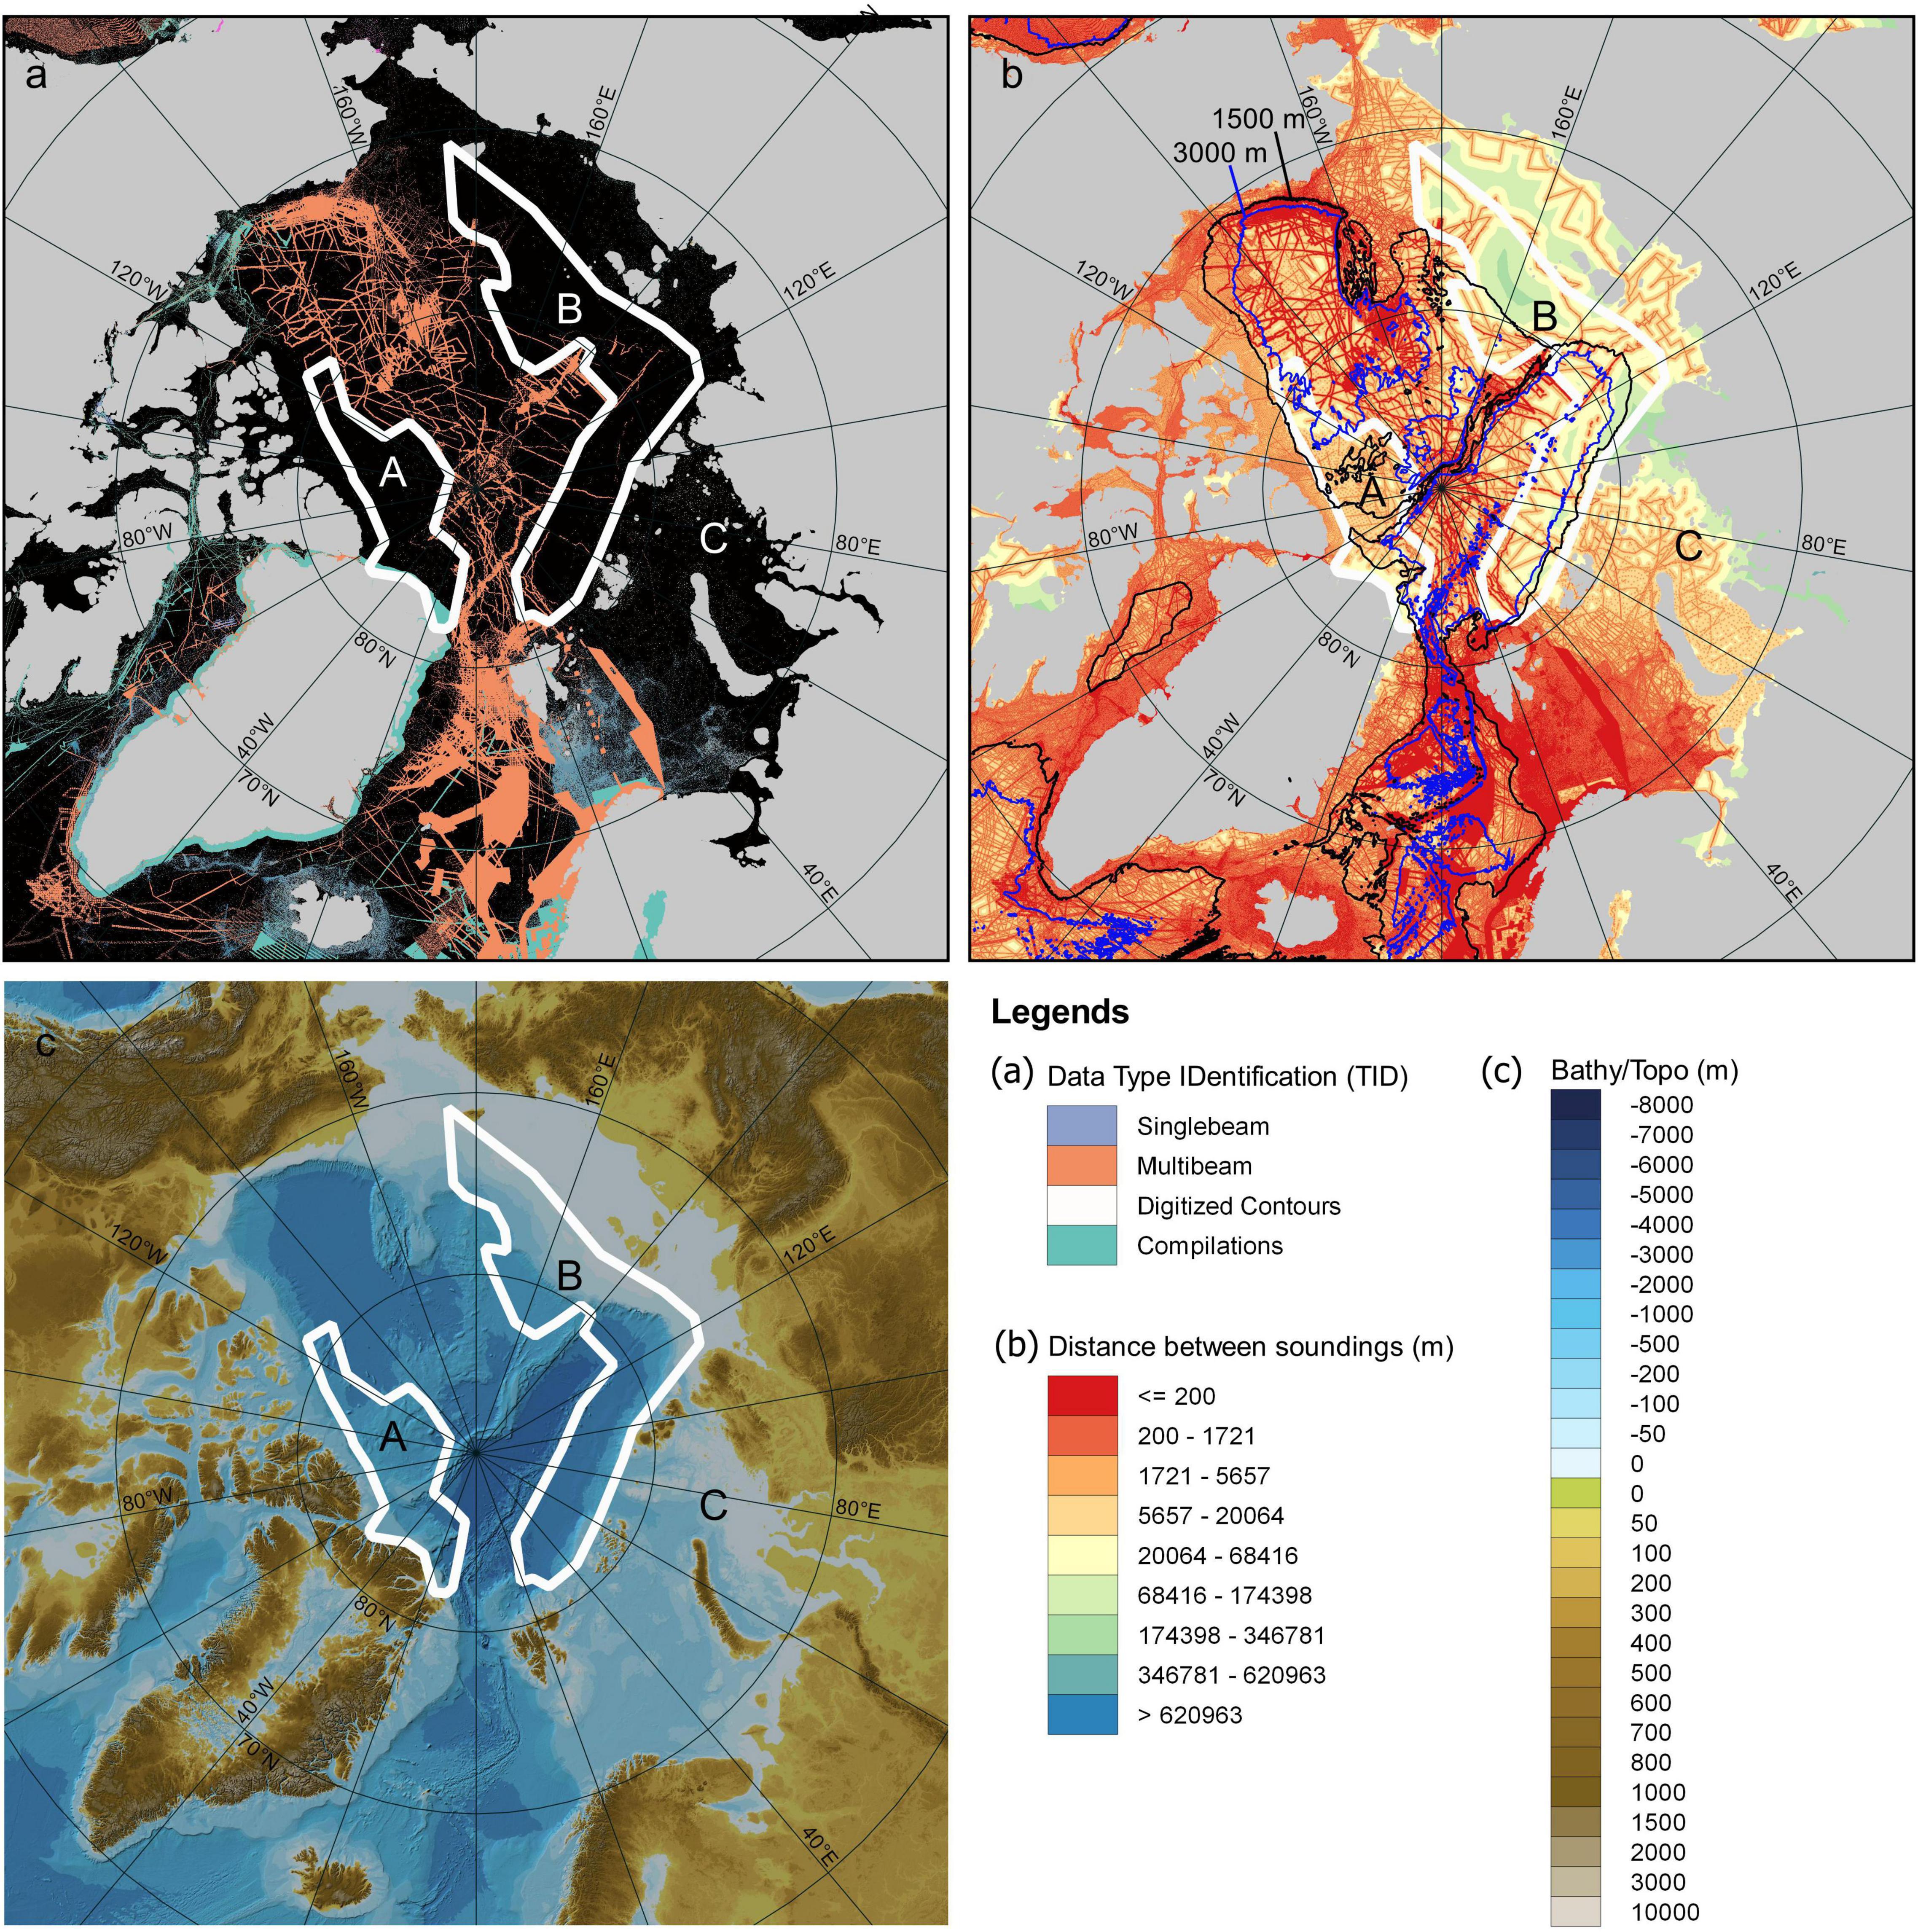
Figure 5. Analyses of the IBCAO 4.1 underlying depth database and identification of three areas (A–C) in the central Arctic Ocean where the database is particularly poor. (a) Map showing the distribution of different types of data (see legend). (b) Map showing horizontal distances between depth data (multibeam, single beam and spot soundings from charts are included). The 1,500 and 3,000 m depth contours are shown as they indicate the required data densities (distance between data points) considering the Seabed 2030 target gridding resolutions; 0–1,500 m: 100 m × 100 m grid cell size; 1,500–3,000 m: 200 m × 200 m grid cell size; 3,000–5,750 m: 400 m × 400 m grid cell size (exceed deepest location in the Arctic Ocean) 5750–11,000: 1,100 m × 400 m grid cell size (c). The areas A–C overlaid on the IBCAO 4.1 bathymetry.
The area off North Greenland is a region of near year-round, persistent, thick multiyear sea ice and thus very difficult to work in, even with heavy icebreakers. Within Area A gridding was primarily done using digitized depth contours from the Russian bathymetric chart “Bottom Relief of the Arctic Ocean” published in 2011 (Naryshkin, 2001). This map does not reveal the underlying constraining depth data and excludes the shallow portion of the North Greenland shelf from the bathymetric portrayal, probably due to lack of data. We only have a few multibeam tracks that can be used to assess the quality of the used depth contours.
Area B has had recent mapping activity in support of the Russian submission for an extended continental shelf (see Figure 3 in Ministry of Natural Resources and Environment of the Russian Federation et al., 2015), the Russian Federation has not made these data available to the GEBCO or IBCAO database and thus the region is mainly gridded from digitized depth soundings from published Russian navigational charts. Navigations charts show only selected soundings for the purpose of safe navigation and thus do not provide a comprehensive view of the seafloor morphology. The few multibeam tracks included in IBCAO 4.1 from Area B show, in several places, that the shelf breaks and slopes are not well portrayed in the digitized maps used as the source to generate the grid. The innermost portion of the East Siberian Sea south of Area B is supported by a relatively regular distribution of soundings from the above mentioned Russian navigational charts. Even if the data density is less than the Seabed 2030 requirement of 100 m × 100 m in shallow waters, we have not included this region among the most poorly constrained in the Arctic Ocean.
A third poorly constrained area is the eastern portion of the Kara Sea marked Area C in Figure 5 is gridded more or less entirely using depth contours that were hand drawn from a sparse sounding database of various random ship tracks, which did not permit direct gridding without the support from contours.
The large Areas A and B have been outlined using the Type Identification (TID) map in Figure 5a as well as a distance between soundings analysis shown in Figure 5b. These two approaches reveal several additional smaller areas with equally poor data coverage spread out over the Arctic Ocean.
A closer look at the bathymetric coverage in the IBCAO 4.1 around Greenland highlights at least 13 marine outlet glaciers with particularly poor, to no, depth data coverage in their hosting fjords (Figure 6). Most of these are located along the northern coasts. The NASA-led project Ocean Melting Greenland has managed to cover a large number of fjords further south, with at least one in and out track of multibeam coverage, where the ice conditions are less challenging (Fenty et al., 2016; Rignot et al., 2016; An et al., 2017, 2018, 2021; Millan et al., 2018).
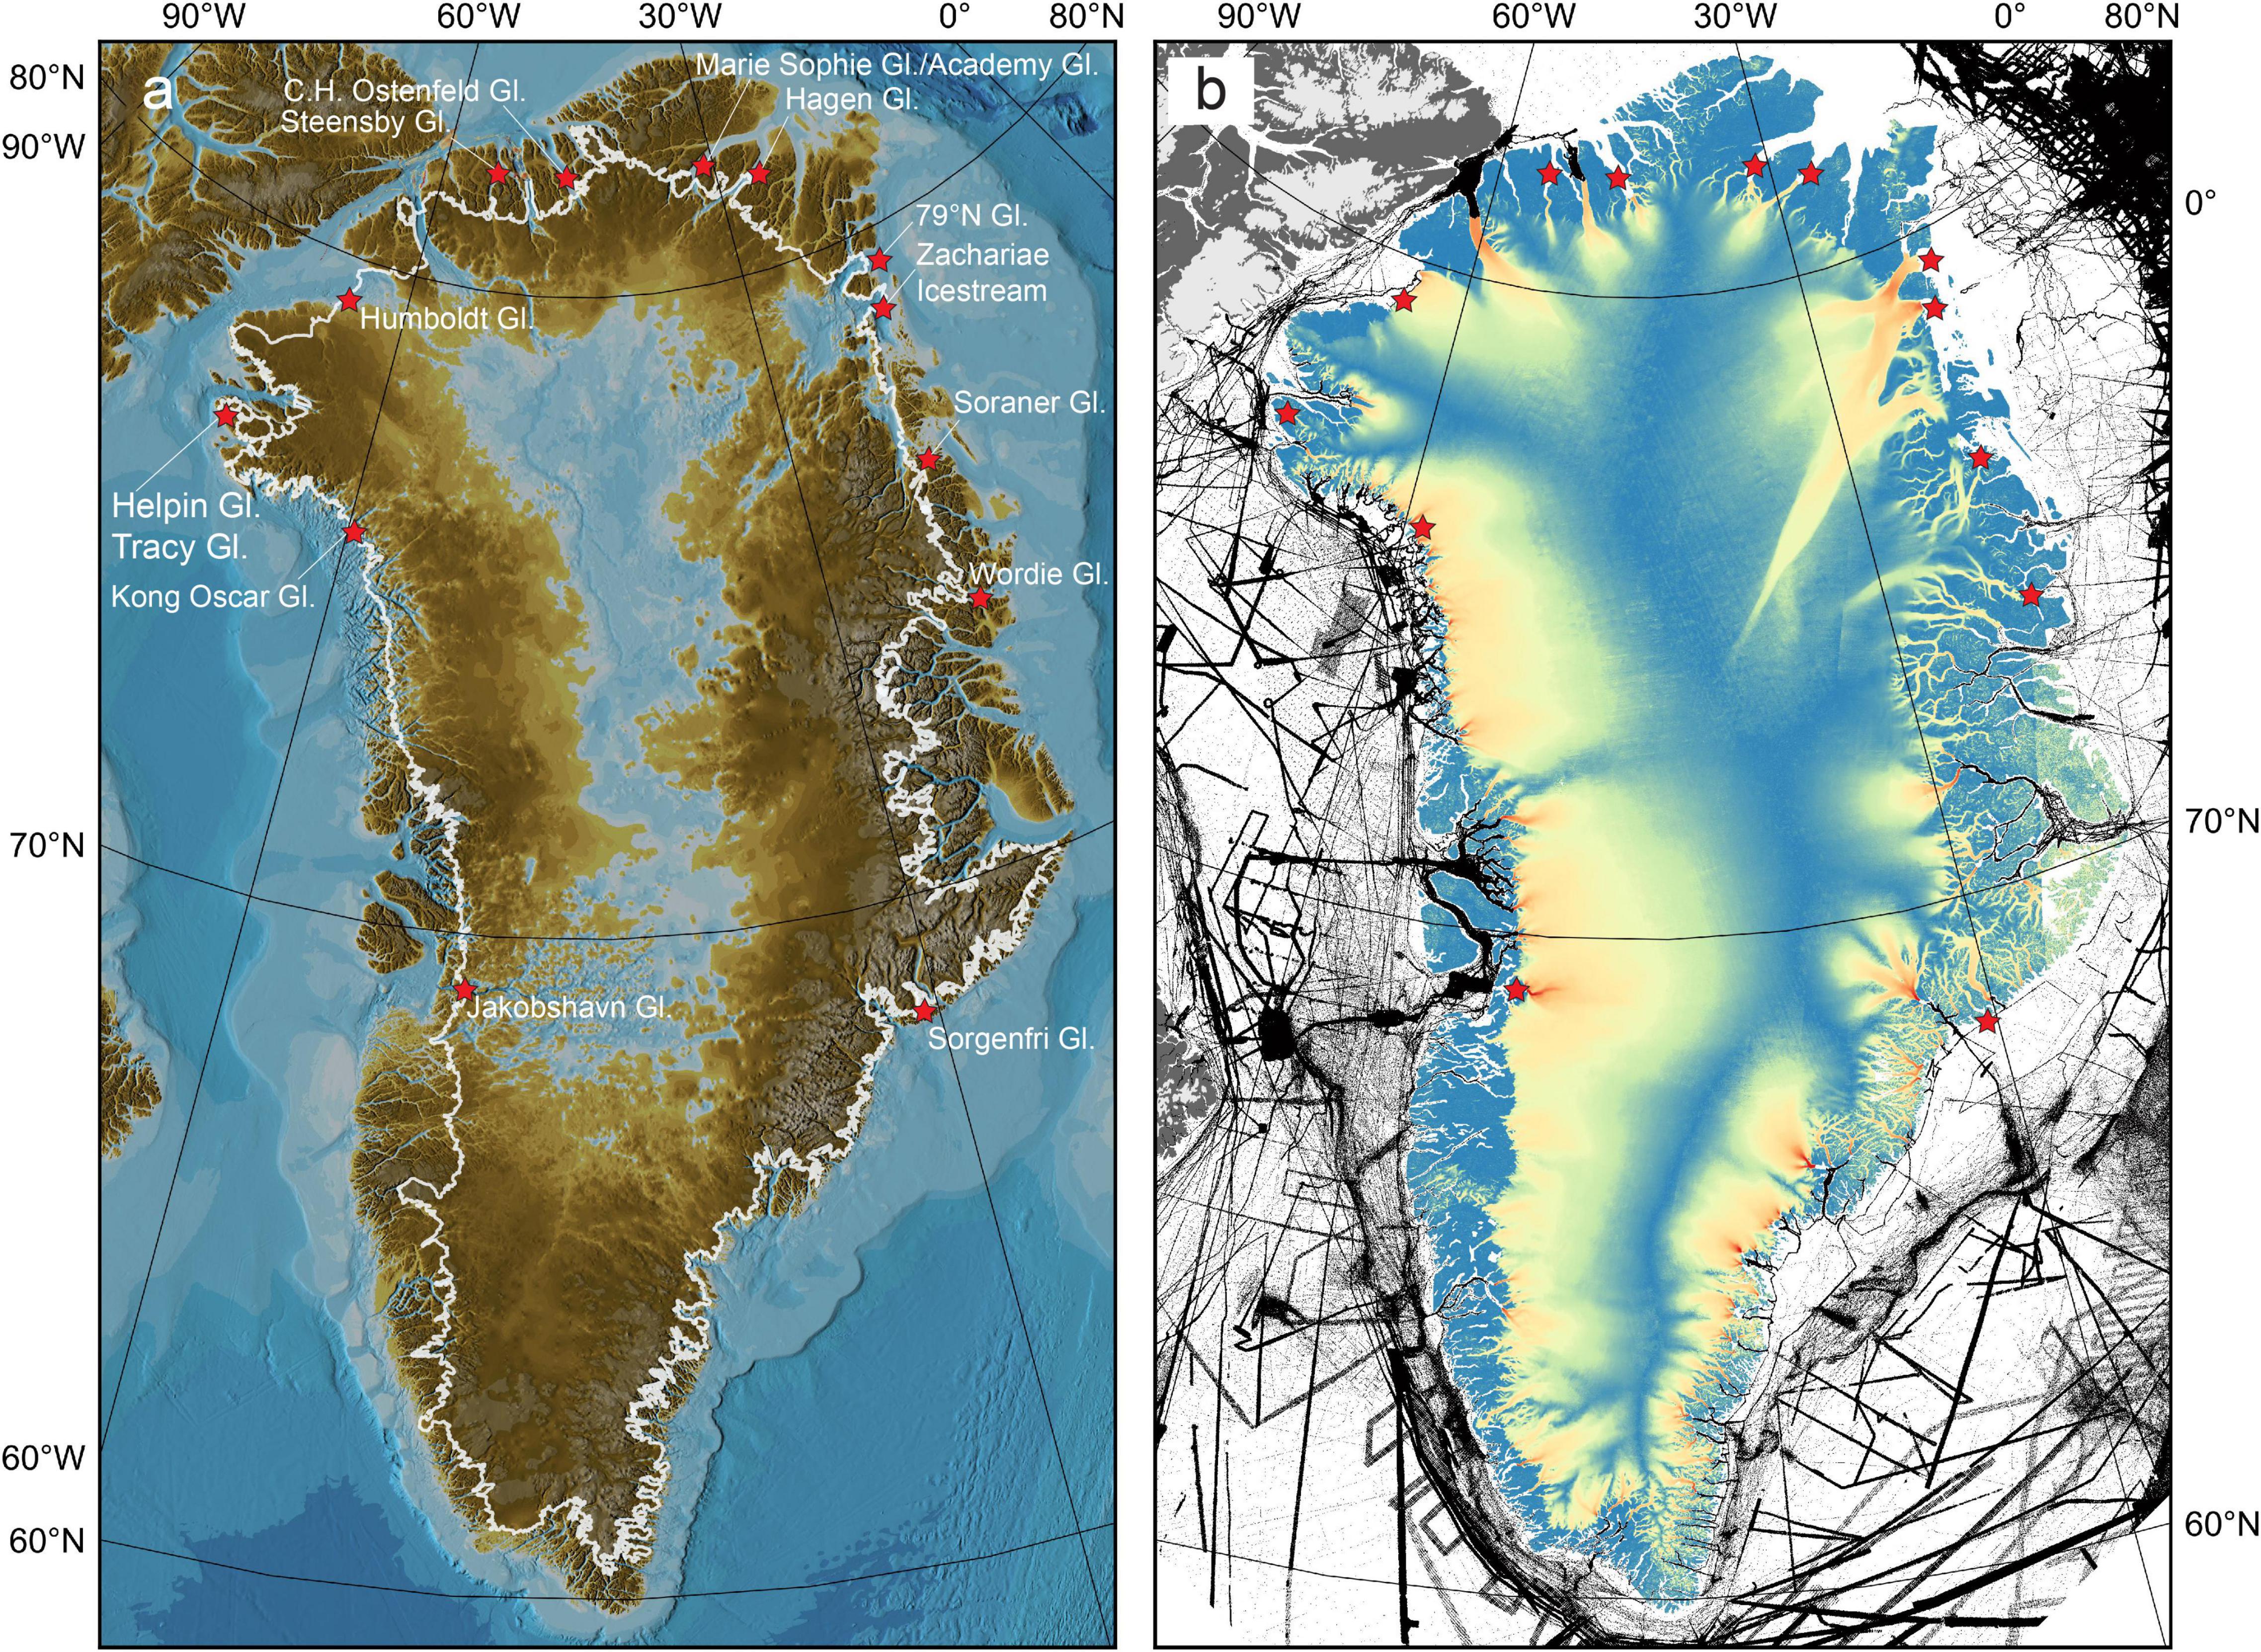
Figure 6. (a) Marine outlet glaciers with poor to no depth data coverage in their hosting fjords. (b) Bathymetric data around Greenland in the IBCAO 4.1 database.
Discussion
While the Polar regions are currently not less unmapped than the rest of the World oceans, ∼80%, the challenges to fill the remaining gaps are much greater due the harsh environmental conditions, where sea ice in particular hampers mapping using both surface vessels and undersea vehicles.
It has been estimated that using current technology (i.e., surface-ship mounted multibeam sonars) it would take about 200 ship years and cost on the order of 3–5 billion dollars to map the unmapped regions of the World oceans deeper than 200 m, which represent 94% of the global seafloor (Mayer et al., 2018). However, to make complete mapping of the world’s seafloor more feasible, we must call upon technological advances to bring this ambitious goal to fruition, in particular if we aim to also succeed in the Polar regions.
Several technologies have been called upon to expedite and reduce the cost of the complete mapping of the world’s seafloor. Foremost among these is the use of autonomous surface vehicles which can carry on mapping missions without the need for a crew on board the vessel which often represents on the order of 30% of the operating cost of an oceanographic research vessel. While we are in the early days of development of truly autonomous full-ocean capable platforms, several commercial entities (e.g., Fugro, iXblue, Ocean Infinity, OceanX, Seakit, TerraSurveys) have already demonstrated the use of single or groups of uncrewed surface vessels for seafloor mapping, though for the most part, these mapping efforts have not involved full-ocean depth sonars. Most recently, the company Saildrone has introduced the Saildrone Surveyor, a 22 m-long uncrewed sailing vessel equipped with both shallow and deep-water multibeam sonars. The use of a wind (and solar) powered uncrewed vessel as a platform for a deep-water mapping system offers the additional level of cost reduction by removing the other major expense associated with traditional surface ship mapping—fuel costs. A wind and solar powered vessel also offer a very low carbon footprint as compared to traditional crewed research vessels. While the Saildrone Surveyor has a small auxiliary engine to assist in charging batteries and maneuverability when needed, the use of wind and solar power allow for multi-month missions without the need to return to port, thus facilitating missions in far remote areas of the ocean and adding another level of gained operational efficiency over traditional crewed research vessels.
Other strategies proposed for the enhanced mapping of the global ocean include the consistent collection and provision of mapping data during transits by all mapping sonar-equipped vessels. There has been great progress on this front led by Fugro who has been providing all of their transit data to the GEBCO compilation (see The-iho-data-center-for-digital-bathymetry-an-overview), and accelerated efforts to engage the broader public in “crowd-sourced” bathymetric data collection (Pavic et al., 2020). These crowd-sourced efforts tend to focus on single-beam echo sounders that are already installed on either commercial or recreational vessels and, in areas with heavy fishing vessel activity, have been supported by commercial ventures (e.g., Olex and MaxSea) and proven to be a very useful addition to the global database of bathymetric data. In these regions of dense vessel activity, the power of the crowd (i.e., a tremendous amount of redundant data) has proven to be an acceptable approach to quality control, though hydrographic agencies are still reticent to use these data for safety of navigation products. Of late, the concept of “Trusted Community Bathymetry,” has evolved, which involves the installation of a relatively inexpensive “black box” on the vessel that will automatically calibrate the system and provide metadata and data quality guarantees to ensure that the data provided is appropriate for even hydrographic (safety of navigation) mapping purposes (Calder et al., 2020). Finally, there is a recent effort to install single-beam echo-sounders on the ubiquitous Argo floats that drift in the most remote regions of the world’s oceans. These new floats will take advantage of the thermal difference in the upper part of the ocean to generate power that will allow the float to power an active echo-sounder. While again offering only single-beam coverage, the hope of thousands of depth measurements per day in remote areas of the ocean will be an important addition to our limited seafloor mapping data base. The collective of these activities will hopefully add tremendously to the global data base of deep-sea bathymetry and with that provide the critical geospatial context needed for a broad range of scientific, environmental, and engineering applications. We now discuss potential approaches for the enhanced collection of bathymetry in the Polar regions.
Even if the Polar regions are currently bathymetrically mapped at about the same level as the global ocean, it is clear that the challenges faced in completing the mapping are exacerbated due to ice, extreme weather, and long distances from ports, putting serious constraints on the methods that can be used. Of these, sea ice represents the most serious challenge because it limits access to the region to surface ships capable of operating in the ice (ice breakers) or near the ice margin (ice-strengthened vessels) and even these can only operate over a small seasonal window. There are a limited number of ice breakers and ice-strengthened vessels and only a small proportion of these carry modern multibeam echo-sounders. Additionally, collecting echo-sounding data while breaking ice is very difficult due to the large noise levels associated with the ice-breaking process and the movement of ice below the transducers. While the presence of ice is a severe challenge to mapping in the Polar regions we must also acknowledge that, in the Arctic the extent of sea ice has dramatically declined (approximately 12.8% per decade) and that the areal proportion of thick ice at least 5 years old has declined by approximately 90% over the past 40 years (Pörtner et al., 2020). Additionally, new modeling has provided evidence supporting the potential for a “sea ice-free” Arctic by as soon as 2035 (Guarino et al., 2020). As ice extent and thickness diminish in the Arctic, access to the region by vessels other than icebreakers and even non-ice-strengthened vessels will increase allowing many of the approaches described above (in particular multibeam sonar-equipped autonomous vessels) to be implemented. However, we must remember that an “ice-free” Arctic does not mean that there is no ice, only that the at some point in the summer the ice extent has dropped to below 1 million km2 and that while there has been an average of 12.8% per decade of decrease in Arctic sea-ice extent over the past 40 years, this decline is associated with annual variability that can significantly increase the extent of Arctic sea ice in some years. It is thus clear that for the foreseeable future, we must think about special approaches to mapping the seafloor in ice-covered, Polar regions.
Ideally detailed mapping of the seafloor in ice-covered regions would be conducted under the ice with a high-resolution broad coverage mapping system that can survey at high speed free from the inclement weather conditions at the surface. Nuclear submarines have operated under Arctic sea ice since the historic voyage of the U.S.S. Nautilus in 1958. Single-beam echo-sounding data from historic transits of United States and British submarines started to be declassified in the l990s and data collected before 1988 became an important contribution the IBCAO Version 2.0 bathymetric compilation (Jakobsson et al., 2008). Declassified data from 1993–2005 was incorporated in Version 3.0 of IBCAO (Jakobsson et al., 2012). The declassification process slowly continues and some more recent single-beam echo-sounder data sets are now becoming available, but these data sets still represent quite sparse soundings. More significantly, in 1998 and 1999 as part of the United States Navy’s and National Science Foundation’s Science Ice Exercises (SCICEX) program the United States Navy’s submarine Hawkbill was equipped with a swath mapping sonar called SCAMP (Seafloor Characterization and Mapping Pods) (Chayes et al., 1998). Included in SCAMP was a 12-kHz Sidescan Swath Bathymetric Sonar (SSBS), which was able to survey as speeds up to 16 knots and acquire bathymetry over a swath as wide as 10 km (Edwards and Coakley, 2003). While this example of equipping a nuclear submarine with a high-resolution mapping system is clearly the most efficient way to assure the collection of mapping data in an under-ice environment, the likelihood of this option being available in the near future is very low and we must explore other possibilities.
In the absence of access to swath mapping-equipped nuclear submarines, other means must be explored to map under the ice. Here again, autonomous vehicles come to the fore, but in this case, underwater autonomous vehicles as opposed to surface vehicles. As far back as 1992, the International Submarine Engineering (ISE) and the Canadian Department of National Defense, developed a long-range autonomous vehicle (Theseus) that successfully deployed a submarine cable and traveled more than 350 km under the ice (Butler and Verrall, 2001). In 2010, ISE deployed two Explorer AUVs (Autonomous Underwater Vehicle) specifically to collect mapping data in support of Canada submission for an Extended Continental Shelf under Article 76 of the Law of the Sea Treaty and were able travel almost 1,000 km over three missions at depths up to 3,160 m (Ferguson, 2009). Numerous other autonomous underwater vehicles have ventured under the ice with a range of sensors. Most notably, the United Kingdom’s Autosub2 collected 450 km of under-ice mapping data off Greenland in 2004 (Wadhams et al., 2006) and Autosub3 collected more than 500 km of mapping data over a series of missions under Pine Island Glacier in Antarctica in 2009 and 2014 (Graham et al., 2013; Kimura et al., 2016). A new “long-range” Autosub has been developed and already operated under the ice shelves of Antarctica, holding great promise for future long-range missions under the ice (McPhail et al., 2019). In any attempt to map under the ice the question of precise positioning of a vehicle that cannot connect to a satellite navigation network must be addressed. In the case of the deployment of the Explorers, ISE used a combination of a Doppler Velocity Log (DVL)-aided Inertial Navigation System (INS), an UltraShort BaseLine (USBL) navigation system and a custom-built homing system for retrieval of the vehicles (Ferguson, 2009). An excellent review of the history of the use of AUVs in the Arctic and the evolution of the positioning systems they used can be found in Barker et al. (2020). In order to have a robust and efficient under ice mapping program more effort will need to be put into the development of robust, long-distance positioning capabilities, longer battery life, and generally more robust vehicles so that users will have the confidence to launch such vehicles on long missions where there is no easy path for rescue of the vehicle. If costs can be reduced, a fleet of such vehicles offers the greatest opportunity to collect high-resolution data over large ice-covered areas.
At the ice margin, where much of the critical mapping with respect to sea level rise is needed, “hybrid” vehicles (vehicles that can operate both tethered and untethered modes) offer tremendous opportunity for mapping beneath ice tongues or ice shelves. Built specifically for working under ice margins, the Nereid Under-Ice vehicle (NUI) is a lightly tethered hybrid AUV/ROV designed to work under fixed or moving ice (Bowen et al., 2014). The vehicle is lowered on an armored cable as a standard ROV at the ice margin. It then is deployed on a very thin fiber tether allowing it to travel up to 40 km laterally with full communications back to the deploying vessel through the fiber optic link. If the fiber breaks, the vehicle becomes an independent AUV and can navigate back to the deployment position. Future iterations may be able to significantly extend this length of the tether allowing controlled exploration and mapping of even larger areas under ice shelves or ice tongues.
Another approach to collecting mapping data in seasonally ice-covered areas is to build low-cost floating echo-sounders with a simple data acquisition and satellite communication link, analogous to the Argo float concept but without the profiling mode. These floats could be deployed by aircraft during open water season with a hydrophone hanging well below the keel depth of the deepest ice expected. The floats would be frozen in during the ice-season and continue to record and transmit depth data until their batteries drained. Engineering studies would be needed to determine if the trade-offs among, cost, battery life and potential data gain would make such an effort worthwhile.
Intriguingly, humankind has demonstrated its willingness to spend many billions of dollars mapping other planets at very high resolution (e.g., Mars and the Moon) yet we have not yet seen the same willingness to spend such sums mapping our own planet, despite the long list of the needs of bathymetry such as for prediction of future GMSL (Siegert et al., 2020).
Summary and Conclusion
Detailed information about the depth (bathymetry) and shape (morphology) of the Earth’s seabed is essential for establishing the geospatial context for a range of scientific, environmental and engineering endeavors. This is particularly true with respect to the role that bathymetry and seafloor morphology can play in determining the melt rates of glaciers and ice sheets and the subsequent impact of these melt rates on Global Mean Sea Level (GMSL) estimates. On a broad scale, the bathymetry and morphology of the seafloor can control and constrain the routes and paths of bottom currents, which is a key mechanism for both global and regional heat transport. Additionally, the bathymetry and morphology of the seafloor control its “roughness” at many scales, which, in turn, have a direct impact on ocean mixing and the distribution and dissipation of heat within the water column. Finally, on the more local level, but with direct and important impacts on glacial melt rates, and therefor GMSL, bathymetry directly influences where marine outlet glaciers are susceptible to the inflow of relatively warm subsurface waters, which can have direct influence on ice mass-loss from calving and undersea melting. With respect to the inflow of warm subsurface waters, the critical factor in determining whether or not rapid melting will take place is the presence or absence and bathymetric sills and their depths with respect to inflowing warm subsurface waters. The IPCC Special Report on the Ocean and Cryosphere in a Changing Climate has indicated that the mass loss from glaciers and the Greenland and Antarctic ice sheets, is among the primary drivers of global sea-level rise, together now contributing more to sea-level rise than the thermal expansion of the ocean.
Despite the importance of understanding the detailed bathymetry for the prediction of GMSL, only approximately 21% of the Arctic Ocean and 19% of the Southern Ocean is covered by available modern mapping data. Areas of particularly sparse data in the Arctic are off Northern Greenland and the Canadian Arctic Archipelago, the outer continental shelves and slopes of the western Chukchi, East Siberian, Laptev, Kara and Barents seas, and, of greatest concern to enhanced prediction of GMSL, areas around the northern coast of Greenland where marine outlet glaciers have poor, or no, depth data coverage in their hosting fjords. In addition, the cavities beneath floating extensions of glaciers remain, with a few exceptions, unmapped. While only comprising a small area of the total unmapped seafloor in the Polar regions, the under-ice bathymetry is critical for future predictions of GMSL.
The challenges we face in collecting complete mapping data in polar regions are manifest but a combination of decreasing ice extent and technological innovation may help us in in our efforts. The steady reduction of ice extent in the Arctic will mean more and more open water for longer periods of time and thus new technologies that are being applied to mapping the non-polar regions will be applicable over a larger percentage of the Arctic. More traditional vessels will have access to the Arctic and those equipped with modern multibeam sonars will add significantly to our data base. As fishing vessels move into the Arctic, crowd-sourced bathymetry can add an important component to this mapping effort. Autonomous platforms may provide a more cost-effective approach to mapping the seasonally open waters of the new Arctic; small (7 m) Saildrones have already operated in this environment1 and a new 12-m version being developed will be capable of carrying a multibeam sonar. At the ice margin, hybrid ROV/AUV vehicles offer the opportunity to survey far under the ice edge while maintaining control and high-rate data transmission from a host platform sitting in open water. As we move into more permanently ice-covered regions, inexpensive echo-sounding floats that can be frozen into the ice can offer sparse, low-resolution data in regions difficult to reach but broad-scale high-resolution mapping from surface-ships will have to be done with multibeam sonar equipped icebreakers. All icebreakers designed to work in the Polar regions should be equipped with multibeam sonars (the sonars would represent an almost negligible fraction of the cost of the icebreaker); the Canadian Government has recognized this and has installed four new multibeam sonars on its fleet of Arctic Coast Guard icebreakers2. Working beneath the ice offers the best opportunity for mapping large areas at high-resolution, and, in the absence of dedicated multibeam sonar-equipped nuclear submarines (feasible but unlikely), a fleet of long-range, high-speed autonomous underwater vehicles, equipped with mapping sonars offers the most promising approach for mapping. Issues of endurance, robustness and positioning will all need to be resolved but rapid advances in autonomous underwater vehicle technology offer hope that such an option may be feasible. While these new technologies will be difficult to develop and implement, more complete mapping of these critical regions will be essential if we are ever to have well-constrained estimates of the rate and impact of global mean sea-level rise.
Author Contributions
Both authors listed have made a substantial, direct, and intellectual contribution to the work, and approved it for publication.
Funding
This review has been done as a part of the Nippon-Foundation- GEBCO-Seabed 2030 project receiving funding from the Nippon Foundation of Japan.
Conflict of Interest
The authors declare that the research was conducted in the absence of any commercial or financial relationships that could be construed as a potential conflict of interest.
Publisher’s Note
All claims expressed in this article are solely those of the authors and do not necessarily represent those of their affiliated organizations, or those of the publisher, the editors and the reviewers. Any product that may be evaluated in this article, or claim that may be made by its manufacturer, is not guaranteed or endorsed by the publisher.
Acknowledgments
We would like to thank all agencies and institutions that have funded and facilitated the collection of bathymetric data in the Polar regions. We thank two reviewers for providing constructive feedback that improved the manuscript.
Footnotes
- ^ https://arctic.noaa.gov/Arctic-News/ArtMID/5556/ArticleID/388/Arctic-Saildrone
- ^ https://www.ctvnews.ca/canada/arctic-sea-floor-to-be-mapped-by-sonar-for-safer-shipping-1.2496958
References
An, L., Rignot, E., Elieff, S., Morlighem, M., Millan, R., Mouginot, J., et al. (2017). Bed elevation of Jakobshavn Isbræ, West Greenland, from high-resolution airborne gravity and other data. Geophys. Res. Lett. 44, 3728–3736. doi: 10.1002/2017GL073245
An, L., Rignot, E., Mouginot, J., and Millan, R. (2018). A Century of stability of Avannarleq and Kujalleq glaciers, West Greenland, explained using high-resolution airborne gravity and other data. Geophys. Res. Lett. 45, 3156–3163. doi: 10.1002/2018GL077204
An, L., Rignot, E., Wood, M., Willis, J. K., Mouginot, J., and Khan, S. A. (2021). Ocean melting of the Zachariae Isstrøm and Nioghalvfjerdsfjorden glaciers, northeast Greenland. Proc. Natl. Acad. Sci. U.S.A. 118, e2015483118. doi: 10.1073/pnas.2015483118
Arndt, J. E., Schenke, H. W., Jakobsson, M., Nitsche, F. O., Buys, G., Goleby, B., et al. (2013). The International bathymetric chart of the Southern Ocean (IBCSO) version 1.0 – a new bathymetric compilation covering circum-Antarctic waters. Geophys. Res. Lett. 40, 3111–3117. doi: 10.1002/grl.50413
Bamber, J. L., Oppenheimer, M., Kopp, R. E., Aspinall, W. P., and Cooke, R. M. (2019). Ice sheet contributions to future sea-level rise from structured expert judgment. Proc. Natl. Acad. Sci. U.S.A. 116, 11195–11200. doi: 10.1073/pnas.1817205116
Barker, L., Jakuba, M., Bowen, A., German, C., Maksym, T., Mayer, L., et al. (2020). Scientific challenges and present capabilities in underwater robotic vehicle design and navigation for oceanographic exploration under-ice. Remote Sens. 12:2588. doi: 10.3390/rs12162588
Bowen, A. D., Yoerger, D. R., German, C. C., Kinsey, J. C., Jakuba, M. V., Gomez-Ibanez, D., et al. (2014). Design of Nereid-UI: a remotely operated underwater vehicle for oceanographic access under ice, 2014 Oceans – St. John’s. IEEE 1–6. doi: 10.1109/OCEANS.2014.7003125
Butler, B., and Verrall, R. (2001). Precision hybrid intertial/acoustic navigation system for a long-range autonomous underwater vehicle. J. Inst. Navig. 48, 1–12. doi: 10.1002/j.2161-4296.2001.tb00223.x
Calder, B. R., Dijkstra, S. J., Hoy, S., Himschoot, K., and Schofield, A. (2020). A design for a trusted community bathymetry system. Mar. Geodesy 43, 327–358. doi: 10.1080/01490419.2020.1718255
Chayes, D. N., Kurras, G., Edwards, M., Anderson, R. M., and Coakley, B. J. (1998). Swath mapping the Arctic Ocean from US navy submarines; Installation and performance analysis of SCAMP operation during SCICEX 1998. EOS Trans. Am. Geophys. Union 79:F854.
Cowton, T. R., Sole, A. J., Nienow, P. W., Slater, D. A., and Christoffersen, P. (2018). Linear response of east Greenland’s tidewater glaciers to ocean/atmosphere warming. Proc. Natl. Acad. Sci. U.S.A. 115, 7907–7912.
Dangendorf, S., Hay, C., Calafat, F. M., Marcos, M., Piecuch, C. G., Berk, K., et al. (2019). Persistent acceleration in global sea-level rise since the 1960s. Nat. Clim. Change 9, 705–710. doi: 10.1073/pnas.1801769115
Dorschel, B., Hehemann, L., Viquerat, S., Warnke, F., Dreutter, S., Tenberge, Y. S., et al. (2021). The international bathymetric chart of the Southern Ocean version 2 (IBCSO v2). Sci. Data (in review)
Dowdeswell, J. A., Batchelor, C. L., Montelli, A., Ottesen, D., Christie, F. D. W., Dowdeswell, E. K., et al. (2020). Delicate seafloor landforms reveal past Antarctic grounding-line retreat of kilometers per year. Science 368, 1020–1024.
Edwards, M. H., and Coakley, B. J. (2003). SCICEX investigations of the Arctic ocean system. Chem. Erde 63, 281–328. doi: 10.1126/science.aaz3059
Eisenman, I., and Wettlaufer, J. S. (2009). Nonlinear threshold behavior during the loss of Arctic sea ice. Proc. Natl. Acad. Sci. U.S.A. 106, 28–32. doi: 10.1078/0009-2819-00039
Fasullo, J. T., and Gent, P. R. (2017). On the Relationship between regional ocean heat content and sea surface height. J J. Clim. 30, 9195–9211. doi: 10.1073/pnas.0806887106
Fenty, I., Willis, J. K., Khazendar, A., Dinardo, S., Forsberg, R., Fukumori, I., et al. (2016). Oceans melting greenland: early results from NASA’s ocean-ice mission in Greenland. Oceanography 29, 71–83. doi: 10.1175/JCLI-D-16-0920.1
Ferguson, J. (2009). “Under-ice seabed mapping with AUVs,” in Proceedings of the IEEE/MTS Oceans Conference and Exhibition, Bremen. doi: 10.5670/oceanog.2016.100
Fox-Kemper, B., Hewitt, H. T., Xiao, C., Aðalgeirsdóttir, G., Drijfhout, S. S., Edwards, T. L., et al. (2021). “Ocean, cryosphere and sea level change,” in Climate Change 2021: The Physical Science Basis. Contribution of Working Group I to the Sixth Assessment Report of the Intergovernmental Panel on Climate Change, eds V. Masson-Delmotte, P. Zhai, A. Pirani, S. L. Connors, C. Péan, S. Berger, et al. (Cambridge: Cambridge University Press). doi: 10.1109/OCEANSE.2009.5278204
Frederikse, T., Landerer, F., Caron, L., Adhikari, S., Parkes, D., Humphrey, V. W., et al. (2020). The causes of sea-level rise since 1900. Nature 584, 393–397.
GEBCO Compilation Group (2021). “GEBCO 2021 Grid”, The Nippon Foundation-Gebco-Seabed 2030 Project. Available online at: https://www.gebco.net/data_and_products/gridded_bathymetry_data/gebco_2021/
Golledge, N. R., Keller, E. D., Gomez, N., Naughten, K. A., Bernales, J., Trusel, L. D., et al. (2019). Global environmental consequences of twenty-first-century ice-sheet melt. Nature 566, 65–72.
Goosse, H., Kay, J. E., Armour, K. C., Bodas-Salcedo, A., Chepfer, H., Docquier, D., et al. (2018). Quantifying climate feedbacks in polar regions. Nat. Commun. 9:1919. doi: 10.1038/s41586-019-0889-9
Graham, A. G. C., Dutrieux, P., Vaughan, D. G., Nitsche, F. O., Gyllencreutz, R., Greenwood, S. L., et al. (2013). Seabed corrugations beneath an Antarctic ice shelf revealed by autonomous underwater vehicle survey: origin and implications for the history of Pine Island Glacier. J. Geophys. Res. Earth Surf. 118, 1356–1366. doi: 10.1038/s41467-018-04173-0
Guarino, M.-V., Sime, L. C., Schröeder, D., Malmierca-Vallet, I., Rosenblum, E., Ringer, M., et al. (2020). Sea-ice-free Arctic during the last interglacial supports fast future loss. Nat. Clim. Change 10, 928–932. doi: 10.1002/jgrf.20087
Hill, E. A., Carr, J. R., Stokes, C. R., and Gudmundsson, G. H. (2018). Dynamic changes in outlet glaciers in northern Greenland from 1948 to 2015. Cryosphere 12, 3243–3263. doi: 10.1038/s41558-020-0865-2
Holland, D. M. (2013). “Chapter 16 - the marine cryosphere,” in International Geophysics, eds G. Siedler, S. M. Griffies, J. Gould, and J. A. Church (London: Academic Press), 413–442. doi: 10.5194/tc-12-3243-2018
Holland, D. M., Thomas, R. H., Young, B. D., Ribergaard, M. H., and Lyberth, B. (2008). Acceleration of Jakobshavn Isbræ triggered by warm subsurface ocean waters. Nat. Geosci. 1, 659–664. doi: 10.1016/B978-0-12-391851-2.00016-7
Jacobs, S. S., Hellmer, H. H., and Jenkins, A. (1996). Antarctic Ice sheet melting in the southeast Pacific. Geophys. Res. Lett. 23, 957–960. doi: 10.1038/ngeo316
Jakobsson, M., Anderson, J. B., Nitsche, F. O., Dowdeswell, J. A., Gyllencreutz, R., Kirchner, N., et al. (2011). Geological record of ice shelf breakup and grounding line retreat, Pine Island Bay, West Antarctica. Geology 39, 691–694. doi: 10.1029/96GL00723
Jakobsson, M., Cherkis, N., Woodward, J., Macnab, R., and Coakley, B. (2000). New grid of Arctic bathymetry aids scientists and mapmakers. EOS Trans. Am. Geophys. Union 81:89. doi: 10.1130/G32153.1
Jakobsson, M., Hogan, K. A., Mayer, L. A., Mix, A., Jennings, A., Stoner, J., et al. (2018). The Holocene retreat dynamics and stability of Petermann Glacier in northwest Greenland. Nat. Commun. 9:2104. doi: 10.1029/00EO00059
Jakobsson, M., Macnab, R., Mayer, L. A., Anderson, R., Edwards, M., Hatzky, J., et al. (2008). An improved bathymetric portrayal of the Arctic Ocean: implications for ocean modeling and geological, geophysical and oceanographic analyses. Geophys. Res. Lett. 35:L07602. doi: 10.1038/s41467-018-04573-2
Jakobsson, M., Mayer, L. A., Bringensparr, C., Castro, C. F., Mohammad, R., Johnson, P., et al. (2020a). The international bathymetric chart of the arctic ocean version 4.0. Sci. Data 7:176. doi: 10.1029/2008GL033520
Jakobsson, M., Mayer, L. A., Coakley, B., Dowdeswell, J. A., Forbes, S., Fridman, B., et al. (2012). The international bathymetric chart of the Arctic ocean (IBCAO) version 3.0. Geophys. Res. Lett. 39:L12609.
Jakobsson, M., Mayer, L. A., Nilsson, J., Stranne, C., Calder, B., O’regan, M., et al. (2020b). Ryder Glacier in northwest Greenland is shielded from warm Atlantic water by a bathymetric sill. Commun. Earth Environ. 1:45. doi: 10.1029/2012GL052219
Jenkins, A., Dutrieux, P., Jacobs, S. S., Mcphail, S. D., Perrett, J. R., Webb, A. T., et al. (2010). Observations beneath Pine Island Glacier in West Antarctica and implications for its retreat. Nat. Geosci. 3, 468–472. doi: 10.1038/s43247-020-00043-0
Johannessen, O. M., Babiker, M., and Miles, M. W. (2013). Unprecedented retreat in a 50-Year observational record for Petermann Glacier, North Greenland. Atmos. Ocean. Sci. Lett. 6, 259–265. doi: 10.1038/ngeo890
Joughin, I., Abdalati, W., and Fahnestock, M. (2004). Large fluctuations in speed on Greenland’s Jakobshavn Isbrae glacier. Nature 432, 608–610. doi: 10.1080/16742834.2013.11447091
Khazendar, A., Fenty, I. G., Carroll, D., Gardner, A., Lee, C. M., Fukumori, I., et al. (2019). Interruption of two decades of Jakobshavn Isbrae acceleration and thinning as regional ocean cools. Nat. Geosci. 12, 277–283. doi: 10.1038/nature03130
Kimura, S., Jenkins, A., Dutrieux, P., Forryan, A., Naveira Garabato, A. C., and Firing, Y. (2016). Ocean mixing beneath Pine Island Glacier ice shelf, West Antarctica. J. Geophys. Res. Oceans 121, 8496–8510. doi: 10.1038/s41561-019-0329-3
Lin, P., Pickart, R. S., Torres, D. J., and Pacini, A. (2018). Evolution of the freshwater coastal current at the Southern tip of Greenland. J. Phys. Oceanogr. 48, 2127–2140. doi: 10.1002/2016JC012149
Macnab, R., and Grikurov, G. (1997). Report: Arctic Bathymetry Workshop. St. Petersburg: Institute for Geology and Mineral Resources of the Ocean (VNIIOkeangeologia). doi: 10.1175/JPO-D-18-0035.1
Mayer, L. A., Jakobsson, M., Allen, G., Dorschel, B., Falconer, R., Ferrini, V., et al. (2018). The Nippon foundation—GEBCO seabed 2030 project: the quest to see the World’s oceans completely mapped by 2030. Geosciences 8:63. doi: 10.4095/209403
McPhail, S., Templeton, R., Pebody, M., Roper, D., and Morrison, R. (2019). “Autosub long range AUV missions under the filchner and ronne ice shelves in the weddell sea, antarctica - an engineering perspective,” in Proceedings of the OCEANS 2019, Marseille, 1–8. doi: 10.3390/geosciences8020063
Millan, R., Rignot, E., Mouginot, J., Wood, M., Bjørk, A. A., and Morlighem, M. (2018). Vulnerability of Southeast Greenland glaciers to warm Atlantic water from operation icebridge and ocean melting greenland data. Geophys. Res. Lett. 45, 2688–2696. doi: 10.1109/OCEANSE.2019.8867206
Ministry of Natural Resources and Environment of the Russian Federation, Federal Agency on Mineral Resources Ministry of Natural Resources and Environment of the Russian Federation, Ministry of Foreign Affairs of the Russian Federation, Ministry of Defence of the Russian Federation, Department of Navigation and Oceanography Russian Academy of Sciences, and Ministry of Defence of the Russian Federation. (2015). Partial Revised Submission of the Russian Federation to the Commission on the Limits of the Continental Shelf in Respect of the Continental Shelf of the Russian Federation in the Artic Ocean: Executive Summary. Moscow: Ministry of Natural Resources and Environment of the Russian Federation. doi: 10.1002/2017GL076561
Morlighem, M., Rignot, E., Binder, T., Blankenship, D., Drews, R., Eagles, G., et al. (2020). Deep glacial troughs and stabilizing ridges unveiled beneath the margins of the Antarctic ice sheet. Nat. Geosci. 13, 132–137.
Morlighem, M., Rignot, E., Seroussi, H., Larour, E., Ben Dhia, H., and Aubry, D. (2011). A mass conservation approach for mapping glacier ice thickness. Geophys. Res. Lett. 38. doi: 10.1038/s41561-019-0510-8
Morlighem, M., Williams, C. N., Rignot, E., An, L., Arndt, J. E., Bamber, J. L., et al. (2017). BedMachine v3: complete bed topography and ocean bathymetry mapping of Greenland from multibeam echo sounding combined with mass conservation. Geophys. Res. Lett. 44, 11,051–11,061. doi: 10.1029/2011GL048659
Mouginot, J., Rignot, E., Scheuchl, B., Fenty, I., Khazendar, A., Morlighem, M., et al. (2015). Fast retreat of Zachariæ Isstrøm, northeast Greenland. Science 350, 1357–1361. doi: 10.1002/2017GL074954
Münchow, A., Padman, L., and Fricker, H. A. (2014). Interannual changes of the floating ice shelf of Petermann Gletscher, North Greenland, from 2000 to 2012. J. Glaciol. 60, 489–499. doi: 10.1126/science.aac7111
Münchow, A., Padman, L., Washam, P., and Nicholls, K. W. (2016). The ice shelf of Petermann Gletscher, North Greenland, and its connection to the Arctic and Atlantic oceans. Oceanography 29, 84–95. doi: 10.3189/2014JoG13J135
Naryshkin, G. (2001). Bottom Relief of the Arctic Ocean. 1:2,500,000. Moscow: Russian Academy of Sciences. doi: 10.5670/oceanog.2016.101
Oppenheimer, M., Glavovic, B. C., Hinkel, J., Wal, R. V. D., Magnan, A. K., Abd-Elgawad, A., et al. (2019). “Sea level rise and implications for low-lying islands, coasts and communities,” in IPCC Special Report on the Ocean and Cryosphere in a Changing Climate, eds H.-O. PöRtner, D. C. Roberts, V. Masson-Delmotte, P. Zhai, M. Tignor, E. Poloczanska, et al. (Geneva: IPCC).
Overland, J. E., and Wang, M. (2013). When will the summer Arctic be nearly sea ice free? Geophys. Res. Lett. 40, 2097–2101.
Pavic, I., Miåakovic, J., Kasum, J., and Alujevic, D. (2020). Analysis of crowdsourced bathymetry concept and it’s potential implications on safety of navigation. Int. J. Mar. Navig. Saf. Sea Transport. 14, 681–686. doi: 10.1002/grl.50316
Pörtner, H.-O., Roberts, D. C., Masson-Delmotte, V., Zhai, P., Tignor, M., Poloczanska, E., et al. (2020). IPCC Special Report on the Ocean and Cryosphere in a Changing Climate. Geneva: IPCC. doi: 10.12716/1001.14.03.21
Rignot, E., Fenty, I., Xu, Y., Cai, C., Velicogna, I., Cofaigh, C. Ó, et al. (2016). Bathymetry data reveal glaciers vulnerable to ice-ocean interaction in Uummannaq and Vaigat glacial fjords, west Greenland. Geophys. Res. Lett. 43, 2667–2674.
Rignot, E., and Mouginot, J. (2012). Ice flow in Greenland for the international polar year 2008–2009. Geophys. Res. Lett. 39:L11501. doi: 10.1002/2016GL067832
Rückamp, M., Neckel, N., Berger, S., Humbert, A., and Helm, V. (2019). Calving induced speedup of Petermann Glacier. J. Geophys. Res. Earth Surf. 124, 216–228. doi: 10.1029/2012GL051634
Rudels, B., Anderson, L., Eriksson, P., Fahrbach, E., Jakobsson, M., Peter Jones, E., et al. (2012). “Observations in the Ocean,” in Arctic Climate Change: The ACSYS Decade and Beyond, ed. P. Lemke (Dordrecht: Springer), 117–198. doi: 10.1029/2018JF004775
Sayedi, S. S., Abbott, B. W., Thornton, B. F., Frederick, J. M., Vonk, J. E., Overduin, P., et al. (2020). Subsea permafrost carbon stocks and climate change sensitivity estimated by expert assessment. Environ. Res. Lett. 15:124075. doi: 10.1007/978-94-007-2027-5_4
Schaffer, J., Kanzow, T., Von Appen, W.-J., Von Albedyll, L., Arndt, J. E., and Roberts, D. H. (2020). Bathymetry constrains ocean heat supply to Greenland’s largest glacier tongue. Nat. Geosci. 13, 227–231. doi: 10.1088/1748-9326/abcc29
Schaffer, J., Von Appen, W.-J., Dodd, P. A., Hofstede, C., Mayer, C., De Steur, L., et al. (2017). Warm water pathways toward Nioghalvfjerdsfjorden Glacier, Northeast Greenland. J. Geophys. Res. Oceans 122, 4004–4020. doi: 10.1038/s41561-019-0529-x
Schodlok, M. P., Menemenlis, D., Rignot, E., and Studinger, M. (2012). Sensitivity of the ice-shelf/ocean system to the sub-ice-shelf cavity shape measured by NASA IceBridge in Pine Island Glacier, West Antarctica. Ann. Glaciol. 53, 156–162. doi: 10.1002/2016JC012462
Serreze, M. C., and Meier, W. N. (2019). The Arctic’s sea ice cover: trends, variability, predictability, and comparisons to the Antarctic. Ann. N. Y. Acad. Sci. 1436, 36–53. doi: 10.3189/2012AoG60A073
Siegert, M., Alley, R. B., Rignot, E., Englander, J., and Corell, R. (2020). Twenty-first century sea-level rise could exceed IPCC projections for strong-warming futures. One Earth 3, 691–703. doi: 10.1111/nyas.13856
Wadhams, P., Wilkinson, J., and Mcphail, S. D. (2006). A new view of the underside of Arctic sea ice. Geophys. Res. Lett. 33:L04501. doi: 10.1016/j.oneear.2020.11.002
Wise, M. G., Dowdeswell, J. A., Jakobsson, M., and Larter, R. D. (2017). Evidence of marine ice-cliff instability in Pine Island Bay from iceberg-keel plough marks. Nature 550, 506–510. doi: 10.1029/2005GL025131
Wood, M., Rignot, E., Fenty, I., An, L., Bjørk, A., Broeke, M. V. D., et al. (2021). Ocean forcing drives glacier retreat in Greenland. Sci. Adv. 7:eaba7282. doi: 10.1038/nature24458
Keywords: bathymetry, ocean mapping, Arctic Ocean, Southern Ocean, cryosphere, sea-level rise
Citation: Jakobsson M and Mayer LA (2022) Polar Region Bathymetry: Critical Knowledge for the Prediction of Global Sea Level Rise. Front. Mar. Sci. 8:788724. doi: 10.3389/fmars.2021.788724
Received: 03 October 2021; Accepted: 27 December 2021;
Published: 17 January 2022.
Edited by:
Jay S. Pearlman, Institute of Electrical and Electronics Engineers, FranceReviewed by:
Eric Rignot, University of California, Irvine, United StatesKim Picard, Geoscience Australia, Australia
Copyright © 2022 Jakobsson and Mayer. This is an open-access article distributed under the terms of the Creative Commons Attribution License (CC BY). The use, distribution or reproduction in other forums is permitted, provided the original author(s) and the copyright owner(s) are credited and that the original publication in this journal is cited, in accordance with accepted academic practice. No use, distribution or reproduction is permitted which does not comply with these terms.
*Correspondence: Martin Jakobsson, martin.jakobsson@geo.su.se