Megameter propagation and correlation of T-waves from Kermadec Trench and Islands
 Tiago C. A. Oliveira
 Peter Nielsen2
  Ying-Tsong Lin
 Noriyuki Kushida
 Sérgio M. Jesus
- 1Physics Department and Centre of Environmental and Marine Studies, University of Aveiro, Aveiro, Portugal
- 2Independent Researcher, Esbjerg N, Denmark
- 3Applied Ocean Physics and Engineering Department, Woods Hole Oceanographic Institution, Woods Hole, MA, United States
- 4International Data Centre, Comprehensive Nuclear-Test-Ban Treaty Organization, Vienna, Austria
- 5Laboratory of Robotics and Engineering Systems, University of Algarve, Faro, Portugal
On 18 June 2020 and 4 March 2021, very energetic low-frequency underwater T-wave signals (2 to 25 Hz) were recorded at the Comprehensive Nuclear-Test-Ban Treaty (CTBT) International Monitoring System (IMS) hydrophone stations in the Pacific Ocean (Stations HA11 and HA03) and the South Atlantic Ocean (Station HA10). This work investigates the long-range (megameters) propagation of these T-waves. Their sources were three powerful submarine earthquakes in the Kermadec Trench and Islands, located at approximately 6000, 8800, and 15100 km from Stations HA11, HA03, and HA10, respectively. Arrival time and back azimuth of the recorded T-waves were estimated using the Progressive Multi-Channel Correlation algorithm installed on the CTBT Organization (CTBTO) virtual Data Exploitation Centre (vDEC). Different arrivals within the duration of the earthquake signals were identified, and their correlations were also analyzed. The data analysis at HA03 and HA10 revealed intriguing T-wave propagation paths reflecting, refracting, or even transmitting through continents, as well as T-wave excitation along a chain of seamounts. The analysis also showed much higher transmission loss (TL) in the propagation paths to HA11 than to HA03 and HA10. Moreover, strong discrepancies between expected and measured back azimuths were observed for HA11, and a three-dimensional (3D) parabolic equation model was utilized to identify the cause of these differences. Numerical results revealed the importance of 3D effects induced by the Kermadec Ridge, Fiji archipelago, and Marshall Islands on T-wave propagation to HA11. This analysis can guide future improvements in underwater event localization using the CTBT-IMS hydroacoustic sensor network.
1 Introduction
Underwater sound from submarine seismic activities frequently affects oceans’ soundscapes (Hildebrand, 2009; Duarte et al., 2021; Schwardt et al., 2022). Submarine earthquakes can generate low-frequency (<40Hz) acoustic waves known as T-waves (or T-phases) that can propagate very long distances (in the order of thousands of km) in the ocean with very low attenuation (Ewing et al., 1952; Fox et al., 1993; Munk et al., 1994; Okal, 2008). T-waves travel at the speed of sound in the water (approximately 1.5 km/s) and have a propagation speed lower than P and S seismic waves propagating in the crust.
The interest in studying T-waves started in the 1940s (Linehan, 1940) when they were discovered in seismograms. Nowadays, its study spans areas such as earthquake monitoring, tsunami early detection, and ocean thermometry (see Bottero et al., 2020 for a resume on T-waves areas of interest). T-waves can preserve high-frequency near-field information lost by seismic waves propagating in the crust (Bohnenstiehl et al., 2002) due to the low attenuation of acoustic waves propagating in the ocean. This ocean property provides the possibility to use T-waves to estimate submarine earthquake rupture model parameters (e.g., Okal et al., 2003; de Groot-Hedlin, 2005; Tolstoy and Bohnenstiehl, 2005; Yun et al., 2022). Furthermore, T-waves triggered by submarine earthquakes travel faster than tsunamis (tsunami propagation speed is approximately 0.2 km/s). Based on this principle, appropriate measurements and analysis of T-waves have been studied to enhance early-tsunami detection systems (e.g., Ewing et al., 1950; Oliveira and Kadri, 2016).
The use of long-range low-frequency ocean acoustic travel-time to infer spatially averaged temperature anomalies was proposed by Munk and Wunsch (1979). Subsequently, Munk et al. (1994) published the results from the 1991 Heard Island Feasibility Test (HIFT), which was carried out to establish the limits of usable long-range acoustic transmission. In the HIFT, an anthropogenic low-frequency acoustic source was used. More recently, Wu et al. (2020) proposed to infer basin-scale deep-ocean temperature changes from the travel times of T-waves generated by repeating earthquakes. One advantage of this methodology is that natural seismic activity is common in the underwater soundscape providing large-area coverage at low cost and no man-made sound generation impacting the ocean environment.
To better use T-waves for the aforementioned applications, one should consider their complex arrival characteristics caused by bathymetric features along their long-range propagation paths through horizontal reflection, refraction, and diffraction (Doolittle et al., 1988; Heaney et al., 2017; Oliveira and Lin, 2019; Stephen et al., 2019; Oliveira et al., 2021). These changes can potentially affect T-wave interpretation in some parts of the ocean due to differences in observed and expected arrival times, back azimuths, or energy intensity. Therefore, three-dimensional (3D) ocean-acoustic signal propagation models are necessary for investigating the complex propagation physics of T-waves and assisting in the interpretation of observations (Heaney et al., 2017; Oliveira et al., 2021). Besides that, the conversion of seismic energy from submarine earthquakes to hydroacoustic T-waves may not always occur at the earthquake epicenter immediately (e.g., Talandier and Okal, 1979; Talandier and Okal, 1998; Graeber and Piserchia, 2004; Williams et al., 2006; Lecoulant et al., 2021). In these cases, coupling from earthquake to ocean-acoustic waves can happen in different places (T-wave conversion zone) and hundreds of kilometers away from the hypocenter. T-wave conversion zones are generally linked to areas with large bathymetric gradients such as at slopes in trenches, islands, seamounts, edges of continental shelves, or depressions on the ocean floor (Talandier and Okal, 1979; Okal, 2008; Bottero et al., 2020). The T-wave conversion zone can then be total or partly unknown, adding uncertainty in estimating arrival time and azimuth. On the other hand, in some ocean regions, earthquake epicenters can be approximated as the only location of T-waves sources (e.g., de Groot‐Hedlin, 2020; Godin, 2021).
It is also worth mentioning that T-waves traveling in the ocean (hydroacoustic T-waves) can reach continental slopes and be converted back into seismic waves (seismic T-waves) propagating on land hundreds of kilometers (e.g., Kosuga, 2011; de Groot‐Hedlin, 2020). However, the conversion of hydroacoustic to seismic T waves depends mainly on the slope and seabed properties at the shore (Bottero et al., 2020; de Groot‐Hedlin, 2020; Stevens et al., 2021).
The T-wave data studied in this paper were collected from the Comprehensive Nuclear-Test-Ban Treaty (CTBT) International Monitoring System (IMS) hydrophone stations (Lawrence and Grenard, 1998) in the Pacific and South Atlantic Oceans. The CTBT-IMS global sensor network is composed of three waveform technologies: Seismic, hydroacoustic, and infrasound, designed to monitor the world continuously for any nuclear explosions on the ground, in the ocean, and in the atmosphere. The hydroacoustic component of the global sensor network has been recording underwater signals propagating in the global ocean by using eleven stations consisting of five T-wave seismometer stations deployed on land close to shore at remote islands and six stations of hydrophones suspended in the water column of the oceans (Nielsen et al., 2021a). In addition to monitoring the oceans for signs of nuclear explosions, CTBTO hydroacoustic data have been used for a broad range of civil and scientific applications. This includes studies on marine mammals density and distribution estimation (e.g., Gavrilov and McCauley, 2013; Harris et al., 2018; Miksis-Olds et al., 2018; Leroy et al., 2021; Pinto and Chandrayadula, 2021), shipping noise (Harris et al., 2019), decadal noise trends in the oceans (Robinson et al., 2021), submarine earthquakes (e.g., Lecoulant et al., 2021), submarine volcanic activity (e.g., Metz et al., 2018; Matoza et al., 2022), ocean thermometry (Wu et al., 2020), missing submarine searching (e.g., Dall’Osto, 2019; Heyburn et al., 2020; Nielsen et al., 2021a), glaciers and icebergs (e.g., Chapp et al., 2005; Evers et al., 2013), the effect of Antarctic circumpolar current on underwater sound propagation (de Groot-Hedlin et al., 2009), tsunamis (Okal et al., 2007; Matsumoto et al., 2016a; Matsumoto et al., 2016b), and others. Only recording of signals related to the Kermadec series of earthquakes on the CTBT-IMS hydrophone stations are considered in this paper because of the high performance of these stations (low system and ambient noise levels) and the efficient propagation of acoustic waves over long distances.
Each CTBT-IMS hydrophone station is composed of six hydrophones arranged into a pair of equilateral triangular arrays forming a triplet, except for HA01 (Cape Leeuwin), where there is only one triplet. Each triplet has a horizontal hydrophone spacing of approximately 2 km. The hydrophone depths below the sea surface for each triplet are almost constant and close to the depth of the local SOFAR (Sound Fixing and Ranging) channel. In general, the depths of the hydrophones provide optimum conditions for recording ocean acoustic signals propagating long distances and trapped in the SOFAR channel caused by low signal attenuation, as mentioned previously. At Stations HA11, HA03, and HA10, where the T-wave data analyzed in this paper were collected, the two arrays are situated on opposite sides of the Islands (North and South) to account for the acoustic shadow produced by the islands.
The paper is organized into five sections. The main focus is on examining the long-range T-wave propagation from the Kermadec Trench and Islands, using three events associated with powerful submarine earthquakes (Mw 7.4 and greater) as an example. After this introduction, the three submarine earthquakes are introduced in Sec. 2. Next, the CTBT-IMS hydrophone data is analyzed using the Progressive Multi-Channel Correlation algorithm installed on the CTBT Organization (CTBTO) virtual Data Exploitation Centre (vDEC) in Sec. 3. Then, numerical simulations of 3D T-wave propagation to investigate key 3D propagation physics are presented in Sec. 4. Finally, concluding remarks are given in Sec. 5.
2 Earthquake events
2.1 The 18 June 2020 Mw7.4 South of the Kermadec Islands earthquake
According to the United States Geological Survey (USGS) earthquake database, a moment magnitude Mw7.4 submarine earthquake (USGS, 2021a) occurred on 18 June 2020 (see Figure 1 and Table 1), at 12:49:53.70 (hereafter all times in UTC +00:00) in the Kermadec Trench (in the South Pacific Ocean) with hypocenter at 33.293°S 177.857°W (uncertainty ± 10km) and depth 10.0 km (uncertainty ± 1.7km). This earthquake was the fourth strongest Mw earthquake in 2020. The Kermadec Trench is about 1000 km long and is one of the deepest oceanic trenches, with maximum water depths of approximately 10 km. The hypocenter was located approximately 445 km south of the Kermadec Islands. The International Seismological Centre (ISC) online bulletin (Bondár and Storchak, 2011) identified the earthquake as Event 618550810.
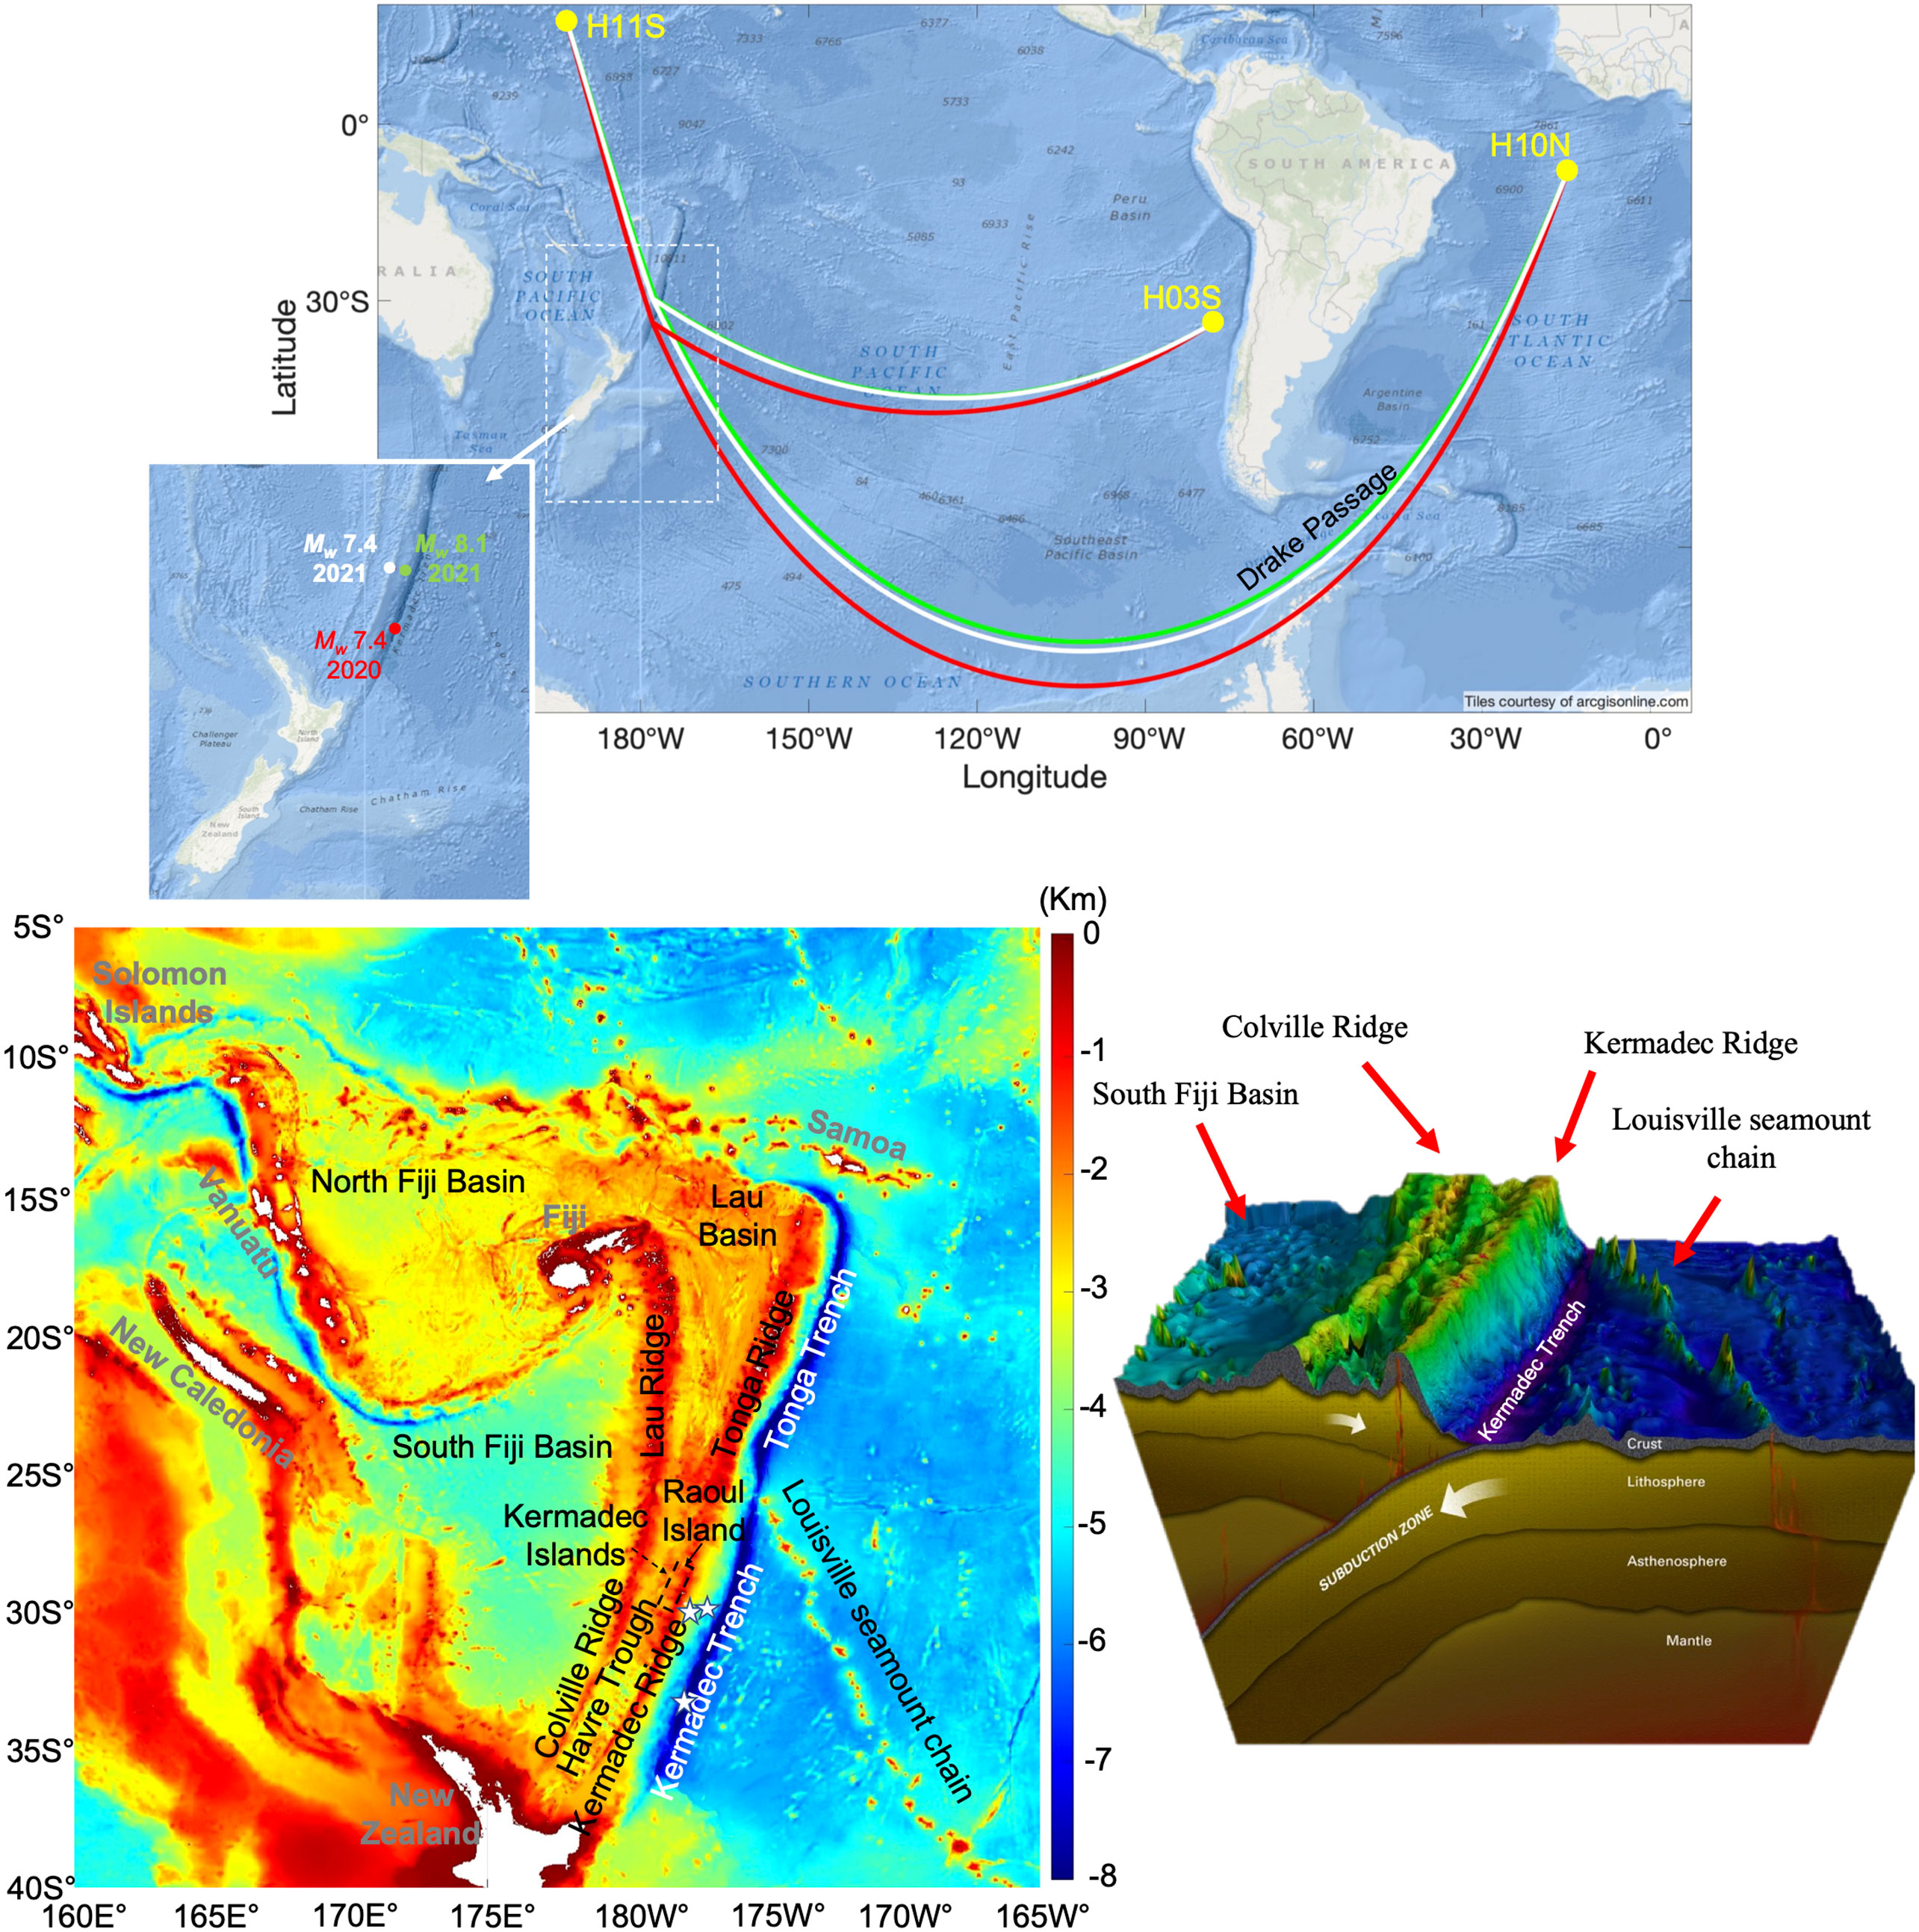
Figure 1 Top - Location map of the 18 June 2020 Mw7.4 (red) Kermadec Trench, and 4 March 2021 Mw7.4 (white) and Mw8.1 (green) Kermadec Islands submarine earthquake epicenters. Lines indicate the geodesic paths from the epicenters to the CTBT-IMS hydrophone triplets, H03S (Juan Fernandez Islands), H11S (Wake Island) and H10N (Ascension Island). Bottom left – Bathymetry (Tozer et al., 2019) and main bathymetric features near the earthquake epicenters (white stars). Bottom right – Illustration of Kermadec region (credit © Woods Hole Oceanographic Institution, https://www.whoi.edu/know-your-ocean/ocean-topics/how-the-ocean-works/seafloor-below/ocean-trenches/) with main bathymetric features identified.
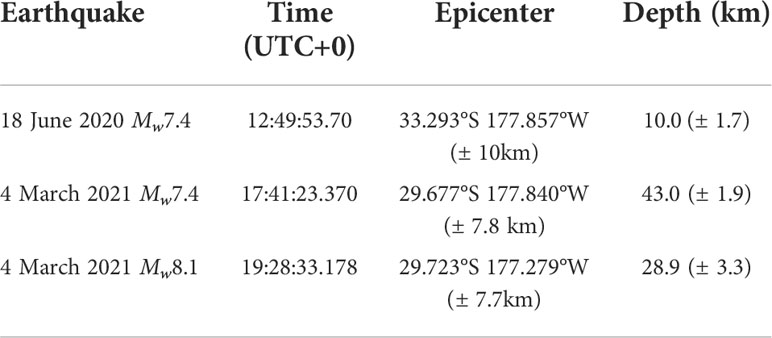
Table 1 Main characteristics of the 2020 Mw7.4 Kermadec Trench and the 2021 Mw7.4 and Mw 8.1 Kermadec Islands earthquakes according to the USGS earthquake database.
2.2 The 4 March 2021 Mw7.4 Kermadec Islands earthquake
On 4 March 2021, at 17:41:23.370, an Mw7.4 (USGS, 2021b) submarine earthquake occurred approximately 42 km south of Raoul Island (the largest and northernmost of the main Kermadec Islands, New Zealand) with a hypocenter at 29.677°S 177.840°W (uncertainty ± 7.8 km) and depth 43.0 km (uncertainty ± 1.9km). By moment magnitude, this earthquake was the seventh strongest in 2021. Its hypocenter was located approximately 400 km North of the 18 June 2020 Mw7.4 earthquake (see section 2.1), and a moderate tsunami was generated by this earthquake (Romano et al., 2021). The 4 March 2021 Mw7.4 earthquake was a foreshock of the 4 March 2021 Mw8.1, which will be introduced next.
2.3 The 4 March 2021 Mw8.1 Kermadec Islands earthquake
An Mw8.1 (USGS, 2021c) submarine earthquake occurred on 4 March, 2021, at 19:28:33.178 with a hypocenter at 29.723°S 177.279°W (uncertainty ± 7.7km) and depth 28.9 km (uncertainty ± 3.3km). The hypocenter of the Mw8.1 was located approximately 55 km to the east of the same day Mw7.4 earthquake (see section 2.2), which occurred approximately 1 hour and 47 minutes earlier. By moment magnitude, this earthquake was the second strongest in 2021, and identified by ISC as event 620360228. The earthquake generated a moderate tsunami with a maximum height of ~30 cm (Romano et al., 2021).
3 T-wave data analysis
T-wave signals from the 2020 Mw7.4 Kermadec Trench and the 2021 Mw7.4 and Mw8.1 Kermadec Islands earthquakes were recorded at the CTBT-IMS hydroacoustic hydrophone stations in the Pacific Ocean (Station HA11 in Wake Island and Station HA03 in Juan Fernández Islands) and the South Atlantic Ocean (Station HA10 in Ascension Island). One triplet of the HA10 hydrophones is located approximately 12 km north (H10N) and the other at 110 km south (H10S) of Ascension Island (South Atlantic Ocean). Data from one hydrophone of the south triplet was not available at the time of the three earthquakes, and the data from the other two hydrophones on this array are not considered further in this paper. Therefore, only H10N data is analyzed from the hydroacoustic station HA10. The HA03 hydrophones are located approximately 15 km north (H03N) and 15 km south (H03S) of Robinson Crusoe Island in the Juan Fernández Islands (South-East Pacific Ocean). Metz et al. (2018) found a systematic bias of H03S back azimuth of -1.3°C, and Nielsen et al. (2021b) found a bias of -1.84°C and 4.12°C for H03S and H03N, respectively. Therefore, only data recorded at H03S is used in this work. The HA11 hydrophones are located approximately 54 km north (H11N) and 89 km south (H11S) of Wake Island (North-West Pacific Ocean). Only data from the southern triplet H11S is used in this work because H11N could be affected by Wake Island shadowing for T-waves arriving from the South.
3.1 Time-frequency analysis of the T-wave signals
Table 2 presents the location and depth of the hydrophones considered in this study. Also, the distance and azimuth of each hydrophone triplet to the earthquake epicenters are presented. The uncalibrated spectrogram and the signal waveform recorded at H10N1, H03S1, and H10N1 for the three earthquakes are shown in Figure 2. Although not shown here, a strong signal correlation was observed between the signals at all of the three hydrophones of H11S (H11S1, H11S2, and H11S3), H03S (H03S1, H03S2, and H03S3), and H10N (H10N1, H10N2, and H10N3).
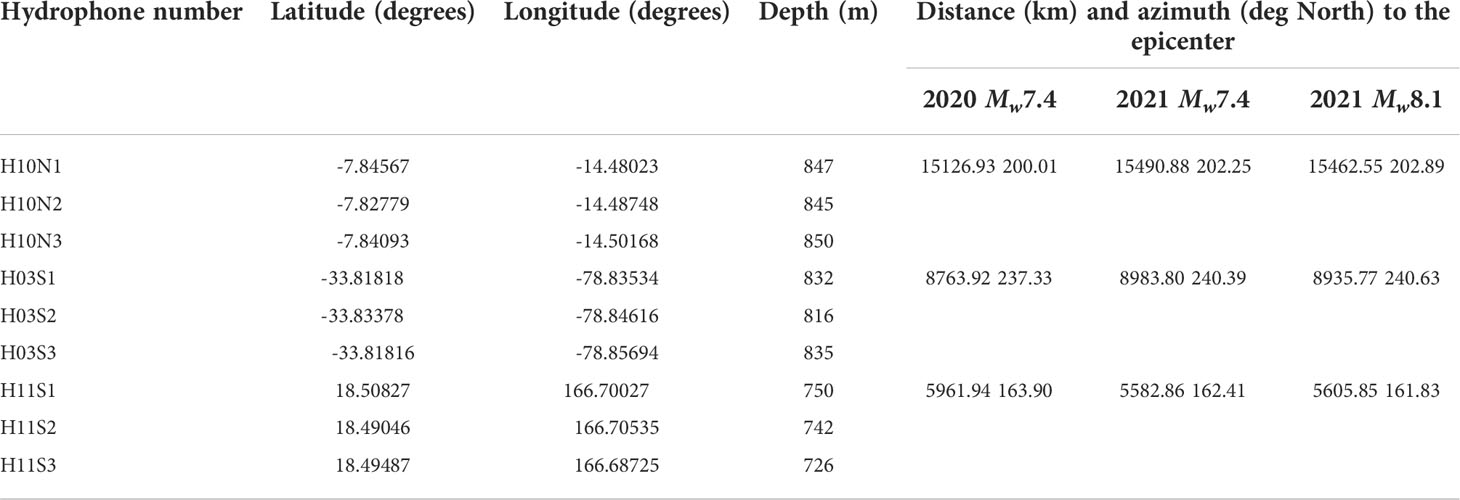
Table 2 Location of CTBT-IMS hydrophones considered in this study, and triplet distance and azimuth to the epicenter of the three earthquakes.
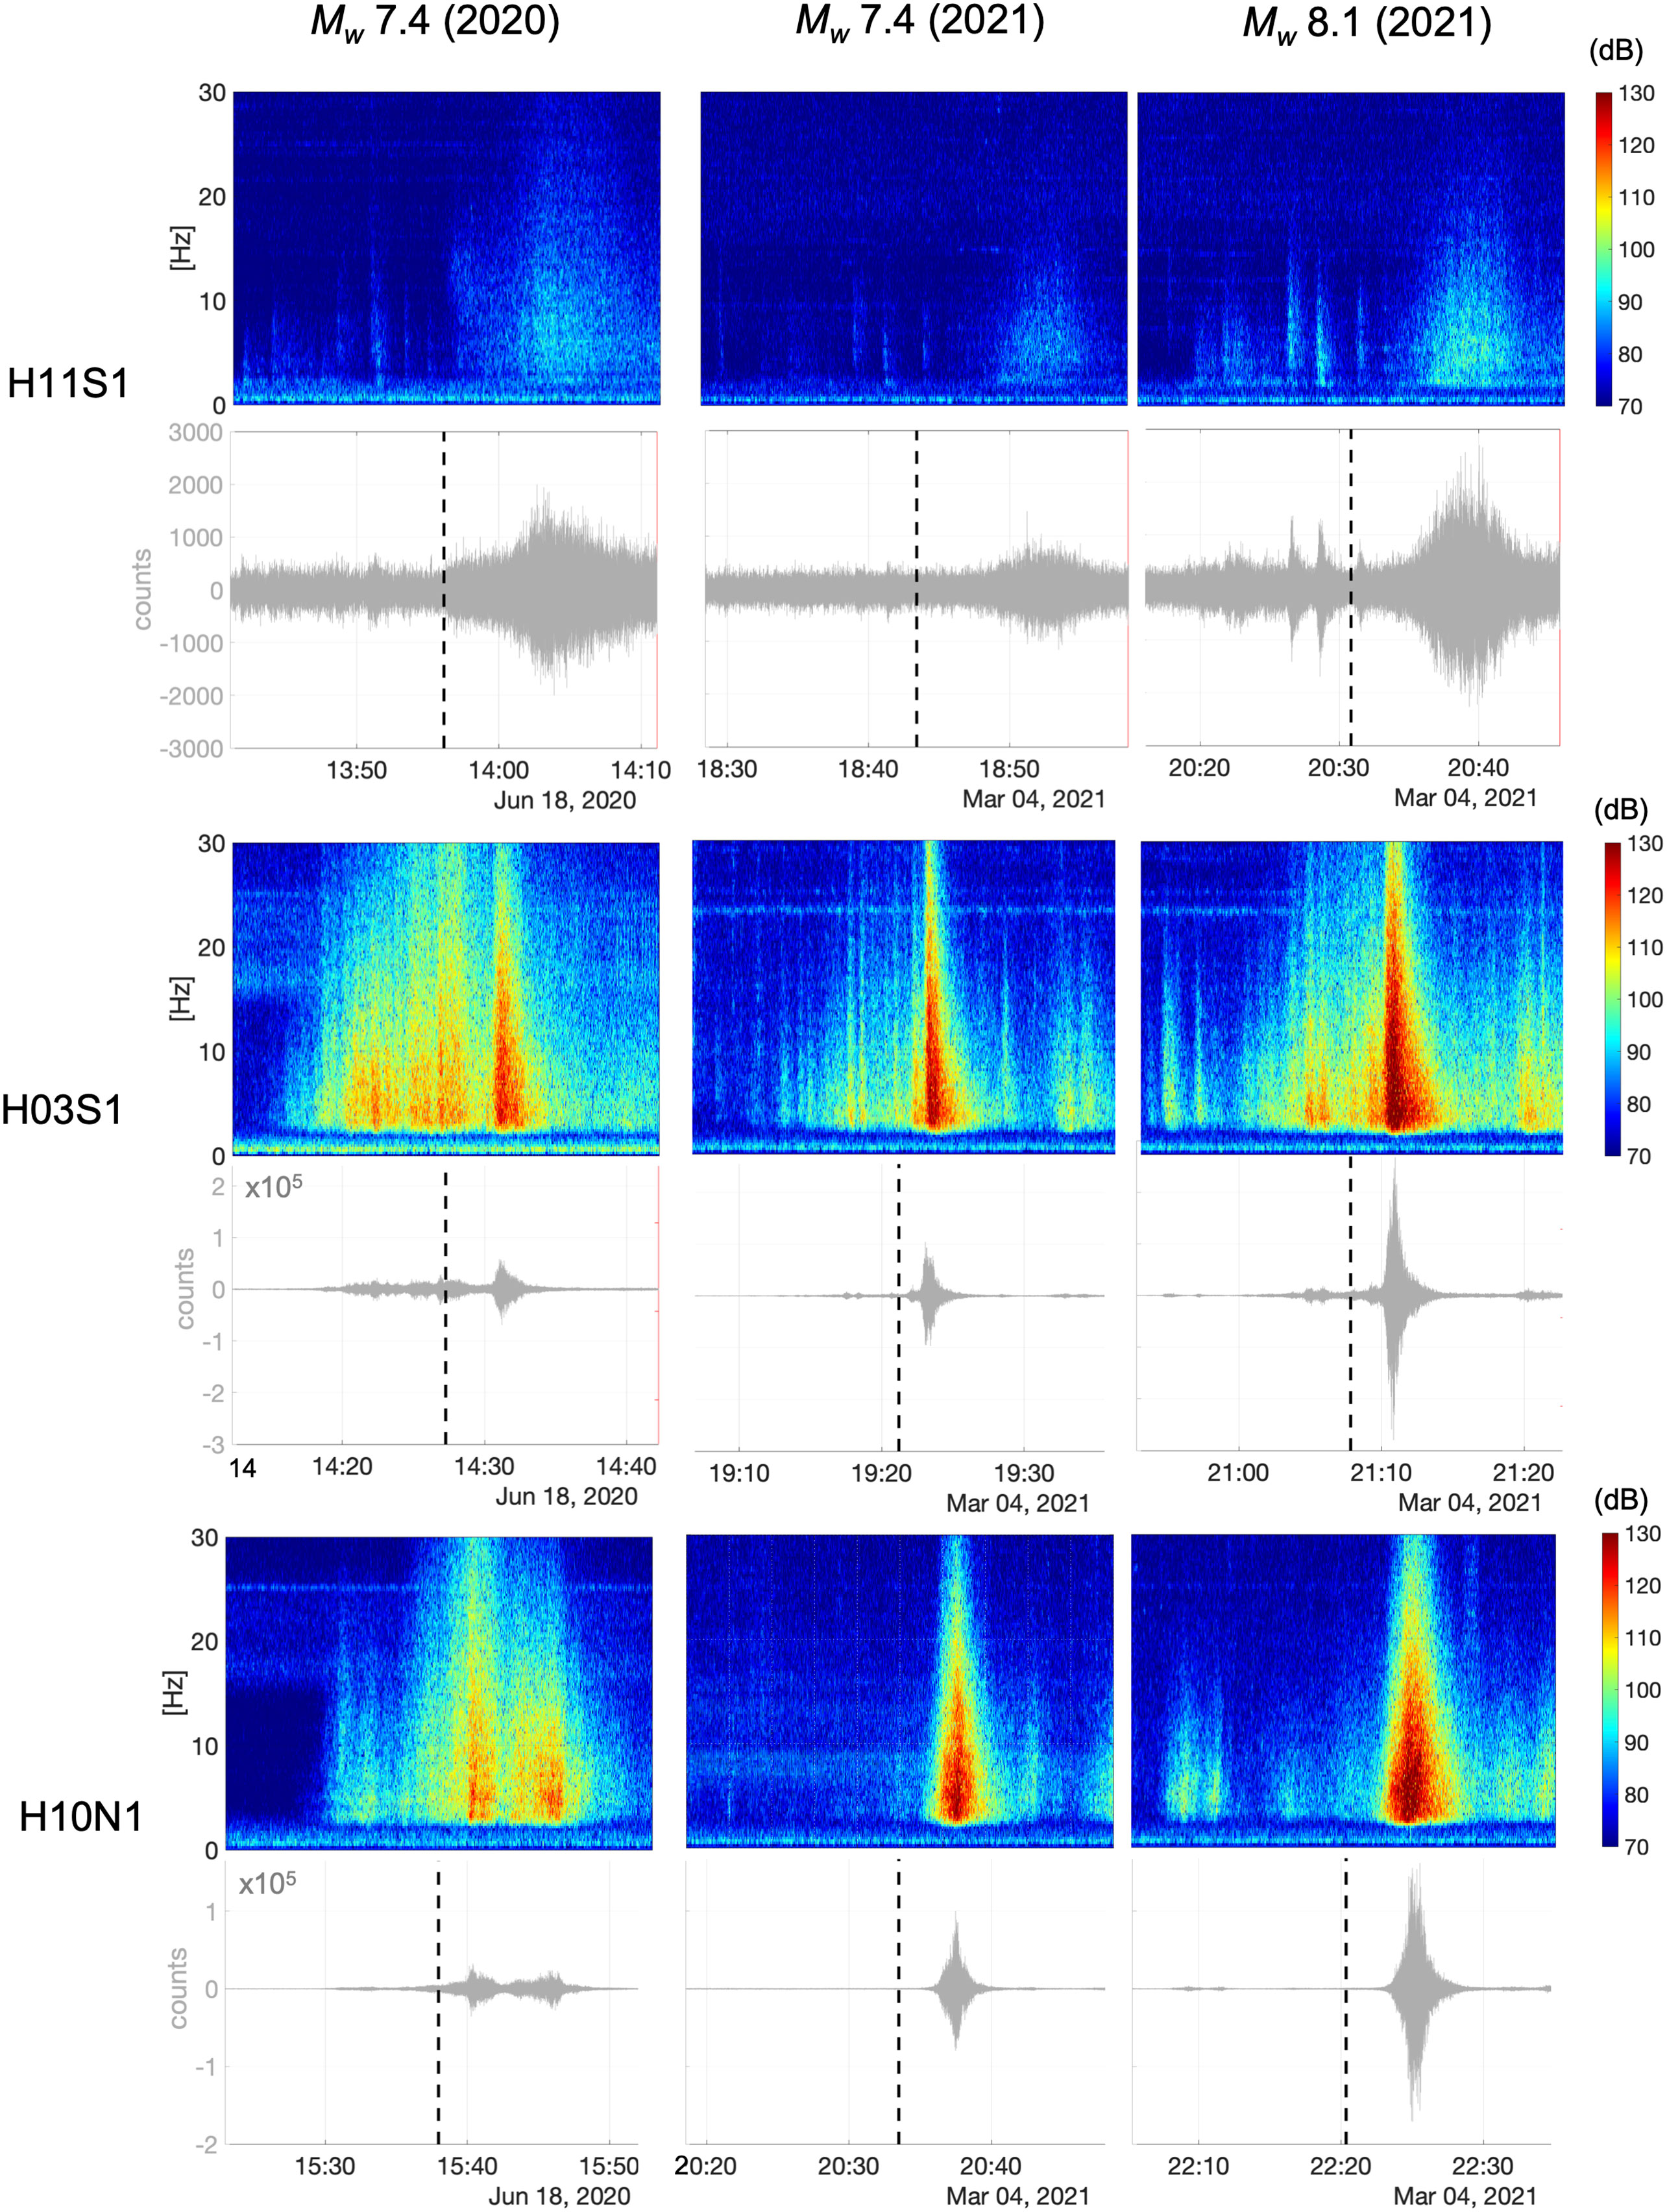
Figure 2 Uncalibrated spectrogram and the signal waveform recorded at H11N1 (top panel), H03S1 (middle panel) and H10N1 (bottom panel) for T-waves from the 18 June 2020 Mw7.4 (left column) Kermadec Trench, and 4 March 2021 Mw7.4 (central column) and Mw 8.1 (right column) Kermadec Islands submarine earthquakes. The vertical dash lines indicate the theoretical arrival times.
T-waves signal analysis shows that the recorded levels were significantly lower at H11S than at H03S and H10N, although it is the shortest distance from the epicenters. Moreover, H03S registered the strongest T-waves for the three events (see the T-wave signal spectrograms shown in Figure 2). It should be noted that the energetic earthquakes were detected at HA10 (~15000 km distance) because of the relatively clear propagation path to HA10 compared to the ~6000 km path to HA11. The propagation path to H11 is blocked by several geographic and bathymetric features, which will be detailed later in the paper. Oliveira et al. (2021) showed that, although the Antarctic peninsula blocks the geodesic path between the 2020 Mw7.4 epicenter and the HA10 hydrophones (see Figure 1), the T-waves generated at the epicenter could still reach the HA10 station after being diffracted by the complicated bathymetry at the Drake Passage.
The spectrograms in Figure 2 seem to indicate different T-wave arrivals close to the theoretical arrival time (TAT, identified by a vertical dash line), which was calculated considering a constant water sound speed at 1500 m/s and the geodesic distance between the announced epicenter and the center of the hydrophone triplets. However, the signals from the 2021 Mw7.4 and Mw8.1 Kermadec Islands earthquakes seem to present more similar arrival patterns between the stations compared to the 2020 earthquake.
The part of the signal arriving before TAT could be due to seismic energy propagating long distances in the ground (higher speed) and then meeting the T-wave generation conditions to couple into the water. In other words, the generation locations of the earlier T-wave arrivals might be different from the later ones. However, the coupling of the in-ground earthquake seismic waves (either P or S waves) to T waves is a very complex phenomenon. As time evolves, this coupling may change depending on the underwater environmental conditions favoring the coupling of seismic to T-wave propagation. The part of the signal arriving before TAT could also be foreshocks, i.e., rumble in the earth before the actual quake or smaller quakes at another location. The part of the signal arriving after TAT could be due to aftershocks or multipath propagation induced by horizontal reflection, refraction, and diffraction from geological features.
Next, it will be investigated if, for the 2021 earthquakes, the arrivals before and after the TAT are related to the events of interest and their origin. The Dase ToolKit - Graphical Progressive Multi-Channel Correlation (DTK-GPMCC) program (Cansi, 1995; Cansi and Klinger, 1997; Vergoz et al., 2021) is used to process the recorded T-wave signals.
3.2 Signal correlation, detection, and propagation paths
T-waves recorded at HA03, HA10, and HA11 are compared to investigate their correlation and similarities. The signals recorded from the 2021 Mw7.4 and Mw8.1 Kermadec Islands earthquakes were correlated at a hydrophone at each station and across hydrophones at each station to establish a measure for their similarities. A passband filter was applied to the seismic band from 0.8 to 4.5 Hz to provide some stability in the signal that was expected to correlate compared to the broader 30-Hz band used for the original data. Detections were computed with DTK-GPMCC version 6.4.0 using ten equally spaced frequency bands between 0.8 to 4.5 Hz. Detection pixels (time-frequency cells) with window lengths of 15 s and a time-series overlap of 90% were considered. The consistency threshold (sum of correlation zero-lags) was the default value of 0.02 under which the direction of arrival (DOA) is well-determined. Pixel families (pixels with similar wavefront characteristics) were obtained considering a minimum and a maximum number of consecutive pixels per family of 10 and 300, respectively. A family of pixels is defined hereafter as an arrival.
The analysis of the part of the time series arriving earlier than TAT could provide information about the excitation of the T-waves from both spectral levels, roll-off and correlation. Nevertheless, it is sometimes difficult or impossible to separate the effects due to the source/generation process and those due to the channel propagation path.
It can be considered that if signals correlate well between earthquakes at the same hydrophone, then the T-wave signal generation is similar between events, and the propagation conditions between event location and hydrophone are stable. In addition, if signals correlate well across hydrophones at different stations, then the source signal generation and propagation conditions are azimuthal independent. However, suppose that a single earthquake signal exhibits a high cross-correlation of the signals recorded at different hydrophones in a station triplet but appears different by exhibiting low correlation at hydrophones from different stations. In that case, it could indicate that the signal similarity by cross-correlation is mostly affected by the propagation channel’s band-limited impulse responses and not so much by the source signals.
3.2.1 Propagation to Station HA03 at Juan Fernández Island
Figure 3 shows the source location of the T-waves generated by the 4 March 2021 Mw7.4 and Mw8.1 Kermadec Islands earthquakes recorded at H03S. The source location for the two events is geographically close and several similar arrival patterns are detected for both earthquakes. Therefore, the analysis is focused on five main T-waves arrival groups. The first group of T-waves arrived before TAT and are presented in magenta in Figure 3. Their arrival azimuths (hereafter, all arrival azimuths are relative to true North) for the Mw8.1 earthquake T-waves increased from 236.3°C to 240.8°C, and the duration of that part of the signal is approximately 513 s. As for the Mw7.4 earthquake T-waves, the azimuths increased from 236.2°C to 240.4°C, which agrees with the Mw8.1 event very much, and the duration is approximately 436 s. This variation in the arrival azimuth could suggest a very intriguing T-wave generation mechanism where the T-waves were triggered along the chain of seamounts on the Louisville Ridge after propagating as seismic waves in the ground for around 450 km and then coupling to acoustic waves in the water.
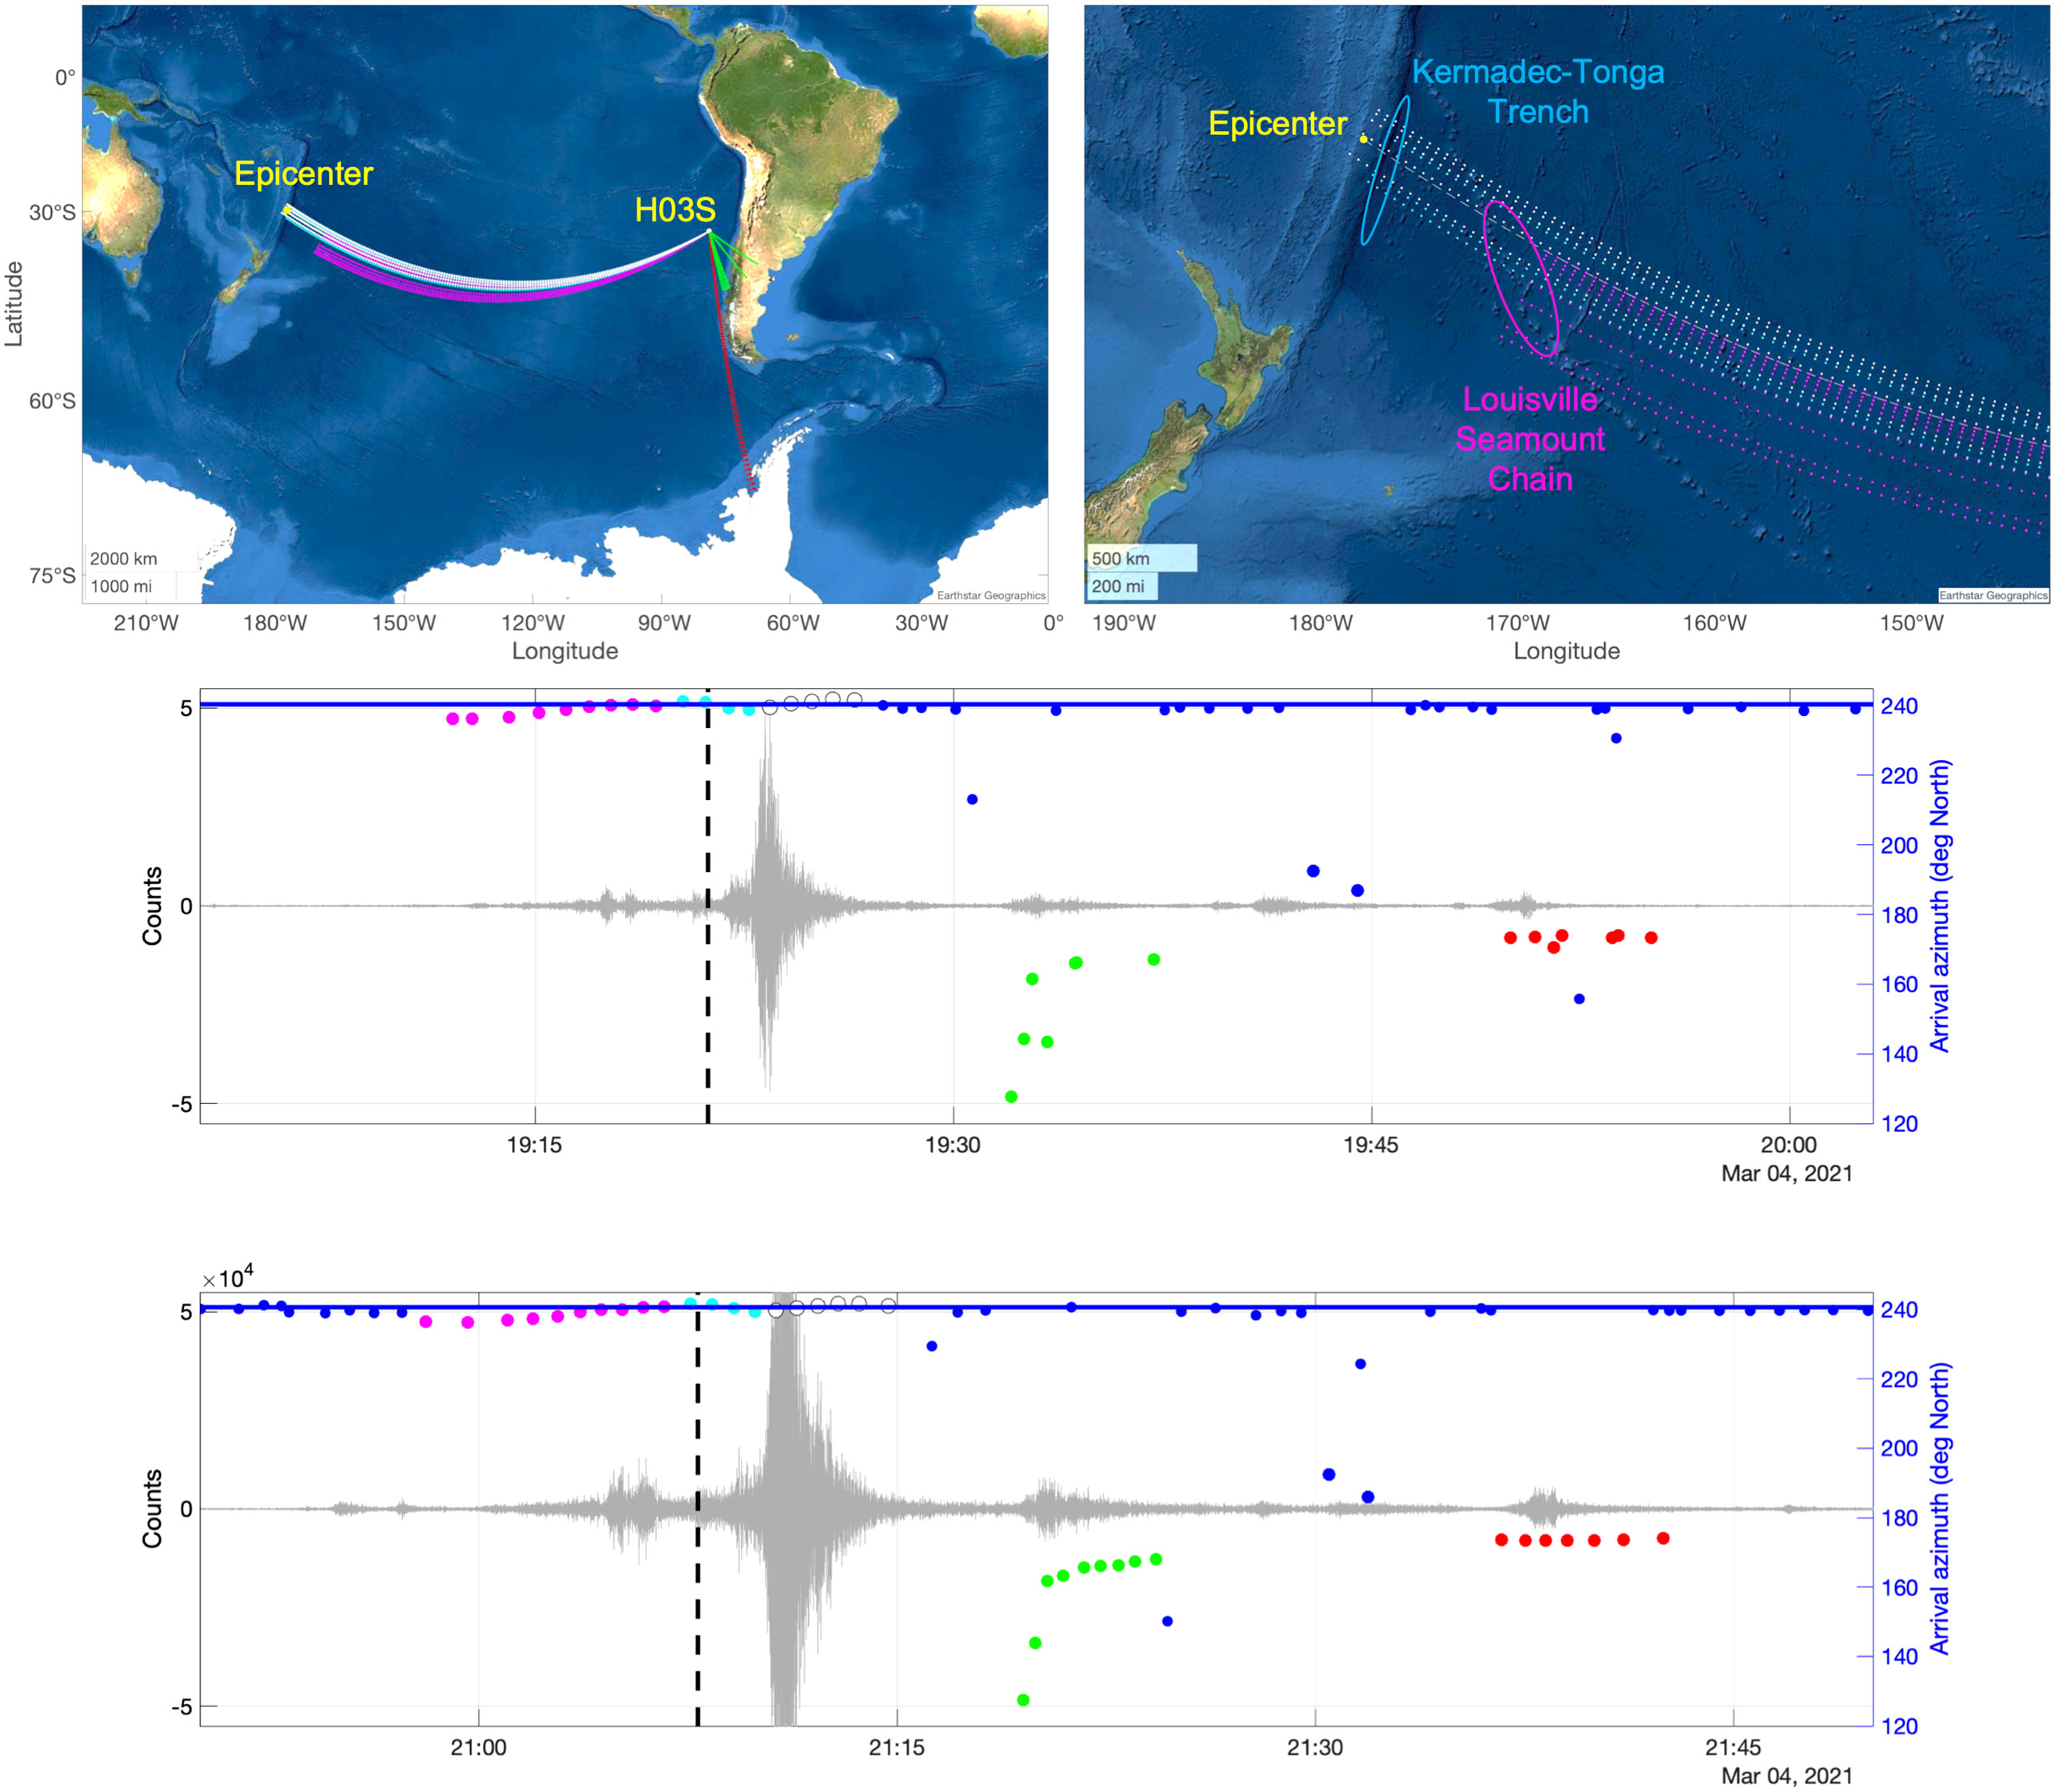
Figure 3 H03S. Back-azimuth paths of T-waves from the 2021 Mw 8.1 earthquake (top plots). Time and angles of arrivals detected at the H03S triplet, and the signal waveform recorded at the H03S1 hydrophone for the 2021 Mw7.4 (middle plot) and Mw 8.1 (bottom plot) earthquakes. The vertical dash lines indicate the theoretical arrival times. The horizontal blue line indicates the azimuth to the epicenter.
The second group of T-waves (light blue in Figure 3) arrived with azimuths for the Mw8.1 earthquake T-waves decreasing from 241.6°C to 239.2 °C with a duration of approximately 138 s. As for the Mw7.4 event, the arrival azimuths decreased from 241.3°C to 238.9°C with a duration of approximately 142 s. The signals’ back azimuth variation suggests that they were triggered in the Kermadec Trench slope (the outer arc of the Trench) after propagating as seismic waves in the ground for around 120 km.
The third group of T-waves (white color in Figure 3) corresponds to the strongest and main T-waves, most likely generated nearby the epicenter. They arrived with azimuths for the Mw8.1 earthquake T-waves ranging from 239.6°C to 241.7°C with a duration of approximately 180 s. As for the Mw7.4 event, the arrival azimuths vary from 239.5°C to 241.7°C with a duration of approximately 135 s. The main T-waves azimuth variation indicates a sound source moving northward, which agrees with the fault model for this type of earthquake proposed by Romano et al. (2021).
More interestingly, the fourth group of T-waves (green arrivals in Figure 3) suggests T-waves reflected at the Chilean coast with arrival angles at H03S between 127.4° and 168° in the Mw8.1 event and between 127.6° and 167° in the Mw7.4 event (both events were consistent). This arrival pattern could indicate T-wave reflections extending from the North to the South along the Chilean coast’s shelf-break. Indeed, the coastline and shelf-break orientation favor T-wave reflections back to H03S hydrophones at reflection angles greater than 90°, i.e., the typical forward reflection but a backward reflection towards the H03S triplet.
The fifth group of arrivals corresponds to T-waves possibly reflected at the Antarctic Peninsula (red arrivals). For the Mw8.1 event, the measured time between the T-waves reflected by the Chilean coast (21:22:16) and the T-waves reflected by the Antarctic Peninsula (21:39:01) is 1005 s. Considering that T-waves from the Chilean coast were reflected at around 44.31°S, 75.48°W, the T-waves reflection from the Antarctica Peninsula occurred near 65.84°S, 70.95°W, a theoretical time difference of 1007 s is obtained.
Between the reflections from the Chilean coast and the Antarctic Peninsula, hydroacoustic signals with similar back azimuths were identified around 19:45 and 21:30 for Mw7.4 and Mw8.1, respectively. The similarity of the arrival patterns suggests that the signals were associated with the Kermadec seismic events. Therefore, their back azimuth could point to Antarctica. Still, we could not find their exact location based on arrival time comparison to Chile coast and Antarctic peninsula reflections.
3.2.2 Propagation to Station HA10 at Ascension Island
The T-waves generated by the 4 March 2021 Mw7.4 and Mw8.1 Kermadec Islands earthquakes and recorded at H10N are shown in Figure 4. Three main potential groups of arrivals at H10N are identified and discussed here. They are represented by black, white, and green arrivals in Figure 4 and are nicknamed Dry T-waves, Wet T-waves, and Bouncing T-waves. The “Bouncing” nickname is from the T-wave characteristics of bouncing back from the African continent. The first group of arrivals (Dry T-waves, black color in Figure 4) are identified only for Mw8.1 and arrived before TAT. They could correspond to T-waves propagating as acoustic waves in the Pacific and crossing South America as seismic waves after acoustic to seismic energy conversion on the west coast of South Chile. Then, the seismic waves were converted into acoustic waves again in the Argentine Basin. Finally, these T-waves propagate as acoustic waves in the South Atlantic Ocean to H10N. These T-waves could have traveled approximately 15600 km, corresponding to 8240 km in the Pacific, 1360 km in the ground crossing South America, and 6000 km in the Atlantic Ocean. These distances were calculated assuming that acoustic to seismic energy conversion could have occurred approximately at 50.92°S, 75.87°W (South Chile) and seismic to acoustic energy conversion at approximately 46.66°S, 58.55°W (Argentine Basin).
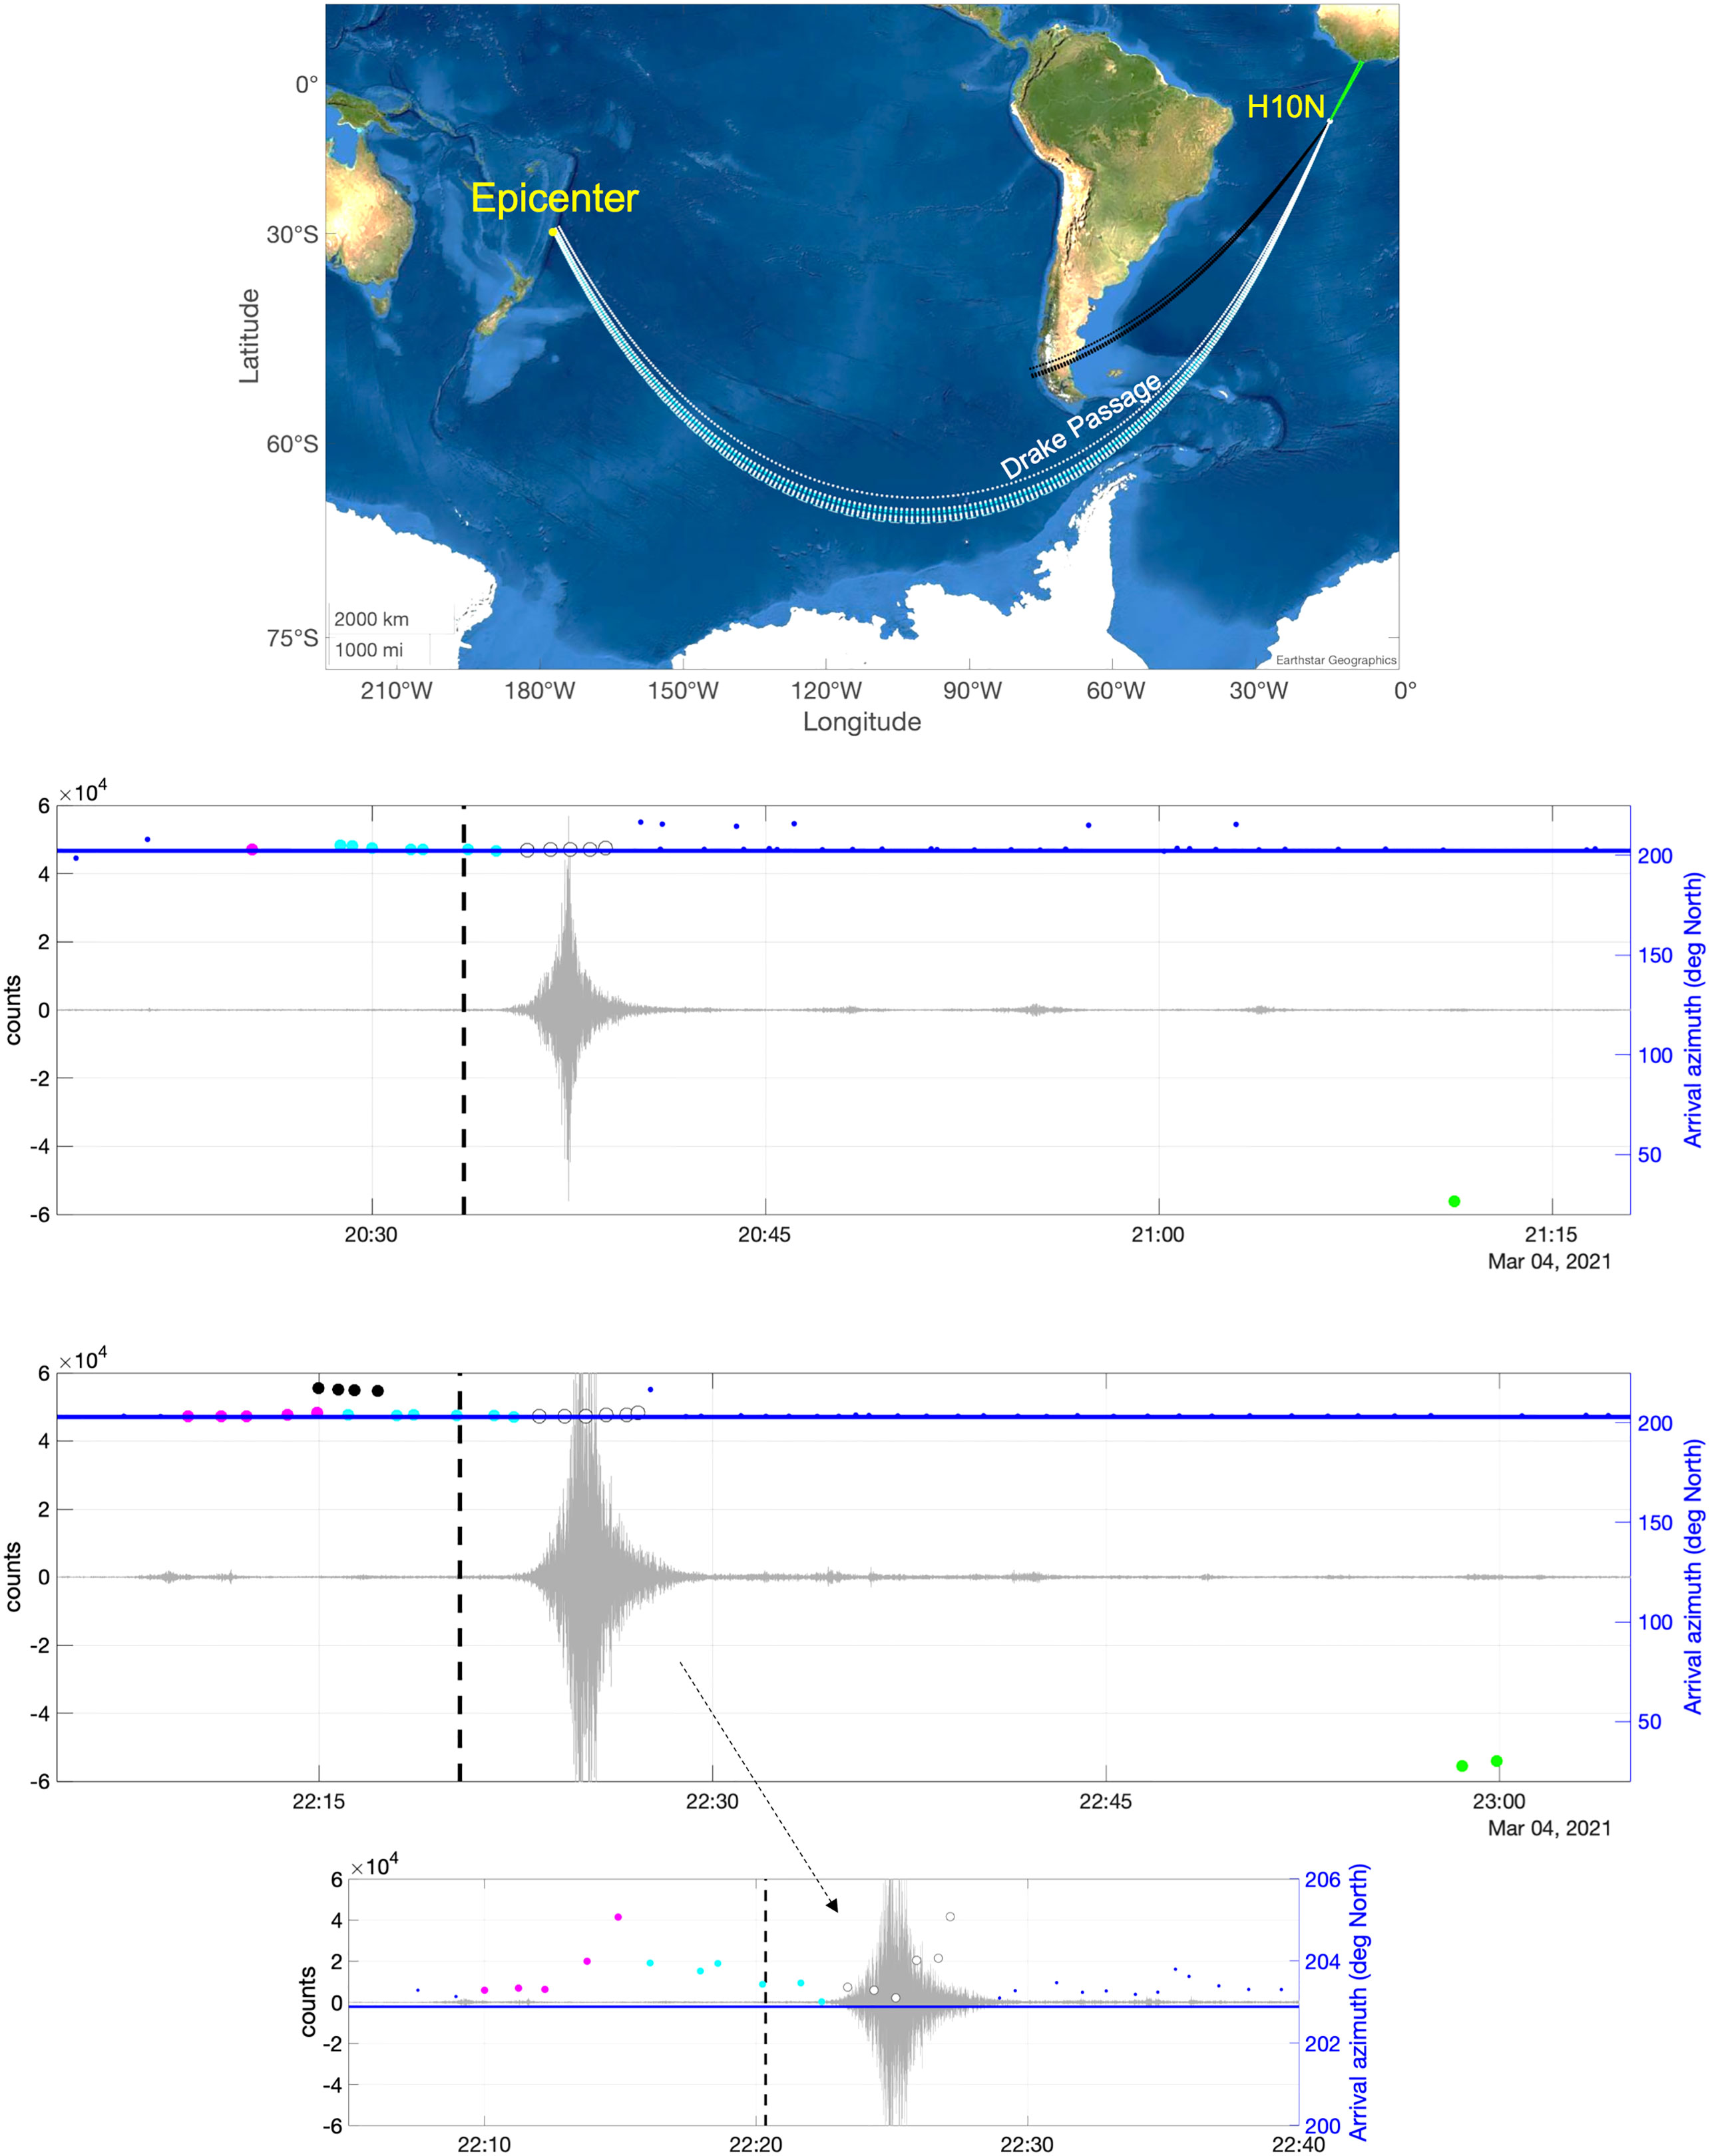
Figure 4 H10N. Back-azimuth paths of T-waves from the 2021 Mw 8.1 earthquake (top plot). Time and angles of the arrivals detected at the H10N triplet, and the signal waveform recorded at the H10N1 hydrophone for the 2021 Mw7.4 (middle plot) and Mw 8.1 (bottom plot) earthquakes. The vertical dash lines indicate the theoretical arrival times. The horizontal blue line indicates the azimuth to the epicenter.
Wet T-waves (the second group of arrivals) correspond to the strongest and main T-waves propagating from the Pacific to the Atlantic through the Drake Passage (white color in Figure 4). They were recorded at H10N for the 2021 Mw7.4 and Mw8.1 earthquakes. Considering the geodesic path between the epicenter and H10N, these T-waves propagated approximately 15500 km in the water. For the Mw 8.1 earthquake, the recorded time difference between the arrival of the Dry T-waves (22:14:58) and the Wet T-waves (22:23:31) was 513 s. Considering the theoretical travel times of 1.5 km/s for T-waves traveling in the water and 5.0 km/s for seismic waves propagating on the ground, this observed arrival time difference indeed matches with the theoretical calculation of 546 s. For the Mw8.1 earthquake, back azimuth variation also suggests that T-waves were triggered in the Kermadec Trench slope (light blue in Figure 4) and along the chain of seamounts on the Louisville Ridge (magenta in Figure 4).
The Bouncing T-waves were recorded at H10N for both the 2021 Mw7.4 and Mw8.1 earthquakes. Determined from the back-azimuth calculation of ~25 deg due North, they correspond to the Wet T-waves that passed H10N and traveled approximately 1550 km to the coast of Liberia (west coast of Africa) and were reflected back to H10N. Assuming the Bouncing T-waves were reflected at roughly 4.622°N, 8.097°W, they propagated approximately 18563km in the water, being the sum of 15463 km from the epicenter to HA10, 1550 km from HA10 to the west coast of Africa, and 1550 km back to HA10. Taking the Mw8.1 event as an example, the Bouncing T-waves (22:58:34) arrived 2112 s after Wet T-waves at H10N, which matches very well with the theoretical calculation of 2103 s.
Between the Wet T-waves and Bouncing T-waves, several similar arrival structures are recorded for the 2021 Mw7.4 and Mw8.1 earthquakes. For the Mw8.1 event, they present arrival angles between 203.1° and 203.8°. These lower energy T-waves could correspond to T-waves propagating in the water but with longer travel distances than Wet T-waves because of horizontal reflection and diffraction induced by geological features like islands and shelfbreaks. Instead, they could also be from echoes near the epicenter. However, no evidence of the echoes was found in H03S signals, but the reflections from Chile and Antarctica could mask them.
3.2.3 Propagation to Station HA11 at Wake Island
Figure 5 shows T-waves arrivals at H11S generated by the Mw7.4 and Mw8.1 Kermadec Islands earthquakes. Several arrivals identified at H11S present similar patterns for both earthquakes, indicating similar T-wave generation and propagation mechanisms. The strongest signals corresponded to the main T-waves, recorded about 300 s after TAT with a duration of about 220 s. Two groups of arrivals (white and black color in Figure 5) were detected during the strongest recorded main T-waves. In the Mw8.1 event, arrival azimuths of the first group (white color) ranged between 146.1° and 148.3° and for the second group (black color) between 150.9° and 152.1°. The back azimuths of the first group of main T-waves intersected the area between the North Edge of the Tonga Trench and Samoa islands. The second group pointed to the Lau Basin, between Fiji and Samoa Islands. These two sets could indicate T-waves generated near the epicenter that traveled in the water through the Havre Trough and Lau Basin.
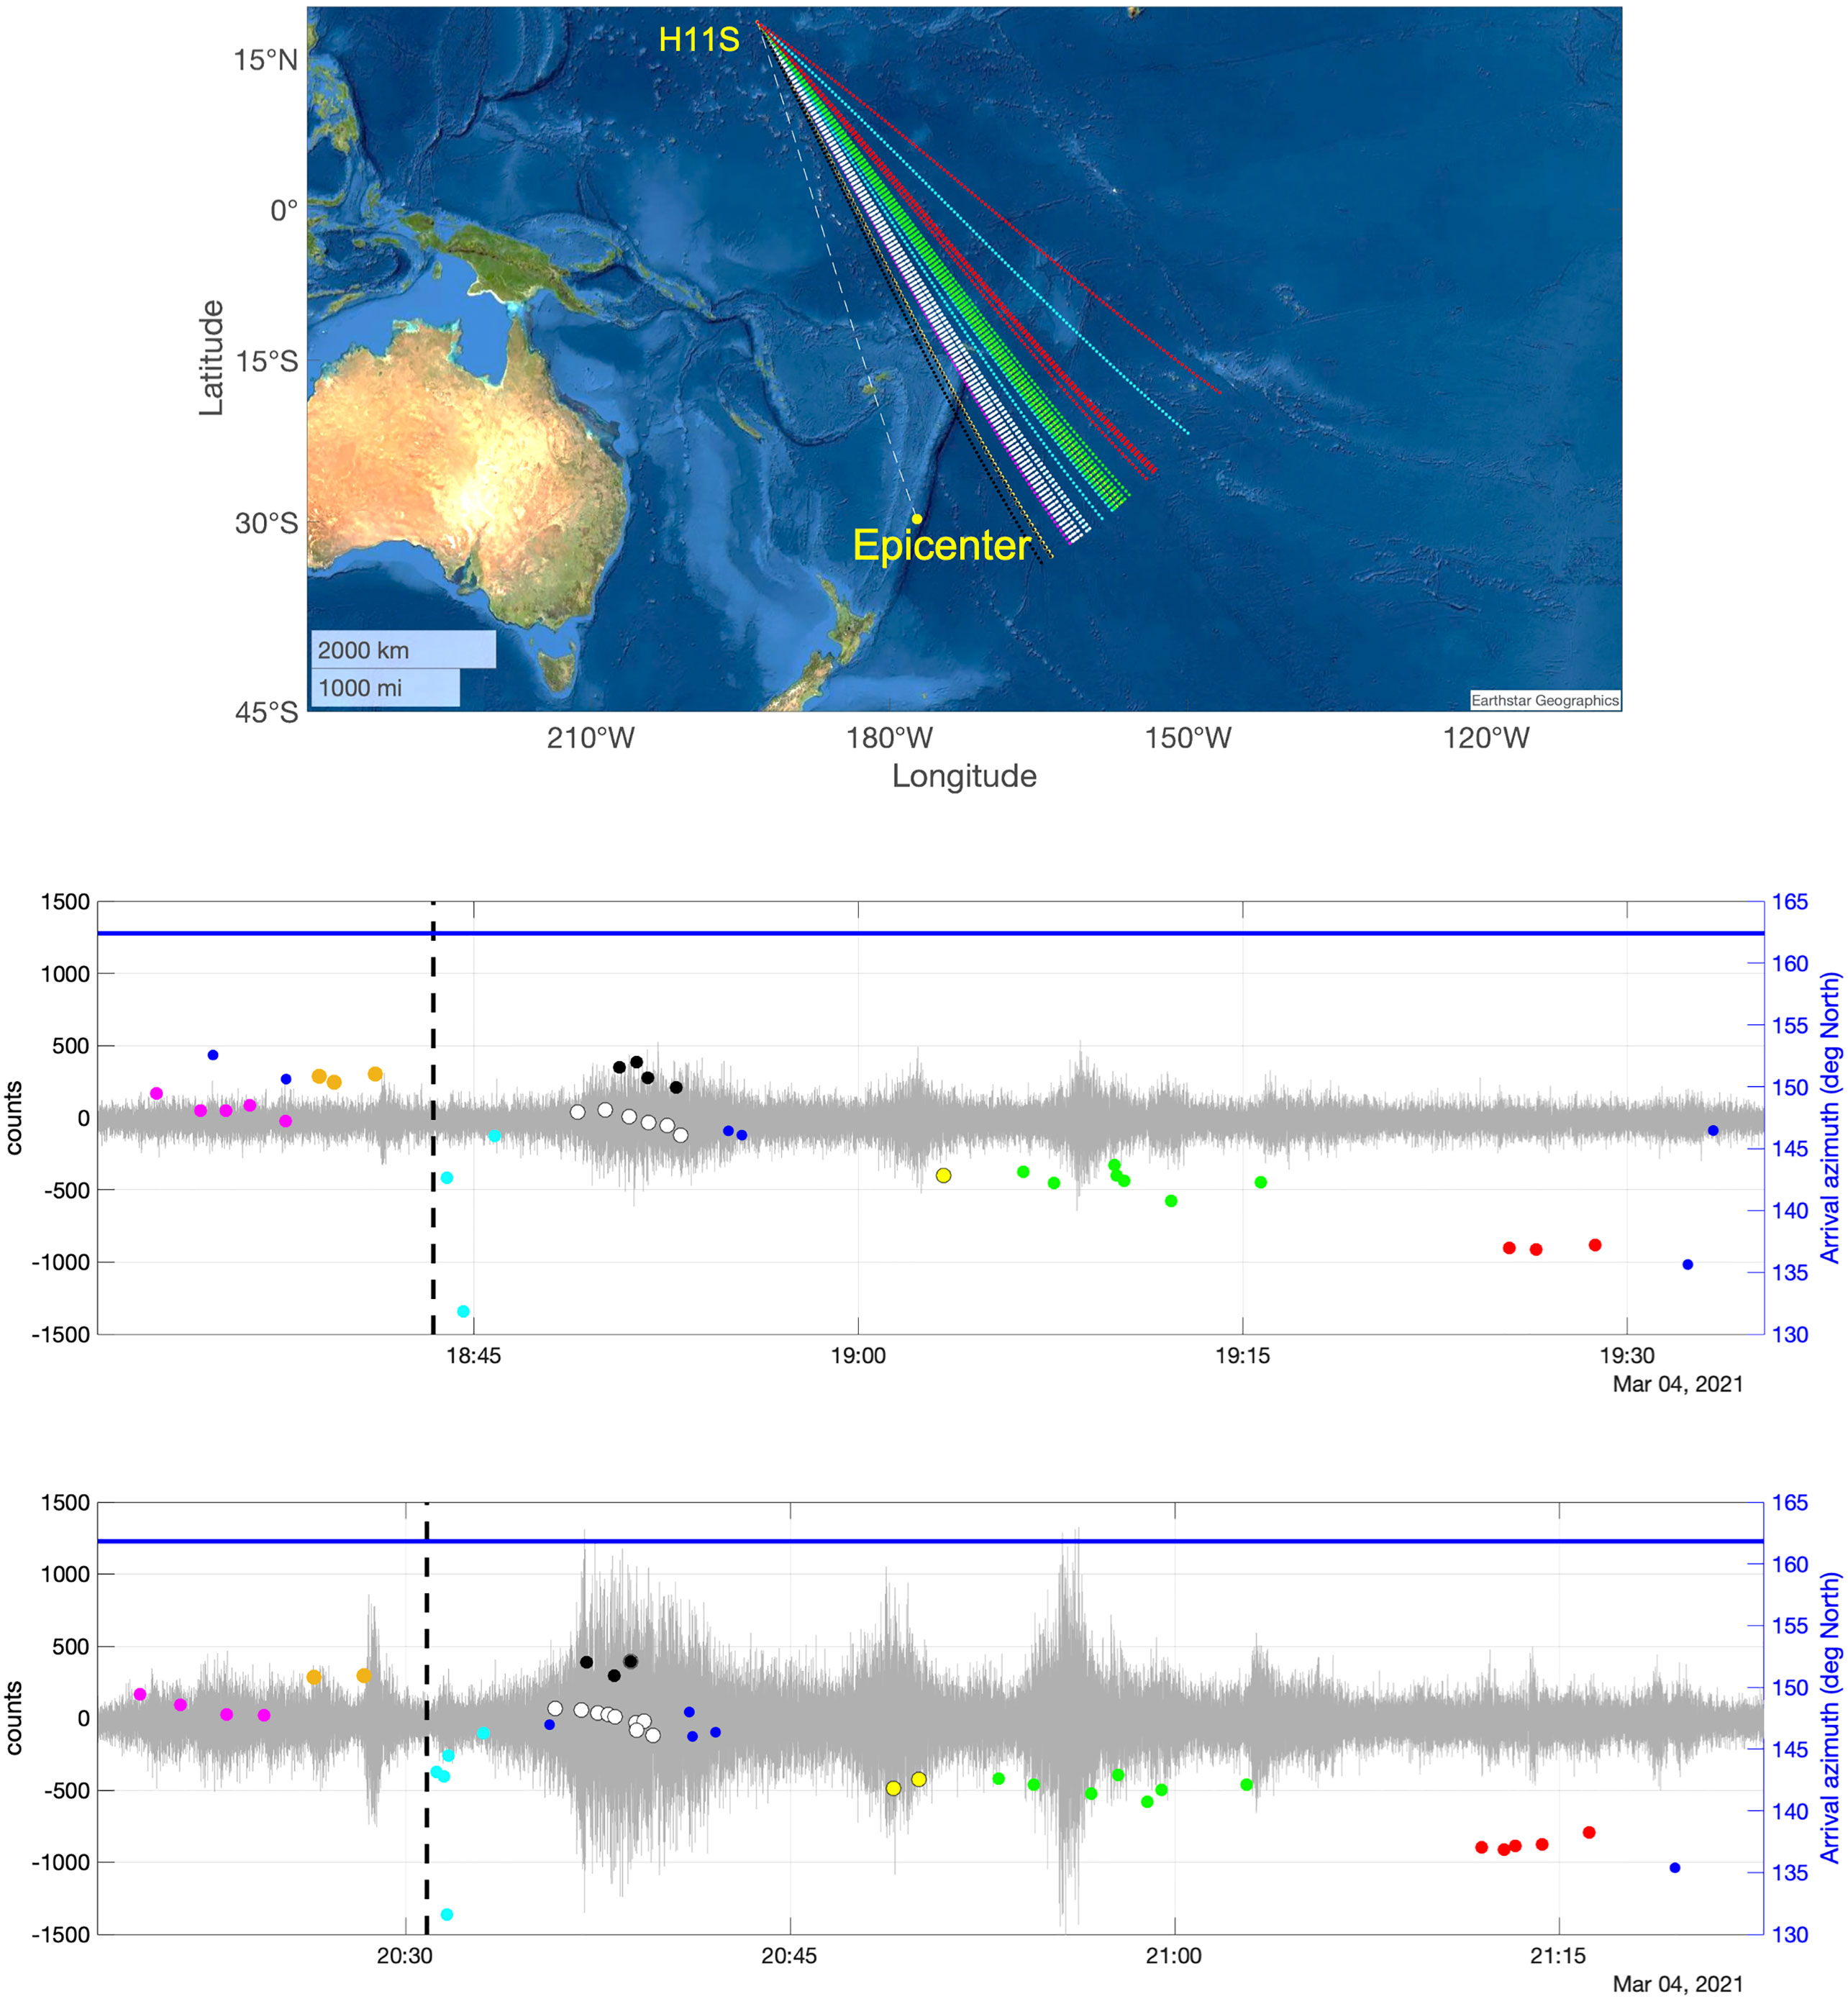
Figure 5 H11S. Back-azimuth paths of T-waves from the 2021 Mw 8.1 earthquake (top plot). Time and angles of the arrivals detected at the H11S triplet, and the signal waveform recorded at the H11S1 hydrophone for the 2021 Mw7.4 (middle plot) and Mw 8.1 (bottom plot) earthquakes. The vertical dash lines indicate the theoretical arrival times. The horizontal blue line indicates the azimuth to the epicenter.
Before the strongest T-waves, three groups of arrivals are identified. For Mw8.1, the first group (magenta color) arrived 672 s before TAT and for a duration of 291 s with back azimuths varying from 149.4° to 147.7°. These azimuths point to the North Edge of the Tonga Trench. The second group (red color) presented back azimuths between 150.8° and 150.9°, arrived 266 s before TAT, and persisted 119 s. The third group (light blue) arrived 22 s after TAT and lasted for 110 s with back azimuths going from 142.8° to 146.3°, which pointed to Samoa Islands. These three groups of weaker and earlier T-waves seem to indicate seismic to acoustic waves coupling far from the epicenter in the complex bathymetry of seamounts and islands over the Kermadec and Tonga Ridges and Samoa Archipelago.
Later T-wave arrivals (yellow, green, red) were detected for the Mw7.4 and Mw8.1 earthquakes with azimuths smaller than the main T-waves. These could be T-waves triggered at the same location as the main T-waves but with longer propagation paths due to horizontal reflection, refraction and diffraction off bathymetric features and islands.
Overall, T-waves from the Mw8.1 earthquake were detected at H11S in a roughly 56.5 minutes time window. They arrived from azimuths ranging between 131.6° and 152.1°, presenting a substantial deviation from the 161.83° geodesic path. This deviation suggests an acoustic blockage along the geodesic path between the earthquake epicenters and HA11. Moreover, the T-wave arrivals observed at HA11 highlight the complexity of seismic to acoustic energy conversion in the Kermadec-Tonga region (Talandier and Okal, 1979). Further discussion from 3D T-wave propagation is provided in the next section.
4 Numerical simulations of T-wave propagation
4.1 3D parabolic-equation sound propagation model
A 3D sound propagation model based on the parabolic equation (PE) is utilized to propagate T-waves in the ocean from the epicenter of the 2021 Mw7.4 earthquake to H03S and H11S hydrophone stations. PE models are one of the most efficient and accurate methods for megameter underwater sound propagation in 3D range-dependent environments (Heaney et al, 2017; Oliveira et al., 2021). The PE model used here solves the approximated 3D Helmholtz wave equation in a Cartesian system by taking a square root of the propagation operator and utilizing the Split-Step Fourier solution marching algorithm (Lin et al., 2013). The model utilizes the wide-angle approximation proposed by Thomson and Chapman (1983). A multi-core parallel and General-Purpose Graphics Processing Unit (GPU) version of this PE model is employed (Kushida et al., 2020). A geodesic Cartesian coordination implementation of this 3D PE model (Oliveira and Lin, 2019; Oliveira et al., 2021) is performed to include the Earth’s curvature for the long-range underwater acoustic signal propagation calculations on a multi-core parallel computer workstation.
The size of the two simulation domains were 8984 km x 1200 km x 11 km (range × cross-range × depth) and 5583 km x 2000 km x 11 km for H03S and H11S, respectively. The grid size used for both simulation domains was 300 m x 150 m x 4 m.
4.2 Ocean environment models
The properties of the bottom considered in the simulations are sound speed cb= 1700 m/s, density ρ= 1500 kg/m3, and attenuation βb= 0.5 dB/λ, where λ is the wavelength in the bottom. Also, for all the simulations, water density is considered to be constant of ρw = 1000 kg/m3. A bathymetric model was constructed using the 15 arc-second resolution (~450 m) SRTM15+ global bathymetry and topography database (Tozer et al., 2019). The depth-dependent water salinity and temperature outputs from the ~9 km horizontal resolution global HYCOM-NCODA (Cummings, 2005) hindcast model for 18:00:00 and 20:00:00 on 4 March, 2021, were used to compute the 3D sound speed field using the equation proposed by Mackenzie (1981). No absorption in the water is considered in the modelling of the underwater acoustic signal propagation and would add approximately an additional 25 dB to the transmission loss (TL) for propagation ranges of 6000 km.
4.3 Model results
Assuming a 5-Hz sound source located near the seafloor at the epicenter of the 4 March 2021 Mw7.4 earthquake, the 3D propagation model result is presented in Figure 6 for H11S (left panels) and H03S (right panels). Model results for HA10 were previously presented by Oliveira et al. (2021), considering the 18 June 2020 Mw7.4 South of the Kermadec Islands earthquake.
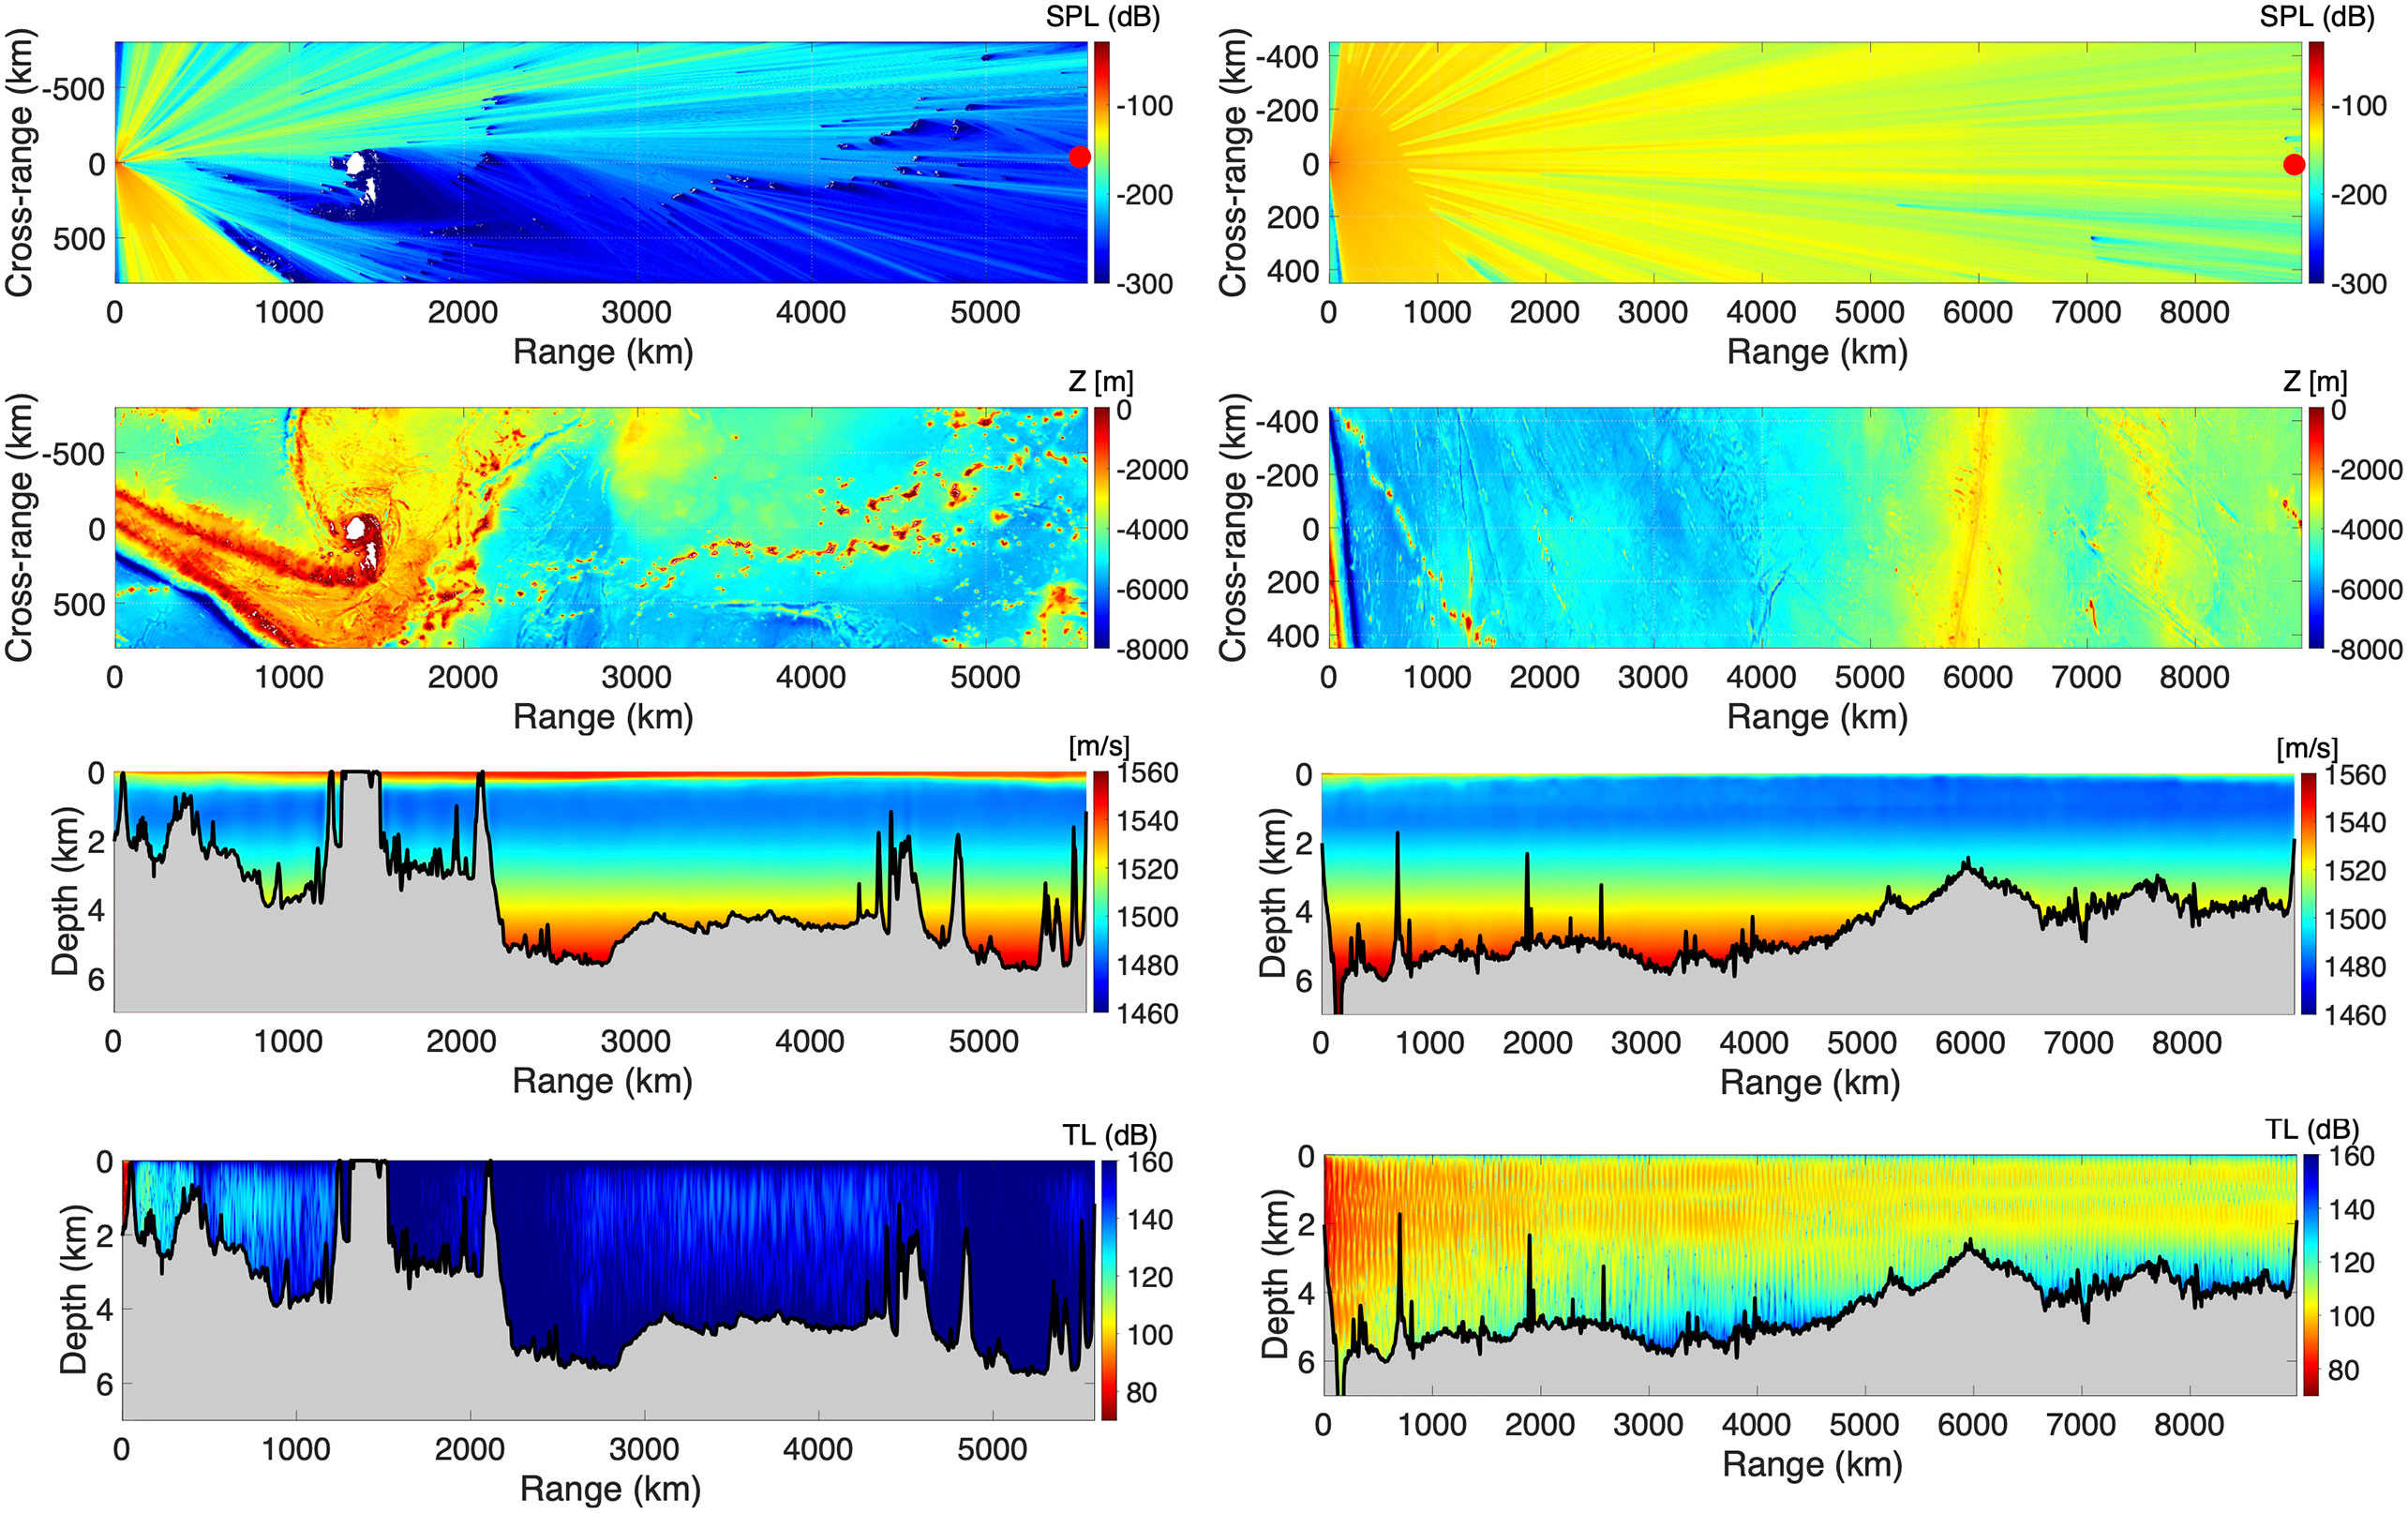
Figure 6 3D sound propagation model results between the 4 March 2021 Mw 7.4 earthquake epicenter and H11S (left) and H03S (right) for a 5 Hz source for the Kermadec Islands earthquake. Top panel: Depth-integrated sound intensity from a 0 dB source. Red dot indicates the location of the hydrophone stations. Second panel: Bathymetric model used in simulations. Third panel: Water sound speed model along the geodesic path from the epicenter to hydrophone stations. Black line indicates the bathymetry. Bottom panel: TL levels along the geodesic path from the epicenter to hydrophone stations.
The two top panels of Figure 6 show the depth-integrated sound intensity from a unit-amplitude (0 dB) source as a function of distance from the source location. The second panels show the bathymetric model used in the simulations. The third panels show the water sound speed model along the geodesic path from the epicenter to the hydrophone stations. The two bottom panels show TL levels along the geodesic path from the epicenter to the hydrophone stations.
Numerical results show that the propagation path along the geodesic towards H11S (left panels in Figure 6) is blocked partly by the Kermadec Ridge (50 km range) and Lau Ridge (400 km range) and fully by the Fiji island, located around 1400 km from the epicenter. The higher acoustic intensity (or lower TL) at longer ranges than 2500 km beyond the blocking obstacles is caused by horizontal reflection and diffraction. Indeed, strong focusing, reflection, refraction, and diffraction effects can be seen between the epicenter and H11S, which are clearly induced by bathymetric changes (see the top and second panels of Figure 6). Although depth-integrated sound intensity plots do not provide information about how TL changes with depth, they help identify the occurrence of horizontal reflection along the propagation path. Modeled TL changes with depth can be seen in the bottom panels of Figure 6. At H11S, TL at 740 m depth (mean depth of hydrophone triplet) is 158.17 dB. The average TL between 720 and 760 m depth equals 158.23 dB. Averaging TL results in depth around a receiver could be used to compensate for uncertainties in sound speed profile and receiver location (Harrison and Nielsen, 2007).
Numerical results support the hypothesis that the observed substantial deviation between the arrival azimuths and the geodesic path at H11S is due to an acoustic blockage along the geodesic path between the earthquake epicenters and HA11. Moreover, depth-integrated results support the hypothesis that T-waves generated near the epicenter could travel in the water through the Havre Trough and Lau Basin (see Figure 1 for the location of bathymetric features) while trapped between the Colville-Lau Ridge and Kermadec-Tonga Ridge.
Numerical results reveal higher TL between epicenter-H11S (5583 km) than epicenter-H03S (8984 km), which agrees with observations. More specifically, at H03S, TL at 828 m depth (mean depth of hydrophone triplet) and averaged between 808 and 848 m is 102.99 and 102.95 dB, respectively. In the depth-integrated sound intensity plot for H03S is possible to observe horizontal sound focusing and refraction induced by the Louisville seamount chain, which creates some defocusing shadow zone behind the highest seamounts. However, TL levels in the water column along the geodesic path (bottom panel in Figure 6) show that sound can travel between the epicenter and H03S trapped in the SOFAR channel (see the third panel in Figure 6) and without being blocked by the seamounts.
Results presented in section 3 highlight that earthquakes can have a complex directivity pattern (amplitude and phase). Therefore, the 2021 Mw7.4 Kermadec Islands earthquake is not entirely realistic modeled, as a single sound source point placed at the epicenter is considered. Indeed, 3D underwater acoustic studies using PE, normal mode, or ray and beam tracing models (Jensen et al., 2011) have been utilized considering single sound sources placed in the water. Recently, 3D hybrid modeling methods have been proposed (e.g., Lecoulant et al., 2021) to model T-wave generation and propagation in realistic ocean environments. However, this hybrid methodology requires high computational resources limiting the modeled T-wave generation area. On the other hand, 3D PE and normal mode underwater acoustic models only take the forward reflected waves and, therefore, can’t be used to verify backward reflection like the T-waves reflected at the shelf-break offshore Chilean coast and the Antarctic Peninsula.
Overall, the numerical results presented here help investigate key 3D propagation physics of the T-waves triggered near the epicenter of the 2021 Mw7.4 in their path towards H03S and H11S.
5 Conclusions
This paper investigated the long-range megameters underwater sound propagation of T-waves triggered by three powerful earthquakes in the region of the Kermadec Trench (Mw7.4 in 2020) and Kermadec Islands (Mw7.4 and Mw8.1 in 2021), which were recorded at the CTBT-IMS hydrophone stations HA11 (North Pacific), HA03 (South Pacific), and HA10 (South Atlantic).
Different arrivals within the duration of the earthquake signals were identified at the three hydrophone stations. Higher TL in the propagation paths to HA11 than to HA03 and HA10 was observed. Each station presented different T-waves arrival patterns. However, the signals from the 2021 Mw7.4 and Mw8.1 Kermadec Islands earthquakes presented similar arrival patterns at each station and were further analyzed.
At Station H03 (Juan Fernández Islands), results suggest T-waves were converted from seismic waves in a generation zone covering a region up to around 450 km east of the epicenter, including the chain of seamounts in the Louisville Ridge and the Kermadec Trench slope. Apart from the main T-waves generated near the epicenter, later arrivals suggest reflections of the main T-waves at the Chilen’s coast’s shelf-break and the Antarctic Peninsula.
At Station HA10 (Ascension Island), results show the arrival of T-waves propagating from the Pacific to the Atlantic through the Drake Passage. These T-waves are also linked to later arrivals after being reflected at the west coast of Africa. For the Mw8.1 Kermadec Islands earthquake (the stronger earthquake), results suggest the presence of T-waves propagating as acoustic waves in the Pacific, crossing South America as seismic waves after acoustic to seismic energy conversion on the west coast of southern Chile, and converting again into acoustic waves in the Argentine Basin.
At Station HA11 (Wake Island), results highlight the complexity of seismic to acoustic energy conversion in the Kermadec-Tonga region. Strong discrepancies between expected and measured back azimuths were observed at HA11. Results suggest that the main T-waves generated near the epicenter traveled in the water through the Havre Trough and Lau Basin in their way to the North Pacific. Weaker and earlier T-waves seem to indicate seismic to acoustic waves coupling far from the epicenter in the complex bathymetry of seamounts and islands over the Kermadec and Tonga Ridges and Samoa Archipelago. The presence of later arrivals could be due to sound triggered at the same location as the main T-waves but with longer travel paths. Numerical results revealed the importance of blockage and 3D effects mainly induced by the Kermadec-Tonga and Colville-Lau Ridges, and Fiji archipelago on sound propagation to HA11.
This study also suggests that when signals correlate well between earthquakes at the same station, T-wave signal generation can be considered robust and propagation conditions stable. In addition, as signals do not correlate well across stations, the source signal generation and propagation conditions are azimuth-dependent. However, as two different earthquake signals are similar at the same station but different at different stations, it could also indicate we mostly correlate the channel responses and not the source signals. Then, the source signals could be different but excite the same channel frequency band.
For future work, the hypothesis that T-waves from strong submarine earthquakes in the Kermadec region can reach HA10 hydrophones before theoretical arrival times due to South America land crossing should be investigated further. Seismic land-based records in southern Argentina and Chile should be analyzed together with hydroacoustic data from HA10 and the Argentine Basin. Besides that, the existence of long-distance multipaths at the three hydrophone stations can be investigated in more detail due to their potential to monitor ocean temperature changes in the world’s oceans. Also, the back azimuths from the Antarctica Peninsula at HA03 should be sensitive to the sea ice concentration and sea ice edge position, which deserves further study.
The complex propagation path of the T-waves to HA11 also justifies future research. This should be supported by underwater acoustic and seismic field measurements along Kermadec-Tonga Trenches and ridges, Havre Trough, and Lau Basin. Moreover, 3D broadband numerical studies of T-wave generation and propagation (e.g., Lecoulant et al., 2021) should be performed for the region.
Data availability statement
The data analyzed in this study is subject to the following licenses/restrictions: The Preparatory Commission for the Comprehensive Nuclear-Test-Ban Treaty Organization (CTBTO) provided limited access to the hydroacoustic data under the scientific project “3D long-range underwater sound modeling” (contract number vDEC2020-0146, contractor UA, PI Tiago Oliveira). Requests to access these datasets should be directed to https://www.ctbto.org/specials/vdec/.
Author contributions
TO: methodology, data analysis, numerical computation and writing original draft; PN: methodology, data analysis and manuscript revision; Y-TL: propagation physics analysis, numerical computation and manuscript revision; NK: numerical computation and manuscript revision; SMJ: data analysis and manuscript revision. All authors contributed to the article and approved the submitted version.
Funding
The first author thanks FCT/MCTES for the financial support to CESAM (UIDP/50017/2020+UIDB/50017/2020+ LA/P/0094/2020), through national funds. The third author thanks the Office of Naval Research (ONR), USA for their financial support under Grant N00014-21-1-2416.
Acknowledgments
Luís Carvalheiro is acknowledged for his help with computer code compilation on ARGUS-HPC at the University of Aveiro (UA). The authors would like to thank the Preparatory Commission for the Comprehensive Nuclear-Test-Ban Treaty Organization (CTBTO) for providing limited access to the hydroacoustic data under the scientific project “3D long-range underwater sound modeling” (contract number vDEC2020-0146, contractor UA, PI Tiago Oliveira). WHOI creative studio for allowing using the illustration of Kermadec region used in Figure 1.
Conflict of interest
The authors declare that the research was conducted in the absence of any commercial or financial relationships that could be construed as a potential conflict of interest.
Publisher’s note
All claims expressed in this article are solely those of the authors and do not necessarily represent those of their affiliated organizations, or those of the publisher, the editors and the reviewers. Any product that may be evaluated in this article, or claim that may be made by its manufacturer, is not guaranteed or endorsed by the publisher.
Disclaimer
The views expressed in this study are those of the authors and do not necessarily reflect those of the Preparatory Commission for the CTBTO.
References
Bohnenstiehl D., Tolstoy M., Dziak R., Fox C., Smith D. (2002). Aftershock sequences in the mid-ocean ridge environment: An analysis using hydroacoustic data. Tectono-physics 354 (1-2), 49–70. doi: 10.1016/S0040-1951(02)00289-5
Bondár I., Storchak D. (2011). Improved location procedures at the international seismological centre. Geophys. J. Int. 186 (3), 1220–1244. doi: 10.1111/j.1365-246X.2011.05107.x
Bottero A., Cristini P., Komatitsch D. (2020). On the influence of slopes, source, seabed and water column properties on T waves: Generation at shore. Pure Appl. Geophysics 177 (12), 5695–5711. doi: 10.1007/s00024-020-02611-z
Cansi Y. (1995). An automatic seismic event processing for detection and location: The PMCC method. Geophys. Res. Lett. 22, 1021–1024. doi: 10.1029/95GL00468
Cansi Y., Klinger Y. (1997). An automated data processing method for mini-arrays. Newslett. European-Mediterranean Seismological Center 11, 2–4.
Chapp E., Bohnenstiehl D. R., Tolstoy M. (2005). Sound-channel observations of ice-generated tremor in the Indian ocean. Geochemistry Geophysics Geosystems 6 (6), 1–14. doi: 10.1029/2004GC000889
Cummings J. A. (2005). Operational multivariate ocean data assimilation. Quart. J. R. Metereol. Soc 131, 3583–3604. doi: 10.1256/qj.05.105
Dall’Osto D. R. (2019). Source triangulation utilizing three-dimensional arrivals: Application to the search for the ARA San Juan submarine. J. Acoust. Soc. Am. 146 (3), 2104–2112. doi: 10.1121/1.5125251
de Groot-Hedlin C. D. (2005). Estimation of the rupture length and velocity of the great Sumatra earthquake of 26 December 2004 using hydroacoustic signals, Geophys. Res. Lett. 32, L11203. doi: 10.1029/2005GL022695
de Groot-Hedlin C. D. (2020). Seismic T-wave observations at dense seismic networks. Seismological Res. Lett. 91 (6), 3444–3453. doi: 10.1785/0220200208
de Groot-Hedlin C., Blackman D. K., Jenkins C. S. (2009). Effects of variability associated with the Antarctic circumpolar current on sound propagation in the ocean. Geophysical J. Int. 176 (2), 478–490. doi: 10.1111/j.1365-246X.2008.04007.x
Doolittle R., Tolstoy A., Buckingham M. (1988). Experimental confirmation of horizontal refraction of CW acoustic radiation from a point source in a wedge-shaped ocean. J. Acoust. Soc. Am. 83, 2117–2125. doi: 10.1121/1.396392
Duarte C. M., Chapuis L., Collin S. P., Costa D. P., Devassy R. P., Eguiluz V. M., et al. (2021). The soundscape of the anthropocene ocean. Science 371, eaba4658. doi: 10.1126/science.aba4658
Evers L. G., Green D. N., Young N. W., Snellen M. (2013). Remote hydroacoustic sensing of large icebergs in the southern Indian ocean: Implications for iceberg monitoring. Geophysical Res. Lett. 40 (17), 4694–4699. doi: 10.1002/grl.50914
Ewing W. M., Press F., Worzel J. L. (1952). Further study of the T phase. Bull. Seism. Soc Am. 42, 37–51. doi: 10.1785/BSSA0420010037
Ewing W. M., Tolstoy I., Press F. (1950). Proposed use of the T phase in tsunami warning systems. Bull. Seism. Soc Am. 4, 53–58. doi: 10.1785/BSSA0400010053
Fox C. G., Dziak R. P., Matsumoto H., Schreiner A. E. (1993). Potential for monitoring low-level seismicity on the Juan-de-Fuca ridge using military hydrophone arrays. Mar. Technol. Soc. J. 27 (4), 22–30.
Gavrilov A. N., McCauley R. D. (2013). Acoustic detection and long-term monitoring of pygmy blue whales over the continental slope in southwest Australia. J. Acoust. Soc. Am. 134 (3), 2505–2513. doi: 10.1121/1.4816576
Godin O. A. (2021). Contributions of gravity waves in the ocean to T-phase excitation by earthquakes. J. Acoust. Soc. Am. 150 (5), 3999–4017. doi: 10.1121/10.0007283
Graeber F. M., Piserchia P. F. (2004). Zones of T-wave excitation in the NE Indian ocean mapped using variations in backazimuth over time obtained from multi-channel correlation of IMS hydrophone triplet data. Geophysical J. Int. 158 (1), 239–256. doi: 10.1111/j.1365-246X.2004.02301.x
Harris D. V., Miksis-Olds J. L., Vernon J. A., Thomas L. (2018). Fin whale density and distribution estimation using acoustic bearings derived from sparse arrays. J. Acoust. Soc. Am. 143 (5), 2980–2993. doi: 10.1121/1.5031111
Harrison C. H., Nielsen P. L. (2007). Multipath pulse shapes in shallow water: Theory and simulation. J. Acoust. Soc. Am. 121 (3), 1362–1373. doi: 10.1121/1.2434691
Harris P., Sotirakopoulos K., Robinson S., Wang L., Livina V. (2019). A statistical method for the evaluation of long term trends in underwater noise measurements. J. Acoust. Soc. Am. 145 (1), 228–242. doi: 10.1121/1.5084040
Heaney K. D., Prior M., Campbell R. L. (2017). Bathymetric diffraction of basin-scale hydroacoustic signals. J. Acoust. Soc. Am. 141 (2), 878–885. doi: 10.1121/1.4976052
Heyburn R., Bowers D., Green D. (2020). Seismic and hydroacoustic observations from recent underwater events in the south Atlantic ocean. Geophysical J. Int. 223 (1), 289–300. doi: 10.1093/gji/ggaa291
Hildebrand J. A. (2009). Anthropogenic and natural sources of ambient noise in the ocean. Mar. Ecol. Prog. Ser. 395, 5–20. doi: 10.3354/meps08353
Jensen F. B., Kuperman W. A., Porter M. B., Schmidt H. (2011). Computational ocean acoustics (Berlin: Springer Science and Business Media).
Kosuga M. (2011). Localization of T-wave energy on land revealed by a dense seismic network in Japan. Geophys. J. Int. 187, 338–354. doi: 10.1111/j.1365-246X.2011.05143.x
Kushida N., Lin Y., Nielsen P., Le Bras R. (2020). “Acceleration in acoustic wave propagation modelling using OpenACC/OpenMP and its hybrid for the global monitoring system,” in Accelerator programming using directives, WACCPD 2019, lecture notes in computer science, vol. vol. 12017 . Eds. Wienke S., Bhalachandra S. (Cham: Springer).
Lawrence M. W., Grenard P. (1998). “Hydroacoustic monitoring system for the comprehensive nuclear-Test-Ban treaty,” in IEEE Oceanic Engineering Society. OCEANS'98. Conference Proceedings, 2. 694–697), Cat. No. 98CH36259.
Lecoulant J., Oliveira T. C. A., Lin Y.-T. (2021). Three-dimensional modeling of T-waves generation and propagation from a south mid-Atlantic ridge earthquake. J. Acoust. Soc. Am. 150, 3807–3824. doi: 10.1121/10.0007072
Leroy E. C., Royer J. Y., Alling A., Maslen B., Rogers T. L. (2021). Multiple pygmy blue whale acoustic populations in the Indian ocean: Whale song identifies a possible new population. Sci. Rep. 11 (1), 1–21. doi: 10.1038/s41598-021-88062-5
Lin Y.-T., Duda T. F., Newhall A. E. (2013). Three-dimensional sound propagation models using the parabolic-equation approximation and the split-step Fourier method. J. Comp. Acoust. 21, 1250018. doi: 10.1142/S0218396X1250018X
Linehan S. J. D. (1940). Earthquakes in the West Indian region. Trans. Am. Geophysical Union 21, 229–232. doi: 10.1029/TR021i002p00229
Mackenzie K. V. (1981). Nine-term equation for sound speed in the oceans. J. Acoust. Soc. Am. 70, 807–812. doi: 10.1121/1.386920
Matoza R. S., Fee D., Assink J. D., Iezzi A. M., Green D. N., Kim K., et al. (2022). Atmospheric waves and global seismoacoustic observations of the January 2022 hunga eruption, Tonga. Science. 377 (6601), 95–100. doi: 10.1126/science.abo7063
Matsumoto H., Haralabus G., Zampolli M., Özel N. M. (2016b). T-Phase and tsunami pressure waveforms recorded by near-source IMS water-column hydrophone triplets during the 2015 Chile earthquake. Geophysical Res. Lett. 43 (24), 12–511. doi: 10.1002/2016GL071425
Matsumoto H., Haralabus G., Zampolli M., Yamada T., Prior M. K. (2016a). Analysis of T-phase and tsunami signals associated with the 2011 tohoku earthquake acquired by CTBT water-column hydrophone triplets. J. Jpn Soc. Civ Eng Ser. B2 (Coast Eng) 72, 337–342. doi: 10.2208/kaigan.72.I_337
Metz D., Watts A. B., Grevemeyer I., Rodgers M. (2018). Tracking submarine volcanic activity at monowai: Constraints from long-range hydroacoustic measurements. J. Geophysical Research: Solid Earth 123 (9), 7877–7895. doi: 10.1029/2018JB015888
Miksis-Olds J. L., Nieukirk S. L., Harris D. V. (2018). Two unit analysis of Sri Lankan pygmy blue whale song over a decade. J. Acoust. Soc. Am. 144 (6), 3618–3626. doi: 10.1121/1.5084269
Munk W. H., Spindel R. C., Baggeroer A., Birdsall T. G. (1994). The heard island feasibility test. J. Acoust. Soc. Am. 96 (4), 2330–2342. doi: 10.1121/1.410105
Munk W., Wunsch C. (1979). Ocean acoustic tomography: A scheme for large scale monitoring. Deep Sea Res. Part A. Oceanographic Res. Papers 26 (2), 123–161. doi: 10.1016/0198-0149(79)90073-6
Nielsen P. L., Zampolli M., Le Bras R., Mialle P., Bittner P., Poplavskiy A., et al. (2021a). CTBTO’s data and analysis pertaining to the search for the missing Argentine submarine ARA San Juan. Pure Appl. Geophysics 178 (7), 2557–2577. doi: 10.1007/s00024-020-02445-9
Nielsen P. L., Zampolli M., Le Bras R., Mialle P., Haralabus G. (2021b). A self-consistent estimate of the CTBT IMS hydrophone locations using scientific airgun data from the CEVICHE trial (Chile). CTBT science and technology conference 2021 (SnT2021). P1.3–P284.
Okal E. A. (2008). The generation of T waves by earthquakes. Adv. Geophys. 12, 1–14. doi: 10.1016/S0065-2687(07)49001-X
Okal E. A., Alasset P. J., Hyvernaud O., Schindelé F. (2003). The deficient T waves of tsunami earthquakes. Geophys. J. Int. 152, 416–432. doi: 10.1046/j.1365-246X.2003.01853.x
Okal E. A., Talandier J., Reymond D. (2007). Quantification of hydrophone records of the 2004 Sumatra tsunami. Pure Appl. Geophysics 164 (2), 309–323. doi: 10.1007/s00024-006-0165-4
Oliveira T. C. A., Kadri U. (2016). Pressure field induced in the water column by acoustic-gravity waves generated from sea bottom motion. J. Geophys. Res. Oceans. 121, 7795–7803. doi: 10.1002/2016JC011742
Oliveira T. C. A., Lin Y.-T. (2019). Three-dimensional global scale underwater sound modeling: The T-phase wave propagation of a southern mid-Atlantic ridge earthquake. J. Acoust. Soc. Am. 146 (3), 2124–2135. doi: 10.1121/1.5126010
Oliveira T. C. A., Lin Y.-T., Kushida N., Jesus S., Nielsen P. (2021). T-Wave propagation from the pacific to the Atlantic: The 2020 Mw7.4 kermadec trench earthquake case. JASA Express Letters. 1 (12), 12600. doi: 10.1121/10.0008939
Pinto N. R., Chandrayadula T. K. (2021). Long-term frequency changes of a potential baleen whale call from the central Indian ocean during 2002–2019. JASA Express Lett. 1 (2), 021201. doi: 10.1121/10.0003444
Robinson S., Harris P., Cheong S., Wang L., Livina V. (2021). “Investigation of trends in ocean noise determined from the ctbto hydroacoustic stations, including during the 2020 covid-19 lockdown period,” in SnT 2021, (Vienna, Austria:CTBT Science and Technology Conference). Available at: https://conferences.ctbto.org/event/7/contributions/862/.
Romano F., Gusman A. R., Power W., Piatanesi A., Volpe M., Scala A., et al. (2021). Tsunami source of the 2021 MW 8.1 raoul island earthquake from DART and tide-gauge data inversion. Geophysical Res. Lett. 48 (17), e2021GL094449. doi: 10.1029/2021GL094449
Schwardt M., Pilger C., Gaebler P., Hupe P., Ceranna L. (2022). Natural and anthropogenic sources of seismic, hydroacoustic, and infrasonic waves: Waveforms and spectral characteristics (and their applicability for sensor calibration). Surveys Geophysics, 43, 1265–1361. doi: 10.1007/s10712-022-09713-4
Stephen R. A., Bolmer S. T., Worcester P. F., Dzieciuch M. A., Udovydchenkov I. A. (2019). Three-dimensional bottom diffraction in the north pacific. J. Acoust. Soc. Am. 146, 1913–1922. doi: 10.1121/1.5125427
Stevens J. L., Hanson J., Nielsen P., Zampolli M., Le Bras R., Haralabus G., et al. (2021). Calculation of hydroacoustic propagation and conversion to seismic phases at T-stations. Pure Appl. Geophysics 178 (7), 2579–2609. doi: 10.1007/s00024-020-02556-3
Talandier J., Okal E. A. (1979). Human perception of T waves: The June 22, 1977 Tonga earthquake felt on Tahiti. Bull. Seismological Soc. America 69 (5), 1475–1486. doi: 10.1785/BSSA0690051475
Talandier J., Okal E. A. (1998). On the mechanism of conversion of seismic waves to and from T waves in the vicinity of island shores. Bull. Seismological Soc. America 88 (2), 621–632. doi: 10.1785/BSSA0880020621
Thomson D. J., Chapman N. R. (1983). A wide-angle split-step algorithm for the parabolic equation. J. Acoust. Soc. Am. 74, 1848–1854.
Tolstoy M., Bohnenstiehl D. R. (2005). Hydroacoustic constraints on the rupture duration, length, and speed of the great Sumatra-Andaman earthquake. Seismol. Res. Lett. 76, 419–425. doi: 10.1785/gssrl.76.4.419
Tozer B., Sandwell D. T., Smith W. H., Olson C., Beale J. R., Wessel P. (2019). Global bathymetry and topography at 15 arc sec: SRTM15+. Earth Space Sci. 6, 1847–1864. doi: 10.1029/2019EA000658
USGS (2021a) Earthquake hazards program. Available at: https://earthquake.usgs.gov/earthquakes/eventpage/us6000ae4n/executive.
USGS (2021b) Earthquake hazards program. Available at: https://earthquake.usgs.gov/earthquakes/eventpage/us7000dfk3/executive.
USGS (2021c) Earthquake hazards program. Available at: https://earthquake.usgs.gov/earthquakes/eventpage/us7000dflf/executive.
Vergoz J., Cansi Y., Cano Y., Gaillard P. (2021). Analysis of hydroacoustic signals associated to the loss of the Argentinian ARA San Juan submarine. Pure Appl. Geophysics 178 (7), 2527–2556. doi: 10.1007/s00024-020-02625-7
Williams C. M., Stephen R. A., Smith D. K. (2006). Hydroacoustic events located at the intersection of the Atlantis (30° n) and Kane (23° 40′ n) transform faults with the mid-Atlantic ridge. Geochemistry Geophysics Geosystems 7 (6), 1–28. doi: 10.1029/2005GC001127
Wu W., Zhan Z., Peng S., Ni S., Callies J. (2020). Seismic ocean thermometry. Science 369 (6510), 1510–1515. doi: 10.1126/science.abb9519
Keywords: underwater soundscape, 3DPE, CTBT-IMS, passive acoustics, DTK-GPMCC, submarine earthquake
Citation: Oliveira TCA, Nielsen P, Lin Y-T, Kushida N and Jesus SM (2022) Megameter propagation and correlation of T-waves from Kermadec Trench and Islands. Front. Mar. Sci. 9:1009013. doi: 10.3389/fmars.2022.1009013
Received: 01 August 2022; Accepted: 17 October 2022;
Published: 15 November 2022.
Edited by:
Won Sang Lee, Korea Polar Research Institute, South KoreaReviewed by:
Sungwon Shin, Hanyang Universiy, Erica, South KoreaHiroyuki Matsumoto, Japan Agency for Marine-Earth Science and Technology (JAMSTEC), Japan
Copyright © 2022 Oliveira, Nielsen, Lin, Kushida and Jesus. This is an open-access article distributed under the terms of the Creative Commons Attribution License (CC BY). The use, distribution or reproduction in other forums is permitted, provided the original author(s) and the copyright owner(s) are credited and that the original publication in this journal is cited, in accordance with accepted academic practice. No use, distribution or reproduction is permitted which does not comply with these terms.
*Correspondence: Tiago C. A. Oliveira, toliveira@ua.pt