Evaluating ecosystem-based management alternatives for the Puget Sound, U.S.A. social-ecological system using qualitative watershed models
 Caitlin L. Magel
 Tessa B. Francis
- Puget Sound Institute, University of Washington Tacoma, Tacoma, WA, United States
Population growth and the associated transformation of landscapes is a major management challenge for coastal ecosystems. Coastal conservation and management should be guided by social, cultural, economic, and ecological objectives, but integrative decision support tools appropriate for complex ecosystems remain underutilized. Evaluating alternative policies for objectives that span the interconnected terrestrial, freshwater, and estuarine habitats along coastlines is limited by the lack of appropriate quantitative tools and available data. We employed qualitative network models (QNMs) to evaluate multi-benefit outcomes of potential management interventions to address population growth and development using a case study of Puget Sound – a large, urbanized fjord-type estuary in Washington, U.S.A. With input from regional scientists and stakeholders, we developed a base conceptual model of the links among human stressors and ecosystem components across the terrestrial-freshwater-estuarine gradient of a generalized Puget Sound watershed. We simulated scenarios representing alternative strategies for accommodating human population growth, namely new development outside of urban centers versus redevelopment (densification) within urban centers, and characterized the responses of multiple recovery objectives and ecosystem stressors for each scenario. Of the urban redevelopment scenarios, reducing stormwater runoff and increasing green infrastructure provided the most favorable outcomes. On rural lands, limiting new development to existing transportation corridors and iincreasing floodplain and riparian habitat extent concomitant with new development produced similar outcomes. Moderate levels of coordinated interventions on both urban and rural lands had favorable outcomes for more ecosystem objectives compared to either moderate intervention applied separately. This study demonstrates the value of qualitative tools for cross-habitat evaluations of possible futures in complex ecosystem-based management systems.
Introduction
Conversion of landscapes and other activities associated with increasing human populations have dramatically degraded the structure and function of coastal and estuarine ecosystems. The impact of ecosystem degradation and loss of services is outsized for coasts and estuaries because approximately 40% of humans live along coastlines both in the U.S. and worldwide (NOAA, 2013; Sale et al., 2014). The loss of important ecosystem functions, habitats, and species has highlighted the importance of coastal ecosystem services for human quality of life (Barbier et al., 2011; Arkema et al., 2015). Efforts to protect and restore coastal watersheds and estuaries have accelerated but recovery efforts have had variable success (Lotze et al., 2006; Cloern et al., 2016; Green et al., 2021). This task remains challenging in part because of the tight linkages between the land and sea along coasts, which expose estuarine and coastal species and ecosystems to multiple (often synergistic) threats from changes to terrestrial, freshwater, and ocean environments (Kennish, 2002; 2021).
Streams and rivers are essential corridors for water, species, sediment, human activities, and other constituents of coastal watersheds. In heavily urbanized and agricultural watersheds, stormwater runoff (rain and melted snow) accumulates pollutants, such as bacteria, toxics, and excess nutrients, as it flows over landscapes en route to receiving waters, causing cascading impacts across the freshwater-estuarine gradient (Kennish, 2002; Hodgson et al., 2020). The quantity and toxicity of stormwater runoff is exacerbated by impervious surfaces and land conversion, and stormwater is the fastest growing cause of water quality degradation in coastal systems (Walsh et al., 2005; McCarthy et al., 2008).
Management actions to address stormwater impacts span a wide range of options from preservation of undeveloped land, such as floodplains and wetlands, to urban restoration approaches, such as elaborate gray (e.g., stormwater vaults or ponds) and green (e.g., stormwater parks, green roofs and buildings, or bioswales) infrastructure. One analysis showed that addressing stormwater runoff from major urban areas of the U.S. West Coast (just 1.3% of total land area) has the potential to reduce pollutant loading to the California Current marine ecosystem by 70% (Levin et al., 2020). A focus on restoration and redevelopment (i.e., renovation of old buildings or roads and associated infrastructure) in existing urban and industrial areas could address legacy issues such as sites of accumulated and lingering toxic contamination and deficient runoff or wastewater management that continue to plague recovery efforts (Connor et al., 2007). At the same time, mitigation and preservation actions in rural and exurban areas may also be needed, particularly where there is high pressure for land conversion to accommodate increasing human population or reduced management of pollutants outside of urban centers. Many coastal watersheds in the U.S.A., including Puget Sound, are simultaneously grappling with a long history of environmental degradation and ongoing development associated with human population growth in urban, ex-urban (distinct semi-rural transition zones at the edge of denser urban development), and rural areas (Jantz et al., 2005; Hepinstall-Cymerman et al., 2013). With dense and growing coastal human populations (Sale et al., 2014; Neumann et al., 2015) and limited resources, it is necessary to prioritize recovery actions guided by conservation metrics and preferred outcomes (Ettinger et al., 2021).
Managers and policy makers are often trying to balance multiple, diverse outcomes over large areas. Restoration and preservation interventions address stressors that, while spatially distributed, are connected across the ecosystem via the flow of water, species, and ecosystem services. Therefore, each intervention has the potential to directly and indirectly influence multiple biophysical and human wellbeing outcomes or have unintended system feedbacks. For example, green infrastructure projects are some of the most effective approaches for mitigating impacts of urban stormwater and simultaneously provide co-benefits for human health and wellbeing (Brink et al., 2016). However, urban greening might not be the best approach depending on the primary recovery outcomes of interest. For example, Ettinger et al. (2021) found that restoration actions such as greening in highly urbanized areas are unlikely to provide strong benefits to priority species, e.g., native salmonids, though they may support human wellbeing. Determining effective strategies and tradeoffs among ecosystem objectives requires an understanding of where the system stressors occur, how the system components are interconnected across the terrestrial-estuarine gradient, and anticipated outcomes of management interventions (Wilson et al., 2009). Integrative decision support tools are needed to direct efficient and effective management actions based on potential outcomes in complex social-ecological settings with multiple objectives.
Quantitative ecosystem models used for directing management actions in estuaries are growing in their use and sophistication [e.g., San Francisco Bay-Delta model (Martyr-Koller et al., 2017), Chesapeake Bay Program modeling system (Hood et al., 2021), and Salish Sea Model (Khangaonkar et al., 2018)] but where they do exist, they require extensive underlying data and parameterization that precludes their use in data-limited systems (Dambacher et al., 2009). Furthermore, quantitative models that consider both social and ecological aspects of coastal systems are lacking (exceptions include: Fulton et al., 2011; Hollowed et al., 2020; Okamoto et al., 2020). Qualitative modeling approaches offer a less time- and data-intensive alternative and complementary method for modeling data-poor systems where the quantitative relationships that link network components are not known and where the focus is on strategy rather than tactics (Levins, 1974).
Qualitative network models (QNMs) are modeling tools constructed using a conceptual understanding of the interactive relationships (negative, neutral, or positive) that link system components (Levins, 1974; Puccia and Levins, 1985). Because of this, QNMs are particularly useful for the conceptual synthesis of diverse information sources and metrics, such as in social and ecological networks (Dambacher et al., 2015). Essentially operationalized conceptual models, QNMs are used to incorporate system structure and feedbacks and qualitatively evaluate how systems respond to external inputs or influences. Model runs are performed by implementing a press perturbation (an increase or decrease to one or more model variables) and model outputs are predictions of the subsequent directional change in each other variable. Researchers have used QNMs to investigate the dynamics of multiple social-ecological systems along the U.S. West Coast, including assessments of fisheries in the California Current marine ecosystem (Harvey et al., 2016), ecosystem and anthropogenetic drivers of early marine survival of Pacific salmon in Puget Sound (Sobocinski et al., 2018), community impacts of ocean acidification in Willapa Bay, Washington (Reum et al., 2015a), and community-wide responses to bivalve aquaculture in South Puget Sound (Reum et al., 2015b). These diverse, regional applications highlight the flexibility of QNMs, which are well suited to leverage existing information and guide coastal management decisions and future research priorities.
This work was situated within the recovery context of Puget Sound, Washington, U.S.A. (Figure 1), which provides a case study for investigating alternative management interventions in a linked terrestrial-aquatic-estuarine ecosystem and evaluating outcomes across multiple social-ecological objectives. Using information from existing regional recovery plans, we developed a set of QNMs to evaluate how management interventions impact a suite of ecosystem recovery objectives (Figure 2). In our analysis, we compared status quo management strategies against alternative proposed interventions, evaluating each for their impact on social and ecological recovery objectives and ecosystem stressors. We focused specifically on comparing rural and urban development strategies to accommodate rapid current and projected human population growth in the Puget Sound region (PSRC, 2020), with implications for prioritizing preservation versus restoration within watersheds. In addition, within each broad strategy, we explored specific management interventions aimed at limiting the potential negative impacts of development on ecosystem outcomes. Finally, we identified management strategies and system behaviors having outsized influence on preferred recovery outcomes, exemplifying the strengths of qualitative modeling.
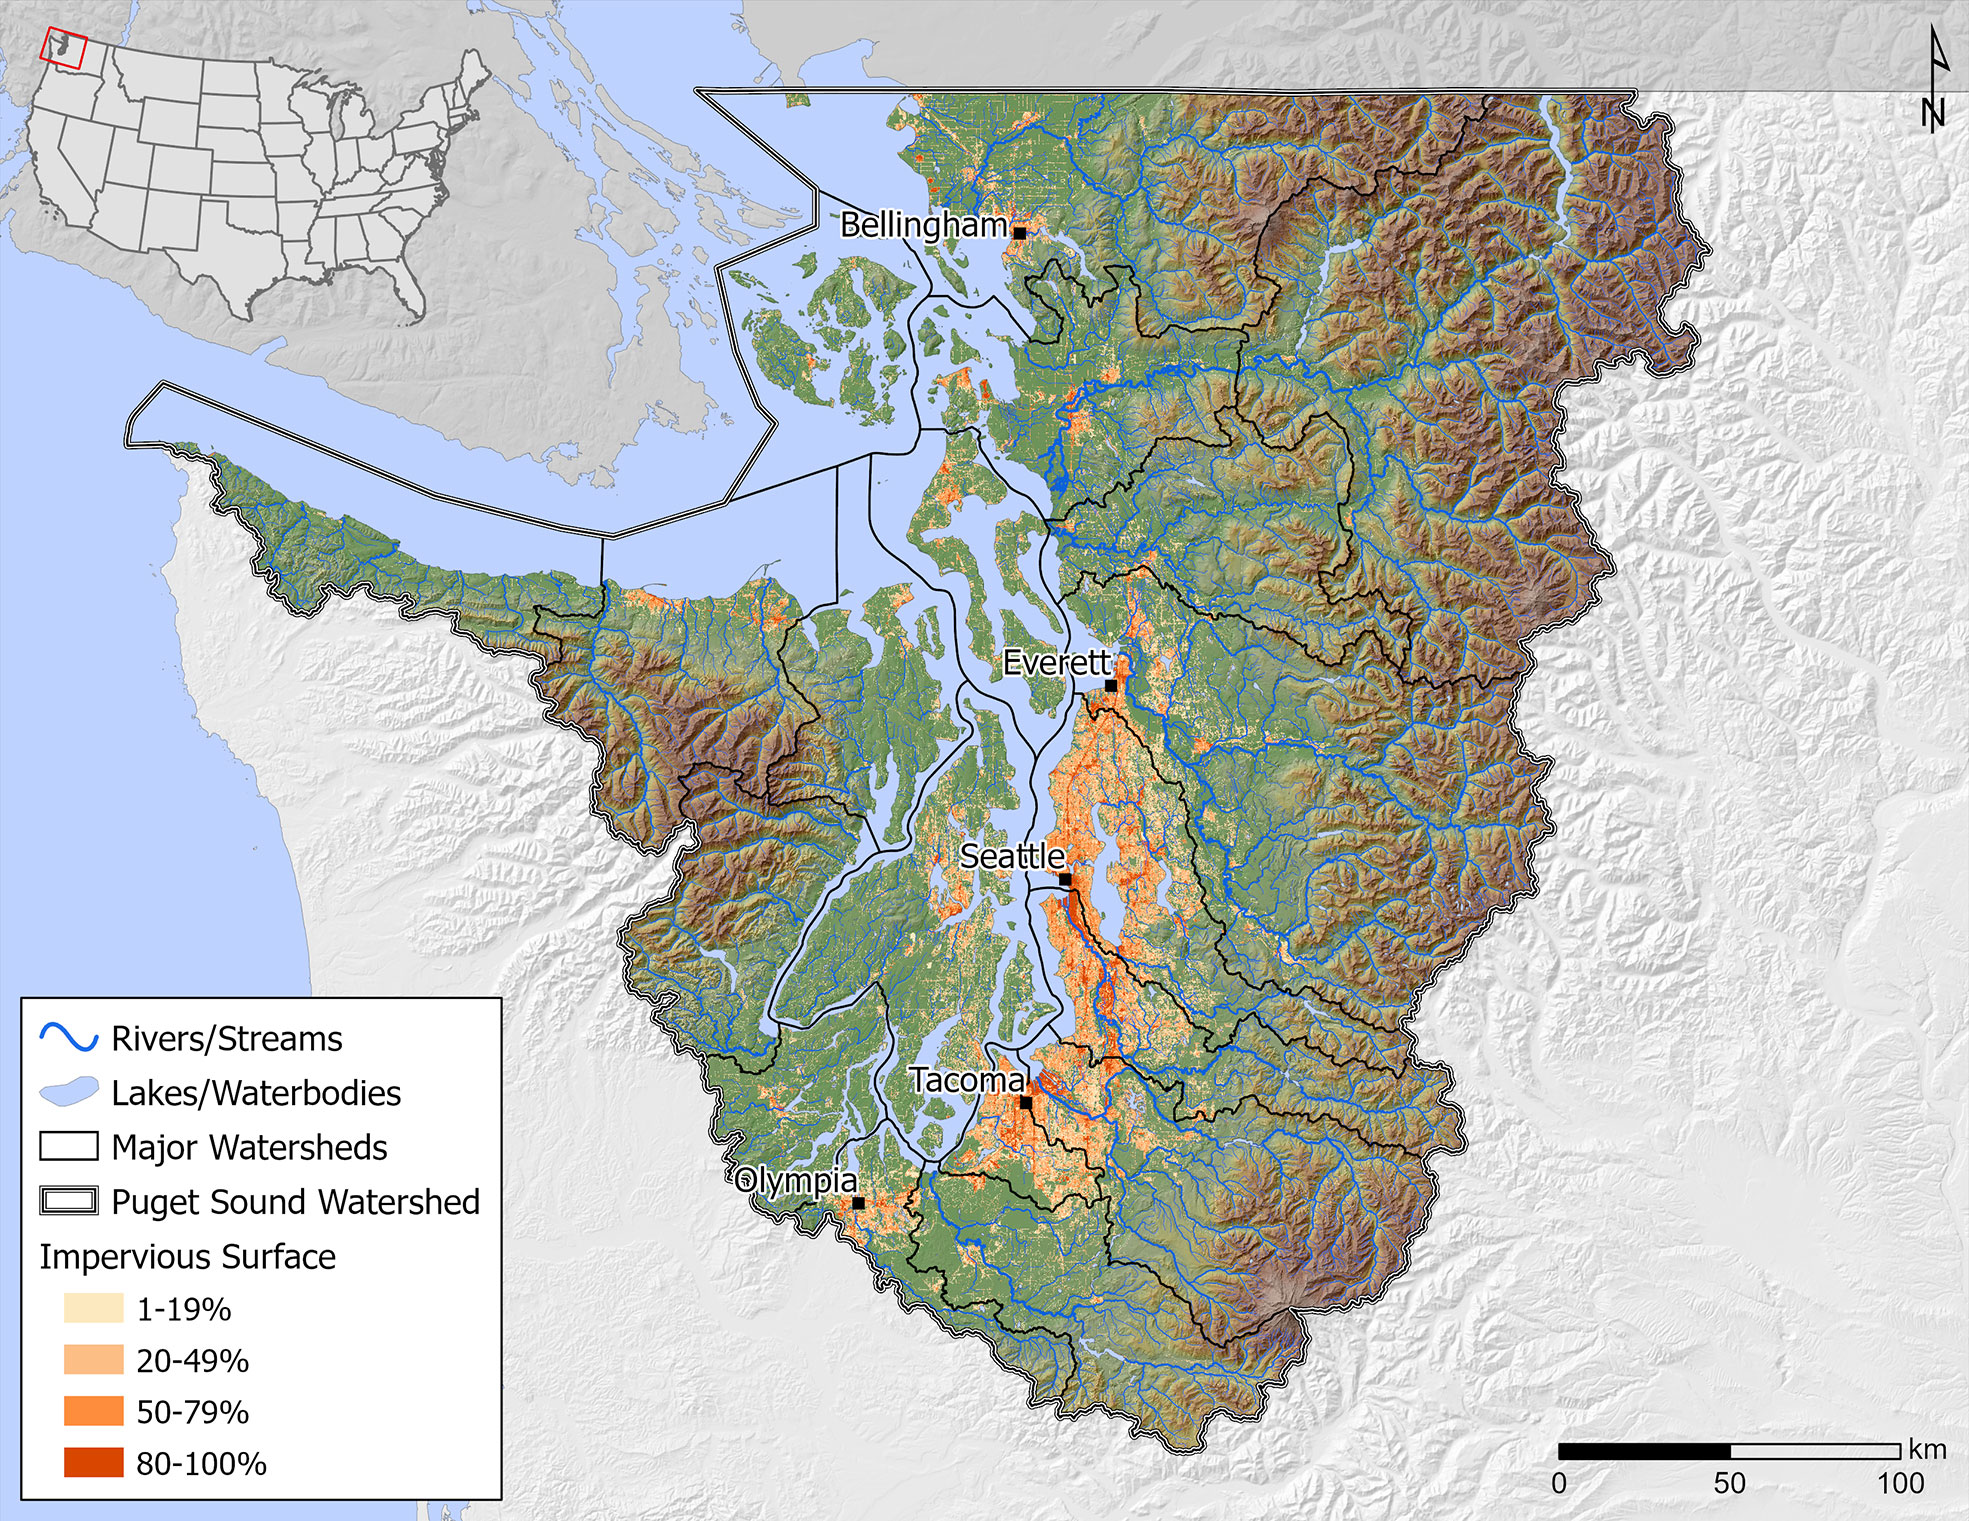
Figure 1 Map of Puget Sound, Washington, U.S.A. with major watershed boundaries outlined in black. Colored shading indicates impervious surface coverage associated with urbanization.
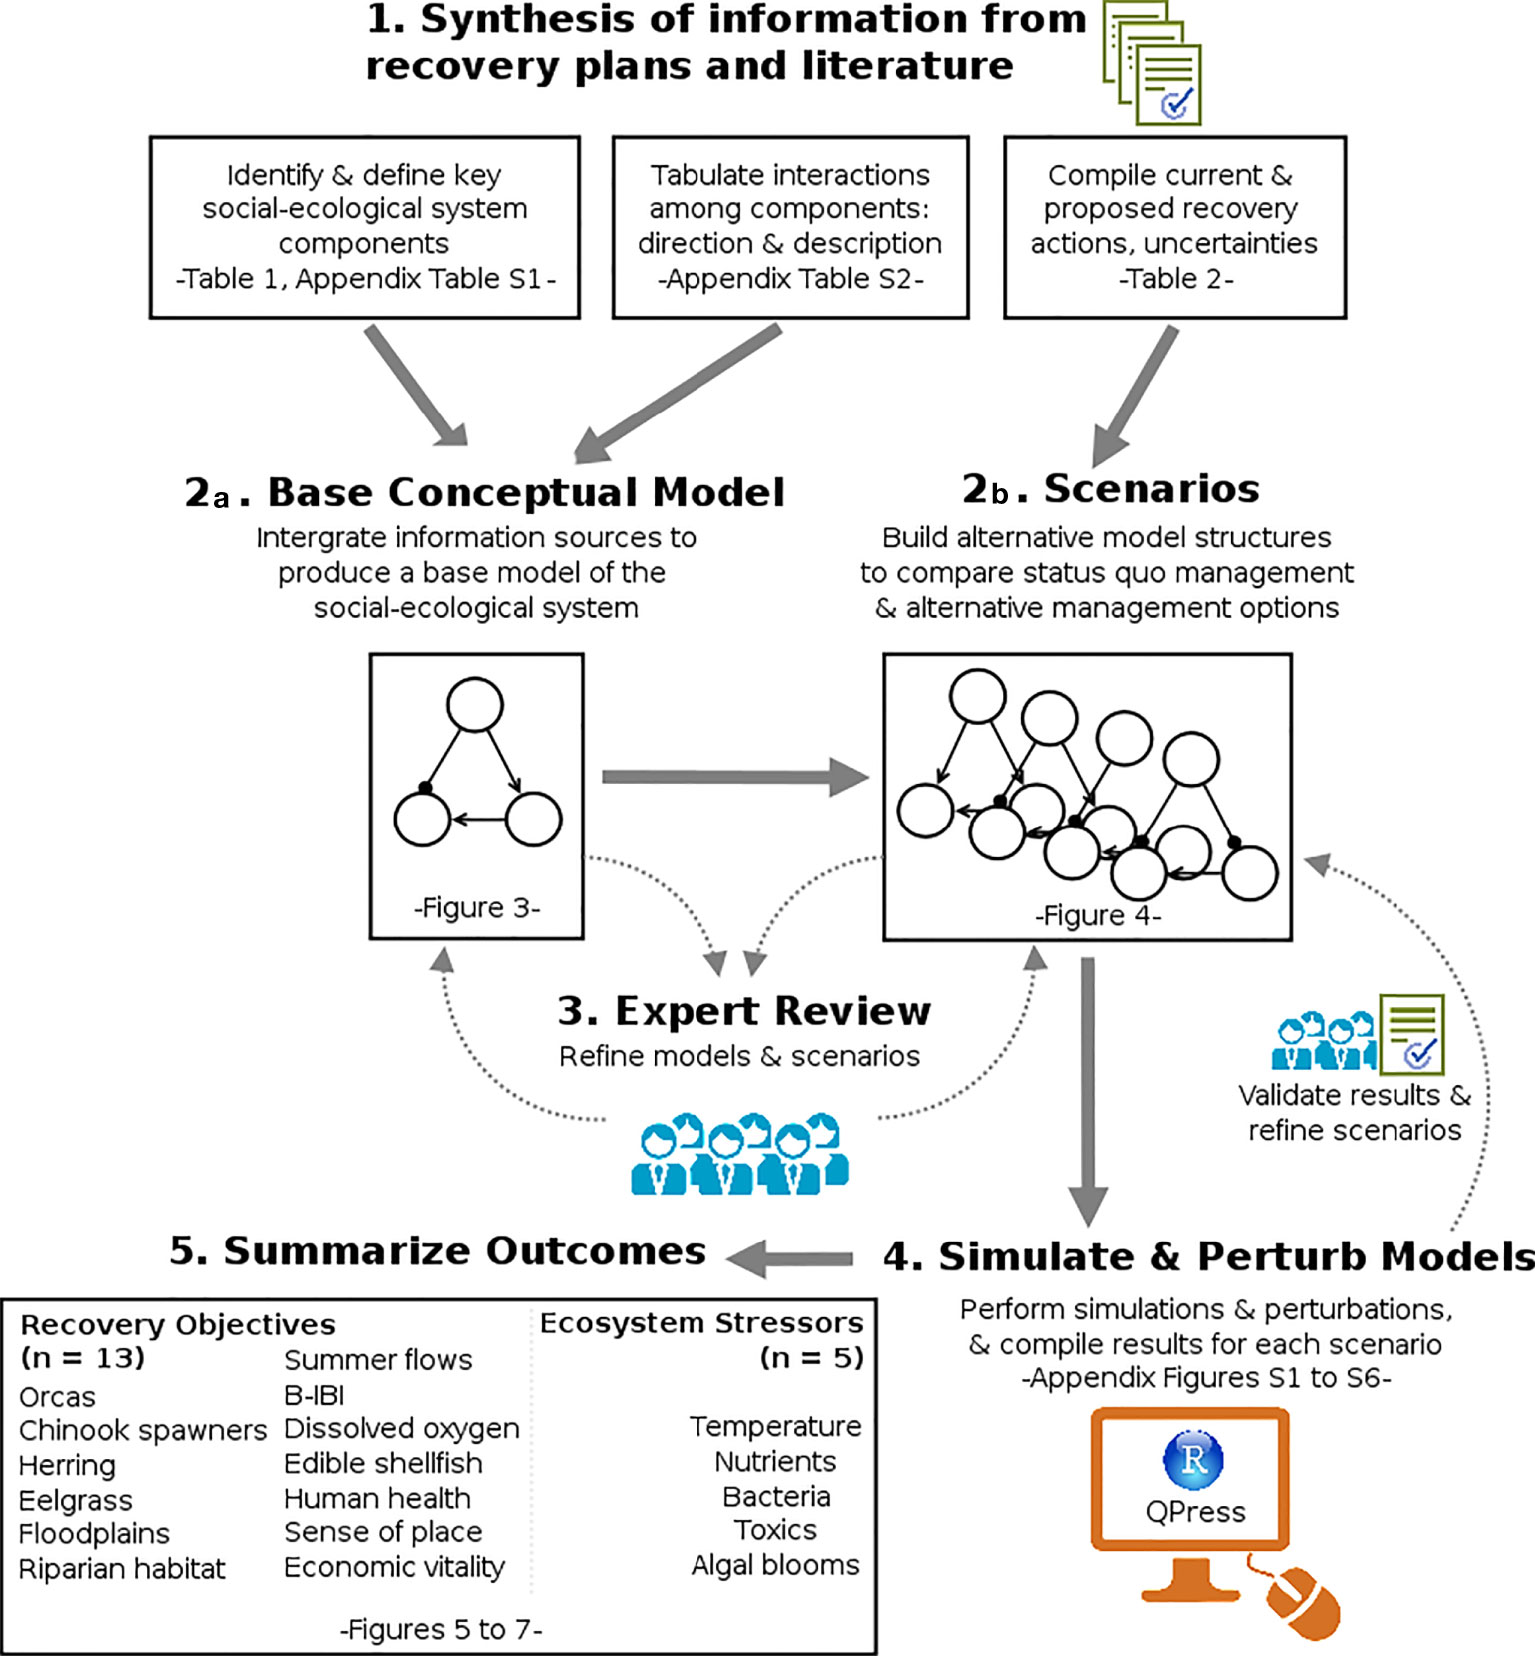
Figure 2 Flow diagram illustrating the process used to build and analyze the Puget Sound QNMs. Symbols courtesy of the Integration and Application Network (ian.umces.edu/symbols/).
Materials and methods
Management context and study setting
Puget Sound is a large fjord-type estuary that covers approximately 2,330 km2 across four marine basins in Washington State, U.S.A. (Burns, 1985) (Figure 1). The region has a rich history of indigenous culture and society that was oriented around the once-abundant natural resources, including salmon, shellfish, and native plants (Ruckelshaus and McClure, 2007). Over the last two centuries, Puget Sound has become highly urbanized with several large commercial ports and more than 60% of the state’s population living within 20 km of the coastline (Shelton et al., 2017). The ecosystem now exhibits many symptoms of environmental degradation such as threatened and endangered species, declining fishery landings, habitat loss, and hypoxia (PSP, 2022). In particular, populations of ecologically and culturally important species including Chinook and coho salmon (Oncorhynchus tshawytscha and O. kisutch, respectively), Pacific herring (Clupea pallasii), and orca whales (Orcinus orca) have experienced dramatic declines (PSP, 2022). Efforts to reverse the degradation have proved challenging, in part because of the complexity of the governance landscape and multiple, often competing, land uses: the 21 major watersheds of Puget Sound cover approximately 35,500 km2 of land that hosts a rapidly growing human population of more than 4 million residents; multiple levels of governance including 12 Washington State counties, 19 tribes, and an international boundary with Canada; a major metropolitan region characterized by a highly urbanized corridor along Puget Sound with extensive suburbs; and a wide range of economically valuable industries, including strong forestry, agricultural, and fishing communities (Ruckelshaus and McClure, 2007). In response, a state agency (Puget Sound Partnership; https://www.psp.wa.gov) was created by the Washington State Legislature in 2007 to coordinate the massive recovery effort. Along with partners, the agency identified 6 broad recovery goals that encompass 25 objectives meant to collectively describe the condition of the Puget Sound social-ecological system (Appendix Table S1; vitalsigns.pugetsoundinfo.wa.gov). While progress has been made, most recovery targets have not been met and development pressures continue to increase (PSP, 2022).
This project benefited from a separate extensive effort, conducted over multiple years by experts in the Puget Sound region, to build a collective foundational scientific and policy understanding to inform recovery plans for specific ecosystem objectives (https://www.psp.wa.gov/implementation-strategies.php). Interdisciplinary teams, comprised of local and regional technical, professional, and policy experts, developed 16 conceptual models that describe the connections between drivers, stressors, other ecological attributes, and Puget Sound biophysical recovery objectives (Appendix Table S1; https://www.miradishare.org/ux/project/psp-pugetsoundrecover-2019-00057). Additionally, for a subset of biophysical recovery objectives (n = 9), teams produced more detailed recovery plans that include summaries of the best available science, descriptions of the relevant programmatic and regulatory context, and causal models linking potential management actions to desired outcomes (Appendix Table S1). These plans represent a shared foundational understanding about the science and policy context surrounding each individual recovery objective, and outline the specific approaches and activities expected to achieve them. However, these documents rarely explicitly address ecosystem interactions and feedbacks that may affect ecosystem outcomes or potential tradeoffs among recovery objectives implicated in the proposed management interventions. Additionally, research and monitoring to understand the human dimensions of ecosystem recovery and management interventions trails behind that of the biophysical dimensions in Puget Sound, as in other systems. While recovery plans for the human dimension objectives have not yet been produced, there is a growing body of work on which to base hypotheses about those relationships (https://www.psp.wa.gov/social-science-research.php) and QNMs are well-suited for testing these hypotheses. The present study was undertaken in part to address these gaps in understanding the integrative impact of management actions on the social-ecological system, and builds upon material previously developed for the conceptual models, recovery plans, and guidance documents, which provided: 1) the basis for a conceptual model representing how ecosystem stressors and recovery objectives are connected across the Puget Sound social-ecological system, and 2) proposed management interventions that were the impetus for the alternative scenarios we investigated using the model (Figure 2).
Conceptual models
Using information contained within the previously developed conceptual models and recovery plans, we first developed a “base” network model, or causal loop diagram, in which a subset of recovery objectives and other key components of the Puget Sound social-ecological system (Table 1) are represented as boxes (termed “nodes”) connected by directed links (Figure 3). Links represent the qualitative relationships (positive or negative) between nodes, as described in recovery plan documents (Appendix Table S2). Published literature and expert review by natural and social scientists, policy experts, and natural resource managers (~20) were used to refine the final model structure, though these changes were relatively minor, and where information was limited, links included in the model, and their signs, reflect hypotheses about system behavior (Appendix Table S2). QNMs are, by nature, simplifications of systems, and there are tradeoffs between network complexity and prediction accuracy or interpretability of results (Harvey et al., 2016; Szymkowiak and Rhodes-Reese, 2021) – a common challenge in all ecosystem modeling (Link et al., 2012). Therefore, we had to limit the number of nodes contained in the base model such that system dynamics were accurately represented, but only the most important variables for describing those dynamics were included, based on existing information. The model describes a generalized Puget Sound watershed, where activities on rural and urbanized lands influence freshwater conditions that, in turn, impact habitats and species in Puget Sound (Figure 3). This base model structure was intended to represent conditions under current management, or “status quo” management. The base model served as the foundation for creating alternative networks for use in simulating proposed management interventions that differ from status quo management and testing additional hypotheses about system dynamics.
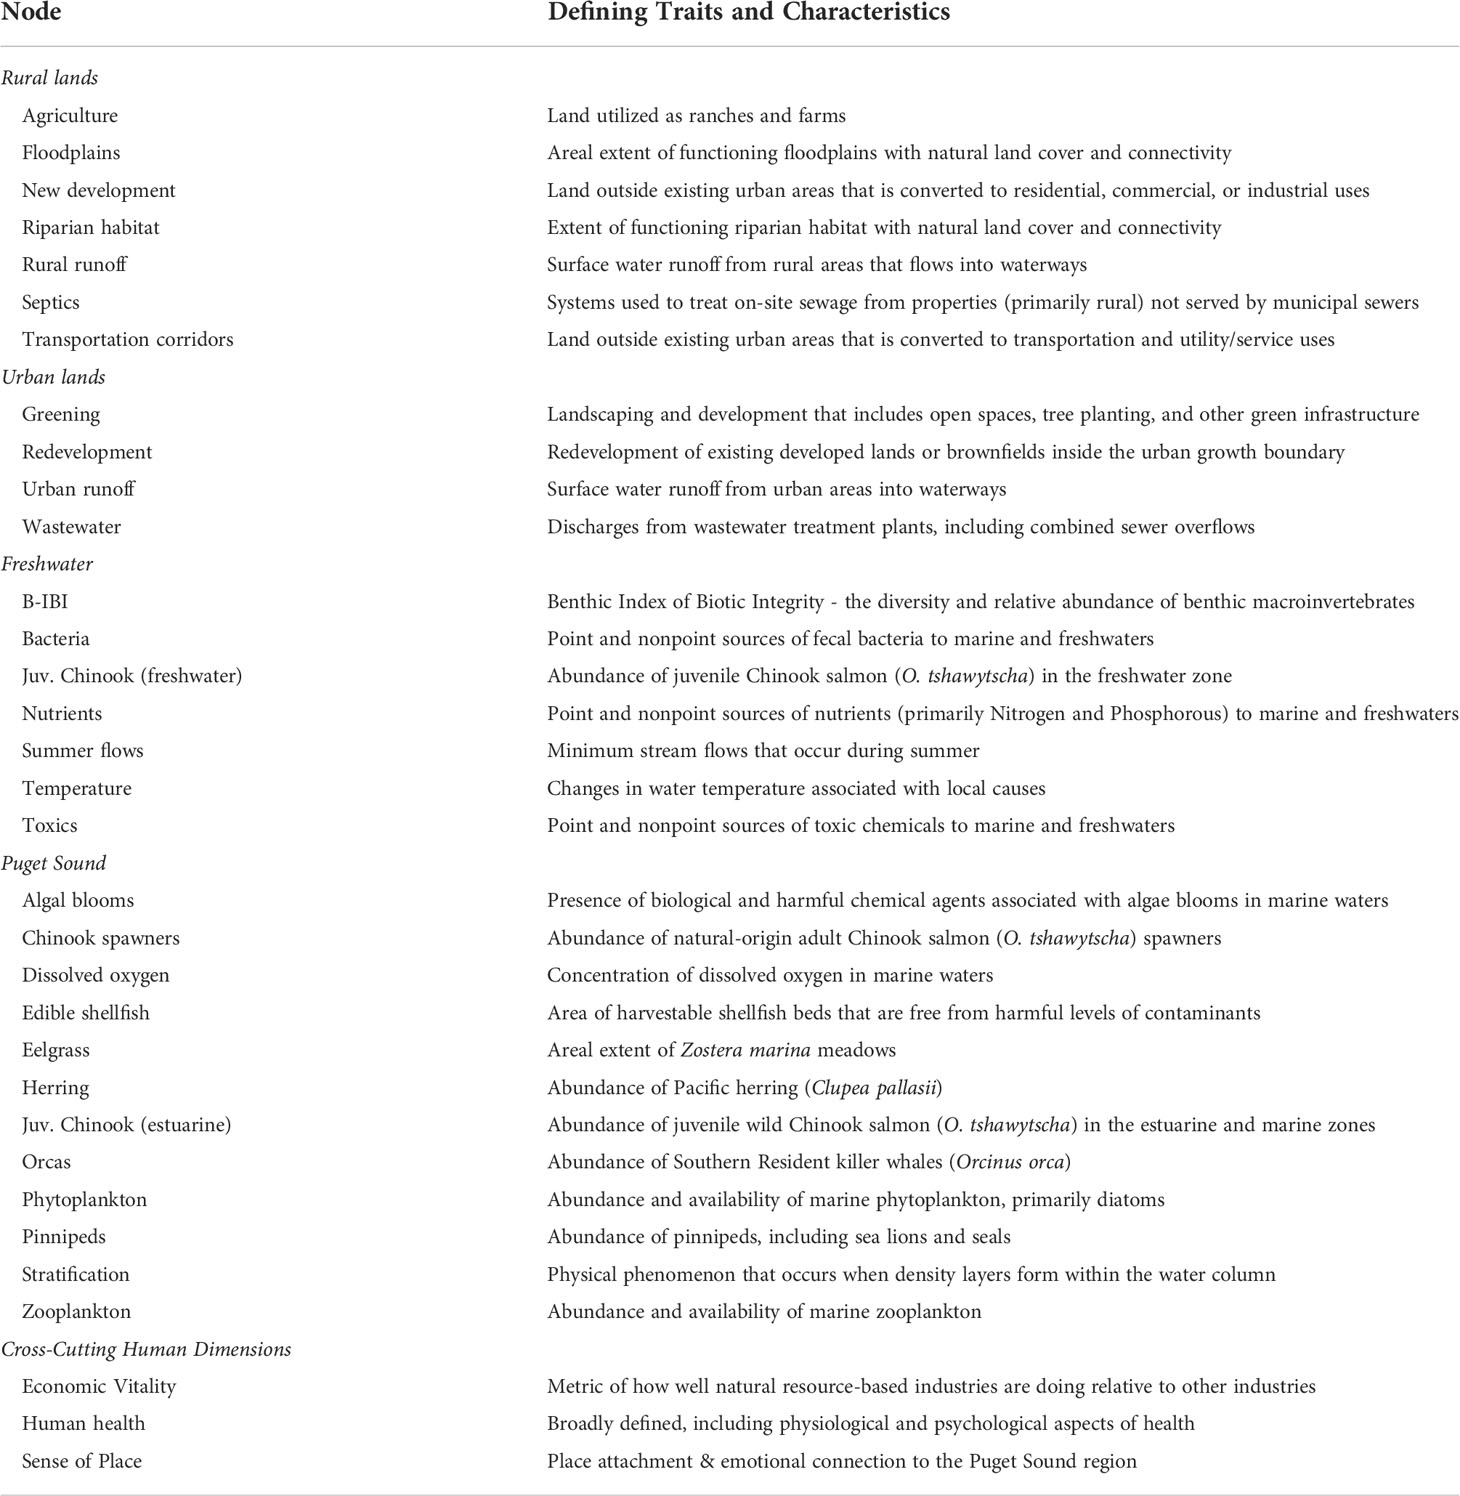
Table 1 Description and defining traits of each node (n = 33) in the base qualitative network model (Figure 3).
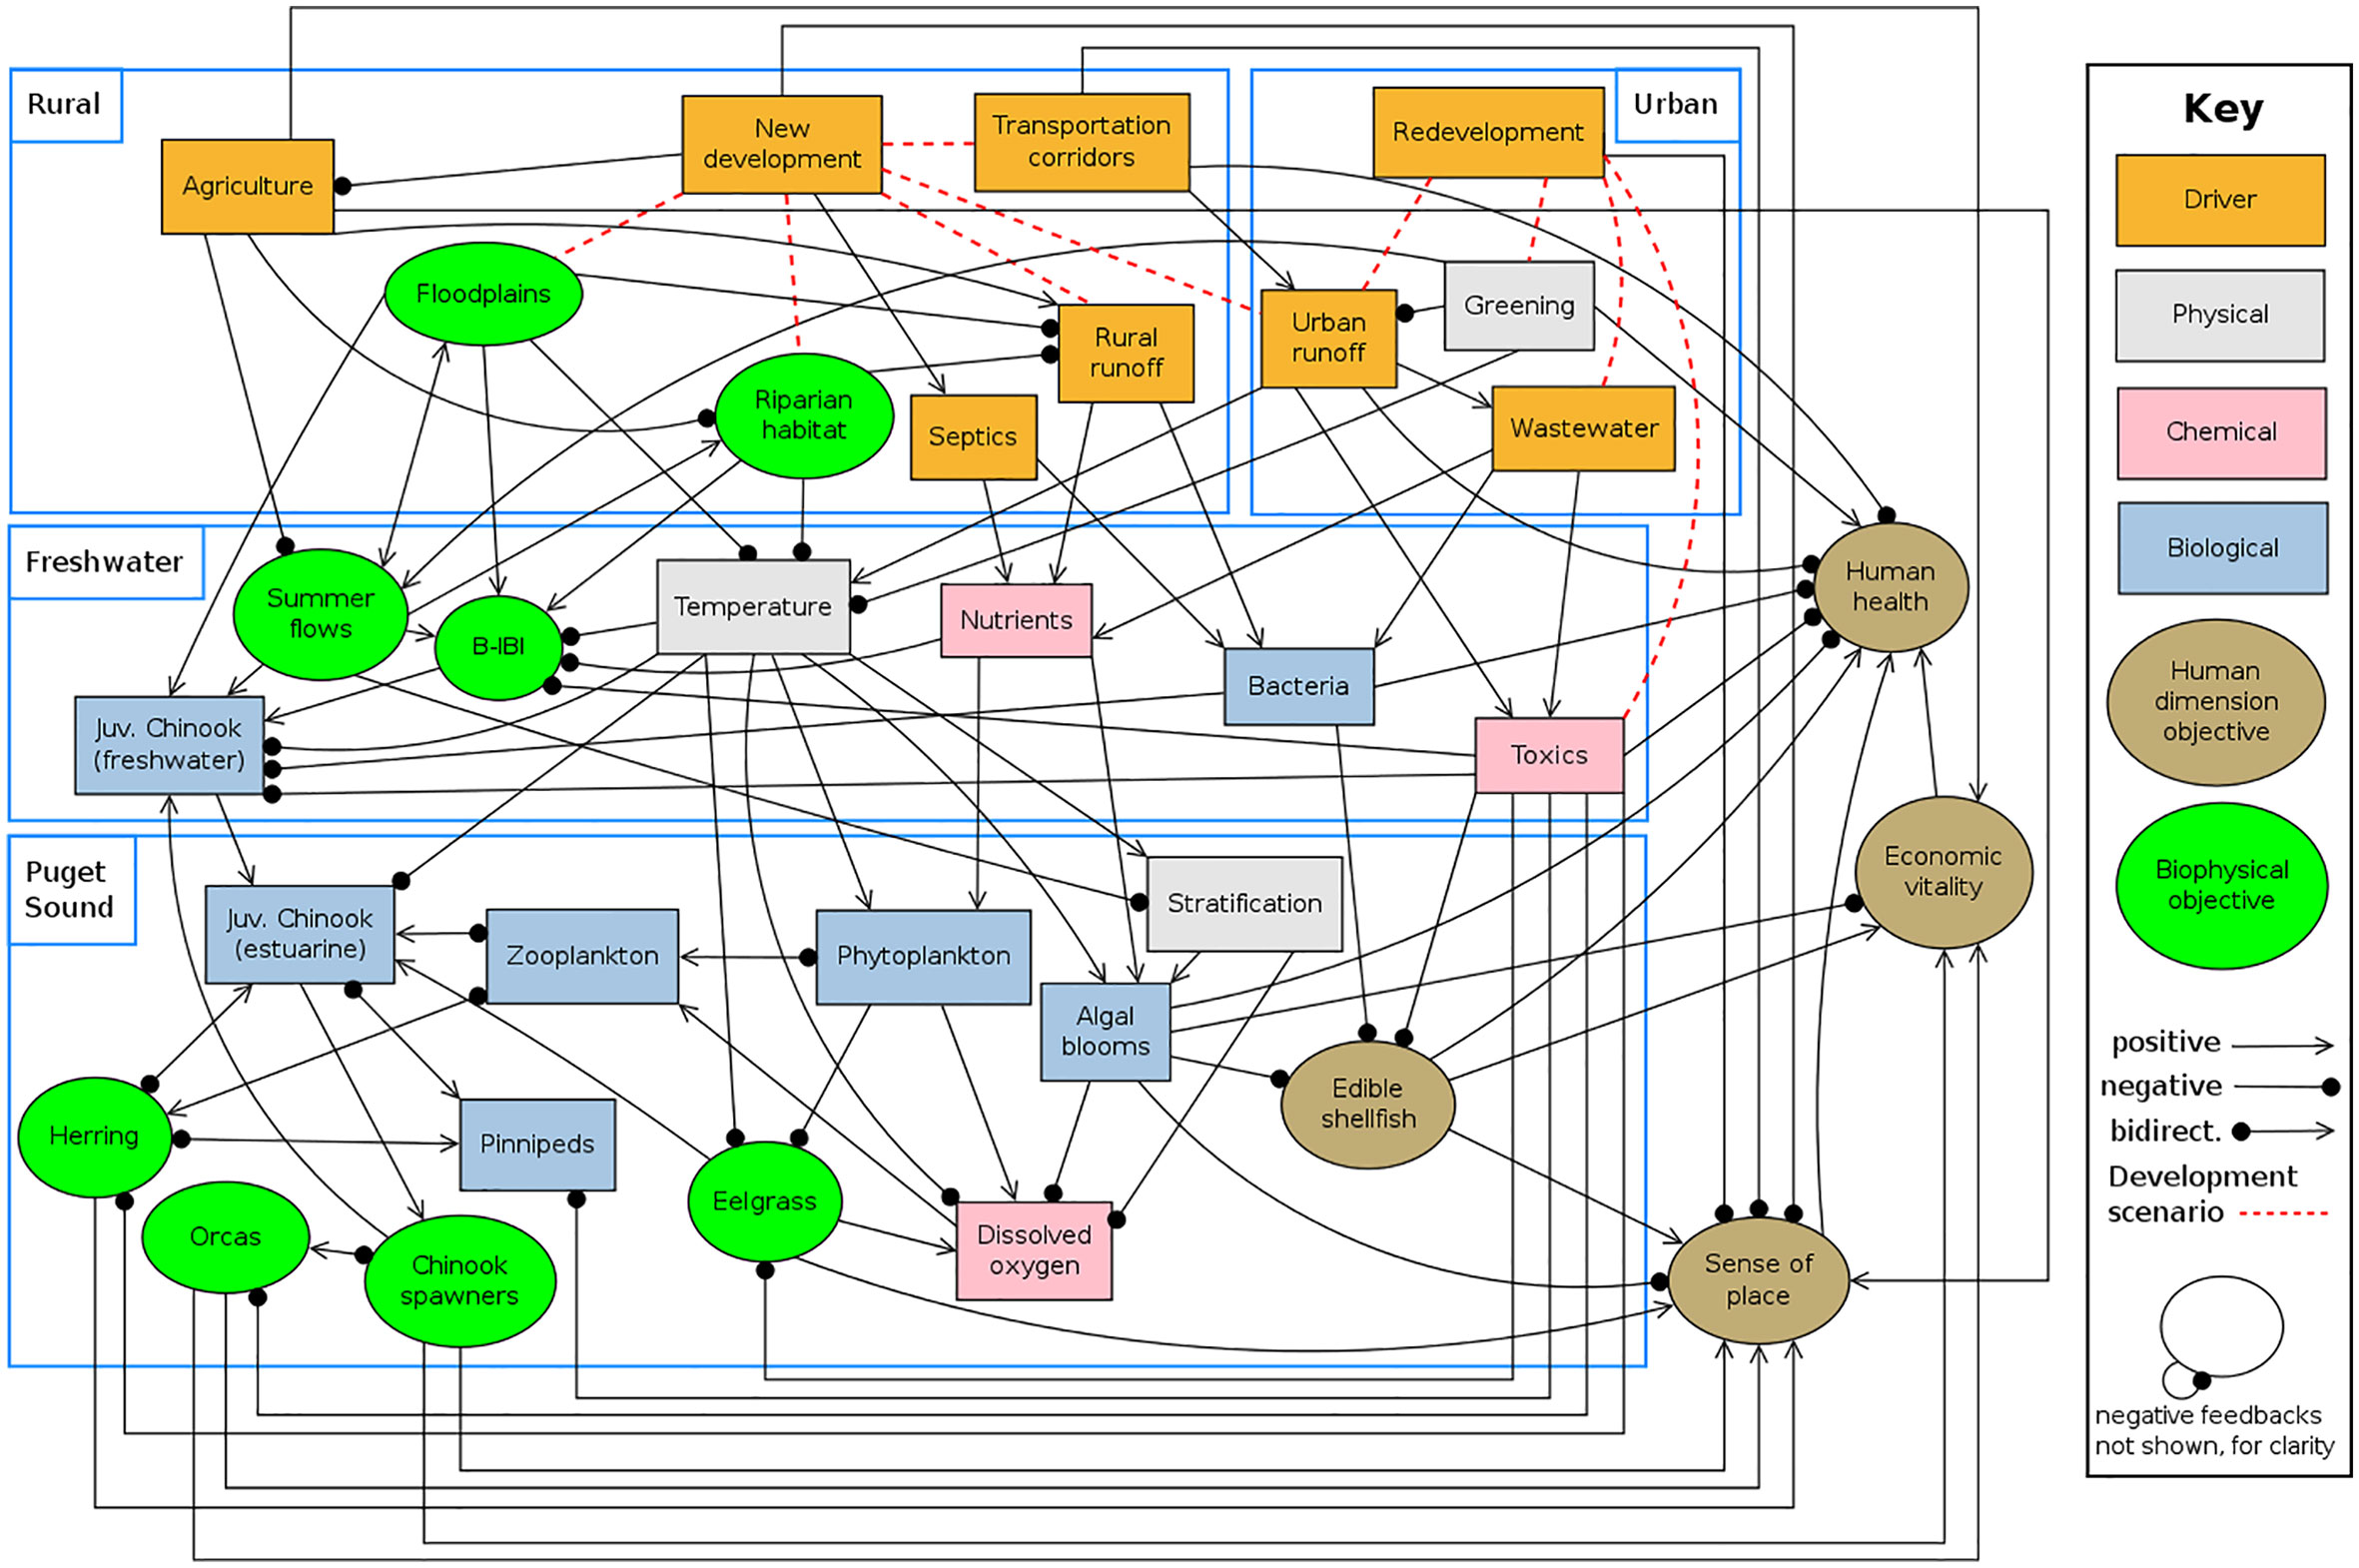
Figure 3 Base conceptual model of the drivers and physical, chemical, biological, and human dimension characteristics of a generic Puget Sound, Washington, U.S.A. watershed, including rural and urban lands, freshwaters, and the nearshore Puget Sound estuary. Lines indicate directed links between nodes; positive (or negative) links occur in the direction of the arrows (or dots). Red dashed lines indicate links which were varied depending on the development intervention and scenario (see Table 2 and Figure 4). Descriptions and justifications for links are given in Appendix Table S2.
To compare hypotheses about system dynamics and proposed recovery actions to status quo management, we developed a set of management intervention scenarios that were derived from recovery actions proposed in the recovery plans (https://www.psp.wa.gov/implementation-strategies.php) and by other regional Puget Sound programs (Appendix Table S1 and Figure 2). Strategies related to restoration or redevelopment of urban lands and preservation of rural lands were common across recovery documents and, during expert review of the base model, managers emphasized the need to coordinate and prioritize recovery actions at the watershed scale. To represent management interventions that varied from the status quo, the presence or sign (positive or negative) of links in the base model leading from the rural “New Development” and urban “Redevelopment” nodes were changed to reflect how each recovery action could influence system stressors or functions (Figure 3). In some cases, management alternatives also contained hypothesized system behaviors, which are reflected by altered links. Three sets of alternative network topologies and simulations were compared to evaluate (1) status quo management scenarios, (2) individual interventions, and (3) coordinated interventions. These alternatives were selected for the present study in part because of their relevance to multiple recovery objectives and scenarios were refined in consultation with experts responsible for leading the development and implementation of recovery plans (Figure 2). Narrative descriptions of the alternative topologies, including relevant system dynamics and assumptions, are provided in Table 2.
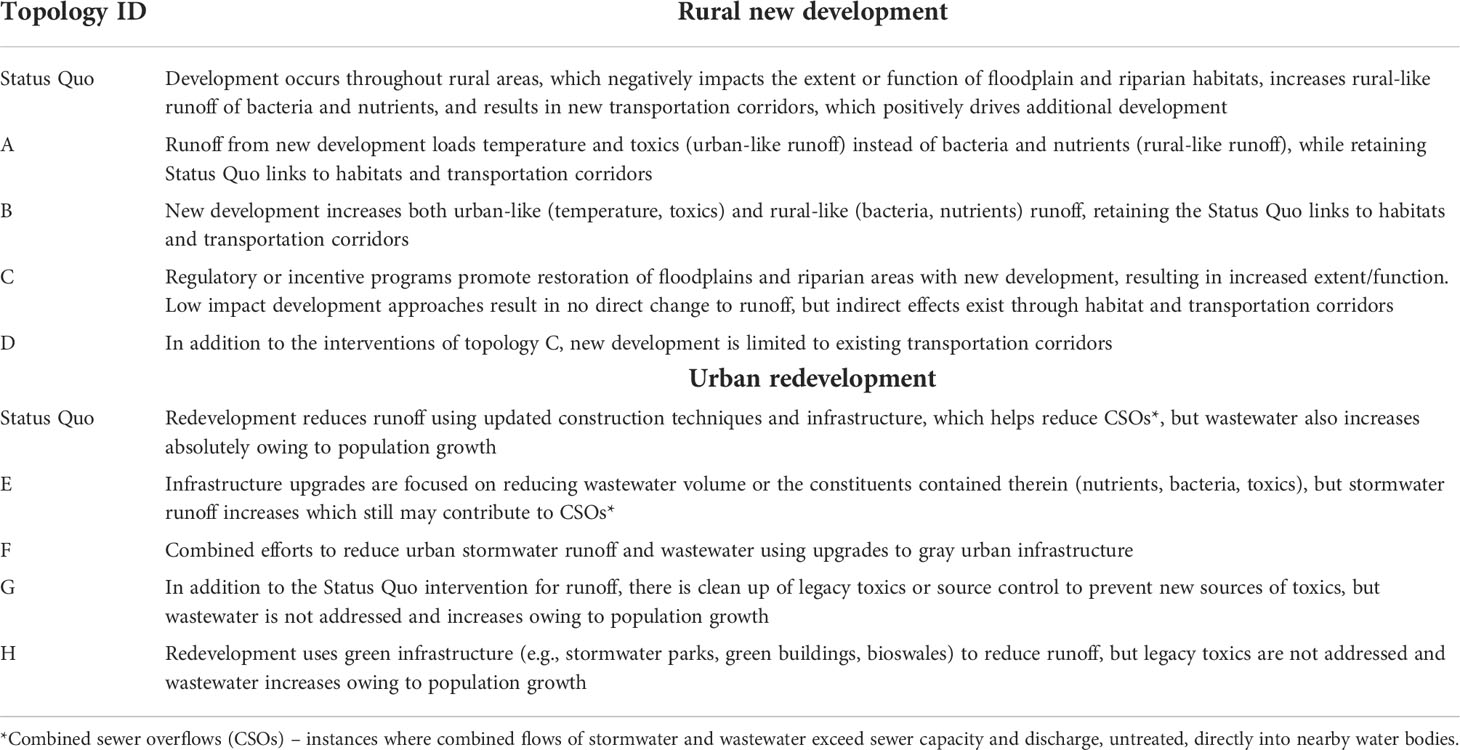
Table 2 Descriptions of the status quo and alternative scenarios (A through H) used to evaluate status quo, individual, and coordinated interventions for rural new development and urban redevelopment (digraphs corresponding to each scenario are given in Figure 4).
Status quo management scenarios– Two scenarios were explored for accommodating projected population growth in the Puget Sound region: either new development on rural lands or redevelopment of urban lands (i.e., densification). First, we compared the outcomes of directing development towards either rural or urban lands using the Status Quo topologies for new development and redevelopment (Figure 4A and Table 2). Only the subset of links shown in Figure 3A were varied – all other links in the base model (Figure 3) remained the same. To evaluate a scenario where population growth is accommodated exclusively on rural lands and there is no redevelopment of urban land (“Rural only”), we positively perturbed the New Development node and simultaneously negatively perturbed the Redevelopment node. To evaluate the opposite scenario (“Urban only”) where population growth is accommodated via redevelopment of urban lands and there is no new development of rural lands, we negatively perturbed New Development and positively perturbed Redevelopment.
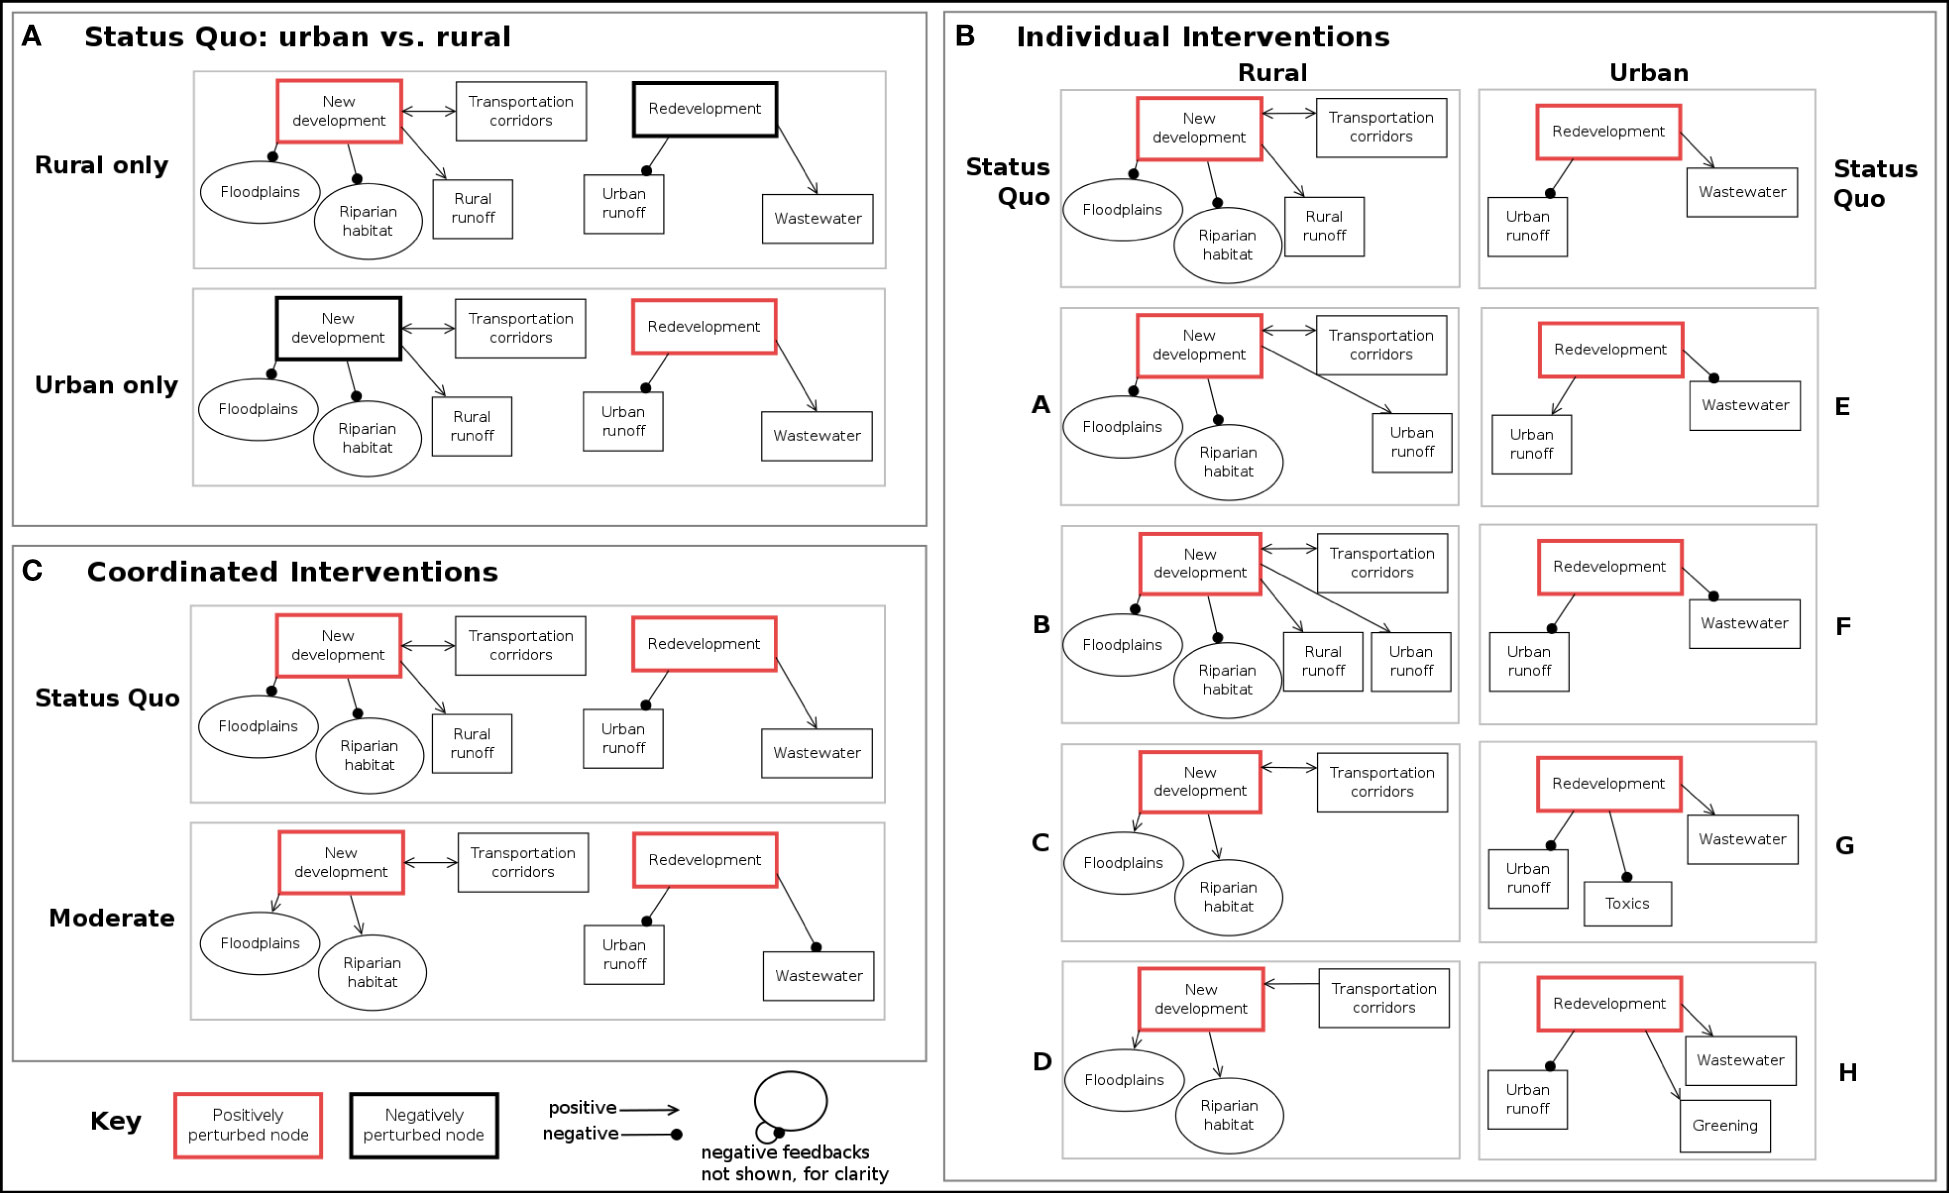
Figure 4 Simplified network topologies for status quo and alternative scenarios used to explore development interventions and system dynamics through simulation. All other network links shown in the base model (Figure 3) were held constant among network configurations. In simulations, the development nodes were positively (red outline) or negatively (black outline) perturbed either simultaneously (in A, C) or separately (in B). For narrative descriptions of each topology, see Table 2 and Methods (“Conceptual Models”). Descriptions and justifications for links are given in Appendix Table S2.
Individual interventions– Next, we explored the ecosystem impacts, and mitigation of those impacts via management interventions, associated with development on urban and rural lands separately from one another in a set of ten models (Figure 4B and Table 2). The links, but not the perturbations, in the Status Quo scenarios for rural new development and urban redevelopment were the same as described above. Four alternative topologies each were created for rural and urban development scenarios and were compared to the Status Quo (Table 2). Topologies A through D outline both alternative hypotheses about rural development impacts on habitats and stressors and potential management strategies for mitigating the pressures of new development. Alternative topologies E through H outline hypotheses for how urban redevelopment could be managed to mitigate the impacts of stressors and the potential to include green infrastructure (“greening”). In each case, only the subset of links shown in Figure 4B varied from the base model, while the rest of the base model structure (Figure 3) was held constant. Simulating only one set of network relationships at a time allowed us to examine the consequences of detailed management alternatives within rural and urban land development strategies, respectively, by positively perturbing either New Development or Redevelopment.
Coordinated interventions– It is likely that accommodating the projected population growth in the Puget Sound region will require development to occur on both urban and rural lands. Therefore, to explore the outcomes from coordinated interventions on urban and rural lands, we developed a final set of networks describing the combined effects of urban redevelopment and rural new development under status quo management strategies as compared with a moderate level of intervention, which was a combination of rural New Development topology C and urban Redevelopment topology F (Figure 4C and Table 2). In these simulations, both development nodes were simultaneously positively perturbed.
Network simulation and analysis
Qualitative network models (QNMs) were used to evaluate model structure, uncertainty, and the outcomes of perturbations for each of the model topologies. Diagramming software (‘Dia’ v.0.97.2; http://dia-installer.de/) was used to produce a signed, directed graph (or digraph) for each network configuration (Figure 4). Although not shown in the figures, a self-regulating (negative) feedback link was applied to each node in the digraph to aid in model convergence and represent system limits (Puccia and Levins, 1985). The digraph is interpreted as a community interaction matrix, wherein the rate of change of each node is a continuous function of all other interacting nodes (Levins, 1974; Puccia and Levins, 1985). Therefore, the interacting model is set up as a series of differential equations. We used the R package ‘QPress’, which has a Bayesian framework for interpreting uncertainty associated with qualitative model formulations (Melbourne-Thomas et al., 2012). This approach allows the user to evaluate uncertainty in the direction of the response of the variables of interest through numerous simulations of the network. For each simulation, a random weight (drawn from a uniform distribution of 0 – 1, where sign is specified by the link type) is assigned to each link in the digraph. The simulation results are retained if the resulting model with all randomly assigned weights is stable according to convergence criteria outlined by Melbourne-Thomas et al. (2012). In our case, the network was simulated as many times as necessary to produce 10,000 stable simulations, which were retained for perturbation analysis.
Management interventions are conducted by perturbing individual or combinations of nodes and tracking the reverberations of those perturbations throughout the retained simulations. Perturbations represent a sustained (i.e., press) shift in the equilibrium condition of that node (Puccia and Levins, 1985). We evaluated, for each topology and perturbation, the sign consistency of other nodes in the model, which is the percentage of total retained solutions in which nodes responded positively, negatively, or equivocally to the invoked perturbations. Following the approach of Sobocinski et al. (2018), we characterized sign consistency as follows: strong negative (or positive) effects were nodes that responded negatively (or positively) in greater than 80% of the retained simulations, weak negative (positive) effects were nodes that responded negatively (positively) in 60-80% of simulations, and equivocal effects were nodes with 40-60% of simulations that were negative or positive (e.g., nearly equal numbers of negative and positive responses across simulations). We focused primarily on the response of nodes representing 13 biophysical and human wellbeing recovery objectives and 5 common ecosystem stressors (temperature, nutrients, bacteria, toxics, and algal blooms).
Model structure and sensitivity
We evaluated the sensitivity of our results to model structure variability across topologies using indicators of model convergence and common metrics of network structure. First, we assessed the total number of simulations attempted to achieve 10,000 stable simulations for each topology; a higher number indicates that model stability and convergence were more difficult to achieve (Melbourne-Thomas et al., 2012). We also calculated mean link weight across all links within retained simulations for each network topology; expected mean link weight is 0.5 (absolute value) given that the assigned weights were drawn from a random normal distribution from 0 to 1. Both metrics were calculated using ‘QPress’ in R (Melbourne-Thomas et al., 2012). To assess the strength of individual model links, we calculated means and standard deviations of the weights for each link from the retained simulations; values larger or smaller than 0.5 suggest stronger or weaker interactions, respectively. Across model topologies, we compared the links with the highest (n = 15) and lowest (n = 15) mean link weight. In addition, the ‘iGraph’ R package (Csardi and Nepusz, 2006) was used to calculate network structure metrics for each topology, including mean distance (shortest path) between pairwise nodes using the ‘mean_distance’ function, link density (ratio of realized to potential links) using ‘edge_density’, and the distance from the development nodes (New Development and Redevelopment) to all other nodes in the network using ‘distances’. Together, these metrics allowed us to evaluate the model results within the context of network structure.
Results
Model structure and stability
The base model had 33 nodes representing social-ecological system components across rural and urban terrestrial, freshwater, and estuarine habitats in a generalized watershed (Figure 3). In the Status Quo model, there were a total of 143 links with an link density (realized/potential links) of 0.135, and the average number of links per node was 4.36. The most highly connected nodes were Human Health and Sense of Place. Redevelopment, Septics, and Pinnipeds were among the least connected nodes. The mean distance (path length) between pairwise nodes in the network was 2.41. To find 10,000 stable simulations, 66,346 total simulations of the Status Quo network were attempted. These metrics of model structure and stability were similar across all network topologies (Appendix Table S3), indicating that the following results are likely not an artifact of model structure alone. One exception was that alternative topology D required significantly fewer total attempted simulations (32,904) to obtain 10,000 stable simulations, indicating that stability criteria were more easily achieved for this topology (Appendix Table S3).
From both the New Development and Redevelopment nodes to recovery objective and ecosystem stressor nodes in the status quo model, the shortest path distances ranged from 1 – 4 (Appendix Table S4). Path distances between recovery objective and ecosystem stressor nodes were longer, albeit marginally, from the New Development node compared to the Redevelopment node. Distances also differed somewhat among the Status Quo and other model topologies but all were between 1 – 4, except for a path distance of 5 between New Development and Orcas in Topology D (Appendix Table S4).
Link weights
Examination of the link weights showed that most were distributed around the expected mean absolute value (0.5) in the retained simulations. In fact, the mean weight (absolute value) of all links across the retained simulations was 0.500. However, some individual model links were distributed with mean weights above or below the expected mean. In simulations of both the Status Quo and Moderate intervention topologies (Figure 4C), the negative self-effect links for Floodplains, Transportation Corridors, Summer Flows, and New Development nodes had the highest mean weights (Appendix Figures S1, S2). Links describing the relationships between Floodplains, Summer Flows, Transportation Corridors, and New Development had the lowest mean weights in simulations of the Status Quo and Moderate intervention models. In fact, these links had mean weights that diverged from 0.5 (absolute value) across all network topologies. Other commonly divergent links (high or low mean weights), regardless of model topology, were those related to the marine food web, including links from Chinook to Herring and Herring to Zooplankton, and the Chinook salmon life stages.
Status quo scenarios
Under the development scenarios “Rural only” and “Urban only”, which implemented status quo system dynamics and management strategies (Figure 4A), there were very few strong responses of recovery objectives or ecosystem stressors – most responses were weak (Figure 5). In general, Urban only (increase in Redevelopment and decrease in New Development) resulted in more favorable outcomes compared to Rural only (increase in New Development and decrease in Redevelopment), although the certainty of most outcomes was weak (based on sign consistency). For Rural only, most recovery objectives had a weak negative response and stressors had a weak positive response, except Toxics, which had a strong positive response. For Urban only, responses were opposite – most recovery objectives had weak positive responses and most stressors had weak negative responses (except Toxics – strong negative). In both cases, Chinook Spawners and Riparian Habitat responded equivocally, and Herring and Summer Flows responded in the opposite direction of most recovery objective nodes (that is, weak positive response in Rural only and weak negative response in Urban only). The responses of the four human wellbeing recovery objectives were coherent in each scenario – all had weak negative responses in Rural only and weak positive responses in Urban only. The proportion of positive and negative responses for all nodes in these perturbations are given in Appendix Figure S3.
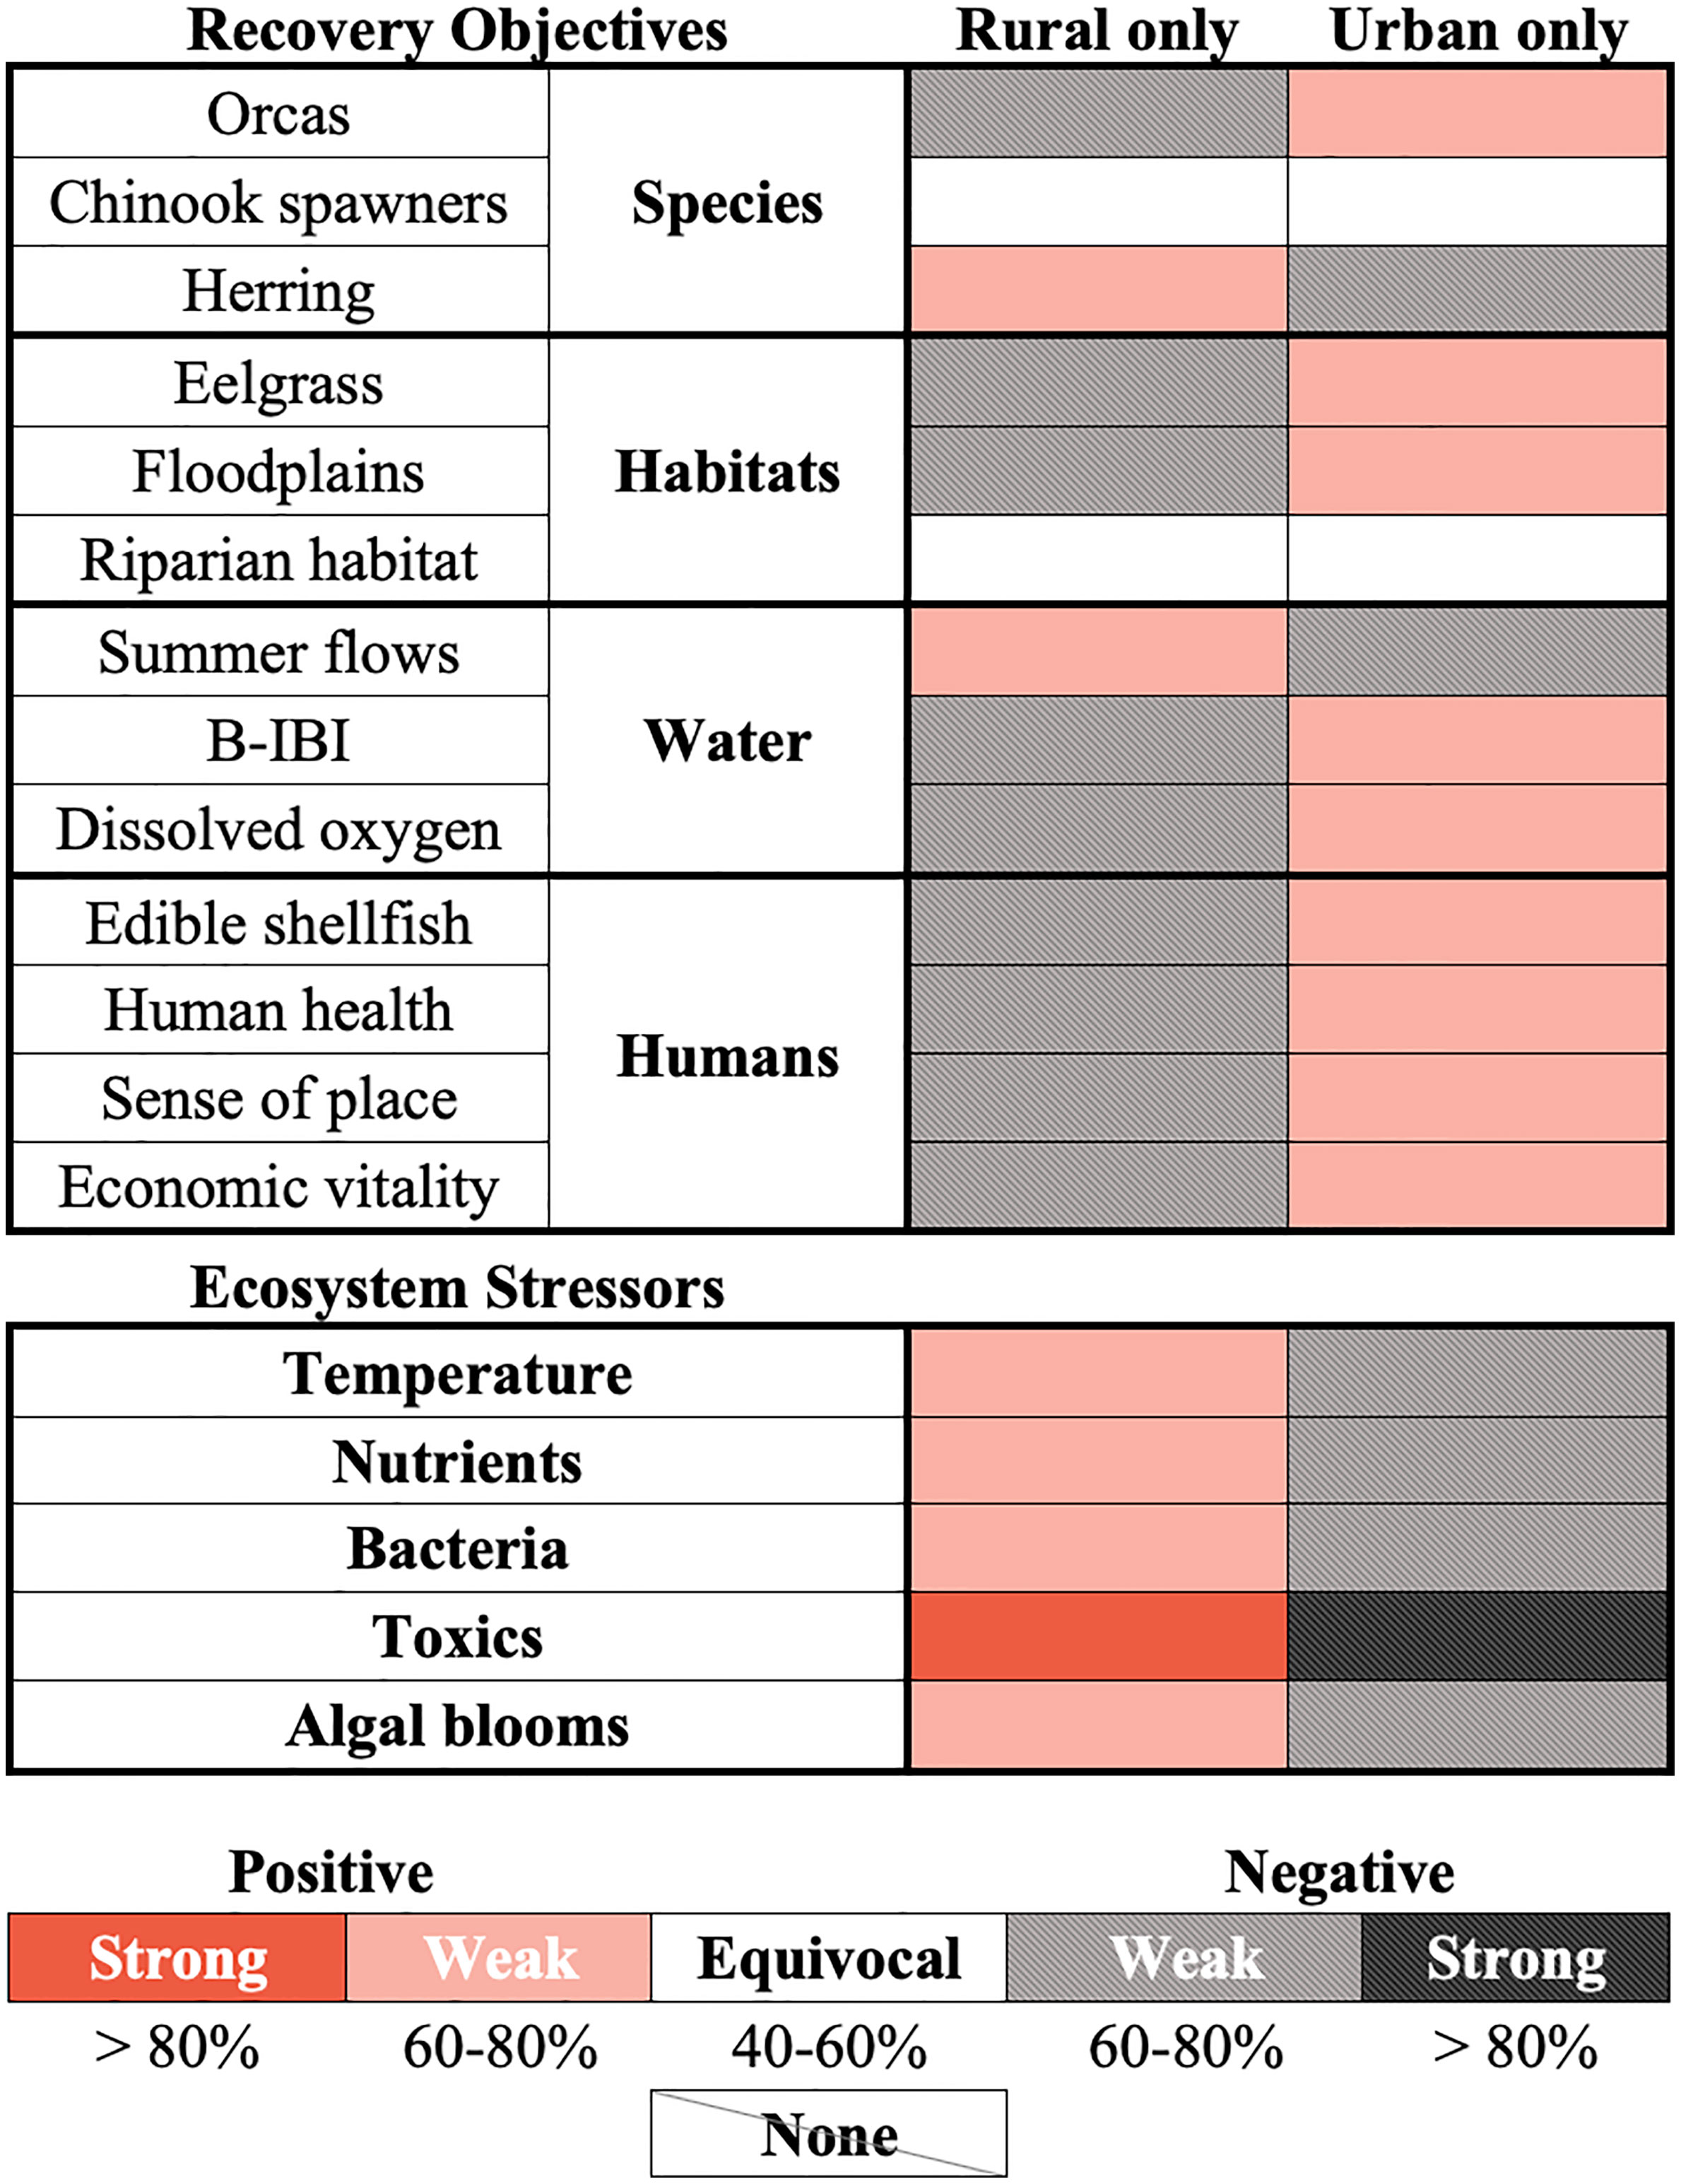
Figure 5 Outcomes of recovery objectives and ecosystem stressors to combined perturbations of the development nodes (“Rural only”: + New Development, – Redevelopment; “Urban only”: – New Development, + Redevelopment) in the Status Quo topology of the Puget Sound watershed qualitative network model (Figure 4A). Shading indicates the direction (positive/negative) and consistency of the response (strong/weak), indicated by the key in the bottom portion of the figure.
Individual interventions
Status quo – Under scenarios of status quo but separately simulated management of rural new development and urban redevelopment, and under status quo assumptions about system dynamics, there were very few strong responses of recovery objectives or ecosystem stressors to increases in either the New Development or Redevelopment nodes – most responses were equivocal or weak (Figure 6). Increasing New Development, which under status quo dynamics reduces habitats and increases rural runoff and transportation corridors (Figure 4B), resulted in weak negative or equivocal responses of most recovery objectives (except Summer Flows – weak positive) and positive (strong – Toxics; weak – Nutrients and Bacteria) or equivocal (Temperature and Algal Blooms) responses of ecosystem stressors (Figure 6 and Appendix Figure S4). Responses of the human dimension recovery objectives to increasing New Development were generally coherent with the responses of the biophysical objectives – weak negative (Edible Shellfish, Human Health, and Economic Vitality) and equivocal (Sense of Place). Increasing Redevelopment, which under status quo dynamics reduces urban runoff and increases wastewater (Figure 4B), resulted in weak positive responses of most recovery objectives (except Herring – weak negative) and negative (strong – Temperature; weak – Toxics and Algal Blooms) or equivocal (Nutrients and Bacteria) responses of ecosystem stressors (Figure 6 and Appendix Figure S5). Again, the human dimension recovery objectives responded similarly to the biophysical objectives – all four human dimensions had a weak positive response to increasing Redevelopment. Some recovery objectives (Floodplains, Riparian Habitat, and Summer Flows) were not connected to the Redevelopment node. Overall, redevelopment had more favorable outcomes compared to new development in the Status Quo, although the certainty of outcomes was generally weak (Figure 6 and Appendix Figure S5).
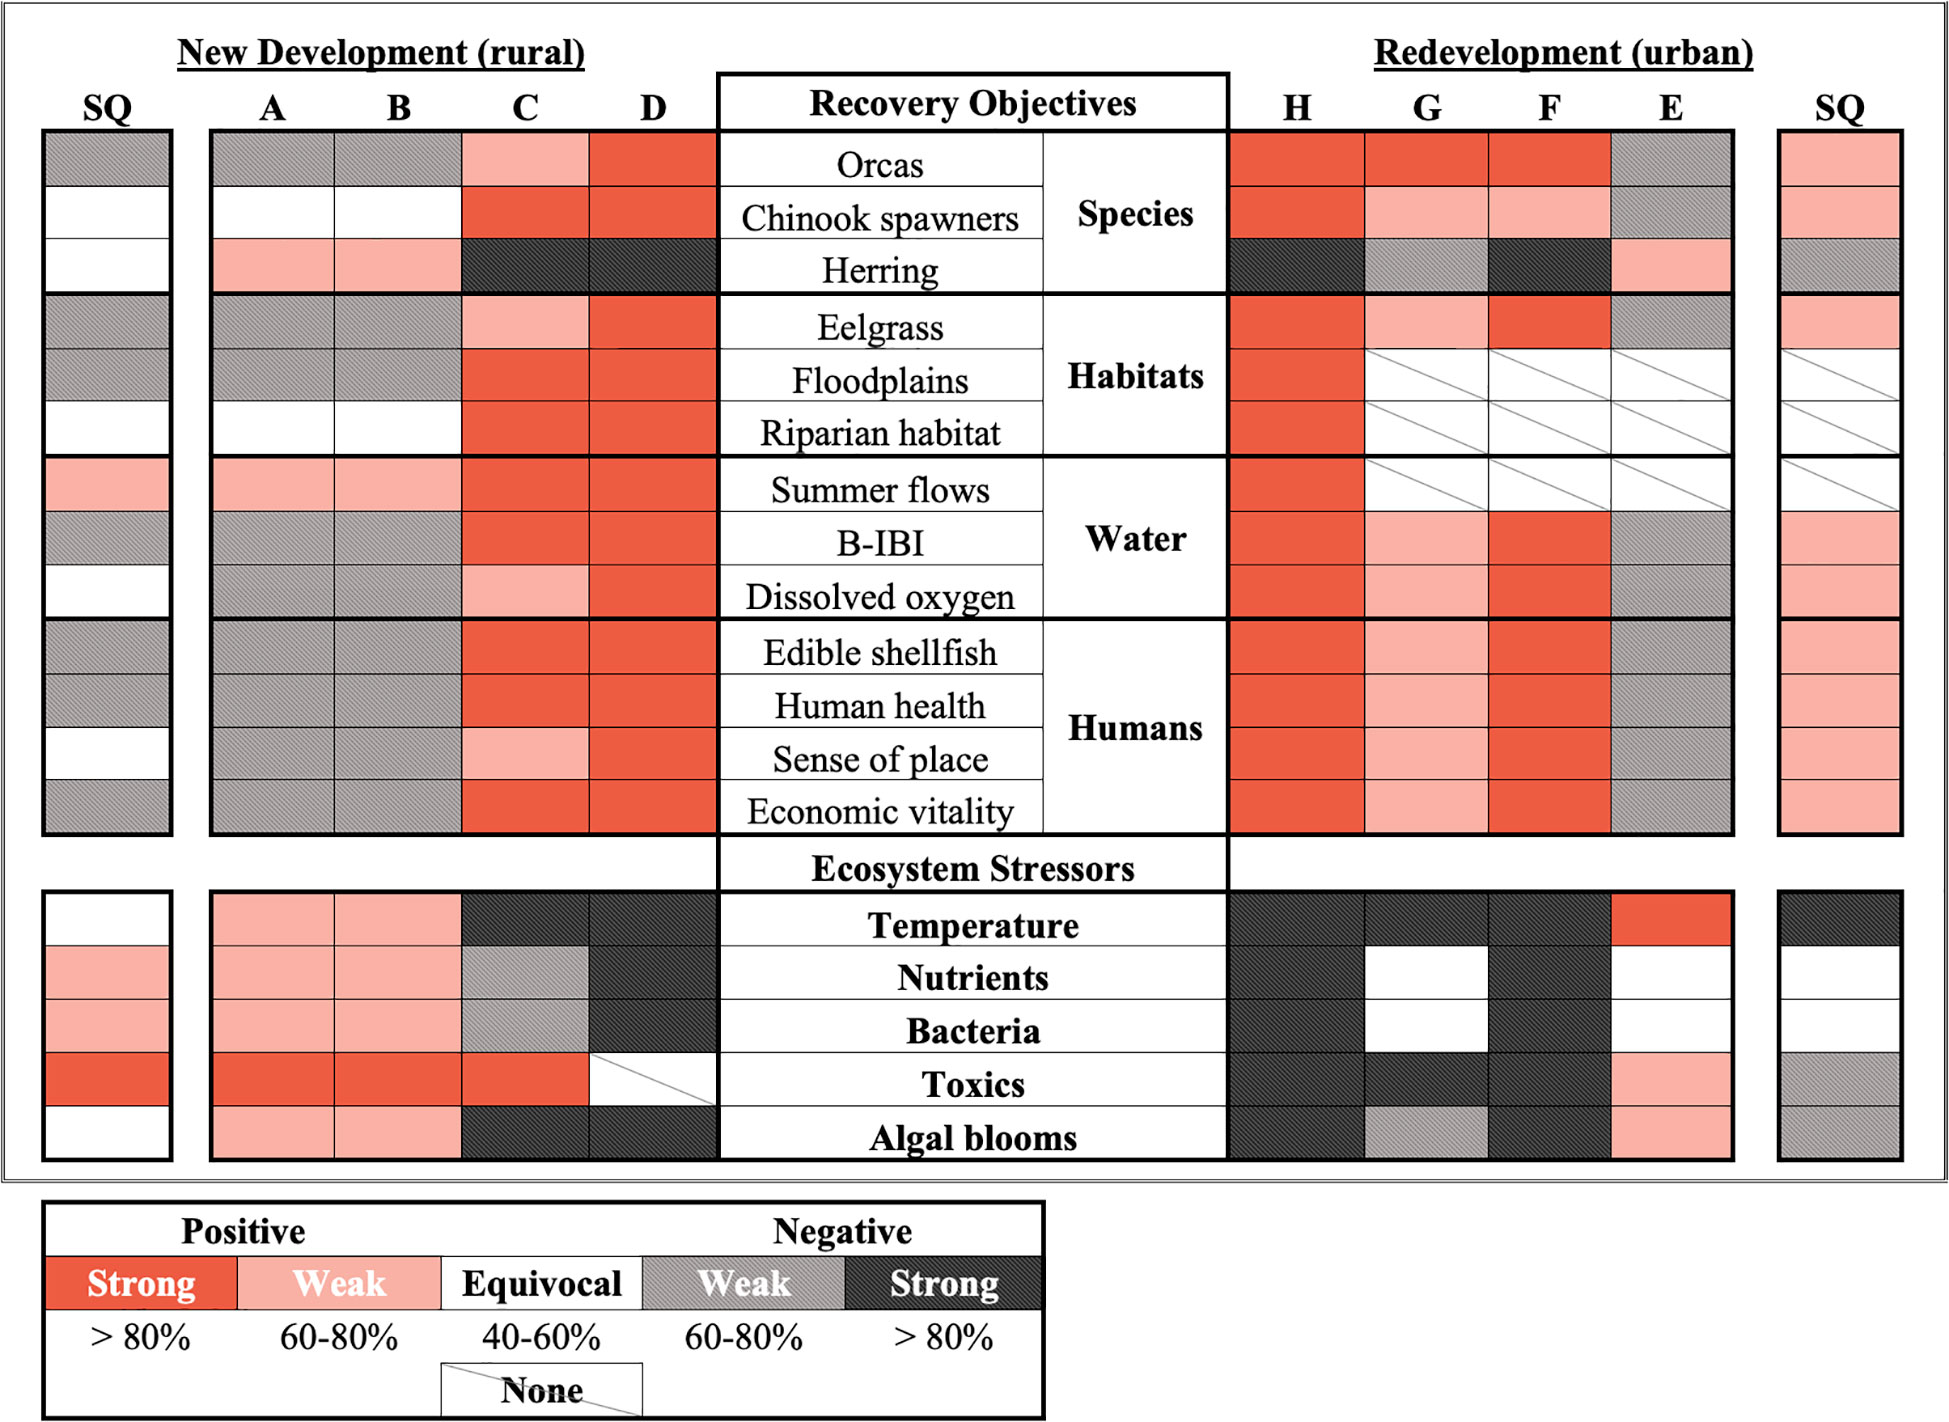
Figure 6 Outcomes of recovery objectives and ecosystem stressors to individual positive (+) perturbations of the development nodes (New Development, left columns, and Redevelopment, right columns) for the status quo (SQ) and eight alternative topologies of the Puget Sound watershed qualitative network model (Figure 4B and Table 2). Shading indicates the direction (positive/negative) and consistency (strong/weak) of the response, indicated by the key in the lower left portion of the figure.
New development alternatives – Among the four topologies representing alternative system behaviors and management interventions associated with new development on rural lands (Figure 4B), topologies A and B, where rural development increases urban runoff or both urban and rural runoff, respectively, had similar outcomes that were less favorable than the Status Quo scenario (Figure 6). In both cases, the perturbation resulted in mostly weak negative responses of recovery objectives, except that Herring and Summer Flows had weak positive responses and Chinook Spawners and Riparian Habitat responded equivocally. As compared to status quo management, when rural development increased urban-like runoff (instead of only rural runoff in Status Quo), there were worse outcomes for Dissolved Oxygen and Sense of Place (weak negative responses compared to equivocal in Status Quo). All the ecosystem stressors increased (strong – Toxics; weak – all others), as compared to the Status Quo model where Temperature and Algal Bloom responses were equivocal.
Topologies C and D, wherein management of new development reduces runoff and increases habitat function and extent, had more favorable outcomes compared to A and B. In topology C, where runoff is controlled but development leads to an increase in transportation corridors, five biophysical recovery objectives had a strong positive response, three had a weak positive response, and one (Herring) had a strong negative response (Figure 6). For the four human dimension recovery objectives, Edible Shellfish, Human Health, and Economic Vitality had a strong positive response and Sense of Place had a weak positive response. Only Toxics increased among the ecosystem stressors; two stressors had a strong negative response (Temperature and Algal Blooms), two had a weak negative response (Nutrients and Bacteria). Topology D, wherein runoff is controlled and no new transportation corridors arise from rural development, resulted in even stronger outcomes compared to C – all recovery objectives (biophysical and human dimension) had a strong positive response except for Herring, which had a strong negative response. All ecosystem stressors had strong negative responses, except for Toxics which was not connected to New Development in topology D. Overall, the outcomes of perturbation in topologies A and B were less favorable compared to the Status Quo or other alternatives, and topology D had the most favorable responses for new development. The proportion of positive and negative responses of all nodes to increasing rural new development in the Status Quo and alternative models (A though D) are shown in Appendix Figure S4.
Redevelopment alternatives – Among the four topologies representing alternative system behaviors and interventions related to urban redevelopment (Figure 4B), topology E, where Redevelopment decreases wastewater instead of urban runoff, resulted in the least favorable outcomes compared to the Status Quo model or other alternatives (Figure 6). For topology E, all of the human dimension recovery objectives and most of the biophysical objectives responded negatively, except Herring which had a weak positive response. Three ecosystem stressors responded positively (strong – Temperature; weak – Toxics and Algal Blooms) and two were equivocal (Nutrients and Bacteria). As in the Status Quo, Floodplains, Riparian Habitat, and Summer Flows were not connected to Redevelopment in topology E. Reducing both Toxics and Urban Runoff via redevelopment in topology F resulted in a weak positive response of Chinook Spawners and strong positive responses in four other biophysical recovery objectives. Only Herring responded negatively (strong) and, as before, three biophysical recovery objectives were not connected to the perturbation. All four human dimension recovery objectives had a strong positive response and all five ecosystem stressors had a strong negative response to an increase in Redevelopment in topology F.
Topology G, where redevelopment decreases urban runoff and toxics but wastewater increases, resulted in similar responses to the Status Quo (Figure 6). Most biophysical recovery objectives had a weak positive response (except Orcas – strong positive – and Herring – weak negative). All four human dimension recovery objectives had a weak positive response. Ecosystem stressors in topology G responded negatively (strong – Temperature and Toxics; weak – Algal Blooms) or equivocally (Nutrients and Bacteria). For topology H, adding urban greening to the status quo reduction in urban runoff resulted in the most strong, favorable responses compared to the Status Quo or other urban redevelopment alternatives. In this model, all recovery objectives were connected to Redevelopment and the perturbation resulted in strong positive responses for all but one biophysical recovery objective (Herring – strong negative), all four human dimension objectives had a strong positive response, and all five ecosystem stressors had strong negative responses. Overall, the outcome of redevelopment in topology H was the most favorable, followed by F, then G. The proportion of positive and negative responses for all nodes in response to increasing urban redevelopment in the Status Quo and alternative models (E though H) are shown in Appendix Figure S5.
Coordinated interventions
Status quo – Simultaneous positive perturbation of the New Development and Redevelopment nodes in the Status Quo model (Figure 4C), which most closely reflects current ecosystem management practices, resulted in primarily equivocal responses of the recovery objectives (Figure 7). Only two biophysical objectives responded otherwise: Floodplains had a weak negative response and Summer Flows had a weak positive response. All four human dimension recovery objectives had equivocal responses. For ecosystem stressors, Nutrients, Bacteria, and Toxics had weak positive responses, whereas Temperature and Algal Blooms responded equivocally. The proportion of positive and negative responses for all nodes in are shown in Appendix Figure S5.
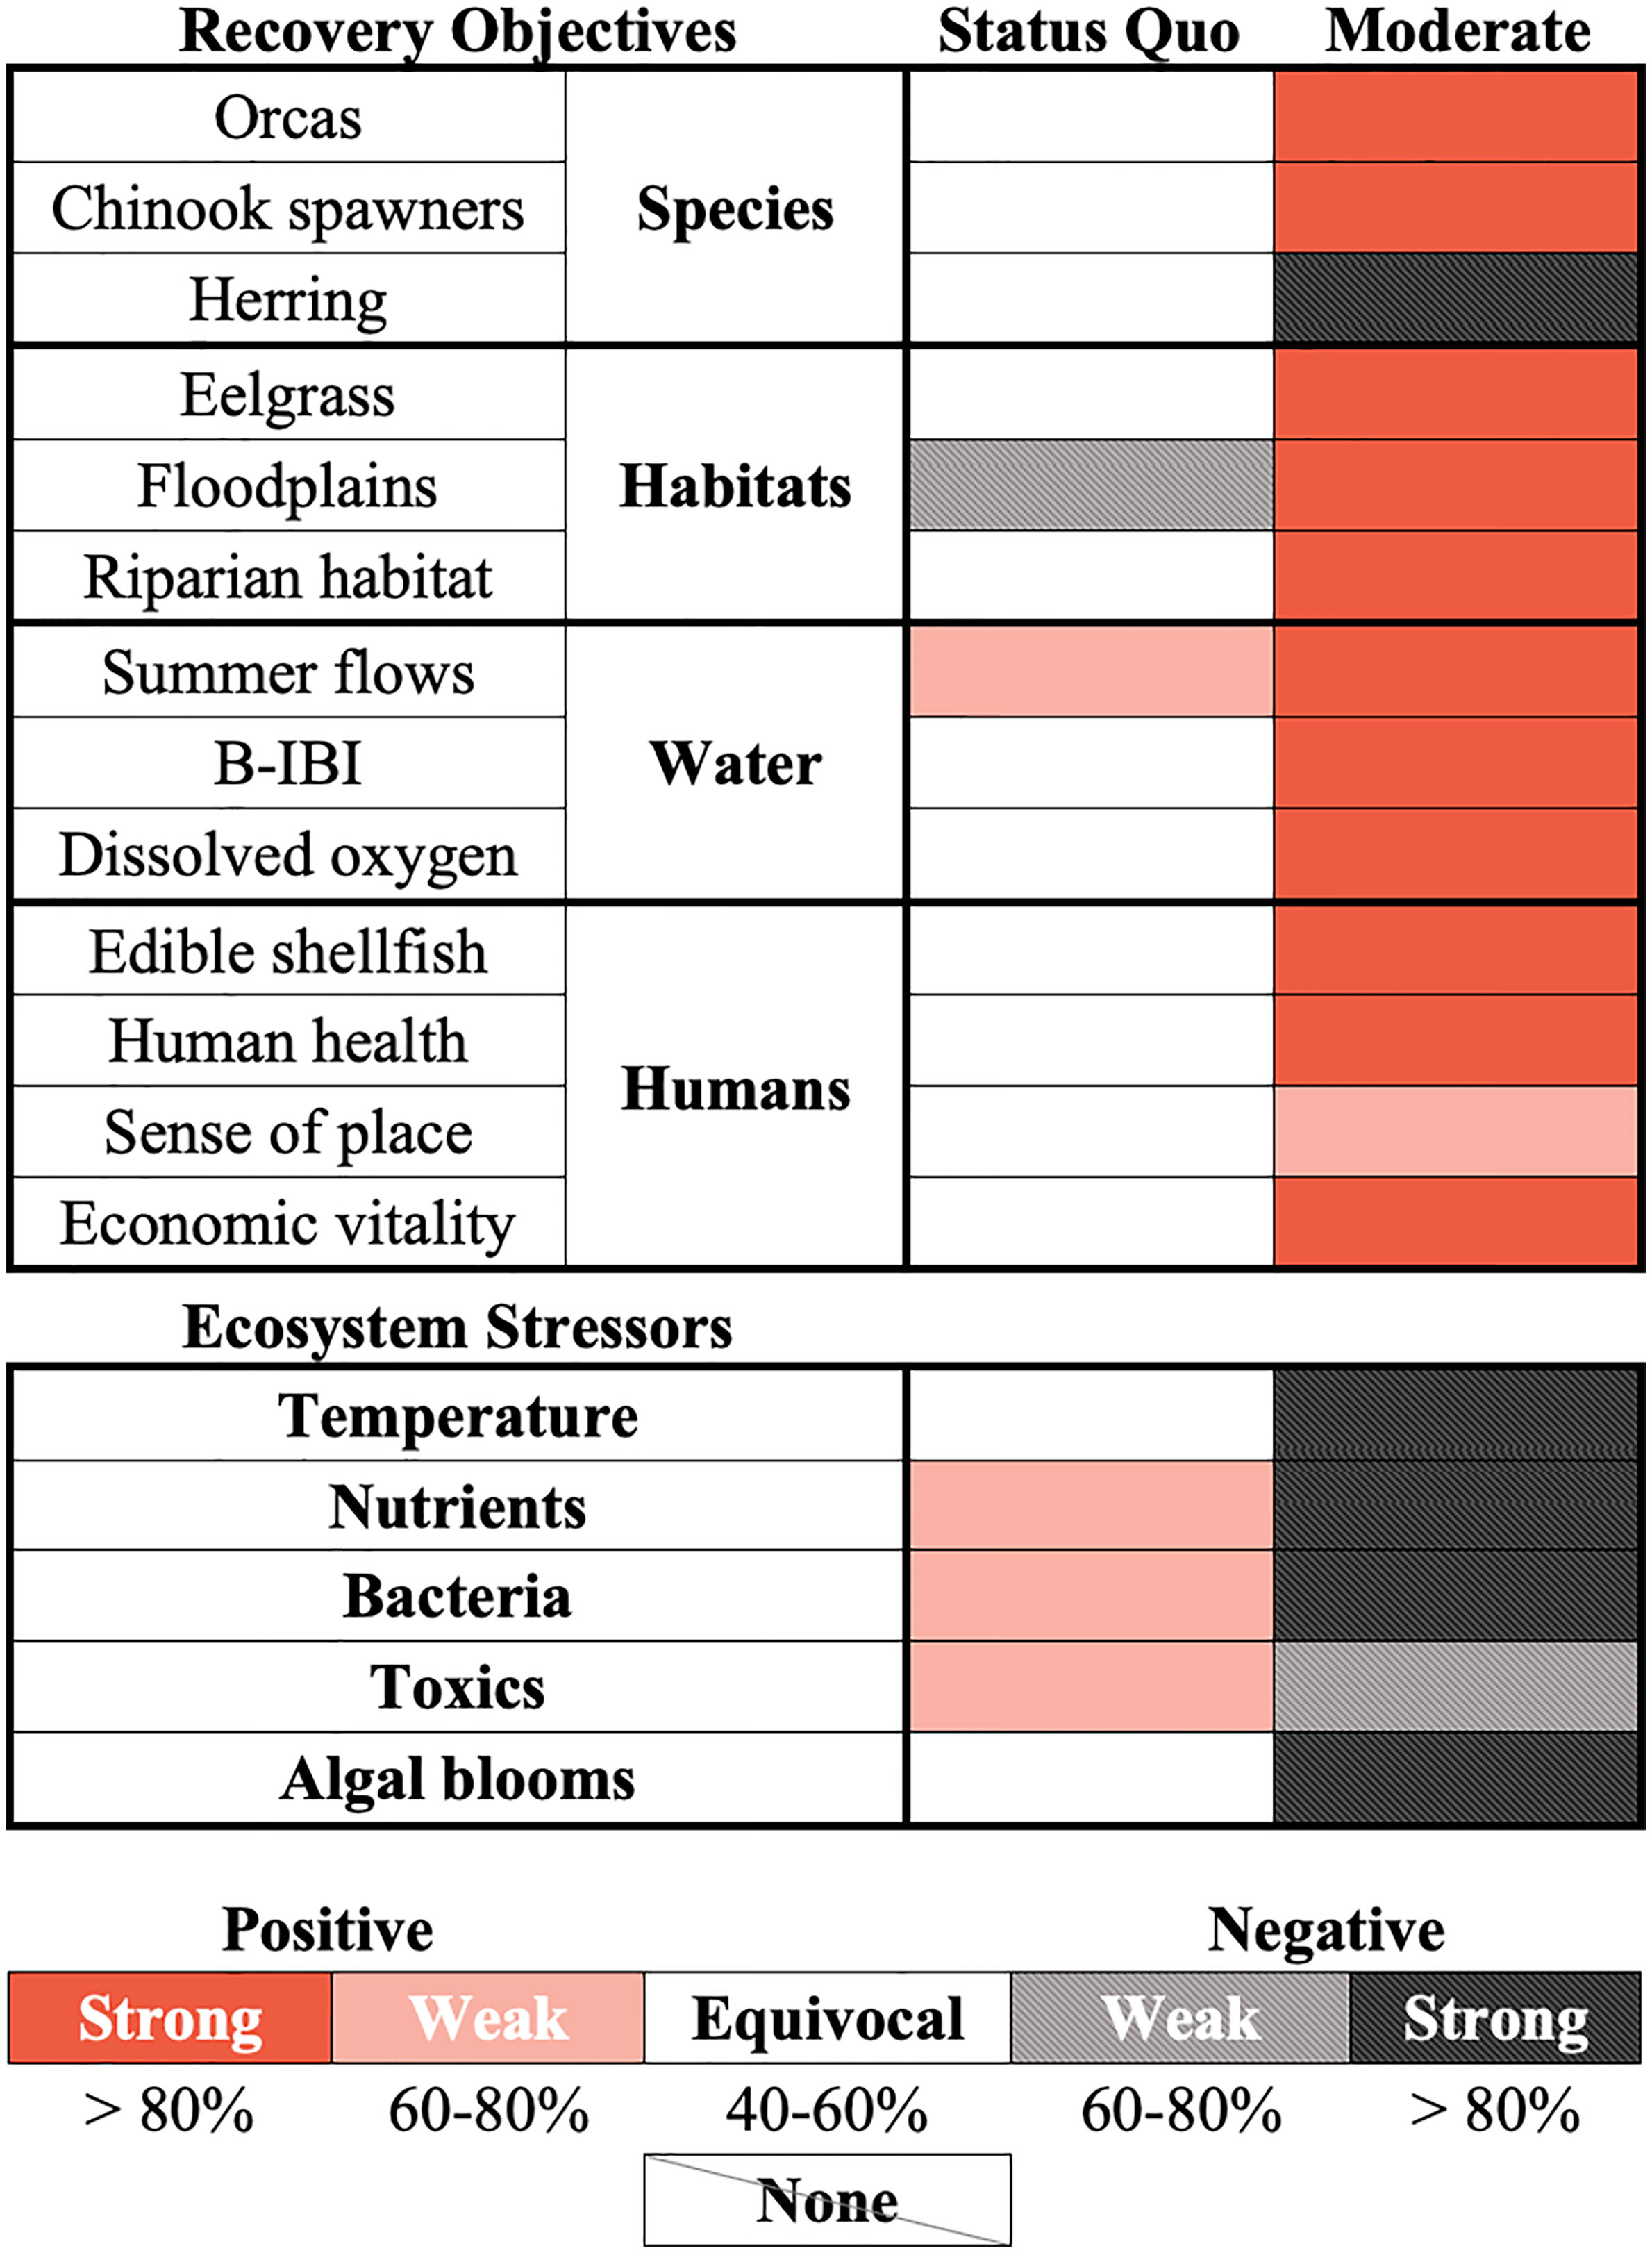
Figure 7 Outcomes of recovery objectives and ecosystem stressors to combined positive (+) perturbations of both development nodes in the Status Quo and Moderate intervention topologies of the Puget Sound watershed qualitative network model (Figure 4C). Shading indicates the direction (positive/negative) and consistency (strong/weak) of the response, indicated by the key in the bottom portion of the figure.
Moderate – Simultaneous positive perturbation of the New Development and Redevelopment nodes under a moderate level of intervention, i.e., a combination of topologies C and F (Figure 4C), resulted in generally favorable and primarily strong outcomes (Figure 7). Eleven of the biophysical and human dimension recovery objectives had strong positive responses, one human dimension objective had a weak positive response (Sense of Place), and one biophysical objective had a strong negative response (Herring). All the ecosystem stressors responded negatively (weak – Toxics; strong – all others). The response of all nodes to combined perturbation in the Moderate model was more certain compared to the Status Quo model, indicated by primarily high sign consistency (Appendix Figure S6).
Discussion
The response of coastal watersheds to any management intervention is multifaceted and complex (Duarte et al., 2015; Teichert et al., 2016), however QNMs allow us to examine these impacts across multiple recovery objectives in one framework. Our scenarios represent the social-ecological system of Puget Sound under different proposed development interventions and hypothesized system behaviors – the basis for which are previously-developed recovery plan documents (https://www.psp.wa.gov/implementation-strategies.php). Individual perturbations compared the relative outcomes of interventions within each development type, whereas combined perturbations allow us to compare outcomes between development types and provide a more realistic representation of ecosystem-scale feedbacks. Scenarios were designed to be distinct from one another to accentuate differences with a modeling approach that only represents directional changes, not magnitude (Puccia and Levins, 1985). For the purposes of this analysis, outcomes of the scenarios were evaluated in the context of regional recovery objectives for Puget Sound (vitalsigns.pugetsoundinfo.wa.gov) but we recognize that impacts may not be equally distributed across the landscape or among communities and that other economic or political aspects should be considered in decision making (see the Future Directions section below for additional consideration of these complexities). Here, we discuss overall implications from the Puget Sound QNMs, which emphasize the need to reduce stormwater runoff via urban restoration, protect critical areas by responsibly managing growth in rural areas, and promote coordination within watersheds to address the cumulative effects of development and achieve multiple social and ecological outcomes.
Urban restoration versus rural preservation
Modeled interventions that reduced stormwater, especially urban stormwater runoff (which loads temperature and toxics to streams and contributes bacteria loading via combined sewer overflows), returned the greatest overall social-ecological benefits. Ultimately, the status quo for urban redevelopment was more favorable across the established regional recovery objectives than the rural new development status quo (Figure 6). Compared to the coordinated status quo scenario, which most accurately characterizes current management approaches, urban only or individual interventions that simultaneously control urban stormwater and wastewater (another source of toxics) had more favorable outcomes (Figures 4-7). Of course, eliminating all runoff had the best outcomes, but our results indicate that runoff constituency matters: urban-like runoff had stronger negative effects across the ecosystem compared to rural-like runoff (loading nutrients and bacteria), likely due to the myriad impacts associated with toxics. Stormwater runoff and toxics are primarily an urban problem (Walsh et al., 2012; Levin et al., 2020), and we found that modifying how these stressors are managed through urban development scenarios provided strong (i.e., consistent), favorable outcomes. Because stream water quality and quantity can be altered even at low levels of imperviousness in watersheds, development on rural land could cause stormwater to become problematic in those locations, as well (King et al., 2011). Streams respond differently to urbanization based on geographic location, prior land use, and hydrologic connectivity (Brown et al., 2009; Utz et al., 2016; Baruch et al., 2018); therefore, improved understanding of the extent to which the chemical constituency of runoff in Puget Sound watersheds changes with rural development could help refine model predictions.
Favorable (and unfavorable) outcomes were obtained for both rural new development and urban redevelopment scenarios (Figure 6), thus it is perhaps just as important how we develop as where. On urban lands, the QNMs showed that management and policy should promote redevelopment practices that adequately reduce stormwater and wastewater to address the long history of urbanization. Our results support the idea that green infrastructure, which harnesses nature-based processes to reduce urbanization impacts (pollutants, stormwater, heat islands, etc.), provides additional benefits for both social and ecological outcomes (Brink et al., 2016). Although there are challenges associated with implementation of green infrastructure (e.g., site suitability, expertise, maintenance, potential to cause “green gentrification”), there is momentum behind adaptive, ecosystem-based, and equitable approaches to designing and siting green infrastructure (Jayakaran et al., 2020). When appropriately designed, implemented, and maintained, green infrastructure and urban restoration can contribute to environmental justice by addressing legacy issues resulting from historical disinvestment (Wolch et al., 2014; Baker et al., 2019). The full breadth of social and ecological benefits should be considered when performing cost-benefit analysis for green infrastructure implementation.
We found that increasing interventions that reduce impacts associated with rural development, such as limiting the creation of new transportation corridors and increasing the extent or function of critical habitats, produced favorable outcomes similar to those of the best urban redevelopment scenario (Figure 6). However, our model does not capture the potential impact on travel or commute times and associated feedbacks to human wellbeing that could result from constraining traffic to existing roadways. On rural lands, habitat preservation and low-impact design can be used to minimize the effects of new development (Daniels and Lapping, 2005). Transferable development rights programs are a market-based approach that preserves land by encouraging development in designated areas (McConnell et al., 2006; Chiodelli and Moroni, 2016). Preservation may be particularly important in places like Puget Sound where ex-urban and rural areas are developing rapidly because of affordable housing shortages or changes to the personal or professional circumstances of residents (Ahani and Dadashpoor, 2021; Greenberg, 2021).
Recovering coastal watersheds and estuaries will likely require both restoration of the built environment to reduce ongoing urbanization impacts and protection of rural, undeveloped lands to prevent new urbanization – particularly on ecologically important lands, such as floodplains, wetlands, and riparian areas (Sonter et al., 2020). Our results further support the value of protecting and restoring these habitats. Rural development interventions that improved riparian and floodplain habitats had better outcomes than urban approaches that only controlled toxics and runoff because improving habitat provided diverse benefits for the freshwater ecosystem, such as maintaining flows and improving freshwater quality (B-IBI) (Figure 6). These upstream habitat improvements in turn have cascading downstream benefits (Capon and Pettit, 2018; Waltham et al., 2019). Furthermore, limiting new development to existing transportation corridors is important for reducing transportation-associated impacts (runoff, toxics, air pollution, etc.) on human health and ecological outcomes (NRC, 2005; Glazener et al., 2021). Given projected population growth for Puget Sound, limiting the development of new roads will necessitate changes to policies and infrastructure that optimize use of existing roadways through incentives and changes to driving culture (Litman, 2013; PSRC, 2020). Laurance and Arrea (2017) argue that proactive planning of infrastructure should be used to place roads in strategic locations that provide socioeconomic advantages while minimizing environmental damage.
Efficiencies, tradeoffs, and synergies of interventions
Moderate levels of intervention to mitigate both rural and urban development impacts simultaneously returned better results than status quo management or each intervention applied separately (topologies C and F) and returned benefits very close to the maximum level of intervention for urban (topology G) and rural lands (topology D) (Figures 6, 7). Although small-scale decision making leverages local knowledge, it may be less efficient than ecosystem-scale decision making for achieving large-scale objectives (White et al., 2012; Neeson et al., 2015; Levin et al., 2020). For example, Neeson et al. (2015) found both economic and ecological advantages associated with spatial and temporal coordination of restoration efforts in the U.S. Great Lakes. Coordination mechanisms are needed to ensure that local actions in Puget Sound effectively and efficiently contribute to regional objectives (Levin et al., 2020).
QNMs are useful for revealing tradeoffs among objectives that are otherwise difficult to foresee owing to multiple indirect interactions within a network (Dambacher et al., 2003). In QNMs, tradeoffs can be revealed in asynchronous responses among ecosystem objectives to perturbations. In the Puget Sound QNMs, nodes representing recovery objectives generally responded synchronously except Herring (discussed below). In part, this complementarity is likely due to the way that recovery objectives are defined for Puget Sound and reflected in the model. For example, the definition of Economic Vitality is tied explicitly to the condition of natural resources (Appendix Table S1), so the response of that node is aligned with biophysical objectives (e.g., Chinook spawners and Orcas). However, if defined more broadly, economic vitality encompassing more than natural resource sectors would likely to have a more complex relationship with biophysical objectives (Outwater et al., 2012; Rodríguez-Pose and Storper, 2020). Similarly, ecosystem stressor responses were sensitive to the specific characteristics of management interventions represented in our models. For example, in our network, urban redevelopment is the primary way to address toxics, so rural new development interventions did not reduce this stressor despite reducing others (Figure 6). Indeed, toxics increased in most rural development strategies because of the connection to transportation corridors (a major source of toxics) that would be constructed to service those developments (Forman et al., 2003). When development was limited to existing transportation corridors (topology D), however, the toxics node was disconnected from the perturbation indicating that limiting the development of new roads would prevent new sources of transportation-related toxics. Thus, for ecosystem objectives related to reducing toxics in runoff, the tradeoff between rural and urban development mitigation strategies can be addressed, at least in part, by attending to construction of roadways.
Herring responded asynchronously from other marine food web nodes in all scenarios, which reveals the underlying food web dynamics at play, i.e., predation of herring by Chinook salmon. However, this raises the question: why are Chinook salmon not constrained by predation pressure from orcas? This may be in part owing to model structure: the Chinook salmon nodes in the network are influenced by more biophysical nodes (e.g., Riparian Habitat, Temperature, etc.) compared to herring, and the Herring node is negatively affected by multiple potential threats (Salish Sea Pacific Herring Assessment and Management Strategy Team, 2018). The results may reflect a lack of resolution needed to capture the complex dynamics of all herring life stages and their multiple predators; neither is the model able to capture interaction strengths within food web dynamics. Specifically, the bottom-up effect of Zooplankton on Herring (as prey) has the same magnitude as the top-down predation effect on Herring by Chinook salmon, which may not be ecologically accurate. However, the conflict in these predicted outcomes for herring and Chinook salmon echoes previous work demonstrating the complexities associated with actions to recover protected predator species that consume protected prey (Marshall et al., 2016).
A challenge of qualitative network modeling generally is that network structure influences results (Dambacher et al., 2002). Therefore, we considered whether the importance of urban redevelopment and stormwater runoff was an artifact of the base model structure. The rural lands portion of the network was more complex (longer path distances between development and the nodes of interest and more feedback loops) compared to the urban lands portion. However, this additional complexity did not prevent the model from producing strong responses of objectives and stressor nodes in new development topologies C and D (Figure 6). Nor did the reduced complexity of the urban lands network preclude weak responses in urban redevelopment topologies status quo, E, and G (Figure 6). Furthermore, we believe that the comparative simplicity of the urban lands network is appropriate in this case, because humans have simplified the ecology of urban environments, including reducing habitat heterogeneity, simplifying terrestrial and aquatic food webs, and reducing stream functions (Paul and Meyer, 2001; Grimm et al., 2008; Start et al., 2020). We also rule out the role of network structure in driving the equivocal responses produced in some scenarios. High numbers of equivocal and weak responses in the combined perturbations (Figures 5, 7) reflect the complex set of positive and negative direct and indirect pathways in the network that can cancel each other out (Appendix Figures S3, S6) (Dambacher et al., 2003). In the case of the Puget Sound QNMs, the equivocal responses we observed in recovery objectives mirrors current ecosystem recovery performance – recent status reports for Puget Sound tell of little or no improvement in recovery metrics (PSP, 2022). Both clear (strong) and unclear (weak or equivocal) responses can provide valuable insight for management – unclear results highlight uncertainties resulting from management actions, indicating where additional caution or research is needed (Carey et al., 2014). In some cases, targeted actions or policies could be used to help generate the desired outcome(s). In the case of Puget Sound, unclear responses highlight management actions that are less likely to produce the desired outcomes given the specific model configuration used.
Some results can be attributed to the network structure. For example, Floodplains and Riparian Habitat were only connected to New Development and therefore were not subject to indirect feedbacks in most topologies; they responded coherently with the New Development node (except in topology H). In other cases, nodes in the network were linked by multiple links of the same sign, and the consistency of their responses was determined by the proportion of links affecting them in each perturbation. For example, Toxics was linked directly to Wastewater, Urban Runoff, and – in one scenario (topology G) – to Redevelopment. A strong negative response of Toxics was only observed when multiple sources of toxics were addressed (Redevelopment SQ and topologies F, G, and H) (Figure 6). Similarly, Edible Shellfish was linked to Algal Blooms, Bacteria, and Toxics. Strong positive responses in Edible Shellfish were observed when at least two of three stressors were reduced, and indeed an increase in Toxics still resulted in a positive response in Edible Shellfish in topology C (Figure 6). QNMs are not appropriate for evaluating the magnitudes of impacts, and these complexities highlight the importance of pairing QNMs with quantitative models to, for example, evaluate what specific reduction of toxic or bacteria loading can reduce the shellfish harvest closures (e.g., James et al., 2020).
Future directions
Another use of QNMs is to identify system relationships or dynamics that are important in determining outcomes. Model simulations here exhibited divergent weighting of relationships (i.e., particularly strong or weak links averaged across 10,000 stable simulations) related to rural land use patterns (links among New development, Transportation Corridors, Floodplains, and Summer Flows nodes) across all network topologies, suggesting that the nature of how development proceeds on rural land and associated impacts to habitats and hydrology are important regardless of management intervention. These relationships represent candidates for additional research and monitoring to better understand how outcomes are influenced by actions that could dampen or amplify these ecosystem components and their interactions. To a lesser extent, marine food web relationships were also outliers (links among Phytoplankton, Zooplankton, Chinook, and Herring), likely because these nodes had high connectivity in the system, and represent potentially important interactions. As discussed above, the relationships between rural land use patterns (new development, transportation corridors, habitats) and stressors (e.g., the constituents of stormwater runoff) were also identified as sectors of the ecosystem that warrant further investigation. As a rapid, iterative tool, the structure of the Puget Sound QNMs could be updated (by adding or removing links or nodes) and the network re-simulated when additional information describing these nodes and their interactions is gained. In a recent QNM analysis, (Forget et al., 2020) applied additional semi-quantitative validation criteria to require certain links to have weights greater or less than other links – an advancement that could be applied in the special case that there is sufficient empirical evidence to constrain the set of final simulations in this way. Furthermore, the scenarios examined here represent a subset of potential applications and the base model could be tailored to address many other coastal watershed management issues.
QNMs facilitate system-level understanding and the integration of diverse sources of information, including variables that are difficult to quantify, such as human dimensions (Metcalf et al., 2014; Dambacher et al., 2015). However, we recognize that the consideration of human dimensions in the present QNMs is more cursory than for the biophysical components. In some cases, this is representative of a lack of research and understanding of the dynamics of social-ecological relationships, but in other cases it is due to the reductionist approach that is needed for qualitative modeling (Szymkowiak and Rhodes-Reese, 2021). For example, sense of place is multifaceted, subjective, and could be differentially impacted depending on individual identities (Larson et al., 2013; Poe et al., 2016). Refinement of the variables and relationships for specific communities would probably lead to different outcomes than those predicted here. Accordingly, human dimension results should be interpreted carefully in light of the relatively weaker scientific understanding of social factors and the subjective nature of those outcomes (Szymkowiak and Rhodes-Reese, 2021). Although the recovery plans upon which we based our QNMs were developed through a participatory process, conducting additional stakeholder workshops would allow for community-specific system perceptions and preferences to be represented in the models and could be used to evaluate outcomes for specific communities of place or communities of practice (Gourguet et al., 2021).
Our tool offers predictions to help direct Puget Sound recovery, as a whole. QNMs, like other modeling approaches, have limitations that influence the interpretation of results (Reum et al., 2021). Predicted responses represent hypothetical equilibrium conditions over appropriately long time scales (Puccia and Levins, 1985; Dambacher et al., 2009). In reality, changes to outcomes and stressors resulting from interventions would manifest over time, but the lack of explicit temporal consideration in QNMs precludes us from comparing the time scales over which outcomes were achieved. For instance, toxics persist and bioaccumulate in the environment over long time scales, so management interventions to address new sources of toxics would not immediately resolve the ongoing issues associated with legacy contamination in Puget Sound (Kennish, 2002; de Souza Machado et al., 2016; Cuevas et al., 2018). There is additional uncertainty in our results from other potential changes in the Puget Sound system that would manifest over time, such as those related to climate change or cultural shifts. Our consideration of spatial components in the QNMs was also coarse – represented by the watershed framework of the base model – and does not fully represent how drivers, stressors, and outcomes may be spatially coupled or separated. Furthermore, the base model was designed to represent a generic coastal watershed in Puget Sound; refinement of the variables and relationships for specific settings or communities would probably lead to different outcomes. Although quantitative spatial-temporal models would allow us to detect how both spatial configuration and time lags impact ecosystem recovery, the lack of empirical data and additional parameterization required to describe these relationships for complex social-ecological systems, including Puget Sound, currently limits the tractability of such an approach (Metcalf, 2010).
Proposed interventions for Puget Sound recovery will be costly and enduring, therefore they should not be undertaken without informed consideration of system tradeoffs and certainty of outcomes. In addition to the tradeoffs among recovery objectives, decision makers may also wish to consider the influence of additional economic and political factors, which were outside the scope of this analysis. QNMs are a valuable decision support tool which allow us to make progress towards the goal of more sophisticated models by advancing system understanding and informing hypotheses about how impacts of recovery actions propagate across the terrestrial-freshwater-marine ecosystem of Puget Sound (Metcalf, 2010). Ultimately, this study motivates the need to work across traditional recovery silos and management groups, such as salmon biology or human health, and across jurisdictions (including tribal nations) by galvanizing interventions that have multiple benefits and bridge the interests of urban and rural landscapes.
Data availability statement
The original contributions presented in the study are included in the article/Supplementary Material. Further inquiries can be directed to the corresponding author.
Author contributions
This study was conceived of and designed by CLM and TBF. CLM performed the analyses. CLM and TBF wrote and revised the manuscript. All authors contributed to the article and approved the submitted version.
Funding
This project has been funded in part by the U.S. Environmental Protection Agency under cooperative agreement PC-01J32201-2 to the Puget Sound Partnership. The contents of this document do not necessarily reflect the views and policies of the U.S. Environmental Protection Agency, nor does mention of trade names or commercial products constitute endorsement or recommendation for use.
Acknowledgments
Many individuals in the broad Puget Sound recovery community provided input on the research questions, conceptual models, and ideas presented here. C. Wright, A. Kinney, and C.A. James, D. Trimbach, K. Sobocinski, K. Wyatt, and C. Krembs offered particularly valuable insights into early versions of the model and interpretation of results. K. Bogue created Figure 1. Feedback on an earlier draft by C. Harvey and P. Levin and the suggestions of three anonymous reviewers greatly improved the manuscript.
Conflict of interest
The authors declare that the research was conducted in the absence of any commercial or financial relationships that could be construed as a potential conflict of interest.
Publisher’s note
All claims expressed in this article are solely those of the authors and do not necessarily represent those of their affiliated organizations, or those of the publisher, the editors and the reviewers. Any product that may be evaluated in this article, or claim that may be made by its manufacturer, is not guaranteed or endorsed by the publisher.
Supplementary material
The Supplementary Material for this article can be found online at: https://www.frontiersin.org/articles/10.3389/fmars.2022.1012019/full#supplementary-material
References
Ahani S., Dadashpoor H. (2021). Urban growth containment policies for the guidance and control of peri-urbanization: A review and proposed framework. Environ. Dev. Sustain. 23, 14215–14244. doi: 10.1007/s10668-021-01268-5
Arkema K. K., Verutes G. M., Wood S. A., Clarke-Samuels C., Rosado S., Canto M., et al. (2015). Embedding ecosystem services in coastal planning leads to better outcomes for people and nature. Proc. Natl. Acad. Sci. 112, 7390–7395. doi: 10.1073/pnas.1406483112
Baker A., Brenneman E., Chang H., McPhillips L., Matsler M. (2019). Spatial analysis of landscape and sociodemographic factors associated with green stormwater infrastructure distribution in Baltimore, Maryland and Portland, Oregon. Sci. Total Environ. 664, 461–473. doi: 10.1016/j.scitotenv.2019.01.417
Barbier E. B., Hacker S. D., Kennedy C., Koch E. W., Stier A. C., Silliman B. R. (2011). The value of estuarine and coastal ecosystem services. Ecol. Monogr. 81, 169–193. doi: 10.1890/10-1510.1
Baruch E. M., Voss K. A., Blaszczak J. R., Delesantro J., Urban D. L., Bernhardt E. S. (2018). Not all pavements lead to streams: Variation in impervious surface connectivity affects urban stream ecosystems. Freshw. Sci. 37, 673–684. doi: 10.1086/699014
Brink E., Aalders T., Ádám D., Feller R., Henselek Y., Hoffmann A., et al. (2016). Cascades of green: A review of ecosystem-based adaptation in urban areas. Glob. Environ. Change 36, 111–123. doi: 10.1016/j.gloenvcha.2015.11.003
Brown L. R., Cuffney T. F., Coles J. F., Fitzpatrick F., McMahon G., Steuer J., et al. (2009). Urban streams across the USA: Lessons learned from studies in 9 metropolitan areas. J. North Am. Benthol. Soc 28, 1051–1069. doi: 10.1899/08-153.1
Capon S. J., Pettit N. E. (2018). Turquoise is the new green: Restoring and enhancing riparian function in the anthropocene. Ecol. Manage. Restor. 19, 44–53. doi: 10.1111/emr.12326
Carey M. P., Levin P. S., Townsend H., Minello T. J., Sutton G. R., Francis T. B., et al. (2014). Characterizing coastal foodwebs with qualitative links to bridge the gap between the theory and the practice of ecosystem-based management. ICES J. Mar. Sci. 71, 713–724. doi: 10.1093/icesjms/fst012
Chiodelli F., Moroni S. (2016). Zoning-integrative and zoning-alternative transferable development rights: Compensation, equity, efficiency. Land Use Policy 52, 422–429. doi: 10.1016/j.landusepol.2016.01.006
Cloern J. E., Abreu P. C., Carstensen J., Chauvaud L., Elmgren R., Grall J., et al. (2016). Human activities and climate variability drive fast-paced change across the world’s estuarine–coastal ecosystems. Glob. Change Biol. 22, 513–529. doi: 10.1111/gcb.13059
Connor M. S., Davis J. A., Leatherbarrow J., Greenfield B. K., Gunther A., Hardin D., et al. (2007). The slow recovery of San Francisco bay from the legacy of organochlorine pesticides. Environ. Res. 105, 87–100. doi: 10.1016/j.envres.2006.07.001
Csardi G., Nepusz T. (2006). The igraph software package for complex network research. InterJournal Complex Syst. 1695, 1–9.
Cuevas N., Martins M., Costa P. M. (2018). Risk assessment of pesticides in estuaries: A review addressing the persistence of an old problem in complex environments. Ecotoxicology 27, 1008–1018. doi: 10.1007/s10646-018-1910-z
Dambacher J. M., Gaughan D. J., Rochet M.-J., Rossignol P. A., Trenkel V. M. (2009). Qualitative modelling and indicators of exploited ecosystems. Fish Fish. 10, 305–322. doi: 10.1111/j.1467-2979.2008.00323.x
Dambacher J. M., Li H. W., Rossignol P. A. (2002). Relevance of community structure in assessing indeterminacy of ecological predictions. Ecology 83, 1372–1385. doi: 10.1890/0012-9658(2002)083[1372:ROCSIA]2.0.CO;2
Dambacher J. M., Luh H., Li H. W., Rossignol P. A. (2003). Qualitative stability and ambiguity in model ecosystems. Am. Nat. 161, 876–888. doi: 10.1086/367590
Dambacher J. M., Rothlisberg P. C., Loneragan N. R. (2015). Qualitative mathematical models to support ecosystem-based management of australia’s northern prawn fishery. Ecol. Appl. 25, 278–298. doi: 10.1890/13-2030.1
Daniels T., Lapping M. (2005). Land preservation: An essential ingredient in smart growth. J. Plan. Lit. 19, 316–329. doi: 10.1177/0885412204271379
de Souza Machado A. A., Spencer K., Kloas W., Toffolon M., Zarfl C. (2016). Metal fate and effects in estuaries: A review and conceptual model for better understanding of toxicity. Sci. Total Environ. 541, 268–281. doi: 10.1016/j.scitotenv.2015.09.045
Duarte C. M., Borja A., Carstensen J., Elliott M., Krause-Jensen D., Marbà N. (2015). Paradigms in the recovery of estuarine and coastal ecosystems. Estuaries Coasts 38, 1202–1212. doi: 10.1007/s12237-013-9750-9
Ettinger A. K., Buhle E. R., Feist B. E., Howe E., Spromberg J. A., Scholz N. L., et al. (2021). Prioritizing conservation actions in urbanizing landscapes. Sci. Rep. 11, 818. doi: 10.1038/s41598-020-79258-2
Forget N. L., Duplisea D. E., Sardenne F., McKindsey C. W. (2020). Using qualitative network models to assess the influence of mussel culture on ecosystem dynamics.Ecol Modell 430, 109070. doi: 10.1016/j.ecolmodel.2020.109070
Forman R. T. T., Sperling D., Bissonette J. A., Clevenger A. P., Cutshall C. D., Dale V. H., et al. (2003). Road ecology: Science and solutions (Washington, DC, United States: Island Press).
Fulton E. A., Link J. S., Kaplan I. C., Savina-Rolland M., Johnson P., Ainsworth C., et al. (2011). Lessons in modelling and management of marine ecosystems: the Atlantis experience. Fish Fish. 12, 171–188. doi: 10.1111/j.1467-2979.2011.00412.x
Glazener A., Sanchez K., Ramani T., Zietsman J., Nieuwenhuijsen M. J., Mindell J. S., et al. (2021). Fourteen pathways between urban transportation and health: A conceptual model and literature review. J. Transp. Health 21, 101070. doi: 10.1016/j.jth.2021.101070
Gourguet S., Marzloff M. P., Bacher C., Boudry P., Cugier P., Dambacher J. M., et al. (2021). Participatory qualitative modeling to assess the sustainability of a coastal socio-ecological system. Front. Ecol. Evol. 9. doi: 10.3389/fevo.2021.635857
Greenberg M. (2021). Seeking shelter: : How housing and urban exclusion shape exurban disaster. Sociologica 15, 67–89. doi: 10.6092/issn.1971-8853/11869
Green L., Magel C., Brown C. (2021). Management pathways for the successful reduction of nonpoint source nutrients in coastal ecosystems. Reg. Stud. Mar. Sci. 45, 101851. doi: 10.1016/j.rsma.2021.101851
Grimm N. B., Faeth S. H., Golubiewski N. E., Redman C. L., Wu J., Bai X., et al. (2008). Global change and the ecology of cities. Science 319, 756–760. doi: 10.1126/science.1150195
Harvey C. J., Reum J. C. P., Poe M. R., Williams G. D., Kim S. J. (2016). Using conceptual models and qualitative network models to advance integrative assessments of marine ecosystems. Coast. Manage. 44, 486–503. doi: 10.1080/08920753.2016.1208881
Hepinstall-Cymerman J., Coe S., Hutyra L. R. (2013). Urban growth patterns and growth management boundaries in the central puget sound, washingto –2007. Urban Ecosyst. 16, 109–129. doi: 10.1007/s11252-011-0206-3
Hodgson E. E., Wilson S. M., Moore J. W. (2020). Changing estuaries and impacts on juvenile salmon: A systematic review. Glob. Chang Biol. 26, 1986–2001. doi: 10.1111/gcb.14997
Hollowed A. B., Holsman K. K., Haynie A. C., Hermann A. J., Punt A. E., Aydin K., et al. (2020). Integrated modeling to evaluate climate change impacts on coupled social-ecological systems in Alaska. Front. Mar. Sci. 6. doi: 10.3389/fmars.2019.00775
Hood R. R., Shenk G. W., Dixon R. L., Smith S. M. C., Ball W. P., Bash J. O., et al. (2021). The Chesapeake bay program modeling system: Overview and recommendations for future development. Ecol. Modell. 456, 109635. doi: 10.1016/j.ecolmodel.2021.109635
James C. A., Lanksbury J., Khangaonkar T., West J. (2020). Evaluating exposures of bay mussels (Mytilus trossulus) to contaminants of emerging concern through environmental sampling and hydrodynamic modeling. Sci. Total Environ. 709, 136098. doi: 10.1016/j.scitotenv.2019.136098
Jantz P., Goetz S., Jantz C. (2005). Urbanization and the loss of resource lands in the Chesapeake bay watershed. Environ. Manage. 36, 808–825. doi: 10.1007/s00267-004-0315-3
Jayakaran A. D., Moffett K. B., Padowski J. C., Townsend P. A., Gaolach B. (2020). Green infrastructure in western Washington and Oregon: Perspectives from a regional summit. Urban For. Urban Green. 50, 126654. doi: 10.1016/j.ufug.2020.126654
Kennish M. J. (2002). Environmental threats and environmental future of estuaries. Environ. Conserv. 29, 78–107. doi: 10.1017/S0376892902000061
Kennish M. J. (2021). Drivers of change in estuarine and coastal marine environments: an overview. Open J. Ecol. 11, 224. doi: 10.4236/oje.2021.113017
Khangaonkar T., Nugraha A., Xu W., Long W., Bianucci L., Ahmed A., et al. (2018). Analysis of hypoxia and sensitivity to nutrient pollution in salish Sea. J. Geophys. Res. Oceans 123, 4735–4761. doi: 10.1029/2017JC013650
King R. S., Baker M. E., Kazyak P. F., Weller D. E. (2011). How novel is too novel? stream community thresholds at exceptionally low levels of catchment urbanization. Ecol. Appl. 21, 1659–1678. doi: 10.1890/10-1357.1
Larson S., De Freitas D. M., Hicks C. C. (2013). Sense of place as a determinant of people’s attitudes towards the environment: Implications for natural resources management and planning in the great barrier reef, Australia. J. Environ. Manage. 117, 226–234. doi: 10.1016/j.jenvman.2012.11.035
Laurance W. F., Arrea I. B. (2017). Roads to riches or ruin? Science 358, 442–444. doi: 10.1126/science.aao0312
Levin P. S., Howe E. R., Robertson J. C. (2020). Impacts of stormwater on coastal ecosystems: the need to match the scales of management objectives and solutions. Philos. Trans. R. Soc B: Biol. Sci. 375, 20190460. doi: 10.1098/rstb.2019.0460
Levins R. (1974). Discussion paper: the qualitative analysis of partially specific systems. Ann. N. Y. Acad. Sci. 231, 123–138. doi: 10.1111/j.1749-6632.1974.tb20562.x
Link J. S., Ihde T. F., Harvey C. J., Gaichas S. K., Field J. C., Brodziak J. K. T., et al. (2012). Dealing with uncertainty in ecosystem models: The paradox of use for living marine resource management. Prog. Oceanogr. 102, 102–114. doi: 10.1016/j.pocean.2012.03.008
Litman T. (2013). Transportation and public health. Annu. Rev. Public Health 34, 217–233. doi: 10.1146/annurev-publhealth-031912-114502
Lotze H. K., Lenihan H. S., Bourque B. J., Bradbury R. H., Cooke R. G., Kay M. C., et al. (2006). Depletion, degradation, and recovery potential of estuaries and coastal seas. Science 312, 1806–1809. doi: 10.1126/science.1128035
Marshall K. N., Stier A. C., Samhouri J. F., Kelly R. P., Ward E. J. (2016). Conservation challenges of predator recovery. Conserv. Lett. 9, 70–78. doi: 10.1111/conl.12186
Martyr-Koller R. C., Kernkamp H. W. J., van Dam A., van der Wegen M., Lucas L. V., Knowles N., et al. (2017). Application of an unstructured 3D finite volume numerical model to flows and salinity dynamics in the San Francisco bay-delta. Estuar. Coast. Shelf Sci. 192, 86–107. doi: 10.1016/j.ecss.2017.04.024
McCarthy S. G., Incardona J. P., Scholz N. L. (2008). Coastal storms, toxic runoff, and the sustainable conservation of fish and fisheries. Am. Fisheries Soc. Symposium 64: 7–27.
McConnell V., Kopits E., Walls M. (2006). Using markets for land preservation: results of a TDR program. J. Environ. Plan. Manage. 49, 631–651. doi: 10.1080/09640560600849913
Melbourne-Thomas J., Wotherspoon S., Raymond B., Constable A. (2012). Comprehensive evaluation of model uncertainty in qualitative network analyses. Ecol. Monogr. 82, 505–519. doi: 10.1890/12-0207.1
Metcalf S. J. (2010). Qualitative models to complement quantitative ecosystem models for the analysis of data-limited marine ecosystems and fisheries. Rev. Fish. Sci. 18, 248–265. doi: 10.1080/10641262.2010.505670
Metcalf S. J., Dambacher J. M., Rogers P., Loneragan N., Gaughan D. J. (2014). Identifying key dynamics and ideal governance structures for successful ecological management. Environ. Sci. Policy 37, 34–49. doi: 10.1016/j.envsci.2013.07.005
National Research Council (NRC) (2005). Assessing and managing the ecological impacts of paved roads (Washington, DC, United States: National Academies Press).
Neeson T. M., Ferris M. C., Diebel M. W., Doran P. J., O’Hanley J. R., McIntyre P. B. (2015). Enhancing ecosystem restoration efficiency through spatial and temporal coordination. Proc. Natl. Acad. Sci. 112, 6236–6241. doi: 10.1073/pnas.1423812112
Neumann B., Vafeidis A. T., Zimmermann J., Nicholls R. J. (2015). Future coastal population growth and exposure to sea-level rise and coastal flooding - a global assessment. PloS One 10, e0118571. doi: 10.1371/journal.pone.0118571
NOAA (National Oceanic and Atmospheric Administration) (2013) National coastal population report: Population trends from 1970 to 2020 (Washington, DC, United States: Silver Spring) (Accessed October 12, 2021).
Okamoto D. K., Poe M. R., Francis T. B., Punt A. E., Levin P. S., Shelton A. O., et al. (2020). Attending to spatial social–ecological sensitivities to improve trade-off analysis in natural resource management. Fish Fish. 21, 1–12. doi: 10.1111/faf.12409
Outwater M. L., Adler T., Dumont J., Kitchen M., Bassok A. (2012). Quantitative approaches for project prioritization: Case study in puget sound, Washington. Transp. Res. Rec. 2303, 108–116. doi: 10.3141/2303-12
Paul M. J., Meyer J. L. (2001). Streams in the urban landscape. Annu. Rev. Ecol. Evol. Syst. 32, 333–365. doi: 10.1146/annurev.ecolsys.32.081501.114040
Poe M. R., Donatuto J., Satterfield T. (2016). “Sense of place”: Human wellbeing considerations for ecological restoration in puget sound. Coast. Manage. 44, 409–426. doi: 10.1080/08920753.2016.1208037
PSP (Puget Sound Partnership) (2022) State of the sound report 2021 (Olympia, Washington) (Accessed April 7, 2022).
PSRC (Puget Sound Regional Council) (2020) Vision 2050: A plan for the central puget sound region (Seattle, WA) (Accessed October 8, 2021).
Puccia C. J., Levins R. (1985). Qualitative modeling of complex systems: An introduction to loop analysis and time averaging (Cambridge, MA, United States: Harvard University Press).
Reum J. C. P., Ferriss B. E., McDonald P. S., Farrell D. M., Harvey C. J., Klinger T., et al. (2015a). Evaluating community impacts of ocean acidification using qualitative network models. Mar. Ecol. Prog. Ser. 536, 11–24. doi: 10.3354/meps11417
Reum J. C. P., Kelble C. R., Harvey C. J., Wildermuth R. P., Trifonova N., Lucey S. M., et al. (2021). Network approaches for formalizing conceptual models in ecosystem-based management. ICES J. Mar. Sci. 78, 3674–3686. doi: 10.1093/icesjms/fsab211
Reum J. C. P., McDonald P. S., Ferriss B. E., Farrell D. M., Harvey C. J., Levin P. S. (2015b). Qualitative network models in support of ecosystem approaches to bivalve aquaculture. ICES J. Mar. Sci. 72, 2278–2288. doi: 10.1093/icesjms/fsv119
Rodríguez-Pose A., Storper M. (2020). Housing, urban growth and inequalities: the limits to deregulation and upzoning in reducing economic and spatial inequality. Urban Stud. 57, 223–248. doi: 10.1177/0042098019859458
Ruckelshaus M. H., McClure M. (2007) Sound science: synthesizing ecological and socioeconomic information about the puget sound ecosystem (Seattle, WA: National Oceanic & Atmospheric Administration (NMFS), Northwest Fisheries Science Center) (Accessed July 16, 2021).
Sale P. F., Agardy T., Ainsworth C. H., Feist B. E., Bell J. D., Christie P., et al. (2014). Transforming management of tropical coastal seas to cope with challenges of the 21st century. Mar. pollut. Bull. 85, 8–23. doi: 10.1016/j.marpolbul.2014.06.005
Salish Sea Pacific Herring Assessment and Management Strategy Team (2018) Assessment and management of pacific herring in the salish Sea: Conserving and recovering a culturally significant and ecologically critical component of the food web (Orcas Island, WA: The SeaDoc Society) (Accessed July 16, 2021).
Shelton A. O., Francis T. B., Feist B. E., Williams G. D., Lindquist A., Levin P. S. (2017). Forty years of seagrass population stability and resilience in an urbanizing estuary. J. Ecol. 105, 458–470. doi: 10.1111/1365-2745.12682
Sobocinski K. L., Greene C. M., Schmidt M. W. (2018). Using a qualitative model to explore the impacts of ecosystem and anthropogenic drivers upon declining marine survival in pacific salmon. Environ. Conserv. 45, 278–290. doi: 10.1017/S0376892917000509
Sonter L. J., Simmonds J. S., Watson J. E. M., Jones J. P. G., Kiesecker J. M., Costa H. M., et al. (2020). Local conditions and policy design determine whether ecological compensation can achieve no net loss goals. Nat. Commun. 11:1–11. doi: 10.1038/s41467-020-15861-1
Start D., Barbour M. A., Bonner C. (2020). Urbanization reshapes a food web. J. Anim. Ecol. 89, 808–816. doi: 10.1111/1365-2656.13136
Szymkowiak M., Rhodes-Reese M. (2021). Examining the expansion of qualitative network models towards integrating multifaceted human dimensions. ICES J. Mar. Sci. 78, 2395–2408. doi: 10.1093/icesjms/fsab105
Teichert N., Borja A., Chust G., Uriarte A., Lepage M. (2016). Restoring fish ecological quality in estuaries: Implication of interactive and cumulative effects among anthropogenic stressors. Sci. Total Environ. 542, 383–393. doi: 10.1016/j.scitotenv.2015.10.068
Utz R. M., Hopkins K. G., Beesley L., Booth D. B., Hawley R. J., Baker M. E., et al. (2016). Ecological resistance in urban streams: the role of natural and legacy attributes. Freshw. Sci. 35, 380–397. doi: 10.1086/684839
Walsh C. J., Fletcher T. D., Burns M. J. (2012). Urban stormwater runoff: a new class of environmental flow problem. PloS One 7, e45814. doi: 10.1371/journal.pone.0045814
Walsh C. J., Roy A. H., Feminella J. W., Cottingham P. D., Groffman P. M., Morgan R. P. (2005). The urban stream syndrome: Current knowledge and the search for a cure. J. North Am. Benthol. Soc 24, 706–723. doi: 10.1899/04-028.1
Waltham N. J., Burrows D., Wegscheidl C., Buelow C., Ronan M., Connolly N., et al. (2019). Lost floodplain wetland environments and efforts to restore connectivity, habitat, and water quality settings on the great barrier reef. Front. Mar. Sci. 6. doi: 10.3389/fmars.2019.00071
White C., Costello C., Kendall B. E., Brown C. J. (2012). The value of coordinated management of interacting ecosystem services. Ecol. Lett. 15, 509–519. doi: 10.1111/j.1461-0248.2012.01773.x
Wilson K. A., Carwardine J., Possingham H. P. (2009). Setting conservation priorities. Ann. N. Y. Acad. Sci. 1162, 237–264. doi: 10.1111/j.1749-6632.2009.04149.x
Keywords: ecosystem recovery, social-ecological system, population growth, qualitative network models, multiple benefits, estuaries, watersheds, aquatic-terrestrial interactions
Citation: Magel CL and Francis TB (2022) Evaluating ecosystem-based management alternatives for the Puget Sound, U.S.A. social-ecological system using qualitative watershed models. Front. Mar. Sci. 9:1012019. doi: 10.3389/fmars.2022.1012019
Received: 04 August 2022; Accepted: 11 October 2022;
Published: 02 November 2022.
Edited by:
Ana C. Brito, University of Lisbon, PortugalReviewed by:
Jonathan Moore, Simon Fraser University, CanadaTracy Collier, Western Washington University, United States
Amie West, Texas A&M University Corpus Christi, United States
Copyright © 2022 Magel and Francis. This is an open-access article distributed under the terms of the Creative Commons Attribution License (CC BY). The use, distribution or reproduction in other forums is permitted, provided the original author(s) and the copyright owner(s) are credited and that the original publication in this journal is cited, in accordance with accepted academic practice. No use, distribution or reproduction is permitted which does not comply with these terms.
*Correspondence: Caitlin L. Magel, magelcai@uw.edu
†ORCID: Caitlin L. Magel, orcid.org/0000-0003-4843-3553
Tessa B. Francis, orcid.org/0000-0002-3383-5392