Rolling Deck to Repository: Supporting the marine science community with data management services from academic research expeditions
 Suzanne M. Carbotte1*†
  Suzanne O’Hara1†
  Karen Stocks2† P. Dru Clark2† Laura Stolp3† Shawn R. Smith4† Kristen Briggs4 Rebecca Hudak3 Emily Miller1 Chris J. Olson2 Neville Shane1 Rafael Uribe1
  Robert Arko1†
  Cynthia L. Chandler3
  Vicki Ferrini1 Stephen P. Miller2 Alice Doyle5 James Holik6
- 1Lamont-Doherty Earth Observatory, Columbia University, New York, NY, United States
- 2Scripps Institution of Oceanography, University of California San Diego, La Jolla, CA, United States
- 3Woods Hole Oceanographic Institution, Woods Hole, MA, United States
- 4Center for Ocean-Atmospheric Prediction Studies, Florida State University, Tallahassee, FL, United States
- 5University-National Oceanographic Laboratory System Office, University of Washington, Seattle, WA, United States
- 6Ocean Sciences Division, National Science Foundation, Washington, DC, United States
Direct observations of the oceans acquired on oceanographic research ships operated across the international community support fundamental research into the many disciplines of ocean science and provide essential information for monitoring the health of the oceans. A comprehensive knowledge base is needed to support the responsible stewardship of the oceans with easy access to all data acquired globally. In the United States, the multidisciplinary shipboard sensor data routinely acquired each year on the fleet of coastal, regional and global ranging vessels supporting academic marine research are managed by the Rolling Deck to Repository (R2R, rvdata.us) program. With over a decade of operations, the R2R program has developed a robust routinized system to transform diverse data contributions from different marine data providers into a standardized and comprehensive collection of global-ranging observations of marine atmosphere, ocean, seafloor and subseafloor properties that is openly available to the international research community. In this article we describe the elements and framework of the R2R program and the services provided. To manage all expeditions conducted annually, a fleet-wide approach has been developed using data distributions submitted from marine operators with a data management workflow designed to maximize automation of data curation. Other design goals are to improve the completeness and consistency of the data and metadata archived, to support data citability, provenance tracking and interoperable data access aligned with FAIR (findable, accessible, interoperable, reusable) recommendations, and to facilitate delivery of data from the fleet for global data syntheses. Findings from a collection-level review of changes in data acquisition practices and quality over the past decade are presented. Lessons learned from R2R operations are also discussed including the benefits of designing data curation around the routine practices of data providers, approaches for ensuring preservation of a more complete data collection with a high level of FAIRness, and the opportunities for homogenization of datasets from the fleet so that they can support the broadest re-use of data across a diverse user community.
1. Introduction
The global oceans cover more than 70% of Earth’s surface, and impact life on earth in numerous ways. They play an important role in regulating climate, host devastating tectonic geohazards, and provide essential food and natural resources. Many of the most pressing challenges facing humanity in the 21st century will require new scientific investigations and observations within the oceans and the need for ocean observations is rapidly expanding. Central to our ocean observing and marine research capability are oceanographic research vessels which enable the collection of physical samples and in situ measurements of environmental parameters. Increasingly, research vessels are outfitted as multi-purpose platforms that acquire a diversity of data types routinely while at sea, regardless of the specific science mission of each cruise. The data acquired with these multi-purpose research vessels are of high scientific value for building global syntheses of properties spanning sea surface to subseafloor, climatologies, and historical time series of atmospheric and oceanic properties. They are used for ground truthing of satellite observations, as fundamental data constraints for global ocean models, and as core background data sets for a wide range of scientific investigations. These data are also of high value for more applied studies such as fisheries and coastal management and for informing marine policy to protect these resources. Fit-for-purpose marine data management systems that provide free and open data access for current and future users are essential components of the infrastructure supporting marine research and ocean monitoring (UNESCO, 2017; Speich et al., 2019).
Oceanographic research conducted by the academic community in the United States (US) is supported by a fleet of research vessels with funding from the US National Science Foundation (NSF), Office of Naval Research and other federal agencies and private sources (National Research Council, 2009; National Research Council, 2015; UNOLS, 2019). This research vessel fleet facilitates coastal to deep ocean “blue water” oceanography as well as polar studies in the Arctic Ocean and around Antarctica. Historically, the archiving of data from US academic research expeditions was the primary responsibility of chief scientists and science parties per NSF data policies with expectation of submission to the national data centers run by the National Oceanographic and Atmospheric Agency (NOAA). However, fulfilling this mandate was ad hoc and sparse, and the preservation of these unique and high value research datasets was highly limited.
The Rolling Deck to Repository (R2R) program was launched in 2009 to provide consistent and comprehensive data management services for the ship-board environmental sensor data from academic research expeditions in the US, initially focused on the research vessels operated through the University National Oceanographic Laboratory System (UNOLS) system and US Coast Guard Healy (Figure 1, www.rvdata.us). The program was developed as a multi-institution collaboration between groups with expertise in marine science data management at Lamont-Doherty Earth Observatory of Columbia University, Scripps Institution of Oceanography at the University of California San Diego, Woods Hole Oceanographic Institute and the Center for Ocean-Atmospheric Prediction Studies at the Florida State University. The NSF Oceanographic Instrumentation and Technical Services Program and the Office of Naval Research have provided ongoing funding support since inception. The services of the R2R program have been developed in close partnership with marine facility operators, funding agencies, the National Environmental Data Centers (NCEI) operated by NOAA, and the US marine science community through guidance from the UNOLS and the R2R Science Advisory Committee. In this article we describe the components of the R2R program, the services provided, and the technical framework supporting the system. Insights on changes in acquisition practices from a review of quality assessment and processing results of example data types (multi-beam sonar and navigation) for the past decade are discussed. Lessons learned from R2R operations working close to data acquisition to support data reusability are presented. While the R2R system manages data curation for the US academic research fleet, the multi-parameter data collection served is openly and freely accessible to the broader international marine community, supporting scientific research around the globe.
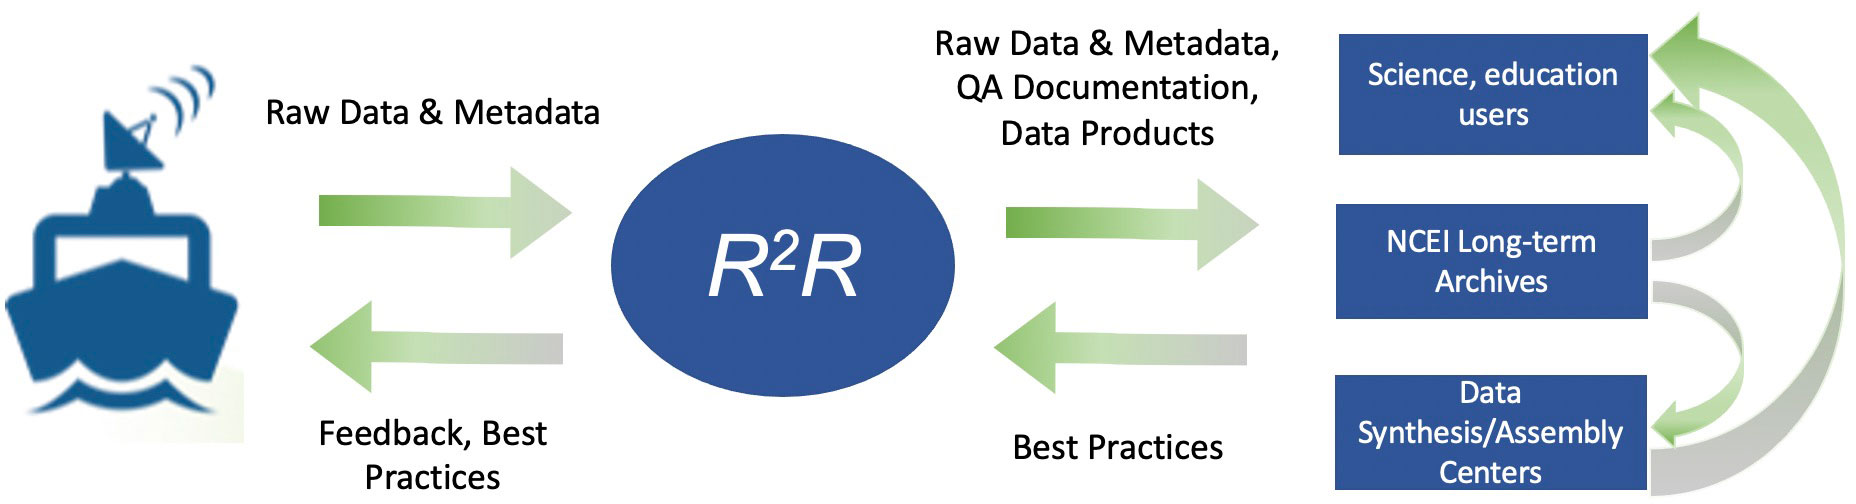
Figure 1 Schematic illustration of data flow and role of R2R in the management of shipboard sensor data from U.S operated research vessels.
2. Components of the R2R data curation system
The data services provided by R2R support the management and curation of the shipboard sensor data and ensure the raw, as-acquired data are documented and preserved at their full resolution. Data services include cruise and dataset documentation to support reuse and proper attribution to data originators, as well as data publication, distribution, and support for long-term preservation. We collaborate with ship operators to obtain the final underway data distribution from all cruises along with basic cruise level information (e.g. who, where, when). The cruise distribution is “broken out” (classified into individual datasets according to instrument system and file format) and documented with file format and size information using scripted tools based on detailed information about the directory location of the recorded filesets from each sensor within the cruise data distribution, and the file naming protocols used (the Vessel Profile). The device types broken out are from instruments operated aboard most ships including singlebeam echo sounder (SBES), conductivity temperature depth (CTD), meteorological (MET), thermosalinograph (TSG), acoustic doppler current profiler (ADCP), expendable bathythermograph (XBT) and Global Positioning System (GPS) sensors, as well as more specialized instrumentation operated on a subset of the fleet including multibeam echo sounder (MBES), gravimeter, magnetometer, pCO2, and other flow-through water sensors. Information on shipboard time servers and the time source for each device are also collected. Permission to release the data is requested from the Chief Scientist of each cruise per NSF data policies for data that are less than 2 years since acquisition. Upon release, data are made publicly available under the Creative Commons Public Domain Mark 1.0 (Creative Commons, 2022). Individual device datasets are “bagged and tagged” (bundled with standard metadata for the device and the data file manifest) and, for the primary data types, submitted to NOAA’s NCEI which provides for long-term archiving of marine environmental data following OAIS protocols (CCSDS and Consultative Committee for Space Data Systems, 2012). Post-cruise semi-automated quality assessment (QA) and data products are provided for select high value data types, including a final navigation product. R2R also provides some support for at-sea operations to enhance data documentation and reusability. Services include the R2R Eventlog application which builds upon and extends the eventlog application described in Ritt (2019) and provides for standardized capture of at-sea sampling and acquisition events (Maffei et al., 2012). The other primary at-sea service provided is near real-time quality control (QC) of MET and TSG data through partnership with the Shipboard Automated Meteorological and Oceanographic System Initiative (SAMOS, Smith et al., 2018). These QC services allow for timely feedback to operators on instrument health frequently resulting in repairs to sensors prior to collection of an entire cruise worth of suspect observations, and provide near real-time MET and TSG data in a standard format to support satellite and model validation (e.g., Bourassa et al., 2003; Li et al., 2013) and creation of global data syntheses (e.g., Freeman et al., 2017).
The complete set of broken out extracted datasets, cruise information, event logs (if acquired), and QC/QA products are findable and accessible through the R2R Cruise Catalog. Direct links to the NCEI archives are given for datasets once they are available in their system, with R2R hosting for the data types NOAA does not routinely archive. All broken out datasets as well as cruise metadata records are published and citable with DataCite DOIs (DataCite, 2022) which provide persistent unique identifiers. Internationally agreed upon controlled vocabularies are used for cruise metadata elements (e.g. International Council for the Exploration of the Sea (ICES) for vessels, see Supplementary Material) and device types are mapped to the SeaVoX Device Catalog, hosted by the British Oceanographic Data Center and implemented in the SeaDataNet system (SeaDataNet, 2022; Schaap and Lowry, 2010). In addition to access through the R2R Cruise Catalog, R2R data resources are available via application programming interfaces (APIs) to support interoperability with other data centers and enable others to design their own tools for machine-to-machine access to data (www.rvdata.us/about/technical-details/services). Data sets can also be discovered through Google dataset searches and earth sciences-specific discovery portals such as the EarthCube GeoCODES portal, facilitated by web-accessible metadata and schema.org protocols (Guha, 2011). Further technical details on the R2R infrastructure, including software components, the data model, metadata standards (ISO and DataCite) and controlled vocabularies used are included in the Supplementary Materials.
2.1. Importance of the cruise context
Unlike many field programs on land, marine expeditions are inherently multidisciplinary in nature with the shipboard sensors providing measurements of many aspects of the marine environment irrespective of the science goals of the cruise. Preserving the cruise context under which these data are acquired is important for future reuse of the diverse multi-parameter co-located datasets which are typically archived in different data repositories and/or collections. On many cruises, scientists bring their own instrumentation on board, or instrumentation operated by other groups is deployed, and in the US these data are managed primarily by other disciplinary-focused data facilities (e.g., Marine Geoscience Data System, Biological and Chemical Oceanography Data Management Office, CLIVAR and Carbon Hydrographic Data Office, and NCEI). The cruise context provides the integrating framework, and is key for tracking provenance and enabling appropriate acknowledgement to data originators as datasets are processed and incorporated into global syntheses and other higher-level products by dedicated data assembly centers (DACs) or as part of targeted science projects. The cruise context also allows for better tracking of the original funding award information which is increasingly included in scientific publications. It allows for field data to be linked to scientific publications which document knowledge derived from the data and inform appropriate re-use.
The R2R Cruise Catalog is designed to provide a central resource for access to data and information about each cruise. This information includes cruise summary metadata, an inventory of the submitted underway data distribution, all broken out datasets, links to quality assessment results and data products, and to cruise reports if contributed by science parties (Figure 2). The concept of cruise DOIs as persistent identifiers for cruise events was developed by R2R (Arko et al., 2016) to contribute to the goal of preserving the cruise context and is included as part of the standard documentation for all datasets. Cruise DOIs resolve to R2R’s Cruise Catalog page for that cruise. Cruise DOI’s have also been deployed to support reciprocal linking with the other disciplinary-focused data facilities that manage ship-based data, enabling discovery of this broader suite of field data acquired in support of academic research via the R2R Cruise Catalog.
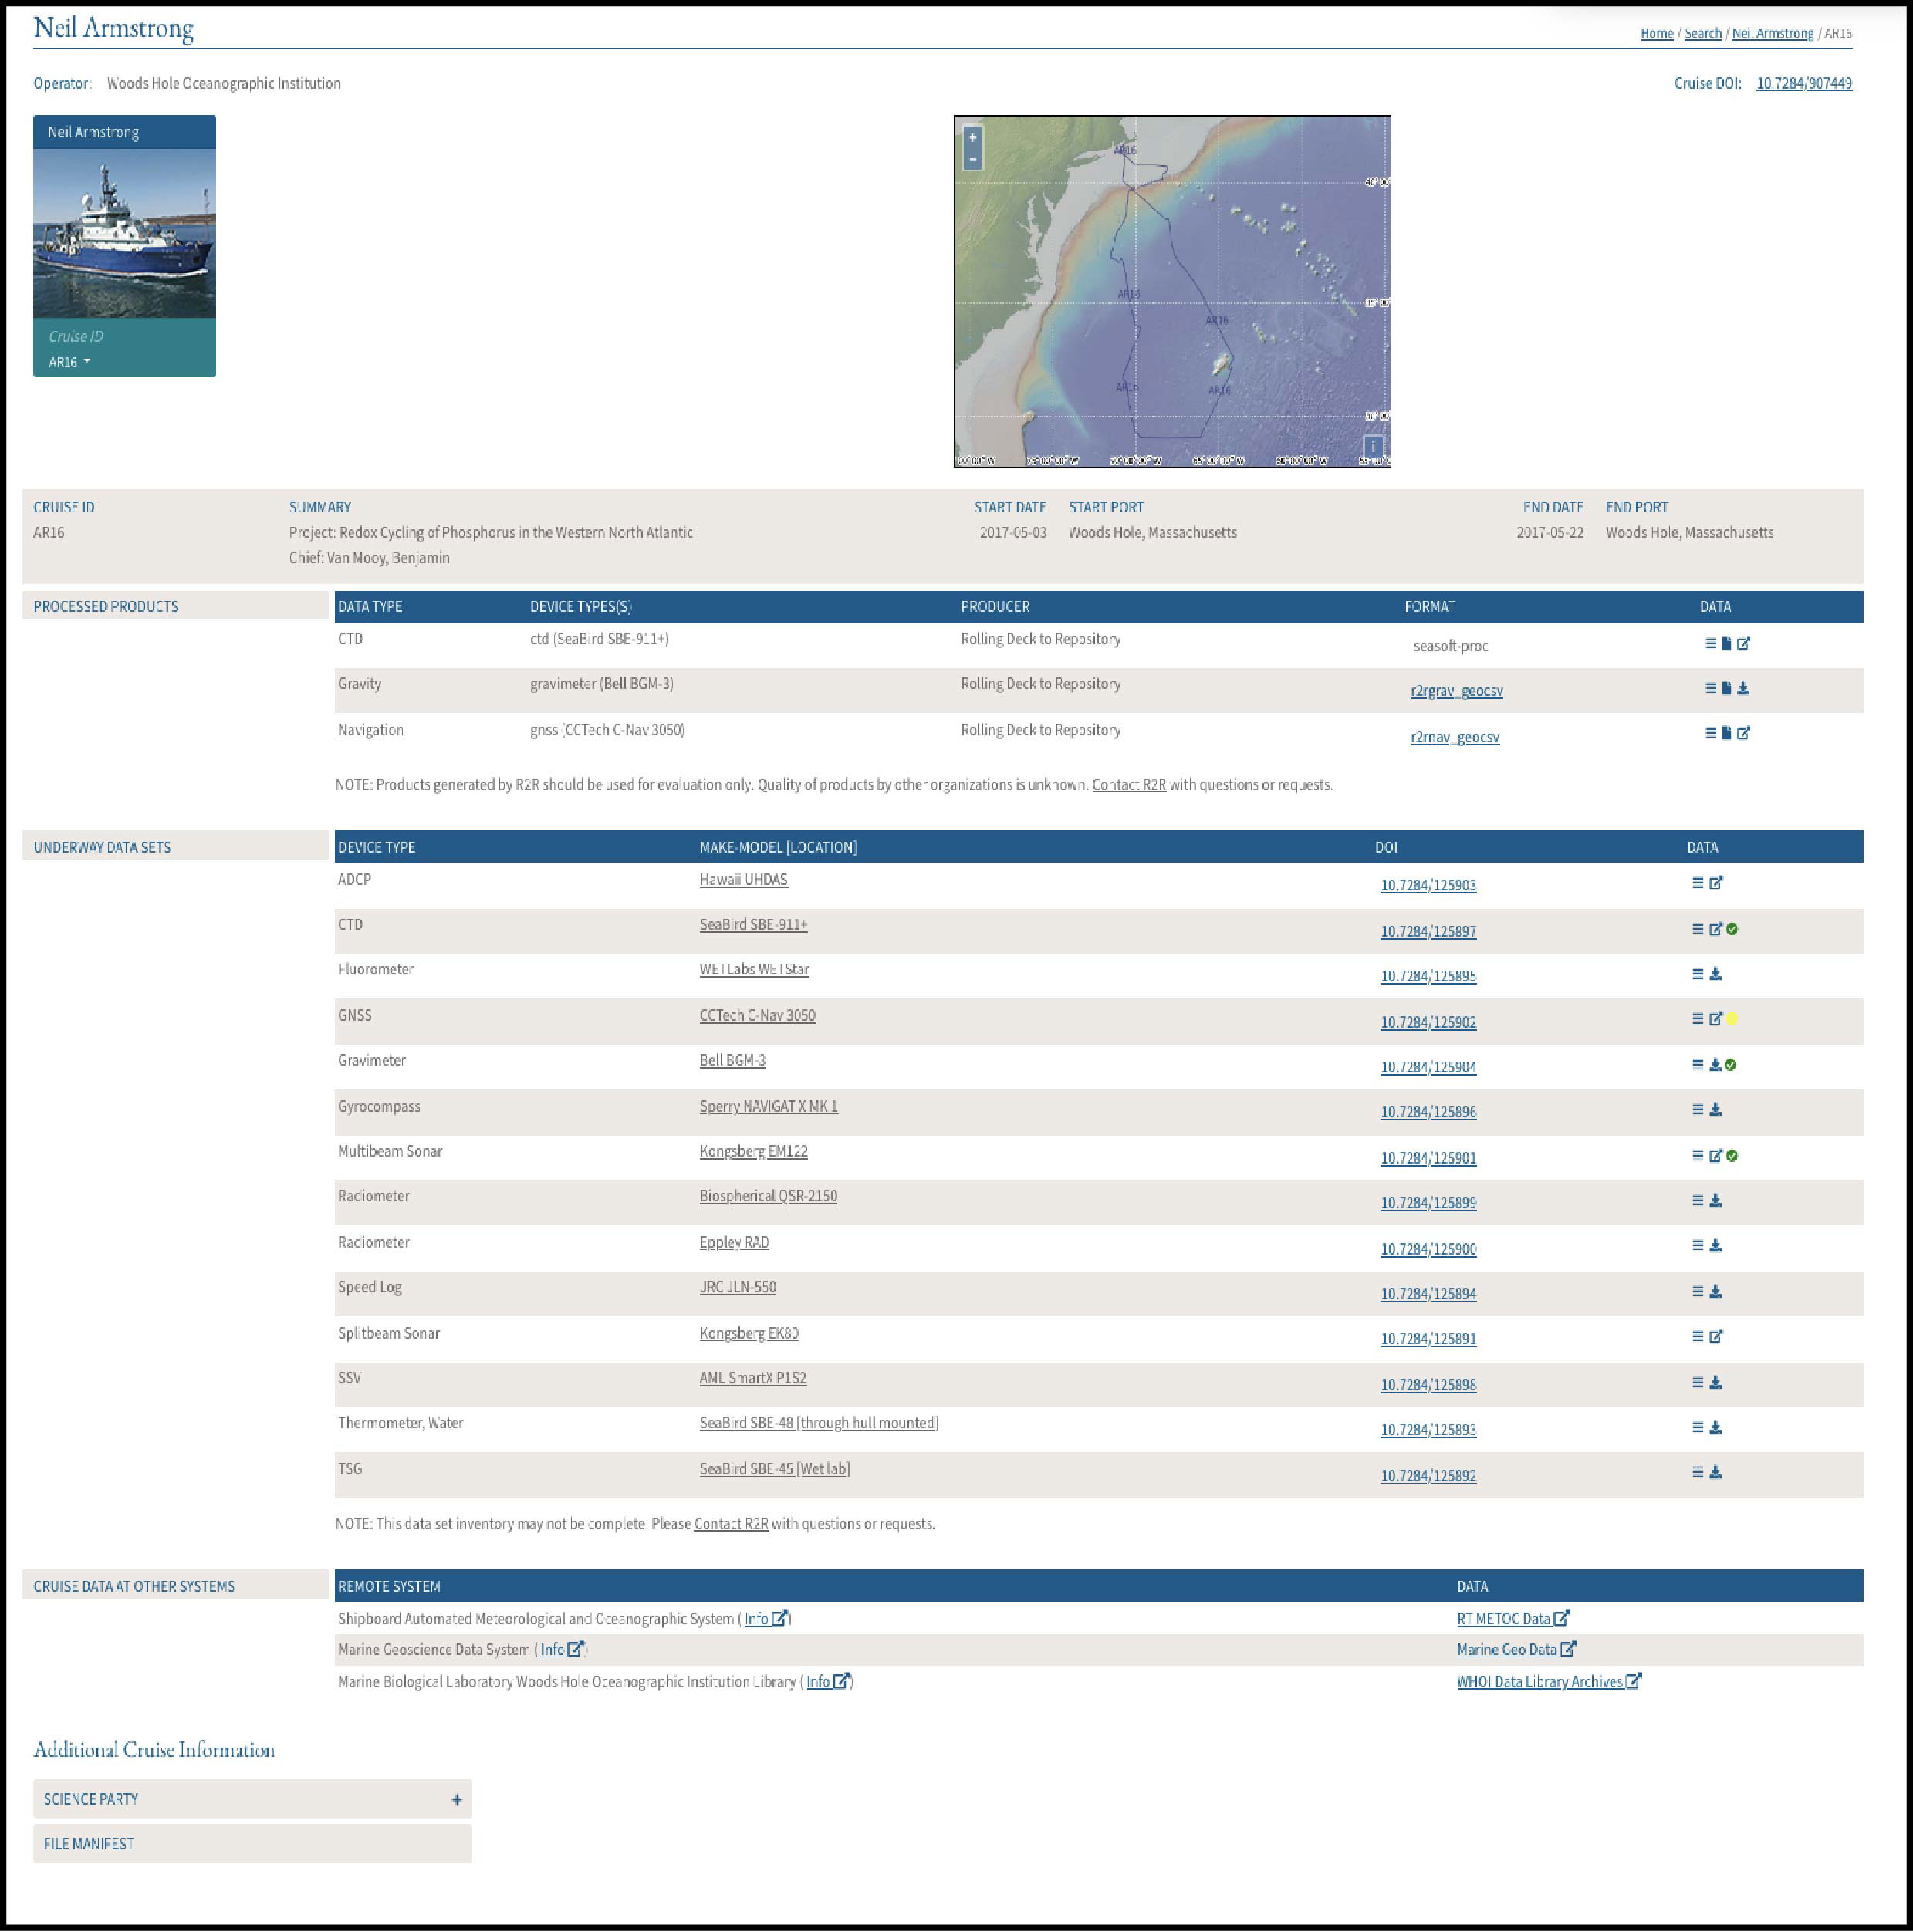
Figure 2 Example of R2R Cruise Catalog page (for R/V Neil Armstrong cruise AR16: https://www.rvdata.us/search/cruise/AR16) showing the cruise track in map view, cruise summary metadata (science party names, institutions and roles, cruise dates, ports and funding awards), an inventory of the submitted underway data distribution, the list of datasets broken out by device type along with links to download these data. Links are also provided to quality assessment results, R2R data products, and to the external repositories that host other marine data for this cruise.
2.2. Scope of the R2R cruise catalog collection
The catalog is currently comprehensive for expeditions from 2009 to the present (Figure 3) for the federally-funded suite of academic research vessels within R2R’s scope. Cruise data from expeditions of the R/V Falkor and Nautilus, both operated for academic research by non-profit private organizations (Schmidt Ocean Institute and Ocean Exploration Trust) are also managed through R2R. Basic information for academic research expeditions from these ships prior to 2009 including from retired vessels, have also been provided by some operators and are included. For most of these older expeditions, only cruise summary metadata and cruise navigation are included. In some cases, datasets from these legacy cruises are inventoried and served. However, the cruise catalog has not been funded to be comprehensive for all academic research cruises from these ships prior to 2009.
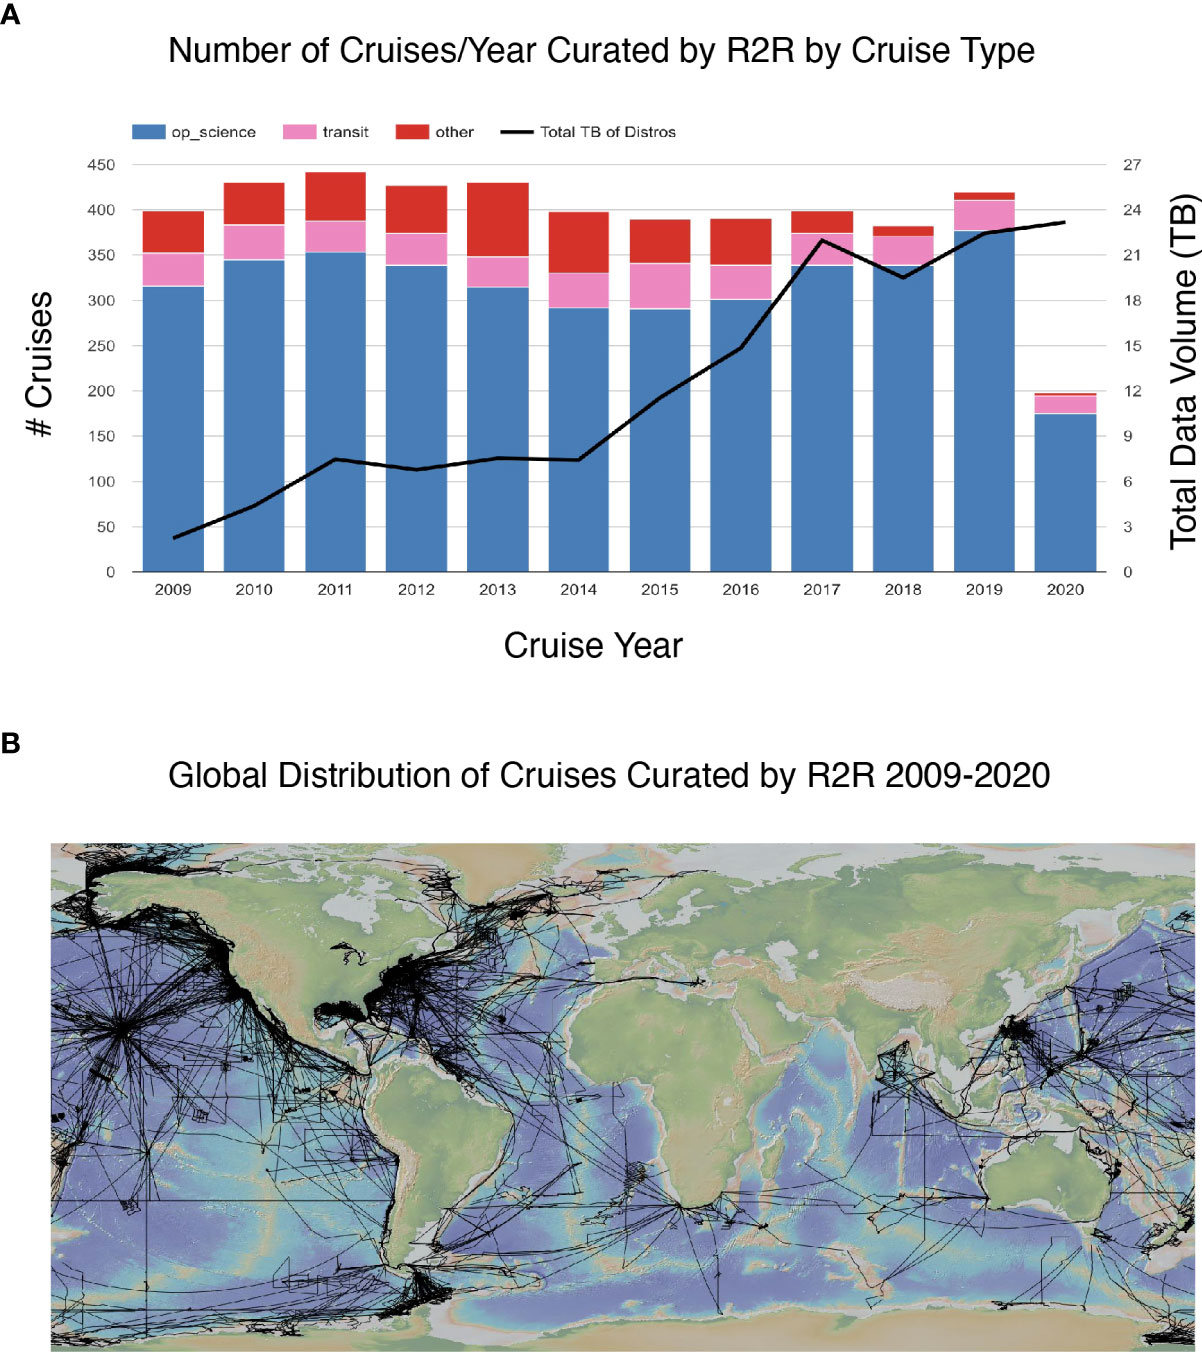
Figure 3 Summary of number of cruises each year and total data volume received for all cruise distributions. (A) Number of cruises organized by cruise type: science, transit (to/from the survey site), and other. “Other” includes operator run shakedown, inspection, servicing and training expeditions, and institutional education and outreach cruises). The low cruise numbers for 2020 reflect the impacts of the Covid-19 pandemic with many expeditions cancelled or postponed. (B) Global distribution of cruise tracks for expeditions with full navigation information registered in the R2R cruise catalog.
The volume of data managed through R2R currently totals over 168 TB from 4904 cruises from 2009 through 2020 (Figure 3). While there is a trend of decreasing total number of cruises in more recent operating years reflecting the retirement of several ships, the number of filesets and total volume of data broken out from cruise distributions for each cruise year is increasing as the number of devices deployed on research ships has grown. Figure 4 shows the total number of datasets extracted, documented and archived from submitted cruise distributions for the different underway device types in use across the fleet. For the 2009-2020 period, ~37,000 datasets corresponding to ~16 million files have been broken out, documented and preserved, with open and public access available to the international marine research community.
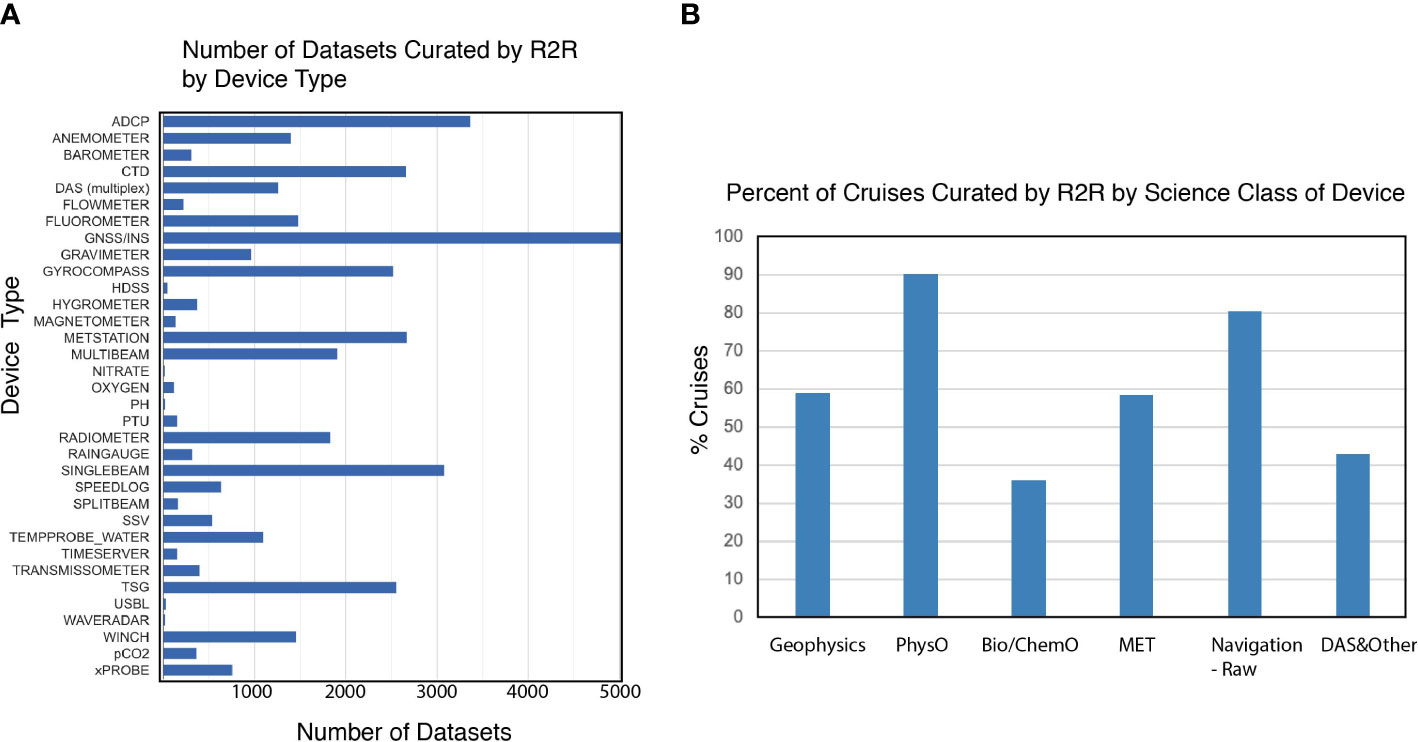
Figure 4 Type of device datasets within the R2R cruise data collection. (A) Total number of filesets broken out from cruise distributions, documented and made accessible, identified by device type for 2009-2020. Note that not all devices are installed on all vessels. All ships operate a GPS (GNSS and/or INS sensor) and a number of ships operate more than one of these sensors (Note that number of GNSS/INS datasets is truncated for display purposes and totals ~8000). Most ships operate with ADCP, singlebeam echosounders, CTD, TSG and gyrocompass sensors. (B) Histogram showing percent of archived cruise distributions in the R2R collection with device datasets classified broadly according to oceanographic science purpose. Devices included in each class are as follows: Geophysics (gravimeter, magnetometer, MBES, SBES, surface sound velocity profiler (SSV)); Physical Oceanography (ADCP, CTD, expendable probes (XBT, XCTD, XSV, XCP etc), Flowmeter, Hydrographic Doppler Sonar, water temperature probe, TSG, waveradar); Biological and Chemical Oceanography (fluorometer, nitrate, oxygen, pCO2, pH, Splitbeam (fishfinder sonar), transmissometer); Meteorology (anemometer, barometer, hygrometer, LiDAR, Metstation, ptu, radiometer, raingauge, aerosol sensor, air temperature probe); Navigation (GNSS, gyrocompass, INS, speedlog, USBL); DAS and Other (Data Acquisition System files, timeserver, winch). Histogram shows that Physical Oceanography sensor data is registered from the largest number of expeditions archived (90% of archived expeditions) over the 2009-2020 period, with geophysical and MET sensor data for 59/59% of archived expeditions and Biological and Chemical Oceanographic sensor data archived for 36% of expeditions. Note that most Geophysical and Bio-ChemO sensors are not installed on the smaller coastal class vessels. Raw navigation filesets were submitted and archived for 80% of expeditions over the decade with navigation information often in multiplexed files from data acquisition systems (DAS) during earlier cruises.
3. Programmatic quality assessment for enhanced data documentation
A significant focus of the R2R program has been the development of programmatic Quality Assessment (QA) procedures for datasets from the most routinely acquired high value devices (https://dev.rvdata.us/about/quality-assessment ). Data quality issues such as missing data, missing documentation, outliers due to noise, and duplicate values complicate data analysis and can be manpower intensive to identify and correct. Further, as data volumes generated by marine sensors grow with improvements in resolution and higher sampling rates, and as more sensors are added to those routinely acquired, there will be increased need for programmatic access to QA information to help scientists manage the “big data” deluge and identify optimal datasets for their needs (e.g. Baraniuk, 2011; Cai and Zhu, 2015).
R2R QA is designed to document the characteristics of a dataset as originally delivered from vessels, and is conducted for GPS, MBES, SBES, gravity, magnetics, CTD, and XBT data. The automated QA is intended to identify incomplete or suspicious data (e.g. data from wrong cruise, corrupted data values, data gaps) and provides documentation of dataset characteristics relevant for informing later scientific use. QA procedures include a suite of basic tests relevant for all data types (e.g. that minimum appropriate metadata exists, that the expected data files exist, that file checksums match cruise manifest checksums, that files are readable and of the correct documented format). In addition to these fileset-level tests, the programmatic QA also includes device-specific tests for which individual datafiles are opened and read to confirm data values are valid and within expected temporal and spatial bounds, as well as statistical tests to assess whether the instrument appears to be functioning properly (Figure 5). Test results are visualized in a QA dashboard (https://www.rvdata.us/qa_info) and also served in a Quality Assessment certificate that is publicly accessible as a downloadable schematized XML (Extensible Markup Language) file. The summary certificate provides the full list of files assessed, the test results, and in many cases summary plots. Visual summaries make use of color-coded indicators (red = critical test failed; yellow = some suspicious data; green = no suspicious data; grey = unassessable) and an overall rating for the entire dataset is derived from the ratings for the individual tests. Standardized documentation describing the QA tests and algorithms is provided along with the QA report (Figure 5, https://service.rvdata.us/docs/qa_docs/).
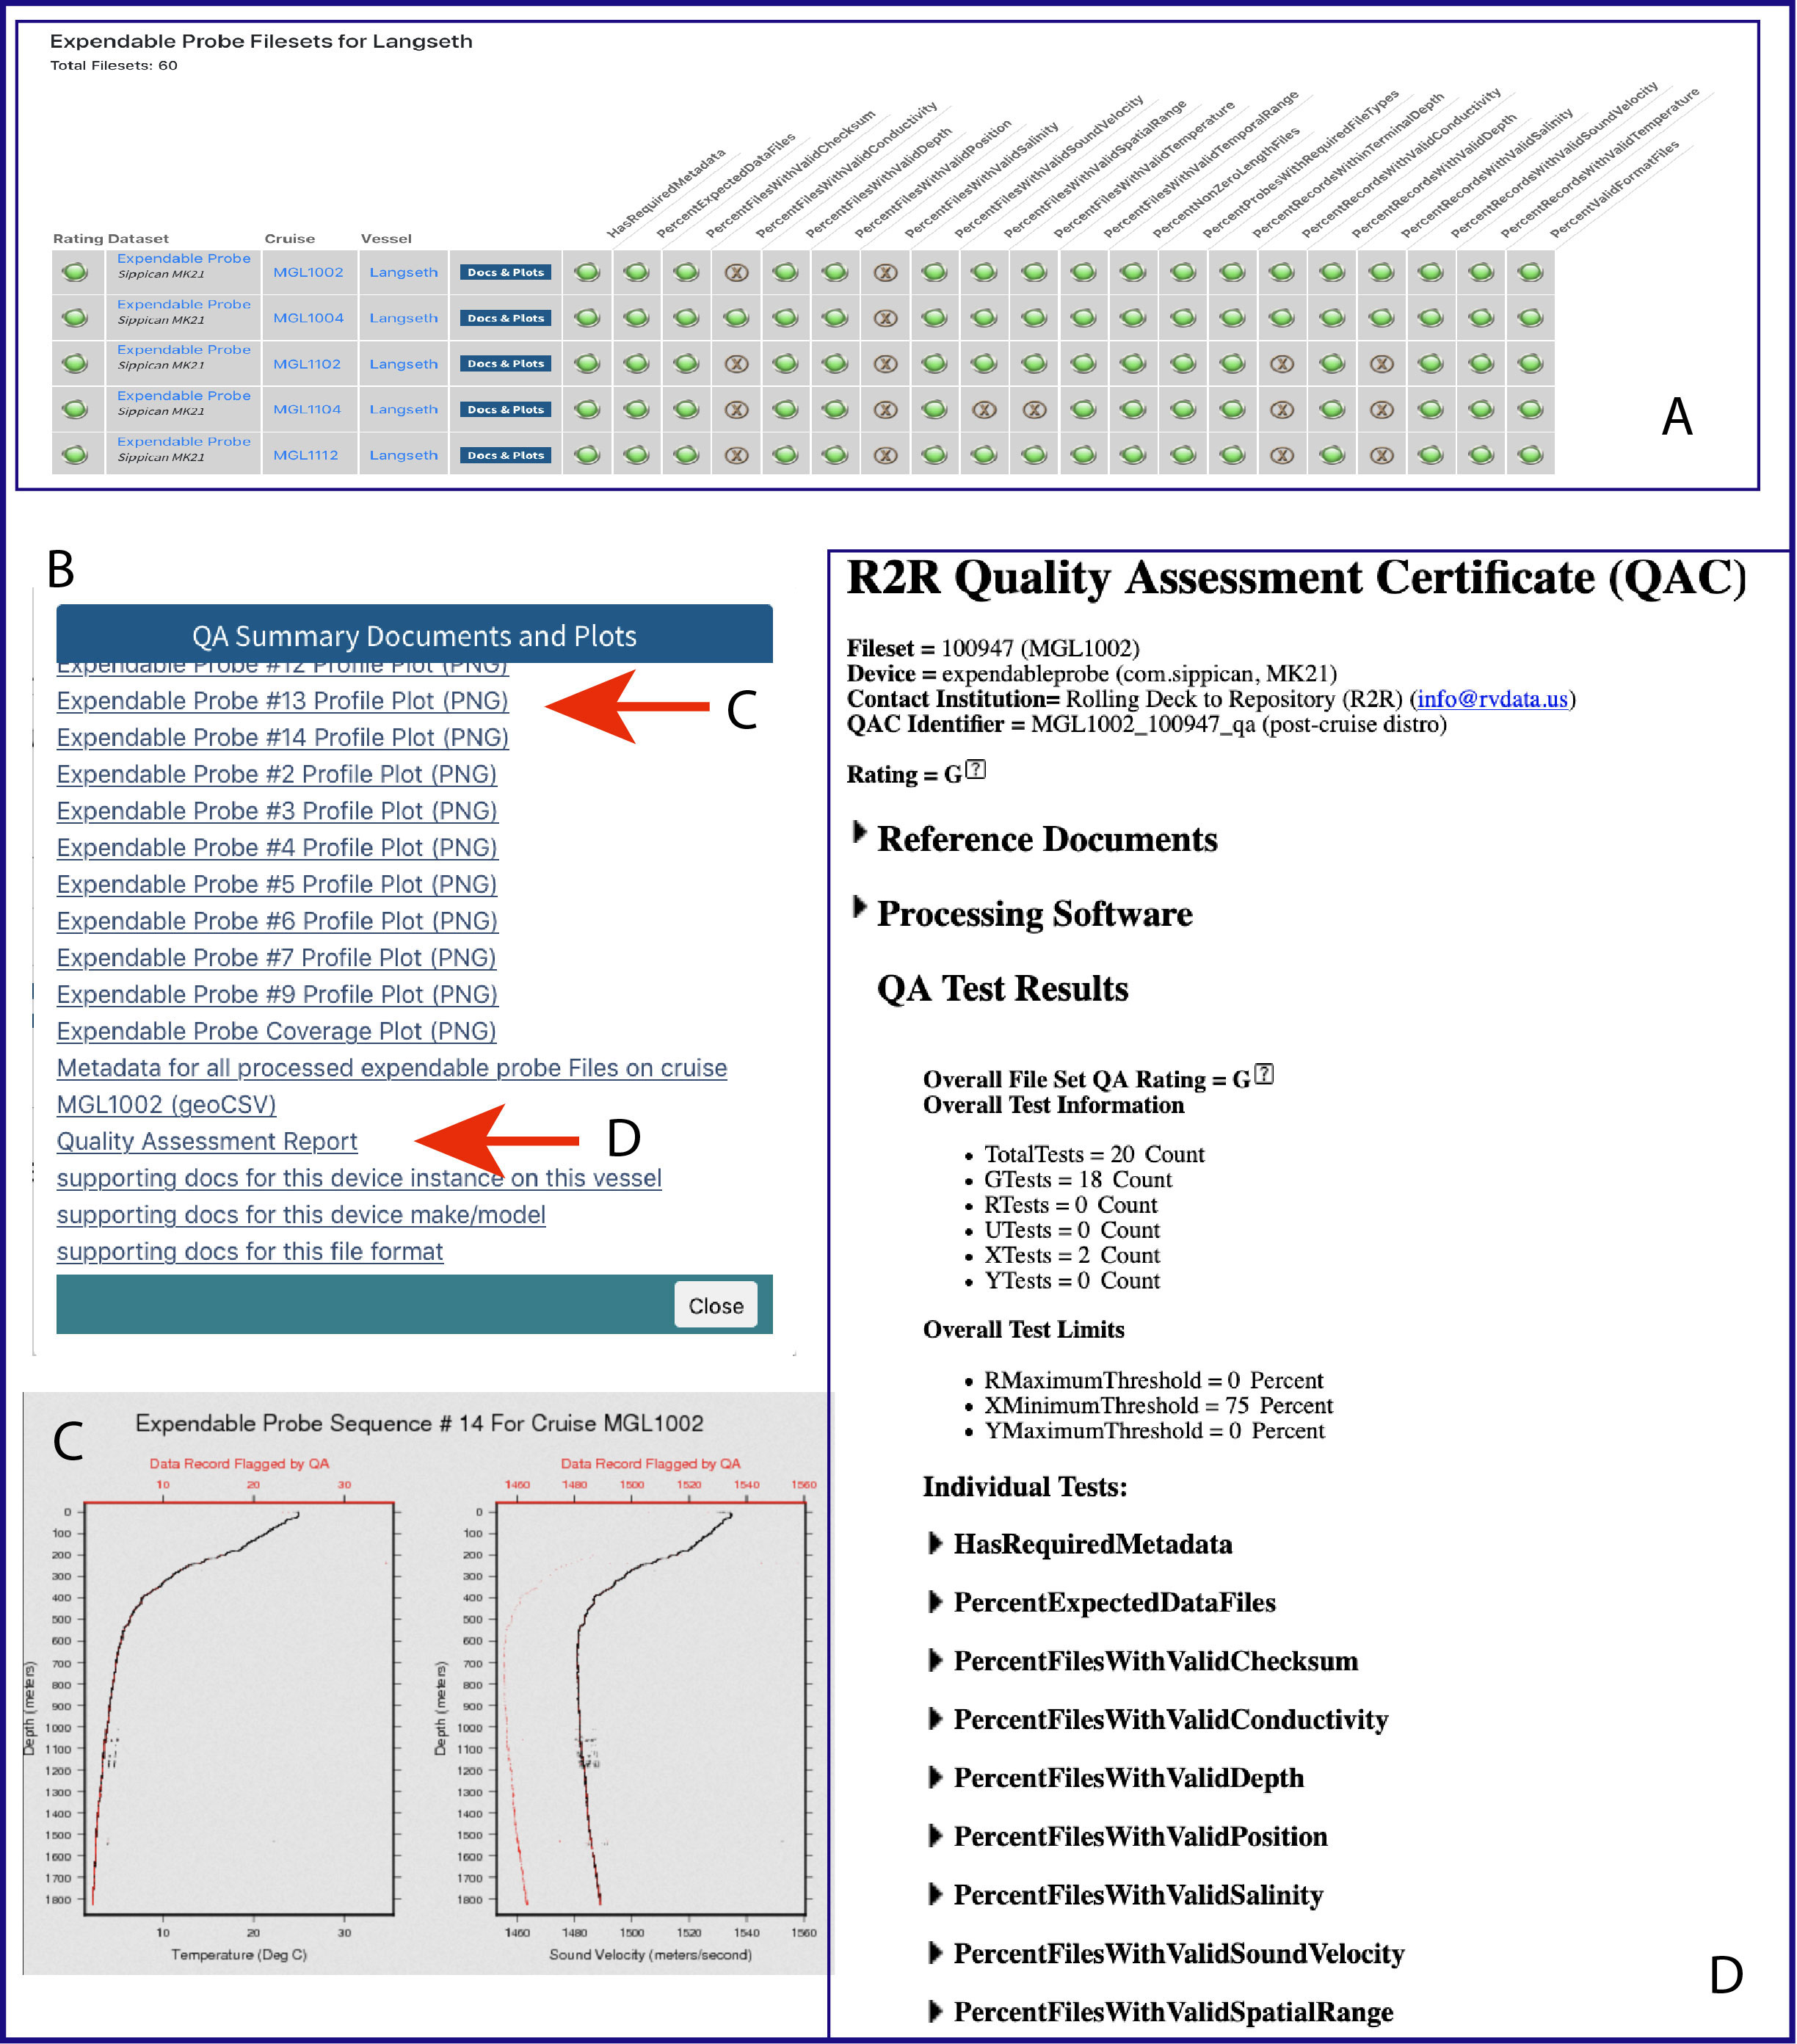
Figure 5 Example of R2R Quality Assessment (QA) results accessible via the QA Dashboard (http://get.rvdata.us/qa_inc/). QA results are shown for XBT data from R/V Marcus Langseth cruise MGL1002 (https://www.rvdata.us/search/cruise/MGL1002). (A) QA for each device is run for all files from one cruise and displayed in the QA Dashboard with red/yellow/green ratings summarizing results for each test. Visual summaries make use of color-coded indicators assigned relative to thresholds set for each QA test (red = critical test failed/; yellow =some suspicious data; green = no suspicious data; grey = unassessed) and an overall rating for the entire dataset is derived from the ratings for the individual tests. (B) List of data plots and documents pertaining to QA results for device. (C) Example plots of XBT data showing data points flagged by the QA process. (D) R2R Quality Assessment Certificate for each cruise includes documentation of version of the QA Processing code run, other reference documents as appropriate for the device/cruise, summary QA results for all tests, as well as description and results of individual QA tests along with thresholds for lamp ratings. The summary certificate provides the full list of files that were assessed, and in many cases summary plots.
Common problems identified during the basic standard QA tests are gaps in the data, data not matching the cruise dates, inconsistent file formats and naming conventions, and corrupt data, often at the beginning or end of the file. QA results are used to help identify missing datasets for contacting operators, to help ensure complete and correct data packages are submitted to NCEI for long-term archiving (e.g. no empty files, all data from correct cruise), and to identify what datasets are suitable for further processing for those data types for which a data product is generated by R2R (e.g. datasets are complete; data are within cruise bounds; data files are readable). QA is also used to verify cruise metadata (e.g. submitted start and end dates and ports can be incorrect), and to notify operators for issues that can help improve acquisition (e.g. inconsistent directory structures; down-sampled navigation).
3.1. Example: Multibeam echo sounder quality assessment and insights on acquisition from a decadal review
The most complex device for which programmatic QA has been developed is multibeam echo-sounders which are deployed on over half of the research fleet ships currently served by R2R and represent one of the largest volume datasets. MultiBeam Quality Assessment (MBQA) includes tests for the presence of measurements relevant for most accurate determination of physical parameters (e.g. has sonar draft measurement, has surface sound velocity, existence/number of sound velocities profiles), tests for the validity of data values in each file (e.g. data within valid ship and sensor limits), data completeness (% beams with bathymetry/side-scan/backscatter measurements) and calculation of statistical metrics that can be used to assess system performance (i.e. beam/pixel variance for evaluating across-track beam noise, across track slope for informing roll bias evaluation). The MBQA code makes use of the open-source software package MB-System (Caress and Chayes, 2008) and is now in version 2.0 release with a total of 19 tests. Advantages of using MB-System for MBQA include the ability to read in current and historical MBES formats from all the primary sensors deployed on research vessels, and to run programmatic QA in a scripted mode.
The fleet-wide scope of the R2R data collection provides the opportunity to conduct an historical review of instrument operations as documented with the programmatic QA, to examine how test results have varied across vessels and through time. Changes in standard operating procedures and device maintenance and in the reliability and age of devices deployed, as well as in cruise-specific conditions including weather can all impact QA results and how they change through time. Figure 6 compares MBQA summary ratings for cruises from 2009-2013 with the period 2014-2020 (corresponding to 533/770 expeditions respectively). MBES data acquired before 2014 were evaluated with MBQA V1.0, while V2.0 was run for the later cruises. These two versions of the MBQA include some differences in tests and algorithms and hence not all test results can be directly compared. However, some general patterns emerge with suspicious data flagged for a higher number of tests overall in the older suite of data and marked improvements seen in the newer data in several areas. Prior to 2014, 30% of filesets are without surface sound velocity compared with only 4% post 2014. 37% of filesets prior to 2014 indicate suspicious navigation compared with only 2 cruises since 2014. Also a large percentage (38%) of the older datasets have fewer than expected number of side-scan records indicating incomplete recording of this sonar data type. Across both time periods a significant number of filesets (25%) have across-track beam noise that exceeds test thresholds, indicative of somewhat to highly noisy outerbeams. For a similar percent of expeditions (33% and 27% for early and later time periods, respectively) the mean across-track slope falls within the suspicious range that could indicate roll bias issues.
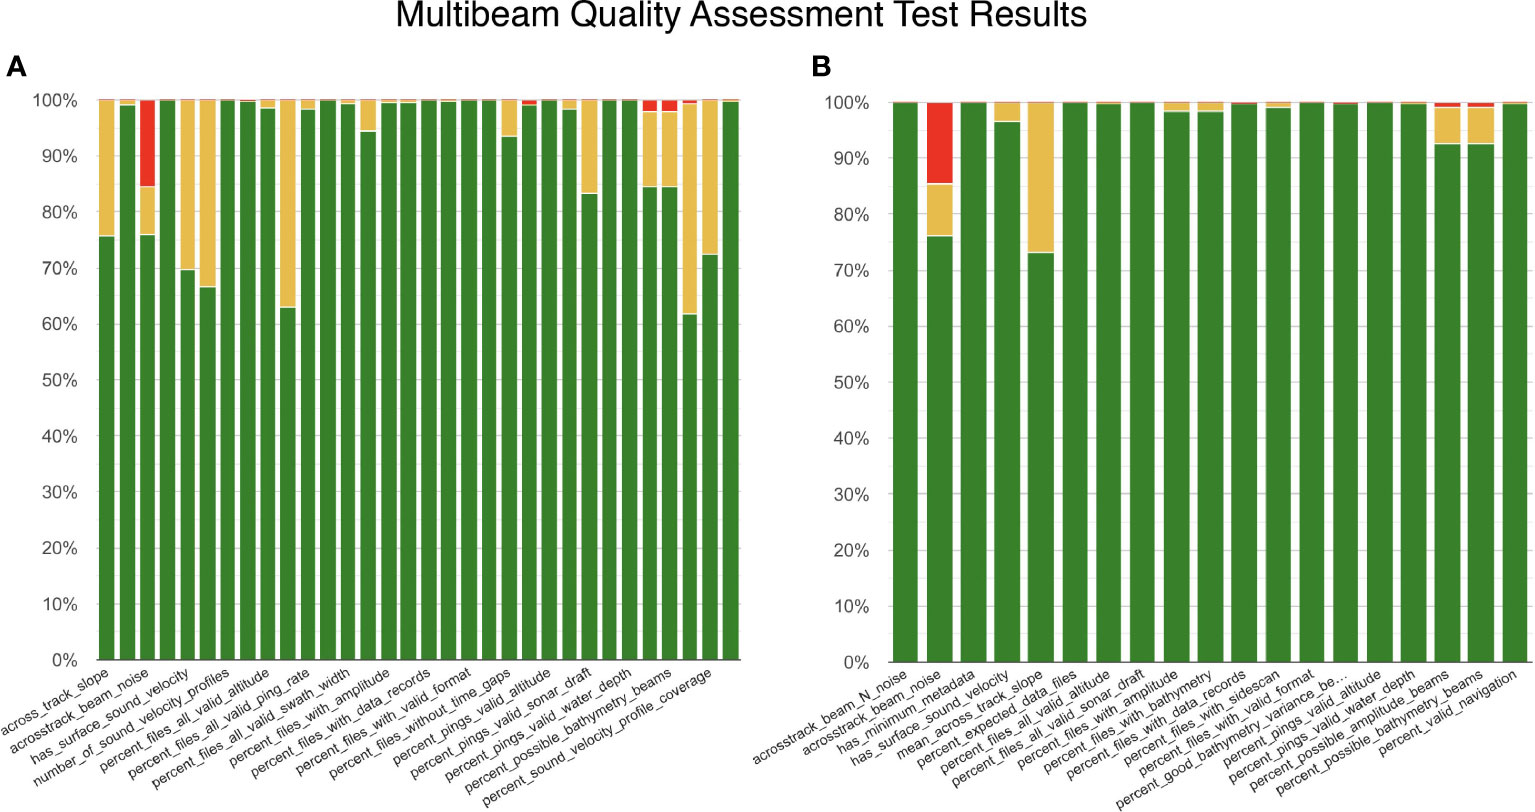
Figure 6 Multibeam Quality Assessment results for different time periods. Description of the different quality assessment tests performed are documented in R2R Technical Report Quality Assessment Description Multibeam (https://service.rvdata.us/docs/qa_docs/Multibeam/R2R_Multibeam_QualityAssessment_Description.pdf (A) Results of MBQA version 1.0 evaluation for all multibeam echo sounder data sets acquired from 2009-2013. (B) Results of MBQA version 2.0 evaluation for all multibeam echo sounder data sets acquired from 2014-2020. See text for discussion.
The comparison of MBQA test results over these 2 time periods indicate significant improvements in the overall completeness of metadata and data, and in data quality recorded across the fleet. The MBQA results also indicate older datasets may require additional processing to improve the navigation merged with the dataset and to accommodate timing issues, and there is more limited recording of side-scan sonar values. Across all years, the MBQA results point to the consistent issue of noisy outer beams which is primarily due to the common practice of setting multibeam sonars to acquire with a maximum swath angle. Operating these systems with a maximum swath angle usually results in acquisition of poor quality outer beams that must be edited out in post-processing (Figure 7). This problem would be best managed by changing standard operational practices so that the swath width is narrowed during data acquisition. Modern generation sonars are best run with the swath narrowed to 60° for highest quality full suite of data or up to 75° when collecting bathymetry only. High across track slope, which is possibly indicative of roll bias, is also found in a significant percentage of expeditions across all years. Caution is needed however, in evaluating this test result as high across-track slope can reflect the true local morphology in the survey area (i.e. surveys conducted along the continental slopes) and human judgement and manual review is needed to determine if this test result indicates an error that requires further processing.
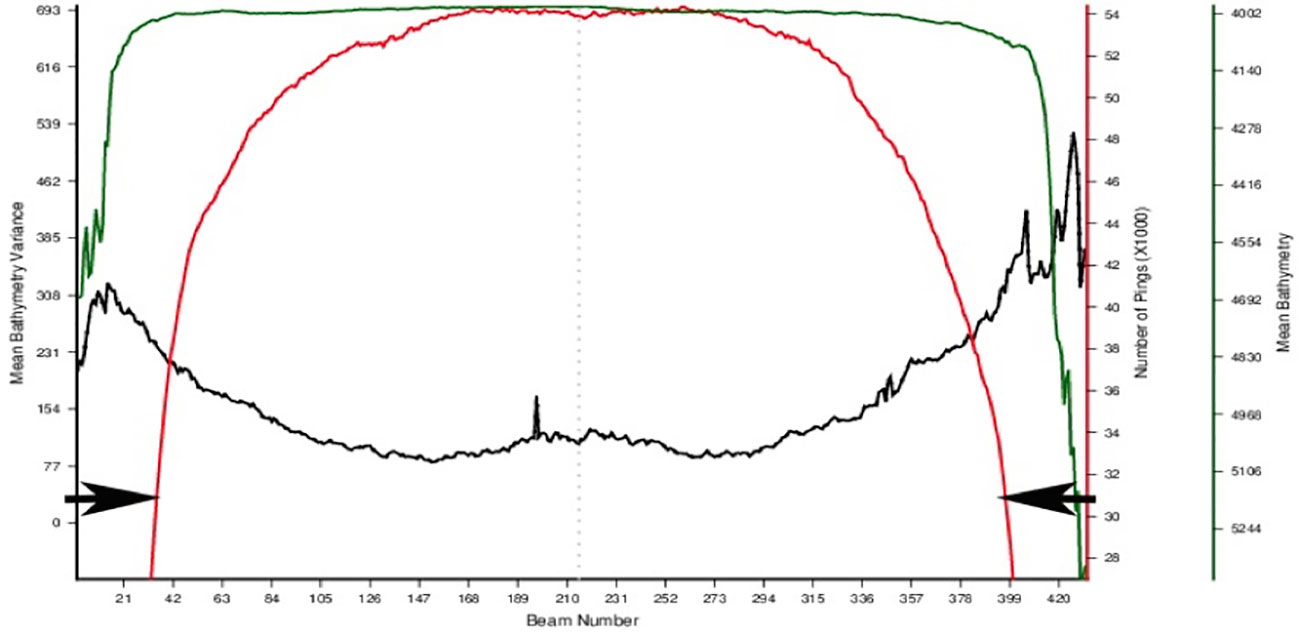
Figure 7 Summary plot of MBQA results to evaluate quality of beam data. Results illustrate noisy outer beams which is primarily due to the common practice of setting multibeam sonars to acquire with a maximum swath angle. Red line shows number of pings per beam for the entire cruise dataset. Green line shows the average depth value for each beam for the full cruise. Black line shows the variance in depth values averaged for each beam over the full cruise. Note how the beams at the outer edges of the swath are not detected for most pings (red line) and typically are invalid when they are detected. Recommended best practice is to narrow the ping width to collected better quality, higher resolution data.
The improvement in data quality and completeness since 2009 documented by the MBQA is likely due to upgrades and greater consistency in the multibeam sonar systems installed across the fleet as well as changes in operator standard practices. For the 2009-2014 period 8 different systems were in operation (6 Kongsberg and 2 Seabeam models) whereas from 2015 forward a number of systems were replaced or upgraded with a total of 5 Kongsberg models now in operation across the fleet. Improvements in operating practices can be attributed to dissemination of information at community forums including RVTEC and direct feedback from R2R when significant problems were found, as well as the contributions of the Multibeam Advisory Committee (https://mac.unols.org) which was initiated in 2011 and which helps support proper MBES system calibration and acquisition best practices.
4. R2R data products
While it is best practice to archive and preserve sensor data in its raw, as-acquired form, derived data products support the widest use for science. For example, it is the derived parameters reflective of physical state rather than instrument parameters (e.g. gravity anomaly value compared with raw instrument counts, seafloor depth rather than two-way travel time) that are of most interest for non-specialist science users. To support these needs for reduced data, R2R provides data products for a number of data types as part of the routine data curation process. These products are served in the standard documented GeoCSV ascii format (GeoCSV, 2015) enabling scientists to use data from different ships without needing to handle the multiple formats of raw data used across the fleet. Derived data products are provided for navigation, gravity and magnetics datasets, singlebeam, CTD and XBT as well as for near real time MET and TSG data via SAMOS. Standardized documentation is provided describing data reduction steps and algorithms, similar to that developed for the QA documentation (https://service.rvdata.us/docs/product/).
4.1. Example: Navigation and insights on acquisition from a decadal review
R2R assesses quality and produces standard navigation data products derived from the GPS positioning data for each cruise. GPS data are of unique value as they provide positioning information for most other sensors and are merged with device data streams on board or after the cruise, based on timestamp information. In the R2R data curation workflow, the cruise GPS data are also used in the quality control of other data types, to confirm that the data provided are from the appropriate cruise, as data are occasionally mislabeled or saved into the wrong cruise directory prior to submission.
The quality assessment tests performed for GPS data include date range checks compared with start/end date of the cruise, tests for dataset completeness, gaps in data, out of sequence records, bad GPS quality flags, and unreasonable speeds and accelerations (Figure 8). The most common quality issues encountered are long data gaps and high temporal incompleteness within a dataset (percent of missing data), which can include both long gaps and “spotty” data with multiple shorter gaps. The number of datasets with high percentages of records with unreasonable speeds and accelerations has reduced slightly over time (Figure 8A compared with Figure 8B) which we attribute to more operators recording their GPS data at higher sampling rates.
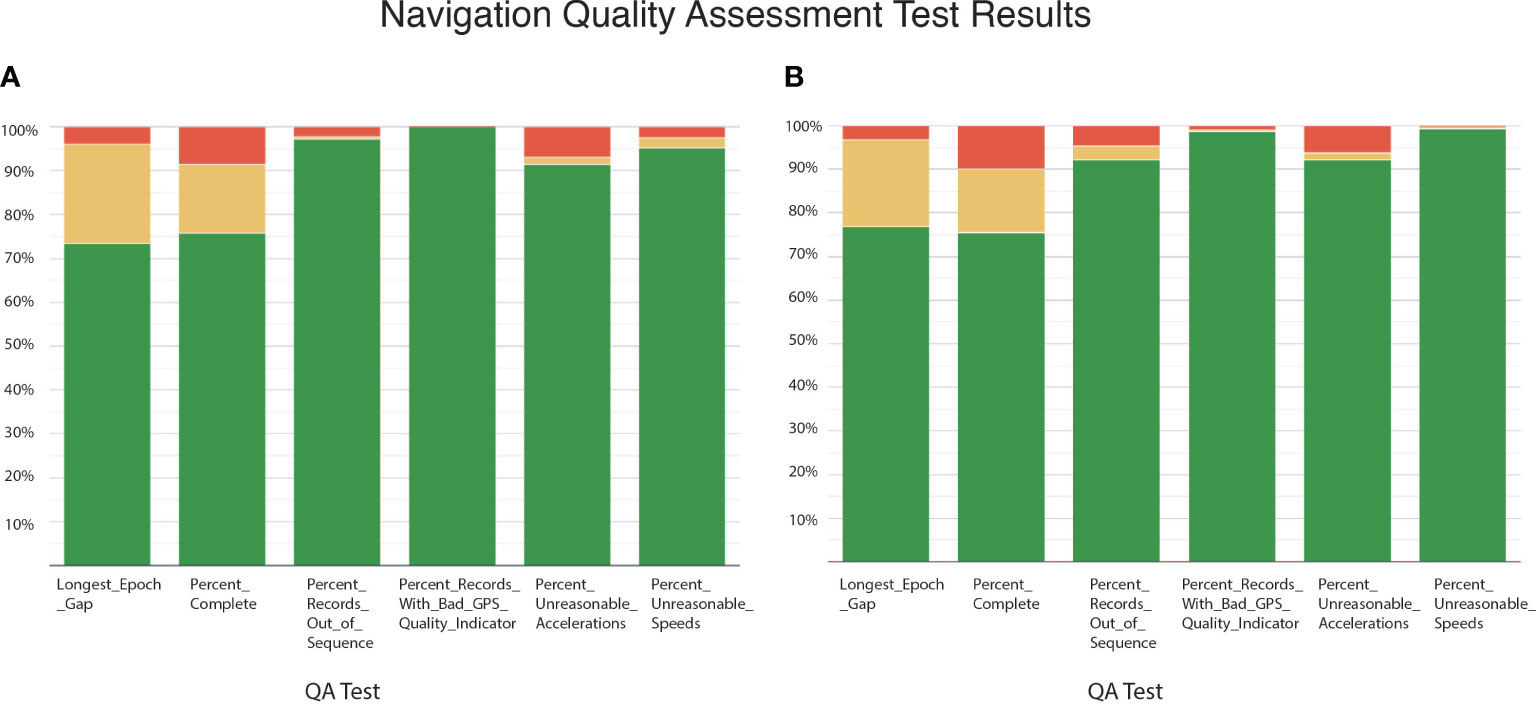
Figure 8 Navigation data Quality Assessment results for different time periods. Description of the different quality assessment tests performed are documented in R2R Technical Report Quality Assessment Description Navigation (https://service.rvdata.us/docs/qa_docs/Navigation/R2R_Navigation_QualityAssessment_Description.pdf) (A) Distribution of quality assessment ratings for navigation data from expeditions from 2009-2013 by individual quality assessment tests. (B) Distribution of quality assessment ratings for navigation data from expeditions from 2014-2020 by individual quality assessment tests.
When the R2R program began in 2009, stand-alone raw navigation filesets were not always recorded and a number of operators provided navigation information within multiplexed files where they were merged with other sensor parameters and at reduced temporal resolution. Other challenges included data recorded at inconsistent frequency, and heterogeneous undocumented formats: 15 data formats were in use across 22 vessels during the first 2 years of the program. To help promote greater standardization across the fleet, R2R developed best practice recommendations for acquisition (Rolling Deck to Repository, 2018) and worked with vessel operators to facilitate adoption. Over time, acquisition practices have increasingly adopted these recommendations (Figure 9). The proportion of cruises with raw navigation files submitted in cruise distributions has increased; the number of diverse files formats has decreased, replaced by an increased uptake of standard National Marine Electronics Association (NMEA) formats (NMEA, 2022); and the amount of data preserved at 1Hz or higher has increased. These improvements reduce manual effort needed for processing and, more importantly, provide more useful data.
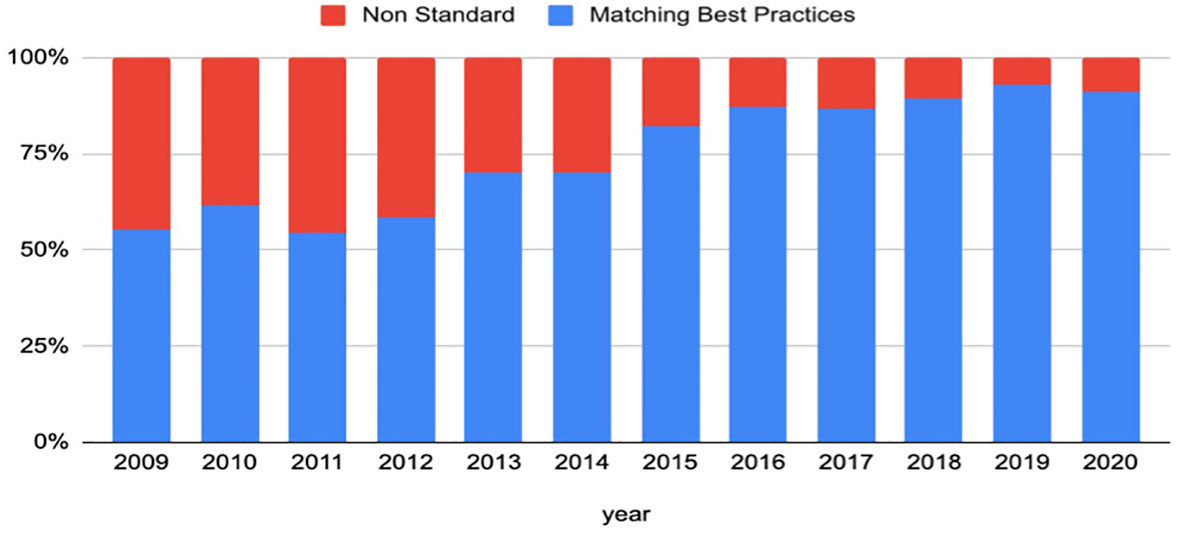
Figure 9 Percentage of cruises, binned by cruise date, with navigation data meeting R2R’s recommended best practices. Only cruises with successful quality assessments are included.
5. The R2R partnership with the science user community, ship-operators, and the NCEI archive
R2R data services are designed to provide the conduit for marine data to flow from the ship operators who manage data acquisition to the NCEI archives which provide for long-term archiving and preservation of marine environmental data in the US. Close collaborations with science users, the marine operators and NCEI has been an integral part of the design and growth of the R2R data management system since inception. Direct engagement with the US marine research community, which provides the science motivation driving all data acquisition using the academic research fleet, has contributed to the development of the program since inception including through an Advisory Committee which has provided guidance on future directions, user testing of beta releases of new tools, and feedback on data center policies. Domain experts have contributed to the design of QA tests and identification of appropriate thresholds and all data processing procedures have been developed with dedicated science experts to guide the processing work flow and review products.
The ship operators and technicians who submit cruise data from their field seasons on a regular basis are another primary partner in R2R. The ship-board technical team is the conduit for information regarding instrumentation, deployment, documentation, and event tracking that is fundamental for understanding and describing the data distribution. In addition, numerous real-world problems encountered while at sea lead to unavoidable heterogeneity in the data that are acquired. Close communication and active engagement of ship operators has been essential to ensure the most complete and accurate representation of data acquired during a cruise is archived.
Working closely with the marine operators has also supported development of more standardized and improved data documentation. R2R has established working arrangements with the ship operators and technicians, primarily at the annual meetings of the UNOLS Research Vessel Technical Enhancement Committee and also through a designated R2R liaison who meet with vessel technicians at least annually, and visit the vessels in-person as opportunities arise. This close contact has resulted in the development of recommended best practices for cruise data directory structure, vessel coordinate systems, and templates for cruise-level metadata. A particular challenge is maintaining an accurate record of all sensors operating on each cruise with their essential minimal metadata (device type, make, model) for example as sensors fail mid-way during a cruise and are replaced. A recent initiative to tackle this challenge, is working with developers of next-generation data acquisition systems to capture accurate device information routinely (automatically rather than manually) and ensure it travels downstream with data packages.
More recent efforts are focused on development of expert recommendations for acquisition of specific device types. Best practices for shipboard installation of C-Star transmissometers resulted from an R2R working group composed of ship technicians, scientists and data managers (Smith et al., 2020). These expert recommendations have been published and made available through the Intergovernmental Oceanographic Commission, Ocean Best Practices System (OBPS; Pearlman et al., 2021; https://repository.oceanbestpractices.org/handle/11329/1275). Development of additional technician-focused best practice documents are underway, including for CTD, EK80, and general flow-through seawater systems.
The other key partner in the development of R2R is the NOAA’s NCEI. Close interaction with NCEI staff has contributed to the quality and standardization of submitted data packages and has supported the development of custom tools to ensure archive completeness. Regularly scheduled communication has ensured technical issues are quickly resolved and shared development needs are planned, which in turn has improved the efficiency of accession of data packages into the NCEI system. Another outcome of this close partnership has been shared development of metadata standards for cruise and device specific metadata (https://www.ngdc.noaa.gov/iho/SubmittingMarineGeophysicalData.pdf), which have historically been lacking, thereby helping to address gaps in standards for marine metadata.
6. Discussion
6.1. Lessons learned from the R2R fleet-wide approach working upstream in the data lifecycle
R2R services are focused on supporting the preservation and re-usability of the suite of multi-parameter data acquired on US academic research cruises each year with data management activities designed to provide a complete and accurately documented data collection; to deliver data packages that are aligned with FAIR principles; and to develop “synthesis-ready” data streams and processed data to support the development of thematic data syntheses and products. In the following section we discuss lessons learned from working as a fleet-wide aggregating data management system and working upstream in the data life-cycle, close to acquisition. These insights are informing potential areas of future development for the R2R program and may be useful considerations for other research communities supported by a distributed network of data providers with diverse practices and resources.
6.1.1. Designing data management systems around the routine practices of data providers supports workflow automation and helps address the challenges of heterogeneous acquisition practices across the diversity of providers
The suite of global, regional, and coastal class vessels supporting academic marine research in the US is operated by different universities, the US Coast Guard, and non-profit organizations, each with their own practices and ways of handling and organizing data, and each operating a specific set of shipboard sensors. While there are commonalities in the primary sensors operated, individual vessels have more or fewer sensors depending on vessel class and typical science mission supported. Furthermore, the suite of sensors installed on any one ship changes through time as devices are added or removed. Given the imperative for high levels of automation in order to provide a cost-effective data management system, the R2R data curation pipeline was designed specifically to accommodate heterogeneity between operators and for change through time. The consistent practice across operators is the bundling of all data into a final cruise data distribution, which is how data historically have been delivered to the science party at the end of the cruise. However, it is the individual datasets derived from the shipboard sensors, rather than the cruise distribution, that are of most utility for re-use and hence the primary target for long-term data preservation. Rather than requiring operators to break the cruise distribution apart to submit individual datasets, R2R manages the cruise distribution as the primary submission package. R2R breaks out data filesets from the submitted distribution using information about the distribution directory structure for each ship and its filenaming protocols. This approach relies on an inventory of the device types onboard, which R2R verifies with operators annually. Data filesets extracted as part of the R2R curation workflow are then documented, packaged for long-term archiving and published. This approach allows for routine solutions to minimally impact data providers, but does require R2R to develop and maintain individual breakout code customized for each vessel. To foster greater standardization, R2R developed and promoted a recommended file directory structure. While adoption was not required, the availability of a suggested format has, over time, led to increased adoption and standardization by operators, and consequently less custom coding by R2R and improved efficiencies. Building the data management pipeline around the practices of the data provider community ensures that their time and expertise can be optimally devoted to acquisition and voluntary adoption of standards has enabled us to maximize automation of curation tasks for the community.
6.1.2. Working upstream in the data lifecycle close to data acquisition allows for preservation of a more complete and homogenized data collection
As its core mission R2R aims to ensure that complete, accurately documented data distributions are collected and preserved for all expeditions conducted annually with the US academic research fleet. Ensuring completeness is challenging as data from all devices installed on each ship are not always acquired (e.g. due to sensor malfunction, interference with other science mission devices), and data that are acquired may be missing from the cruise distribution due to changes in data recording software/hardware, or other technical problems while underway. The R2R data pipeline operates with a high level of automated workflows which has allowed for the efficient management of the large data volumes acquired each year. While these workflows include checks on data and documentation completeness, close interaction with the marine operators has been essential to resolve the inevitable missing or erroneous data and documentation issues that occur.
The fleet-wide approach has also provided the opportunity for homogenization of the documentation accompanying all data packages delivered for archiving which ensures a more standardized and readily re-usable collection is preserved. The standard metadata is machine-readable and aligned with FAIR principles (below) to support data re-use but the standardization has also allowed for more efficient flow into the NCEI archives. The delivery of standard submission packages from R2R has replaced the formerly heterogeneous and incomplete flow of data from distributed marine operators and science parties, allowing for NCEI to more efficiently handle the increased data volume submitted to them. Providing a single submission pathway to the NCEI archives has also improved efficiencies around issues of duplicate data, and provides another check point for identifying erroneous data or metadata.
6.1.3. Working between data providers and the archives allows for efficient provision of a high level of data FAIRness
The growing need to support re-usability of research data and in particular enhance the ability of machines to automatically find and use data is a key motivation behind the development of the FAIR “findable, accessible, interoperable, and reusable” data principles (Wilkinson et al., 2016; Wilkinson et al., 2017). The FAIR principles provide guidelines for how digital data should be identified, annotated and delivered and have seen increasing adoption across the marine data community (e.g. Tanhua et al., 2019; Lara-Lopez et al., 2019; Martín Miquez et al., 2019). Central recommendations to support FAIR data include the need for persistent unique identifiers for data objects, standardized machine parsable metadata, controlled vocabularies, clear actionable licenses for data use, and machine-to-machine data access
R2R services are designed to align with these FAIR recommendations for data annotation and delivery. Publication of each data fileset with DataCite DOIs provides unique persistent identifiers which are included in the metadata accompanying all data packages submitted to NCEI, along with cruise DOIs to uniquely identify the originating data acquisition event. Internationally agreed upon controlled vocabularies for cruise metadata elements and device type are used in machine parsable metadata which is provided in DataCite format. The quality assessment R2R conducts on the core underway data types provides enhanced metadata documenting dataset completeness and validity and is also provided in a documented machine-readable format. That all data submitted from R2R to the archives are licensed under the Creative Commons CC0 license, which is without any restriction, makes the data available for the broadest possible re-use. Data access is via multiple access points using standard communication protocols to retrieve datasets and their associated metadata through their persistent identifier. Access points include the R2R cruise catalog search portal which returns datasets within the broader acquisition context of the cruise, NCEI data portals which offer different access points organized by device/data types and integrated within broader scope global disciplinary data collections, APIs for machine-to-machine access, and reciprocal linking to enable data findability and access through other related disciplinary data repositories. All dataset pages include schema.org markup which allows for indexing of the full collection and dataset search via google searches and other catalogs, such as the International Ocean Commission Ocean’s Ocean InfoHub Project (www.oceaninfohub.org).
Working fleet-wide has enabled R2R to efficiently provide this uniform and high level of FAIRness. Data packages are delivered with the same minimum standardized metadata, controlled vocabularies, unique identifiers for datasets and cruises, along with the most unrestricted license for use. The completeness and accuracy of the minimal metadata provided benefits directly from the close collaboration with data providers and working fleet-wide has enabled the development of higher-level enhanced metadata documenting quality for the core data types in a cost-efficient manner.
6.1.4. Providing homogenized data collections and quality-controlled synthesis-ready data products benefits data re-use
The widest user base for marine data is supported by the thematic data synthesis products generated by global-scope data assembly efforts like the World Ocean Database (Levitus et al., 2013) or the Earth Magnetic Anomaly Grid (EMAG) data synthesis (Maus et al., 2009) as well as more regionally-based initiatives like the European Marine Observations and Data Network (EMODnet) (Martín Miquez et al., 2019) and Australia’s Integrated Marine Observing Systems (IMOS) (Lara-Lopez et al., 2019). Global-scale synthesis efforts exist for many of the diverse data types acquired routinely with research vessels (Table 1) and the demand for and scope of data products to support ocean observation and basic marine science needs is rapidly growing. To build these products, DACs typically integrate heterogeneous datasets into a standard format suitable for the target user community (e.g., convert to common units, map parameters/terms to controlled vocabularies), conduct scientific data quality control, and augment the observations with additional metadata. R2R’s work to provide homogenized documentation and completeness of the US research fleet data collection has directly improved the quantity and global range of observations flowing to these syntheses.
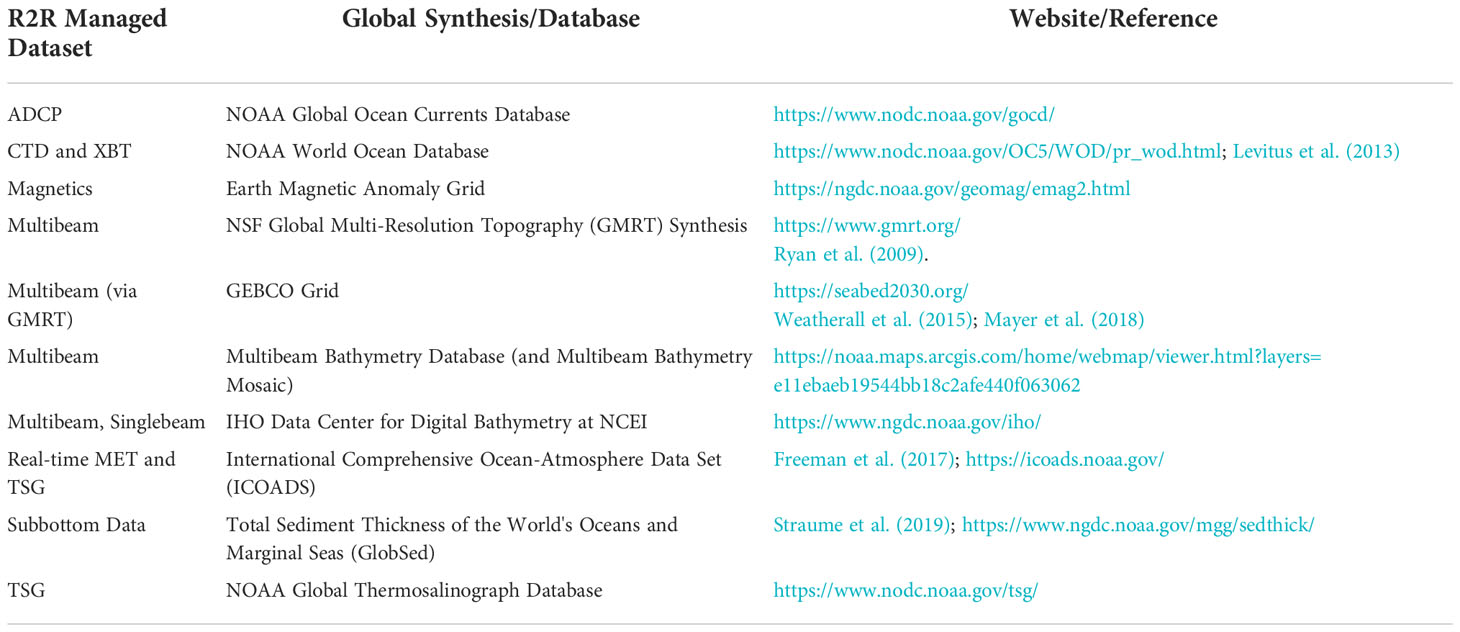
Table 1 Summary of global syntheses databases that incorporate cruise datasets curated by the R2R program.
In addition, for select parameters, R2R is conducting data conversion and processing to provide more synthesis-ready data products. The selection of parameters for this higher-level QC/data reduction work has been based on the capacity and needs of existing national and international DACs. For example, processing is not conducted for multibeam sonar data, but we support existing efforts for this data type including the Global Multi-Resolution Topography synthesis GMRT; Ryan et al., 2009) and Seabed2030 (Mayer et al., 2018) by providing quality assessment information to inform data selection for processing. For other data types, for example data acquired with MET and TSG sensors, QC’d data products in a standard format mapped to ship navigation data are generated in near real-time via the SAMOS component of R2R that feed directly into operational global data syntheses (e.g., Freeman et al., 2017; Smith et al., 2019). Conducting this higher-level QC/data processing close to data collection provides an opportunity to impact data acquisition, for example by helping to identify malfunctioning instruments, and hence improve the quality and quantity of data collected. Further, for data types acquired with a wide heterogeneity in devices used, standardization and data QC is easier to conduct near acquisition time with close interaction with marine data providers to ensure that device and calibration information are accurately captured.
6.2. Recommendations
From the decade of operational management of routine environmental data acquired on expeditions of the academic research vessels in the US we offer these summary recommendations:
• Ensuring the preservation of all data acquired at sea and the accuracy of data documentation requires data management in close partnership with data providers and aligned with their ship-board data acquisition processes.
• Standardized cruise data directory structures, accurate inventories and documentation of all devices used on each cruise, and cruise metadata templates are needed to support efficient post cruise data management.
• Adoption of cruise DOIs, which provide a unique identifier for the acquisition framework with standard metadata, and inclusion of these DOIs as part of the metadata for all data packages, allows for preservation of the cruise context within which data were acquired and benefits marine data re-usability.
• Working closely with both operators and science advisors has enabled the development of recommended data practices that balance value to scientists with tractability for the operator, and have improved the standardization and quality of data over time.
6.3. Looking forward
In the coming operational period, R2R’s work will include new services to further advance data interoperability and to support future cloud-based data access. These services will support not only the data product development work of the global thematic DACs that make use of research fleet data but will also provide new opportunities for the growing ecosystem of open science community tools currently being developed in data-science focused languages like R and Python, and with Jupyter notebooks. Work on best practices for additional device types and for event logging of operational activities will be ongoing in collaboration with operators and the science community. Similarly, further work on developing controlled vocabularies and standards in partnership with international groups is planned. There has been tremendous progress in recent years in marine data sharing initiatives globally and developing new opportunities for aligning with and integrating with the broad marine community will be an increasing focus.
7. Concluding comments
Oceanographic data collected by research ships across the international community represent the primary source of in situ observations of the oceans spanning remote locations in the deep ocean to the near shore coastal zones and supporting a diversity of chemical, physical, biological and geoscience research objectives. Many of the observations routinely acquired are of high value for monitoring ocean state and contribute to studies of ocean health. There is increasing recognition, reaching the highest levels of global and national policy, of the vital importance of the oceans for sustaining life on earth and as an engine of economic activity and growth (e.g. Joint Ocean Commission, 2013; UNESCO, 2017; Ryabinin et al., 2019). A comprehensive evidence base is needed to support the responsible stewardship of the oceans and there is a need for easy access to all data acquired across the global community to collectively build this knowledge base. Robust API driven data access and standard format data and documentation are essential to support these needs and will be foundational for the deployment of emerging big data technologies. R2R data services are supporting the aggregation of multi-disciplinary/multi-parameter observations from academic research expeditions conducted in the US each year into a FAIR-aligned, comprehensive, citable and openly accessible collection with harmonized documentation, contributing an important resource for current and future marine research around the globe.
Data availability statement
Publicly available datasets were analyzed in this study. This data can be found here: Rolling Deck to Repository www.rvdata.us.
Author contributions
RA, SC, and JH conceived of original project; RA, SC, CC VF, SM, SO, and SS led initial design and project implementation; SO, SC, KS, PC, LS, and SS lead current design and implementation and along with KB, RH, EM, CO, NS, and RU’s current project operations. AD contributed to project implementation. SC wrote first draft of article. All authors contributed to the article and approved the submitted version.
Funding
Funding for the R2RProgram has been from US National Science Foundation under awards 0947877, 0947822, 0947784, 0947784, 1447797, 1949707, the Office of Naval Research, NOAA via the Ocean Exploration Trust, and Schmidt OceanInstitute.
Acknowledgments
Special acknowledgement goes to colleagues at NOAA, NCEI including Christopher Paver, Jennifer Jencks, Chuck Anderson, Brian Myer, Georgiana Zelenak and their other colleagues who facilitate the ongoing collaboration for long-term archiving of the R2R research fleet data collection. The R2R program has benefited from the NSF-funded Science Gateways Community Institute (Lawrence et al., 2015) with an Extended Developer Engagement in support of R2R cyberinfrastructure. Note: Any opinions, findings, conclusions or recommendations expressed in this paper are those of the authors and do not necessarily reflect the views of the National Science Foundation.
Conflict of interest
The authors declare that the research was conducted in the absence of any commercial or financial relationships that could be construed as a potential conflict of interest.
Publisher’s note
All claims expressed in this article are solely those of the authors and do not necessarily represent those of their affiliated organizations, or those of the publisher, the editors and the reviewers. Any product that may be evaluated in this article, or claim that may be made by its manufacturer, is not guaranteed or endorsed by the publisher.
Supplementary material
The Supplementary Material for this article can be found online at: https://www.frontiersin.org/articles/10.3389/fmars.2022.1012756/full#supplementary-material
References
Arko R., Ji P., Fils D., Shepherd A., Chandler C., Lehnert K. (2016). Persistent identifiers for field deployments: A missing link in the provenance chain, abstract IN43B-1699 presented at 2016 fall meeting, AGU (San Francisco, Calif.: American Geophysical Union).
Baraniuk R. G. (2011). More is less: Signal processing and the data deluge. Science 331, 717–719. doi: 10.1126/science.1197448
Bourassa M. A., Legler D. M., O’Brien J. J., Smith S. R. (2003). SeaWinds validation with research vessels. J. Geophys. Res. 108, 1–16. doi: 10.1029/2001JC001081
Cai L., Zhu Y. (2015). The challenges of data quality and data quality assessment in the big data era. Data Sci. J. 14 (2), 1–10. doi: 10.5334/dsj-2015-002
Caress D. W., Chayes D. N. (2008) MB-System: Open source software for the processing and display of swath mapping sonar data. Available at: http://www.mbari.org/data/mbsystem.
CCSDS, Consultative Committee for Space Data Systems (2012) Reference model for an open archival information system (OAIS), recommended practice, CCSDS 650.0-M-2. Available at: https://public.ccsds.org/pubs/650x0m2.pdf.
Creative Commons (2022) Public domain mark. Available at: https://creativecommons.org/share-your-work/public-domain/pdm (Accessed June 15, 2022).
DataCite (2022) DataCite – APIs. Available at: https://datacite.org/integratorapis.html (Accessed June 15, 2022).
Freeman E., Woodruff S. D., Worley S. J., Lubker S. J., Kent E. C., Angel W. E., et al. (2017). ICOADS release 3.0: A major update to the historical marine climate record. Int. J. Climatology 37, 2211–2232. doi: 10.1002/joc.4775
GeoCSV (2015). Available at: http://geows.ds.iris.edu/documents/GeoCSV.pdf.
Guha R. (2011). Introducing schema.org: Search engines come together for a richer web. Google Off. Blog. Available at: https://search.googleblog.com/2011/06/introducing-schemaorg-search-engines.html.
Joint Ocean Commission (2013). Charting the course: Securing the future of america’s oceans, (Meridian Institute, Washington DC) 36.
Lara-Lopez A., Hodgson-Johnston I., Cahill M., Mancini S., Blain P., Moltmann T. (2019). From research to end-users, tracing the path of ocean observations in Australia. Mar. Freshw. Res. 70, 925–935. doi: 10.1071/MF18066
Lawrence K. A., Zentner M., Wilkins-Diehr N., Wernert J. A., Pierce M., Marru S., et al. (2015). Science gateways today and tomorrow: positive perspectives of nearly 5000 members of the research community. Concurrency Computation: Pract. Exp. 27 (16), 4252–4268. doi: 10.1002/cpe.3526
Levitus S., Antonov J. I., Baranova O. K., Boyer T. P., Coleman C. L., Garcia H. E., et al. (2013). The world ocean database. Data Sci. J. 12, WDS229–WDS234. doi: 10.2481/dsj.WDS-041
Li M., Liu J., Wang Z., Wang H., Zhang Z., Zhang L., et al. (2013). Assessment of Sea surface wind from NWP reanalyses and satellites in the southern ocean. J. Atmos. Oceanic Technol. 30 (8), 1842–1853. doi: 10.1175/JTECH-D-12-00240.1
Maffei A. R., Chandler C. L., Stolp L., Lerner S., Avery J., Thiel T. (2012)R2R eventlogger: Community-wide recording of oceanographic cruise science events 2012, OS51E-1921. In: AGU fall meeting 3-7 December 2012 (San Francisco). Available at: https://ui.adsabs.harvard.edu/abs/2012AGUFMOS51E1921M/abstract (Accessed 2022-10-18).
Martín Miquez B., Novellino A., Vinci M., Claus S., Calewaert J.-B., Vallius H., et al. (2019). The European marine observation and data network (EMODnet): Visions and roles of the gateway to marine data in Europe. Front. Mar. Sci. 6. doi: 10.3389/fmars.2019.00313
Maus S., Barckhausen U., Berkenbosch H., Bournas N., Brozena J., Childers V., et al. (2009). EMAG2: A 2–arc min resolution earth magnetic anomaly grid compiled from satellite, airborne, and marine magnetic measurements. Geochemistry Geophysics Geosystems 10 (8), 1–12. doi: 10.1029/2009GC002471
Mayer L., Jakobsson M., Allen G., Dorschel B., Falconer R., Ferrini V., et al. (2018). The Nippon foundation–GEBCO seabed 2030 project: The quest to see the world’s oceans completely mapped by 2030. Geosciences 8, 63. doi: 10.3390/geosciences8020063
National Centers for Environmental Information (NCEI) (2022). Available at: https://www.ncei.noaa.gov/ (Accessed June 15, 2022).
National Research Council (2009). Science at Sea: Meeting future oceanographic goals with a robust academic research fleet (Washington, DC: The National Academies Press). doi: 10.17226/12775
National Research Council (2015). Sea Change: 2015-2025 decadal survey of ocean sciences (Washington, DC: The National Academies Press). doi: 10.17226/21655
NMEA (2022) National marine electronics organization (NMEA) 0183 standard. Available at: http://www.nmea.org/content/nmea_standards/nmea_0183_v_410.asp (Accessed June 15, 2022).
Pearlman J., Buttigieg P. L., Bushnell M., Delgado C., Hermes J., Heslop E., et al. (2021). Evolving and sustaining ocean best practices to enable interoperability in the UN decade of ocean science for sustainable development. Front. Mar. Sci. 8. doi: 10.3389/fmars.2021.619685
Ritt S. (2019) Electronic logbook package. Available at: https://elog.psi.ch/elog/.
Rolling Deck to Repository (2018) R2R best practices for navigation data collection. Available at: https://www.rvdata.us/files/Recommended-Best-Practices-for-Navigation-Data-Collection.pdf.
Ryabinin V., Barbière J., Haugan P., Kullenberg G., Smith N., McLean C., et al. (2019). The UN decade of ocean science for sustainable development. Front. Mar. Sci. 6, 470. doi: 10.3389/fmars.2019.00470
Ryan W. B. F., Carbotte S. M., Coplan J. O., O’Hara S., Melkonian A., Arko R., et al. (2009). Global multi-resolution topography synthesis: Geochemistry, geophysics. Geosystems 10 (3), 1–9. doi: 10.1029/2008GC002332
Schaap D. M. A., Lowry R. K. (2010). SeaDataNet – pan-europea infrastructure for marine and ocean data management: unified access to distributed data sets. Int. J. Digital Earth 3 (S1), 50–69. doi: 10.1080/17538941003660974
SeaDataNet (2022). About SeaDataNet. Available at: https://www.seadatanet.org/ [Accessed November 22, 2022].
Smith S. R., Alory G., Andersson A., Asher W., Baker A., Berry D. I., et al. (2019). Ship-based contributions to global ocean, weather, and climate observing systems. Front. Mar. Sci. 6. doi: 10.3389/fmars.2019.00434
Smith S. R., Briggs K., Bourassa M. A., Elya J., Paver C. R. (2018). Shipboard automated meteorological and oceanographic system data archive: 2005–2017. Geosci Data J. 5, 73–86. doi: 10.1002/gdj3.59
Smith S. R., Forcucci D., Goes J., Hudak R., Mishonov A., Stolp L., et al. (2020). Best practices for shipboard underway transmissometers. version 1 (Tallahassee: FL, Florida State University Center for Ocean-Atmospheric Prediction Studies), 13. doi: 10.25607/OBP-790
Speich S., Lee T., Muller-Karger F., Lorenzoni L., Pascual A., Jin D., et al. (2019). Oceanobs’ 19: An ocean of opportunity. Front. Mar. Sci. 6, 570. doi: 10.3389/fmars.2019.00570
Straume E. O., Gaina C., Medvedev S., Hochmuth K., Gohl K., Whittaker J. M., et al. (2019). GlobSed: Updated total sediment thickness in the world’s oceans. Geochemistry Geophysics Geosystems 20, 1–17. doi: 10.1029/2018GC008115
Tanhua T., Pouliquen S., Hausman J., O’Brien K., Bricher P., de Bruin T., et al. (2019). Ocean FAIR data services. Front. Mar. Sci., 2019. doi: 10.3389/fmars.2019.00440
UNESCO (2017) United nations decade of ocean science for sustainable development, (2021-2030). UNESCO press release. Available at: https://en.unesco.org/ocean-decade.
UNOLS (2019) US Academic research fleet improvement plan 2019 update. Available at: https://www.unols.org/documents/fleet-improvement-plans.
Weatherall P., Marks K. M., Jakobsson M., Schmitt T., Tani S., Arndt J. E., et al. (2015). A new digital bathymetric model of the world’s oceans. Earth Space Sci. 2, 331–345. doi: 10.1002/2015EA000107
Wilkinson M. D., Dumontier M., Aalbersberg I. J., Appleton G., Axton M., Baak A., et al. (2016). The FAIR guiding principles for scientific data management and stewardship. Sci. Data 3 (1), 1–9. doi: 10.1038/sdata.2016.18
Keywords: marine data management, data curation, data science, ocean observations, marine research cruise, FAIR, interoperability
Citation: Carbotte SM, O’Hara S, Stocks K, Clark DP, Stolp L, Smith SR, Briggs K, Hudak R, Miller E, Olson CJ, Shane N, Uribe R, Arko R, Chandler CL, Ferrini V, Miller SP, Doyle A and Holik J (2022) Rolling Deck to Repository: Supporting the marine science community with data management services from academic research expeditions. Front. Mar. Sci. 9:1012756. doi: 10.3389/fmars.2022.1012756
Received: 05 August 2022; Accepted: 07 November 2022;
Published: 08 December 2022.
Edited by:
Jay S. Pearlman, Institute of Electrical and Electronics Engineers, FranceReviewed by:
Cora Hoerstmann, UMR7294 Institut Méditerranéen d’océanographie (MIO), FranceStuart James Kininmonth, The University of Queensland, Australia
Copyright © 2022 Carbotte, O’Hara, Stocks, Clark, Stolp, Smith, Briggs, Hudak, Miller, Olson, Shane, Uribe, Arko, Chandler, Ferrini, Miller, Doyle and Holik. This is an open-access article distributed under the terms of the Creative Commons Attribution License (CC BY). The use, distribution or reproduction in other forums is permitted, provided the original author(s) and the copyright owner(s) are credited and that the original publication in this journal is cited, in accordance with accepted academic practice. No use, distribution or reproduction is permitted which does not comply with these terms.
*Correspondence: Suzanne M. Carbotte, carbotte@ldeo.columbia.edu
†These authors share senior authorship