Projecting future climate change impacts on the distribution of the ‘Octopus vulgaris species complex’
 Francisco Oliveira Borges1*
  Miguel Guerreiro1,2
  Catarina Pereira Santos1
  José Ricardo Paula1,3
  Rui Rosa1,3
- 1MARE – Marine and Environmental Sciences Centre & ARNET - Aquatic Research Network, Faculdade de Ciências, Universidade de Lisboa, Lisboa, Portugal
- 2GEOMAR, Helmholtz Centre for Ocean Research Kiel, Kiel, Germany
- 3Departamento de Biologia Animal, Faculdade de Ciências, Universidade de Lisboa, Lisboa, Portugal
Introduction: Historically considered to be a single cosmopolitan species, the so called Octopus vulgaris species complex (OVSC) is now recognized to be a group of (at least) six cryptic species: O. americanus (in the west Atlantic), O. vulgaris (in the northeast Atlantic and Mediterranean Sea), O. aff. vulgaris (in the region of South Africa), O. tetricus (southeastern Oceania), O. sinensis (northwestern Pacific), and O. djinda (western Australia). The potentially different environmental preferences of this highly cryptic species complex may result in distinct consequences under future environmental conditions.
Methods: The present study employed species distribution models (SDM) using MaxEnt to investigate potential changes in habitat suitability and geographical distribution of the OVSC in the future (i.e., 2050, and 2100), across four representative concentration pathway scenarios (RCP-2.6, 4.5, 6.0, and 8.5, CMIP5).
Results: Differential responses were observed in the OVSC species analyzed. Specifically, O. vulgaris and O. tetricus exhibited a severe loss in distribution across their predicted range; O. americanus exhibited projected extirpation close to the equator, with limited expansion towards the poles; O. aff. vulgaris was projected to lose half of its current distribution; O. sinensis exhibited moderate losses, with projected increases in northern areas; and finally, O. djinda exhibited limited losses to its distribution. Except for O. sinensis, increasing RCP severity exacerbated changes in mean habitat suitability and projected distribution gains and losses.
Discussion: Ultimately, this study provides information on the potential biogeographical effects of marine climate change on a key worldwide ecological and economic resource to further disentangle the effects over each OVSC species, with the goal of assisting toward the sustainable management of octopus species at the global scale.
Introduction
Cryptic species complexes represent a particularly challenging topic in marine ecology. The term ‘species complex’ is employed when referring to a group of closely related species, historically classified as a single taxon, given the difficulty in their distinction through traditional morphology-based taxonomic methods (Knowlton, 1993; Bickford et al., 2007). Despite their typically high phenotypical proximity, which ultimately prevents their accurate discrimination, considerable genetic divergence can be observed (Espíndola et al., 2016). Cryptic diversity is relatively common in the Tree of Life, with cryptic species occurring almost homogenously among metazoans (Pfenninger and Schwenk, 2007) and protozoa (Bass et al., 2007). Moreover, cryptic species can be found in all major terrestrial and aquatic taxa, across the entire latitudinal profile (Beheregaray and Caccone, 2007). Over the past decades, techniques such as molecular sequencing, DNA barcoding, and mitochondrial DNA (mtDNA) analysis have enabled the disentangling of such instances, revealing a vast array of cryptic species complexes (Hebert et al., 2003; Bickford et al., 2007). The cephalopod class is no exception, with well-known species complexes, including those of the big-fin reef squid, Sepiotheuthis cf. lessoniana (Lesson 1930) (Cheng et al., 2014), the pharaoh cuttlefish, Sepia pharaonis (Ehrenberg, 1831) (Farhadi and Anderson, 2021), the squid Lolliguncula sp. (Steenstrup, 1881) (Sales et al., 2014; Costa et al., 2021), Ommastrephes squids (Fernández-Álvarez et al., 2020); and the common octopus, Octopus vulgaris (Cuvier 1797).
Historically, O. vulgaris was considered a cosmopolitan species, inhabiting shallow benthonic waters in disjunct populations spread around tropical waters worldwide (Robson, 1932; Roper et al., 1984). Initially described as a single species with a rather broad range (occurring along the eastern North Atlantic and the Mediterranean Sea, in the Americas and the eastern South Atlantic, Oceania, and the Northwest Pacific Ocean), recent genetic and molecular analyzes have enabled researchers to discriminate genetically distinct species within the O. vulgaris complex (Söller et al., 2000; Leite et al., 2008; Amor et al., 2015; Gleadall, 2016). At the same time, the existence of geographically and genetically isolated populations also contributed to the inclusion of ‘Type’ species in the complex (Norman et al., 2014). To this day, the OVSC is known to be comprised of (at least) six Octopus species, including: i) O. vulgaris - previously named O. vulgaris sensu strictu and which occurs in the North Atlantic Ocean, from North Africa to the English Channel, and in the Mediterranean Sea (Mangold and Hochberg, 1991; Mangold, 1998; Rosa et al., in press); ii) Octopus americanus - occurring along the Atlantic continental shelves of the Americas (Avendaño et al., 2020); iii) Octopus aff. Vulgaris – occurring in the coastlines of South Africa and Madagascar (Oosthuizen and Smale, 2003; Oosthuizen et al., 2004); iv) Octopus sinensis, occurring in the north-western Pacific Ocean, in the region of Japan and the Eastern China Sea (Reid and Wilson, 2015; Gleadall, 2016); v) Octopus tetricus, occurring in the south-eastern Australian coastline and northern New Zealand (Guzik et al., 2005; Amor et al., 2017); and vi) Octopus djinda Amor, - formerly Octopus cf. tetricus, occurring in the south-western coastline of Australia (Amor and Hart, 2021). This species complex is highly valued worldwide, representing one of the world’s most important cephalopod fisheries (Balguerías et al., 2000; Sauer et al., 2021). Along with its high value, extensive exploitation is poised to negatively impact this group, with some populations exhibiting signs of depletion (Quetglas et al., 2015). Indeed, octopus catches have increased in the past decades (FAO, 2021), despite global cephalopod fisheries declining since 2014 (FAO, 2020). This increase in fishery pressures, together with poor taxonomic resolution and catch under-reporting at regional and even species level could potentially lead to overexploitation of octopus populations (Norman et al., 2014; Sauer et al., 2021), as has been the case for certain species of the complex [e.g., O. sinensis (Gleadall, 2016)]. Likewise, small scale coastal fisheries are also becoming unsustainable in the long term, for example in Southern Europe, due to the growing interest in Octopus fisheries allied to depleting finfish stocks and rising prices (Pita et al., 2021). The difficulty implicit to species discrimination within the complex leads to increased difficulty when compiling data on each of these species. At the same time, population identification and stock discrimination preclude an accurate assessment of the status of the OVSC around the world (Sauer et al., 2021), raising concerns over the real impact of anthropogenic pressures on each of the complex’s species. Additionally, within such pressures and given the potentially distinct habitat requirements between species, there is a particularly pressing need to disentangle the potential effects of anthropogenic climate change over these species.
Rising carbon dioxide (CO2) concentrations in the atmosphere over the past centuries (Shukla et al., 2019; Masson-Delmotte et al., 2021) are responsible for significant changes to the earth’s climate and the global ocean system (Pecl et al., 2017). Indeed, oceanic waters have been warming over the past decades due to the ocean’s ability to absorb 90% of excess atmospheric heat trapped by greenhouse gases (Zanna et al., 2019). At the same time, increased absorption of approximately 30% of the excess atmospheric CO2 has also been changing ocean chemistry, leading to decreasing pH levels (Gobler and Baumann, 2016). These changes in ocean chemistry and temperature have further contributed to increased ocean stratification and slowed and disrupted current patterns, leading to the expansion of areas with low oxygen (Gobler and Baumann, 2016). These phenomena are both consequences and drivers of ocean climate change and are set to yield a vast array of negative impacts on marine ecosystems worldwide (Sampaio et al., 2021). Among cephalopods, some lines of evidence indicate that this group may benefit from the impending shift in ocean conditions (Doubleday et al., 2016), although their responses are likely to be complex (Pecl and Jackson, 2008; Rodhouse et al., 2014). Their high phenotypic flexibility and consequent environmental plasticity (Liscovitch-Brauer et al., 2017), together with their ‘live fast and die young’ lifestyle (O’Dor and Webber, 1991) likely represent an advantage over other marine taxa when confronted with the various challenges of a changing climate. Indeed, the synergistic effects of warming and the overfishing of their predators and competitors, have been linked to the increased fitness of cephalopod species (Rodhouse et al., 2014; Doubleday et al., 2016). On the other hand, several experimental studies have shown potential deleterious effects of climate change for a wide array of cephalopod species, including octopuses (Repolho et al., 2014; Rosa et al., 2019), squid (Rosa and Seibel, 2008; Rosa et al., 2012; Rosa et al., 2014), and cuttlefishes (Rosa et al., 2013; Moura et al., 2019; Otjacques et al., 2020). At the same time, distribution shifts associated with climate forcing have already been observed for several octopuses (Ramos et al., 2014; Arreguín-Sánchez, 2019; Ponce-Márquez et al., 2020), and other cephalopod groups (Golikov et al., 2013; Alabia et al., 2020; Oesterwind et al., 2022), suggesting a broad redistribution of cephalopod species over the coming decades as they seek suitable environmental conditions (Xavier et al., 2016; Rosa et al., 2019).
Given the relatively high potential for future climate change to induce differential changes to marine species, there is a need to accurately describe a species’ ecological and geographical distribution. With the combination of biogeographic knowledge and modelling in climate change impact studies, it is possible to attempt the prediction of the future impacts on biodiversity and ecosystem health (Hannah et al., 2002). Species distribution models (SDMs) present a very useful tool in this regard. Indeed, its development and use have increased steeply over the past decades (Zimmermann et al., 2010), since these models offer a good framework for predicting changes in species distributions, across vast geographical spaces and regarding large species assemblages (Elith et al., 2006). These models take geo-referenced occurrence data and environmental predictors for a defined geographical extent and establish the relationship between a species’ occurrence and environmental conditions, defining a species’ ecological niche and allowing researchers to perform projections on the potential changes in a species distribution ranges across time and space (Miller, 2010). While these models are bounded by a set of assumptions and limitations that must be taken into consideration during interpretation (Araújo et al., 2005; Araújo and Guisan, 2006; Heikkinen et al., 2006; Fitzpatrick and Hargrove, 2009), SDMs incorporating future climate change predictions are considered a very effective way to address some of the questions regarding climate change effects on biodiversity (Sinclair et al., 2010).
To this day, a growing body of literature has employed SDM frameworks with cephalopod species (Puerta et al., 2015; Alabia et al., 2016; Xavier et al., 2016; Boavida-Portugal et al., 2022). However, research employing this modelling approach to project potential biogeographical impacts of marine climate change on octopuses remains very scarce (Hermosilla et al., 2011; Lima et al., 2020; Ángeles-González et al., 2021; Schickele et al., 2021; Boavida-Portugal et al., 2022), with few studies focusing on species of the OVSC and at this scale. In this context, the present study aims to evaluate the potential biogeographical impacts of future oceanic climate change on the distribution of the six OVSC species, by implementing an SDM workflow using MaxEnt modelling to predict present-time habitat suitability and species occurrence distribution and project these into two future periods (i.e., 2040/2050 and 2090/2100), across four Representative Concentration Pathway scenarios (RCP; RCP-2.6, 4.5, 6.0, and 8.5, CMIP5). With this approach, the present study also aims to aid the correct management of octopus fisheries worldwide, particularly with regards to the six species studied. By identifying the most threatened areas of each species’ distribution, it is possible to better inform policy makers and economic agencies to prevent the collapse of local or regional populations.
Material and methods
Collection and curation of occurrence data
To obtain the necessary geo-referenced occurrence data on the species of interest, the Global Biodiversity Information Facility (GBIF) [GBIF.org (24 May 2022)] (GBIF, 2022) and the Ocean Biodiversity Information Facility (OBIS) [OBIS.org (24 May 2022)] databases were surveyed. As a way of limiting the data retrieved in each database to only valid occurrences, a specific set of filters were used, positively selecting for those occurrences obtained through ‘Human Observation’ and ‘Preserved Specimen’, and filtering out duplicate observations, improper datum conversion points, missing (NA) values in either Latitude or Longitude, as well as rounded latitude/longitude coordinates. When dealing with species complexes, there is the risk of misidentification of specimens with the original morphospecies. Online databases such as GBIF and OBIS, contain significant contributions from citizen-science databases (e.g., iNaturalist) and non-directed scientific surveys, which undergo different degrees of scientific validation (iNaturalist, 2022), but are still susceptible to frequent cases of species misidentification, mainly when dealing with highly cryptic species complexes. In this sense, since most retrieved occurrences were labeled as Octopus vulgaris, one of the most recent illustrations of the potential distribution of each species of the complex (Avendaño et al., 2020) was used to re-label each occurrence point. In the case of Octopus djinda, occurrence data from Amor and Hart (2021) was also included in the species’ dataset, due to the relative lack of geo-referenced occurrences in either online database. For the present analysis, occurrences of O. sinensis from the Kermadec islands (Reid and Wilson, 2015) were excluded, and the extent of O. sinensis was limited to the Northwestern Pacific Ocean.
The compiled dataset was then curated, restricting all occurrences to the continental shelf area [i.e., from the surface to a depth of 200 m; (Laruelle et al., 2018)] and removing potential occurrences referenced on land. Since GBIF and OBIS do not include comprehensive records for the depth of each occurrence in most species, the occurrence data was converted into a spatial polygon object which was then used to extract a vector of the depth values at each occurrence’s coordinates (using the function ‘extract’ from the package ‘raster’), from a bathymetry raster layer obtained from Ocean Climate Layers for Marine Spatial Ecology (MARSPEC) (Sbrocco and Barber, 2013). The spatial polygon object was then converted back into a data frame and merged with the depth vector, and each species data frame was subset to exclude depths greater than 200 m. To remove data occurring on land, a second clipping of the occurrence data was performed by erasing all points outside a shapefile of the world’s ocean bodies (downloaded from Natural Earth Data, https://www.naturalearthdata.com/). These restriction procedures were performed because SDMs must ideally restrict model calibration to accessible areas (Peterson and Soberón, 2012). The curated occurrence dataset, together with the plotted occurrences for each species and the script used for data curation are supplied in the Supplementary Material (see Curated_species_datasets.zip). Dataset curation and the following analyses were all performed in R studio software (v.4.1.2) (R Studio Team, 2022). All scripts are available in the Supplementary Material.
Predictor variables
The predictor variables used in this study included one topographic variable – i.e., bathymetry – and three oceanographic variables: temperature, salinity, and current velocity. Concerning the oceanographic variables, both surface and maximum depth (benthic) layers were chosen, since octopuses are primarily benthonic, but can still be influenced by surface conditions. The choice of the oceanographic variables was primarily based on the availability of environmental predictors projected for the future periods (i.e., 2040-2050 and 2090-2100), and Representative Concentration Pathway scenarios (i.e., RCP2.6, 4.5, 6.0, and 8.5). The mean, max, min, and range for each predictor were obtained from Bio-ORACLE, which offers global geophysical, biotic, and climate layers at a common spatial resolution (5 arcmins) and a uniform landmask (Tyberghein et al., 2012; Assis et al., 2018). Bathymetry, in turn, was retrieved from MARSPEC at a resolution of 5 arcmins (Sbrocco and Barber, 2013) and used as a predictor variable, to incorporate the water column height into the spatial analysis.
Modelling
The species distribution models were built for MaxEnt modelling, using the ‘megaSDM’ package (Shipley et al., 2022). For this purpose, each predictor variable layer had to be reprojected to an equal-area projection (i.e., specifically the cylindrical equal-area projection – “+proj=cea +lat_ts=0 +lon_0 = 0 +x_0 = 0 +y_0 = 0 +datum=WGS84 +no_defs”), because conventional non-equal area projections have grids which vary in their area the further away from the equator, and MaxEnt randomly samples cells from the available geographic space, assuming cells of equal area in the entire extent of each predictor (Elith et al., 2011). To detect and prevent collinearity in the predictor variable list (i.e., a strong correlation between two or more variables), the function ‘vifcor’ from the package ‘usdm’ was used (Naimi, 2015). Specifically, the function tests the variables against each other until it finds a pair of variables with a maximum linear correlation greater than a previously specified threshold [i.e., in this case, 0.7 (Cohen et al., 2003)], excluding the variable with a greater variance inflation factor value, and repeating this process for all variable combinations. This was performed in two separate analyses, i.e., first to the surface predictors, and then to those from the benthos, to prevent instability in parameter estimation. The results from the ‘vifcor’ function with the remaining variable list for the surface and benthonic predictor stacks are present in the Supplementary material (see collinearity.rar), together with the correlation plots obtained using the ‘ENMTools’ package (Warren et al., 2021).
The SDM analysis followed the workflow described in the ‘megaSDM’ package documentation (Shipley et al., 2022). In short, the training area, where the occurrence and background points are located, and the study area, where the model will be projected, were defined using the functions ‘TrainStudyEnv’ and ‘PredictEnv’, which take specific raster stacks and manipulates them to standardize the present and future period’s environmental data input, re-projecting, clipping, and resampling raster predictors when necessary (Shipley et al., 2022). The package then takes and manipulates the occurrence data and employs a series of measures to mitigate the inherent bias, typical of collected or downloaded occurrence data (Phillips et al., 2009; Boakes et al., 2010) and which decreases the overall accuracy of SDMs (Phillips et al., 2009; Beck et al., 2013; Varela et al., 2014). To mitigate environmental and spatial biases within the occurrence data, the package performs environmental filtering of the occurrence data by dividing the environmental values at each point into a pre-determined number of bins (n = 25 in the present study), and then selecting one point from each unique combination of bins, obtaining a subset of occurrence points that is filtered by the environment (Varela et al., 2014; Castellanos et al., 2019; Shipley et al., 2022). This method allows the removal of clustered or oversampled records, while still maintaining the range of environments in which a species was found (Varela et al., 2014). The number of occurrence records remaining after the environmental filtering process is present in Table 1.
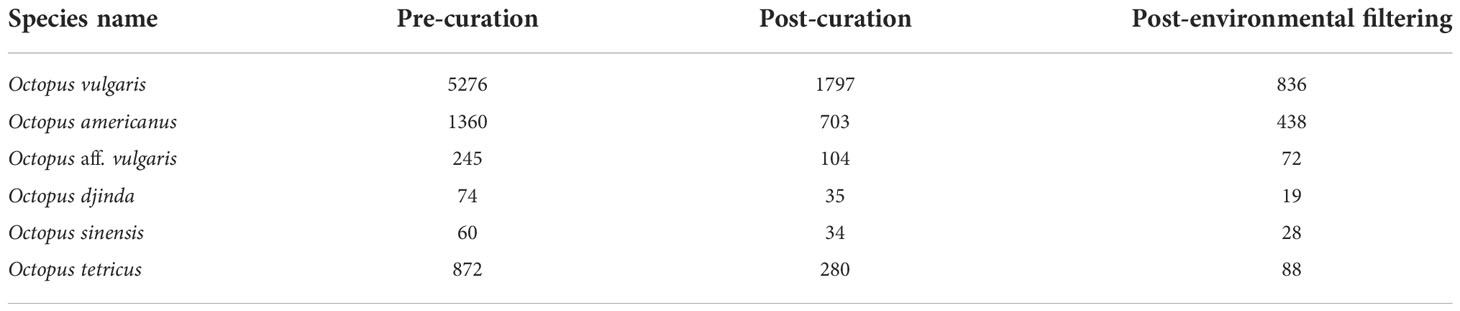
Table 1 Number of valid entries per species pre- and post-curation, and post-environmental filtering.
Since the species occurrence data frames only feature presence data, there was the need to generate background points for each species. Background points are artificially created species occurrence points, which describe the environmental conditions of the training area, and allow the incorporation of true data or pseudo-absence data into the models (Peterson and Soberón, 2012). The ‘megaSDM’ package uses a ‘combined’ method to generate the background points, which employs both random and spatially constrained sampling, each weighted by a user-defined threshold (i.e., 50% each for the present study) (Shipley et al., 2022). As such, half of the user-set number of background points (i.e., n = 1000 per species) was randomly sampled from the entire study area (Barbet-Massin et al., 2012), while the remaining half were sampled from within shapefiles buffered around each true occurrence point (with the radius of each buffer being proportional to the 95% quantile of the distance to the nearest neighbor). Using a combined method to generate background points reduces potential model overestimation of environmental suitability that typically arises in regions of greater occurrence point densities, usually in more easily sampled areas (i.e., spatial bias), and which random background point generation by itself does not consider (Lobo et al., 2010; Kramer-Schadt et al., 2013). At the same time, this method also reduces the susceptibility of extreme extrapolation errors and overfitting induced by spatially constrained methods, by assigning a percentage of the background points to be sampled randomly from the entire environmental extent (Radosavljevic and Anderson, 2014). During generation, the background points were also environmentally filtered, similar to the occurrence data, creating an even spread across available environmental space, while retaining its spatial weighting (Shipley et al., 2022).
The present habitat suitability and distribution of each species were estimated using the MaxEnt modelling technique, which employs maximum entropy methods and is particularly resilient when dealing with presence-only species records (Elith et al., 2010). This method also has a predictive performance that is consistently competitive with other high-performing methods (Elith et al., 2006; Feng et al., 2019). The ‘megaSDM’ package employs MaxEnt modelling using replication and the subsequent ensemble of the replicate model predictions – in the present case, a replicate number of 5 was used per species, with each model run using a different subset of occurrence points (Shipley et al., 2022). The area under the curve (AUC) value was employed to evaluate each model replicate and the final ensemble model. This was performed by taking the AUC value of each replicate and comparing it to the AUC of a null model, where multiple replicates of occurrence points were placed at random in the training area (Raes and ter Steege, 2007; Shipley et al., 2022). The ‘MaxentProj’ function removed all models with validation AUC values lower than a specified threshold (i.e., in this case, 0.70). The same function then projected all models onto the specified future environments, across all RCP scenarios, and created the ensemble of all replicate maps using the median value of each pixel, thus reducing the effect of outliers (Araújo and New, 2007; Shipley et al., 2022). The evaluation plots and tables for each species’ models are supplied in the supplementary material (see Evaluation.zip). From the ensembles, the habitat suitability maps were obtained. To produce binary maps of probability of occurrence (0 or 1), a threshold value was applied to the continuous habitat suitability maps. This threshold consisted of the mean model TSS criteria of model evaluation, also named ‘maximum test sensitivity and specificity’ logistic threshold, which maximizes the specificity and sensitivity of the receiver operating curve (i.e., the ROC curve), and is particularly effective in presence-only data (Liu et al., 2005). All the model projections, including the habitat suitability ensembles and the binary maps, are supplied in the supplementary material (see Projections.zip).
Post-analysis
The post-analysis followed a similar framework to the one previously described by Borges et al. (2022). Also, since the OVSC species do not exhibit a global distribution, instead having their areas of accepted occurrence in specific continents or regions of the globe, the post-analysis was performed in subsets of the total extent of the model predictions, encompassing only the currently accepted areas of distribution. First, changes to each species latitudinal distribution (within their currently accepted range) were assessed by plotting each species latitudinal centroid (i.e., the arithmetic mean latitude for the species-occupied pixels) for each time and RCP scenario. Second, the latitudinal trends in mean habitat suitability were obtained, by converting each ensemble into matrix form and calculating each row’s mean value. To obtain the projected changes in the latitudinal mean habitat suitability, the resulting present-day vector was subtracted to the 2050 and 2100 vectors, and the respective outputs were plotted along the latitudinal (y) axis. Afterwards, the binary maps of probability of occurrence were used to create a visualization of unidirectional range shifts (i.e., expansion and/or contraction) and transitory fluctuations (i.e., range contraction followed by expansion, and vice-versa), per scenario, per species (Early and Sax, 2011) using the function ‘createTimeMaps’ (Shipley et al., 2022). The Time Maps for each species and RCP scenario are supplied in the Supplementary Material (see Projections.zip). Data regarding this analysis is present in the supplementary material (see Post_analysis.zip).
Results
Variable contribution
The variable contribution for each species’ ensemble model is presented in Table 2 (see Supplementary material for further details). Overall, Temperature (either benthic or surface levels) contributed the most for the determination of habitat suitability and species occurrence. Except for O. vulgaris – where benthic salinity maximum provided the highest contribution - all OVSC species exhibited a temperature-related environmental layer as their most contributing variable. In the top four most contributing variables, temperature layers dominated, with bathymetry and salinity occurred isolated (salinity mainly in O. americanus). Variables associated with Current Velocity, in general, were the least contributing variables (apart from O. sinensis, where maximum surface current velocity was the fourth most contributing variable).
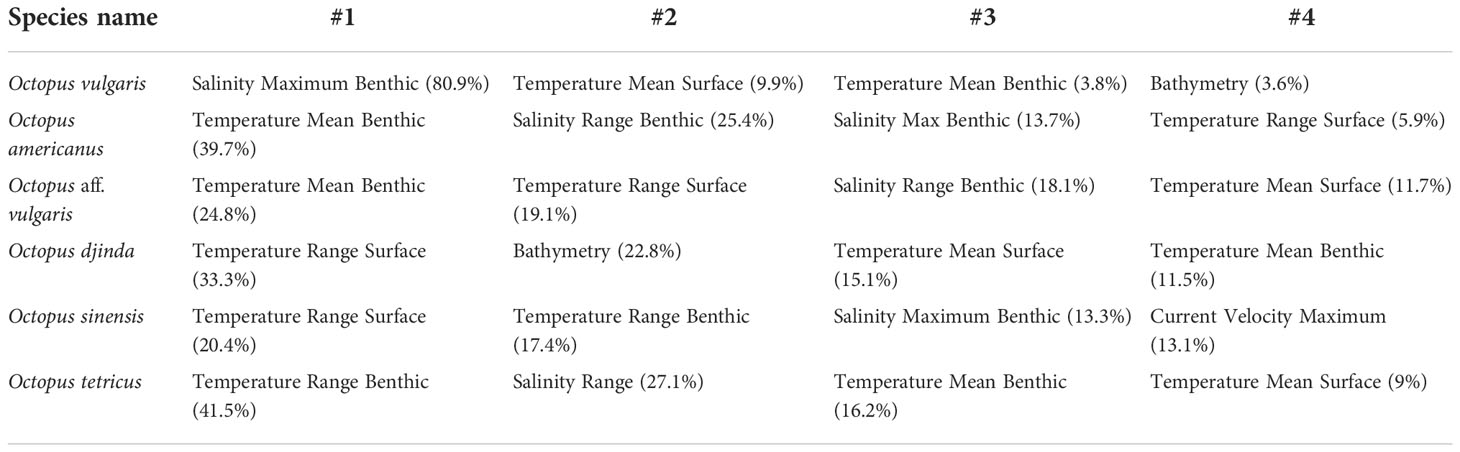
Table 2 Ensemble model variable contribution. The top four most contributing variables per species are presented below.
General patterns of habitat suitability
All six species of the OVSC exhibited a shift in their centroid of latitudinal distribution over time (Figure 1), despite relatively different responses between species and scenarios. Indeed, while O. vulgaris did not exhibit a clear trend over time and RCP severity – with the centroid barely moving until 2050 and with either a shift north (RCP-4.5 and RCP-6.0) or south (RCP-8.5) depending on the scenario (Figure 1A) - the other species exhibited fairly clear trends. Specifically, the centroid of distribution for O. americanus exhibited a considerable northward shift for all RCP scenarios, with the magnitude of this shift increasing along RCP severity, particularly between 2050 and 2100 (Figure 1B). For O. aff. vulgaris (Figure 1C), there is a clear southward shift that is exacerbated over time in RCP-6.0 and RCP-8.5, while for the two less severe scenarios the centroid expansion contracts until the end of the century, relative to 2050. Akin to O. americanus, O. sinensis also exhibited a clear northward shift of its centroid until the end of the century (Figure 1D), in a trend that is in general exacerbated with RCP scenario severity – except for RCP-6.0, where the northward shift is smaller when compared to RCP-4.5. Similar to O. aff. vulgaris, O. tetricus exhibited the same southward shift in its centroid, with a considerable southward shift until 2050 which then contracts northward in RCP-2.6 and RCP-4.5 - although not returning to the present-day latitude – and the successive shift southward for the more severe RCP scenarios (Figure 1E). The O. djinda (Figure 1F) also exhibited a similar pattern with a shift southward.
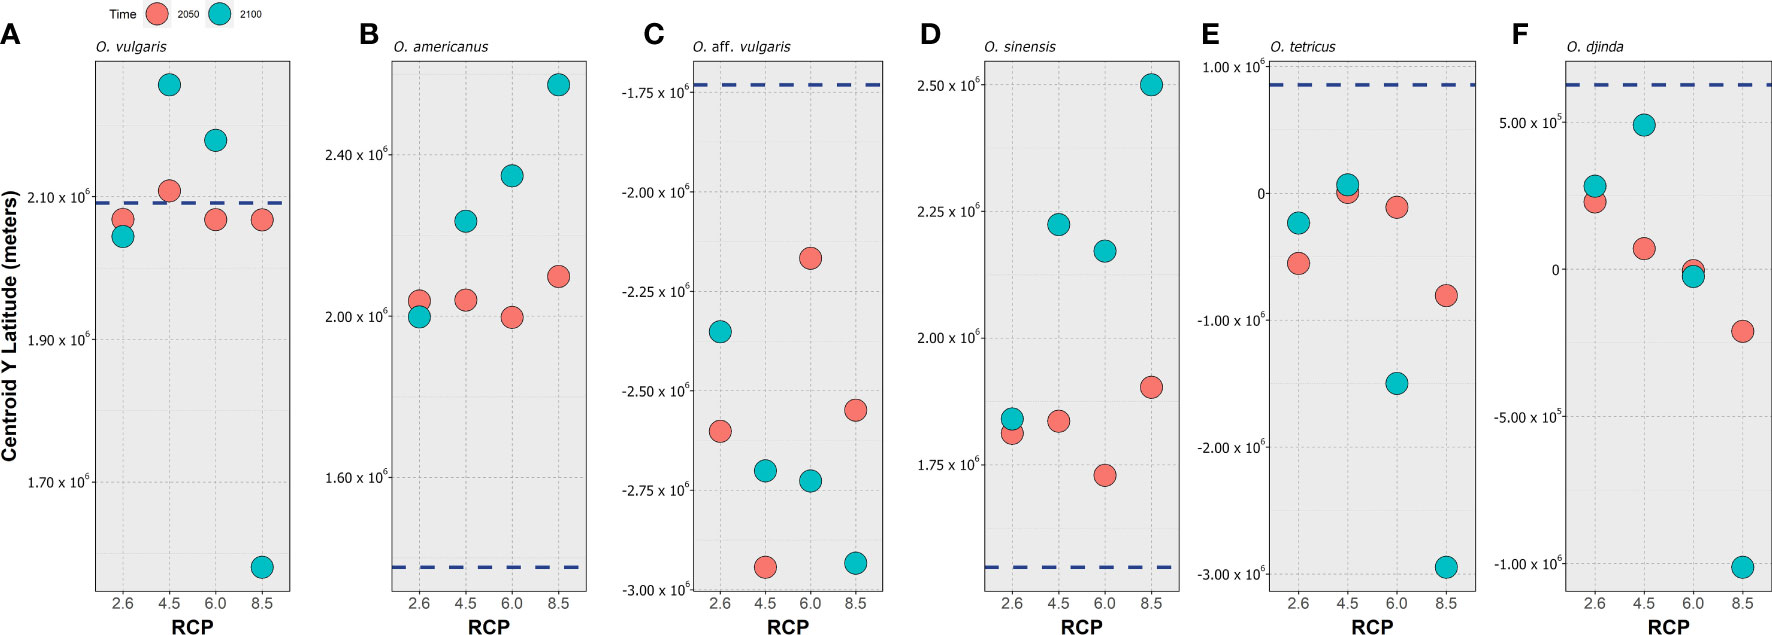
Figure 1 Projected changes to the centroid of latitudinal distribution (i.e., the mean latitude of the occupied pixels) calculated for 2050 (red circles) and 2100 (blue circles) and Representative Concentration Pathway scenario (RCP-2.6, 4.5, 6.0, and 8.5; CMIP5), for (A) Octopus vulgaris, (B) O. americanus, (C) O. aff. vulgaris, (D) O. sinensis, (E) O. tetricus, and (F) O. djinda. The dark blue, dashed horizontal lines represents the centroid value for the present-day (2000–2014 environmental conditions based on monthly averages).
Latitudinal trends in habitat suitability and occurrence distribution
In this section, the results of mean habitat suitability change across latitude and the plotted difference in projected occurrence distribution regarding present-day are presented in a species-by-species fashion. In terms of global trends, O. vulgaris was projected to undergo considerable reductions in habitat suitability and consequently local extirpations in its projected future distribution, which were exacerbated with the increasing severity of the RCP scenario. Specifically, mean latitudinal habitat suitability is projected to decrease over most of its latitudinal distribution (in the northern hemisphere) until the end of the century (Figure 2), mainly along the North African and Mediterranean range (Figure 3).
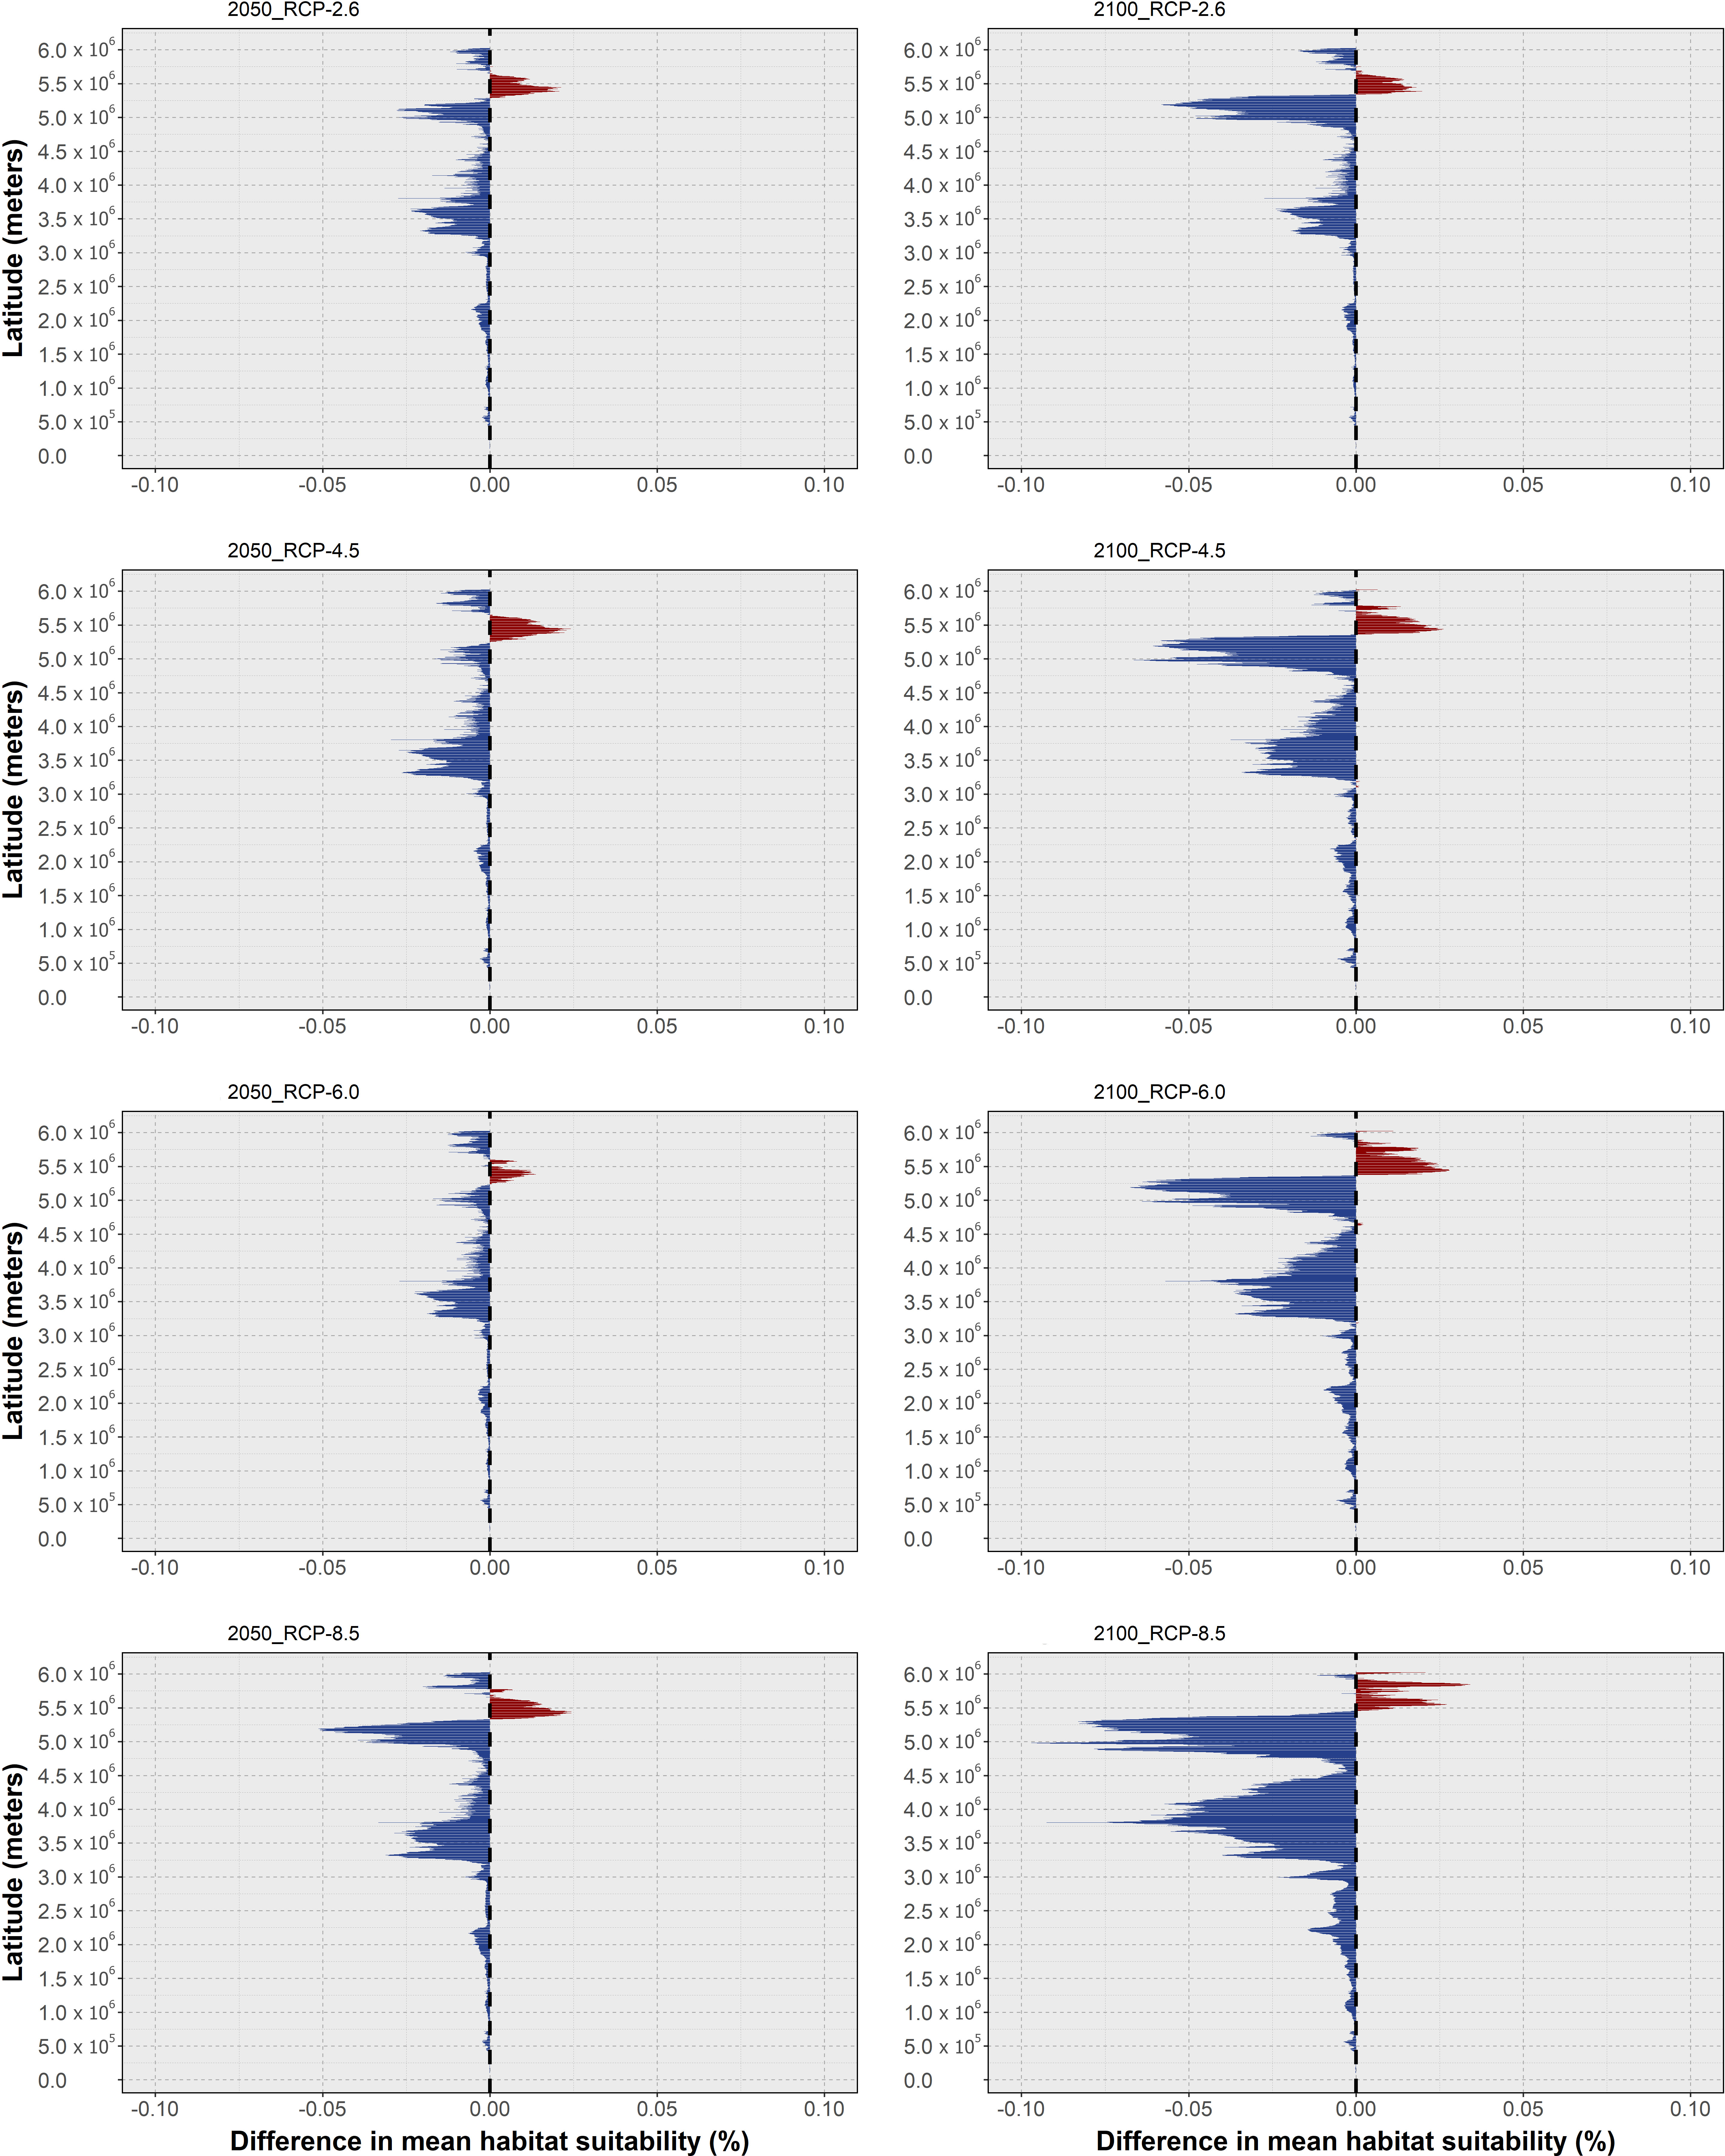
Figure 2 Changes in mean latitudinal habitat suitability for Octopus vulgaris between the present-day and 2050 (left side) and 2100 (right side), for each Representative Concentration Pathway scenario (RCP-2.6, 4.5, 6.0, 8.5; CMIP5), relative to the present-day baseline (i.e., the black dashed vertical line). Data to the right of the dashed line represents a relative increase in mean habitat suitability (red) and data to the left represents a relative decrease (blue).
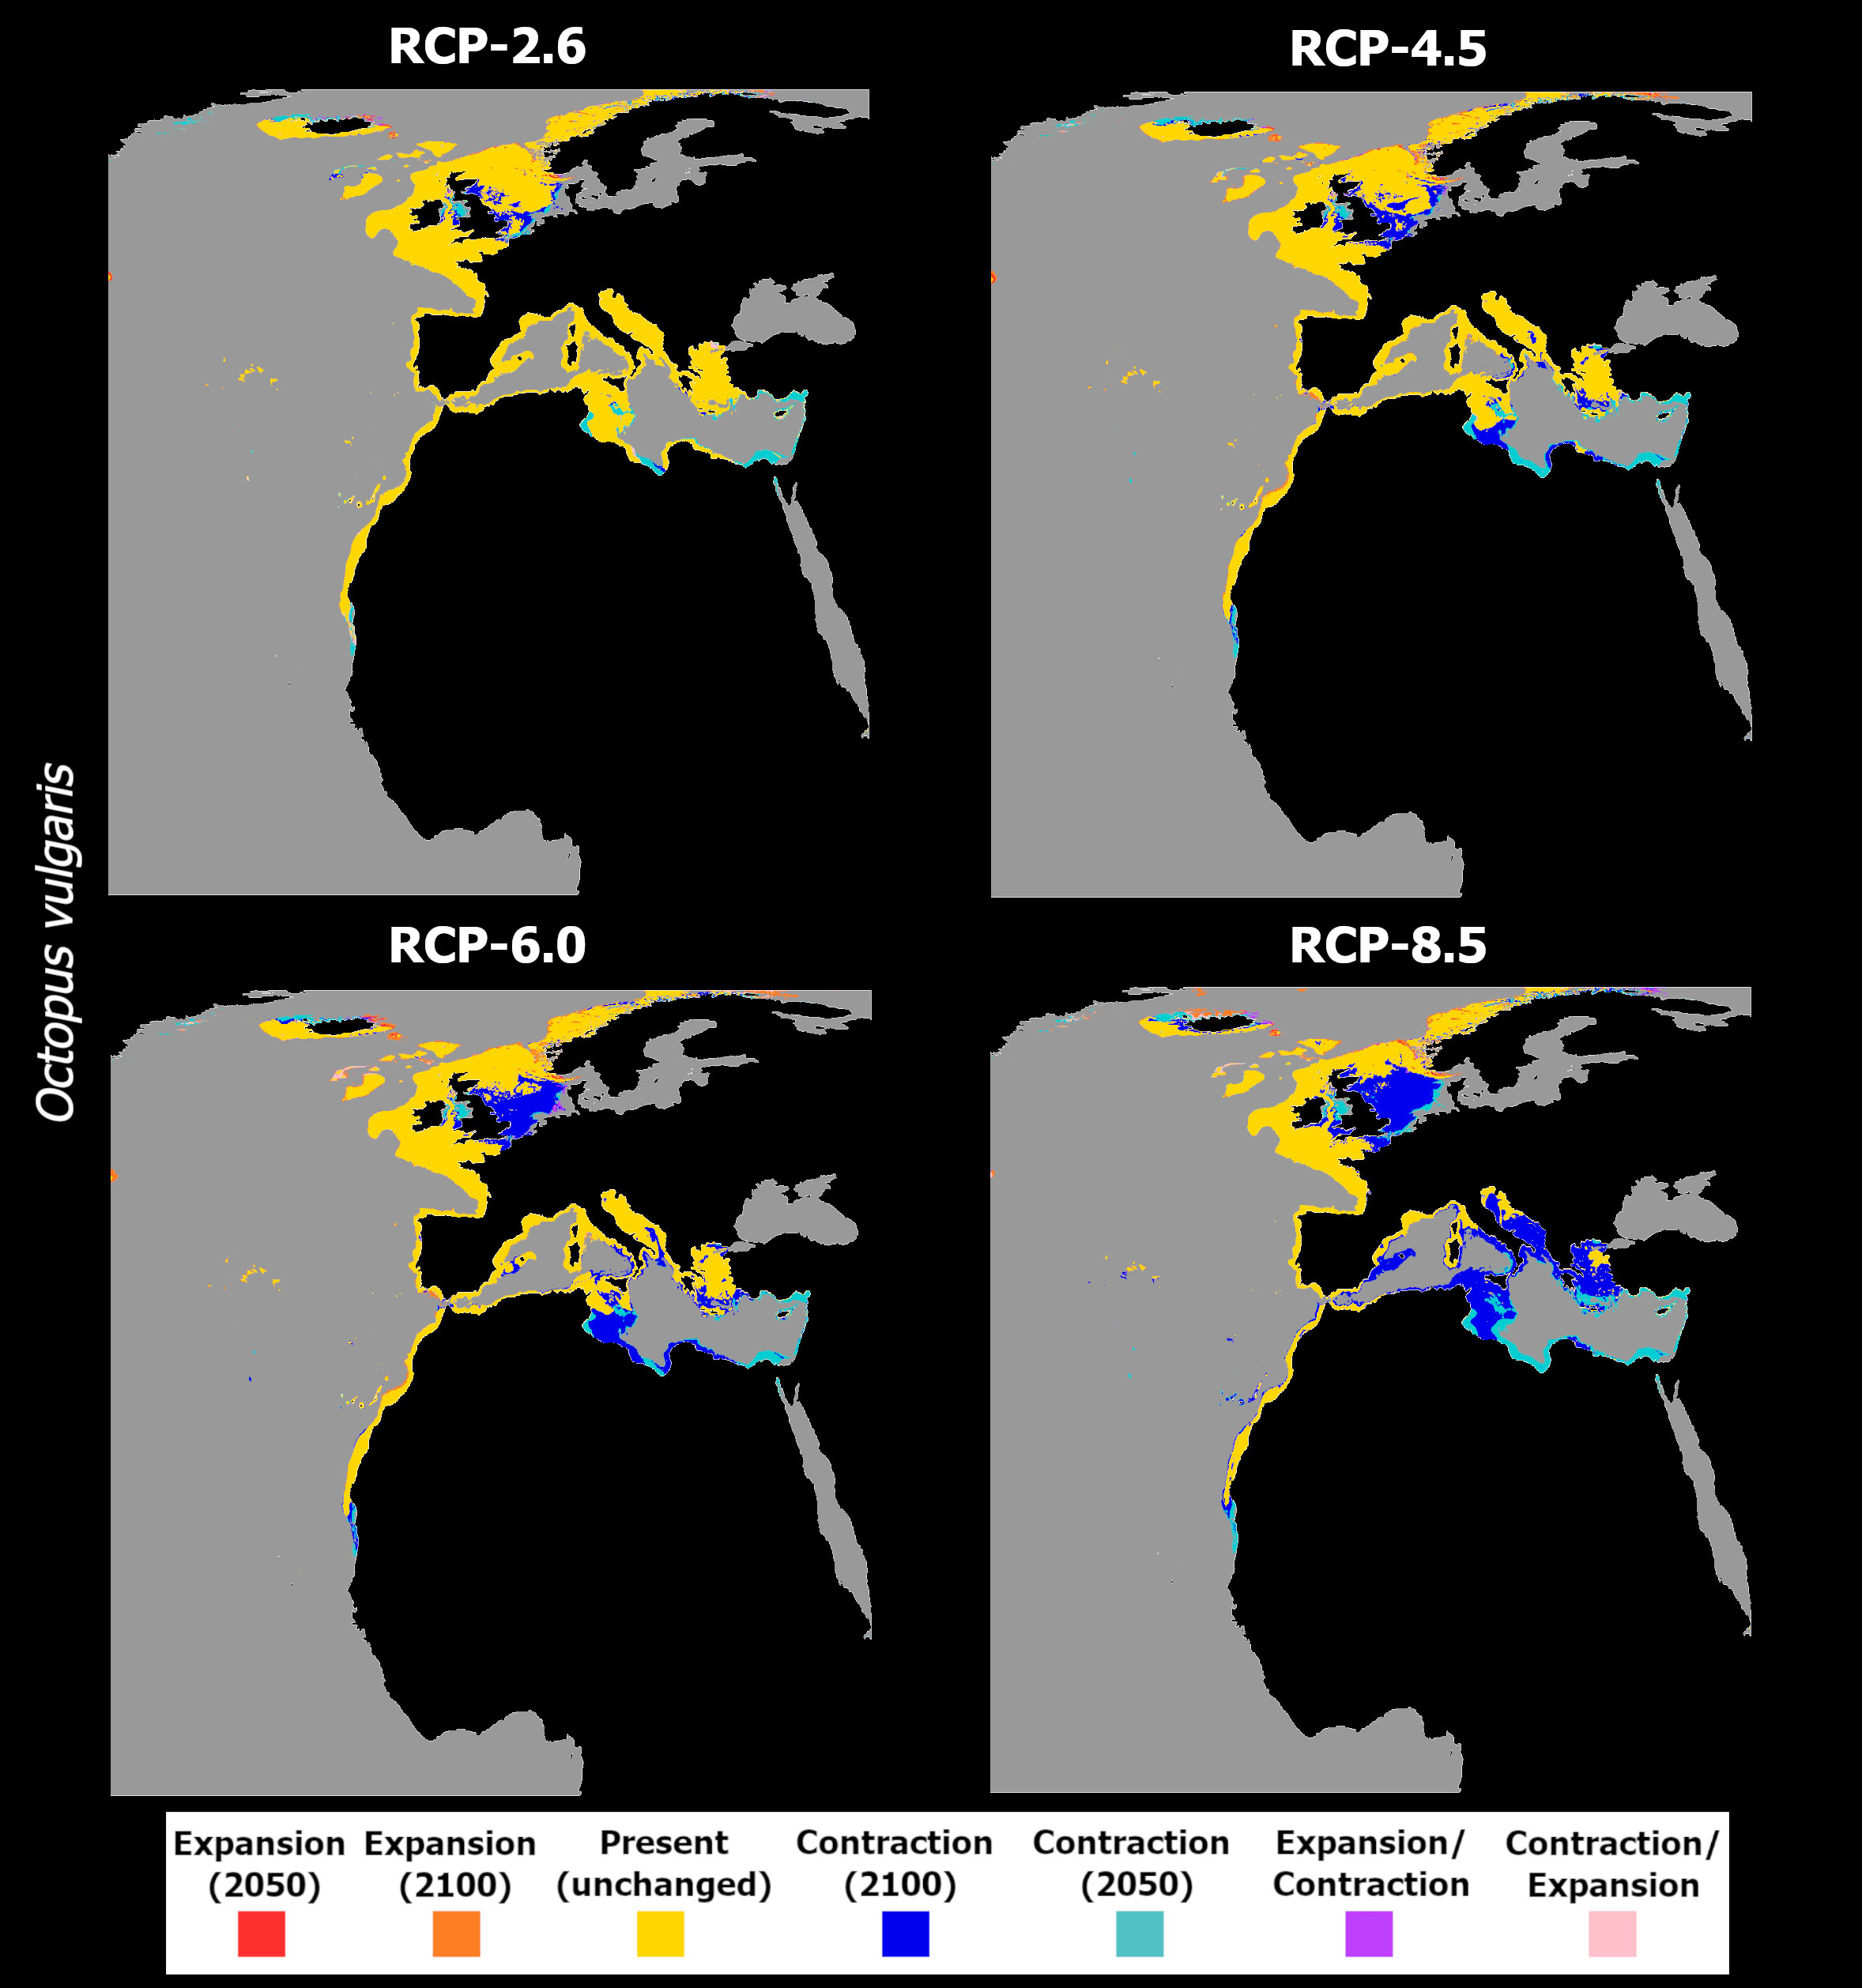
Figure 3 Time maps of the projected changes in species occurrence distribution for Octopus vulgaris, showing unidirectional range shifts in occurrence distribution [i.e., range expansion (in red and orange) or contraction (in dark and light blue)] as well as transitory fluctuations (i.e., range contraction followed by expansion (pink), and vice-versa (purple)] across time (i.e., 2050 and 2100) and RCP scenarios (RCP-2.6, 4.5, 6.0, 8.5; CMIP5).
Changes in habitat suitability for this species are relatively similar across RCP scenarios until 2050 - the largest decreases in suitability occur generally over the same areas but are larger for the Mediterranean and North Sea latitudes (Figure 2, left). For the year 2100, there is a considerable decrease in latitudinal suitability for most of the species’ range (Figure 2, right), with the most extreme scenarios (i.e., RCP-6.0 and RCP-8.5) featuring the largest declines. Gains in mean habitat suitability were projected for a small latitudinal band in the northernmost latitudes, which increased between 2050 and 2100 for RCPs 4.5 to 8.5, moving northward in the two most severe scenarios (Figure 2). The changes in mean habitat suitability induced the projected extirpation of O. vulgaris from localized regions along the Mauritanian coastline until 2050, in certain regions of the southern and eastern Mediterranean Sea, and in the waters surrounding the United Kingdom (Figure 3). For RCP-2.6, gains in distribution were very sparse and restricted to small areas in the northernmost limits of the species’ predicted distribution. Following the trends in mean habitat suitability, increasing severity of the RCP scenario led to a considerable decrease in the specie’s areas of occurrence (Figure 3A). In RCP-4.5, mid-range latitudes exhibit greater losses between 2050 and 2100, compared to the previous scenario. In terms of projected distribution changes (Figure 3B), there is a considerable increase in the areas of species extirpation – again, mainly along the coastline of Mauritania, in the Mediterranean Sea, and in the North Sea. Projections in RCP-6.0 emphasize the areas of distribution loss, mainly in the Mediterranean and the North seas. In the former, extirpation of the species until the end of the century expands in the Adriatic Sea and around Italy, while also appearing in the Balearic Sea (Figure 3C). For the most extreme scenario, RCP-8.5, there was a severe increase in the areas of species distribution loss over most of Macaronesia and in the Mediterranean Sea (Figure 3D). Northward, the species is projected to lose considerable areas of its distribution in the Sea of Ireland, while some potential exists for expansion in the northernmost limits of its distribution.
In the case of O. americanus, the ensemble models predict an overall decrease in mean habitat suitability in tropical and subtemperate areas near the equator until 2050, with slight increases in the higher latitudes of both the Northern and Southern hemispheres (Figure 4). This pattern is exacerbated by the increasing severity of the RCP scenario. Specifically, for RCP-2.6, the ensemble model predicted decreasing mean habitat suitability until 2050 in lower latitudes (Figure 4A), while in higher latitudes there are predicted increases until the mid of the century as well, although with localized decreases between 2050 and 2100 in some latitudes (Figure 4B). In terms of distribution, this led to projected localized extirpation by 2050 in the tropical and subtropical areas between Cuba and the Yucatán Peninsula in the Gulf of Mexico, southward over the coastline of Brazil (Figure 5A). North of the Yucatán Peninsula, there is some projected localized distribution loss by 2050, together with areas of transitory fluctuation of contraction by 2100 following expansion until 2050. In the northernmost regions of its distribution, O. americanus is also projected to undergo a considerable gain in distribution.
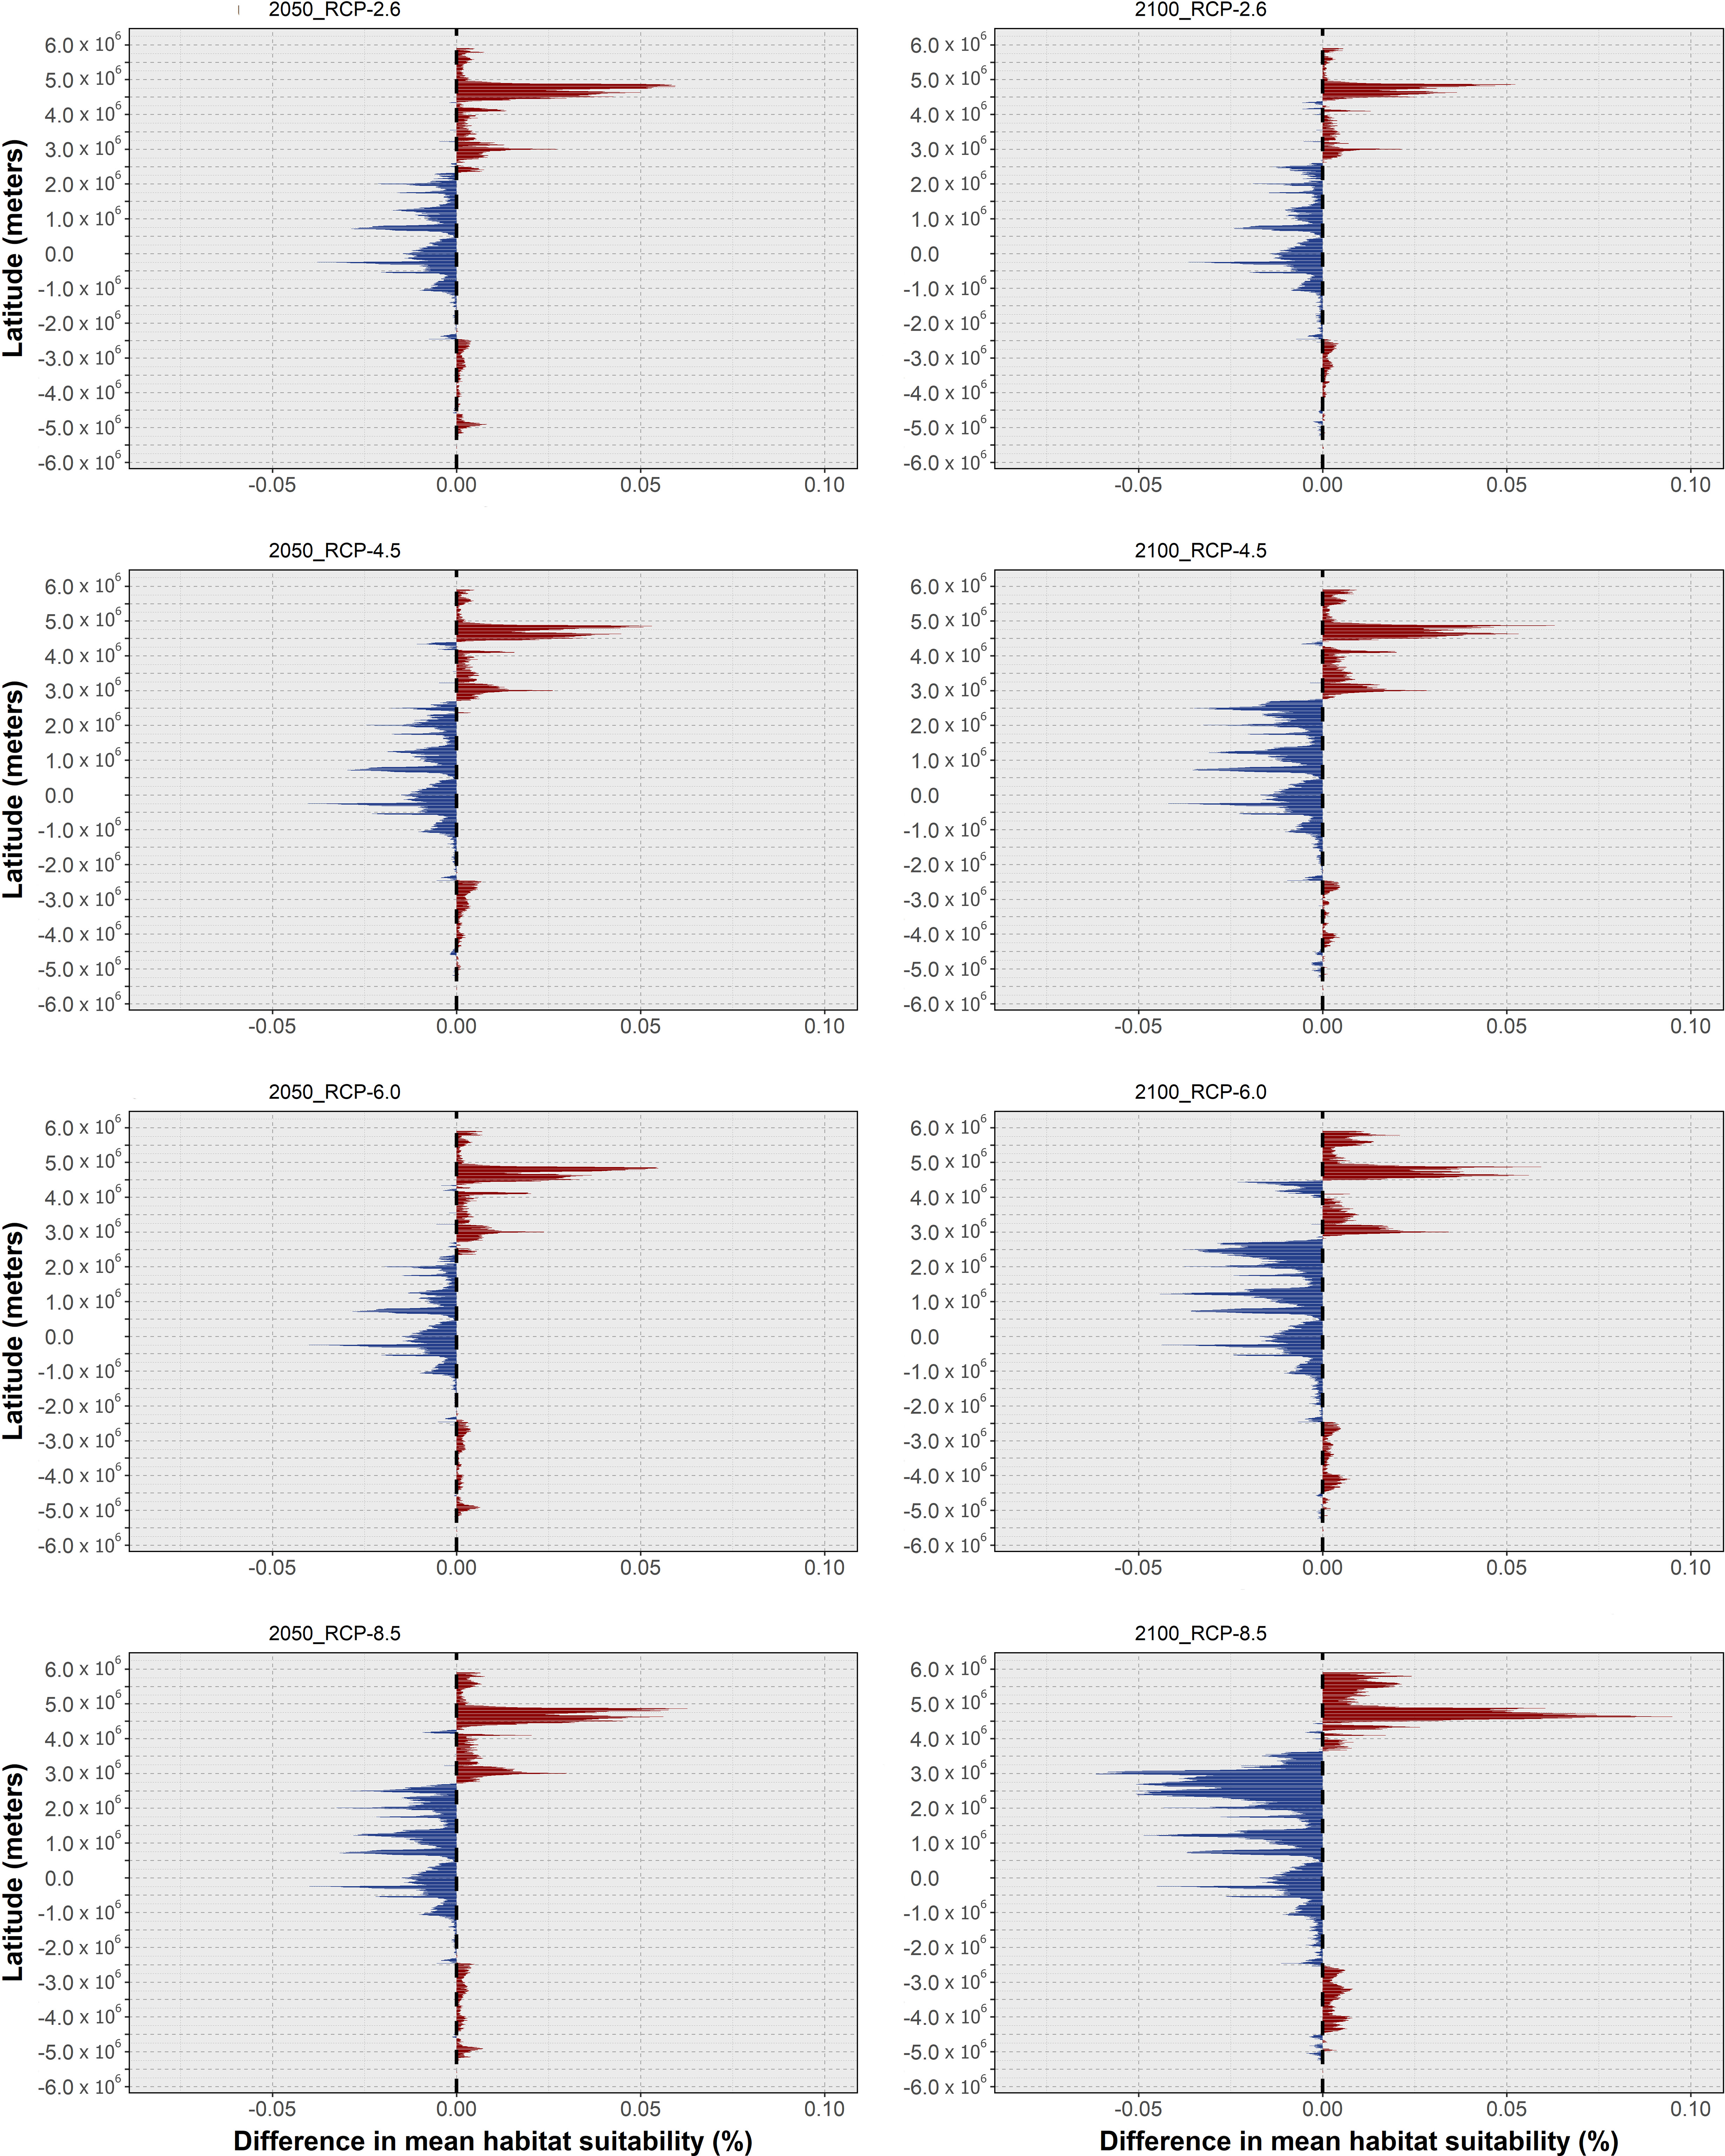
Figure 4 Changes in mean latitudinal habitat suitability for Octopus americanus between the present-day and 2050 (left side) and 2100 (right side), for each Representative Concentration Pathway scenario (RCP-2.6, 4.5, 6.0, 8.5; CMIP5), relative to the present-day baseline (i.e., the black dashed vertical line). Data to the right of the dashed line represents a relative increase in mean habitat suitability (red) and data to the left represents a relative decrease (blue).
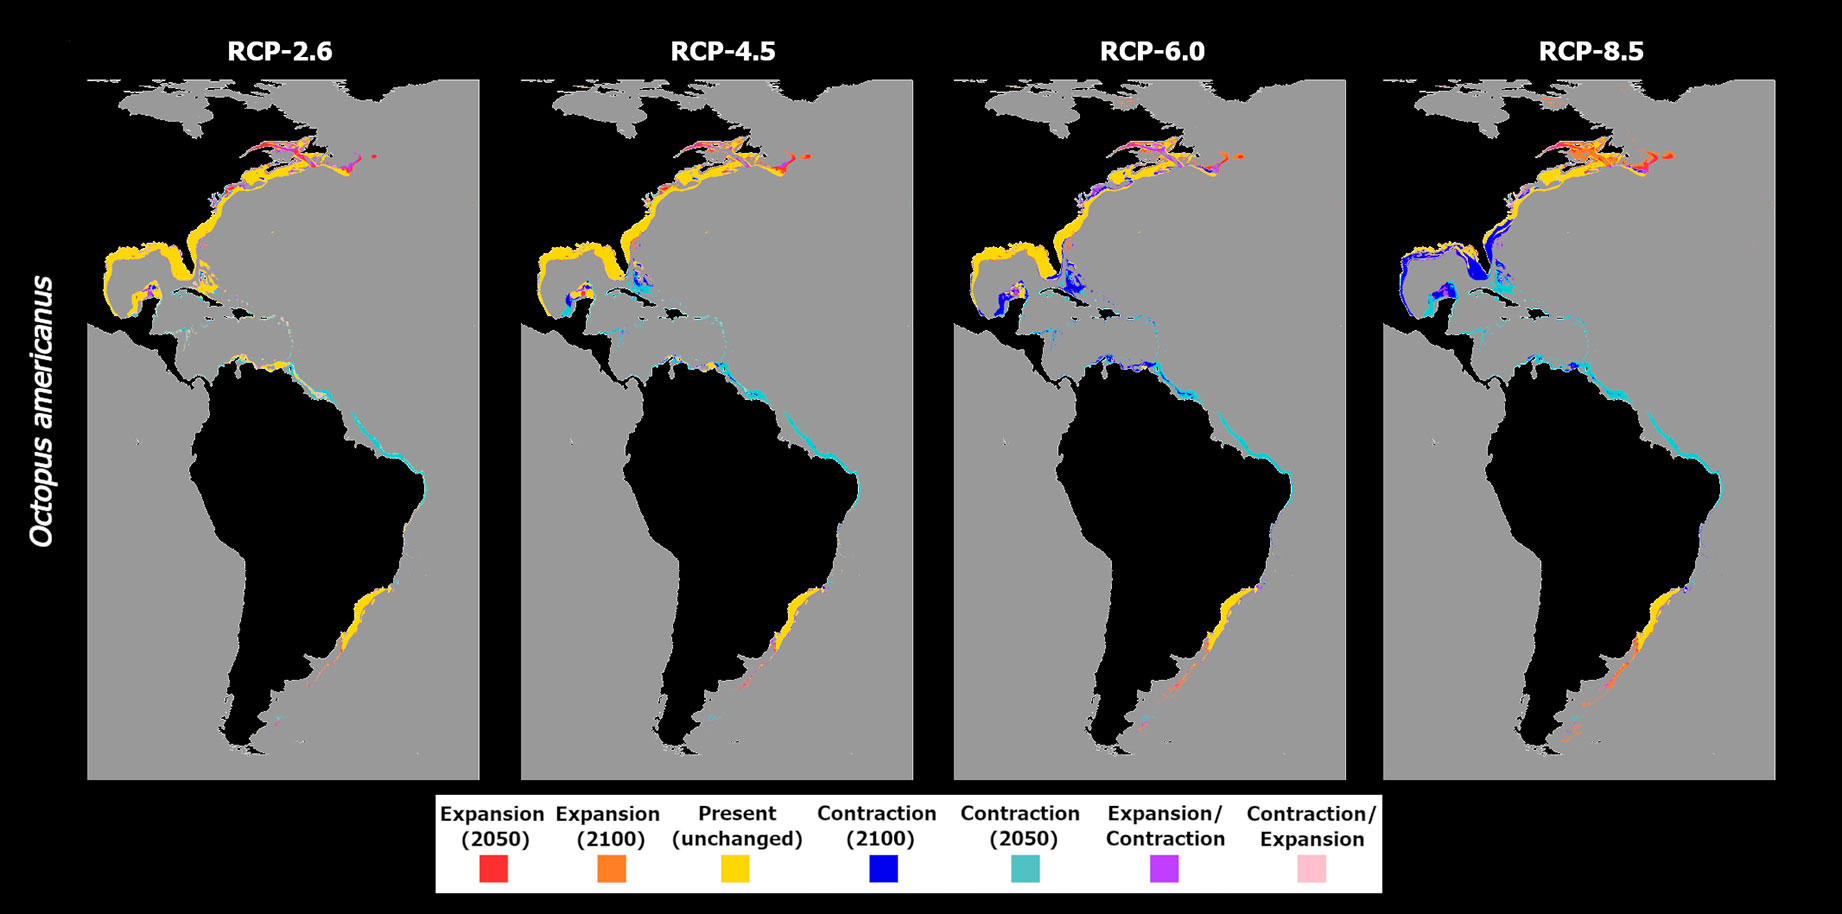
Figure 5 Time maps of the projected changes in species occurrence distribution for Octopus americanus, showing unidirectional range shifts in occurrence distribution [i.e., range expansion (in red and orange) or contraction (in dark and light blue)] as well as transitory fluctuations (i.e., range contraction followed by expansion (pink), and vice-versa (purple)] across time (i.e., 2050 and 2100) and RCP scenarios (RCP-2.6, 4.5, 6.0, 8.5; CMIP5).
In RCP-4.5, the tropical and subtemperate latitudes exhibited an increased loss in mean habitat suitability by mid-century (Figure 4C), with some areas also showing further losses between the present-day and 2100 (Figure 4D). At the same time, mean habitat suitability until 2100 in the northernmost latitudes increases further than in the previous scenario. This trend translated into an expansion of the areas of extirpation by 2050 from the region Brazil to the seas between Cuba and the Bahamas (Figure 5B), and in the Yucatán Peninsula. In this area of the Gulf of Mexico, there is also projected distribution loss by the end of the century in the seas to the west of the Yucatán Peninsula, and in the region of the Bahamas and the continental shelf near the United States. In RCP-6.0, there was a considerable relative increase in mean habitat suitability in the northernmost latitudes of this species’ distribution (Figures 4E, F), together with some localized increases in higher latitudes in the southern hemisphere. However, most of the species distribution extent in the tropical and subtemperate bands is again considerably reduced. This led to an increased decline in O. americanus distribution in these areas, particularly in the Greater Antilles and in the Gulf of Mexico, where the models projected considerable losses between 2050 and 2100 (Figure 4C). In higher latitudes, the increase in mean habitat suitability leads to increased areas of potential expansion in the northern and southern limits of the species distribution. Finally, RCP-8.5, the changes in mean habitat suitability were particularly exacerbated regarding the previous scenarios (Figures 4G, H) leading to a potential expansion of the areas of distribution loss from the eastern Brazilian coastline, along the entire Central American shores by 2050, and northward along the coastline of most of the US. At the same time, expansion in the offshore areas of Canada, in the Gulf of Saint Lawrence and to the east of Newfoundland, and southward in Uruguay and Argentina, suggests an exacerbation of this shift towards the poles (Figure 5D).
Regarding O. aff. vulgaris, there was a considerable decrease in mean latitudinal habitat suitability relative to the present-day, projected for most scenarios (Figure 6). Indeed, until 2050, and save for localized suitability gains in the southernmost latitudes in RCP-2.6 and RCP-8.5 (both of a very small scale compared to the decreases), most of the latitudinal extent for this species is projected to undergo a considerable loss in suitability (Figure 6, left). Until 2100, however, RCP-2.6 and RCP-4.5 exhibit decreases in habitat suitability across most of the species’ distribution which are relatively smaller compared to 2050. This relative increase in mean habitat suitability between 2050 and 2100 is also followed by a localized gain in suitability relative to the present-day in the southernmost latitudes, for both scenarios (Figure 6, right). For RCP-6.0 and RCP-8.5, however, the overall trend of decreasing habitat suitability regarding the present-day continued (Figure 6, right).
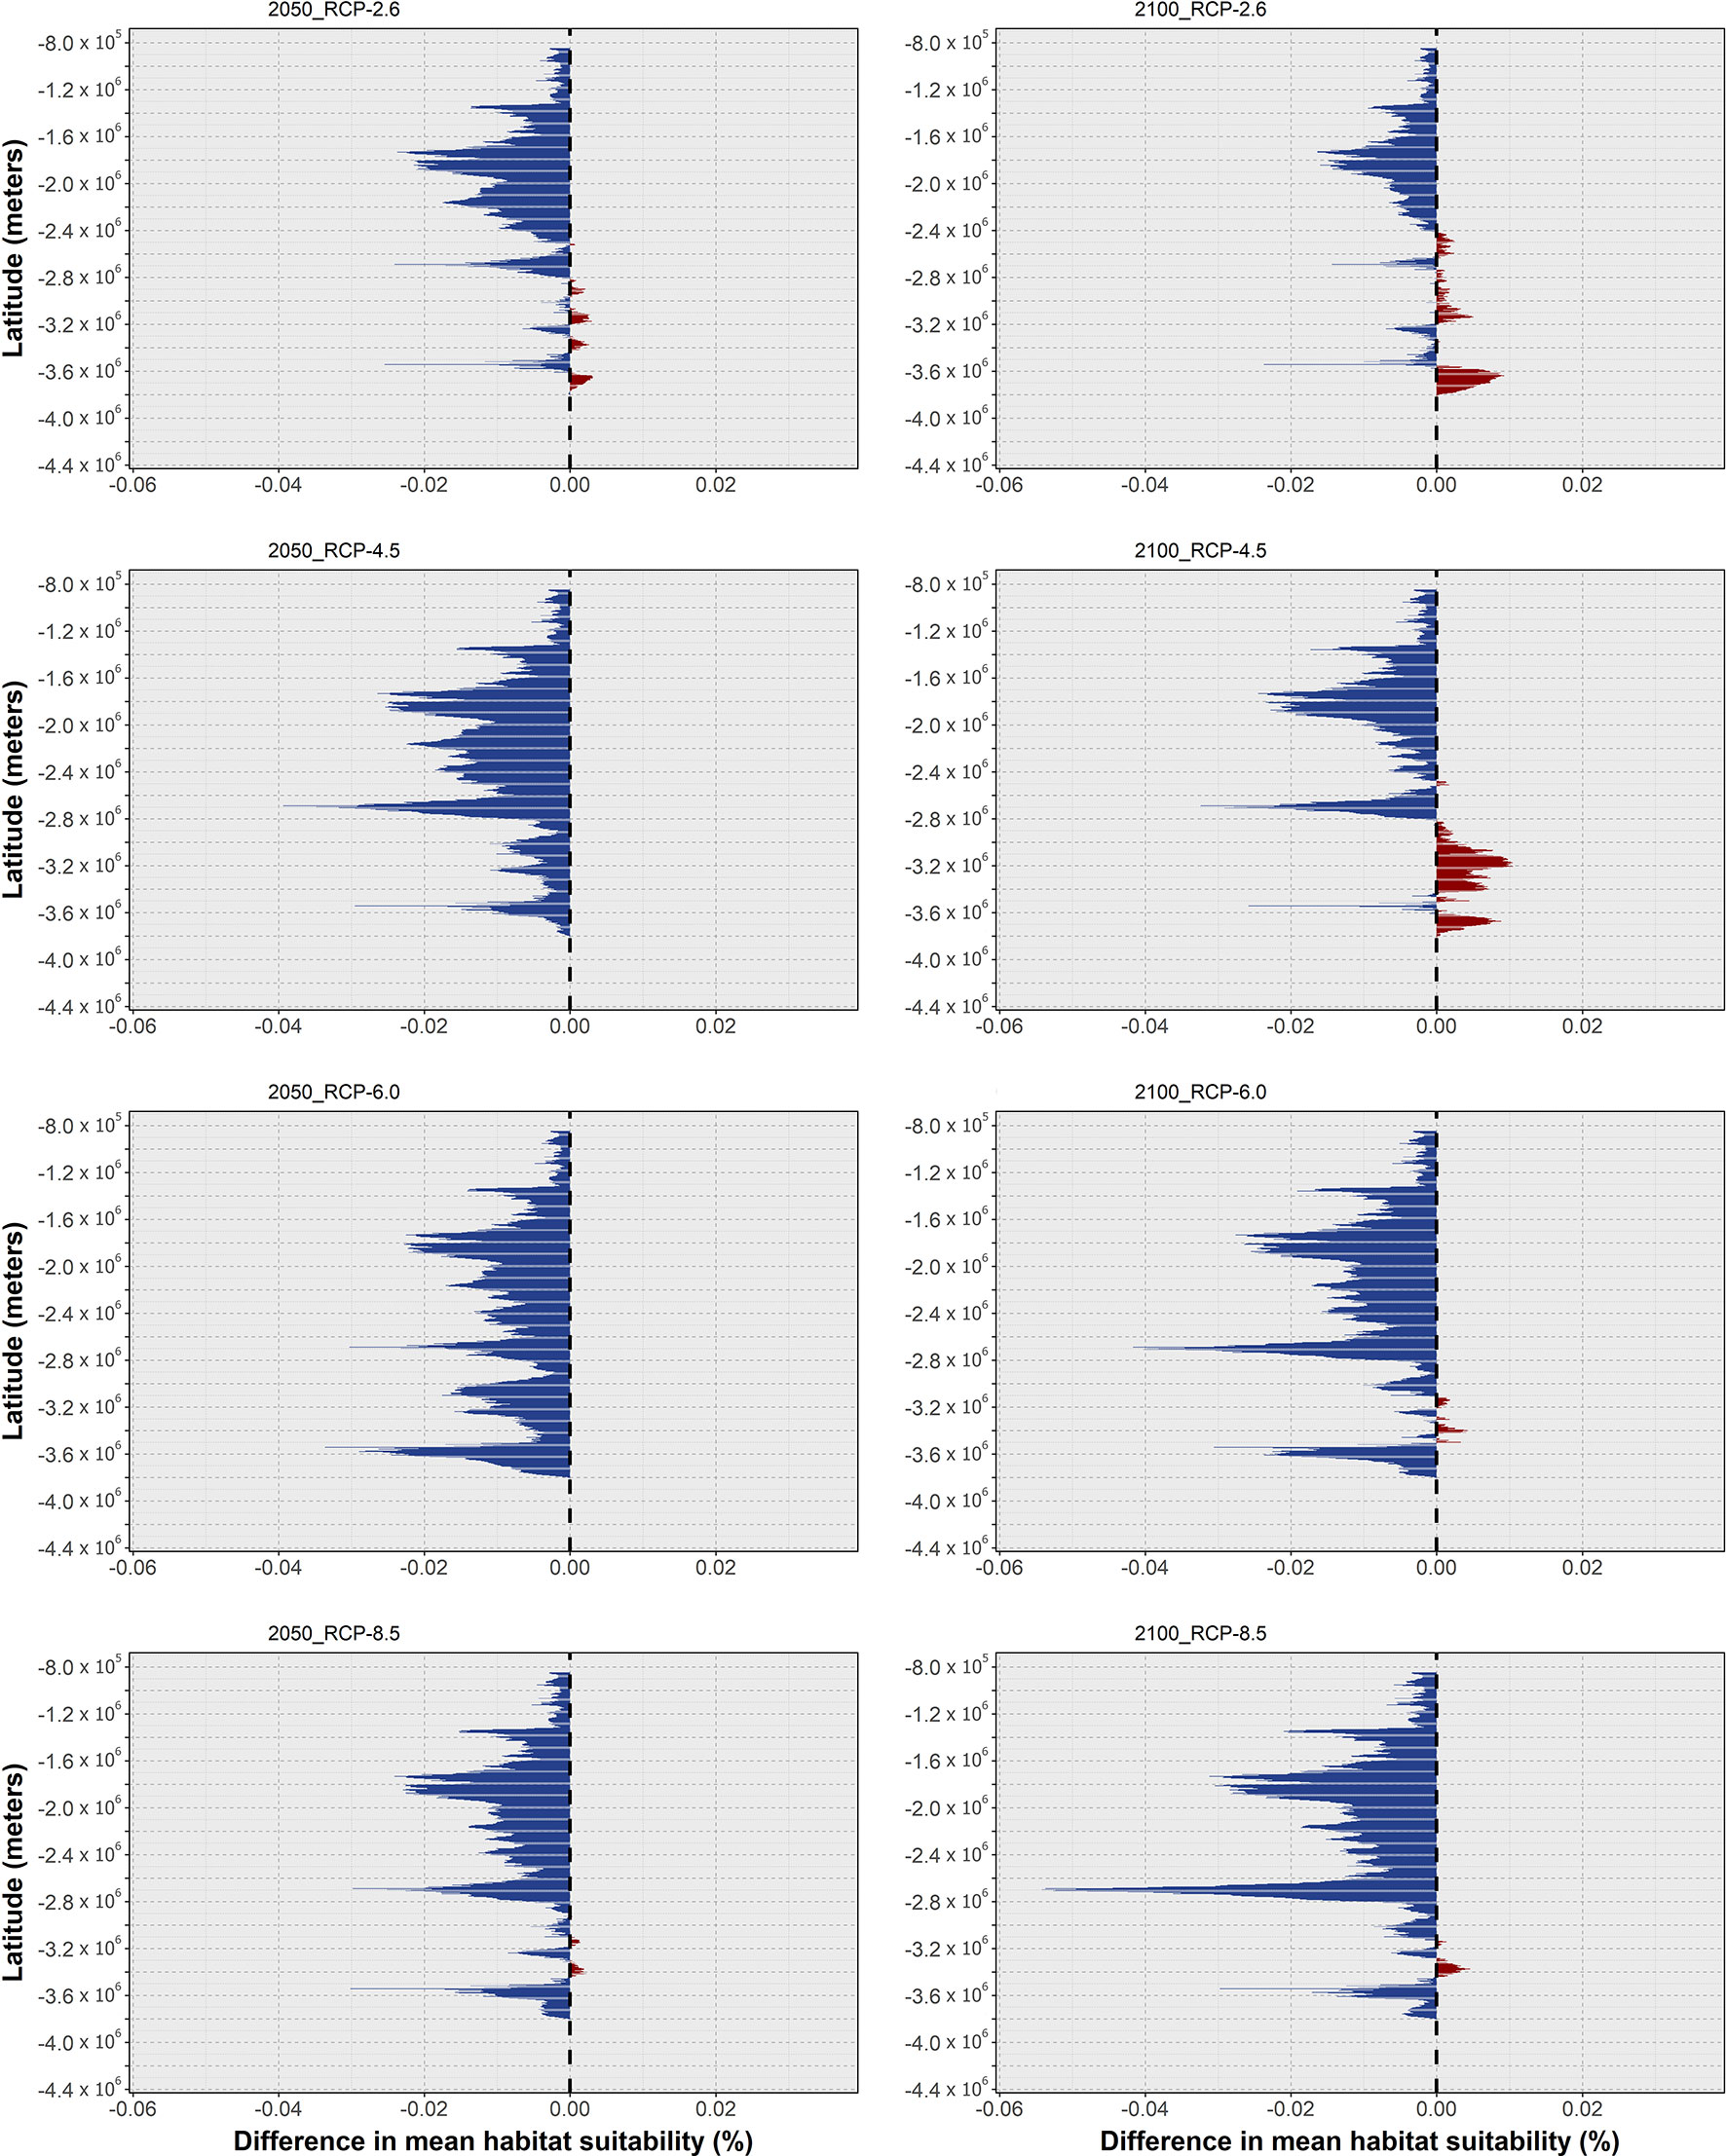
Figure 6 Changes in mean latitudinal habitat suitability for Octopus aff. vulgaris between the present-day and 2050 (left side) and 2100 (right side), for each Representative Concentration Pathway scenario (RCP-2.6, 4.5, 6.0, 8.5; CMIP5), relative to the present-day baseline (i.e., the black dashed vertical line). Data to the right of the dashed line represents a relative increase in mean habitat suitability (red) and data to the left represents a relative decrease (blue).
In terms of distribution projections (Figure 7), an oscillating decrease in mean habitat suitability in RCP-2.6 is observed, with a likely extirpation of this species from its northernmost areas of distribution - from the Quirimbas islands to the east of the Maputo Bay on the east-African shores, and sparsely along the western coastline (Figure 7A). Considerable loss by 2050 is also observed along northern Madagascan waters. In these regions, there are also large extensions of areas projected to undergo transitory fluctuations, disappearing in 2050 but re-emerging by 2100, due to the oscillating values of mean habitat suitability. For RCP-4.5, the ensemble model projects a very different situation between the southern Indian Ocean and southern Atlantic Ocean African shores (Figure 7B). Specifically, the models project some areas of fluctuation, with the species potentially disappearing in 2050 and remerging by 2100 in the northern region of Namibia. In the western areas of its distribution, offshore Namibia and South Africa, this kind of transitory fluctuations also occurs, alongside projected expansions into greater depths by the end of the century. In the southern Indian Ocean, the model projects O. aff. vulgaris to potentially disappear by 2050 from most of the Mozambican shores and from Madagascar’s northern and southwestern coastlines. In RCP-6.0, this pattern of loss becomes more evident. The progressive decrease in mean habitat suitability until the end of the century further exacerbated the projected loss in Madagascar and Mozambican waters (Figure 7C), with new areas of extirpation between 2050 and 2100 appearing in the southern parts of these regions. Despite some localized distribution restrictions, no considerable changes occur over the southern South African continental shelf. On the south Atlantic shores, there are sparse projected losses in the distribution in the Namibian coastline, and the area of projected fluctuation also seen in RCP-4.5 is projected to occur southward, in the western South African shelf. RCP-8.5 exhibited a more severe scenario, with the species being completely extirpated from the coastal areas of Madagascar (Figure 7D) - despite a small region in the southeast resisting until the mid of the century but eventually disappearing by 2100. The situation is the same for the waters of Mozambique, but the species remains relatively undisturbed in South African and Namibian waters, despite localized losses in the latter region.
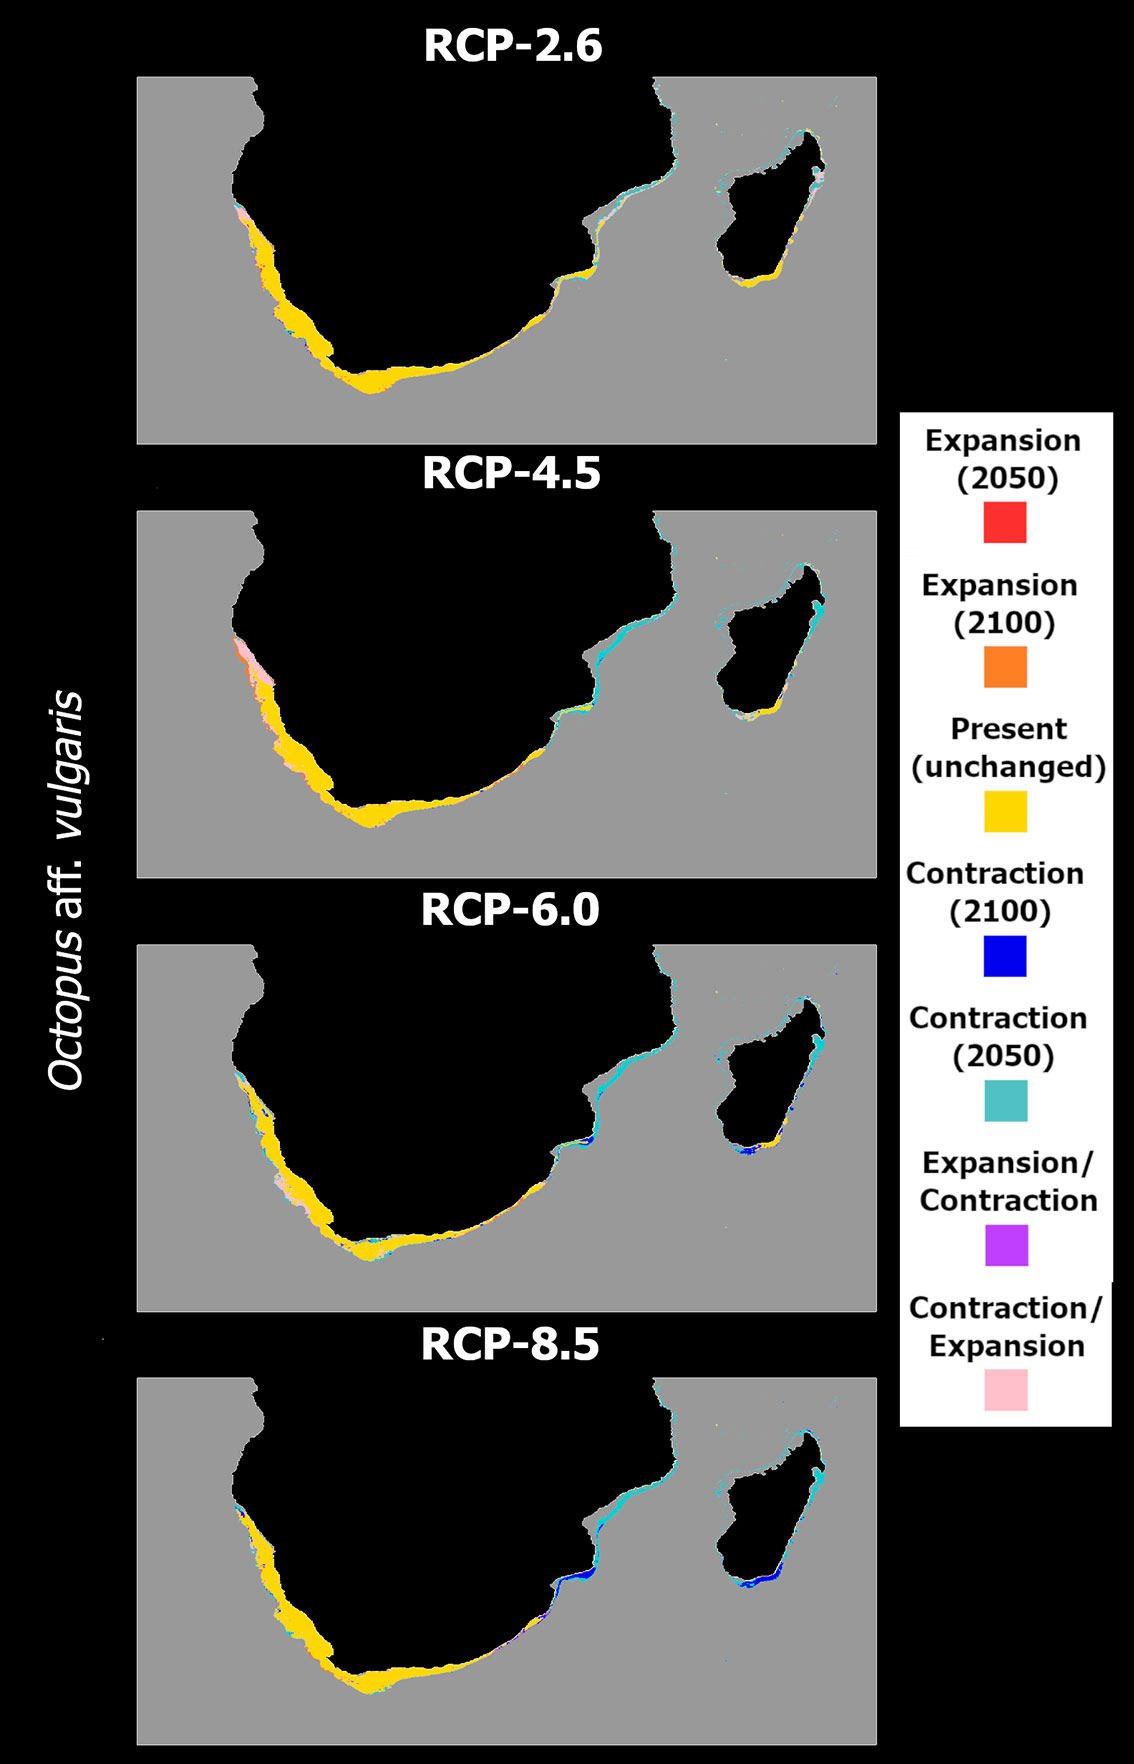
Figure 7 Time maps of the projected changes in species occurrence distribution for Octopus aff. vulgaris, showing unidirectional range shifts in occurrence distribution [i.e., range expansion (in red and orange) or contraction (in dark and light blue)] as well as transitory fluctuations (i.e., range contraction followed by expansion (pink), and vice-versa (purple)] across time (i.e., 2050 and 2100) and RCP scenarios (RCP-2.6, 4.5, 6.0, 8.5; CMIP5).
For O. sinensis, the models predict a different response of this species since no progressive exacerbation of the observed trends is seen with increasing RCP severity (Figure 8). In RCP-2.6, mean habitat suitability increases until the mid- and end of the century for most of its latitudinal distribution in the northwestern Pacific Ocean, with relatively small decreases being observed only at the lowest latitudes of its extent (Figures 8A, B). In this scenario, there are no considerable changes to the species distribution, with losses being virtually non-existent, and projected expansions localized to areas near the western coastlines of Korea in the Yellow Sea, and around Hokkaido and Sacalina islands in the Sea of Japan (Figure 9A). In contrast, RCP-4.5 exhibits a different trend, with mean habitat suitability decreasing considerably in the southern latitudes, where present-day suitability is predicted to be highest (Figures 8C, D). In the areas of higher suitability, a temporary increase in habitat suitability until 2050 is observed (Figure 8C) but quickly followed by a decrease below present-day values until the end of the century (Figure 8D). In terms of distribution, the projected map is dotted with areas of projected loss in distribution between 2050 and 2100, mainly in the outer areas of the predicted distribution in the East China Sea, in the Yellow Sea, and across the coastlines of Japan (Figure 9B).
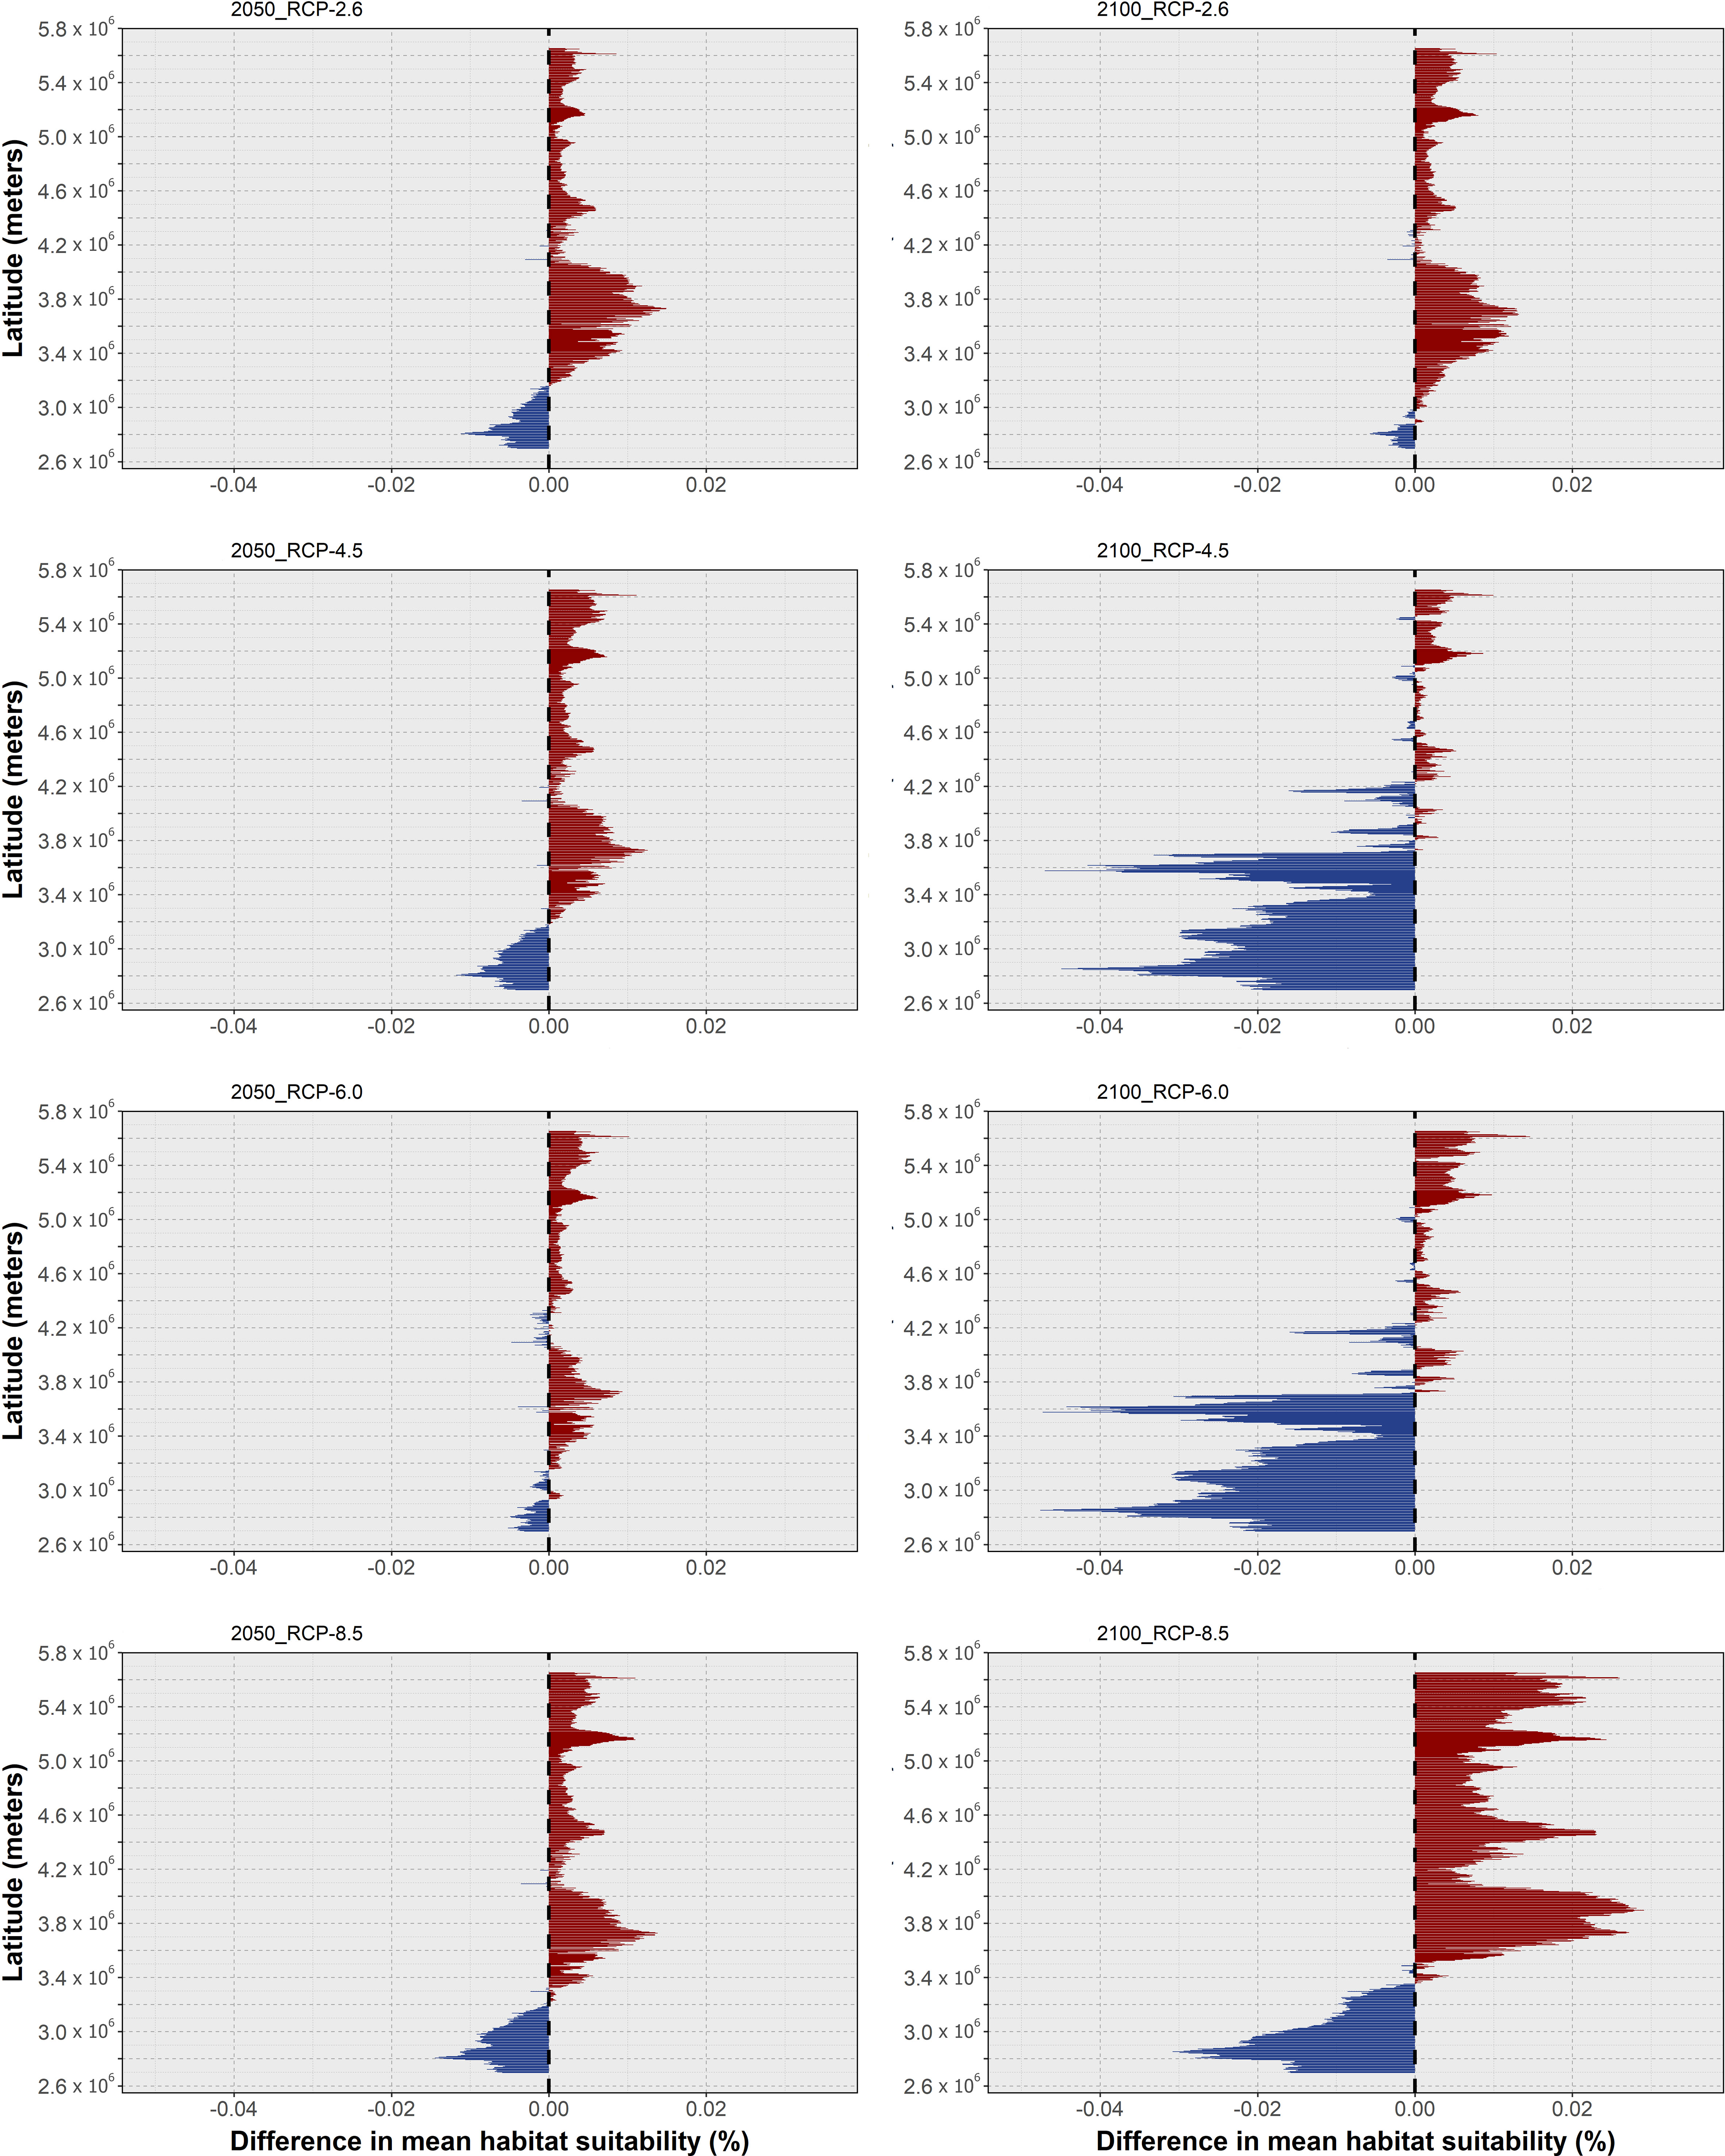
Figure 8 Changes in mean latitudinal habitat suitability for Octopus sinensis between the present-day and 2050 (left side) and 2100 (right side), for each Representative Concentration Pathway scenario (RCP-2.6, 4.5, 6.0, 8.5; CMIP5), relative to the present-day baseline (i.e., the black dashed vertical line). Data to the right of the dashed line represents a relative increase in mean habitat suitability (red) and data to the left represents a relative decrease (blue).
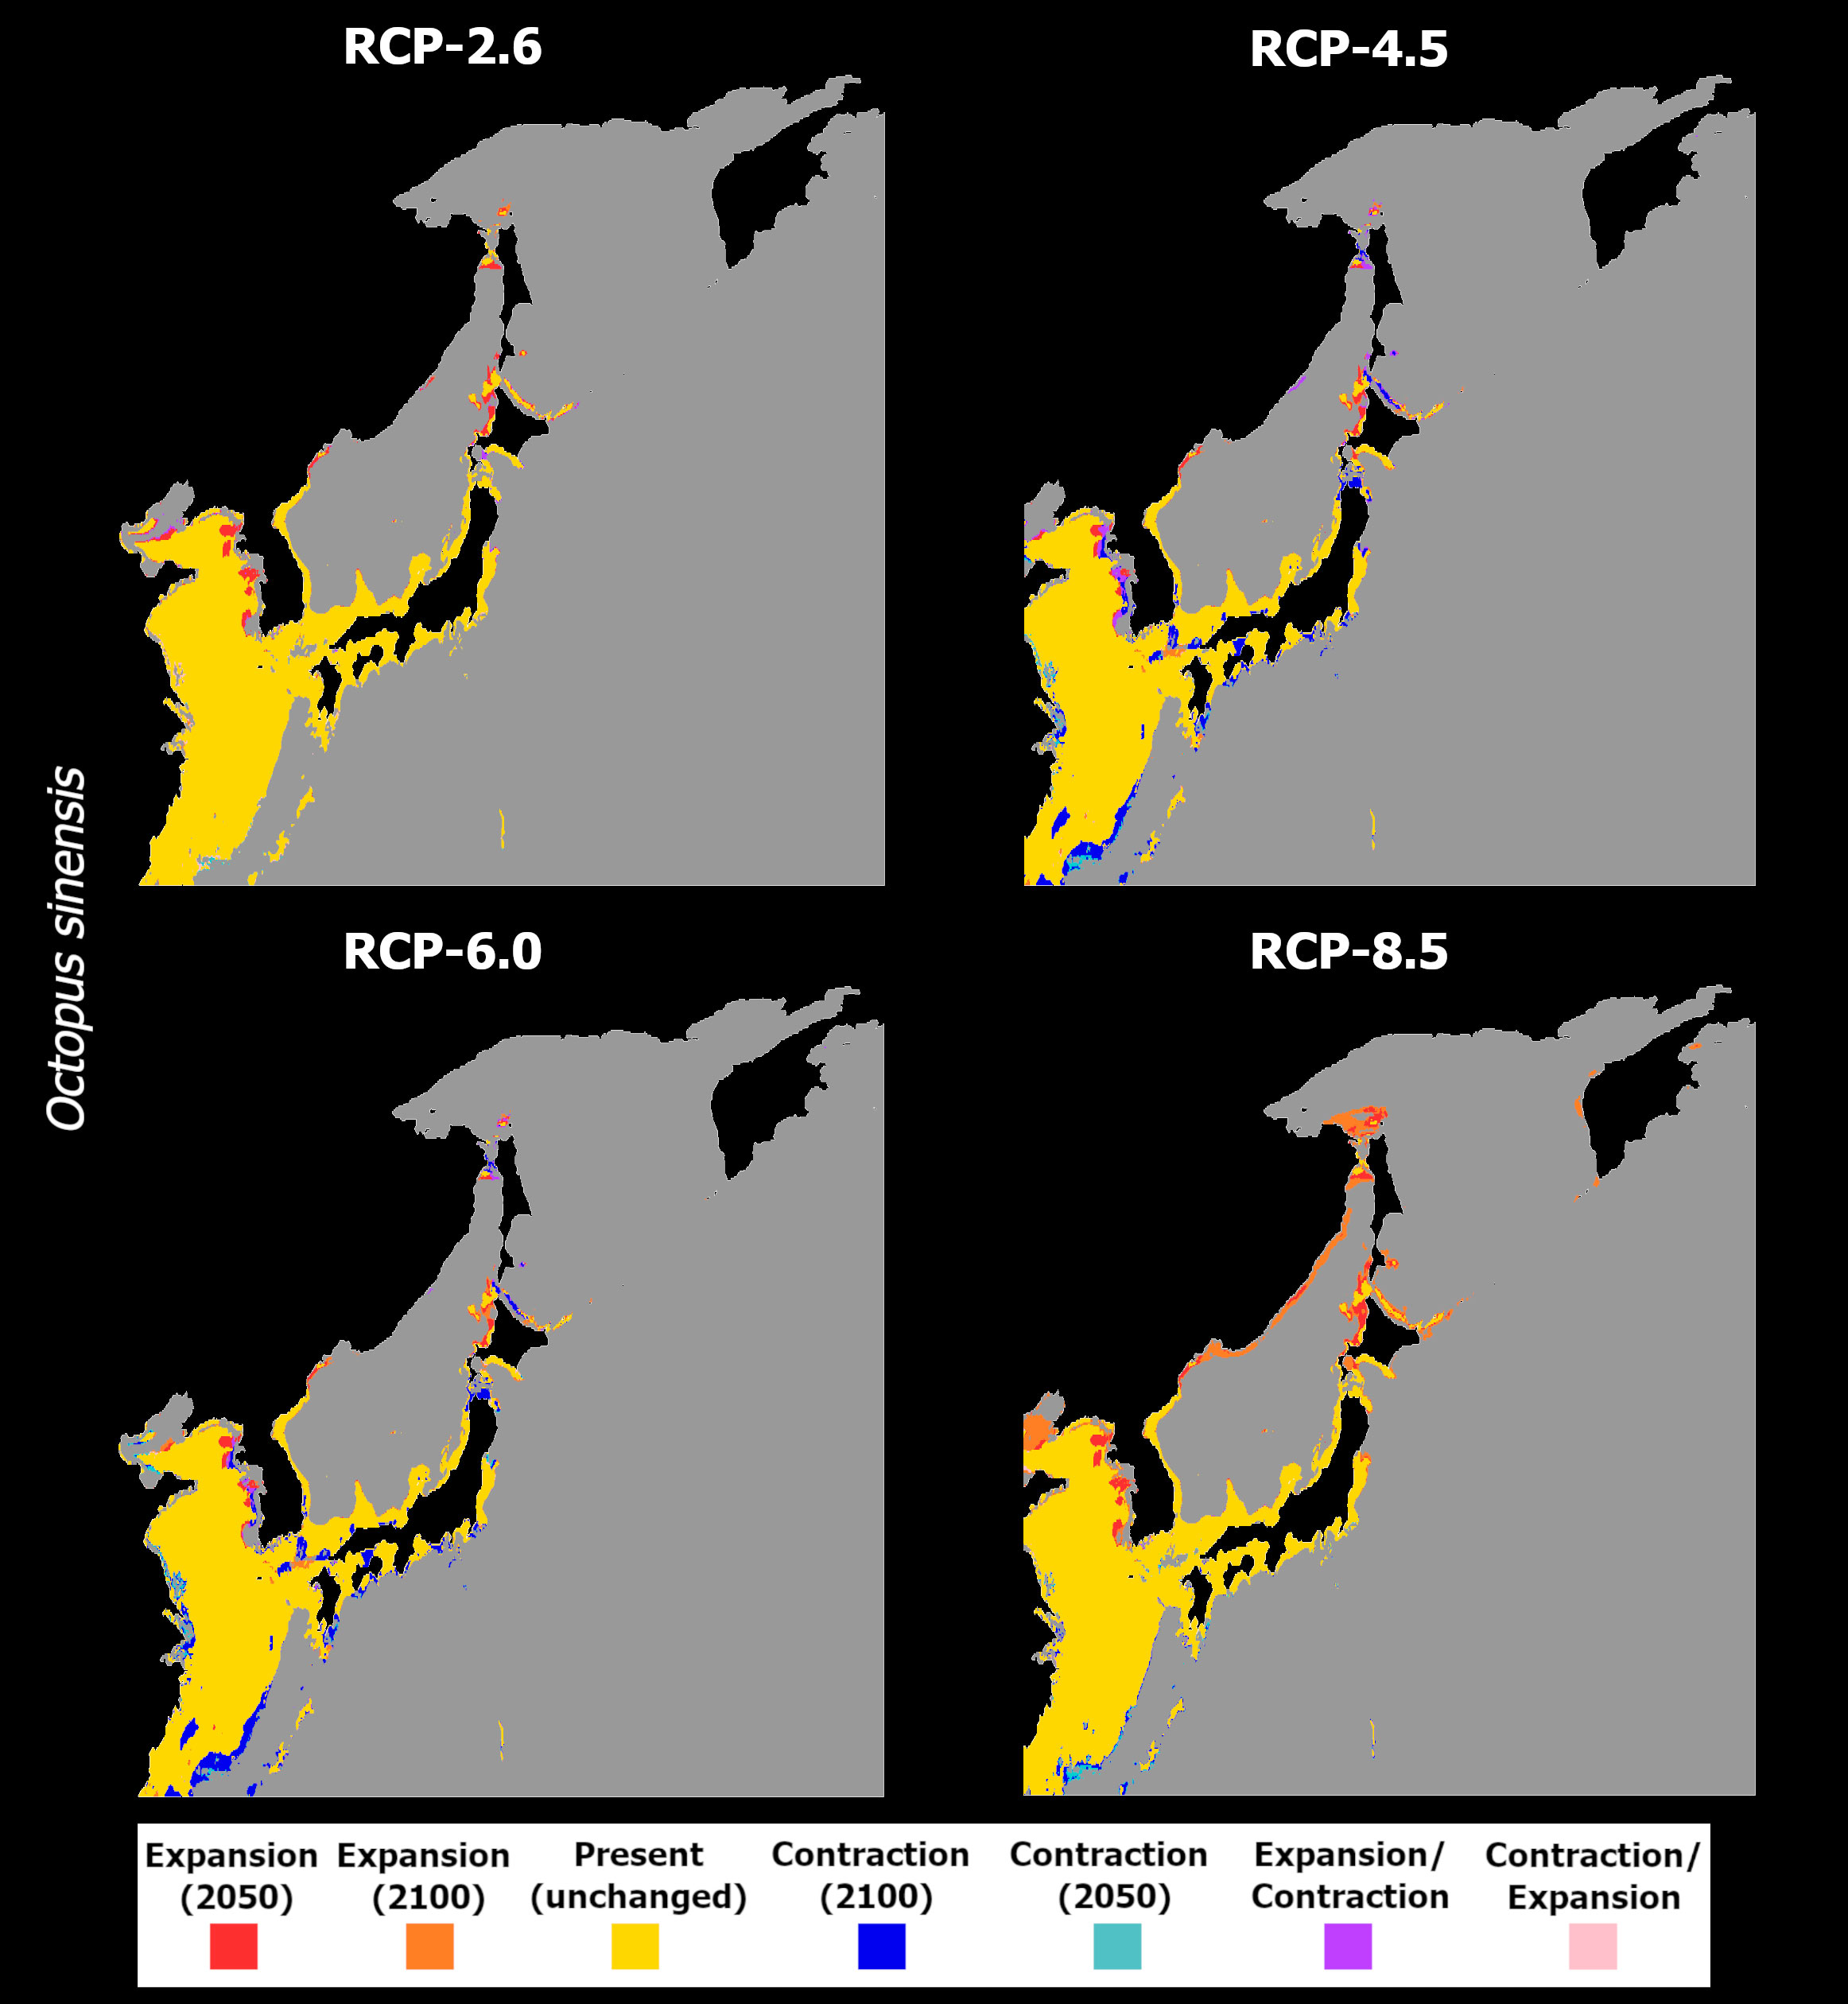
Figure 9 Time maps of the projected changes in species occurrence distribution for Octopus sinensis, showing unidirectional range shifts in occurrence distribution [i.e., range expansion (in red and orange) or contraction (in dark and light blue)] as well as transitory fluctuations (i.e., range contraction followed by expansion (pink), and vice-versa (purple)] across time (i.e., 2050 and 2100) and RCP scenarios (RCP-2.6, 4.5, 6.0, 8.5; CMIP5).
Due to the oscillating habitat suitability in higher latitudes, areas of temporary emergence followed by extirpation are observed in the eastern regions of the Yellow Sea and dotted alongside the northern areas of the Sea of Japan. Also in these regions, there are instances of projected expansions, although restricted, localized in the Yellow Sea and mainly on Hokkaido Island. RCP-6.0 presents a very similar situation to the previous scenario in terms of habitat suitability and projected distribution changes (Figures 8E, F, 9C). However, for RCP-8.5, the ensemble model predicted somewhat similar response to RCP-2.6. In this scenario, there is an exacerbation of the increase in mean habitat suitability until 2100 in the northern regions (Figures 8G, H). To the south, however, mean suitability decreases progressively until the end of the century. This leads to a relatively small but present restriction in the species’ distribution at greater depths in the East China Sea (Figure 9D). However, considerable expansion is observed in the north and eastern region of the Yellow Sea, on the coastlines of Korea by 2050, and on the shores of China until the end of the century, as well as in the Sea of Japan.
Regarding O. tetricus, this species exhibited an overall trend of decreasing habitat suitability over its northern extent of distribution in Australia, with gains in its southernmost limits (Figure 10). This pattern was consistent across RCP scenarios, and the projected changes stayed relatively stable between 2050 and 2100, despite a slight overall increase between 2050 and 2100 for RCP-2.6, and an exacerbation of mean habitat suitability decrease for RCP-8.5 for the same period.
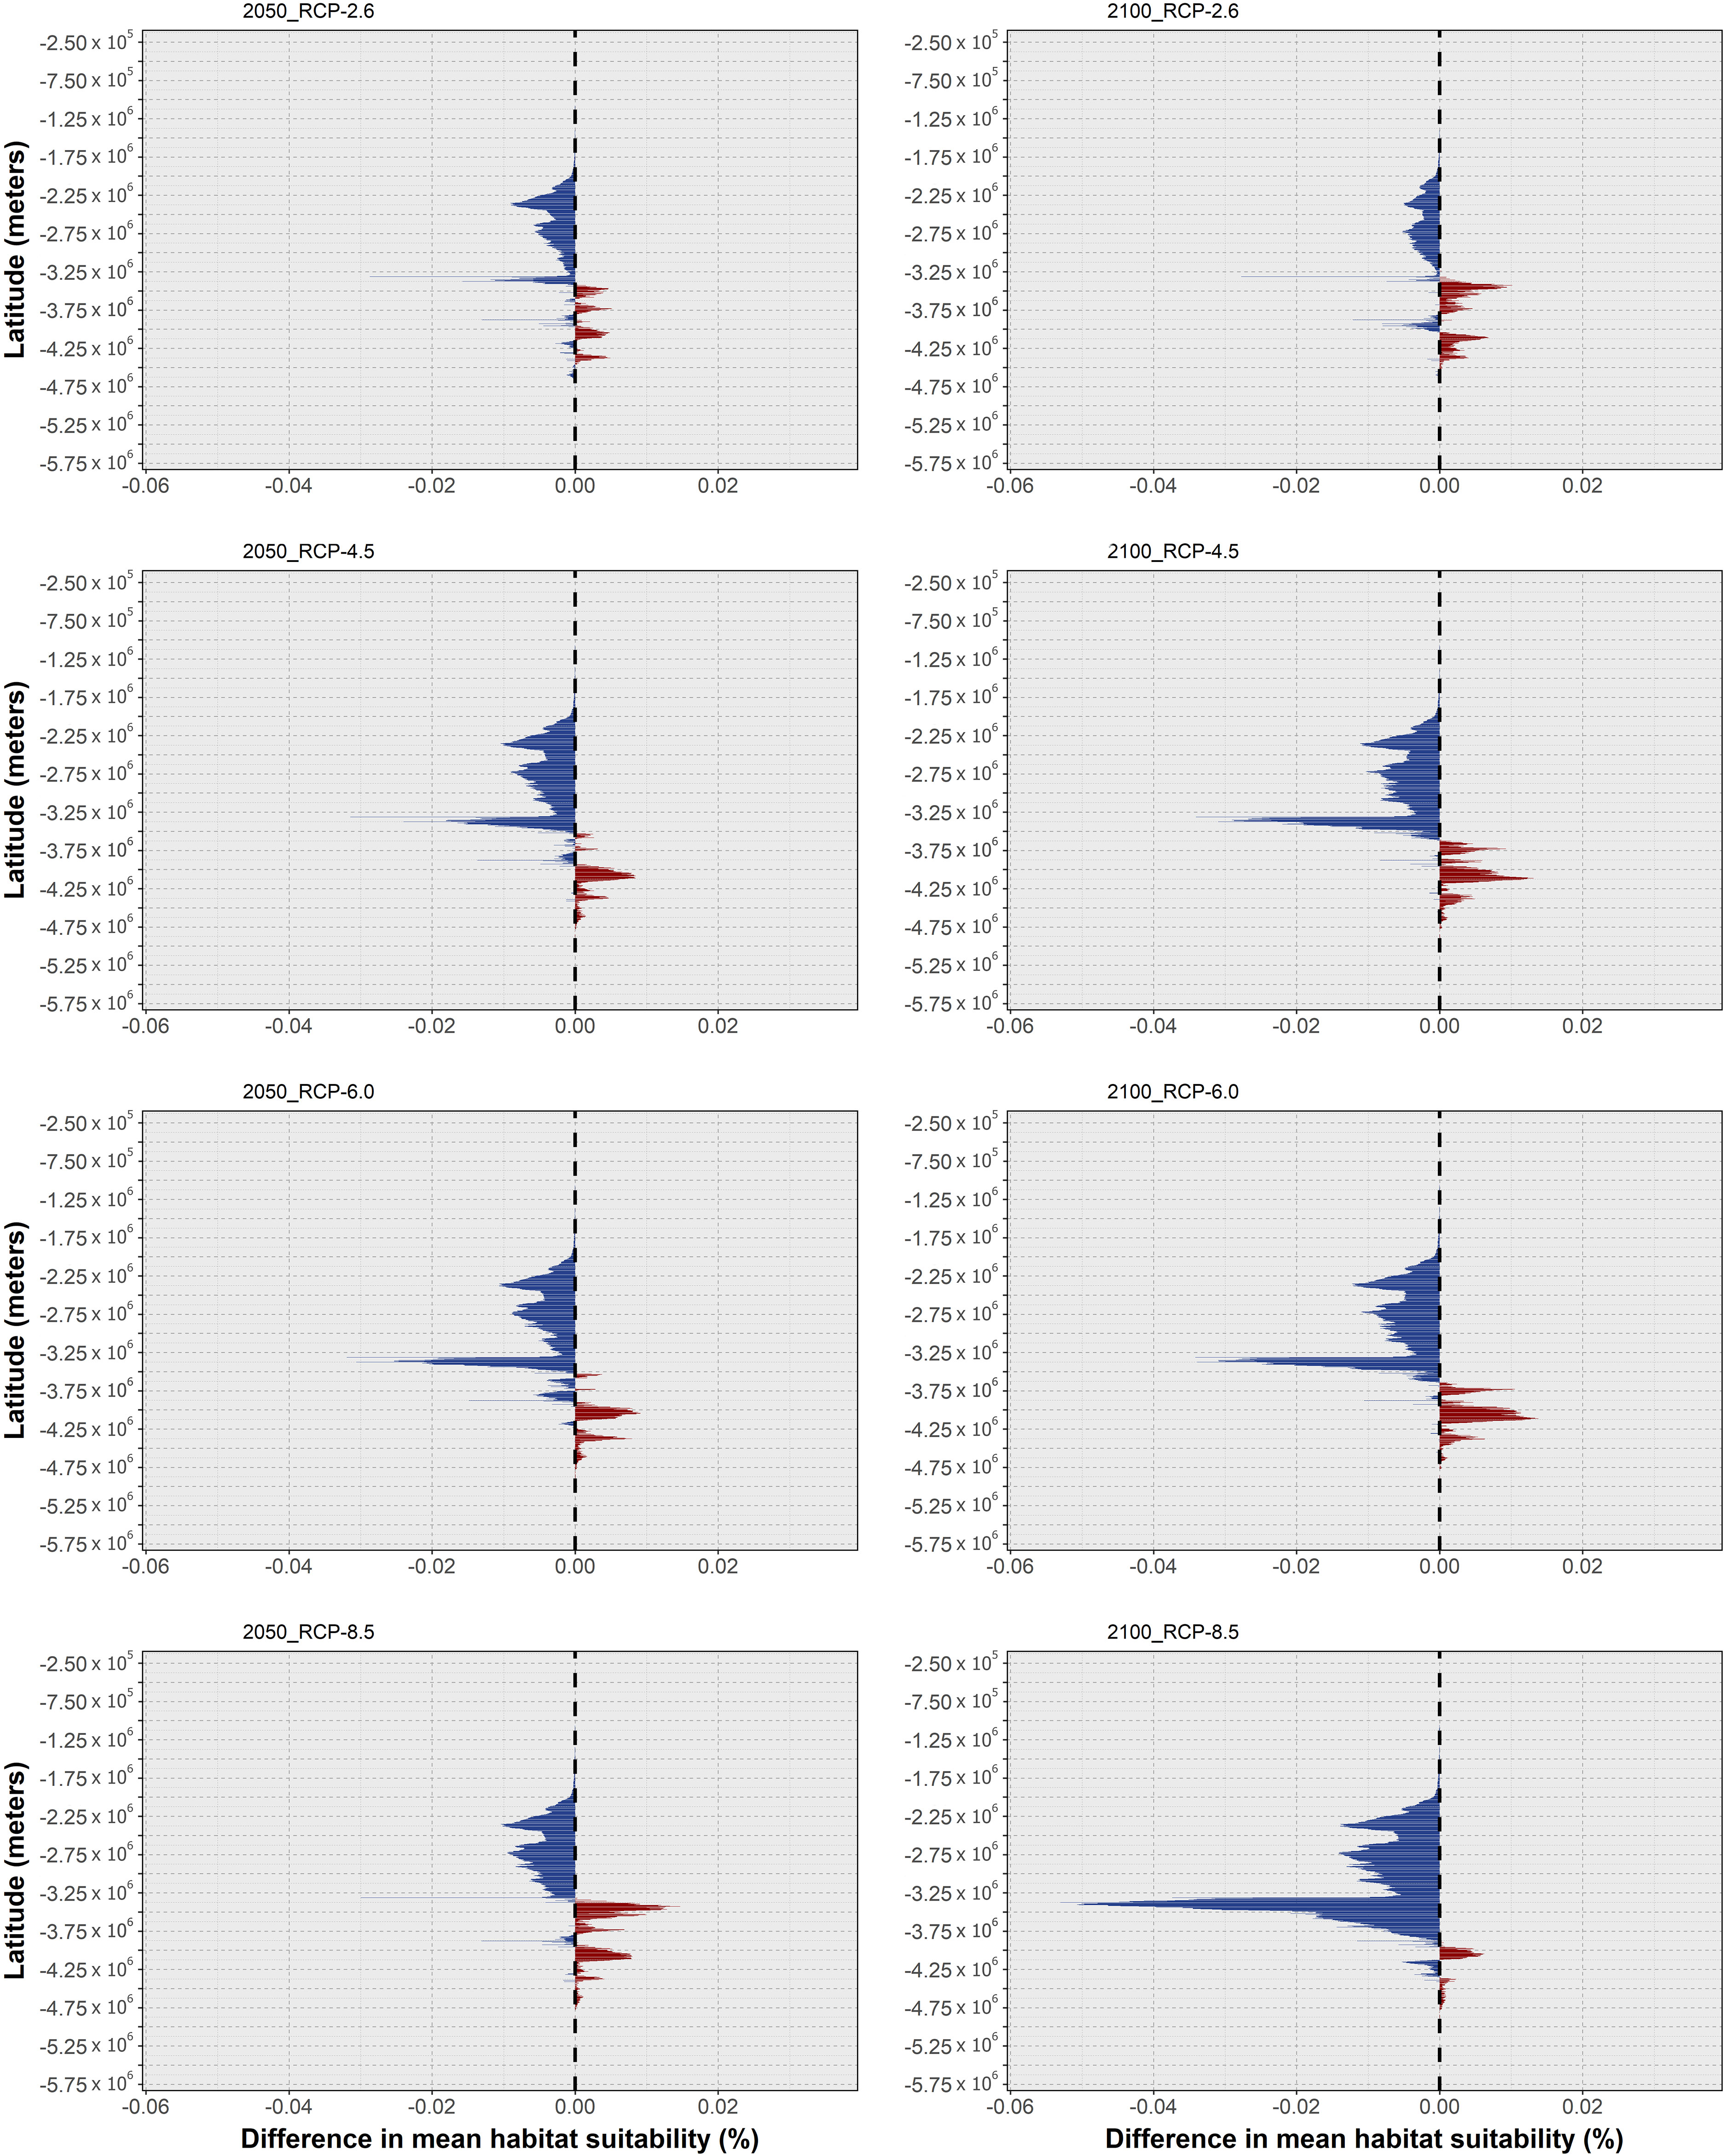
Figure 10 Changes in mean latitudinal habitat suitability for Octopus tetricus between the present-day and 2050 (left side) and 2100 (right side), for each Representative Concentration Pathway scenario (RCP-2.6, 4.5, 6.0, 8.5; CMIP5), relative to the present-day baseline (i.e., the black dashed vertical line). Data to the right of the dashed line represents a relative increase in mean habitat suitability (red) and data to the left represents a relative decrease (blue).
In terms of projected distribution, the oscillating pattern of mean habitat suitability in the north under RCP-2.6 (Figures 10A, B) led to extirpation until 2050 in the areas near Shark Bay in the west, and a temporary potential extirpation in eastern Australia, near the Coral Sea (Figure 11A), and permanent extirpation in the areas north of this region. In the South of Australia, slight increases in mean habitat suitability led to expanding distribution towards greater depths in the Great Australian Bay and Tasmania. In the westernmost area of this species occurrence, specifically in the Bass Strait, the models also predicted a fluctuating pattern of expansion in 2050, followed by extirpation in 2100, due to oscillating mean habitat suitability in this region. Under RCP-4.5, the deeper western and southern coastlines of Australia are projected to undergo localized extirpation (Figure 11B), as well as the higher latitudes of the species’ distribution in both western and eastern Australian coastlines. Also, on the southern Australian coastline, there is an expansion of the transitory fluctuation patterns compared to RCP-2.6, evidencing an expansion followed by extirpation until the end of the century in this region. Lastly, in New Zealand, there is an overall expansion of the distribution towards greater depths all around its distribution. Projections for RCP-6.0 show a similar pattern as RCP-4.5 for both eastern and western Australian coastlines and for the Great Australian Bay, projecting losses in distribution until 2050 and 2100 for these regions (Figure 11C). However, increasing mean habitat suitability in the southern latitudes until 2100 (Figure 10F) led to a potential expansion of the species in the southwestern region of Australia (i.e., near the Bass Strait), while transitory fluctuations expand in New Zealand – in the Northwestern coastlines of New Zealand, fluctuations between contraction in 2050 and expansion until 2100 are projected from North Taranaki Bight until Auckland, while expansion followed by contraction is projected in greater depths in the Southeastern coastlines. RCP-8.5 was the scenario with the most exacerbated responses, following the considerable decrease in mean habitat suitability between the present-day and the year 2100 (Figures 10G, H). Specifically, the models projected a considerable loss in distribution along most of the eastern, western, and southern Australian coastlines (Figure 11D), apart from the region of Tasmania. The Great Australian Bay area also exhibited a considerable area of transitory fluctuation, with a temporary expansion in the area in 2050, followed by its extirpation until 2100.
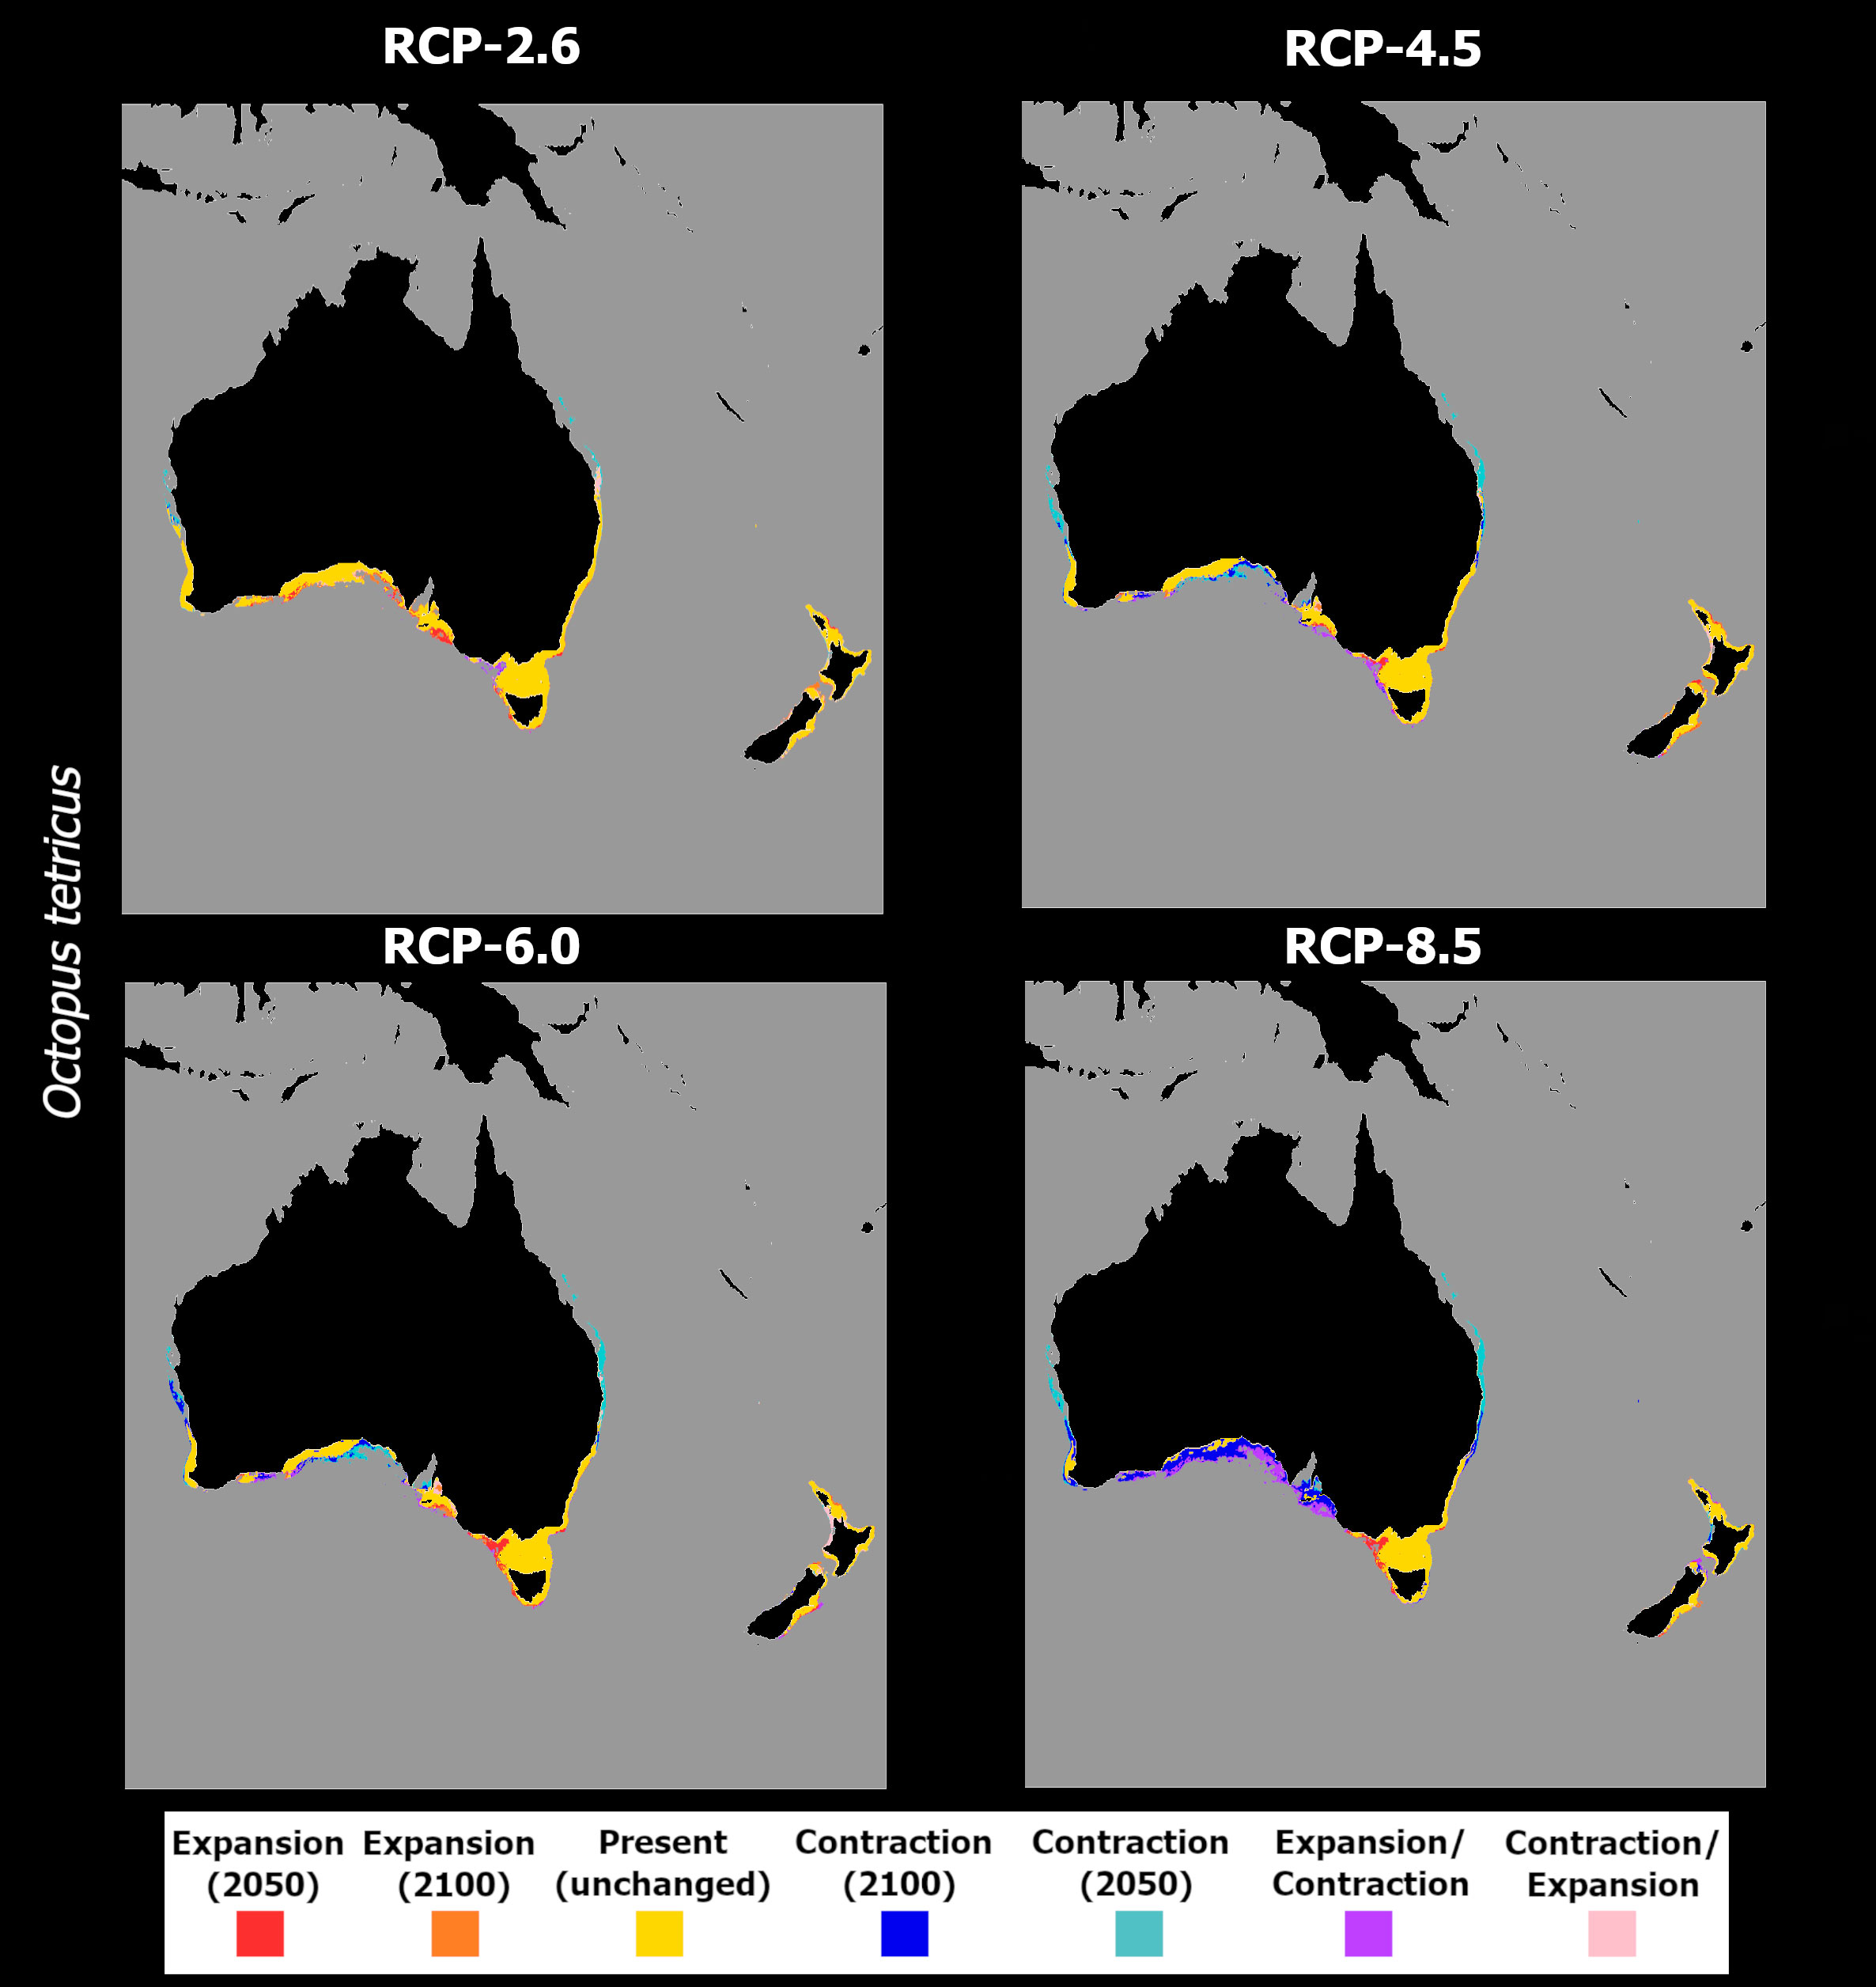
Figure 11 Time maps of the projected changes in species occurrence distribution for Octopus tetricus, showing unidirectional range shifts in occurrence distribution [i.e., range expansion (in red and orange) or contraction (in dark and light blue)] as well as transitory fluctuations (i.e., range contraction followed by expansion (pink), and vice-versa (purple)] across time (i.e., 2050 and 2100) and RCP scenarios (RCP-2.6, 4.5, 6.0, 8.5; CMIP5).
Regarding O. djinda, the ensemble models projected decreasing mean habitat suitability across most of its distribution (Figure 12), in a pattern that is exacerbated between 2050 and 2100 for most RCP scenarios. RCP-2.6 exhibited the smallest magnitude of habitat suitability loss, relative to the other RCP scenarios, and the smallest temporal change (Figures 12A, B). This scenario also exhibited a relative increase until 2050, followed by a decrease until the end of the century (albeit still above the present-day baseline). These patterns led to relatively small changes in the species distribution, with some projected losses until 2100 occurring in the northernmost range of its distribution – in the western Australian coastline (Figure 13A), and sparse gains together with a large span of momentary expansion followed by contraction along the southern coastline.
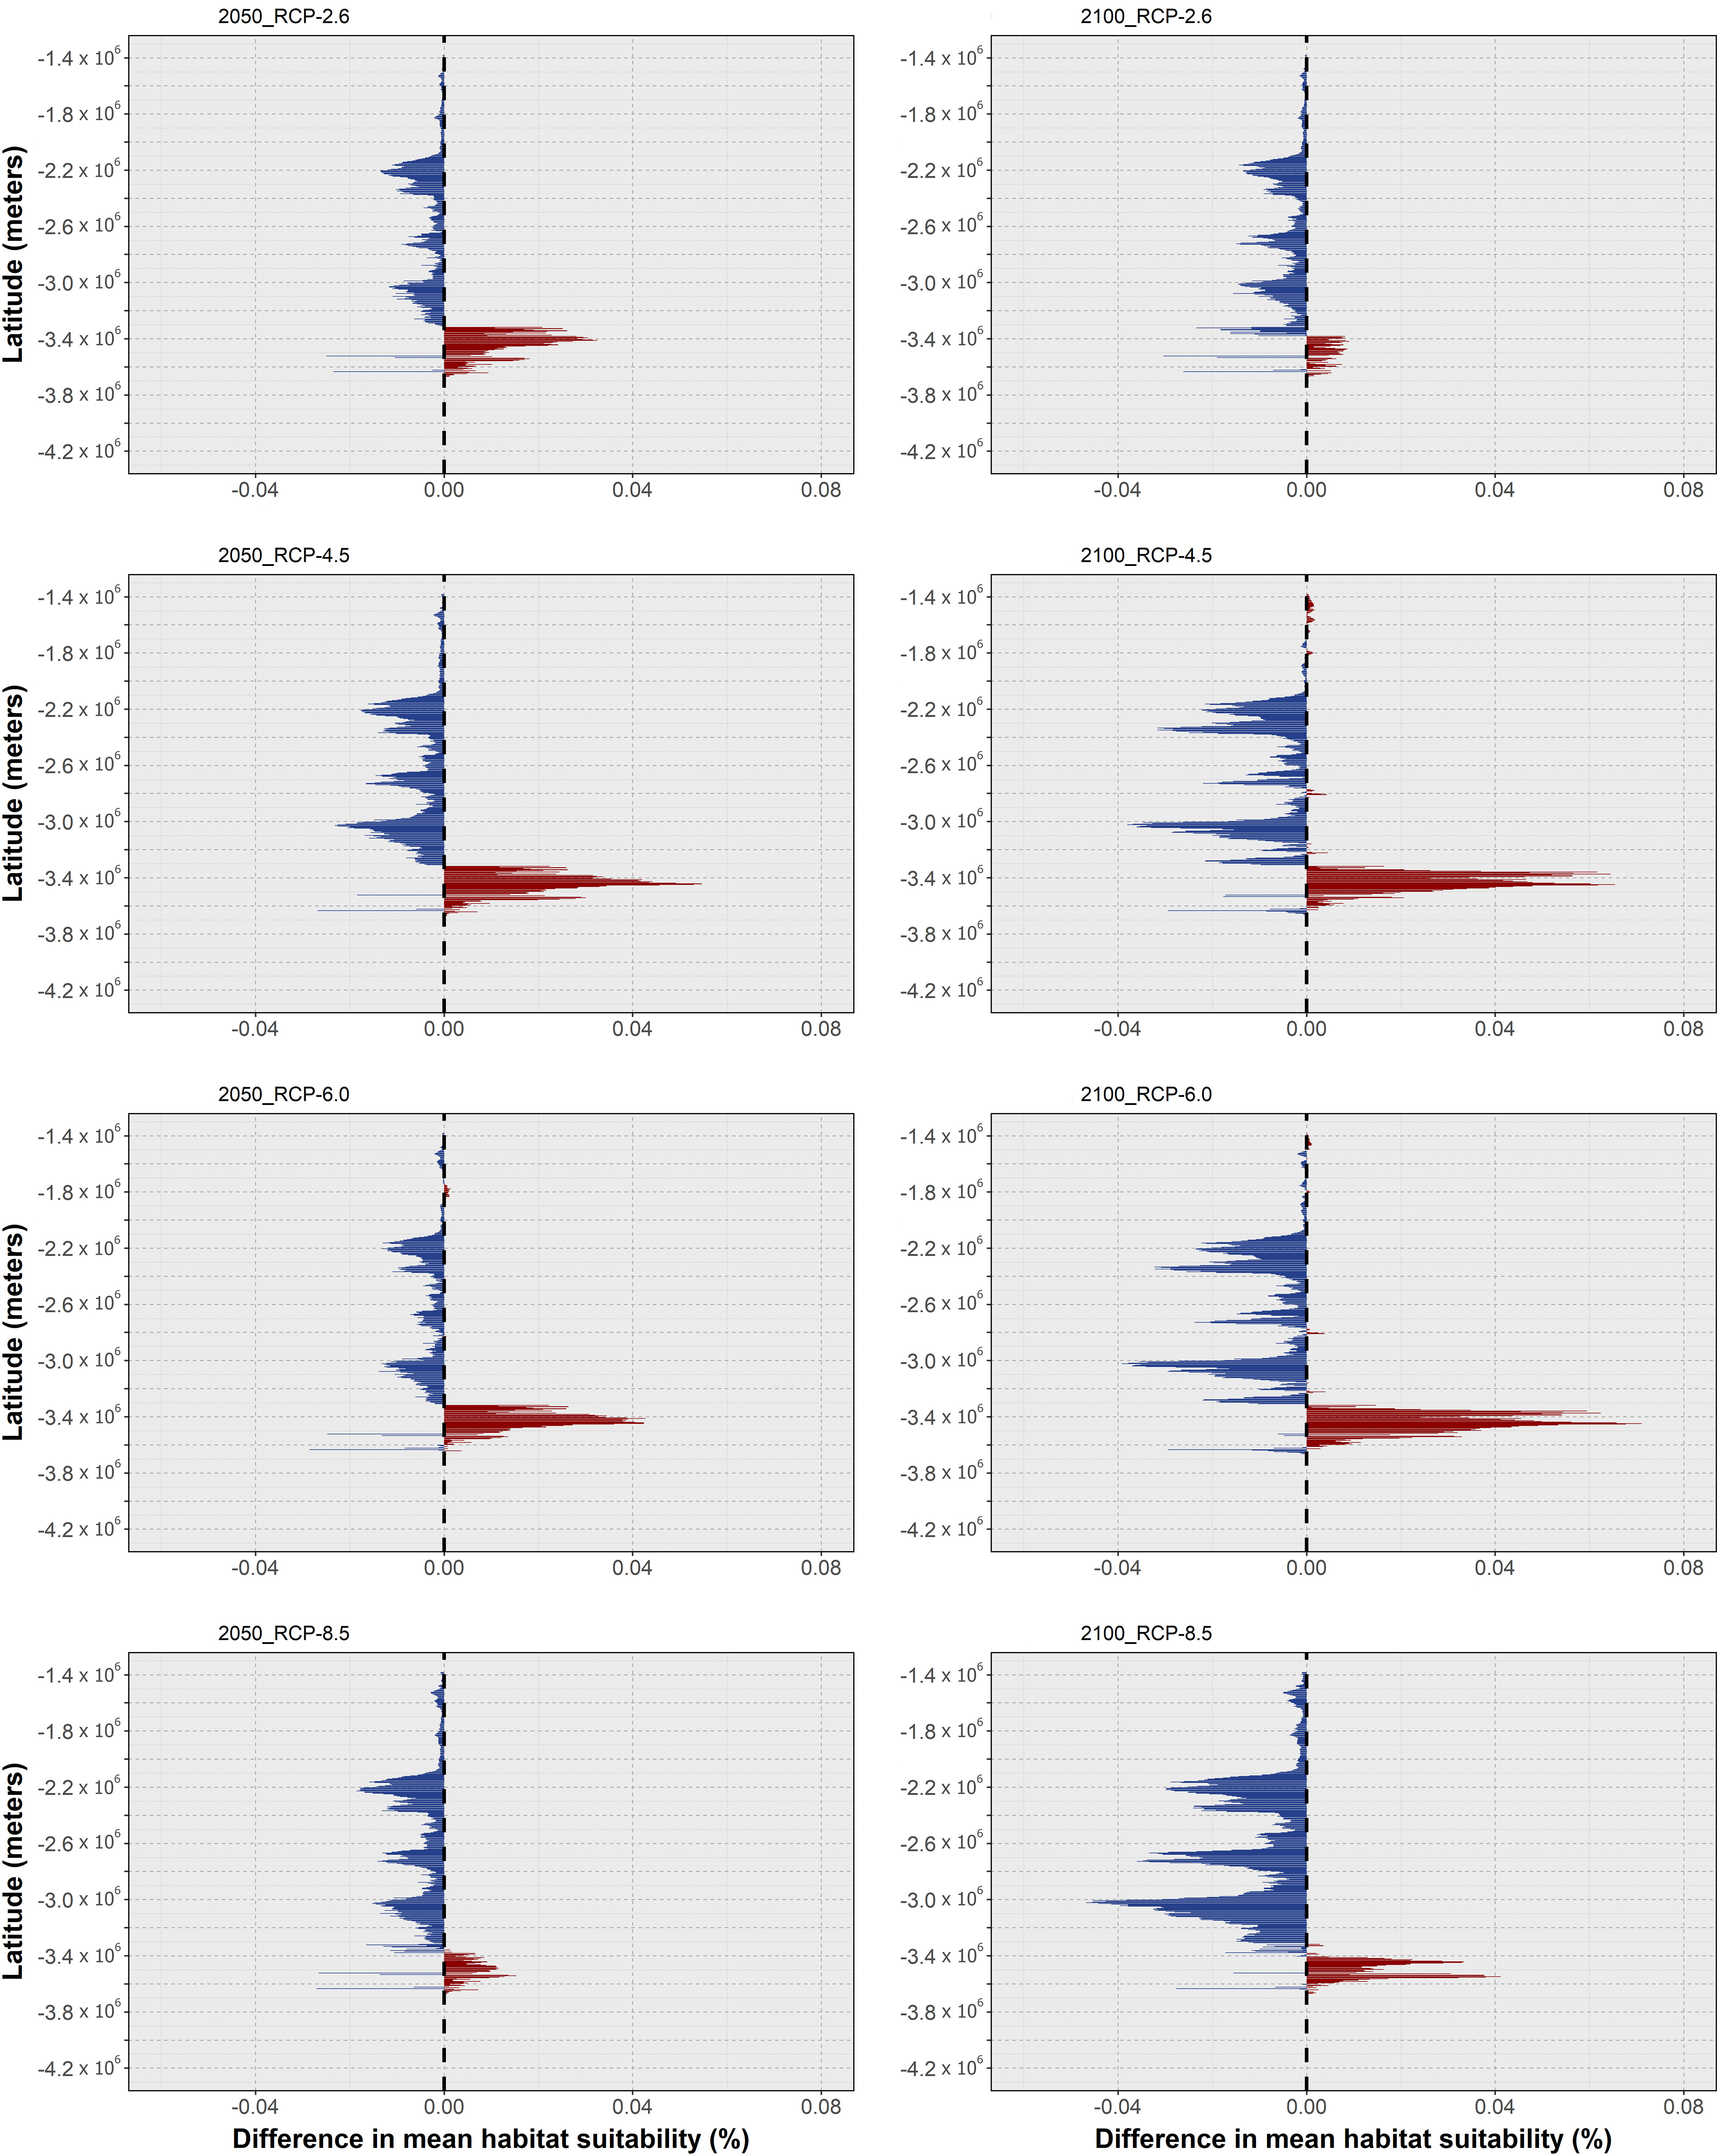
Figure 12 Changes in mean latitudinal habitat suitability for Octopus djinda between the present-day and 2050 (left side) and 2100 (right side), for each Representative Concentration Pathway scenario (RCP-2.6, 4.5, 6.0, 8.5; CMIP5), relative to the present-day baseline (i.e., the black dashed vertical line). Data to the right of the dashed line represents a relative increase in mean habitat suitability (red) and data to the left represents a relative decrease (blue).
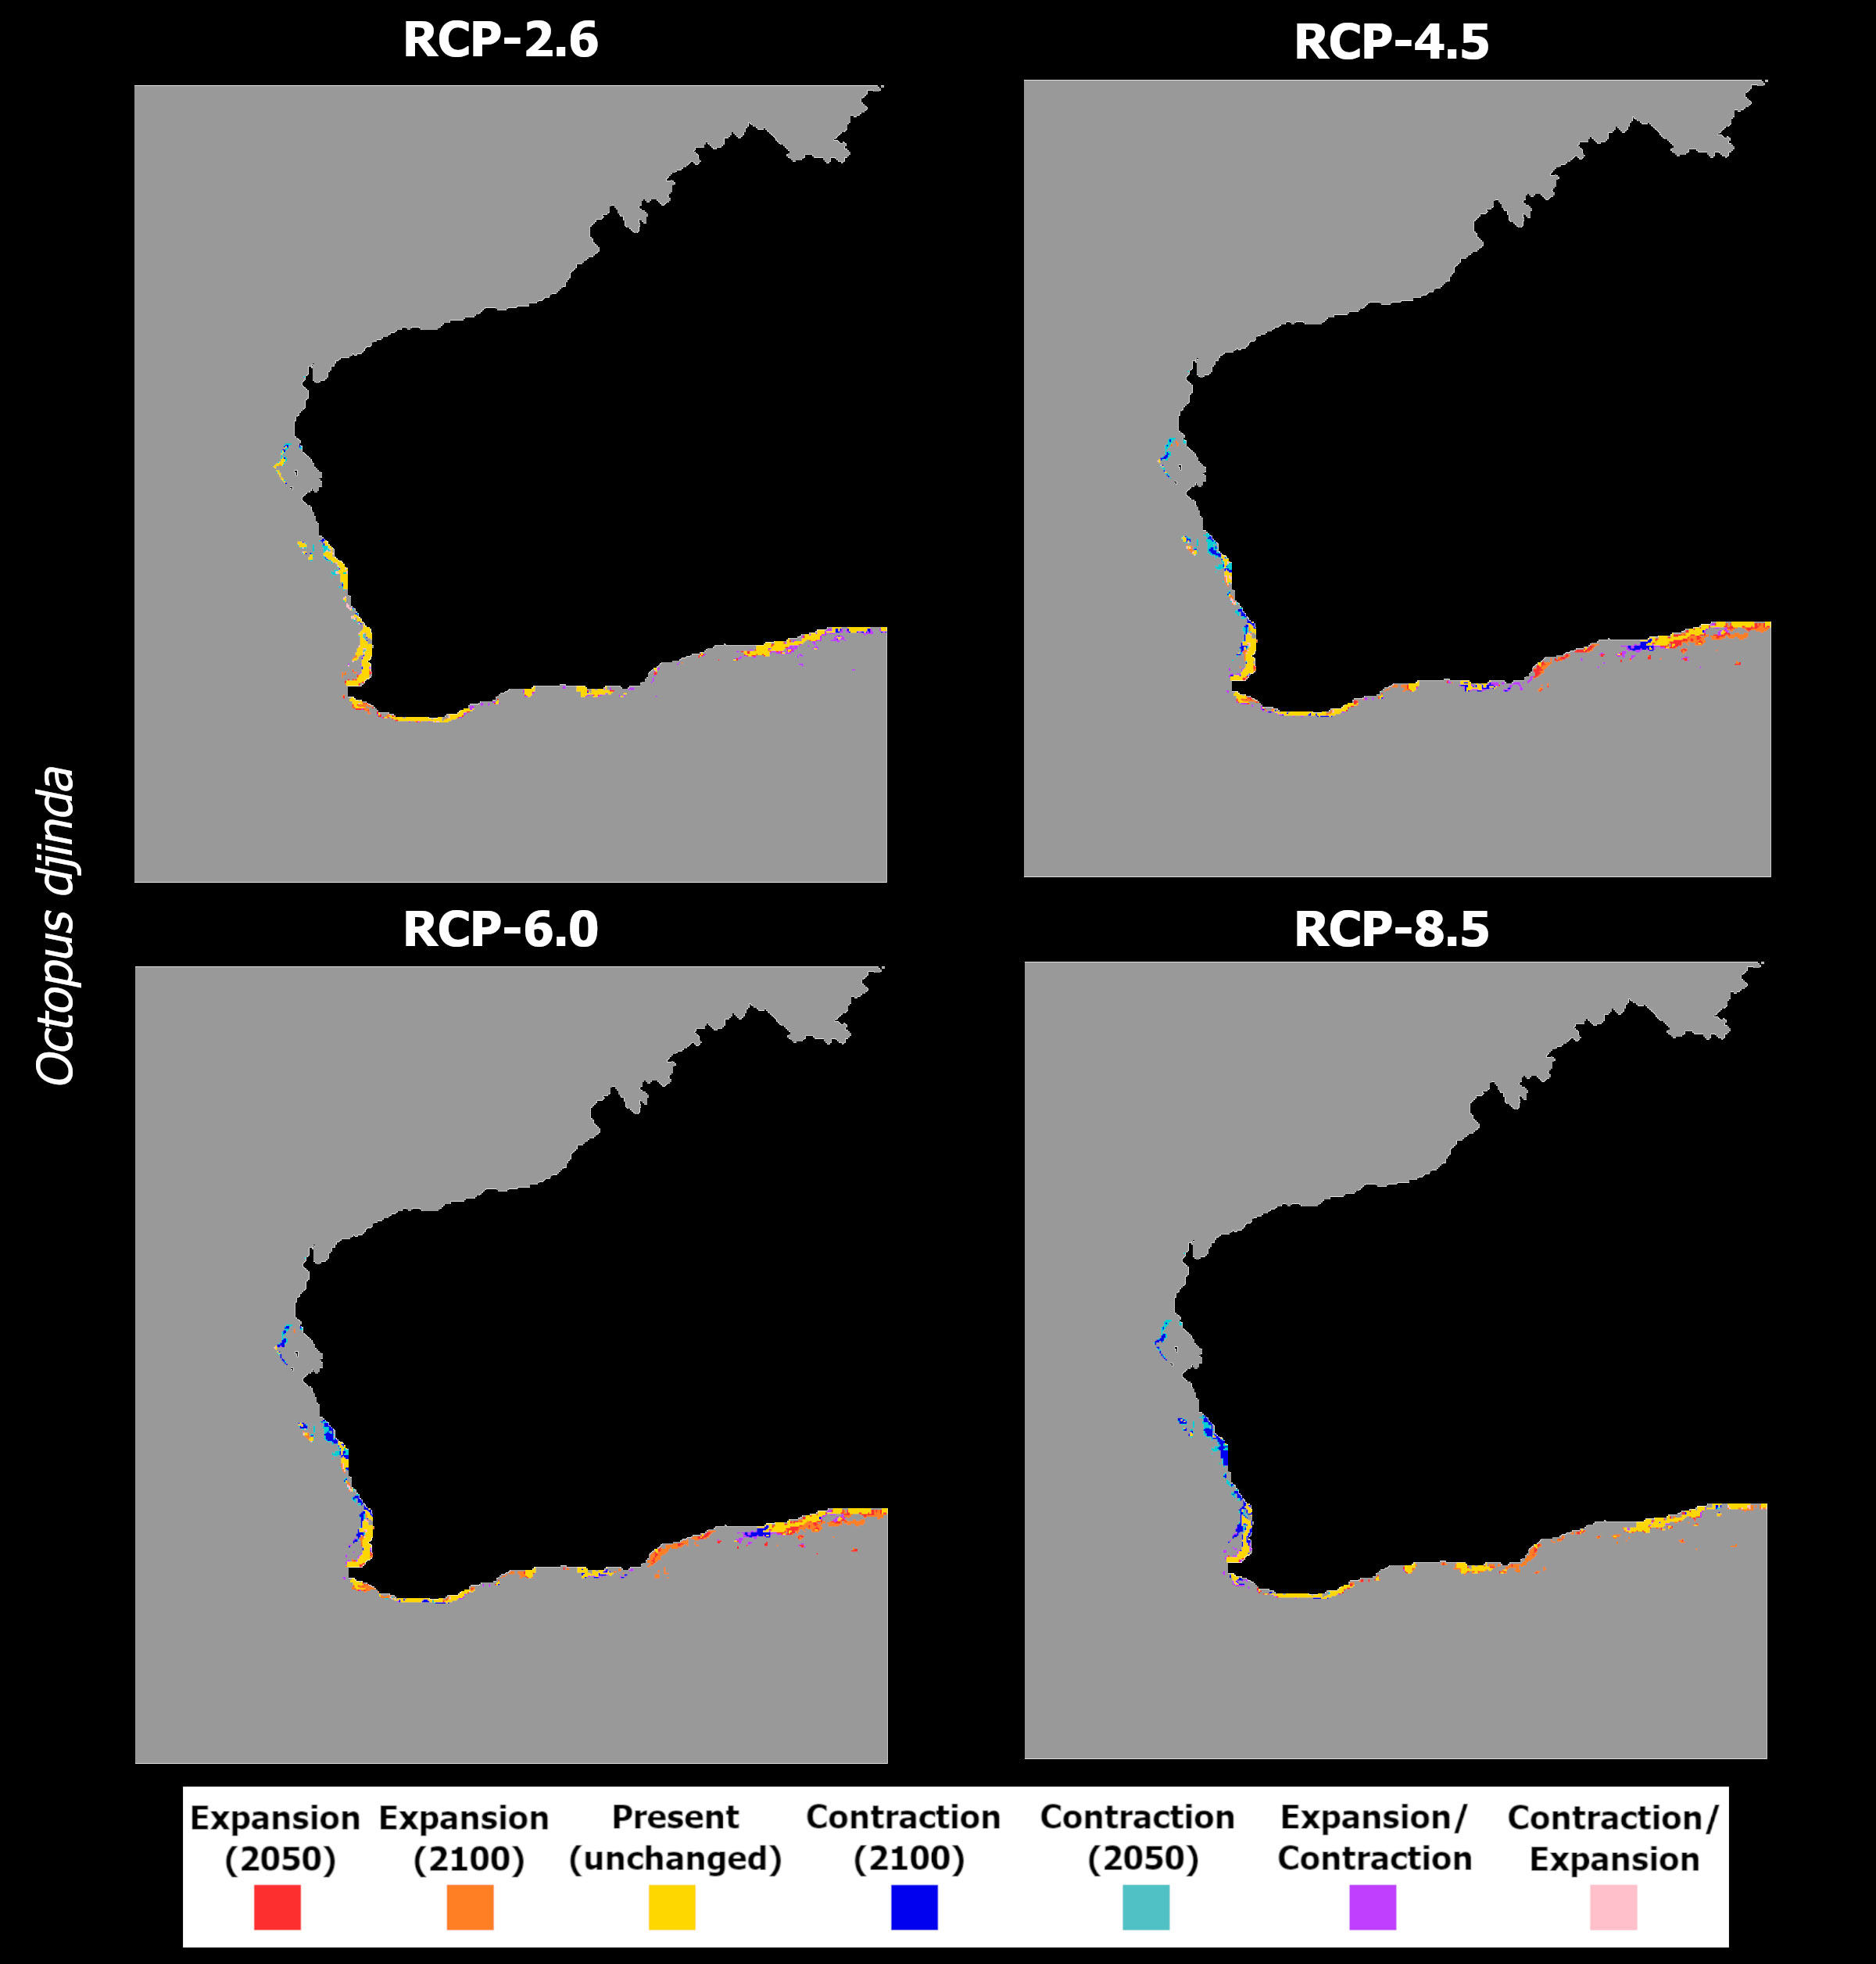
Figure 13 Time maps of the projected changes in species occurrence distribution for Octopus djinda, showing unidirectional range shifts in occurrence distribution [i.e., range expansion (in red and orange) or contraction (in dark and light blue)] as well as transitory fluctuations (i.e., range contraction followed by expansion (pink), and vice-versa (purple)] across time (i.e., 2050 and 2100) and RCP scenarios (RCP-2.6, 4.5, 6.0, 8.5; CMIP5).
In RCP-4.5, the loss in mean habitat suitability increases until the end of the century (Figures 12C, D), while the southernmost latitudes exhibit a considerable increase in suitability until the end of the century. This led to a larger area of projected losses in distribution, relative to RCP-2.6, in the western Australian coastline, together with increased areas of expansion in the South (Figure 13B). For RCP-6.0, the projections are very similar to the previous scenario, although the projected extirpation in the western Australian coastline is greater between 2050 and 2100, with further expansion on the southern shores during the same period (Figure 13C), due to a relative exacerbation of the changes in mean habitat suitability relative to RCP-4.5 (Figures 12E, F). Finally, in RCP-8.5, despite projected habitat suitability loss being considerably exacerbated (Figures 12G, H) leading to extirpation across the entire western Australian coastline (Figure 13D), there is considerably lesser expansion projected for the southern areas of its distribution (e.g., mainly localized around the Great Australian Bay).
Discussion
In terms of present-day distribution of each OVSC species, the ensemble models were able to make relatively accurate predictions, with small exceptions that are discussed below. Regarding future projections, the biogeographical response to climate change-associated changes in environmental variables was different across OVSC species, hinting at potentially different long-term consequences and management requirements for each species within the so-called OVSC and historically referred to as Octopus vulgaris. However, a general trend of decreasing mean habitat suitability with increasing RCP severity, with associated losses in the current distribution range, was observed across species.
For O. vulgaris, the ensemble models predicted a distribution very similar to that presented in Rosa et al. (in press), with the species occurring along west Africa and in the Macaronesia region (Adam, 1962; Gonçalves, 1991; Sánchez et al., 2015); in the Mediterranean Sea and along the Iberian Peninsula (Rees, 1956; Sousa Reis, 1985) and northward into the Northeast Atlantic Ocean and the English Channel (Massy, 1928; Rees, 1950; De Luca et al., 2014). However, its occurrence was also predicted in Iceland and in the North Sea, where it currently does not occur (Goud et al., 2019; Oesterwind et al., 2022). Notwithstanding, previous SDM analyses performed on O. vulgaris in the same region, by Schickele et al. (2021), have led to similar predictions over the eastern North Sea, despite slightly different results. In terms of future changes, the present study projected a decrease in habitat suitability for the Mediterranean and the eastern Atlantic, exacerbated with scenario severity, but did not predict increasing habitat suitability and consequent northward distribution gains in the Baltic Sea (Schickele et al., 2021). These differences likely stem from the environmental predictors and geographical restrictions included in the analysis. Indeed, to avoid over-parametrization, Schickele et al. (2021) only employed sea surface salinity and mean annual sea bottom temperature (including mean, range, and variance), and in the case of Octopus vulgaris, the analysis excluded salinity altogether. The present study, however, employed bathymetry and current velocity as environmental predictors, but also used both max depth (i.e., sea bottom) and surface layers for current velocity, temperature, and salinity. This approach aimed to accurately describe the octopuses’ habitats, while still avoiding over-parametrization. Notwithstanding, both studies projected increasing environmental pressure in the southern areas of this species’ distribution range, which could lead to severe impacts on populations at this trailing edge and potential socioeconomic repercussions, given the relative importance of this resource for regional fisheries (Sánchez et al., 2015; Sauer et al., 2021). Indeed, the present study projected severe contractions in the Mediterranean Sea and along the Iberian and French coastlines, with minimal expansion. Together, these results point to a potential severe decrease in habitat suitability towards the end of the century for this species, with severity increasing alongside the emissions implicit to each RCP scenario.
Regarding O. americanus, its predicted distribution was in line with its current accepted distribution (Avendaño et al., 2020). Indeed, the ensemble model predicted its occurrence from the north of Argentina, along the continental shelf of Yucatan, and into the northwest coast of the United States and Canada. In terms of projections, this species exhibited a clear pattern of decreasing suitability in tropical and subtropical waters (mainly in the regions of the Yucatan Peninsula, northern Brazil, and towards Florida) and increases in higher latitudes (offshore Argentina and alongside the north-western US and Canada), both exacerbated with RCP scenario severity. This is a slightly different response to that projected for O. vulgaris, which saw its available environmental niche decrease considerably with time and RCP scenario. It is worth noting that other American octopuses have been analysed with an SDM framework, where similar trends were observed. For instance, O. insularis (Leite et al., 2008), which occurs in tropical and subtropical waters of the Central and South American continents, sharing most of its distribution with part of O. americanus’, is projected to undergo an increase in suitable niche space in the tropical Atlantic, potentially expanding into the temperate northern Atlantic, temperate South America, and temperate South Africa (Lima et al., 2020). In the present-study, however, O. americanus is projected to undergo a severe range contraction in lower latitudes, in the tropical and subtropical Atlantic, suggesting that suitable niche space decreases in these regions. Alongside this severe range contraction at lower latitudes, the increase in habitat suitability at higher latitudes, particularly in the northern hemisphere, presents a potential poleward shift, suggesting the possibility of a split in the distribution of O. americanus between North and South America which could isolate both populations and lead to genetic divergence in the long term. In fact, O. americanus is mainly a subtropical and temperate species (O’Brien et al., 2021), linked to waters between the 18 and 25°C depending on the life stage (Bastos, 2018; Ángeles-González et al., 2020). Juveniles and adults of this species typically occur in cooler waters up to 200 m in depth (Avendaño et al., 2020), and shallow waters associated with upwelling systems (O’Brien et al., 2021), which limits their occurrence in tropical areas. Therefore, the prediction of O. americanus in warmer shallow waters in the tropics (e.g., in the Caribbean region) is likely an overprediction introduced by the occurrence points utilized. As will be discussed below, one limitation of the use of online databases is the potential for misidentification in highly morphologically similar and co-occurring species [e.g., as is the case between O. americanus and O. insularis (O’Brien et al., 2021)]. Nevertheless, the observed projected trend of reducing mean habitat suitability in equatorial and low-latitude tropical areas is likely to be accurate, with increasing oceanic temperatures leading further constraining the species in these areas. Yet, it is also important to note that one may also argue that adult individuals may also move into deeper, cooler waters, together with the projected regional displacement; alongside, the weakening of regional upwelling systems, such as in Brazil, associated with climate change could also lead to further contraction in coastal areas (de Souza et al., 2020).
For O. aff. vulgaris, the predicted present-day distribution was (again) quite similar to the accepted distribution range, with the species occurring in the coastlines of Namibia in the South-eastern Atlantic Ocean, and in the Indian Ocean shores of Mozambique and Madagascar (Oosthuizen and Smale, 2003; Oosthuizen et al., 2004). Future projections predict a severe pressure on the eastern range of its distribution, in the Indian Ocean, with decreasing habitat suitability leading to losses in northern latitudes. Indeed, over time and for all scenarios except RCP-2.6, this species is projected to potentially be extirpated from most of Madagascar and Mozambican shores. This could lead to a reshuffling in local food webs and a significant impact on subsistence and recreational fisheries in the eastern regions of South Africa, where most of this species’ exploitation occurs (Robertson et al., 1997; Oosthuizen and Smale, 2003).
The O. djinda has only recently been shown to indeed be a distinct species than O. tetricus, occurring along the southwest Australian coast from Shark Bay to near Cape Le Grand (Amor and Hart, 2021; Moltschaniwskyj and Hall, in press a). The ensemble model was able to accurately predict its present-day distribution but encountered issues of overprediction – mainly in the southern Australian shores, in disjunct areas along the Great Australian Bight. This species is considered not to occur in this region, which has been associated with sharp drops in sea surface temperature that prevent paralarvae dispersal and settlement, maintaining the allopatric distributions between the now O. djinda and O. tetricus to the east (Amor et al., 2014). Regarding the areas of present-day distribution, the future projections exhibited the same trend of decreasing mean habitat suitability in lower latitudes, with a (limited) increase in southern areas. In this context, the species is projected to lose some of its northern distribution, potentially expanding into the Great Australian Bight if conditions become more suitable over time. This pattern was consistent and exacerbated with increasing RCP severity. However, from RCP6.0 to RCP8.5, the areas of projected loss outpace those of potential expansion. Overall, the present results suggest a potential for southward expansion of O. djinda towards the shallow areas of the Great Australian Bay, since this species typically occurs in temperatures between 17-25°C and depths of up to 80 m (Amor and Hart, 2021). This could potentially lead to increased chances of overlap with other octopus species (e.g., Octopus kaurna, Stranks 1990) and top-down pressure in these habitats. At the same time, since O. djnda supports a highly productive fishery (Moltschaniwskyj and Hall, in press a), local fishermen communities may also be affected by these shifts.
O. sinensis was accurately predicted to occur over most of its present-day distribution. Indeed, this species is known to occur in the South China Sea (Gleadall, 2016), from the region of Taiwan (Lü et al., 2013; Reid and Wilson, 2015), northward into Japan in southern Hokkaido and the East China Sea (Sauer et al., 2021). Our projections translated into two positive (RCP-2.6 and 8.5) and two negative scenarios (RCP-4.5 and 6.0), with the least and most extreme emission scenarios both resulting in a considerable expansion of O. sinensis towards the most northern regions of its distribution (on the Sea of Japan and the Yellow Sea). This poleward expansion to newly suitable habitats would be beneficial to the species. On the other hand, the two middle-emission scenarios exhibited a considerable loss of habitat suitability and distribution, over most of its present latitudinal extent. Given that this species is of major economic importance in the southern waters of China and Japan (Sauer et al., 2021), this may lead to a loss of fishery grounds of this species. Indeed, in the 20th century, O. sinensis was already over-exploited in certain regions of Japan (Hamabe et al., 1976) and, despite current regulations, these synergistic pressures may undermine the sustainable use of this species in the region.
Lastly, O. tetricus also exhibited considerable overprediction of its area of present-day distribution. Indeed, this species was predicted to occur along most of the southeastern, southern, and southwestern shores of Australia, as well as most of eastern and northwestern New Zealand. However, its present distribution only encompasses the east coast of the Australian mainland, in shallow waters across the Tasmanian Sea, and in northern New Zealand (Amor et al., 2014; Amor and Hart, 2021; Moltschaniwskyj et al., in press b). Overall, until the end of the century, the ensemble models projected localized decreases in mean habitat suitability in northern latitudes, much as O. djinda, with consequent losses in distribution in these regions. For RCP-2.6, the species is inclusively projected to expand into the Great Australian Bight, together with increases into further depths in New Zealand and Tasmania. If this emissions scenario occurs, it is possible that this species could clash with other competitor species and further increase top-down pressure in these novel habitats. However, for the most extreme scenarios, together with shifts towards greater depths, the species is projected to be particularly pressured in its northern distribution latitudes in mainland Australia, with the Australian Bight becoming unsuitable for colonization (with the models projecting severe loss by 2100 for this area), and small expansions in the area west of the Bass Strait. Warming is known to significantly affect O. tetricus egg development speed at 25°C - the upper limit of their temperature range (Spreitzenbarth and Andrew, 2021). As such, with increasing temperatures over time, this species is particularly susceptible to negative effects imposed by warming, which would lead to a contraction of the species range in mainland Australia, pushing the species into being further pressured by other anthropogenic stressors, despite its recent poleward expansion into Tasmanian waters (Ramos et al., 2014). Indeed, in New Zealand, egg development for this species has been shown to cease above 21°C (Anderson, 1994), which further emphasizes the threat of warming in terms of reproductive fitness.
This study’s results highlight the looming threat of marine climate change to ectotherm species, and namely in octopods. Indeed, temperature was one of the main contributing variables (either surface, benthic, or both) to determining habitat suitability in the ensemble models. The four RCP scenarios employed in this analysis encompass the wide gradient of possible climatic futures, mainly in terms of global temperature rise. The first scenario, RCP-2.6, projects the global temperature rise to stay below 2°C by the end of the century, requiring a global CO2 emission decline until zero by the year 2100. The intermediate scenario RCP-4.5 projects peaking CO2 emissions by the middle of the century, resulting in a 2-3°C increase in global temperatures. RCP-6.0 is a high emissions greenhouse gas scenario, resulting in a potential temperature increase of between 3 to 4°C. Lastly, the “worst case scenario” RCP-8.5 projects temperatures to increase by over 4°C due to continued increasing emissions during the 21st century (IPCC, 2014; Schwalm et al., 2020). In the present analysis, temperature was one of the most contributing variables for the majority of the OVSC species, emphasizing its potential future impacts to these species’ worldwide distribution. Indeed, temperature (and thermal stress) has been shown to promote a decrease in egg incubation time, hatchling size, weight at first sexual maturity, and average generation time (Andre et al., 2010). In this sense, it is likely that habitats featuring the greatest thermal pressure over time will significantly decrease in terms of habitat suitability, leading to potentially deleterious effects on octopus populations and promoting poleward shifts whenever possible. In this context, decreasing habitat suitability and potential distribution contraction in tropical and subtropical areas were to be expected, since the thermal tolerance of marine animals in these regions is closer to the environmental temperature limits in their habitats (Tewksbury et al., 2008; Nguyen et al., 2011; Rosa et al., 2014). Salinity was also particularly relevant, being the most contributing variable for O. vulgaris and the second most to O. americanus. Indeed, salinity gradients are of a high importance for the O. vulgaris complex (Hermosilla et al., 2011; Moreno et al., 2014; Iglesias et al., 2016), for instance in determining the preferred areas of recruitment. Changes to the salinity profile could, then, further condition the habitats that are suitable for these species. Likewise, with temperature increase, temperate and subtemperate areas become more suitable for these species, opening more habitats at increasing latitudes for these species to move into [i.e., poleward shifts (Burrows et al., 2011; Poloczanska et al., 2013). The present study revealed a potential poleward shift in O. americanus and poleward expansion in O. sinensis, while also projecting severe range contractions in lower latitudes for O. tetricus and O. aff. vulgaris, and to a lesser extent for O. djinda. This is in line with previous research (Xavier et al., 2016; Schickele et al., 2021; Boavida-Portugal et al., 2022), and contributes to the notion of cephalopod borealization (Xavier et al., 2016). This type of change in the distribution of species which are both important predators and preys can lead to significant ecosystem-level impacts which must be addressed. First, areas which are projected to undergo octopus range contraction could very well suffer a decrease in top-down control of benthic communities, while projected poleward shifts could increase this top-down control on lower trophic levels, in higher latitude areas (Allen, 1971; Colléter et al., 2012; Schickele et al., 2021). However, the present models do not account for adaptation, and recent abundance increases in commercially important cephalopods at a global scale suggest the existence of potential benefits under an already changing environment (Doubleday et al., 2016). It is still uncertain if this pattern of abundance increase will be maintained under further, more prolonged, and severe environmental changes, with distinct species bound to have different responses. Notwithstanding, suitable habitats are projected to be shifting for most of the OVSC species, as have been for coastal cephalopods (Boavida-Portugal et al., 2022), which emphasizes the need for further research, namely featuring field validation of said projections to clarify the potential road ahead for this marine group.
As with all modelling projections, there is the need to address potential caveats of the SDM analysis. First, all models were subject to some degree of over or under prediction in all species. The first issue is common, since SDMs assume that a species will completely occupy areas predicted to be climatically suitable, ignoring potential real-world limitations such as unaccounted environmental predictors, the existence of geographical barriers preventing dispersion, etc. (Araújo et al., 2005). Underprediction, however, is linked to the nature of the occurrence point data, in terms of sample size and spatial biases. Occurrence data retrieved from online databases, such as OBIS and GBIF, are unlikely to represent a complete sample of a species known distribution, since data in these databases is highly dependent on sampling effort, which is frequently geographically skewed (Beck et al., 2013). Also, regarding occurrence data from online databases, species misidentification may introduce some bias in the data retrieved. Notwithstanding, this issue is not likely to be prevalent in most species, as there is no co-occurrence with other highly similar species. This issue may be more pressing in the case of O. americanus however, the overall trends projected for the future are not invalidated. Finally, the relatively low sample size for O. djinda and O. sinensis (post-environmental filtering sample sizes of 19 and 28 respectively; Table 1), could also be introducing uncertainty in the predictions, since sample sizes under 50 to 100 occurrence points suffer from relative decreases in predictive accuracy, depending on the algorithm and modelling conditions used (Stockwell and Peterson, 2002). However, all model runs for each species were maintained by the ‘megaSDM’ package during evaluation, suggesting reliable performance. Another issue refers to the assumption of climatic niche conservation between native and non-native ranges, which could potentially introduce biases and lead to inaccurate predictions (Pearman et al., 2008). As was already mentioned, the high phenotypic flexibility and strong adaptation potential of cephalopods (Boyle et al., 1996; Liscovitch-Brauer et al., 2017) suggest that Octopus species could adapt to future climate change-related conditions. Notwithstanding, this issue is minimized by the reduced geographical extent of the present study’s projections and the fact that predictions were primarily made within each species present-day distribution. In this context, future research should aim to increase sample size whenever possible, as well as increasing the ecological relevance of environmental predictors used. In this sense, the inclusion of dissolved oxygen, pH, and the distribution and ecological relationships between the OVSC species and potential predators and competitors would contribute towards more ecologically relevant models (Warton et al., 2015; Abdulwahab et al., 2022). Despite these limitations, the overall tendencies of the present study’s projections reflect major climatic drivers of change, and thus are bound to be ecologically meaningful (Garcia et al., 2016).
Final remarks
The present study contributes to the body of research on the biogeographical impacts of climate change on cephalopod species, particularly regarding the impacts on species complexes which are often treated as single species. In this regard, the results of this study highlight the potentially differential responses exhibited by each of the OVSC species. While results suggest increased pressure and potential extirpation at lower latitudes for some species (e.g., O. americanus and O. aff vulgaris), widespread distribution contraction were also identified (e.g., O. vulgaris and O. tetricus), and the potential for poleward distribution shifts as well (e.g., O. americanus and O. sinensis). These different responses require that research conducted on the O. vulgaris complex be adapted to include the different environmental requirements of each species, as well as the different abiotic pressures they will be subjected to in the future. This is of paramount importance for the correct evaluation and management of the fisheries stocks of the OVSC species, and the sustainability of regional octopus’ fisheries. The present study aimed to contributed towards fisheries management and conservation, by providing a set of future projections where the identification of potential areas of increase/decrease in habitat suitability and the consequent potential changes in each species distribution towards the end of the century are possible. By identifying such areas, it is possible to complement potential stock evaluation and stock management to predict increased environmental stress which could further increase anthropogenic pressure already present through fisheries exploitation.
Data availability statement
The original contributions presented in the study are included in the article/Supplementary Material. Further inquiries can be directed to the corresponding author.
Author contributions
RR and FB conceptualized the study; FB was responsible for data gathering and curation; FB conducted the SDM analysis and post-analysis processing; FB wrote the original draft of the manuscript; FB, MG, CS, JP, and RR reviewed and edited the manuscript. All authors contributed to the article and approved the submitted version.
Funding
This study had the support of national funds through Fundação para a Ciência e Tecnologia (FCT), under the project LA/P/0069/2020 granted to the Associate Laboratory ARNET; the MARE grant MARE UIDB/04292/2020; and the FCT Ph.D. fellowships attributed to FB (SFRH/BD/147294/2019), MG (SFRH/BD/148070/2019), and CS (SFRH/BD/117890/2016), and the FCT Scientific Employment Stimulus program to JP (2021.01030.CEECIND). CS was also supported through the FCT project OCEANPLAN, under the grant agreement PTDC/CTA-AMB/30226/2017. financed through FCiencias.ID
Conflict of interest
The authors declare that the research was conducted in the absence of any commercial or financial relationships that could be construed as a potential conflict of interest.
Publisher’s note
All claims expressed in this article are solely those of the authors and do not necessarily represent those of their affiliated organizations, or those of the publisher, the editors and the reviewers. Any product that may be evaluated in this article, or claim that may be made by its manufacturer, is not guaranteed or endorsed by the publisher.
Supplementary material
The Supplementary Material for this article can be found online at: https://www.frontiersin.org/articles/10.3389/fmars.2022.1018766/full#supplementary-material
References
Abdulwahab U. A., Hammill E., Hawkins C. P. (2022). Choice of climate data affects the performance and interpretation of species distribution models. Ecol. Modell. 471, 110042. doi: 10.1016/j.ecolmodel.2022.110042
Adam W. (1962). “Cephalopodes de l’archipel du cap-vert, de l’Angola et du Mozambique,” in Memorias da junta de investigacoes do ultramar.
Alabia I. D., Dehara M., Saitoh S.-I., Hirawake T. (2016). Seasonal habitat patterns of Japanese common squid (Todarodes pacificus) inferred from satellite-based species distribution models. Remote Sens. 8, 921. doi: 10.3390/rs8110921
Alabia I. D., Saitoh S.-I., Igarashi H., Ishikawa Y., Imamura Y. (2020). Spatial habitat shifts of oceanic cephalopod (Ommastrephes bartramii) in oscillating climate. Remote Sens. 12, 521. doi: 10.3390/rs12030521
Allen K. R. (1971). Relation between production and biomass. J. Fish. Res. Bd. Can. 28, 1573–1581. doi: 10.1139/f71-236
Amor M. D., Hart A. M. (2021). Octopus djinda (Cephalopoda: Octopodidae): A new member of the octopus vulgaris group from southwest Australia. Zootaxa 5061, 145–156. doi: 10.11646/zootaxa.5061.1.7
Amor M. D., Laptikhovsky V., Norman M. D., Strugnell J. M. (2015). Genetic evidence extends the known distribution of octopus insularis to the mid-Atlantic islands ascension and St Helena. J. Mar. Biol. Assoc. U. K. 97, 753–758. doi: 10.1017/S0025315415000958
Amor M. D., Norman M. D., Cameron H. E., Strugnell J. M. (2014). Allopatric speciation within a cryptic species complex of Australasian octopuses. PloS One 9, e98982. doi: 10.1371/journal.pone.0098982
Amor M. D., Norman M. D., Roura A., Leite T. S., Gleadall I. G., Reid A., et al. (2017). Morphological assessment of the octopus vulgaris species complex evaluated in light of molecular-based phylogenetic inferences. Zool. Scr. 46, 275–288. doi: 10.1111/zsc.12207
Anderson T. J. (1994). Taxonomy and ecology of shallow-benthic octopus in north-eastern new Zealand Vol. 71 (Auckland, New Zealand: University of Auckland).
Andre J., Haddon M., Pecl G. T. (2010). Modelling climate-change-induced nonlinear thresholds in cephalopod population dynamics. Glob. Change Biol. 16 (10), 2866–2875. doi: 10.1111/j.1365-2486.2010.02223.x
Ángeles-González L. E., Martínez-Meyer E., Yañez-Arenas C., Velázquez-Abunader I., López-Rocha J. A., Torrejón-Magallanes J., et al. (2021). Climate change effect on octopus maya (Voss and solís-ramírez 1966) suitability and distribution in the Yucatan peninsula, gulf of Mexico: A correlative and mechanistic approach. Estuar. Coast. Shelf Sci. 60, 107502. doi: 10.1016/j.ecss.2021.107502
Araújo M. B., Guisan A. (2006). Five (or so) challenges for species distribution modelling. J. Biogeogr. 33, 1677–1688. doi: 10.1111/j.1365-2699.2006.01584.x
Araújo M. B., New M. (2007). Ensemble forecasting of species distributions. Trends Ecol. Evol. 22, 42–47. doi: 10.1016/j.tree.2006.09.010
Araújo M. B., Pearson R. G., Rahbek C. (2005). Equilibrium of species’ distributions with climate. Ecography 28, 693–695. doi: 10.1111/j.2005.0906-7590.04253.x
Arreguín-Sánchez F. (2019). Climate change and the rise of the octopus fishery in the campeche bank, méxico. Reg. Stud. Mar. Sci. 32, 100852. doi: 10.1016/j.rsma.2019.100852
Assis J., Tyberghein L., Bosch S., Verbruggen H., Serrão E. A., De Clerck O. (2018). Bio-ORACLE v2.0: Extending marine data layers for bioclimatic modelling. Glob. Ecol. Biogeogr. 27, 277–284. doi: 10.1111/geb.12693
Avendaño O., Roura Á., Cedillo-Robles C. E., González Á. F., Rodríguez-Canul R., Velázquez-Abunader I., et al. (2020). Octopus americanus: A cryptic species of the o. vulgaris species complex redescribed from the Caribbean. Aquat. Ecol. 54, 909–925. doi: 10.1007/s10452-020-09778-6
Balguerías E., Quintero M. E., Hernández-González C. L. (2000). The origin of the Saharan bank cephalopod fishery. ICES J. Mar. Sci. 57, 15–23. doi: 10.1006/jmsc.1999.0572
Barbet-Massin M., Jiguet F., Albert C. H., Thuiller W. (2012). Selecting pseudo-absences for species distribution models: How, where and how many? Methods Ecol. Evol. 3, 327–338. doi: 10.1111/j.2041-210X.2011.00172.x
Bass D., Richards T. A., Matthai L., Marsh V., Cavalier-Smith T. (2007). DNA Evidence for global dispersal and probable endemicity of protozoa. BMC Evol. Biol. 7, 162. doi: 10.1186/1471-2148-7-162
Bastos P. (2018) Fisiologia digestiva e dieta peletizada para engorda do polvo octopus vulgaris tipo II (Universidade Federal de Santa Catarina). Available at: https://repositorio.ufsc.br/handle/123456789/193116 (Accessed 10 October 2022).
Beck J., Ballesteros-Mejia L., Nagel P., Kitching I. J. (2013). Online solutions and the ‘Wallacean shortfall’: What does GBIF contribute to our knowledge of species’ ranges? Divers. Distrib. 19, 1043–1050. doi: 10.1111/ddi.12083
Beheregaray L. B., Caccone A. (2007). Cryptic biodiversity in a changing world. J. Biol. 6, 9. doi: 10.1186/jbiol60
Bickford D., Lohman D. J., Sodhi N. S., Ng P. K. L., Meier R., Winker K., et al. (2007). Cryptic species as a window on diversity and conservation. Trends Ecol. Evol. 22, 148–155. doi: 10.1016/j.tree.2006.11.004
Boakes E. H., McGowan P. J. K., Fuller R. A., Chang-qing D., Clark N. E., O’Connor K., et al. (2010). Distorted views of biodiversity: Spatial and temporal bias in species occurrence data. PloS Biol. 8, e1000385. doi: 10.1371/journal.pbio.1000385
Boavida-Portugal J., Guilhaumon F., Rosa R., Araújo M. B. (2022). Global patterns of coastal cephalopod diversity under climate change. Front. Mar. Sci. 8. doi: 10.3389/fmars.2021.740781
Borges F. O., Lopes V. M., Amorim A., Santos C. F., Costa P. R., Rosa R. (2022). Projecting future climate change-mediated impacts in three paralytic shellfish toxins-producing dinoflagellate species. Biology 10, 1424. doi: 10.3390/biology11101424
Boyle P. R., Boletzky S. V., Clarke M. R. (1996). Cephalopod populations: definition and dynamics. Philos. Trans. R. Soc Lond. B Biol. Sci. 351, 985–1002. doi: 10.1098/rstb.1996.0089
Burrows M. T., Schoeman D. S., Buckley L. B., Moore P., Poloczanska E. S., Brander K. M., et al. (2011). The pace of shifting climate in marine and terrestrial ecosystems. Science 334, 652–655. doi: 10.1126/science.1210288
Castellanos A. A., Huntley J. W., Voelker G., Lawing A. M. (2019). Environmental filtering improves ecological niche models across multiple scales. Methods Ecol. Evol. 10, 481–492. doi: 10.1111/2041-210X.13142
Cheng S. H., Anderson F. E., Bergman A., Mahardika G. N., Muchlisin Z. A., Dang B. T., et al. (2014). Molecular evidence for co-occurring cryptic lineages within the sepioteuthis cf. lessoniana species complex in the Indian and indo-West pacific oceans. Hydrobiologia 725, 165–188. doi: 10.1007/s10750-013-1778-0
Cohen J., Cohen P., West S. G., Aiken L. S. (2003). “Applied multiple regression/correlation analysis for the behavioral sciences,” in Applied multiple regression/correlation analysis for the behavioral sciences, 3rd ed (Mahwah, NJ, US: Lawrence Erlbaum Associates Publishers).
Colléter M., Gascuel D., Ecoutin J.-M., Tito de Morais L. (2012). Modelling trophic flows in ecosystems to assess the efficiency of marine protected area (MPA), a case study on the coast of sénégal. Ecol. Modell. 232, 1–13. doi: 10.1016/j.ecolmodel.2012.01.019
Costa T. A. S., Sales J. B. L., Markaida U., Granados-Amores J., Gales S. M., Sampaio I., et al. (2021). Revisiting the phylogeny of the genus lolliguncula steenstrup 1881 improves understanding of their biogeography and proves the validity of lolliguncula argus brakoniecki & roper 1985. Mol. Phylogenet. Evol. 154, 106968. doi: 10.1016/j.ympev.2020.106968
De Luca D., Catanese G., Procaccini G., Fiorito G. (2014). An integration of historical records and genetic data to the assessment of global distribution and population structure in octopus vulgaris. Front. Ecol. Evol. 2. doi: 10.3389/fevo.2014.00055
de Souza M. M., Mathis M., Mayer B., Noernberg M. A., Pohlmann T. (2020). Possible impacts of anthropogenic climate change to the upwelling in the south Brazil bight. Clim. Dyn. 55 (3–4), 651–664. doi: 10.1007/s00382-020-05289-0
Doubleday Z. A., Prowse T. A. A., Arkhipkin A., Pierce G. J., Semmens J., Steer M., et al. (2016). Global proliferation of cephalopods. Curr. Biol. 26, R406–R407. doi: 10.1016/j.cub.2016.04.002
Early R., Sax D. F. (2011). Analysis of climate paths reveals potential limitations on species range shifts. Ecol. Lett. 14, 1125–1133. doi: 10.1111/j.1461-0248.2011.01681.x
Elith J., Graham C., Anderson R. P., Dudík M., Ferrier S., Guisan A., et al. (2006). Novel methods improve prediction of species’ distributions from occurrence data. Ecography 29, 129–151. doi: 10.1111/j.2006.0906-7590.04596.x
Elith J., Kearney M., Phillips S. (2010). The art of modelling range-shifting species. Methods Ecol. Evol. 1, 330–342. doi: 10.1111/j.2041-210X.2010.00036.x
Elith J., Phillips S. J., Hastie T., Dudík M., Chee Y. E., Yates C. J. (2011). A statistical explanation of MaxEnt for ecologists. Divers. Distrib. 17, 43–57. doi: 10.1111/j.1472-4642.2010.00725.x
Espíndola A., Ruffley M., Smith M. L., Carstens B. C., Tank D. C., Sullivan J. (2016). Identifying cryptic diversity with predictive phylogeography. Proc. R. Soc B. 283, 20161529. doi: 10.1098/rspb.2016.1529
FAO (2020). “The state of world fisheries and aquaculture., (2020),” in Sustainability in action (Rome: Food and Agriculture Organization of the United Nations), 244. doi: 10.4060/ca9229e
FAO (2021)Fisheries division, statistics and information branch. In: FishStatJ. version 4.01.4. June 2021. universal software for fishery statistical time series. Available at: https://www.fao.org/fishery/statistics/software/fishstatj/en (Accessed 10 October 2022). Copyright 2020. Global octopus capture 1950–2019.
Farhadi A., Anderson F. E. (2021). “The dynasty of the pharaoh: Phylogeography and cryptic biodiversity of sepia pharaonis cuttlefish in Northwest Indian ocean peripheral seas,” in The Arabian seas: Biodiversity, environmental challenges and conservation measures. Ed. Jawad L. A. (Cham: Springer International Publishing), 427–442. doi: 10.1007/978-3-030-51506-5_17
Feng X., Park D. S., Walker C., Peterson A. T., Merow C., Papeş M. (2019). A checklist for maximizing reproducibility of ecological niche models. Nat. Ecol. Evol. 3, 1382–1395. doi: 10.1038/s41559-019-0972-5
Fernández-Álvarez F. Á., Braid H. E., Nigmatullin C. M., Bolstad K. S. R., Haimovici M., Sánchez P., et al. (2020). Global biodiversity of the genus ommastrephes d’Orbigny 1834 (Ommastrephidae: Cephalopoda): An allopatric cryptic species complex. Zool. J. Linn. Soc 190, 460–482. doi: 10.1093/zoolinnean/zlaa014
Fitzpatrick M. C., Hargrove W. W. (2009). The projection of species distribution models and the problem of non-analog climate. Biodivers. Conserv. 18, 2255. doi: 10.1007/s10531-009-9584-8
Garcia R. A., Cabeza M., Altwegg R., Araújo M. B. (2016). Do projections from bioclimatic envelope models and climate change metrics match? Glob. Ecol. Biogeogr. 25, 65–74. doi: 10.1111/geb.12386
Gleadall I. G. (2016). Octopus sinensis d’Orbigny 1841 (Cephalopoda: Octopodidae): Valid species name for the commercially valuable East Asian common octopus. Species Divers. 21, 31–42. doi: 10.12782/sd.21.1.031
Gobler C. J., Baumann H. (2016). Hypoxia and acidification in ocean ecosystems: Coupled dynamics and effects on marine life. Biol. Lett. 12, 20150976. doi: 10.1098/rsbl.2015.0976
Golikov A. V., Sabirov R. M., Lubin P. A., Jørgensen L. L. (2013). Changes in distribution and range structure of Arctic cephalopods due to climatic changes of the last decades. Biodiversity 14, 28–35. doi: 10.1080/14888386.2012.702301
Gonçalves J. M. (1991). Biology and exploitation of octopus vulgaris cuvier 1797 (Mollusca: Cephalopoda) in the Azores. ICES CM 1991/K 11, 13.
Guzik M. T., Norman M. D., Crozier R. H. (2005). Molecular phylogeny of the benthic shallow-water octopuses (Cephalopoda: Octopodinae). Mol. Phylogenet. Evol. 37, 235–248. doi: 10.1016/j.ympev.2005.05.009
Hamabe J., Kawakami T., Watabe Y., Okutani T. (1976). “Perspectives for Japanese overseas squid fisheries,” in Report of the expert consultation on fishing for squid and other cephalopods (Rome: FAO), 47–51.
Hannah L., Midgley G. F., Lovejoy T., Bond W. J., Bush M., Lovett J. C., et al. (2002). Conservation of biodiversity in a changing climate. Conserv. Biol. 16, 264–268. doi: 10.1046/j.1523-1739.2002.00465.x
Hebert P. D. N., Cywinska A., Ball S. L., deWaard J. R. (2003). Biological identifications through DNA barcodes. Proc. Biol. Sci. 270, 313–321. doi: 10.1098/rspb.2002.2218
Heikkinen R. K., Luoto M., Araújo M. B., Virkkala R., Thuiller W., Sykes M. T. (2006). Methods and uncertainties in bioclimatic envelope modelling under climate change. Prog. Phys. Geogr. 30, 751–777. doi: 10.1177/0309133306071957
Hermosilla C., Rocha F., Valavanis V. D. (2011). Assessing octopus vulgaris distribution using presence-only model methods. Hydrobiologia 670, 35–47. doi: 10.1007/s10750-011-0671-y
Iglesias P., Picón P., Nande M., Lago M. J., Otero J. J., Trujillo V., et al. (2016). Effect of low salinity on survival and ingested food of the common octopus, octopus vulgaris cuvier 1797. J. Appl. Aquac. 28 (3), 267–271. doi: 10.1080/10454438.2016.1190953
IPCC (2014). “IPCC: Climate change 2014: Synthesis report,” in Contribution of working groups I, II and III to the fifth assessment report of the intergovernmental panel on climate change; core writing team. Eds. Pachauri R. K., Meyer L. A. (Geneva, Switzerland: IPCC), 151.
Knowlton N. (1993). Sibling species in the Sea. Annu. Rev. Ecol. Evol. Syst. 24, 189–216. doi: 10.1146/annurev.es.24.110193.001201
Kramer-Schadt S., Niedballa J., Pilgrim J. D., Schröder B., Lindenborn J., Reinfelder V., et al. (2013). The importance of correcting for sampling bias in MaxEnt species distribution models. Divers. Distrib. 19, 1366–1379. doi: 10.1111/ddi.12096
Laruelle G. G., Cai W.-J., Hu X., Gruber N., Mackenzie F. T., Regnier P. (2018). Continental shelves as a variable but increasing global sink for atmospheric carbon dioxide. Nat. Commun. 9, 454. doi: 10.1038/s41467-017-02738-z
Leite T. S., Haimovici M., Molina W., Warnke K. (2008). Morphological and genetic description of octopus insularis, a new cryptic species in the octopus vulgaris complex (Cephalopoda: Octopodidae) from the tropical southwestern Atlantic. J. Molluscan Stud. 74, 63–74. doi: 10.1093/mollus/eym050
Lima F. D., Ángeles-González L. E., Leite T. S., Lima S. M. Q. (2020). Global climate changes over time shape the environmental niche distribution of octopus insularis in the Atlantic ocean. Mar. Ecol. Prog. Ser. 652, 111–121. doi: 10.3354/meps13486
Liscovitch-Brauer N., Alon S., Porath H. T., Elstein B., Unger R., Ziv T., et al. (2017). Trade-off between transcriptome plasticity and genome evolution in cephalopods. Cell 169, 191–202.e11. doi: 10.1016/j.cell.2017.03.025
Liu C., Berry P. M., Dawson T. P., Pearson R. G. (2005). Selecting thresholds of occurrence in the prediction of species distributions. Ecography 28, 385–393. doi: 10.1111/j.0906-7590.2005.03957.x
Lobo J. M., Jiménez-Valverde A., Hortal J. (2010). The uncertain nature of absences and their importance in species distribution modelling. Ecography 33, 103–114. doi: 10.1111/j.1600-0587.2009.06039.x
Lü Z., Liu L., Li H., Wu C., Zhang J. (2013). Deep phylogeographic break among octopus variabilis populations in China: Evidence from mitochondrial and nuclear DNA analyses. Biochem. Syst. Ecol. 51, 224–231. doi: 10.1016/j.bse.2013.09.003
Mangold K. (1998). The octopodinae from the eastern Atlantic ocean and the Mediterranean Sea. Smithson Contrib Zool., 521–528.
Mangold K., Hochberg F. G. (1991). Defining the genus octopus: Redescription of octopus vulgaris. Bull. Mar. Sci. 49, 665.
Masson-Delmotte V., Zhai P., Pirani A., Connors S. L., Péan C., Berger S., et al. (2021). Climate change 2021: The physical science basis. contribution of working group I to the sixth assessment report of the intergovernmental panel on climate change (United Kingdom and New York, NY, USA: Cambridge University Press).
Miller J. (2010). Species distribution modelling. Geogr. Compass 4, 490–509. doi: 10.1111/j.1749-8198.2010.00351.x
Moltschaniwskyj N. A., Hall K. C. (In press a). “Octopus djinda, western rock octopus” in Octopus biology and ecology. Eds. Rosa R., Gleadall I. G., Pierce G., Villanueva G. R. (Cambridge, US: Academic Press).
Moltschaniwskyj N. A., Hall K. C. (In press b). “Octopus tetricus, gloomy octopus” in Octopus biology and ecology. Eds. Rosa R., Gleadall I. G., Pierce G., Villanueva G. R. (Cambridge, US: Academic Press).
Moreno A., Lourenço S., Pereira J., Gaspar M. B., Cabral H. N., Pierce G. J., et al. (2014). Essential habitats for pre-recruit octopus vulgaris along the Portuguese coast. Fish. Res. 152, 74–85. doi: 10.1016/j.fishres.2013.08.005
Moura É., Pimentel M., Santos C. P., Sampaio E., Pegado M. R., Lopes V. M., et al. (2019). Cuttlefish early development and behavior under future high CO2 conditions. Front. Physiol. 10. doi: 10.3389/fphys.2019.00975
Naimi B. (2015) USDM: Uncertainty analysis for species distribution models. r package version 1.1–15. Available at: http://www.documentation.org/packages/usdm.
Nguyen K. D. T., Morley S. A., Lai C.-H., Clark M. S., Tan K. S., Bates A. E., et al. (2011). Upper temperature limits of tropical marine ectotherms: Global warming implications. PloS One 6, e29340. doi: 10.1371/journal.pone.0029340
Norman M., Finn J., Hochberg F., Jereb P., Roper C. (2014). “Cephalopods of the world. an annotated and illustrated catalogue of cephalopod species known to date,” in Octopods and vampire squids., FAO species catalogue for fishery purposes, vol. Volume 3. (Rome: FAO).
O’Brien C. E., Bennice C. O., Leite T. (2021). A field guide to distinguishing Octopus insularis and Octopus americanus (Octopoda: Octopodidae). Zootaxa, 5060 (4), 589–594.
O’Dor R. K., Webber D. M. (1991). Invertebrate athletes: Trade-offs between transport efficiency and power density in cephalopod evolution. J. Exp. Biol. 160, 93–112. doi: 10.1242/jeb.160.1.93
Oesterwind D., Barrett C. J., Sell A. F., Núñez-Riboni I., Kloppmann M., Piatkowski U., et al. (2022). Climate change-related changes in cephalopod biodiversity on the north East Atlantic shelf. Biodivers. Conserv. 31, 1491–1518. doi: 10.1007/s10531-022-02403-y
Oosthuizen A., Jiwaji M., Shaw P. (2004). Genetic analysis of the octopus vulgaris population on the coast of south Africa. S. Afr. J. Sci. 100, 603–607. doi: 10.10520/EJC96180
Oosthuizen A., Smale M. J. (2003). Population biology of octopus vulgaris on the temperate south-eastern coast of south Africa. J. Mar. Biol. Assoc. U.K. 83, 535–541. doi: 10.1017/S0025315403007458h
Otjacques E., Repolho T., Paula J. R., Simão S., Baptista M., Rosa R. (2020). Cuttlefish buoyancy in response to food availability and ocean acidification. Biology 9, 147. doi: 10.3390/biology9070147
Pearman P. B., Guisan A., Broennimann O., Randin C. F. (2008). Niche dynamics in space and time. Trends Ecol. Evol. 23, 149–158. doi: 10.1016/j.tree.2007.11.005
Pecl G. T., Araújo M. B., Bell J. D., Blanchard J., Bonebrake T. C., Chen I.-C., et al. (2017). Biodiversity redistribution under climate change: Impacts on ecosystems and human well-being. Science 355, eaai9214. doi: 10.1126/science.aai9214
Pecl G. T., Jackson G. D. (2008). The potential impacts of climate change on inshore squid: biology, ecology and fisheries. Rev. Fish Biol. Fish. 4, 373–385. doi: 10.1007/s11160-007-9077-3
Peterson A., Soberón J. (2012). Species distribution modelling and ecological niche modeling: Getting the concepts right. Nat. Conserv. 10, 1–6. doi: 10.4322/natcon.2012.019
Pfenninger M., Schwenk K. (2007). Cryptic animal species are homogeneously distributed among taxa and biogeographical regions. BMC Evol. Biol. 7, 121. doi: 10.1186/1471-2148-7-121
Phillips S. J., Dudík M., Elith J., Graham C. H., Lehmann A., Leathwick J., et al. (2009). Sample selection bias and presence-only distribution models: Implications for background and pseudo-absence data. Ecol. Appl. 19, 181–197. doi: 10.1890/07-2153.1
Pita C., Roumbedakis K., Fonseca T., Matos F. L., Pereira J., Villasante S., et al. (2021). Fisheries for common octopus in Europe: Socioeconomic importance and management. Fish. Res. 235, 105820. doi: 10.1016/j.fishres.2020.105820
Poloczanska E. S., Brown C. J., Sydeman W. J., Kiessling W., Schoeman D. S., Moore P. J., et al. (2013). Global imprint of climate change on marine life. Nat. Clim. Change 3, 919–925. doi: 10.1038/nclimate1958
Ponce-Márquez M. A., Gamboa-Álvarez M. Á., Dela Rosa-Castillo J. E., López-Rocha J. A., Rosas C. (2020). Expansion of the geographical distribution of the Caribbean reef octopus (Octopus briareus) to the gulf of Mexico. Cienc Mar. 46, 177–184. doi: 10.7773/cm.v46i3.3133
Puerta P., Hunsicker M. E., Quetglas A., Álvarez-Berastegui D., Esteban A., González M., et al. (2015). Spatially explicit modeling reveals cephalopod distributions match contrasting trophic pathways in the Western Mediterranean Sea. PloS One 10, e0133439. doi: 10.1371/journal.pone.0133439
Quetglas A., Keller S., Massutí E. (2015). Can Mediterranean cephalopod stocks be managed at MSY by 2020? the Balearic islands as a case study. Fish. Manage. Ecol. 22, 349–358. doi: 10.1111/fme.12131
R Core Team (2022). R: A language and environment for statistical computing, Vienna, Austria: R Foundation for Statistical Computing). https://www.R-project.org/.
Radosavljevic A., Anderson R. P. (2014). Making better maxent models of species distributions: Complexity, overfitting and evaluation. J. Biogeogr. 41, 629–643. doi: 10.1111/jbi.12227
Raes N., ter Steege H. (2007). A null-model for significance testing of presence-only species distribution models. Ecography 30, 727–736. doi: 10.1111/j.2007.0906-7590.05041.x
Ramos J. E., Pecl G. T., Moltschaniwskyj N. A., Strugnell J. M., León R. I., Semmens J. M. (2014). Body size, growth and life span: Implications for the polewards range shift of octopus tetricus in south-Eastern Australia. PloS One 9, e103480. doi: 10.1371/journal.pone.0103480
Rees W. J. (1950). The distribution of octopus vulgaris lamarck in British waters. J. Mar. Biol. Assoc. U.K. 29, 361–378. doi: 10.1017/S0025315400055417
Rees W. J. (1956). Notes on the european species of eledone. Bull. Br. Mus. Nat. Hist. (D.) 3, 283–293.
Reid A. L., Wilson N. G. (2015). Octopuses of the kermadec islands: Discovery and description of a new member of the octopus ‘vulgaris’ complex (O. jollyorum, sp. nov.) and the first description of a male callistoctopus kermadecensis (Berry 1914). Bull. Auckland Museum 20, 349–368.
Repolho T., Baptista M., Pimentel M. S., Dionísio G., Trübenbach K., Lopes V. M., et al. (2014). Developmental and physiological challenges of octopus (Octopus vulgaris) early life stages under ocean warming. J. Comp. Physiol. B. 184, 55–64. doi: 10.1007/s00360-013-0783-y
Robertson W. D., South African Association for Marine Biological Research, D, Fielding, P.J, Oceanographic Research Inst., D (1997). “Transkei coastal fisheries resources,” in Phase 2: resource utilisation, development and tourism (Durban (South Africa: ORI).
Robson G. C. (1932). A monograph on the recent Cephalopoda I: The octopoda (London: British Museum (Natural History).
Rodhouse P. G. K., Pierce G. J., Nichols O. C., Sauer W. H. H., Arkhipkin A. I., Laptikhovsky V. V., et al. (2014). “Chapter two - environmental effects on cephalopod population dynamics: Implications for management of fisheries,” in Advances in marine biology, advances in cephalopod science: Biology, ecology, cultivation and fisheries. Ed. Vidal E. A. G. (Academic Press), 99–233. doi: 10.1016/B978-0-12-800287-2.00002-0
Roper C. F., Sweeney M. J., Nauen C. (1984). “Cephalopods of the world. an annotated and illustrated catalogue of species of interest to fisheries,” in FAO species catalogue for fishery purposes.
Rosa R., Lopes A., Pimentel M. S., Faleiro F., Baptista M., Trübenbach K., et al. (2014). Ocean’s cleaning stations under a changing climate: Biological responses of tropical and temperate fish-cleaner shrimps to global warming. Glob. Change Biol. 20, 3068–3079. doi: 10.1111/gcb.12621
Rosa R., Pimentel M. S., Boavida-Portugal J., Teixeira T., Trübenbach K., Diniz M. (2012). Ocean warming enhances malformations, premature hatching, metabolic suppression and oxidative stress in the early life stages of a keystone squid. PloS One 7, e38282. doi: 10.1371/journal.pone.0038282
Rosa R., Pissarra V., Borges F. O., Xavier J., Gleadall I. G., Golikov A., et al. (2019). Global patterns of species richness in coastal cephalopods. Front. Mar. Sci. 6. doi: 10.3389/fmars.2019.00469
Rosa R., Roura Á, Amor M., Gleadall I. G., Guerra Á., González Á. F., et al. (In Press) “Octopus vulgaris, common octopus,” in Octopus biology and ecology. Eds. Rosa R., Gleadall I. G., Pierce G., Villanueva G. R. (Cambridge, US: Academic Press).
Rosa R., Seibel B. A. (2008). Synergistic effects of climate-related variables suggest future physiological impairment in a top oceanic predator. Proc. Natl. Acad. Sci. U.S.A. 105, 20776–20780. doi: 10.1073/pnas.0806886105
Rosa R., Trübenbach K., Pimentel M. S., Boavida-Portugal J., Faleiro F., Baptista M., et al. (2014). Differential impacts of ocean acidification and warming on winter and summer progeny of a coastal squid (Loligo vulgaris). J. Exp. Biol. 217, 518–525. doi: 10.1242/jeb.096081
Rosa R., Trübenbach K., Repolho T., Pimentel M., Faleiro F., Boavida-Portugal J., et al. (2013). Lower hypoxia thresholds of cuttlefish early life stages living in a warm acidified ocean. Proc. R. Soc B 280, 20131695. doi: 10.1098/rspb.2013.1695
Sales J. B. L., Markaida U., Shaw P. W., Haimovici M., Ready J. S., Figueredo-Ready W. M. B., et al. (2014). Molecular phylogeny of the genus lolliguncula steenstrup 1881 based on nuclear and mitochondrial DNA sequences indicates genetic isolation of populations from north and south atlantic, and the possible presence of further cryptic species. PloS One 9, e88693. doi: 10.1371/journal.pone.0088693
Sampaio E., Santos C., Rosa I. C., Ferreira V., Pörtner H.-O., Duarte C. M., et al. (2021). Impacts of hypoxic events surpass those of future ocean warming and acidification. Nat. Ecol. Evol. 5, 311–321. doi: 10.1038/s41559-020-01370-3
Sánchez P., Villanueva R., Jereb P., Guerra A., González Á., Sobrino I., et al. (2015). “Octopus vulgaris,” in Cephalopod biology and fisheries in Europe: II. species accounts., ICES cooperative research report, rapport des recherches collectives (Denmark: ICES - International Council for the Exploration of the Sea),), 13–28.
Sauer W. H. H., Gleadall I. G., Downey-Breedt N., Doubleday Z., Gillespie G., Haimovici M., et al. (2021). World octopus fisheries. Rev. Fish. Sci. Aquac. 29, 279–429. doi: 10.1080/23308249.2019.1680603
Sbrocco E. J., Barber P. H. (2013). MARSPEC: Ocean climate layers for marine spatial ecology. Ecology 94, 979–979. doi: 10.1890/12-1358.1
Schickele A., Francour P., Raybaud V. (2021). European Cephalopods distribution under climate-change scenarios. Sci. Rep. 11, 3930. doi: 10.1038/s41598-021-83457-w
Schwalm C. R., Glendon S., Duffy P. B. (2020). RCP8.5 tracks cumulative CO2 emissions. Proc. Natl. Acad. Sci. U.S.A. 117, 19656–19657. doi: 10.1073/pnas.2007117117
Shipley B. R., Bach R., Do Y., Strathearn H., McGuire J. L., Dilkina B. (2022). megaSDM: Integrating dispersal and time-step analyses into species distribution models. Ecography. 2022 (1). doi: 10.1111/ecog.05450
Shukla P. R., Skeg J., Buendia E. C., Masson-Delmotte V., Pörtner H.-O., Roberts D. C., et al. (2019). Climate change and land: An IPCC special report on climate change, desertification, land degradation, sustainable land management, food security, and greenhouse gas fluxes in terrestrial ecosystems.
Sinclair S., White M., Newell G. (2010). How useful are species distribution models for managing biodiversity under future climates? Ecol. Soc 15, 13. doi: 10.5751/ES-03089-150108
Söller R., Warnke K., Saint-Paul U., Blohm D. (2000). Sequence divergence of mitochondrial DNA indicates cryptic biodiversity in octopus vulgaris and supports the taxonomic distinctiveness of octopus mimus (Cephalopoda: Octopodidae). Mar. Biol. 136, 29–35. doi: 10.1007/s002270050004
Sousa Reis C. (1985). Biologie et pêche d’Octopus vulgaris cuvier 1797, (Mollusque céphalopode) sur la côte sud du Portugal–aspects trophiques. Rapp. Commun. Inter. Mer Médit 29, 249–251.
Spreitzenbarth S., Andrew J. (2021). Temperature induced changes in the development of embryos and paralarvae of the merobenthic octopus, octopus tetricus. Aquaculture 538, 736547. doi: 10.1016/j.aquaculture.2021.736547
Stockwell D. R. B., Peterson A. T. (2002). “Controlling bias in biodiversity data,” in Predicting species occurrences: issues of scale and accuracy (Washington, DC: Island Press), 537–546.
Tewksbury J. J., Huey R. B., Deutsch C. A. (2008). Putting the heat on tropical animals. Science 320, 1296–1297. doi: 10.1126/science.1159328
Tyberghein L., Verbruggen H., Pauly K., Troupin C., Mineur F., De Clerck O. (2012). Bio-ORACLE: A global environmental dataset for marine species distribution modelling. Glob. Ecol. Biogeogr. 21, 272–281. doi: 10.1111/j.1466-8238.2011.00656.x
Varela S., Anderson R. P., García-Valdés R., Fernández-González F. (2014). Environmental filters reduce the effects of sampling bias and improve predictions of ecological niche models. Ecography 37, 1084–1091. doi: 10.1111/j.1600-0587.2013.00441.x
Warren D. L., Matzke N. J., Cardillo M., Baumgartner J. B., Beaumont L. J., Turelli M., et al. (2021). ENMTools 1.0: An r package for comparative ecological biogeography. Ecography 44, 504–511. doi: 10.1111/ecog.05485
Warton D. I., Blanchet F. G., O’Hara R. B., Ovaskainen O., Taskinen S., Walker S. C., et al. (2015). So many variables: Joint modeling in community ecology. Trends Ecol. Evol. 30, 766–779. doi: 10.1016/j.tree.2015.09.007
Xavier J. C., Peck L. S., Fretwell P., Turner J. (2016). Climate change and polar range expansions: Could cuttlefish cross the Arctic? Mar. Biol. 163, 78. doi: 10.1007/s00227-016-2850-x
Zanna L., Khatiwala S., Gregory J. M., Ison J., Heimbach P. (2019). Global reconstruction of historical ocean heat storage and transport. Proc. Natl. Acad. Sci. U.S.A. 116, 1126–1131. doi: 10.1073/pnas.1808838115
Keywords: biogeography, climate change, species distribution models, species complex, common octopus
Citation: Borges FO, Guerreiro M, Santos CP, Paula JR and Rosa R (2022) Projecting future climate change impacts on the distribution of the ‘Octopus vulgaris species complex’. Front. Mar. Sci. 9:1018766. doi: 10.3389/fmars.2022.1018766
Received: 13 August 2022; Accepted: 14 November 2022;
Published: 30 November 2022.
Edited by:
Jin Sun, Ocean University of China, ChinaReviewed by:
Françoise Lima, University of the Azores, PortugalCarlos Rosas, National Autonomous University of Mexico, Mexico
Daniel Oesterwind, Thünen-Institut, Germany
Tatiana Silva Leite, Federal University of Santa Catarina, Brazil
Copyright © 2022 Borges, Guerreiro, Santos, Paula and Rosa. This is an open-access article distributed under the terms of the Creative Commons Attribution License (CC BY). The use, distribution or reproduction in other forums is permitted, provided the original author(s) and the copyright owner(s) are credited and that the original publication in this journal is cited, in accordance with accepted academic practice. No use, distribution or reproduction is permitted which does not comply with these terms.
*Correspondence: Francisco Oliveira Borges, fdborges@fc.ul.pt