A framework for a net environmental benefit analysis based comparative assessment of decommissioning options for anthropogenic subsea structures: A North Sea case study
 Joseph P. Nicolette1*
  Nicholas A. Nelson1
  Michael K. Rockel1 Mark L. Rockel1 Alex N. Testoff1 Larry L. Johnson2
  Laura D. Williamson3,4
  Victoria L. G. Todd3,4
- 1Montrose Environmental Solutions, Inc., Sandy Springs, Georgia, GA, United States
- 2Global Decommissioning Advisor, Former Oil and Gas Operator, Florida, FL, United States
- 3Ocean Science Consulting Limited., Scotland, United Kingdom
- 4Environmental Research Institute, University of the Highlands & Islands, Thurso, United Kingdom
Taxpayers and operators worldwide have significant current liabilities associated with decommissioning of offshore Oil & Gas (O&G) assets. Consequently, decommissioning is at the forefront of industrial, governmental, and non-governmental agendas. Decommissioning is a highly complex activity with health, safety, environmental, social, economic, and technical implications. Increasing scientific evidence supports that manmade subsea structures create hard, artificial reef habitats that provide ecological and social benefits to society. Given the significant uncertainty regarding how subsea structures should be retired at the end of their operational lifetimes, it is necessary for governments, taxpayers, and operators to understand the risks and benefits associated with potential decommissioning options. Currently, the North Sea decommissioning process is based on the policies and direction of the Oslo and Paris Convention’s (OSPAR) Decision 98/3 and follow comparative assessment (CA) multiple-criteria decision analysis (MCDA) guidelines to determine the best overall strategy for decommissioning subsea structures; however, CA MCDA processes can be biased, ambiguous, difficult to use, interpret, and replicate, and limited in their consideration of multigenerational benefits. Consequently, to assist decision-makers in understanding and evaluating options and associated benefits for decommissioning subsea structures, this study adapted the net environmental benefit analysis (NEBA) framework to supplement and strengthen the CA process for evaluating decommissioning options for offshore O&G facilities. The net environmental benefit analysis based comparative assessment (NEBA-CA) framework is presented that addresses the growing need for a practical, quantitative, scientifically robust, defendable, and transparent MCDA approach to determine optimized decommissioning strategies for subsea assets. Increased transparency in CAs will provide an additional layer of credibility with regulators and society. The approach is data driven and a desktop analysis mainly relying on existing data. Using a North Sea case study, this work demonstrates the ability of NEBA-CA to resolve inherent complexity in comparing decommissioning options, thereby supporting operators in working with regulators to decommission assets in a way that maximizes ecosystem service benefits to society while managing site-related risks and costs. The NEBA-CA framework supplements and strengthens the standard CA process by 1) incorporating quantified metrics including multigenerational ecosystem service benefits and risks, 2) excluding front ranking (scoring) or weighting of metrics, and 3) providing consistent graphical displays to support visual differentiation of options and metrics.
1 Introduction
As of the end of 2020, there were at least 6,000 fixed or floating Oil & Gas (O&G) platforms in operation globally (Gourvenec, 2018). Between 2017 and 2030, a global estimated annual average of 100 offshore O&G assets will require decommissioning. The annual average is expected to rise to 150 assets between 2031 and 2040 (IEA, 2019b). The majority of these assets will necessitate complete removal under current global regulations with an associated cost in the hundreds of billions (USD) to 2040 (Gourvenec et al., 2022). With nearly 800 platforms operating in the North Sea as of 2016 (Todd et al., 2016), cumulative expenditure estimates for decommissioning in the United Kingdom (UK) range from £40 billion to more than £66 billion over the next 40 years (O&G UK, 2021). Consequently, decommissioning is at the forefront of industrial, governmental, and non-governmental agendas, acknowledging that removal is a highly complex activity with health, safety, environmental, social, economic, and technical implications.
Recent peer-reviewed independent scientific and regulatory processes for decommissioning decision-making for subsea structures worldwide have not only revealed significant uncertainty associated with how subsea structures should be decommissioned, but also overlooked the potential benefits subsea infrastructure may provide to society, marine stakeholders, and the environment (Fowler et al., 2018; IOGP, 2022). This paper presents a practical, quantitative, scientifically robust, defendable, and transparent multiple-criteria decision analysis (MCDA) framework to support optimized decommissioning strategies for subsea assets.
1.1 Decommissioning planning and comparative assessment
Operator “end-of-life” decommissioning plans identify specific options for subsea structures within a field. Subsea structures comprise a myriad of components, such as inter alia, platform jackets, production flowlines and bundles, risers and riser turrets, towheads, wellheads and associated protection units, production manifolds, umbilicals, pipeline end manifolds, concrete mattresses, mooring anchors, and chains.
In the context of offshore decommissioning, a comparative assessment process was first referenced within the Oslo and Paris Convention's (OSPAR) policies and directions (OSPAR, 1998) with respect to assets designated as candidates for derogation based on a variety of specific considerations. The term comparative assessment (CA) is used to describe the general process used to evaluate decommissioning options and identify proposed options. Guidelines for implementing CAs have been published by O&G UK (2015) and the Department of Energy and Climate Change (DECC) [Offshore Petroleum Regulator for Environment & Decommissioning (OPRED), 2018], both of which satisfy OSPAR’s regulatory requirements for CA, including cases of derogation. No detailed procedures for the CA process are prescribed in OSPAR Decision 98/3, O&G UK guidance, or DECC guidance (OSPAR, 1998; O&G UK, 2015; OPRED, 2018). To determine proposed decommissioning options for subsea structures, CAs typically consider the following five factors: health and safety, environmental, social, technical feasibility, and economic impacts associated with the implementation of various decommissioning options (O&G UK 2015; DMIRS, 2017; OPRED, 2018; IOGP, 2022).
1.2 Comparative assessment and evaluation
In general, decommissioning processes and CA protocols include both qualitative and quantitative analyses with front grouping, ranking (or scoring), and/or weighting schemes for parameter evaluation. For example, O&G UK proposed three evaluation methods where qualitative and/or quantitative data for each option are grouped into simple classes by color and/or numerical scores (O&G UK 2015). Depending on which of the three evaluation methods is used, the evaluation may include weighting of the scored data (O&G UK 2015). In the subsequent OPRED guidelines, the effects of decommissioning options on the five main factors were ranked on a scale of low to medium to high and assigned a correlating color of green, amber and red, respectively (OPRED, 2018).
However, the current CA techniques have several disadvantages:
1. Guidance is vague: Although the CA process is referenced within decommissioning guidelines from multiple geographical locales (O&G UK 2015; Petroleum Safety Authority, 2020; APPEA, 2016; NOPSEMA, 2018; OPRED, 2018; ANP, 2020; Government of New Zealand, 2021; UNEP/MED, 2022; Petroleum Institute of Thailand, 2008), guidance available is arcane, obscure, and non-standardized, leading to ambiguity associated with varying methods, analysis techniques, presentations, interpretations, conclusions, and data transparency, even between similar projects spanning across geographical and regulatory boundaries (O&G UK 2015; DMIRS, 2017; OPRED, 2018);
2. Insufficient rigor: Empirical data are often analyzed and presented in a qualitative, unrepeatable, and non-scientifically robust manner, challenging independent scientific peer-review, thereby diminishing their value to stakeholders;
3. Reduced transparency: Given the multiple layering of metrics and risk evaluations that define an option within CA approaches, results can increase the overall subjectivity of metric comparisons between options, which can lead to reduced transparency and ambiguity in how results were derived;
4. Qualitative data lumping where differences obscured: Multiple options may be identified as having the same color and/or ranking, which indicates that there are no disparities between these options, even though the metric values may be different;
5. Potential to introduce stakeholder bias: CA approaches have potential to, inter alia, bias stakeholders participating in the weighting and ranking exercise and can also obscure quantitative differences when data are grouped into rankings (i.e., become increasingly subjective with each layer of weights and ranks);
6. Ecological and social benefits understated: CA approaches often tend to focus on option risks over benefits; that is, within the standard CA evaluation process, the incorporation of multigenerational benefits, also known as intergenerational benefits (Nicolette et al., 2013a), appears limited; and,
7. Ineffective presentation of results: CA results have been presented in a variety of non-standardized and inconsistent graphical displays that can be confusing to regulators.
Fortunately, operators are obliged to release CAs into the public domain (such as British Petroleum, 2011; CNR International, 2012; Shell International Petroleum, 2017; Spirit Energy, 2018; INEOS, 2021; Ithaca Energy Group, 2021; and Xodus Group, 2021). This enables stakeholders to familiarize themselves with the CA process. Nonetheless, disadvantages of the CA process have the potential to generate significant uncertainty and incorrect inferences by stakeholders. This could lead to the identification of inaccurate quantitative metric data differences or scoring between options, rendering the time-consuming and costly CA exercises of little value to society.
As part of the decommissioning planning process, a CA approach that limits subjectivity, increases transparency, incorporates multigenerational benefits and risks, focuses on quantitative analysis, and provides a consistent and systematic approach to option evaluation, with readily comparable data displays, is needed. This study presents a framework for supplementing and strengthening the standard CA process including incorporation of a risk management approach to support decision-making. Additionally, a North Sea case study is used to demonstrate the application and results of the net environmental benefit analysis based comparative assessment (NEBA-CA) framework applied to an offshore jacket, including resulting graphics and risk management approach.
1.3 NEBA background
Net environmental benefit analysis (NEBA) is a risk-benefit approach for comparing the net environmental benefits and risks between competing management actions. Management actions include a wide variety of actions that affect the environment, such as restoration, remediation, conservation, and development. The first formalized NEBA framework (Efroymson et al., 2003; Efroymson et al., 2004) is recognized, inter alia, by the United States Environmental Protection Agency (USEPA), the USEPA Science Advisory Board (USEPA SAB, 2009), and the National Oceanic and Atmospheric Administration (NOAA, 2011) for its value in providing a defendable basis for environmental decision-making. Net environmental benefits are gains in the value of environmental services or other ecological properties attained by an action(s) minus the value of the adverse environmental effects caused by the action(s) (Efroymson et al., 2004). Thus, NEBA considers the overall impact, positive or negative, of proposed or implemented actions(s) and manages site risks.
Efroymson et al. (2004) noted that NEBA is an extension or elaboration of ecological risk assessment (USEPA, 1997). They identified that the key difference between the two processes was the consideration of environmental benefits in NEBA, which were not incorporated in traditional risk assessments. Gradually, NEBA evolved to include, inter alia, ecological services and the social and economic benefits derived from the presence of ecological services (Nicolette et al., 2013a), jointly known as ecosystem services (Millennium Ecosystem Assessment, 2005).
Efroymson et al. (2004) summarized the major advantages of NEBA in supporting management decisions.
“The NEBA framework should be useful when the balance of risks and benefits from an action at a site is ambiguous. That ambiguity arises when the site retains significant ecological value; when the actions are themselves environmentally damaging; when the ecological risks from the in-situ condition are relatively small, uncertain, or limited to a component of the ecosystem.”
In the context of offshore decommissioning, the NEBA framework directly addresses the ambiguity that can arise when making decisions regarding the selection of appropriate decommissioning options. Ambiguity associated with decommissioning option decision-making arises because recent evidence suggests that subsea structure has a beneficial consequence: the creation of hard-structure habitat areas that support benthos, fish, and marine mammals that in turn, provide a variety of ecological and social benefits to society (Fowler and Booth, 2012; Claisse et al., 2014; Todd et al., 2021; McLean et al., 2022; Todd et al., 2022a). These habitats contribute to human well-being by providing passive use values such as existence, bequest, and aesthetic values, as well as active use values such as recreational fishing, commercial fishing, diving, photography, and scientific research. The provision of specific ecosystem services is site dependent. It stands to reason that these benefits will be provided by the infrastructure for as long as it is in place (i.e., centuries), establishing multigenerational value (Kenter et al., 2013).
To assist decision makers in understanding and evaluating options and associated benefits for decommissioning subsea structures, we adapted the NEBA framework (Efroymson et al., 2004) to supplement and strengthen the CA process for evaluating decommissioning options for offshore O&G assets. The framework is based on international experience with NEBA-based comparative assessment studies integrating ecosystem service values, site data, and readily available scientific information at sites in Australia, California, Caribbean, Gulf of Mexico, Gulf of Thailand, and the North Sea. The developed framework is holistic in that it considers environmental, social, health and safety, technical feasibility, and economic factors, including the multigenerational benefits and risks associated with option implementation.
2 The NEBA-based comparative assessment framework
The NEBA-based CA (NEBA-CA) framework presented herein is a MCDA approach with which the potential range of offshore decommissioning options for a given field can be compared (IOGP, 2022). The NEBA-CA is focused on option selection through an analysis of the trade-offs between benefits and risks and involves comparison of several management options that may include: (1) leaving the structure in place, (2) physically removing the structure, (3) partially removing the structure, (4) improving ecological value through onsite and offsite restoration options (e.g., rigs-to-reefs, creation of designated reefing areas, and in-situ management); or (5) a combination of these options.
The NEBA-CA framework supplements and strengthens the standard CA process by 1) incorporating quantified metrics including multigenerational ecosystem service benefits and risks, 2) excluding front ranking (scoring) or weighting of metrics, and 3) providing consistent graphical displays to support visual differentiation of options and metrics.
Incorporating quantified multigenerational ecosystem service benefits and risks - Incorporating formally quantified benefit and risk metrics, including the time frame over which these benefits and risks would be impacted (i.e., multigenerational or the duration of the decommissioning campaign, depending upon the metric being evaluated), provides decision-makers with an opportunity to make informed choices about the net benefits of decommissioning options that affect the environment. Informed decisions are systematic, transparent, understandable to stakeholders, non-arbitrary, scientifically-based and defendable, quantitative in nature (where possible), based on internationally recognized concepts and approaches, and considerate of stakeholder concerns.
Additionally, multigenerational value is important because future generations are unable to participate in decisions that will affect them and thus, they cannot defend their interests in the current decision-making process, even though present decisions can have irreversible impacts on their welfare. Correction for multigenerational valuation issues to capture potential irreversible wealth/benefit transfers between generations can be accomplished using a discount rate that gives more weight to future generations’ preferences (Lowe, 2008). The discount rate reflects the time preference that society has to receive benefits sooner rather than later (Lowe, 2008).
Excluding front ranking or weighting of metrics - NEBA-CA quantified values for options analyzed are graphically displayed in relation to one another, providing a level of objectivity and transparency to stakeholders for the initial evaluation of the data. Weighting of select quantified metrics, where it is determined necessary, can be integrated into NEBA-CA once the original data graphics are produced. Weighting various metrics at this latter stage, once the quantified data are final and evaluated by key stakeholders, ensures increased transparency. It is important that all stakeholders are represented should latter weighting or ranking be conducted.
Objective graphical displays - NEBA-CA provides objective graphics that allow for benefits, losses, and risks for all metrics to be displayed in a manner that can be readily ascertained by the viewer, thereby increasing their confidence in the outcome.
The NEBA-CA framework for offshore decommissioning consists of the following components (Figure 1):
• Analysis Planning
• Options Analysis and Graphics
• Risk Management Decision-Making
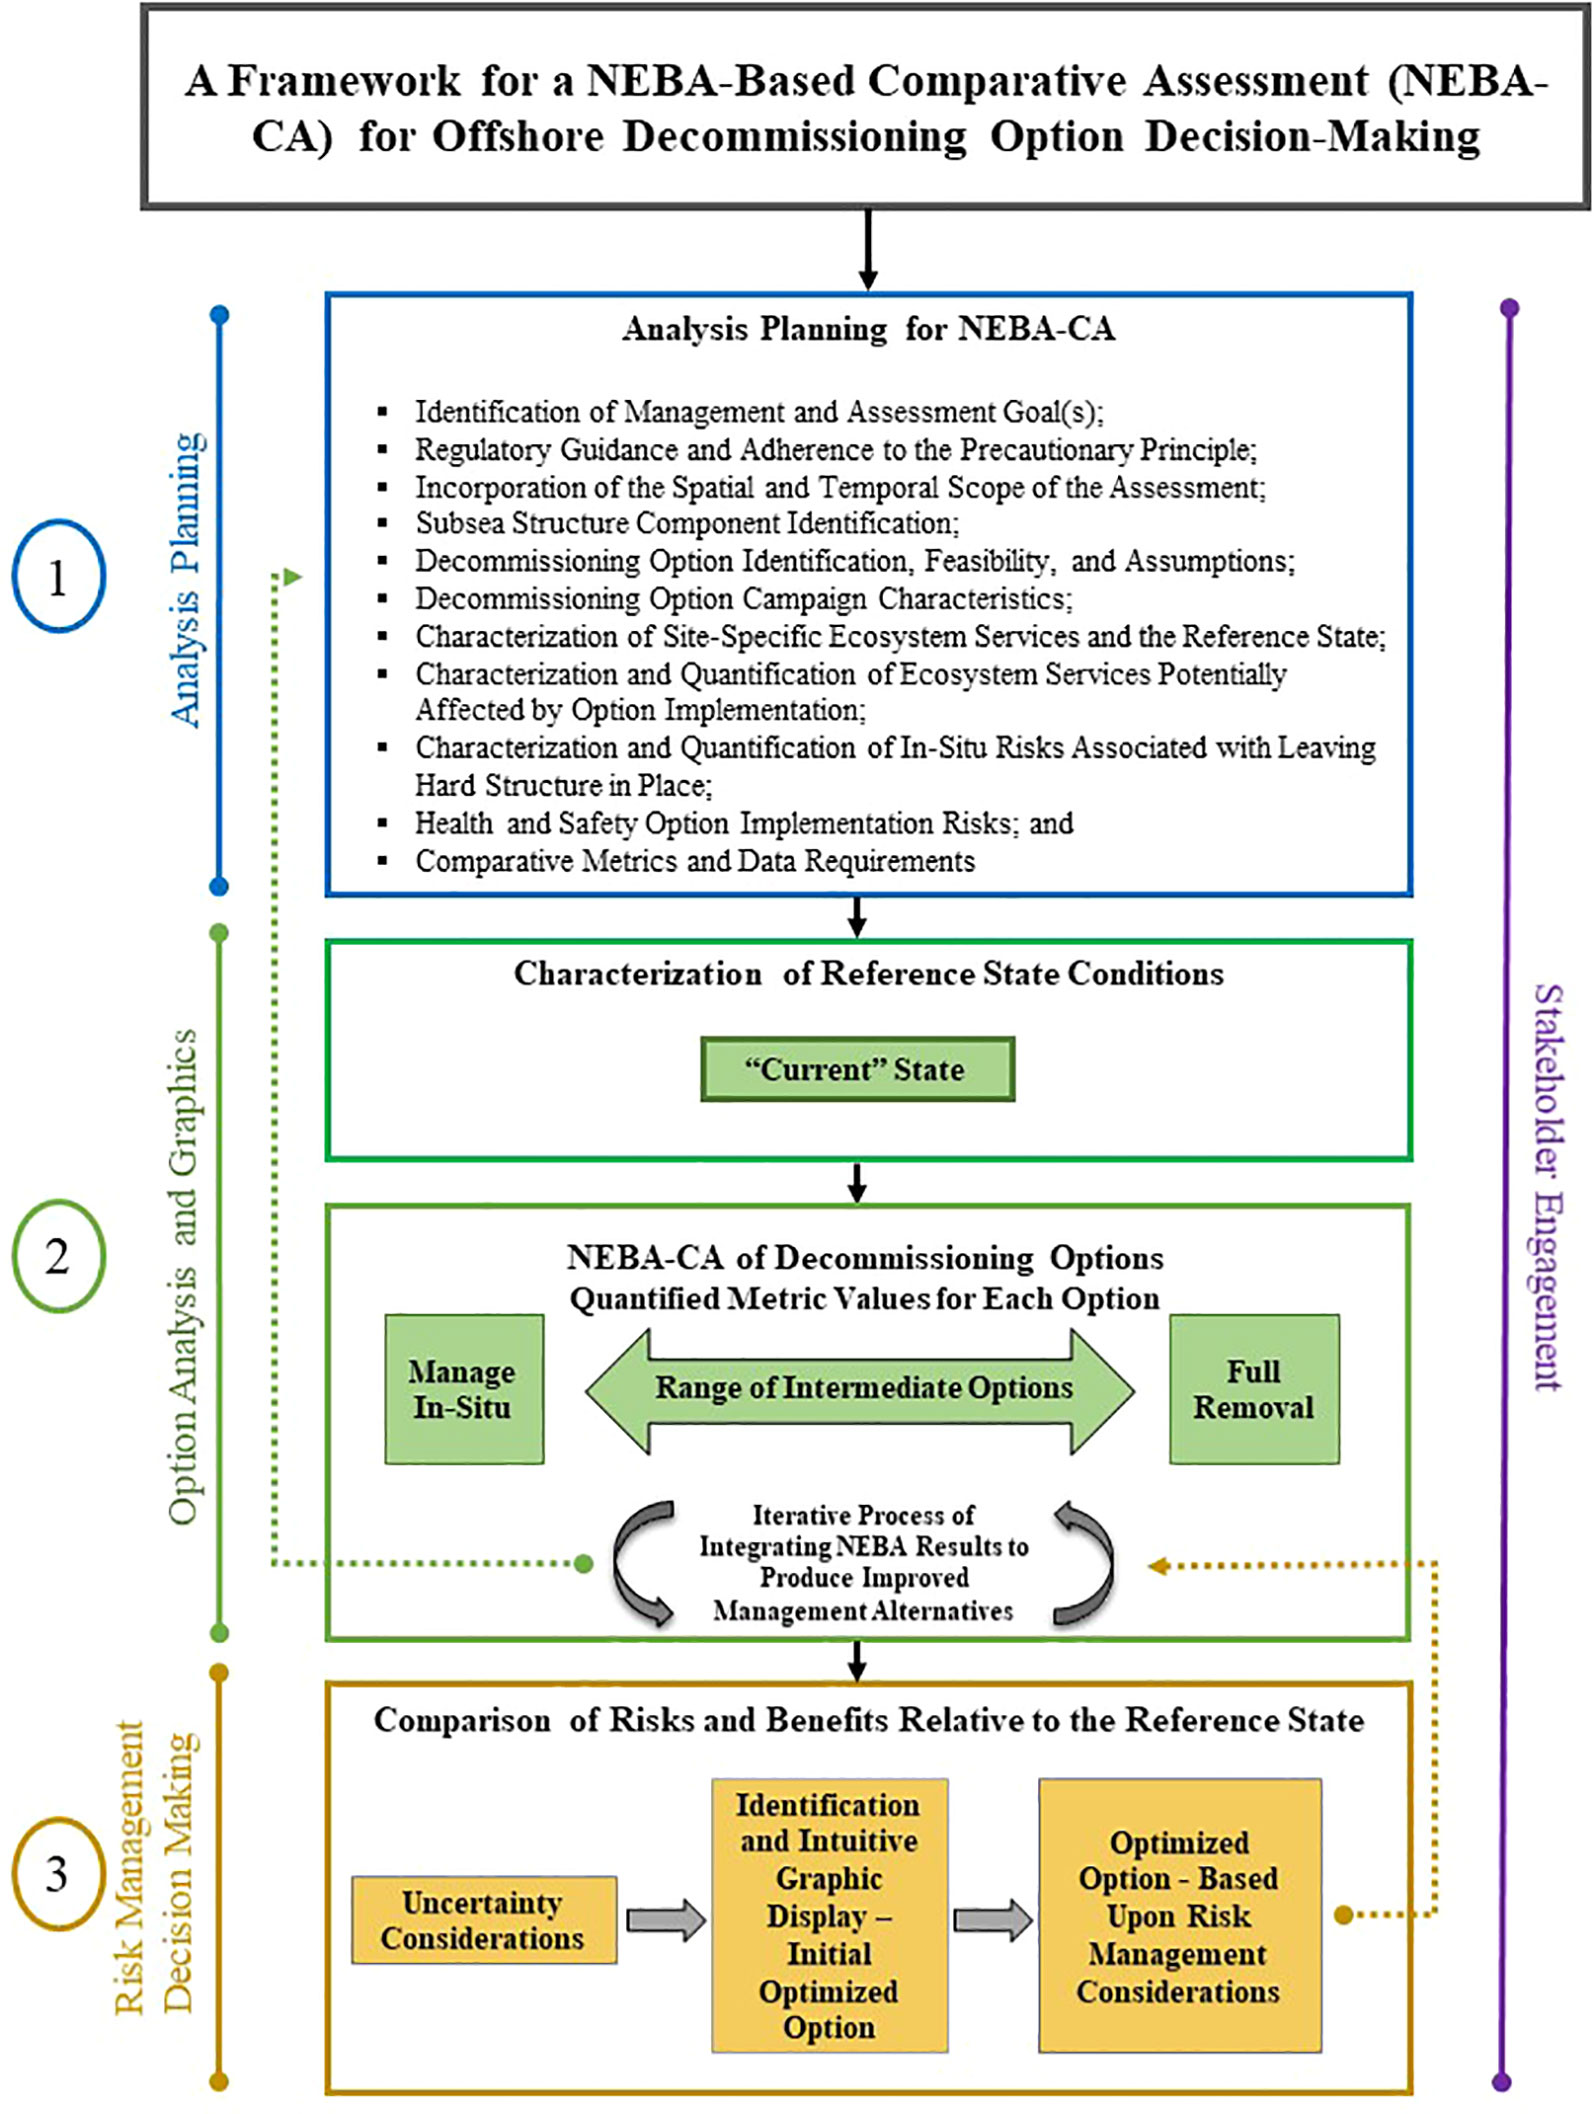
Figure 1 The NEBA-CA Framework for Offshore Decommissioning Option Selection.
It should be noted that long-term monitoring, in some form, may be required by the local regulatory authority should any assets remain in place. While potential monitoring is not addressed in this framework, monitoring typically does not alter the optimum benefit versus detriment outcome. Each of the above-mentioned components are described in the following sections.
2.1 Analysis planning
Analysis planning in NEBA-CA is comparable to the planning and problem formulation aspects of risk assessment (USEPA, 1997) and NEBA (Efroymson et al., 2004). Analysis planning outlines the scope of the work to be conducted to compare alternative decommissioning actions. Analysis planning provides for the upfront development of the assessment to identify those environmental services, properties, or potential risks of concern, as well as the methods and metrics by which those services, properties, or risks will be measured. Analysis planning for NEBA-CA for offshore decommissioning includes the following considerations (Figure 1):
• Identification of Management and Assessment Goal(s);
• Regulatory Guidance and Consistency with the Precautionary Principle;
• Incorporation of the Spatial and Temporal Scope of the Assessment;
• Subsea Structure Component Identification;
• Decommissioning Option Identification, Feasibility, and Assumptions;
• Decommissioning Option Campaign Characteristics;
• Characterization of Site-Specific Ecosystem Services and the Reference State;
•Characterization and Quantification of Ecosystem Services Potentially Affected by Option Implementation;
• Characterization and Quantification of In-Situ Risks Associated with Leaving Hard Structure in Place;
• Health and Safety Option Implementation Risks; and
• Comparative Metrics and Data Requirements
2.1.1 Management and assessment goal(s)
The overarching management goal of a NEBA-CA is to provide a scientifically defendable, transparent, non-arbitrary, and systematic approach for evaluating decommissioning options in support of decision-making that maximizes short-term and multigenerational ecosystem service benefits to society while managing site and implementation risks. NEBA-CA supports the understanding of the net ecosystem service benefits and risks (ecological, human use, and economic) between competing decommissioning alternatives to support an overall risk-benefit analysis so that operators, regulators, and other stakeholders can make informed decisions regarding a preferred decommissioning program.
2.1.2 Regulatory guidance and consistency with the precautionary principle
As part of the planning process and in pursuit of management goal(s) identified, NEBA-CA considers decommissioning options in terms of health and safety, environmental, societal, technical, and economic considerations, as generally required by current CA guidance (OSPAR, 1998; O&G UK 2015; OPRED, 2018). Additionally, NEBA-CA’s inclusion of multigenerational ecosystem services addresses the essence of sustainable development by quantitatively assessing the impact of actions taken today on future generations and their ability to meet their needs (Brundtland, 1987).
2.1.2.1 Consistency with the precautionary principle
The precautionary principle of risk management implies that if an action or policy has a suspected risk of causing harm to the public or environment, in the absence of scientific consensus (that the action or policy is not harmful), the burden of proof that it is not harmful falls on those taking that action. The precautionary principle encourages policies that protect human health and the environment in the face of uncertain risks and is meant to ensure that the societal good is represented. Adherence to the precautionary principle is a key component of decommissioning under the OSPAR (Raffensperger and Tickner, 1999). Additionally, the 1992 treaty that created the European Union (EU) made the precautionary principle the foundation of EU environmental policy (Article 130R) (European Commission, 1992).
Because ongoing research has identified a variety of ecosystem service benefits provided by subsea infrastructure, options to decommission and remove subsea structures should be evaluated, on a case by case basis, because these actions have the potential to create a plausible risk to these ecosystem service benefits. These risks include potential significant (and possibly irreversible) adverse effects on fish stock protection and abundance, which further relate to potential adverse effects to commercial fishing, marine mammals and prey abundance, and protection of species of special concern (e.g., endangered species), all of which can adversely affect future generations. The NEBA-CA satisfies the precautionary principle in that it supports a transparent, quantitative, and scientifically defendable approach for environmental decision-making and ensures that the societal good is represented in decisions made under scientific uncertainty where ambiguity exists.
The applicability and consistency of the NEBA-CA framework with select International, European, and UK decommissioning guidance and legislation are presented in Supplementary Table 1. A NEBA-CA should be conducted irrespective of constraints associated with aged regulations (e.g., OSPAR 98/3), especially where these regulations did not have the benefit of our current knowledge regarding the potential multigenerational ecological, social, and economic benefits of subsea structures.
2.1.3 Incorporation of the spatial and temporal scope of the assessment
2.1.3.1 Spatial
It is important to determine the spatial and temporal scales over which the analysis will be conducted before one can begin to understand the environmental benefits or impacts. The spatial scale of a NEBA-CA is dependent on the assets to be evaluated and their locations within the field. A NEBA-CA can be conducted for a specific component (e.g., a jacket) or developed to address all assets and types of subsea structures within a field. Spatially, the analysis focuses on the assets themselves and the areas over which they influence the local ecology. The analysis also considers areas outside the influence of the structures for comparison purposes. As an example, Claisse et al. (2014) estimated that secondary fish production near O&G platforms off the California coast was 18 to 150 times greater than that of nearby soft-bottom habitats.
2.1.3.2 Temporal
Removal of subsea structure can immediately remove habitat and its associated ecosystem, which would have been predicted to provide ecological and socioeconomic value for multiple generations (i.e., centuries) into the future. Thus, the analysis of options must consider the predicted multigenerational timeframe over which ecological and socioeconomic benefits and risks would be influenced by the implementation of the options. Understanding component degradation rates supports an understanding of predicted multigenerational timeframes associated with structure left in-situ.
2.1.3.3 Degradation rates
Degradation rates can be used to estimate the period over which benefits (i.e., presence of hard structure and associated ecological value) and risks (navigation, trawling, potential contaminant releases, etc.) would be projected to occur. For example, carbon steel is commonly used in the construction of fixed production jackets in the North Sea. Although jackets are built to last, the structure will eventually oxidise and corrode in the seawater (O&G UK, 2013). Corrosion rates and cathodic protection information can be used to approximate the longevity of a structure in place (O&G UK, 2013).The corrosion rate depends on a variety of factors such as: protective structures, depth, temperature, salinity, pH, flow, pressure, and fouling (O&G UK, 2013). O&G UK (2013) presented a general rate of corrosion for carbon steel in the North Sea on the exterior (5-10mm/century) and interior (1-2mm/century), not accounting for cathodic protection.
As there is some uncertainty as to predicting future conditions over multiple generations, conservative and internally consistent assumptions can be made within NEBA-CA for the purposes of differentiating between options (Section 4).
2.1.4 subsea structure component identification
As presented earlier, subsea structures are comprised of many types of components of varying sizes and materials. In developing the subsea structure list, physical parameters by component should be developed to consider the composition (steel, plastics, coatings, etc.), structural dimensions (hard structural surface area (m2) and volume/complexity), water depth, and structure weight (t). These data will support the estimation of available habitat structure, environmental health and safety risks, and greenhouse gas emissions required for component lifts and/or transport associated with each option.
Plastics, coatings, and potential contaminants (e.g., mercury, naturally occurring radioactive material (NORM), and residual hydrocarbons) present on/in each component should also be identified along with the volume, type/composition, thickness, and/or extent on/in the structure. These data support the ecological and human health risk evaluation associated with component degradation and potential contaminant releases into the environment.
2.1.4.1 Halo effect area
Along with the understanding of the physical characteristics of the subsea structures, the analysis should also consider the physical condition of the sea bottom under and near the structure. O&G offshore facilities are known to enhance surrounding benthic communities by altering flow patterns and subsequent deposition of organic matter (Wolfson et al., 1979; Todd et al., 2018; Todd et al., 2021). The increased input of organic matter to the benthic community, creates a “halo” effect (also known of as a “shadow” or “umbrella” area) surrounding the structures, resulting in an affected area that can be 15 times larger than the structure by itself (Reeds et al., 2018). “Halo” areas in shallower water environments can be found at large distances from the subsea structures and while these distances are not known for deep water environments, an area of altered habitat that is two–to-four times the area of the structure is not unlikely. Thus, removal of subsea structures and their “reef” inhabitants will not only directly impact the reef communities but will also influence the altered benthic communities adjacent to the artificial reef that has been created by the subsea structure. Thus, aside from the subsea structures to be considered, the effect of decommissioning options on the “halo” effect area should also be incorporated into the NEBA-CA.
2.1.5 Decommissioning option identification, feasibility, and assumptions
2.1.5.1 Option identification
Decommissioning options to be evaluated for each structure group should be identified. Both in-situ and implementation risks and benefits for each option will be compared. Various decommissioning options can be developed for each structure within a given field. Similar structures (i.e., structural groups) are likely to have similar options. The identified options should range from a no-action option to a full-removal option and include potential intermediate options.
Full removal involves complete removal of the component. For jackets, full removal likely requires cutting footings below the mudline. It should be noted that to cut the footings below the mudline, it may be necessary to remove surrounding sediments/drill cuttings piles to a depth of several meters, so that the cutting tool can maneuver to make the cut; therefore, it is necessary to understand the ramifications of full removal in terms of sediment disturbance in relation to the cuttings pile(s) and the potential to release contaminants, if any, that may be present in the cuttings pile sediments into the environment. Additionally, cuttings piles may extend vertically upward and cover cross braces within a jacket. Removal of the lower portions of a jacket may also have the potential to disturb cuttings piles and release potential contaminants into the environment, if any are present in the cuttings pile. In some cases, the shell hash layer that covers cuttings piles has been shown to entomb potential contaminants (Gala et al., 2008).
Additionally, various intermediate options may be developed within the bounds of the no-action and full removal options. These include the partial removal of the structure where the removed portion is transported to the shore for recycling, reefed in-place, or transported to a designated reefing location. For example, partial removal options for a jacket could include toppling the jacket (with or without conductors and/or the topside) or cutting sections of the jacket at various depths, and either placing cut portions near the base of the jacket or removing cut portions to a recycling facility.
2.1.5.2 Exclusion zones
Option selection and evaluation should consider the potential to remove or maintain the existing exclusion zone (Nelson et al., 2022). No-action options can include both a “Leave-In-Place” option (LIP), referring to leaving the structure in-place, in whole or in part, without an exclusion zone, or a “Protect-in-Place” option (PIP) that refers to leaving the structure in-place, in whole or in part, while retaining the exclusion zone. Exclusion zones protect the habitat, along with the associated ecosystem benefits, that have developed around the subsea structure, or portions thereof, by limiting the intrusion of trawling gear into the developed ecosystem. The adverse physical impacts of trawl fishing on the sea bottom, as well as the impacts of incidental bycatch, have been well documented (Daan et al., 2005; Mannocci et al., 2012; Eigaard et al., 2017). Bycatch, in the fishing industry, is a fish or other marine species that is caught unintentionally while catching certain target species and target sizes of fish, crabs etc.
Exclusion zones also assist in managing navigation and trawling risks by limiting the vessel traffic within the exclusion zone. The exclusion of commercial fishing within the 500 m exclusion zone around each installation in the North Sea is regarded as “further enhancing the properties of these reefs as refuges for marine life” (Todd et al., 2009). Owing to these fishing restrictions, offshore oil platforms have served as de facto marine protected areas (MPAs) for years (Fujii and Jamieson, 2016), allowing for high colonization rates of fish and benthic invertebrates on large steel structures throughout the water column (Bell & Smith, 1999; Roberts, 2002; Soldal et al., 2002). These benefits may increase the carrying capacity of fish in the North Sea, similar to that observed in the Gulf of Mexico (Scarborough-Bull et al., 2008). Thus, the removal of offshore structures and associated exclusion zones should be considered and incorporated into any fisheries management plan because the removal of these structures has the potential to cause ecological and economic impacts (Scarborough-Bull et al., 2008).
2.1.5.1 Technical feasibility and option assumptions
When selecting potential decommissioning options, it is important to understand the technical feasibility of the proposed options and document why certain options, including their assumptions, are selected or rejected for evaluation. While considering and evaluating decommissioning options, adaptive management of the options can be used to adjust existing options or introduce new decommissioning options into the analysis for consideration on an iterative basis.
2.1.6 Decommissioning option campaign characteristics
For each identified decommissioning option, it is necessary to define the characteristics of the decommissioning campaign necessary to implement each option. This information includes the type of vessels to be used, fuel types burned, personnel tasks and associated manhours expected for each task (onshore and offshore), weight of the structure to be transported, distances to be travelled, and outgoing and receiving port locations. This information will be used to support the development of multiple metric values, including health and safety risks (onshore and offshore), greenhouse gas emissions, and the estimated costs of option implementation. Implementation campaign characteristics should consider the synergies between tasks for all subsea structures in the field. Campaign characteristics, and associated costs for option implementation, are typically developed by the operator.
2.1.7 Characterization of site-specific ecosystem services and the reference state
To understand the potential positive or negative effects associated with the implementation of various decommissioning options, it is imperative to identify the key ecosystem services associated with the structure in its “current condition”. Analysis planning should clearly identify the condition that will serve as the “reference” state from which changes in metric values will be measured. Since decommissioning actions (e.g., removal, partial removal) proposed as part of the decommissioning program may affect the current “in-situ” condition of ecosystem services, the “reference state” should represent the “current condition,” and metrics adjusted appropriately in relation to this condition. Thus, an understanding of the reference state requires an understanding of the marine ecosystem that has developed in relation to the presence of subsea structure(s) under current conditions and its level of maturity. These ecosystem services include both ecological and socioeconomic services. Ecological services include, inter alia, benthic invertebrate and fish production and nursery areas; provisioning of food resources for benthos, fish, and marine mammals; and refuge areas for fish. Socio-economic services include, inter alia, multigenerational production and harvest of commercial and recreational fish stocks, long-term fish stock protection, and provision of existence and bequest value of species of special significance. Socioeconomic services exist because the habitat exists. Thus, actions that affect habitats have the potential to affect the flow of socioeconomic values.
2.1.8 Characterization and quantification of ecosystem services potentially affected by option implementation
Once site-specific ecosystem services have been identified, the next step is to determine which of these services may benefit or be adversely impacted through the implementation of each decommissioning option. In the context of a NEBA-CA, ecosystem service impacts associated with option implementation refer to the impacts that are predicted to arise from the implementation of the options being analyzed and include the following:
• Ecological impacts associated with physical changes of habitat (e.g., removal, partial removal);
• Ecological risks associated with chemical/polymer short and long-term exposure (e.g., NORM, mercury, PAHs, plastics);
• Risks to socioeconomic active and passive use values associated with the above-mentioned ecological risks; and
• Greenhouse gas emissions associated with option implementation.
The physical removal of hard-structure habitat can create ecological impacts such as the reduction of benthic biomass and associated fish production and densities, resulting in subsequent risks to marine biota that may use these sites as feeding stations (Scarborough-Bull et al., 2008; Arnould et al., 2015; Todd et al., 2018; Todd et al., 2022a; Todd et al., 2022b). Changes in hard structure surface area, a key habitat metric, are estimated within NEBA-CA. Hard structure surface area can serve as a surrogate metric to understand potential changes in ecological metrics such as fish biomass, benthic biomass, etc.
In case any component or decommissioning option results in the release of a contaminant into the environment, an ecological risk assessment, in some form, should be considered to understand the extent of potential risk to ecological populations (USEPA, 2004; Barnthouse, 2008). For example, the effect of degradation of plastics associated with components to be left in situ should be considered (Testoff et al., 2022) and similarly, screening level ecological risk assessment of multiple chemical constituents can also be considered (USEPA, 1997; USEPA, 2004).
Both physical and chemical risks to marine ecology may occur following the implementation of decommissioning options and have the potential to result in related adverse risks to socioeconomic values to society (Scarborough-Bull et al., 2008). Socioeconomic risks include loss of commercial and recreational fishing value associated with less fish, decreased stock protection, and loss of species of special significance where society holds existence and bequest value for these species. For example, Desmophyllum pertusum, a slow-growing cold-water coral of conservation importance, was found on multiple jackets in the North Sea (Gass and Roberts, 2006). Removal of these jackets may thus, affect the long-term protection of this species through the reduction of physical habitat, a metric quantified within the NEBA-CA.
Natural reef habitats are declining worldwide (Pandolfi et al., 2003). In areas where many offshore platforms exist (e.g., North Sea, Gulf of Mexico, Australia, and California), mass removal may have the potential to adversely affect ecological and socioeconomic values on a larger scale through loss of physical habitat and connectivity benefits (McLean et al., 2022). Evidence shows that the artificial habitat supplied by platforms in the Gulf of Mexico has increased the regional carrying capacity for economically important reef fish species (Scarborough-Bull et al., 2008).
An improved understanding of potential impacts and risks allows us to evaluate the consequences of the removal of hard structures and to meet the social responsibility associated with the precautionary principle.
2.1.9 Quantifying ecosystem service values
To evaluate how implementation of an action affects ecological and socioeconomic conditions, quantification of changes, negative or positive, in ecosystem services is necessary. It is also important to recognize that ecosystem services are not static measurements but represent a flow of benefits over time (i.e., multigenerational services). Quantified estimates of ecosystem services sufficient for environmental decision-making can be obtained through the use of the natural resource service valuation approaches developed and refined under the United States natural resource damage assessment (NRDA) process (Unsworth and Bishop, 1994; NOAA, 1999; Nicolette et al., 2013b). Within NRDA, these approaches are used to balance compensatory restoration with adverse impacts to maintain the flow of ecological and socioeconomic services provided to society (Nicolette et al., 2013b). These approaches include service-to-service approaches such as habitat equivalency analysis (HEA) and resource equivalency analysis (REA) (NOAA, 1999; Chapman and LeJeune, 2007). In a NEBA-CA decommissioning context, these approaches can be used to evaluate changes in ecological and socioeconomic service values, over time, associated with option implementation. It is within this context that the use of these economic-based methods is considered and takes advantage of the experience gained within the NRDA process over the past 30 years.
2.1.9.1 Ecological service quantification
Many ecological habitat services are not traded in the marketplace and therefore do not have a direct monetary value. A method for evaluating ecological habitat service flows is provided in King and Adler, 1991. This concept led to the development of the HEA approach (NOAA, 1999). HEA is an environmental economics-based approach used for determining appropriately scaled compensatory restoration. HEA uses environmental metric(s) to measure changes to ecological habitat services and focuses on quantifying the area (e.g., hectares, acres) and level of impact over time in units typically represented as service-hectare-years (SHYs), service-acre-years (SAYs), and service-tonne-years (STYs) (Nicolette et al., 2013a); however, other metrics can be used and developed appropriate to the site and the key services being evaluated. Within this method, changes in one or more metrics (e.g., fish biomass, species diversity) may be selected as a surrogate or proxy to represent the loss or gain of ecological services associated with changes to a habitat (Chapman et al., 1998; Chapman and LeJeune, 2007; Nicolette et al., 2013a). The calculation of ecological services involves a discount rate that allows for the gains and losses of ecological services to be evaluated from a net present value (NPV) standpoint; however, using a non-monetary environmental metric (e.g., NPV fish biomass SHYs or NPV benthic invertebrate STYs). The discount rate is the rate at which the public is indifferent to consuming goods now or sometime in the future (Moore et al., 2013).
An overview of the information, technical approach, and input parameters required to conduct habitat equivalency analysis is detailed in published articles and government sponsored reports (Chapman et al., 1998; NOAA, 1999; Dunford et al., 2003; Chapman and LeJeune, 2007; Bateman et al., 2011; Nicolette et al., 2013a). The use of HEA has been upheld in the US Federal Court (United States, 1997; United States, 2001). Additionally, the European Environmental Liabilities Directive (ELD) gives preference to resource equivalency approaches over monetary valuation when determining compensatory restoration (Nicolette et al., 2013b).
2.1.9.2 Human use service quantification
Ecosystems generate several different types of benefits for humans including those that are enjoyed directly through consumption (boating, fishing, diving, etc.), indirectly through their support and production of directly enjoyed goods and services (clean water, food production, etc.) and through non-consumptive means such as bequest and existence values (Nicolette et al., 2013a). Human use service values are typically quantified in monetary metrics, however, for use data, metrics might include user-days or visitor-days as non-monetary metrics. Multiple economics methods are available to quantify changes in human use services. These include hedonic pricing, stated preference methods, and the travel cost models (Freeman, 2003). Each method measures a different type of public value.
Conducting primary economic studies may not be feasible given the cost and time required to collect and analyze the data; therefore, many analysts estimate publicly valued ecosystem services using benefit transfer methods. Benefit transfer refers to methodologies that use knowledge gained from past studies regarding the value of similar services at comparable locations and employs this knowledge at a new location (Rosenberger and Loomis, 2001; Nicolette et al., 2013a). Transferred values are adjusted for population, income, and other factors to obtain an estimate of the value at the project site.
Service to service human use valuation approaches are also preferred approaches for compensatory restoration within the ELD.
2.1.10 Characterization and quantification of In-Situ risks associated with leaving hard structure in place
In addition to evaluating the effects on ecological and socioeconomic services, it is important to consider the in-situ management risks associated with structures that are managed in place. A variety of in-situ risks may be associated with the various options and should be identified with the intent of quantifying these risks and how they would be predicted to change through implementation of the various options. For example, if an option identifies that a certain subsea component, or portion thereof, is to be left in place, it is important to consider the potential and magnitude of the in-situ risks associated with that action over the period in which that component is predicted to last in the environment. The types of in-situ risks that are likely to be encountered with subsea structures that are left in place can vary based on the type of structure (e.g., fixed structure, buoyant structure) and include chemical risks (e.g., component specific, drill cuttings piles), navigational hazard risks, and trawl fishing hazard risks (i.e., snagging), among others. These risks vary according to the site-specific location, depth, and type of structure being evaluated. Assumptions regarding risks should be consistent among options for a given component. Although the predicted risk will only be as precise as the available data allows, internal consistency in the assumptions across options, where appropriate, for the same subsea component provides a mechanism to support option differentiation, i.e., a key outcome of the NEBA-CA process.
It should also be noted that option development can be used to manage in-situ management risks. For example, navigation and trawl snagging risks can be managed by maintaining the existing exclusion zone around a structure as well as by reducing ecological impacts by limiting impacts to benthic habitat within the exclusion zone (Nelson et al., 2022).
2.1.11 Health and safety, implementation risks
Decommissioning options entail various equipment, tasks and associated manhours that are predicted to occur. As these activities increase in difficulty and/or the man hours needed for option execution increase, human health and safety risks may increase as well. These risks include both physical injury and potential loss of life (PLL) during both onshore and offshore activities.
2.1.12 Comparative metrics and data requirements
Given the options identified, the next step is to determine what metrics would be evaluated for understanding the benefits and risks associated with implementation of each option. Metric selection should focus on how each decommissioning option may affect specific parameters related to environmental, health and safety, short and long-term risks, economic, and technical feasibility. Assessment metrics should be evaluated for each option and include a combination of ecosystem service (benefit) and risk metrics.
Net environmental benefits and risks are assessed using the “reference” state of the environmental condition, against which the potential change in environmental values and risks associated with each of the decommissioning options will be compared. NEBA-CA incorporates a variety of quantitative and semi-quantitative assumptions. These assumptions should be identified, along with their basis, during analysis and within reporting. Given the uncertainty in some assumptions, the assessment should attempt to be conservative in any estimates to not overestimate benefits or underestimate adverse impacts and risks.
Since it would be difficult to measure every ecosystem service associated with a site, metrics that serve as a surrogate for potentially affected ecosystem services should be identified (Section 2.1.8). Additionally, human health and safety risk metrics associated with navigation, trawling, and option implementation are important as they relate to long and short-term conditions that should be considered along with ecosystem service values. Example ecosystem service and risk metrics that the authors have used for various offshore decommissioning applications of NEBA-CA are presented in Table 1.
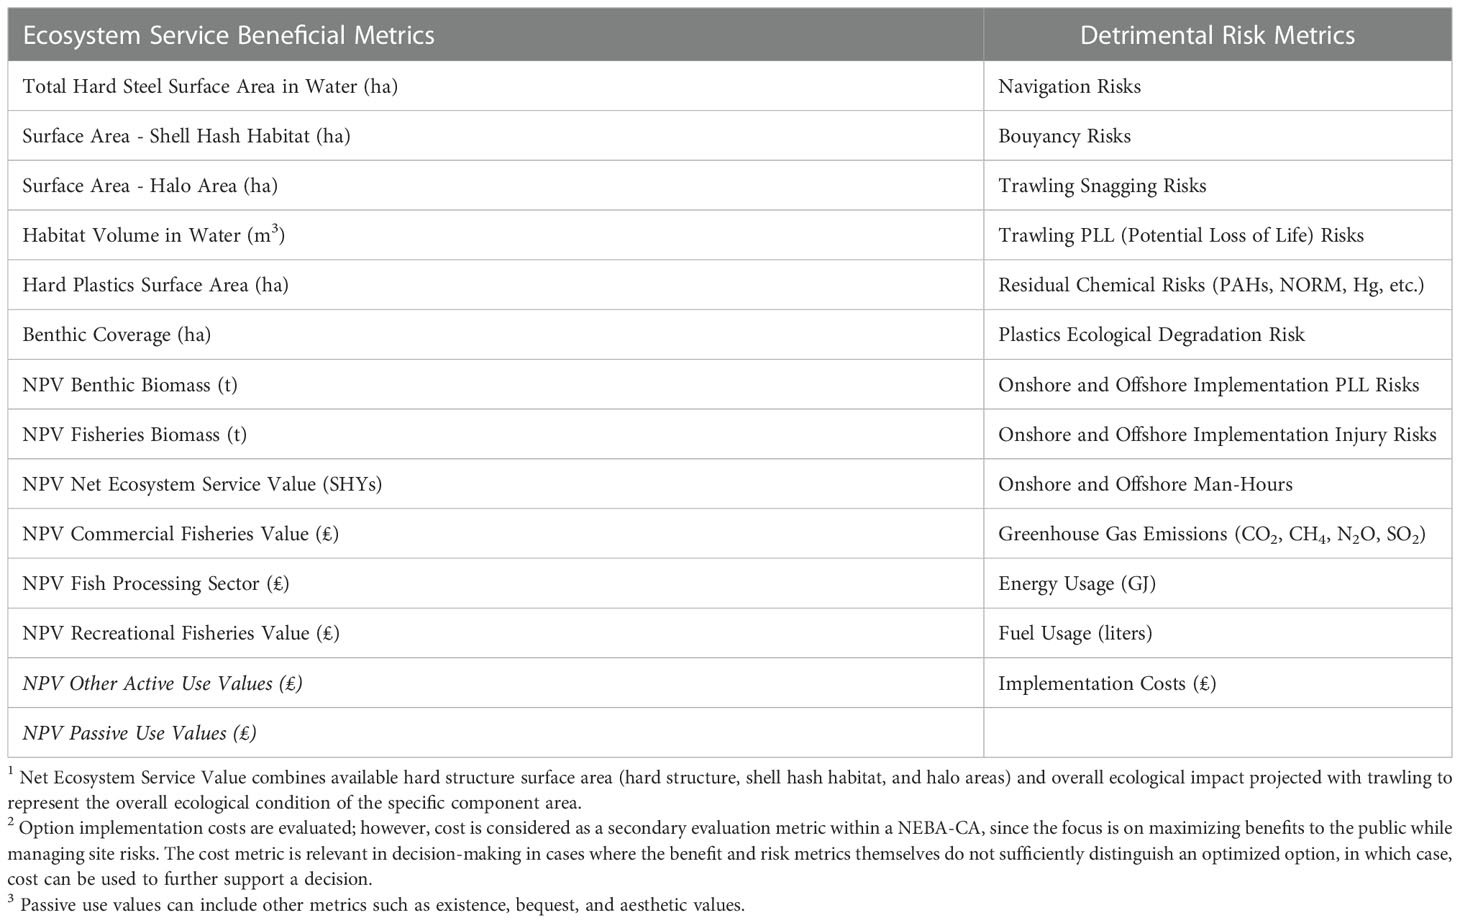
Table 1 Example Metrics Used for Offshore Decommissioning Applications of NEBA-CA.
Risk analysis and modeling may be required to further understand how chemicals or actions influence ecosystem services. For example, combining water column dispersion modeling and associated chemical toxicity reference values may help understand the relationship between chemicals released into the environment and potential risks to ecological or human receptors. When conducting a NEBA-CA analysis, sufficient information should be collected and evaluated for each metric so that a relative differentiation of the trade-offs between options can be compared. Within NEBA-CA, quantified metric estimates are approximate values and are not intended to be exact, but sufficient enough for identifying impacts and differences between options to a reasonable degree of certainty.
2.2 Data requirements
Since offshore O&G sites are generally different in composition, design, water depth, and location, NEBA-CA is a site-by-site analysis. Analysis planning should identify data requirements and data gaps for the proposed analysis. NEBA-CA is primarily a desktop analysis and relies on existing data, although supplemental data can be collected to address significant data gaps where deemed necessary. Data are needed to establish the ecological and chemical condition around and away from the structure. Field layout and engineering diagrams are needed to establish structural surface areas and physical characteristics of the site, and data associated with option campaigns are needed to evaluate onshore and offshore implementation risks, option costs, and greenhouse gas emissions. Options should describe the changes in surface area and other physical actions that will alter the existing habitat. Our experience has shown that operators have developed most of the data needed as part of their development, monitoring, and regulatory submissions which includes:
• Historical marine environmental and subsea surveys;
• Environmental appraisals;
• Jacket and subsea structure removal studies/estimates;
• Previously conducted CA’s, if any;
• Prior environmental monitoring reports – sediment and water quality, biota surveys, and human use activities;
• Remotely operated vehicle (ROV) survey reports and video;
• Detailed field layout diagrams and tables listing dimensions and material composition of each component; and
• Regulatory submissions relating to facilities included in the scope.
Review of ROV footage is critical in establishing the ecological condition near the structure. In some cases, examination of the existing ROV footage may be necessary to identify the biological makeup of the ecosystem associated with the subsea structure. In other cases, collection of ROV footage may be necessary. For example, collection of high-resolution videos so that fish can be identified at a species level and differentiated based on their commercial or recreational value, as well as for the identification of species of special significance, may be warranted for the site if not available.
Additionally, marine mammal acoustical or observational surveys within a field can provide further evidence as to the use of the field as feeding grounds by seals, whales, etc.
For cutting piles and “halo” areas, the biological and chemical characteristics, as well as physical dimensions of these habitat areas, help to further establish the ecological condition associated with the field. The collection of these data, if not available, would support an understanding of the effects that these actions (i.e., disturbance) might have on the ecosystem services associated with the field. Once the analysis of individual components is completed, a field-level decommissioning plan can be proposed that represents the decision for the overall campaign across the field.
2.3 Option analysis and graphics
A key aim of the NEBA-CA process is to provide a mechanism to differentiate how assessment metrics are predicted to change, given the implementation of each decommissioning option. A NEBA-CA provides a graphical summary of the data so that differentiation between options becomes readily apparent while providing a clear basis for that differentiation, thus providing an improved understanding of individual metric trade-offs between options based on quantified data. This is necessary because stakeholders tend to focus on metrics of specific interest to themselves at the expense of other metrics. For example, commercial fishermen may focus more on commercial fishery values, an environmental group may focus on overall ecosystem habitat values, or O&G operators may focus on economic benefits of leaving structure in-situ. The separation of various metrics within a graphical presentation is critical for allowing stakeholders to understand the following:
• Their own metric interests;
• Metric interests of others; and
• Trade-offs that need to be made to arrive at a final decision.
A stakeholder may not initially support a final decision; however, a data presentation that clearly depicts scientifically-based, transparent, and defendable metrics and the individual trade-offs between options, will be helpful for stakeholder discussions regarding understanding the basis of option selection.
Graphics presented as part of a NEBA-CA are developed to provide an understanding of the relative beneficial (positive) and detrimental (negative) impacts associated with the metrics evaluated for each option so that trade-offs between options can be evaluated. Note that, for clarity within a structure, if there is no difference in an assessment metric across all decommissioning options, that metric is not included in the associated graphics. The justification behind this approach is to focus on metrics that help differentiate between options to select a preferred decommissioning option.
For example, if exposure risks to chemical constituents associated with structural components are considered negligible across all options, and therefore do not help differentiate between options, the chemical exposure risks associated with structural components are not presented in the graphic displays, although they are documented as part of the NEBA-CA. Additionally, duplicative metrics can be removed from the comparative graphics to avoid overinfluencing the visual effect, impact, or clarity of the evaluation metrics.
2.3.1 Benefit–detriment graphical understanding
Given the variety of units in which various metrics are displayed, it is necessary to develop a process whereby all differentiating metrics can be displayed on the same graph. Consequently, graphics are developed such that each specific metric can be plotted in proportion to its specific metric values across options. Metrics with beneficial ecological and human use service attributes are scaled to a value between 0 and 1, as shown in example Figure 2. Note that shell hash habitat is recognized as a beneficial attribute; however, in the case of full removal, shell hash habitat value can be adversely impacted compared to baseline soft-bottom habitat, and as such, can result in a negative impact for the full removal option.
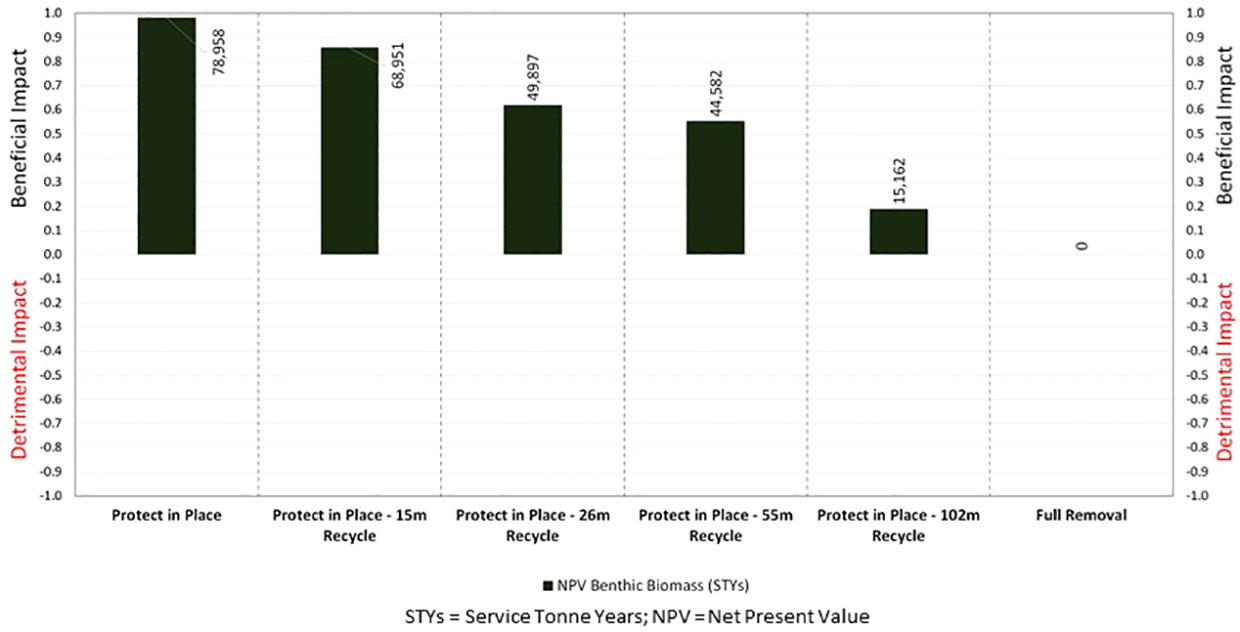
Figure 2 Example graphic of one metric, [net present value (NPV) of benthic biomass (Service Tonne Year)], scaled to between 0 and 1 for each of the options evaluated. All bars are in proportion to one another.
Each beneficial metric is scaled across all options by setting the best value for that metric to 1. All subsequent values for that specific metric are scaled to a proportion of 1, so that their graphical bar heights are relative to one another. For example, a bar that goes to a value of 0.5, provides 50% of the beneficial value when compared to the option where that metric has the greatest beneficial value of 1. This allows all values for each specific beneficial metric to be plotted on the same relative scale, for that specific metric, across the options for comparison. Note that the actual data values are provided above each bar to provide stakeholders a basis to understand the metric tradeoffs.
Similarly, each detrimental metric is scaled across all options by setting the most detrimental value for a metric value equal to −1. All subsequent values for that specific metric are scaled to a proportion of −1 so that their graphical bar heights are relative to one another. Thus, the bar that is predicted to provide the greatest adverse impact (i.e., highest risk) for each specific detrimental metric receives a value of −1, and the metric values for that specific metric for the other options are plotted proportional to the bar at a value between 0 and −1. Graphics presented in this manner help to identify NEBA-CA optimized options, considering that all risk drivers are managed to as low as reasonably practical (ALARP). ALARP is a best common practice of judgement of the balance of risk and societal benefit (NOPSEMA, 2022).
2.4 North Sea case example
A NEBA-CA was conducted for an end-of-life jacket located in the North Sea in approximately 150 meters water depth (Confidential Client Report, 2020). The purpose of presenting this case study is to demonstrate the application and results of the NEBA-CA framework applied to an actual site, including resulting graphics. The case study included analysis of the following four scenarios for the jacket with various exclusion zone (presence or absence) and partial removal options:
• Protect-In-Place - Recycle
• Leave-In-Place - Recycle
• Protect-In-Place - Reef
• Leave-In-Place - Reef
Although detailed metric evaluations were conducted for the case study, underlying detailed analysis of the individual metrics on which the graphics for the case study were based are not included. This is because the NEBA-CA framework presents metrics to consider, while not being prescriptive. Metrics and their evaluation methods will be site by site considerations and may depend upon available data, and as well, provide flexibility in the application of the approach.
The options analysis and quantitative metric evaluation results of the case study are presented using benefit-detriment graphics, whereby a visual assessment of the data can be conducted. The options evaluated ranged from in-situ management to full removal, with multiple partial removal options. For partial removal options, the removed portion of the jacket is either reefed alongside the remaining portion of the jacket or transported to a recycling facility. These conditions are also examined by considering alternate exclusion zone options (i.e., to fully remove the exclusion zone or maintain the zone). The case study evaluation options framework is shown in Figure 3.
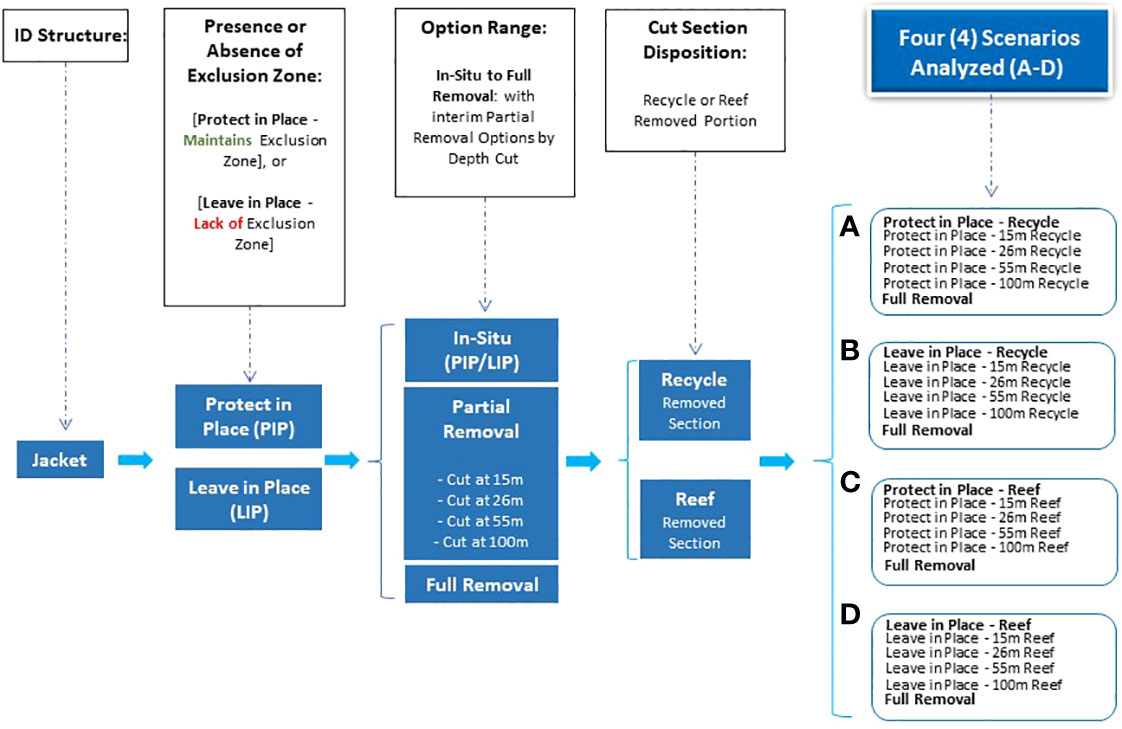
Figure 3 The NEBA-CA North Sea Jacket Option Analysis.
2.4.1 Case study option identification and nomenclature
The options identified for the North Sea jacket were designated as follows on corresponding graphics:
• Leave-In-Place (LIP) refers to leaving the structure, in whole or in part, in place without an exclusion zone (NOEZ);
• Protect-in-Place (PIP) refers to leaving the structure, in whole or in part, in place with a 500 m exclusion zone (EZ) that serves to protect the habitat and associated ecosystem benefits that have developed around the jacket, or portions thereof, and manage navigation and trawling risks;
Both the Leave-In-Place and Protect-in-Place options assumed that the jacket remained in-place after topside removal. For scenarios in which the jacket is managed in place with a portion extending above the water level, it was assumed that there would likely be a requirement for functional navigational aids, including the need for periodic access and associated maintenance.
• Partial Removal: For both of the above options, the option name included the following if a partial removal action:
O Final depth of cut in meters; and
O Cut section disposition (Reef or Recycle)
◼ Reefing refers to placing the cut portion in the sea next to the jacket.
◼ Recycling refers to transporting the cut section to shore to be recycled.
O Four cut depths were evaluated for the partial removal options as follows:
2.4.1.1 Partial removals and cut depth intervals
For options that involved some form of partial removal, it was assumed that the removed structure would be either transported to shore for recycling or the removed structure would be reefed in place near the base of the jacket. Partial removal options were considered for multiple depth intervals in either case (recycle or reef).
To determine depth intervals appropriate for evaluating partial removal options, it was necessary to understand the characteristics of various vessels, from heavy lift vessels (HLVs) to fishing vessels, which may occur in the North Sea. The analysis considered the transit and lifting drafts (where appropriate) of these vessels with the likelihood of being used in the North Sea.
The basis for partial removal cut depths that were evaluated follows:
2.4.1.1.1 Partial removal - 0 (sea level) to 15 m
The transit draft of any of the HLVs evaluated (likely the largest vessels in the area) ranged from 10 m to 12 m. The drafts of various types of fishing vessels ranged from 1.25 m to 8.5 m. It should be noted that an HLV, especially in a lifting draft, will have a detailed route plan, and as such, we focused on the transit draft rather than lifting the draft in determining this first depth cut. A 15 m depth cut was estimated to provide sufficient clearance for vessels in use in the North Sea, as these would be in transit when operating at or near the jacket location.
2.4.1.1.2 Partial removal - 0 to 26 m
The Seawise Giant was the largest ship built to date and had a draft of 24.6 m. The decision to include partial removal at 26 m reflects the largest potential draft of a vessel and coincides with the 85-foot clearance guideline in the Gulf of Mexico.
2.4.1.1.3 Partial removal - 0 to 55 m
Partial removal at 55 m was selected as an option because it met the International Maritime Organization (IMO) guidelines.
2.4.1.1.4 Partial removal - 0 to approximately 100 m
This option is the “derogation option” under OSPAR Decision 98/3, which requires the jacket to be removed down to the top of the footings. The top of the footings of the jacket was approximately 100 m deep.
• Full removal (assumes cut 3 m below the mudline, NOEZ, and removed structure prepared for recycling.
2.4.2 Ecosystem services and metric identification
For this case study, the NEBA-CA drew upon the UK National Ecosystem Assessment (UK NEA) framework (UK Government, 2011) as the basis for the identification and selection of key ecosystem service assessment metrics. Ecosystem service values are recognized by UK and International authorities as legitimate uses of the sea (UK Government, 2011). Several key findings of the UK NEA related to the importance of ecosystem services to UK society are listed below. Each key finding was assigned a level of scientific certainty, based on a 4-box model and complemented, where possible, with a likelihood scale (well established, virtually certain, very likely, likely) (UK Government, 2011).
• The diversity of organisms in marine habitats provide a range of ecosystem services and benefits of significant value to UK society. (well established)
• Many of the benefits are accrued directly by coastal dwellers and visitors, but also indirectly by much of the UK’s society. (well established, virtually certain)
• The quantity of wild fish caught in UK waters is insufficient to meet the UK demand for this food. (well established, virtually certain)
• The sustainability of food provision from marine habitats is threatened by overexploitation of fisheries; fishing is also damaging other marine ecosystem services. (well established, virtually certain)
• The UK’s seas are important to people’s quality of life but are less well protected than terrestrial environments. (virtually certain)
• The UK population has a strong affinity for the sea and has always derived inspiration from it. More people are using the sea for leisure and recreation, education, research and health benefits. (virtually certain)
• Many organisms create living habitats such as reefs and seagrass meadows. These can provide essential feeding, breeding and nursery space that can be particularly important for commercial fish species. (well established, likely)
• Building coastal defences and offshore structures, such as wind turbines, oil platforms and reefs, provides artificial habitats which can have positive impacts, particularly for species usually associated with rocky environments. (very likely)
• The use of monetary and non-monetary valuation of ecosystem services will aid the process of considering the impacts and benefits of development on marine habitats. (virtually certain)
As can be ascertained from the key findings of the UK NEA, ecosystem services and associated valuation play a key role in UK society and as such, require consideration as to actions that affect these services. Although multiple metrics were calculated as part of the study, only those metrics plotted on the graphics (as described earlier) are highlighted in Table 2. These metrics encompassed ecosystem services, risks, and costs.
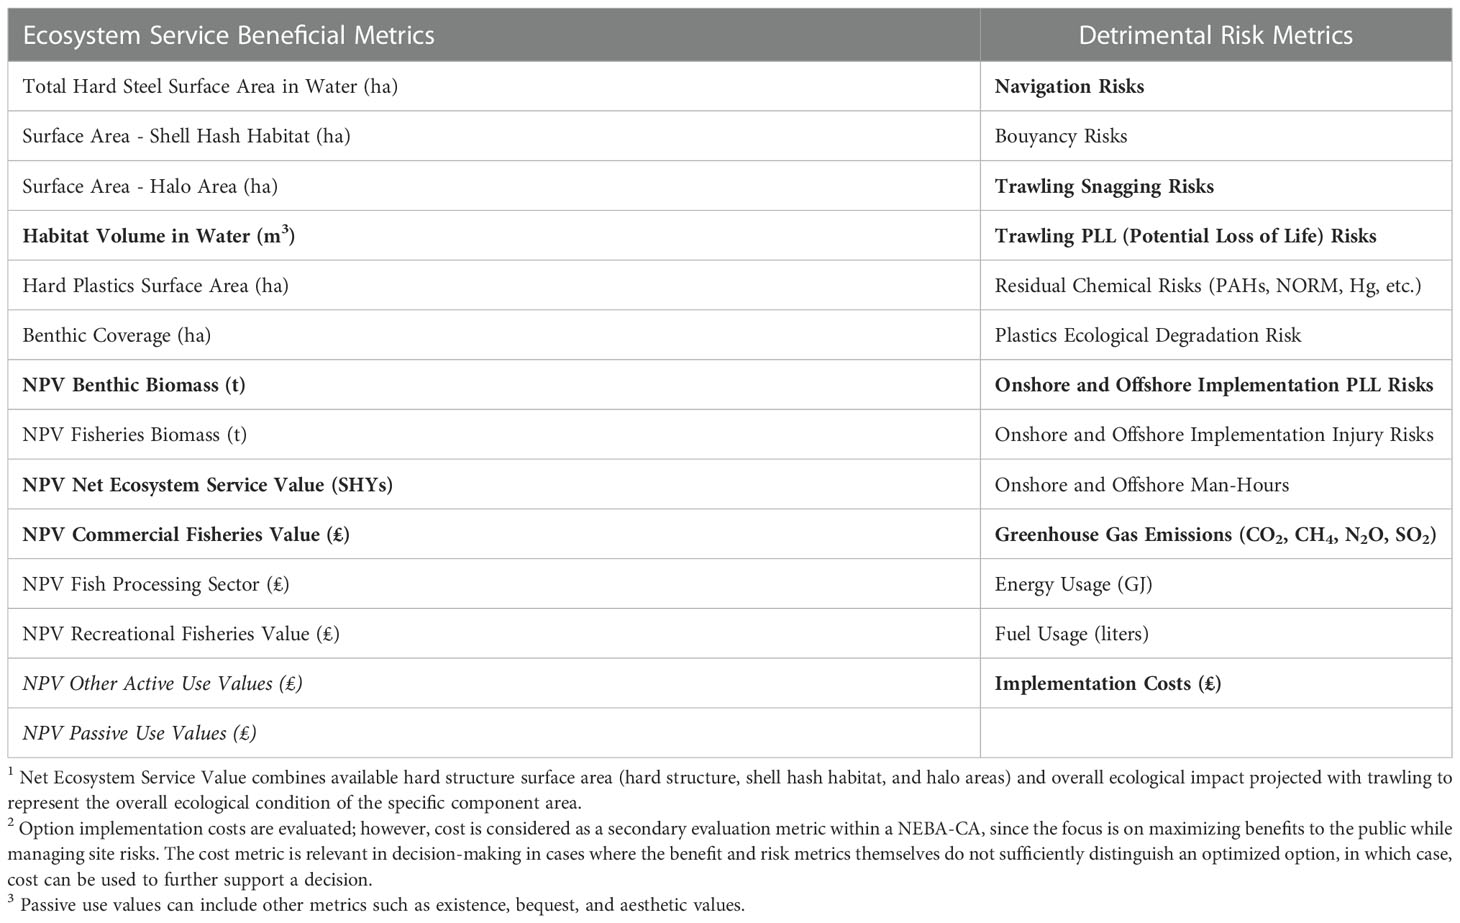
Table 2 North Sea Case Study Metrics (metrics bolded were plotted in graphics).
2.4.3 Case study results
The results of the case study, without any weighting of the data and for demonstration purposes, are graphically presented for the Protect-In-Place - Recycle scenario (Figure 4). Note that the graphics produced within NEBA-CA depict the quantified value associated with each bar to help the reviewer understand the differences between metric values by option. The graphics for all four scenarios are provided in Figures 5A–D for visual comparison. The results summary for the four scenarios is provided in Table 3. The quantified metric values were removed from Figures 5A–D to aid the reader in visually observing the trends among the four scenarios.
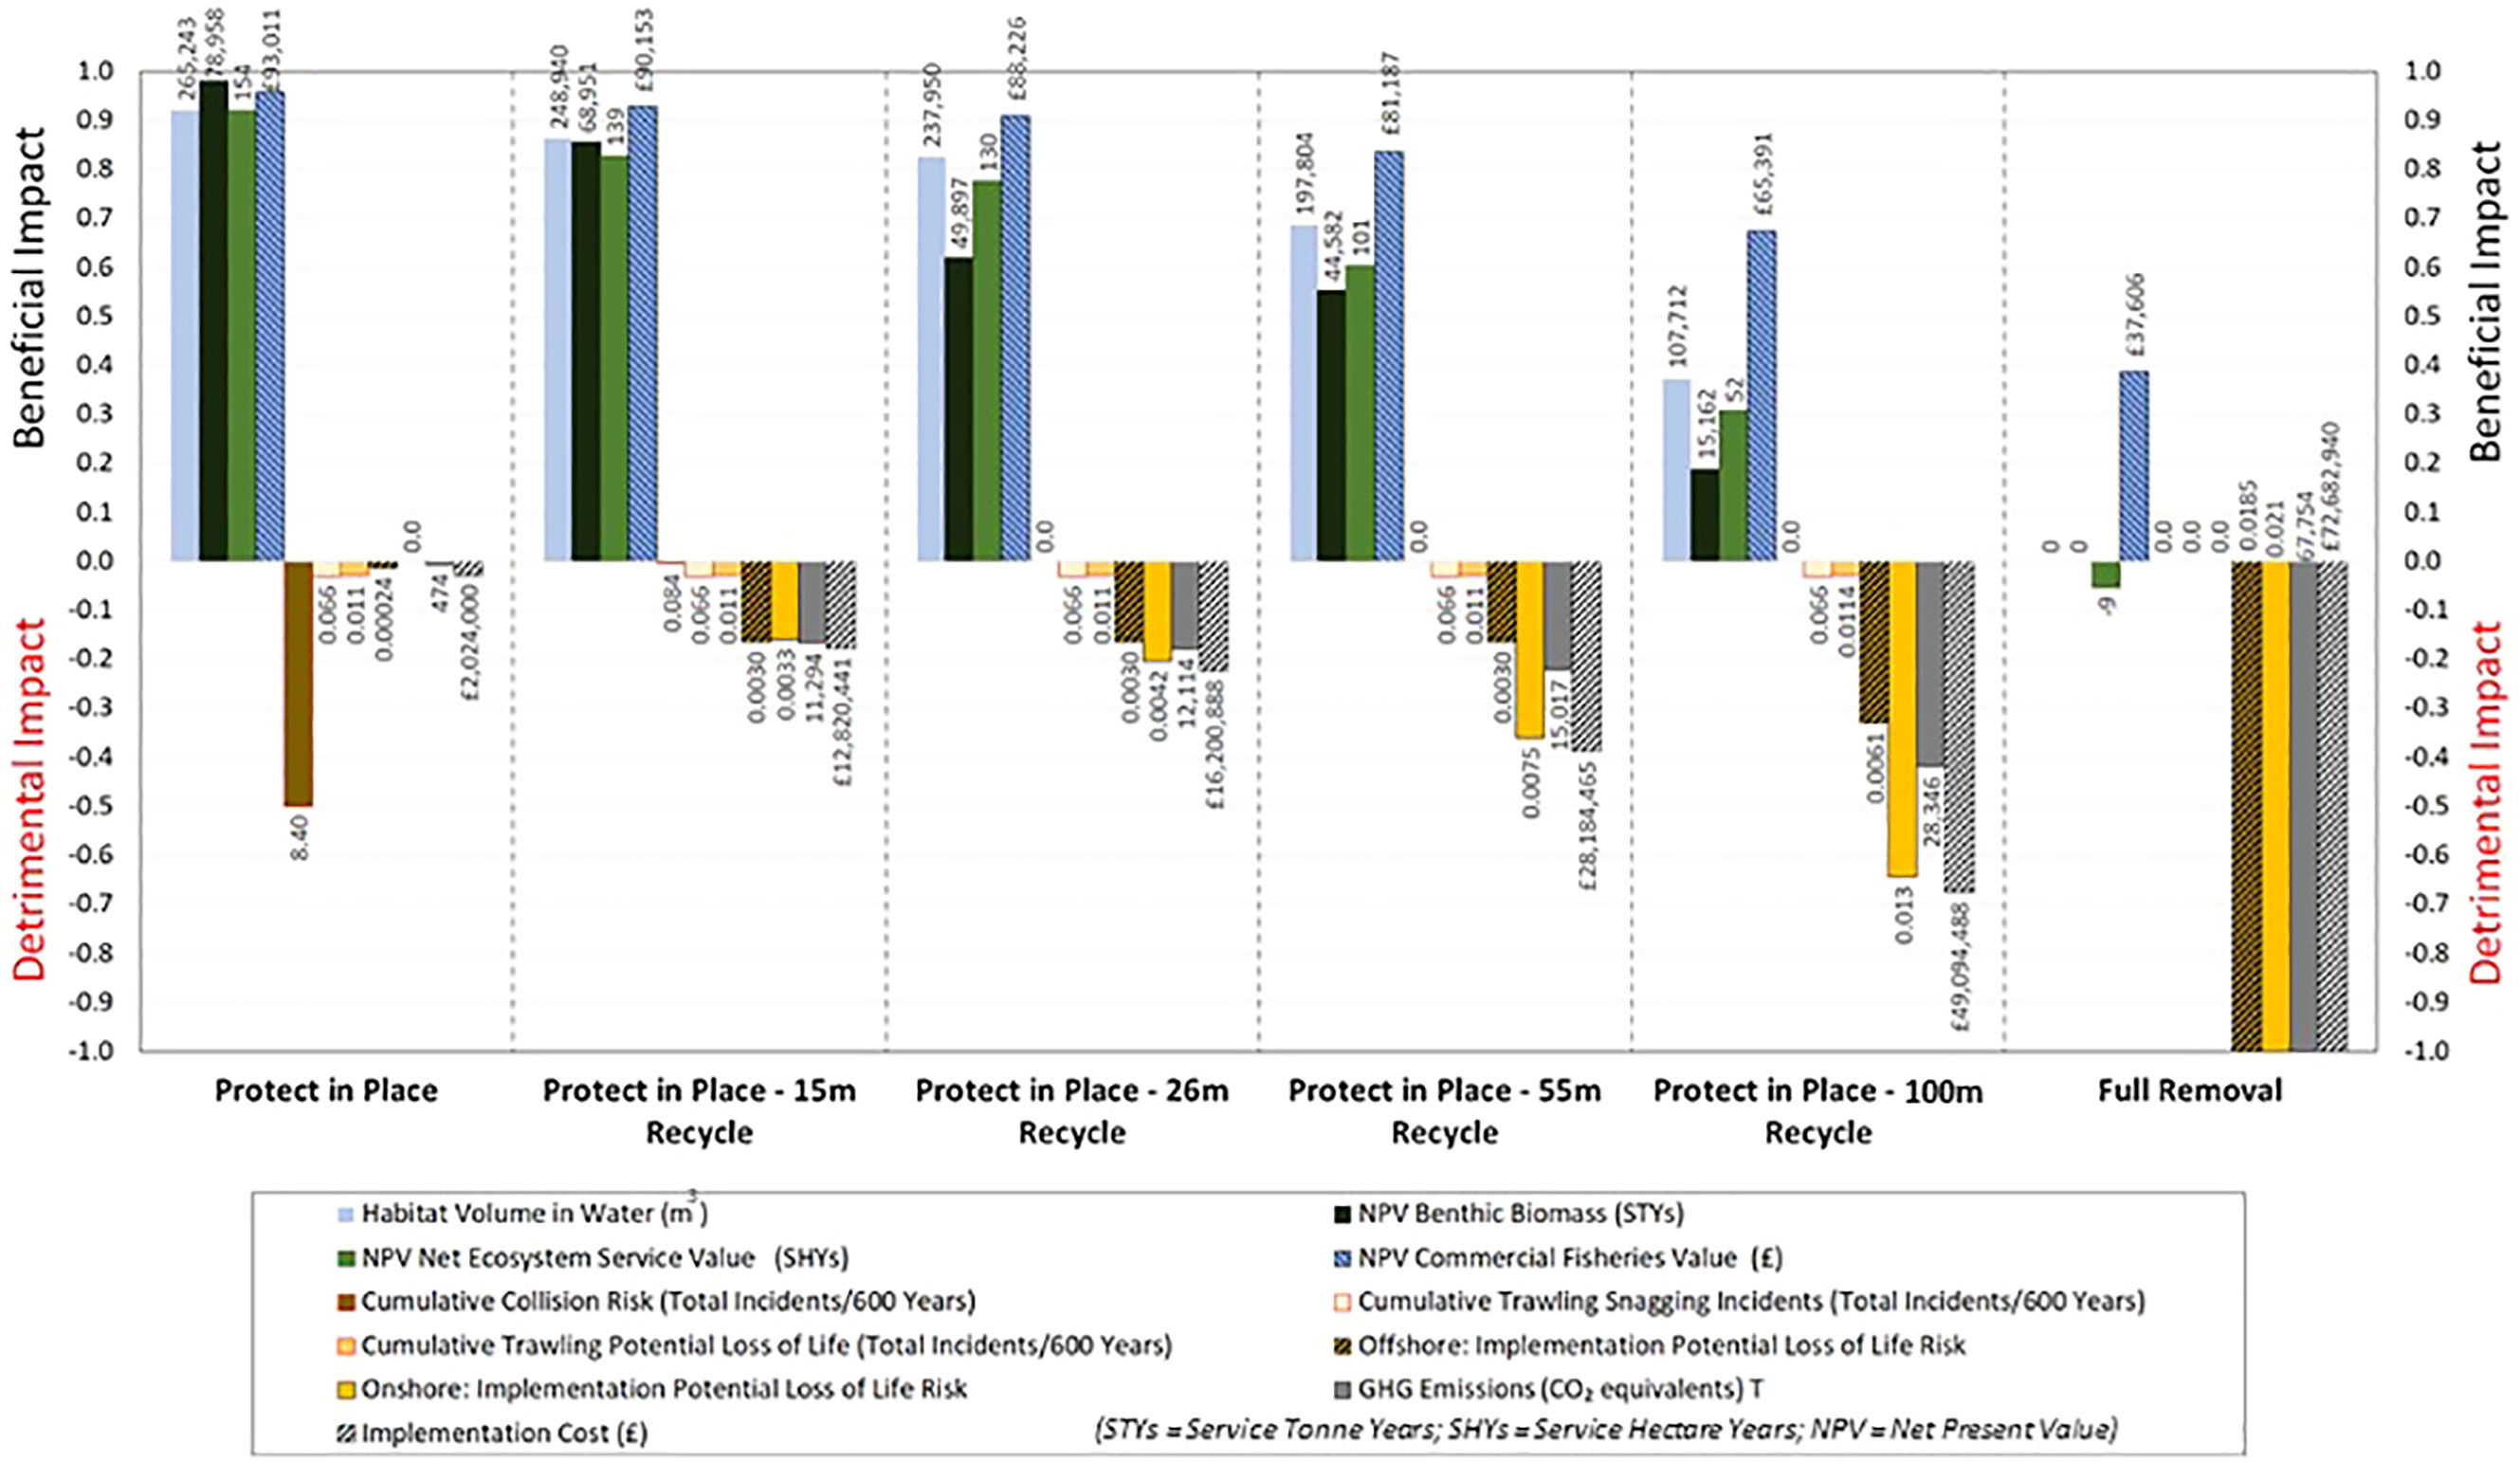
Figure 4 Beneficial and Detrimental Trade-offs Associated with the Jacket and the Protect-In-Place Recycle Options.
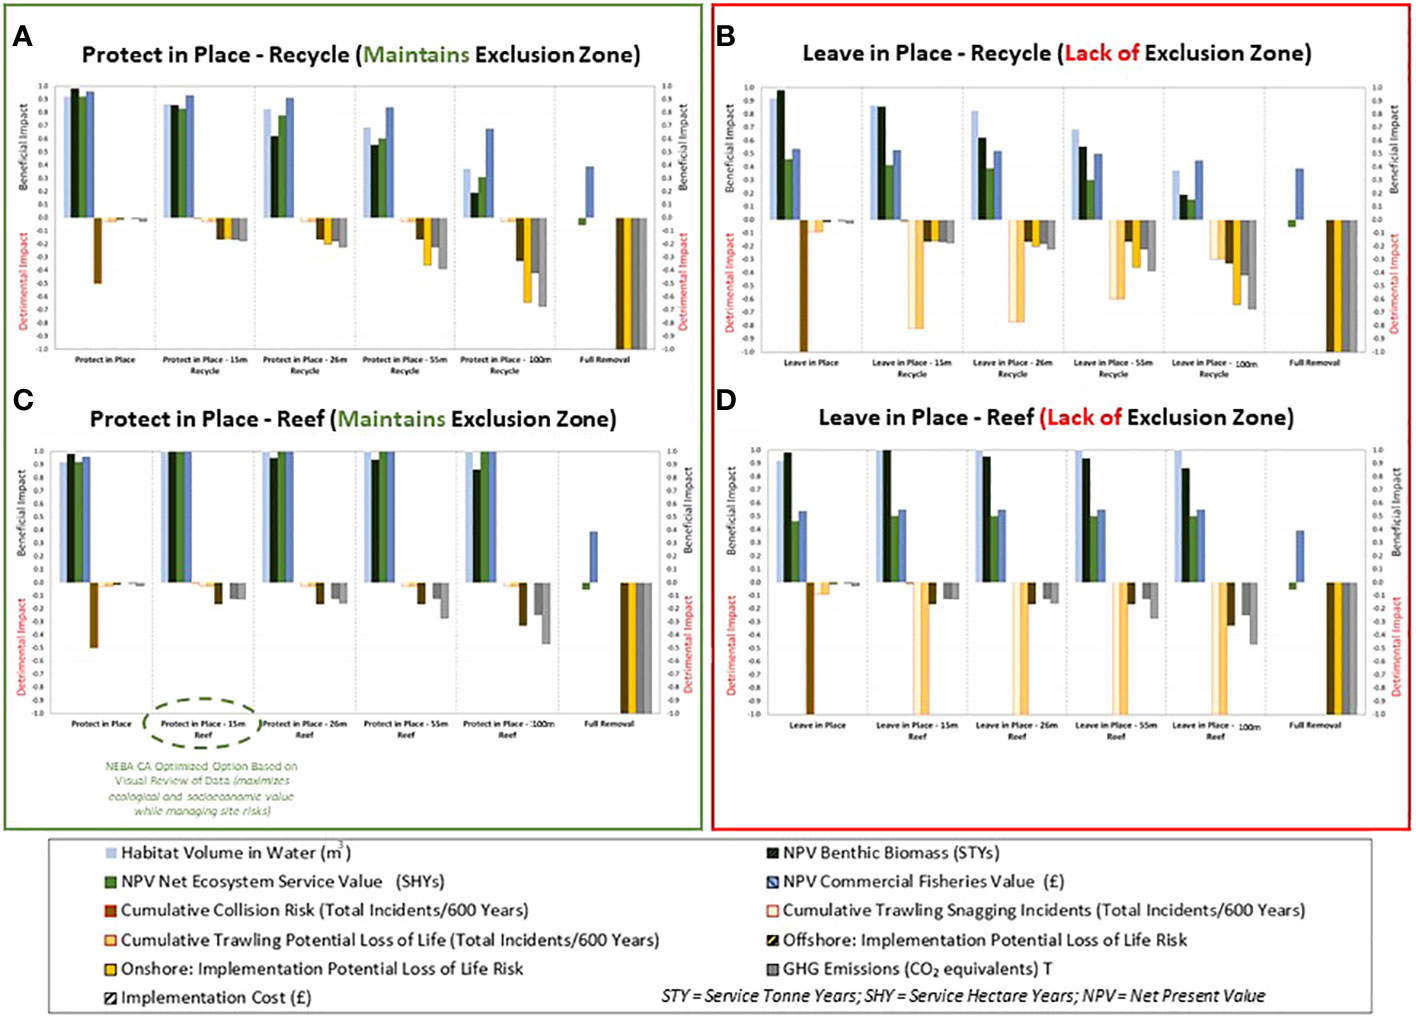
Figure 5 (A–D) The NEBA-CA Optimized Decommissioning Option Based on Visual Observation with Data Comparison for the Jacket. Note that metric values were removed from this graphic to enhance the visual comparison.
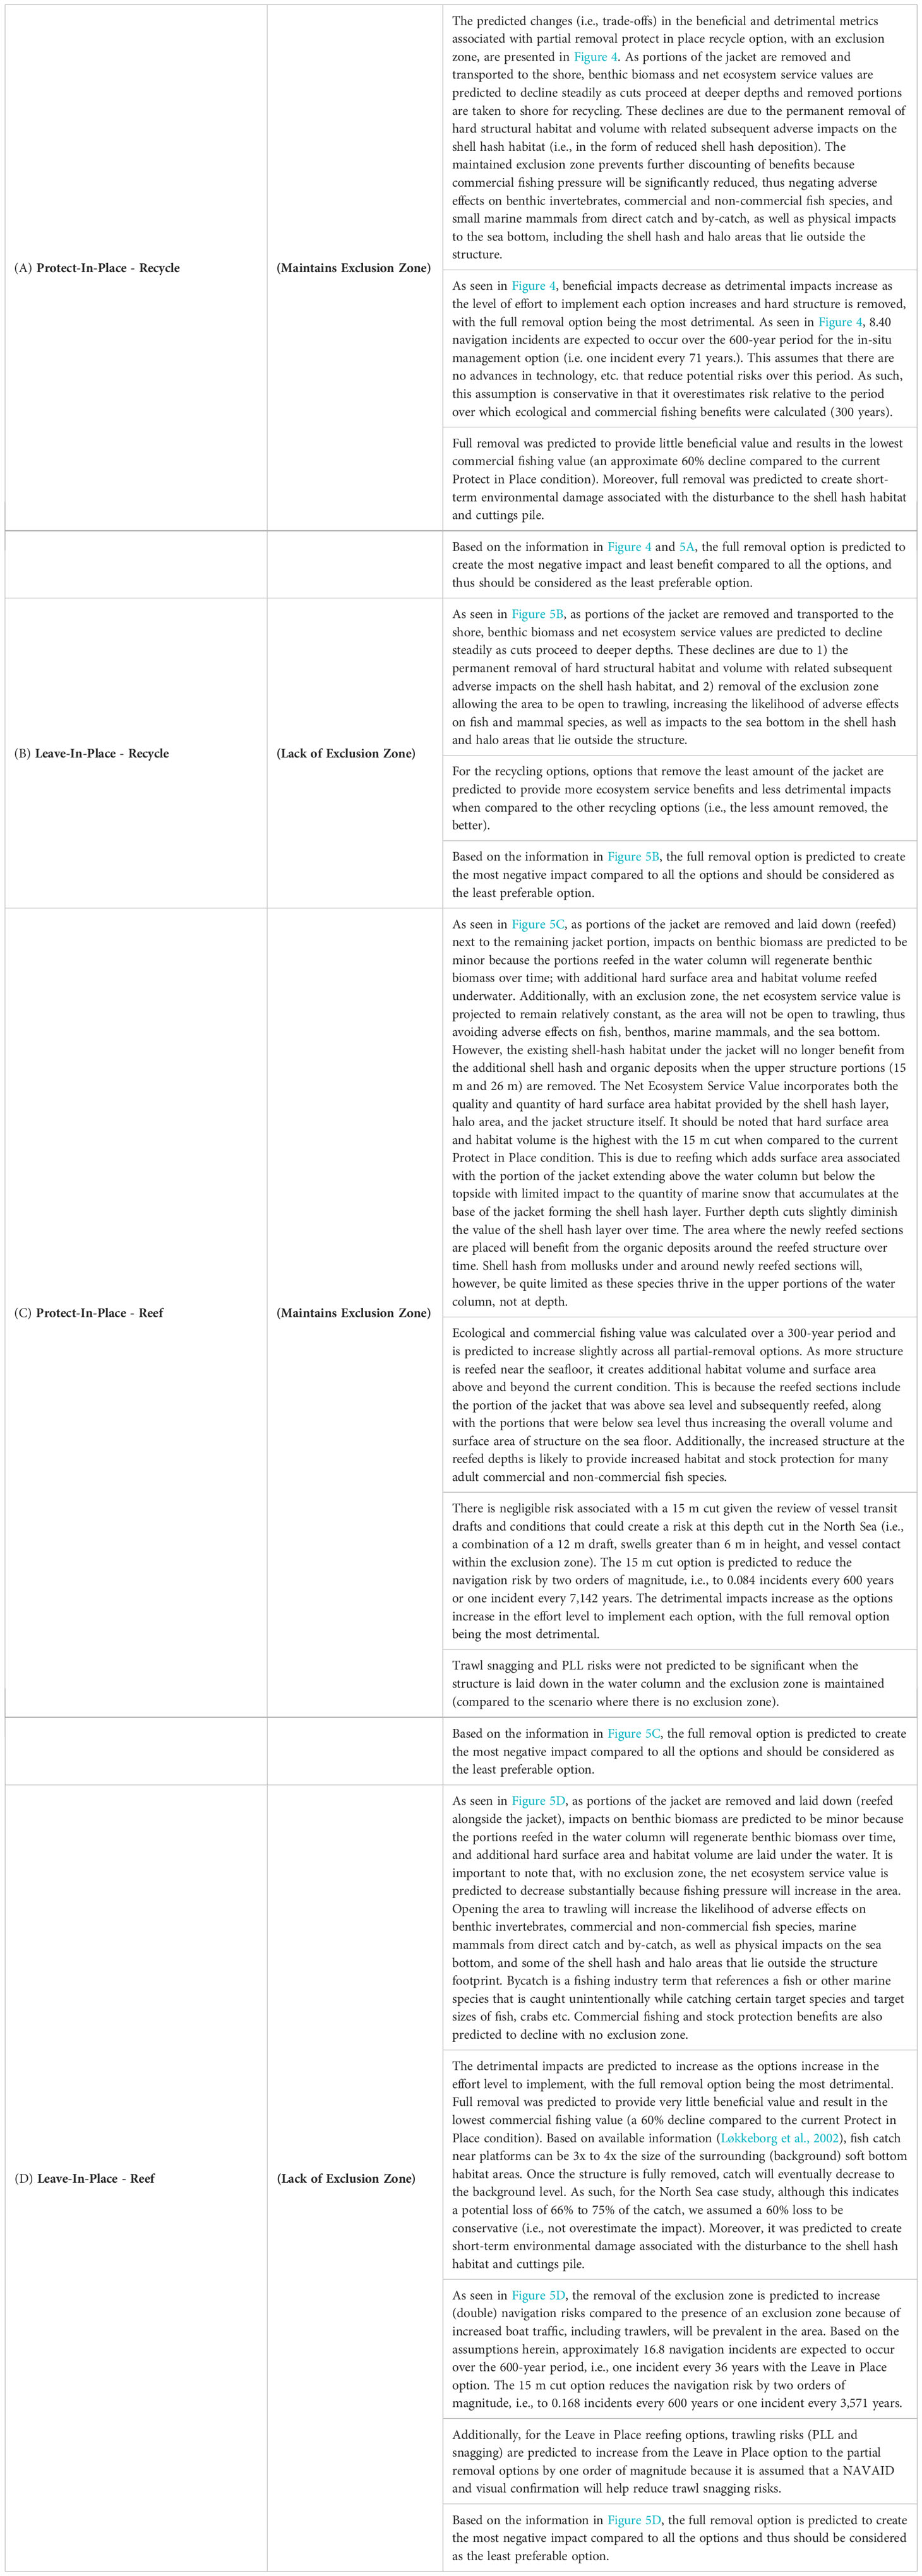
Table 3 North Sea Case Study Results Summary.
2.4.4 Observations
Overall, the following trends become apparent:
• The presence of an exclusion zone provides greater ecological and socioeconomic value and less risk than the same option with no exclusion zone; and
• Reefing (i.e., habitat retention) provides greater ecological and related socioeconomic value and lower risks than the recycling option.
• Full removal option is predicted to create the most negative impact compared to all the options and should be considered as the least preferable option.
It is important to understand that any calculated values for the various options are to be used in the comparative assessment to differentiate between the options and are therefore most relevant when compared against each other. Although some data may not be precise, internal consistency of assumptions, between options, provides the level of evaluation necessary for option comparison.
If stakeholders determine that weighting of metrics is appropriate, they can adjust the graphics by changing the individual weights of select metrics; however, in the example graphics provided, visual comparison of the data did not require weighting of metrics while allowing the reviewer the ability to evaluate all data simultaneously so that the trade-offs between options could be understood and discussed with confidence.
2.5 Optimized decommissioning option for the jacket
The overall NEBA-CA optimized decommissioning option across all option groups was determined as follows:
First, the graphical approach used to identify the preferred individual group options was used to visually evaluate how the data from each of the four option groups compared to one another (Figures 5A–D). The visual display provides the relative difference between the predicted metrics for each option group.
As seen in Figures 5A–D, the option group considering Leave-in-Place with Recycling would create the least amount of ecosystem service benefit and the greatest amount of risk. The option group considering Protect-in-Place with Reefing would create the greatest amount of ecosystem service benefit and the least amount of risk. Based on the visual display of the data, the optimized decommissioning option was initially identified as the Protect-in-Place - 15 m Reef option (Figure 5C).
2.6 Risk management decision-making
Given the visual analysis, risk management tolerance considerations can also be incorporated into the evaluation of the data to adjust, if necessary, the initially identified optimized option to account for the understanding of the magnitude of risk and how that risk might influence health, safety, or the environment. For example, an option may have an identified risk; however, that risk might be small in scale or be considered negligible in absolute terms, even if the bar tracks to -1 as the highest assessed risk option for the asset. As such, this step can be used to help confirm or refine the initially identified optimized decommissioning option based on an understanding of the identified risks and achieving ALARP thresholds. The risk management process and preferences (i.e., ALARP thresholds) will likely vary on a case-by-case basis, but in most cases would include both operator and other stakeholder engagement.
For this North Sea case study, a risk management process and preferences were used to examine the initial optimized option to further consider a final optimized decommissioning option. This process included the following four steps, as seen in Figure 6:
1. Step 1: Navigation and trawl snagging and potential loss of life (PLL) risks were identified as key long-term risks associated with the potential decommissioning options. Thus, the first step was the identification and removal of options deemed to have unacceptable risks based on the identified criteria. In this case, collision and trawling risks were presented in relation to a preferred risk-management threshold return period (the period of years it would take to have one occurrence) of 1,000 years. Options in which a navigation or trawling incident was predicted to occur in less than 1,000 years1 were removed from consideration, given the predicted risk. Unacceptable risks based on the 1,000-year threshold are shown in red in Figure 7. Accordingly, the Protect-in-Place Reef option was not considered acceptable because a navigation incident was predicted to occur within 71 years. The return period for the Protect-in-Place - 15 m Reef option was 7,142 years, which was considered an acceptable risk. The options with acceptable and unacceptable risk return periods for navigation and trawling risks are presented in Figure 7, with unacceptable risk options removed from consideration and presented as “grey” text in Figure 7.
2. Step 2: The next evaluation criterion for those options with acceptable navigation and trawling risks was the consideration of both onshore and offshore implementation PLL risks. In this case, options with a PLL risk of greater than 1% were not considered acceptable. The unacceptable onshore and offshore implementation PLL risks and associated options are presented in Figure 7.
3. Step 3: After managing navigation, trawling, and implementation risks, GHG emissions were considered next to differentiate between the remaining options. Options with acceptable navigation, trawling, and implementation risks were evaluated based on the level of GHG emissions. Steps 1, 2, and 3 lead to options that best manage the risks (Figure 7).
4. Step 4: Since the goal of NEBA-CA is to maximize ecosystem service benefits while managing site risks, the next step was to evaluate the remaining options to identify the option(s) that maximizes the ecosystem service value, which was determined to be the Protect-In-Place Reef with Partial Removal at 15 m option (Figure 7).
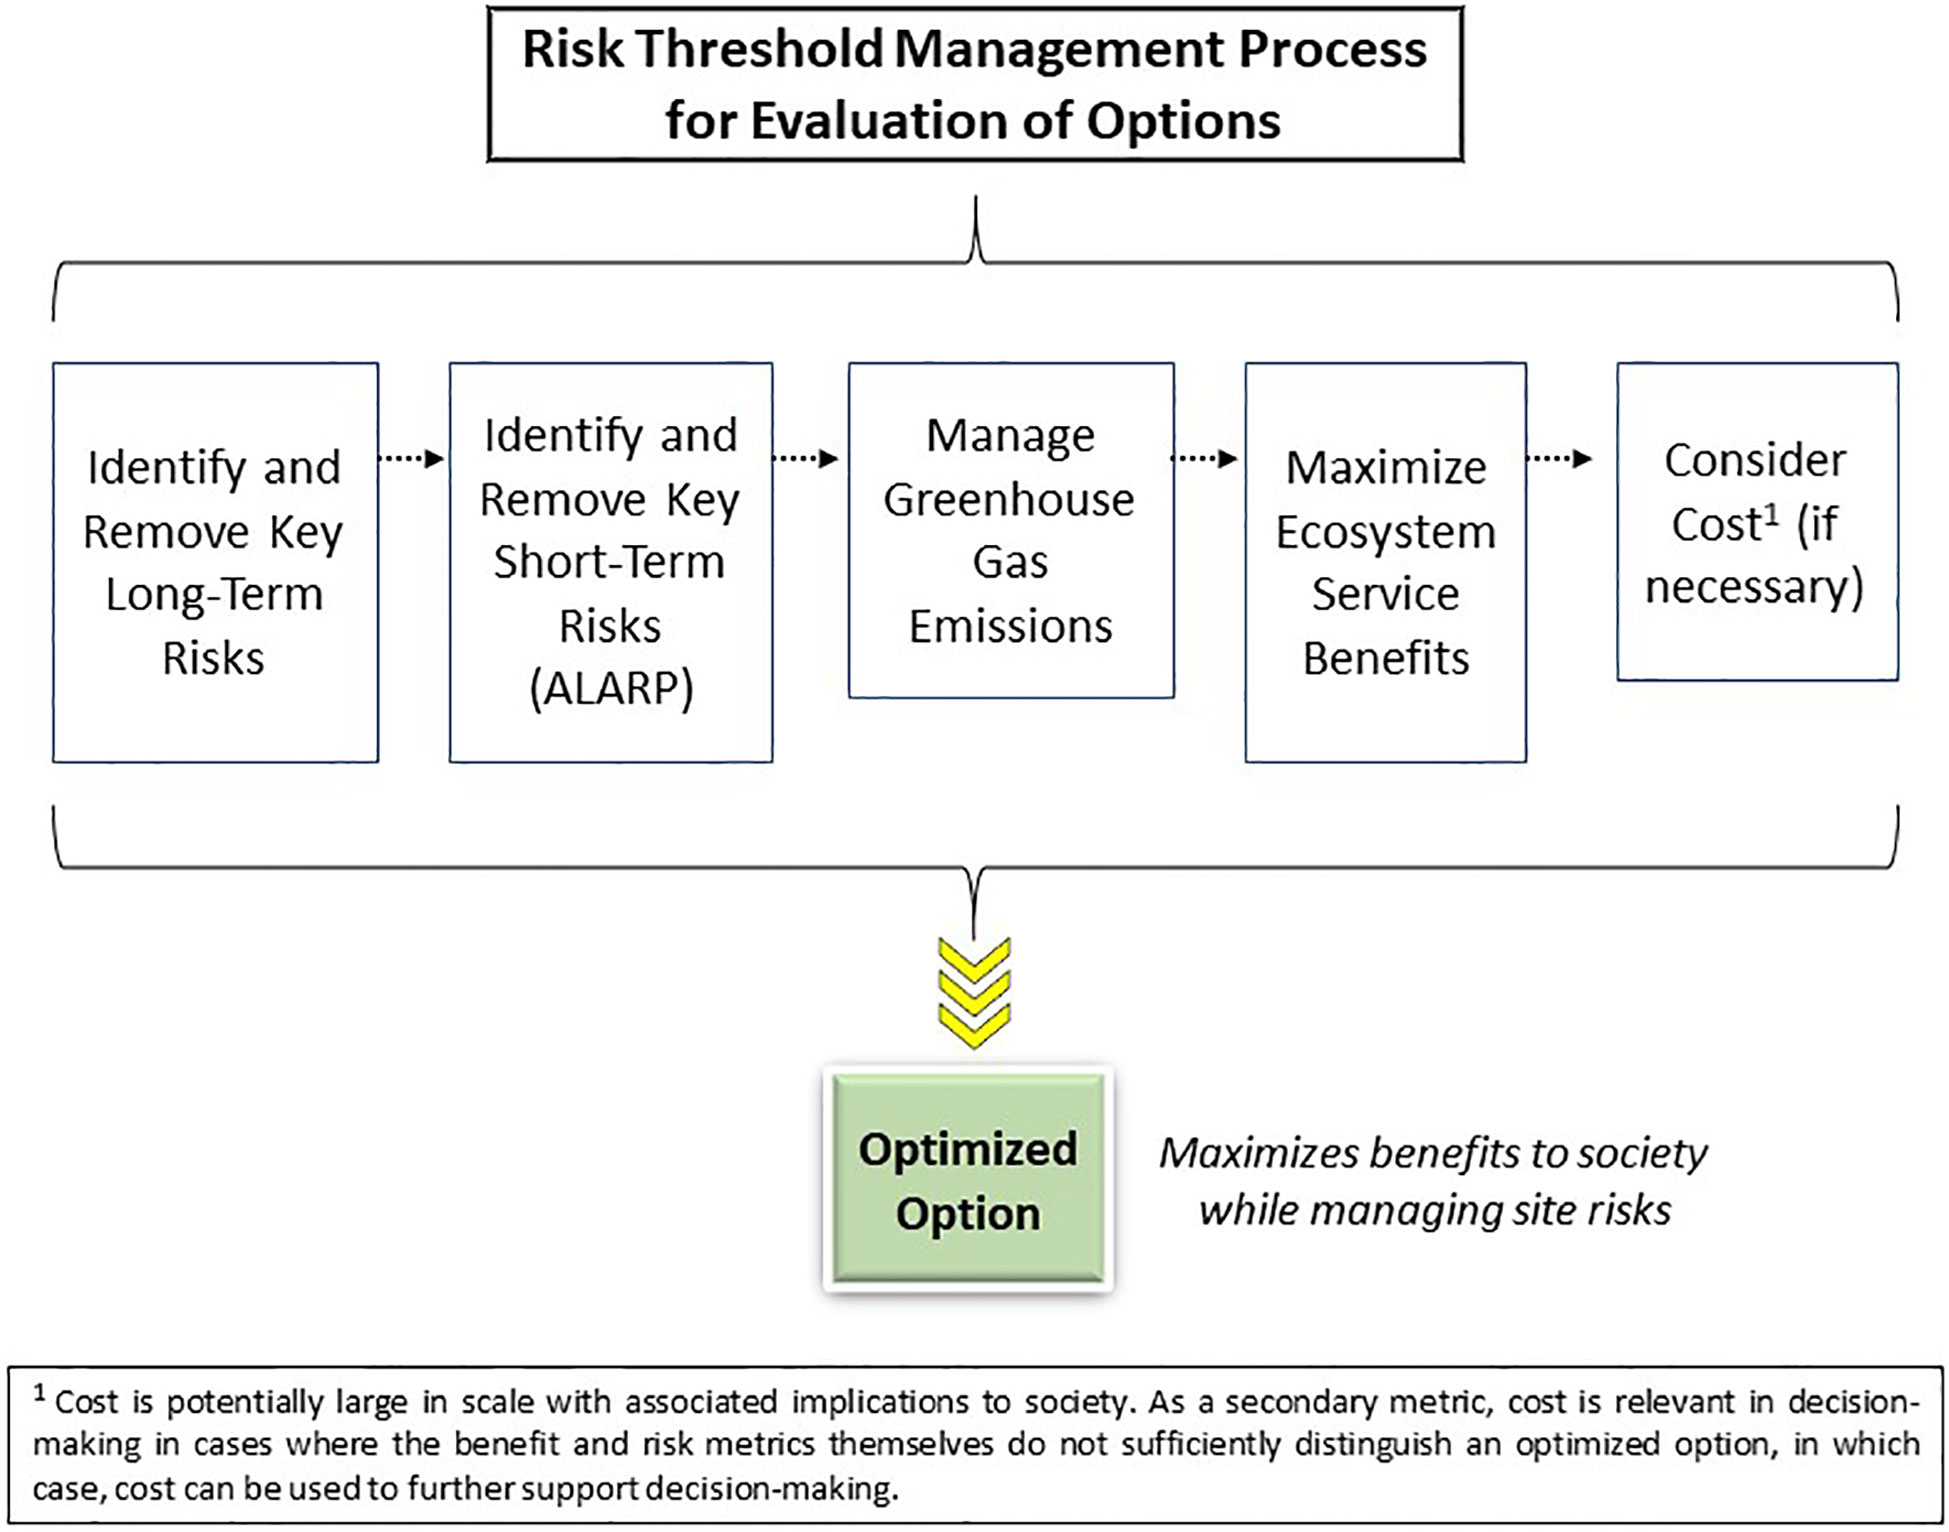
Figure 6 A Schematic Representation of the Process for Risk Threshold Management and Option Selection.
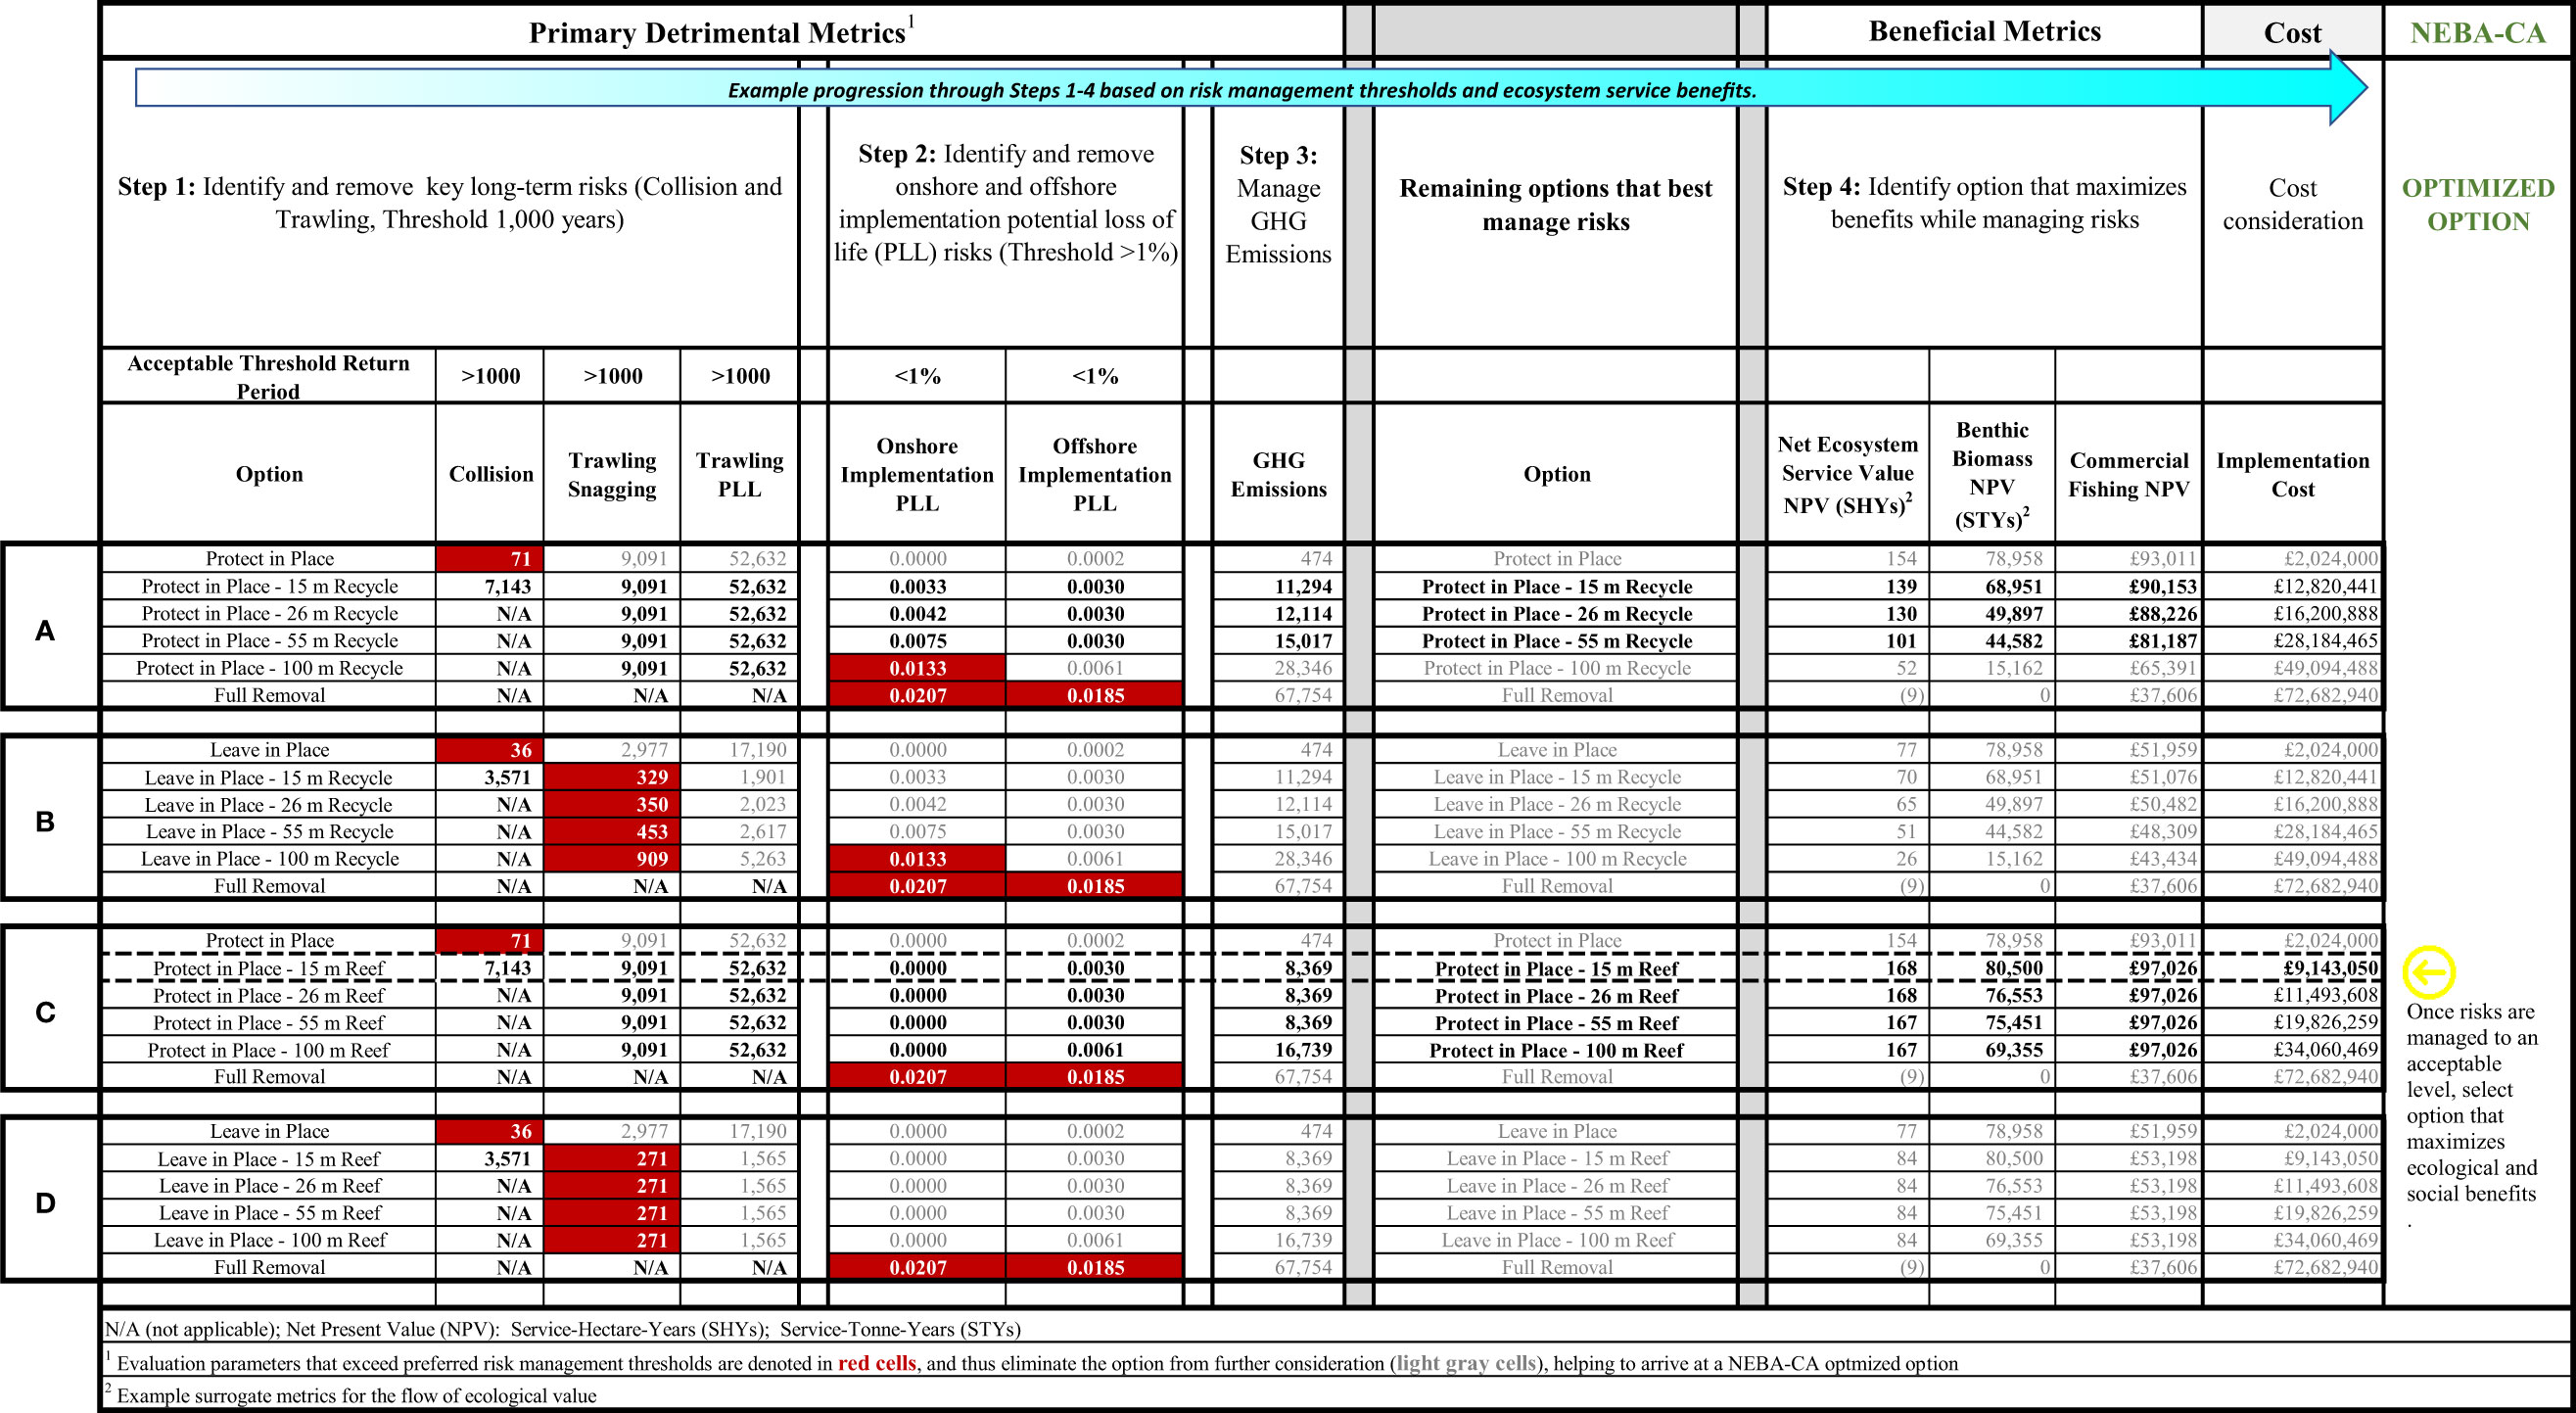
Figure 7 NEBA-CA Risk Management Process.
For the North Sea case study, based upon the preferences evaluated, the optimized option was confirmed to be the Protect-In-Place Reef with Partial Removal at 15 m. It should be noted that in some cases, comparison to preferences and thresholds might further adjust the final optimized option. It should be noted that consideration of cost was not necessary to identify the initial optimized decommissioning option.
3 Discussion
With aged regulations, both precedent and bias appear to have influenced the advancement of decommissioning planning, in which support for a complete removal option is not typically substantiated by robust science, and complete removal is simply assumed to be the best option. For example, in the 1990s, there was a public and political outcry over the proposed plans to dispose of the Brent Spar oil storage and tanker loading buoy by sinking it in deeper water. This influenced development of the North Sea decommissioning policy and a ‘return to a clean seabed’ was promoted as the default decommissioning decision. Consequently, OSPAR Decision 98/3 was adopted in 1998, which prohibits dumping or leaving, whole or in part, any offshore installation after the end of its working life. Recent assessments have since allowed for some exceptions to this rule (termed ‘derogations’); however, this has largely been based on the technical complexity of removing certain types of, often larger, gravity-based structures and not on the health, safety, environmental, economic, and social implications of the removal options. Based on evolving science, and in full compliance with the precautionary principle, full removal has the potential to be harmful to society and the environment.
In the North Sea case study, the NEBA-CA analysis indicated that the removal of the jacket structure, in full or in part, will adversely impact the established ecological community. Additionally, adverse effects may disrupt ecosystem connectivity and associated networks across multiple fields and structures in the North Sea (Henry et al., 2018; McLean et al., 2022).
In general, the level of ecosystem services affected by decommissioning is based on the location and attributes of the structure(s), as well as on the characteristics of the option(s) to be implemented. A key characteristic associated with each potential option is its effect on the hard surface area of structure that remains in the sea, and its relation to “halo” area productivity. The high level of heterotrophic growth per area of the seafloor is due to the large amount of habitat provided by the structural surface area of subsea structure (Claisse et al., 2014); therefore, site-by-site and option-by-option NEBA-CA analyses within the decommissioning planning process are warranted to facilitate decision-making.
The North Sea case study results indicate that, for the jacket examined, the full removal option for the jacket is the least preferable option. Given the potential for adverse impacts associated with full and partial removal options for the jacket, leaving as much steel structure in the sea as possible is projected to maximize ecosystem service benefits to society while managing site risks. The analysis further refines the jacket partial removal options and indicates that the less steel removed (i.e., a lesser depth cut combined with a reefing action) as part of a partial removal, the greater the projected ecosystem service benefits provided to society. That is, in an area where hard structure is lacking to support reef colonization and thus limit ecological production (i.e., in the North Sea), the availability of hard structure provided by subsea infrastructure is a valuable multigenerational habitat for benthic invertebrate colonization that further attracts fish (including commercially fished species) and other marine biota (e.g., marine mammals; Todd et al., 2022b), helping to maintain ecosystem benefits for multiple generations of the UK public; therefore, the financial expenditure and opportunity cost to society should be considered in the decision-making process. If it is possible to maximize ecological and human use service benefits and manage site risks with less removal, the value of these cost savings should be considered by both government regulators and society.
Scientific evidence pertaining to the ecological and social multigenerational values associated with subsea structures is increasing. Decisions made today can have positive or negative risks to future generations with the potential for long-term impacts; therefore, decisions regarding the decommissioning of offshore structures should consider the ecological and social values associated with the subsea structure and the basic tenets of the precautionary principle. There is no reason that these same concepts cannot be applied to decommissioning and development of other offshore subsea structures, such as wind energy development.
4 Limitations and uncertainties
The NEBA-CA framework is a data driven approach that entails the evaluation of multiple option and site-specific metrics that represent ecological and human use services, ecological and human health risks, and costs. The approach is primarily a desktop analysis that relies on readily available data and as such, data availability may be a limitation of the approach in some cases; however, based on the authors experience related to decommissioning projects in the North Sea, Australia, Gulf of Mexico, California, and the Caribbean, most data required to conduct the analysis and associated modelling have been previously generated by the site operator as part of their development, monitoring, and regulatory requirements. In many cases, ROV data may be available; however, detailed analysis of this footage may be necessary to understand the ecological and physical conditions present. In cases where data were lacking, the operator commissioned the collection of data necessary to fill any significant data gaps. For example, the collection of additional ROV video at and around the site is necessary to establish the physical and ecological condition of the site, as well as outside of the influence of the structure. Data gaps should be identified up-front during the planning phase of the NEBA-CA.
The NEBA-CA framework is intended to provide a differentiating weight of evidence regarding identifying and optimizing decommissioning options for maximizing ecosystem service benefits to society while managing both site risks and costs. Indication of changes in ecosystem service value, both ecological and socioeconomic, is developed from the identification of surrogate or proxy metrics to represent the flow of ecological and socioeconomic value. For example, site-specific changes in hard structure surface area, fish biomass, fish diversity, benthic biomass, and benthic diversity, or some combination thereof, may be used as a proxy to evaluate how various options may affect overall ecological habitat value. Likewise, site-specific changes in recreational fishing, commercial fishing, diving photography, and the fish processing sector, or some combination thereof, may be used to evaluate how various options might affect socioeconomic direct use value. Quantified metric estimates are approximate values and are not intended to be exact, but sufficient enough for identifying impacts and differences between options to a reasonable degree of certainty.
The approach used in NEBA-CA is to approximate the metric values for each of the options based on consistent assumptions where applicable. Assumptions should be kept internally consistent, where applicable, to account for their influence across all options. Internally consistent refers to the use of an assumption that remains constant among options so that all options are treated in a consistent manner. For example, for calculation purposes, a 300-year time frame was used to capture changes over multiple generations. Future predictions of changes in value are just that, predictions. However, by keeping the same predicted rate of change consistent throughout options, relative differences of the effects of implementing various options can be ascertained.
Conservative assumptions used within the North Sea case study are listed in Supplementary Table 2.
5 Conclusions
The NEBA-CA framework provides a transparent, objective, science-based decommissioning option selection approach that can assist decision makers in maximizing ecological, economic, and social benefits to the public while managing site risks and costs. Although the approach is data driven, it is primarily a desktop analysis that relies on readily available data and as such, data availability may be a limitation of the approach in some cases; however, based on the authors experience, most data required to conduct the analysis and associated modelling have been previously generated by the site operator as part of their development, monitoring, and regulatory requirements. Application of NEBA-CA to offshore decommissioning is consistent with the advantages of NEBA in that NEBA-CA directly addresses the ambiguity within available CA techniques that can arise when making decisions regarding the selection of appropriate decommissioning options. Offshore subsea structures have been shown to retain significant ecological value, physical removal of structure can adversely affect these values, and the ecological risks of the in-situ condition, if any, appear to be relatively small and limited in scale. The NEBA-CA framework supplements and strengthens the standard CA process by 1) incorporating quantified metrics including multigenerational ecosystem service benefits and risks, 2) excluding front ranking (scoring) or weighting of metrics, and 3) providing consistent graphical displays to support visual differentiation of options and metrics. Evaluation of risk management preferences and thresholds can further refine the NEBA-CA results to support an optimized option. Increased transparency in CAs will provide an additional layer of credibility with regulators and society.
Data availability statement
The datasets presented in this article are not readily available because the datasets for the case study are client confidential and provided for demonstration purposes. Requests to access the datasets should be directed to jnicolette@montrose-env.com.
Ethics statement
Ethical review and approval was not required for the animal study because non intrusive ROV data were used to observed benthic and fisheries populations. ROV data were collected as part of regulatory required monitoring.
Author contributions
JN: Conceptualization, Methodology, Formal analysis, Writing - Original Draft NN: Formal analysis, Writing - Original Draft MKR: Review and Editing - case study support MLR: Review and Editing - case study support AT: Review and Editing - case study support LW Writing - Review and Editing VT: Writing - Review and Editing. LJ Review and editing. All authors contributed to the article and approved the submitted version.
Funding
Montrose Environmental Solutions, Inc. had no funding role in the development of the framework presented in this paper or the decision to submit this paper for publication. The paper was developed independently by the authors. All authors declare no other competing interests.
Acknowledgments
The authors would like to thank a confidential operator for their approval to publish the case study results. We would also like to thank Montrose Environmental Solutions, Inc. for their contribution in paying the open-access publication fee. Lastly, copy editing by Editage author services was appreciated.
Conflict of interest
Authors JN, NN, MKR, MLR, and AT are employed by Montrose Environmental Solutions, Inc.
Authors LW and VT are employed by Ocean Science Consulting, Ltd. (OSC).
This paper presents an adaptation of the NEBA framework, a framework that the lead author co-authored and has over 30 years of experience, that supplements and strengthens the comparative assessment (CA) process for evaluating decommissioning options for offshore oil and gas facilities. The framework incorporates, in part, ecosystem service valuation approaches that several of the authors pioneered as part of US NRDA regulation development. The framework presented herein includes the culmination of over 10 years of offshore decommissioning option CA experience and was developed independent of any direction from either MEG or OSC. Additionally, a confidential operator, through a non-disclosure agreement, gave permission to the authors to publish site data based on this framework. All authors declare no other competing interests.
Publisher’s note
All claims expressed in this article are solely those of the authors and do not necessarily represent those of their affiliated organizations, or those of the publisher, the editors and the reviewers. Any product that may be evaluated in this article, or claim that may be made by its manufacturer, is not guaranteed or endorsed by the publisher.
Supplementary material
The Supplementary Material for this article can be found online at: https://www.frontiersin.org/articles/10.3389/fmars.2022.1020334/full#supplementary-material
Footnotes
- ^ A 1,000-year period was used as this represents a potential long-term period over which the structure would remain in place.
References
ANP (2020) Body of mines and energy (National Agency for Petroleum, Natural Gas and Biofuels). Available at: https://www.in.gov.br/web/dou/-/resolucao-n-817-de-24-de-abril-de-2020-254001378 (Accessed July 5, 2022). Resolution No. 817Section 1.
APPEA (2016) Offshore oil and gas decommissioning decision-making guidelines. Available at: https://www.stfs.com.au/wp-content/uploads/2016/12/APPEA-Decommissioning-Guidelines.pdf (Accessed July 5, 2022).
Arnould J. P. Y., Monk J., Ierodiaconou D., Hindell M. A., Semmens J., Hoskins A. J., et al. (2015). Use of anthropogenic sea floor structures by Australian fur seals: Potential positive ecological impacts of marine industrial development? PLoS One 10, e0130581–e0130581. doi: 10.1371/journal.pone.0130581. iss. 7.
Barnthouse L. (2008). The strengths of the ecological risk assessment process: linking science to decision making. Integrated Environ. Assess. Manage. 4 (3), 299–305. doi: 10.1897/IEAM_2007-065.1
Bateman I. J., Mace G. M., Fezzi C., Atkinson G., Turner K. (2011). Economic analysis for ecosystem service assessment. Environ. Resour. Econ. 48, 177–218. doi: 10.1007/s10640-010-9418-x
Bell N., Smith J. (1999). Coral growing on north Sea oil rigs. Nature 402 (6762), 601. doi: 10.1038/45127
British Petroleum (2011). Miller decommissioning programme. document number: MLR-A-D0-PM-PRO-00217 198 pp. Accessible at: https://www.bp.com/content/dam/bp/country-sites/en_gb/united-kingdom/home/pdf/Miller_Decomm_Programme.pdf. (Accessed 5 July 2022).
Brundtland G. (1987). Report of the world commission on environment and development: Our common future (United Nations General Assembly Document A/42/427) pp. 374. Accessible at: https://digitallibrary.un.org/record/139811?ln=en. (Accesed on 11 November, 2021)..
Chapman D., Iadanza N., Penn T. (1998). Calculating resource compensation: an application of the service-to-service approach to the blackbird mine hazardous waste site Vol. 97-1 (National Oceanic and Atmospheric Administration Damage Assessment and Restoration Program Technical Paper), 18. Accessible at: https://repository.library.noaa.gov/view/noaa/33285. (Accessed 5 July 2021).
Chapman D., LeJeune K. (2007). “REMEDE: Resource equivalency methods for assessing environmental damage in the EU,” in 6th framework programme of the European commission, deliverable no. 6A: Review report on resource equivalence methods and applications, 36.
Claisse J. T., Pondella D. J., Love M., Zahn L. A., Williams C. M., Williams J. P., et al. (2014). Oil platforms off California are among the most productive marine fish habitats globally. Proc. Natl. Acad. Sci. 111 (43), 15462–15467. doi: 10.1073/pnas.1411477111
CNR International (2012) Murchison Decommissioning comparative assessment report. document number: MURDECOM-CNR-PM-REP-00225. Available at: http://www.cnri-northsea-decom.com/Comparative-Assessment.pdf (Accessed July 5, 2022).
Confidential Client Report (2020). Net environmental benefit analysis based comparative assessment for the X jacket and associated subsea structures (North Sea Operator), 302.
Daan N., Gislason H., Pope J. G., Rice J. C. (2005). Changes in the north Sea fish community: Evidence of indirect effects of fishing? ICES J. Mar. Sci. 62 (2), 177–188. doi: 10.1016/j.icesjms
DMIRS (2017) Petroleum decommissioning guideline (Government of Western Australia). Available at: https://dmp.wa.gov.au/Documents/Petroleum/PET-DecommissioningGuideline.pdf (Accessed July 5, 2022).
Dunford R., Ginn T., Desvousges W. (2003). The use of habitat equivalency analysis in natural resource damage assessments. Ecol. Econ. 48, 49–70. doi: 10.1016/j.ecolecon.2003.07.011
Efroymson R. A., Nicolette J. P., Suter II, GW. (2003). A framework for net environmental benefit analysis for remediation or restoration of petroleum-contaminated sites Vol. 2003 (Oak Ridge, Tennessee: Oak Ridge National Laboratory) 34, 17.
Efroymson R. A., Nicolette J. P., Suter II, GW (2004). A framework for net environmental benefit analysis for remediation or restoration of contaminated sites Vol. 34 (Environmental Management), 315–331. Available at: https://link.springer.com/article/10.1007/s00267-004-0089-7.
Eigaard O., Bastardie F., Hintzen N. T., Buhl-Mortensen L., Buhl-Mortensen P., Catarino R., et al. (2017). The footprint of bottom trawling in European waters: Distribution, intensity, and seabed integrity. ICES J. Mar. Sci. 74 (3), 847–865. doi: 10.1093/icesjms/fsw194
European Commission (1992). Council directive 92/43/EEC of 21 may 1992 on the conservation of natural habitats and of wild fauna and flora. Off. J. Eur. Communities 206, 7–50.
Fowler A. M., Booth D. J. (2012). Evidence of sustained populations of a small reef fish on artificial structures. does depth affect production on artificial reefs? J. Fish Biol. 80 (3), 613–629. doi: 10.1111/j.1095-8649.2011.03201.x
Fowler A. M., Jørgensen A.-M., Svendsen J. C., Macreadie P. I., Jones D. O., Boon A. R., et al. (2018). Environmental benefits of leaving offshore infrastructure in the ocean. Front. Ecol. Environ. 16, 571–578. doi: 10.1002/fee.1827
Freeman A. M. (2003). The measurement of environmental and resource values: Theory and methods. 2nd ed (Washington, DC, USA: Resources for the Future).
Fujii T., Jamieson A. J. (2016). Fine-scale monitoring of fish movements and multiple environmental parameters around a decommissioned offshore oil platform: A pilot study in the north Sea. Ocean Eng. 126, 481–487. doi: 10.1016/j.oceaneng.2016.09.003
Gala W. R., Hill R. W., Hostetter L. A. (2008). “Use of habitat equivalency analysis (HEA) to determine the environmentally superior project alternative”. Soc. Petroleum Engineers (SPE) Paper No. 111760, SPE International Conference on Health, Safety, and Environment in Oil and Gas Exploration and Production, Nice, France. 9 pp.
Gass S. E., Roberts J. M. (2006). The occurrence of the cold-water coral lophelia pertusa (Scleractinia) on oil and gas platforms in the north Sea: Colony growth, recruitment and environmental controls on distribution. Mar. pollut. Bull. 52, 549–559. doi: 10.1016/j.marpolbul.2005.10.002
Gourvenec S. (2018). Shaping the offshore decommissioning agenda and next-generation design of offshore infrastructure. Proc. Institution Civil Engineers-Smart Infrastructure Construction 171, 54–66. doi: 10.1680/jsmic.18.00002
Gourvenec S., Sturt F., Reid E., Trigos F. (2022). Global assessment of historical, current and forecast ocean energy infrastructure: Implications for marine space planning, sustainable design and end-of-engineered-life management. Renewable Sustain. Energy Rev. 154, 111794. doi: 10.1016/j.rser.2021.111794
Government of New Zealand (2021) Exclusive economic zone and continental shelf (Environmental effects - decommissioning plans) regulations 2021. Available at: https://www.legislation.govt.nz/regulation/public/2021/0272/latest/whole.html#LMS548501 (Accessed July 5, 2022). Sections 29E-30.
Henry L. A., Ayorga-Adame C. G., Fox A. D., Polton J. A., Ferris J. S., McLellan F., et al (2018). Ocean sprawl facilitates dispersal and connectivity of protected species. Scientific Reports 8, 11346 doi: 10.1038/s41598-018-29575-4
IEA (2019b). Annual average decommissioning need for offshore oil and gas assets by region 2000-2040 (Paris: International Energy Association, IEA). Available at: https://www.iea.org/data-and-statistics/charts/annual-average-decommissioning-need-for-offshore-oil-and-gas-assets-by-region-2000-2040.
INEOS UK SNS Ltd (2021) Topaz decommissioning project comparative assessment. document number: RD-TOP-ZPL005-7. Available at: https://assets.publishing.service.gov.uk/government/uploads/system/uploads/attachment_data/file/962320/RD-TOP-ZPL005_7_Topaz_Comparative_Assessment_JAN2021_FINAL.pdf (Accessed July 5, 2022).
IOGP (2022). Habitat retention strategies for decommissioned offshore jacket structures (International Association of Oil and Gas Producers, IOGP Report 650), 54. Accessible at: https://www.iogp.org/bookstore/product/habitat-retention-strategies-for-decommissioned-offshore-jacket-structures/. (Accessed 5 July 2022).
Ithaca Energy Group Ltd (2021) Causeway-fionn decommissioning pipelines and umbilical comparative assessment. Available at: https://www.ithacaenergy.com/sites/ithaca/files/decommissioning/cfi-lla-it-de-re-0001-02-1-comparative-assessment.pdf (Accessed July 5, 2022). Document number: CFI-LLA-IT-DE-RE-0001.
Kenter J. O., Bryce R., Davies A., Jobstvogt N., Watson V., Ranger S., et al. (2013). The value of potential marine protected areas in the UK to divers and sea anglers (Cambridge, UK: UNEP-WCMC).
King D. M., Adler K. J. (1991). Scientifically defensible compensation ratios for wetland mitigation (Washington, DC, USA: United States Environmental Protection Agency, Office of Policy, Planning and Evaluation).
Løkkeborg S., Humborstad O. B., Jørgensen T., Soldal A. V. (2002). Spatiotemporal variations in gillnet catch rates in the vicinity of north Sea oil platforms. ICES J. Mar. Sci. 59, S294–S299. doi: 10.1006/jmsc.2002.1218
Lowe J. (2008). Intergenerational wealth transfers and social discounting: Supplementary green book guidance (Her Majesty's Treasury. The Crown) 9. ISBN: 978-1-84532-419-3. Accessible at: https://assets.publishing.service.gov.uk/government/uploads/system/uploads/attachment_data/file/193938/Green_Book_supplementary_guidance_intergenerational_wealth_transfers_and_social_discounting.pdf (Accessed on 5 June 2019).
Mannocci L., Dabin W., Augeraud-Véron E., Dupuy Jean-François, Ridoux V. (2012). Assessing the impact of bycatch on dolphin populations: The case of the common dolphin in the Eastern north Atlantic. PloS One 7, e32615. doi: 10.1371/journal.pone.0032615
McLean D. L., Ferreira L. C., Benthuysen J. A., Miller K. J., Schläppy M.-L., Ajemian M. J., et al. (2022). Influence of offshore oil and gas structures on seascape ecological connectivity. Global Change Biol. 28(11), 3515–3536.
Millennium Ecosystem Assessment (Program) (2005). Ecosystems and human well-being (Washington, D.C: Island Press).
Moore M. A., Boardman A. E., Vining A. R. (2013). More appropriate discounting: the rate of social time preference and the value of the social discount rate. J. Benefit-Cost Anal. 4 (1), 1–16. doi: 10.1515/jbca-2012-0008
Nelson N. A., Nicolette J. P., Testoff A. N., Duguid A. D. (2022). Safety zones and decommissioning in Situ/Artificial reefing in the Australian regulatory context: A net environmental benefit analysis-based comparative assessment (NEBA-CA) intergenerational value proposition. APPEA J. 62 (S1), S327–S333. doi: 10.1071/AJ21112
Nicolette J., Burr S., Rockel M. (2013a). A practical approach for demonstrating environmental sustainability and stewardship through a net ecosystem service analysis. Sustainability 2013(5), 2152–2177. doi: 10.3390/su5052152
Nicolette J., Goldsmith B., Wenning R., Barber T., Colombo F. (2013b). “Experience with restoration of environmental damage’. chapter 9 of the book entitled,” in The E.U. liability directive: A commentary. Eds. Berkamp L., Goldsmith B. (Oxford Press), 181–219. Published March 14, 2013. Available at: https://www.mdpi.com/2071-1050/5/5/2152.
NOAA (National Oceanic and Atmospheric Administration) (1999). Habitat equivalency analysis: an overview (Silver Springs, Maryland: Damage Assessment and Restoration Program, Damage Assessment Center).
NOAA (National Oceanic and Atmospheric Administration) (2011). “Summary report for fate and effects of remnant oil remaining in the environment,” in Annex m - net environmental benefit analysis (National Oceanic and Atmospheric Administration). Shigenaka, G. pp 48. Accessible at: https://www.restorethegulf.gov/sites/default/files/documents/pdf/Annex%20M%20NEBA.pdf (Accessed on 26 June 2019).
NOPSEMA (2022). ALARP guidance note, n-04300-GN0166, revision 6 Australia National Offshore Petroleum Safety and Environmental Management Authority. Available at: https://www.nopsema.gov.au/sites/default/files/documents/N-04300-GN0166%20-%20ALARP%20%28A138249%29.pdf
NOPSEMA (2018) The regulator (National Offshore Petroleum Safety and Environmental Management Authority). Available at: https://www.nopsema.gov.au/sites/default/files/documents/2021-04/A619419.pdf (Accessed July 5, 2022).
O&G UK (2013). Long term degradation of offshore structures and pipelines: Decommissioned and left in-situ, Report No. 002-121-RPT-001. pp 47. Accessible at: https://oeuk.org.uk/product/guidelines-for-long-term-degradation-of-offshore-structures-and-pipelines-issue-1/. (Accessed 10 January 2021)
O&G UK (2015). Guidelines for comparative assessment in decommissioning programmes. Issue 1, pp 49. ISBN: 1903004551. Accessible at: http://oeuk.org.uk/product/guidelines-for-comparative-assessment-in-decommissioning-programmes-issue-1/ (Accessed 10 March 2019).
O&G UK (2021) Decommissioning insight 2021. Available at: https://oeuk.org.uk/product/decommissioning-insight-report/.
OPRED (2018). “Decommissioning of offshore oil and gas installations and pipelines,” in ANNEX a - a guide to comparative assessments (Offshore Decommissioning Unit, Offshore Petroleum Regulator for Environment and Decommissioning, Department of Business, Energy and Industrial Strategy) pp 138. Accessible at: https://assets.publishing.service.gov.uk/government/uploads/system/uploads/attachment_data/file/760560/Decom_Guidance_Notes_November_2018.pdf (Accessed on 9 January 2020).
OSPAR (1998). Decision 98/3 on the disposal of disused offshore installations, OSPAR convention for the protection of the marine environment of the north-East Atlantic (Sintra: Ministerial Meeting of the OSPAR Commission), 12. 22-23 July 1998, Annex 33 (Ref. § B-5.6).
Pandolfi J. M., Bradbury R. H., Sala E., Hughes T. P., Bjorndal K. A., Cooke R. G., et al. (2003). Global trajectories of the long-term decline of coral reef ecosystems. Sci. (American Assoc. Advancement Science) 301 (5635), 955–958. doi: 10.1126/science.1085706
Petroleum Institute of Thailand (2008) Draft Thailand decommissioning guidelines for upstream installations (Accessed 5 July 2022). Petroleum Institute of Thailand. 2008. Draft Thailand Decommissioning Guidelines for Upstream. International Decommissioning. The guidelines cover the onshore and offshore decommissioning of installations for - [PDF Document] (vdocuments.net).
Petroleum Safety Authority (Norway) (2020) Regulation guidelines for petroleum activities, chapter 6 sections 43-45a. Available at: https://www.npd.no/en/regulations/regulations/petroleum-activities/#Section-43 (Accessed July 5, 2022).
Raffensperger C., Tickner J. (Eds.) (1999). Protecting public health and the environment: Implementing the precautionary principle (Washington, DC: Island Press).
Reeds K. A., Smith J. A., Suthers I. M., Johnston E. L. (2018). An ecological halo surrounding a Large offshore artificial reef: Sediments, infauna, and fish foraging. Mar. Environ. Res. 141, 30–38. doi: 10.1016/j.marenvres.2018.07.011
Roberts J. M. (2002). The occurrence of the coral lophelia pertusa and other conspicuous epifauna around an oil platform in the north Sea. Underwater Technol. 25 (2), 83–92. doi: 10.3723/175605402783219163
Rosenberger R. S., Loomis J. B. (2001). Benefits transfer of outdoor recreation use values; rocky mountain research station Vol. 2001 (Fort Collins, CO, USA: U.S.D.A. Forest Service).
Scarborough-Bull A., Love M. S., Schroeder D. M. (2008). Artificial reefs as fishery conservation tools: Contrasting the roles of offshore structures between the gulf of Mexico and the southern California bight. Am. Fisheries Soc. Symposium 49, 899–915.
Shell International Petroleum Co. Ltd (2017) Gaupe decommissioning programme comparative assessment report. document number: GAUPD-PT-S-AA-7480-00001 rev A02. Available at: https://assets.publishing.service.gov.uk/government/uploads/system/uploads/attachment_data/file/891475/Gaupe_Comparative_Assessment.pdf (Accessed July 5, 2022).
Soldal A. V., Svellingen I., Jørgensen T., Løkkeborg S. (2002). Rigs-to-reefs in the north Sea: hydroacoustic quantification of fish in the vicinity of a "semi-cold" platform. ICES J. Mar. Sci. 59, S281–S287. doi: 10.1006/jmsc.2002.1279
Spirit Energy (2018) Ensign comparative assessment for pipelines. document number: SPT-DCM-SNS0104-REP-0003. Available at: https://www.spirit-energy.com/media/1297/spt-dcm-sns0104-rep-0003-a3-signed.pdf (Accessed July 5, 2022).
Testoff A. N., Nelson N. A., Nicolette J. P. (2022). A quantitative method for evaluating ecological risks associated with long-term degradation of deep-Sea plastic-containing infrastructure. APPEA J. 62 (1), 141–158. doi: 10.1071/AJ21113
Todd V. L. G., Lavallin E. W., Macreadie P. I. (2018). Quantitative analysis of fish and invertebrate assemblage dynamics in association with a north Sea oil and gas installation complex. Mar. Environ. Res. 142, 69–79. doi: 10.1016/j.marenvres.2018.09.018
Todd V., McLean D. L., Ferreira L. C., Benthuysen J. A., Miller K. J., Schläppy M., et al. (2022a). Influence of offshore oil and gas structures on seascape ecological connectivity. Global Change Biol. 28, 3515–3536. doi: 10.1111/gcb.16134
Todd V. L. G., Pearse W. D., Tregenza N. C., Lepper P. A., Todd I. B. (2009). Diel echolocation activity of harbour porpoises (Phocoena phocoena) around north Sea offshore gas installations. ICES J. Mar. Sci. 66, 734–745. doi: 10.1093/icesjms/fsp035
Todd V. L. G., Susini I., Williamson L. D., Todd I. B., McLean D. L., Macreadie P. I. (2021). Characterising the second wave of fish and invertebrate colonisation and production potential of an offshore petroleum platform. ICES J. Mar. Sci. 78, 1131–1145. doi: 10.1093/icesjms/fsaa245
Todd V. L. G., Warley J. C., Todd I. B. (2016). Meals on wheels? a decade of megafaunal visual and real-time passive acoustic monitoring detections from on-tow and stationary offshore oil and gas rigs and platforms in the north and Irish seas. PLoS One 11, 25. doi: 10.1371/journal.pone.0153320
Todd V. L. G., Williamson L. D., Couto A. S., Todd I. B., Clapham P. J. (2022b). Effect of a new offshore gas platform on harbor porpoises in the dogger bank. Mar. Mammal Sci. 38 (4), 1609–1622. doi: 10.1111/mms.12949
UK Government (2011). “National ecosystems assessment. technical report. chapter 12,” in Marine (Cambridge: UNEP-WCMC).
UNEP/MED (2022) Decision IG.24/9. Mediterranean offshore guidelines and standards: (a) common standards and guidance on the disposal of oil and oily mixtures and the use and disposal of drilling fluids and cuttings; (b) common standards and guidelines for special restrictions or conditions for specially protected areas (SPA) within the framework of the Mediterranean offshore action plan. Available at: https://wedocs.unep.org/bitstream/handle/20.500.11822/31707/19ig24_22_2409_eng.pdf (Accessed July 5, 2022).
United States (1997). United states v. Melvin Fisher, United States District Court for the Southern District of Florida, Key West Division Case Numbers 92–10027-CIV-DAVIS, and 95–10051-CIV-DAVIS. Decided 30 July 1997, Filed 30 July 1997. 977 F. Supp. 1193; 1997 U.S. Dist. LEXIS 16767.
United States (2001). United states of America and internal improvement trust fund v. great lakes dredge and dock company (United States District Court for the Southern District of Florida D. C). Docket No. 97–02510-CV-EBD. Available at: https://caselaw.findlaw.com/us-11th-circuit/1302158.html.
Unsworth R. E., Bishop R. C. (1994). Assessing natural resource damages using environmental annuities. Ecol. Economics 11, 35–41. doi: 10.1016/0921-8009(94)90048-5
USEPA (1997). Ecological risk assessment guidance for superfund: Process for designing and conducting ecological risk assessments (EPA 540-R-97-006) (Washington, DC: USEPA, OSWER).
USEPA (2004). An examination of EPA risk assessment principles and practices: Staff paper prepared for the U.S (Environmental Protection Agency by members of the Risk Assessment Task Force). EPA/100/B-04/001. March. pp 193. Accessible at: https://semspub.epa.gov/work/10/500006305.pdf. (Accessed on 5 March 2019)
USEPA Science Advisory Board (SAB) (2009). Valuing the protection of ecological systems and services (EPA-SAB-09-012) (Washington, DC: USEPA Science Advisory Board).
Wolfson A., Van Blaricom G., Davis N., Lewbel G. S. (1979). The marine life of an offshore oil platform. Mar. Ecol. Prog. Ser. 1, 81–89. doi: 10.3354/meps001081
Xodus Group (2021) Dunlin alpha decommissioning comparative assessment report. document number: A-301649-S07-REPT-005 (Fairfield Betula Ltd). Available at: http://www.fairfield-energy.com/assets/documents/A-301649-S07-REPT-005.pdf (Accessed July 5, 2022).
Keywords: net environmental benefit analysis, comparative assessment, decommissioning, offshore platform, North Sea, multiple criteria decision analysis, NEBA, NEBA-CA
Citation: Nicolette JP, Nelson NA, Rockel MK, Rockel ML, Testoff AN, Johnson LL, Williamson LD and Todd VLG (2023) A framework for a net environmental benefit analysis based comparative assessment of decommissioning options for anthropogenic subsea structures: A North Sea case study. Front. Mar. Sci. 9:1020334. doi: 10.3389/fmars.2022.1020334
Received: 16 August 2022; Accepted: 07 December 2022;
Published: 25 January 2023.
Edited by:
Stelios Katsanevakis, University of the Aegean, GreeceReviewed by:
Ibon Galparsoro, Technological Center Expert in Marine and Food Innovation (AZTI), SpainRafael Sarda, (CSIC), Spain
Copyright © 2023 Nicolette, Nelson, Rockel, Rockel, Testoff, Johnson, Williamson and Todd. This is an open-access article distributed under the terms of the Creative Commons Attribution License (CC BY). The use, distribution or reproduction in other forums is permitted, provided the original author(s) and the copyright owner(s) are credited and that the original publication in this journal is cited, in accordance with accepted academic practice. No use, distribution or reproduction is permitted which does not comply with these terms.
*Correspondence: Joseph P. Nicolette, Jnicolette@Montrose-env.com