Characteristics and patterns of marine debris in the Chinese beach-sea continuum
 Xiaoguang Ouyang1,2*
  Zhifeng Yang1,2
- 1Southern Marine Science and Engineering Guangdong Laboratory (Guangzhou), Guangzhou, China
- 2Guangdong Provincial Key Laboratory of Water Quality Improvement and Ecological Restoration for Watersheds, School of Ecology, Environment and Resources, Guangdong University of Technology, Guangzhou, China
The amounts of marine debris and plastic pollution have been growing dramatically in the environment. Floating marine debris can be transported between the sea and coastal zone by various processes. However, it remains unknown if marine debris in the sea and coastal zone are quantitatively related. This study collected time-series data on marine debris (including plastics) from China’s beaches and adjoining seas over a 10-year period (2012–2021). It aims to investigate (1) the characteristics of debris distribution in the beach-sea continuum, (2) the relationships among the density and accumulation density of marine debris on beaches, sea surfaces and seafloors. Our results show that the density of marine debris and plastics on beaches and seafloors in the pandemic period were 3–5 folds of those in the pre-pandemic period. The density (104682.4 ± 27793.0 items km–2) and accumulation density (1787.4 ± 220.0 kg km–2) of marine debris on beaches were significantly higher than those on both sea surfaces (3320.8 ± 446.0 items km–2 and 21.6 ± 5.7 kg km–2) and seafloors (2453.7 ± 868.4 items km–2 and 117.5 ± 70.4 kg km–2). The density of plastics on beaches (85373.0 ± 21633.8 items km–2) was significantly higher than that on sea surfaces (2915.4 ± 365.8 items km–2) and seafloors (2254.2 ± 717.1 items km–2). The density of small-to-medium (0–10cm) floating debris (3419.5 ± 418.2 items km–2) was more than 100 times higher than the density of large (> 10cm) floating debris (29.6 ± 3.1 items km–2). The proportion of plastics in marine debris on sea surfaces (83.3 ± 1.3%) was significantly higher than that on beaches (74.1 ± 2.5%) but not significantly different from that on seafloors (81.1 ± 3.0%). There are significant relationships between the density of debris on seafloors and that on beaches, between the density or accumulation density of debris on seafloors and that on sea surfaces. This study suggests that the density and accumulation density of marine debris on seafloors were closely associated with those on sea surfaces and beaches. The results can help to estimate the transportation, deposition and aggregation of marine debris from beaches and sea surfaces to seafloors.
Introduction
Marine debris includes any anthropogenic, manufactured, or processed solid material discarded, disposed of, or abandoned that ends up in the marine environment (Shevealy et al., 2012; UNEP, 2021). It can be discarded into or carried by wind, storm/flood events, river or pluvial systems, and by deliberate or accidental disposal into the marine environment (UNEP, 2009; Marin et al., 2019; Jian et al., 2022; Daniel et al., 2022). It is a marker of the Anthropocene and has widespread effect on society and human wellbeing due to the serious threats to the livelihoods of coastal communities as well as to shipping and port operations (UNEP, 2021). Globally, plastics are the major components of marine debris based on per number of items (Gregory & Ryan, 1997; Derraik, 2002). Marine debris threatens marine organisms due to debris ingestion (Foekema et al., 2013; Abbasi et al., 2018; Fang et al., 2018; Not et al., 2020) and entanglement (Allen et al., 2012; Panti et al., 2019; Parton et al., 2019), and has negative effects on biota abundance and macrophyte survival in marine ecosystems (Duan et al., 2021; Ouyang et al., 2022). Debris can be transported from the land to the ocean downstream by rivers (Lebreton et al., 2017), storm/flood events (Jian et al., 2022; Daniel et al., 2022) or via dry deposition (Zhang et al., 2020), and be carried to the coastal region from the oceans by nearshore currents, intentional or accidental disposal (UNEP, 2009).
Beaches are directly connected to seas and receive debris from both the land and seas while debris can be concomitantly transported from beaches to the seas. The average density of marine debris across sampling beaches was estimated to reach 1,264.92 items m–2 in a recent global synthesis (Serra-Gonçalves et al., 2019), which is much higher than that (0–0.0149 items m–2) in the sea and the open ocean worldwide (Barnes et al., 2009). However, the reported density of marine debris was mostly estimated or analysed based on individual surveys investigating the density and types of beach debris at single locations (e.g., Browne et al., 2015; Bouwman et al., 2016: Cheung et al., 2016). There is a lack of knowledge on the density patterns of beach and sea debris using robust sampling campaigns, such as repeated sampling on beaches and the seas over time in the same regions. This is of paramount importance as the recent pandemic (i.e., outbreak of COVID-19) may stimulate the disposable of waste products (e.g., face masks, disposable plastic bags and lunch boxes) discarded or transported to the terrestrial and aquatic environments (Liu et al., 2021; Du et al., 2022), including beaches and seas. For example, the pandemic has resulted in the single-use face mask production increasing 12 times more than pre-pandemic levels in China (Adyel, 2020) and a surge in the generation of 472.3 tonnes day–1 more plastics than usual from the use of disposable personal protective equipment and other single-use plastic items in Bangladesh (Haque et al., 2021). The amount of plastic wastes generated worldwide since the outbreak was estimated at 1.6 million tonnes day-1 at the global scale and the momentum of decades-long global battle to reduce plastic pollution will be reversed by COVID-19 (Benson et al., 2021). Nonetheless, it remains unknown the magnitude of increase in debris on beaches and the seas during the pandemic period in comparison with the pre-pandemic period in China.
Different processes may control the transport of marine debris between beaches and the seas. The horizontal large-scale flow is the most efficient way of transporting debris over large distance, allowing connections between ecoregions and transport across basins (van Sebille et al., 2020). Microplastics, i.e., plastics in the size range of 0-5mm, can be subjected to vertical mixing, biofouling and suspended load transport until arriving at terminal deposition habitats (Zhang, 2017). A wide array of factors influence their vertical migration, including their own physical and chemical properties (Qian et al., 2020), the adsorption of materials that accelerate deposition and resuspension. Microplastic particles may aggregate with suspended inorganic particles such as clay as was shown experimentally for nano-sized polystyrene spheres (Besseling et al., 2017). Strong storms and winds may facilitate the transport of marine debris to beaches, in particular during extreme weather events, e.g., typhoons (Lo et al., 2020), and then to the adjoining seas. For the transport and transfer of marine debris, beaches and the seas are a continuum within the whole land-sea continuum. Here, we define the beach-sea continuum as the interfaces between the beaches and sea surfaces, as well as between the sea surfaces and seafloors. To date, there is a lack of understanding on relationships between the density and accumulation density of marine debris on different interfaces of the beach-sea continuum.
This study collects data on different characteristics of marine debris, including the density, the accumulation density and the proportion of plastics in marine debris in the Chinese beach-sea continuum. The study aims to address the current knowledge gaps on (1) the patterns of beach and sea debris using time series (2012–2021) data on the density and accumulation density of marine debris in the Chinese beach-sea continuum and (2) the relationships between the density and accumulation density of marine debris, as well as proportions of plastics in marine debris on different interfaces of the beach-sea continuum using the same dataset. We hypothesize that the density and accumulation density of marine debris, and proportions of plastics in marine debris on different interfaces of the continuum are related. Specifically, the research questions of this study include (1) will the density and accumulation density of marine debris vary over time in the beach-sea continuum? (2) are there significant differences in the density and accumulation density of marine debris and proportions of plastics in marine debris on different interfaces of the beach-sea continuum? (3) are there significant relationships between the density and accumulation density of marine debris on different interfaces of the beach-sea continuum?
Materials and methods
Data collection
Time-series data on the characteristics and distribution of marine debris in the Chinese beach-sea continuum were collected from Ministry of Ecology and Environment, China (MEE) (MEE, 2018–2021a) and State Bureau of Oceanic Administration, China (SBOA) (SBOA, 2012–2017a). Here the Chinese seas include the Bohai sea (78, 000km2), the Yellow sea (380, 000km2), the East China Sea (1,249,000 km2) and the South China Sea (3,500,000 km2) along the north-to-south gradient. The interfaces of the beach-sea continuum were divided into beaches, sea surfaces and seafloors. The data collected in our study mainly include (1) the density (items km-2) of marine debris, (2) the accumulation density (kg km-2) of marine debris, and (3) the proportion of plastics in marine debris in various environmental components: beaches, seafloors, sea surfaces. In general, the database includes data on the annual average of marine debris over the whole country during 2012–2021. There are also density data on large and small-to-medium floating debris identified for sea surfaces. Debris was classified using SBOA definitions, where small debris is 0 to 2.5cm, medium debris is 2.5 to 10 cm and large debris is larger than 10 cm. The density of small and medium debris were estimated as a whole by SBOA. Thus, we used small-to-medium debris (0 to 10 cm) to represent the density of small and medium debris. Further, density data on sea surface and seafloor debris from available monitoring stations over the country were also collected where available.
Surveys were performed as allowed by ocean conditions from June 25 to October 7 in the North Zone and from June 1 to October 31 in the South Zone during 2012-2021. For both sandy and gravel/cobble beaches, marine debris was monitored by the visual census method and superficial debris was collected, counted, weighed by balances (precision: 0.01g) posteriorly and the size was measured from quadrats. The number of quadrats depended on the beach width of each transect and at least two quadrats were established for each transect. Each quadrat usually covered an area of 10m×10m. The width and/or length of the transects vary from beach to beach. No less than 2, 3 and 5 quadrats were established if the length of beaches is<2km, 2-5km and >5km, respectively. For sea surfaces, large debris was collected using the strip transect method which was used to calculate the density of debris combining the number of debris with the maximum distance perpendicular to the transect and the total length of the transect. Small-to-medium debris was collected by trawling nets. For seafloors, debris was monitored by trawling nets which were thrown from the slope on the back of monitoring ships and then were attached to seafloors. The nets moved on the seafloors when the ship was driven for 15-30 minutes. The height of the nets is 0.5m and the width of the opening mouth is ≥1m. The trawling time is 15-30 minutes. The trawling depth depends on the water depth of the monitoring area. The trawling nets were made of plastics. Nets were raised and moved out of sea surfaces by the weighted pulley system after trawling. The pore size of trawling nets is 0.5cm. The number of samples at each monitoring section were set up to follow SBOA (2015), i.e., 3-5 monitoring sections for beaches and 3 monitoring sections for sea surfaces and seafloors. The types of marine debris included but were not limited to plastics, paper and cardboard, rubber, metals, glasses and cloth. The classification of marine debris was in line with that defined by United Nations Environmental Programme (UNEP) (UNEP, 2021). For plastics, the main types included foams, plastic fragments and fibers. However, the density and other data on different types of marine debris and plastics are not readily available. The density and accumulation density of marine debris were calculated as below
Where Density (items km–2) and Accumulation density (kg km–2) are the density and accumulation density of marine debris with sampling methods denoted by subscripts,
A is the area of a quadrat (km2). n (items) and W (kg) are the number and weight of marine debris from monitoring sections, respectively. L (m) and w (m) are the total length of the transect and the maximum distance perpendicular to the transect, respectively. D (m) and P (m) are the trawling distance and the mouth width of trawling nets, respectively.
Numerical changes in the monitoring stations of marine debris during 2012–2021except 2015 in Chinese Seas were shown in Figure 1. The number of monitoring stations in the Bohai Sea, the Yellow sea, the East China Sea and the South China Sea fluctuated in the ranges of 8–14 (Figure 1A), 6–11 (Figure 1B), 8–16 (Figure 1C) and 7–17 (Figure 1D), respectively. Annual data on the density and accumulation density of marine debris for the whole country are available while those for each Chinese sea are unavailable. The density of plastics in marine debris was unavailable from the source data and was calculated by combining the density of marine debris and the proportion of plastics in marine debris as below
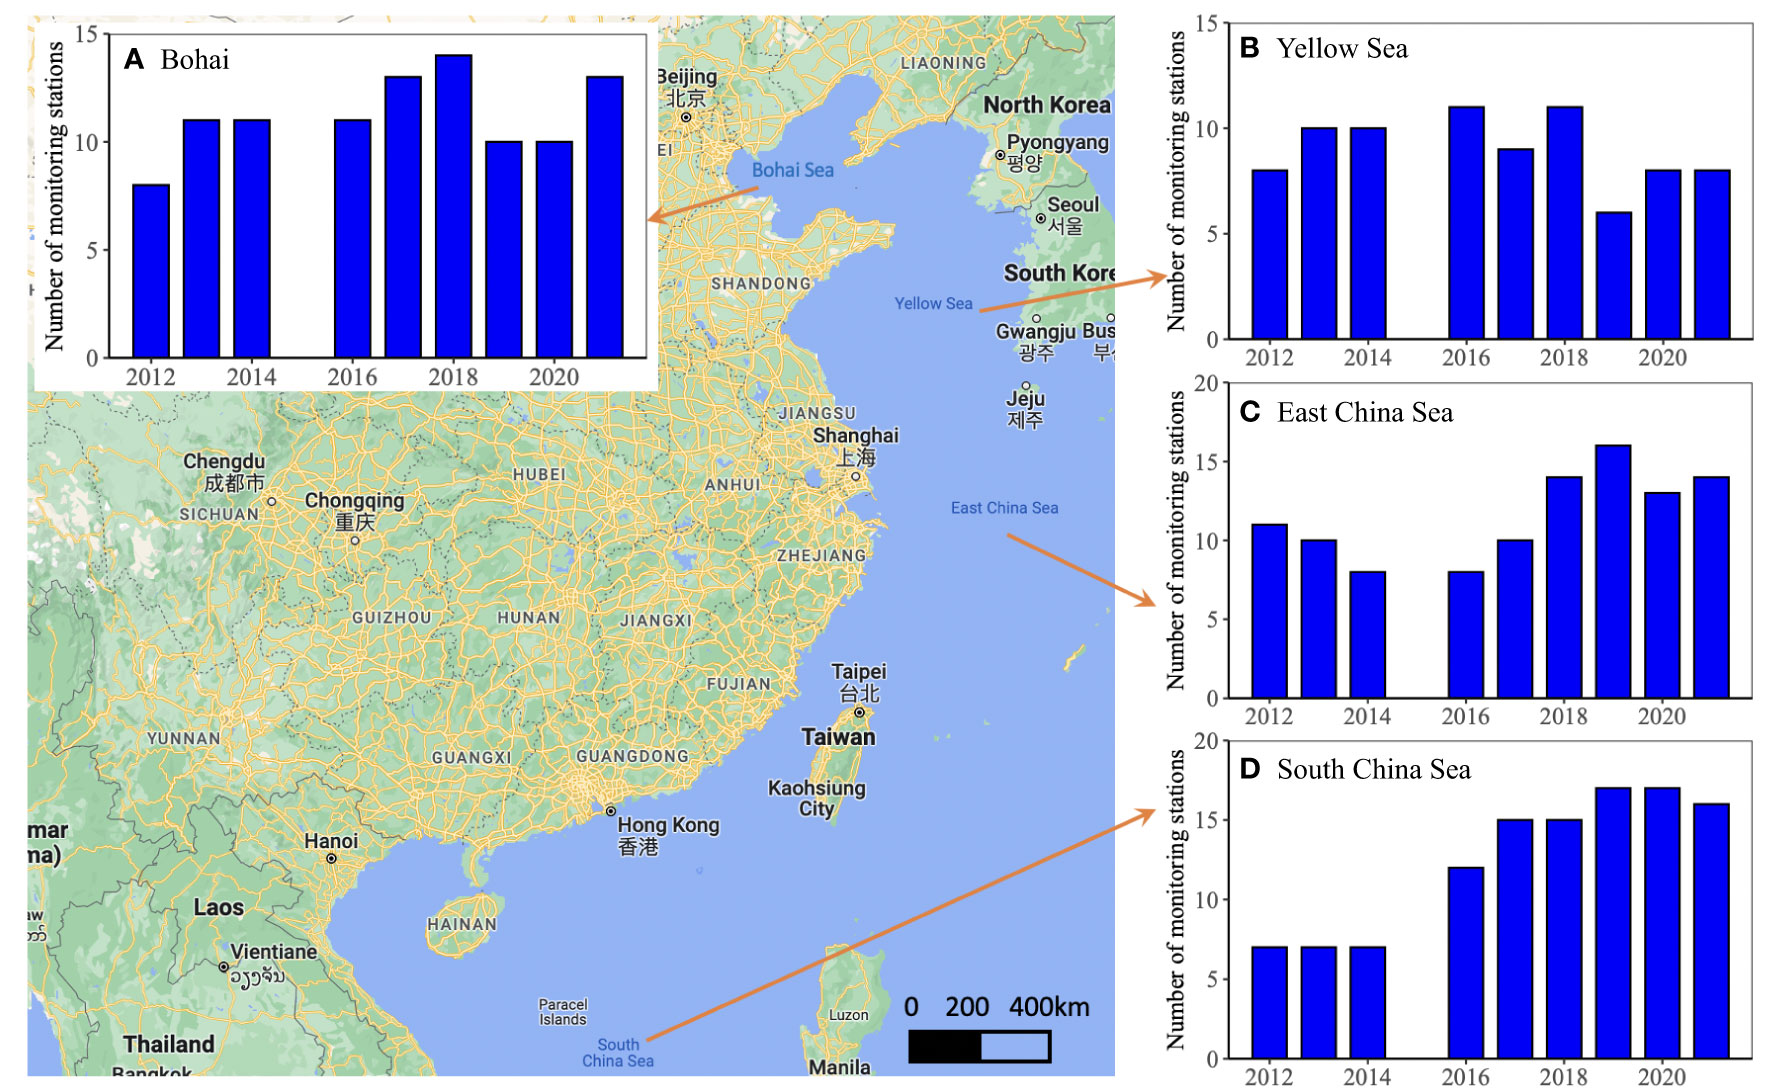
Figure 1 Number of monitoring stations of marine debris in Chinese seas during 2012–2021. The bar charts show number of monitoring stations in the Bohai Sea (A), the Yellow Sea (B), the East China Sea (C) and the South China Sea (D), respectively.
Where Densityplastics is the density of plastics in marine debris, items km–2. Densitydebris is the density of marine debris, items km–2. plastics% is the proportion of plastics in marine debris.
Data analysis
Analysis of variance (ANOVA) was performed to examine the difference in the density and accumulation density of marine debris, as well as the difference in the proportion of plastics in marine debris on different interfaces of the beach-sea continuum. When there was a significant treatment effect, Tukey’s HSD test was done to further examine the significant difference between the two groups. The assumptions of normality and homogeneity of variance were tested by the Shapiro-Wilk normality test and Levene’s test (α=0.05), respectively. Data were transformed (e.g., log-transformation) if the assumptions could not be met. Non-parametric ANOVA (namely Kruskal-Wallis test) was performed if the transformed data still could not met the assumptions. The Mann-Whitney test was run to further examine the significant difference if there is a treatment effect for the non-parametric ANOVA. The Mann-Whitney test was used to examine the differences in the density and accumulation density of marine debris, as well as the proportion of plastics in marine debris between the COVID-19 pandemic (2019–2021) and pre-pandemic (2012–2018) period.
Regression analyses were performed to examine the relationships between the density and accumulation density of marine debris on different interfaces of the beach-sea continuum, as well as the relationship between the proportion of plastics in sea surface and beach debris. The assumption of normality was tested by the Shapiro-Wilk normality test. Data were log-transformed if the assumption could not be met.
Data analyses were done using R programming language (R Core Team, 2022). The package ‘car’ was used for ANOVA (Fox and Weisberg, 2011). The significance level of statistic analysis was ‘α=0.05’. Data are presented as mean ± standard error (SE).
Results
Temporal variation in the density and accumulation density of marine debris in the beach-sea continuum
Our results show that the density and accumulation density of marine debris fluctuated without clear annual patterns on different interfaces of the beach-sea continuum, including beaches, sea surfaces and seafloors. Specifically, the highest density of marine debris on beaches and seafloors arrived at 280,043 items km–2 in 2019 and 7,348 items km–2 in 2020, respectively, which were one order of magnitude higher than the lowest ones (50,142 items km–2 in 2014 and 575 items km–2 in 2013, respectively, Figure 2A). in contrast, the highest density of marine debris on sea surfaces (5,519 items km–2 in 2012) only doubled that of the lowest one (2,236 items km–2 in 2014). In general, the density of small-to-medium floating debris hit 3,419.5 ± 418.2 items km–2 (2,206–5,482 items km–2), which was two orders of magnitude higher than that of large floating debris (29.6 ± 3.1 items km–2, 20–50 items km–2, Figure 2B) on sea surfaces. The highest accumulation density of marine debris on sea surfaces and seafloors arrived at 65 kg km–2 and 671 kg km–2 in 2016, respectively, which were one order of magnitude higher than the lowest ones (3.6 and 11.1 items km–2 in 2021, respectively, Figure 2C). In contrast, the highest accumulation density of marine debris on beaches (3,119 items km–2 in 2014) only tripled that of the lowest one (1,105 items km–2 in 2015). Further, the proportion of plastics in marine debris fluctuated between 74.1 ± 2.5% and 83.3 ± 1.3% with the highest and lowest values occurring on sea surfaces in 2021 and seafloors in 2016, respectively (Figure 2D). Combining the proportion of plastics in marine debris and the densities of marine debris, the density of plastics were estimated to range 35,600.8 – 228,795.1 items km–2 on beaches, 477.4 – 6,106.2 items km–2 on seafloors and 1,721.7 – 4,415.2 items km–2 on sea surfaces, respectively.
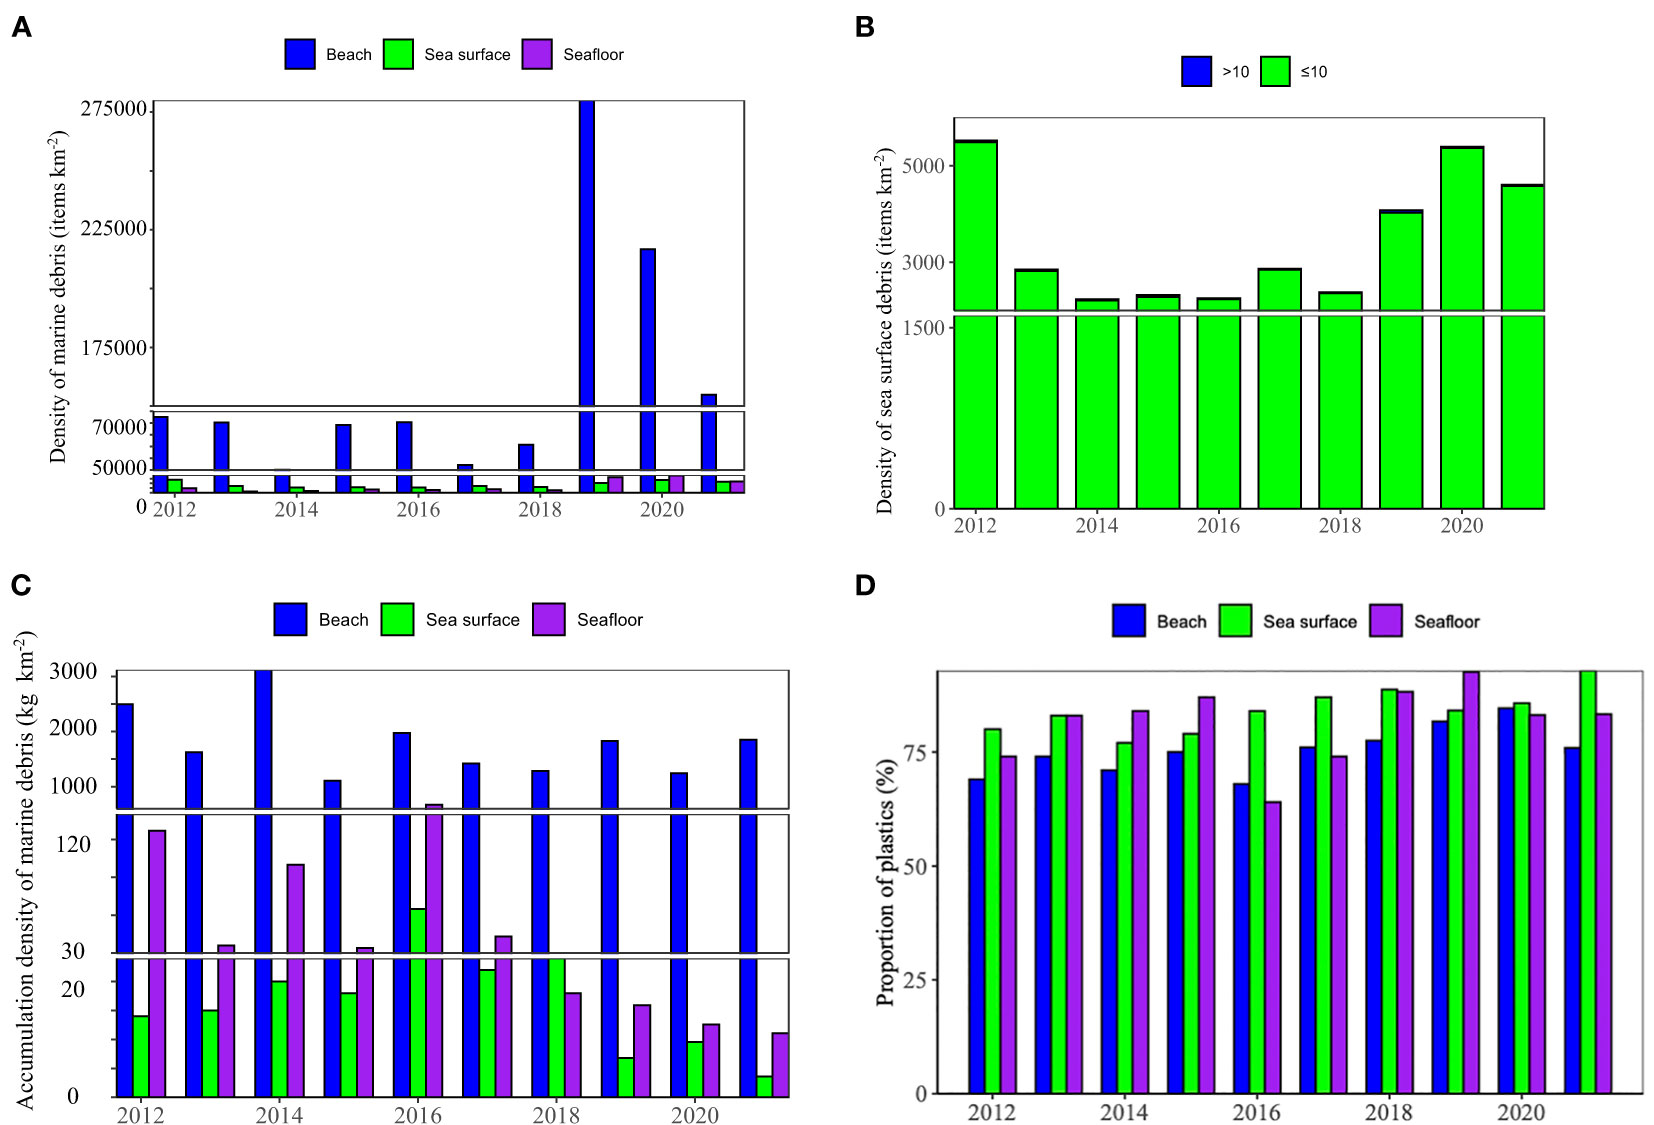
Figure 2 Variation in the density and accumulation density of marine debris over 2012–2021 in the beach-sea continuum. The panels include the variation in the density (A), density of large (>10cm) and small-to-medium (0–10cm) floating debris on sea surfaces (B), accumulation density (C) of and proportion of plastics (D) in marine debris.
The density and accumulation density of marine debris, however, show clear patterns in the comparisons between the pandemic (2019–2021) and pre-pandemic (2012–2018) periods in specific interfaces of the beach-sea continuum while no patterns were found for others. Specifically, the density of marine debris on beaches and seafloors in the pandemic period arrived at 217,182.7 ± 36,150.8 items km–2 and 6,250.3 ± 768.4 items km–2, respectively, and were significantly higher than those in the pre-pandemic period (63,630.0 ± 3,527.9 items km–2 and 1,157.4 ± 162.8 items km–2, Mann-Whitney test, P<0.05, Figures 3A, I). In contrast, there was not a significant difference in the density of marine debris on sea surfaces between the pandemic and the pre-pandemic periods (Mann-Whitney test, P>0.05, Figure 3E). Similarly, the density of plastics on beaches (176,539.8 ± 32,304.9 items km–2) and seafloors (5,407.3 ± 717.0 items km–2) in the pandemic period were also significantly higher than those in the pre-pandemic period (46,301.5 ± 2,391.4 items km–2 and 902.8 ± 118.3 items km–2, Mann-Whitney test, P<0.05, Figures 3B, J). However, no significant differences were found for the density of plastics on sea surfaces between the pandemic (4,108.4 ± 353.9 items km–2) and pre-pandemic (2,404.1 ± 351.7 items km–2) periods (Mann-Whitney test, P>0.05, Figure 3F). The accumulation densities of marine debris on sea surfaces and seafloors in the pandemic period arrived at 6.7 ± 1.7 kg km–2 and 13.2 ± 1.4 kg km–2, respectively, and were significantly lower than those in the pre-pandemic period (25.4 ± 6.7 kg km–2 and 147.0 ± 88.6 kg km–2, Mann-Whitney test, P<0.05, Figures 3G, K). However, there was not a significant difference in the accumulation density of marine debris on beaches between the pandemic and the pre-pandemic periods (Mann-Whitney test, P>0.05, Figure 3C). Further, no significant differences in the proportions of plastics between the pandemic and pre-pandemic periods were found for all the interfaces of the beach-sea continuum (Mann-Whitney test, P>0.05, Figures 3D, H, L).
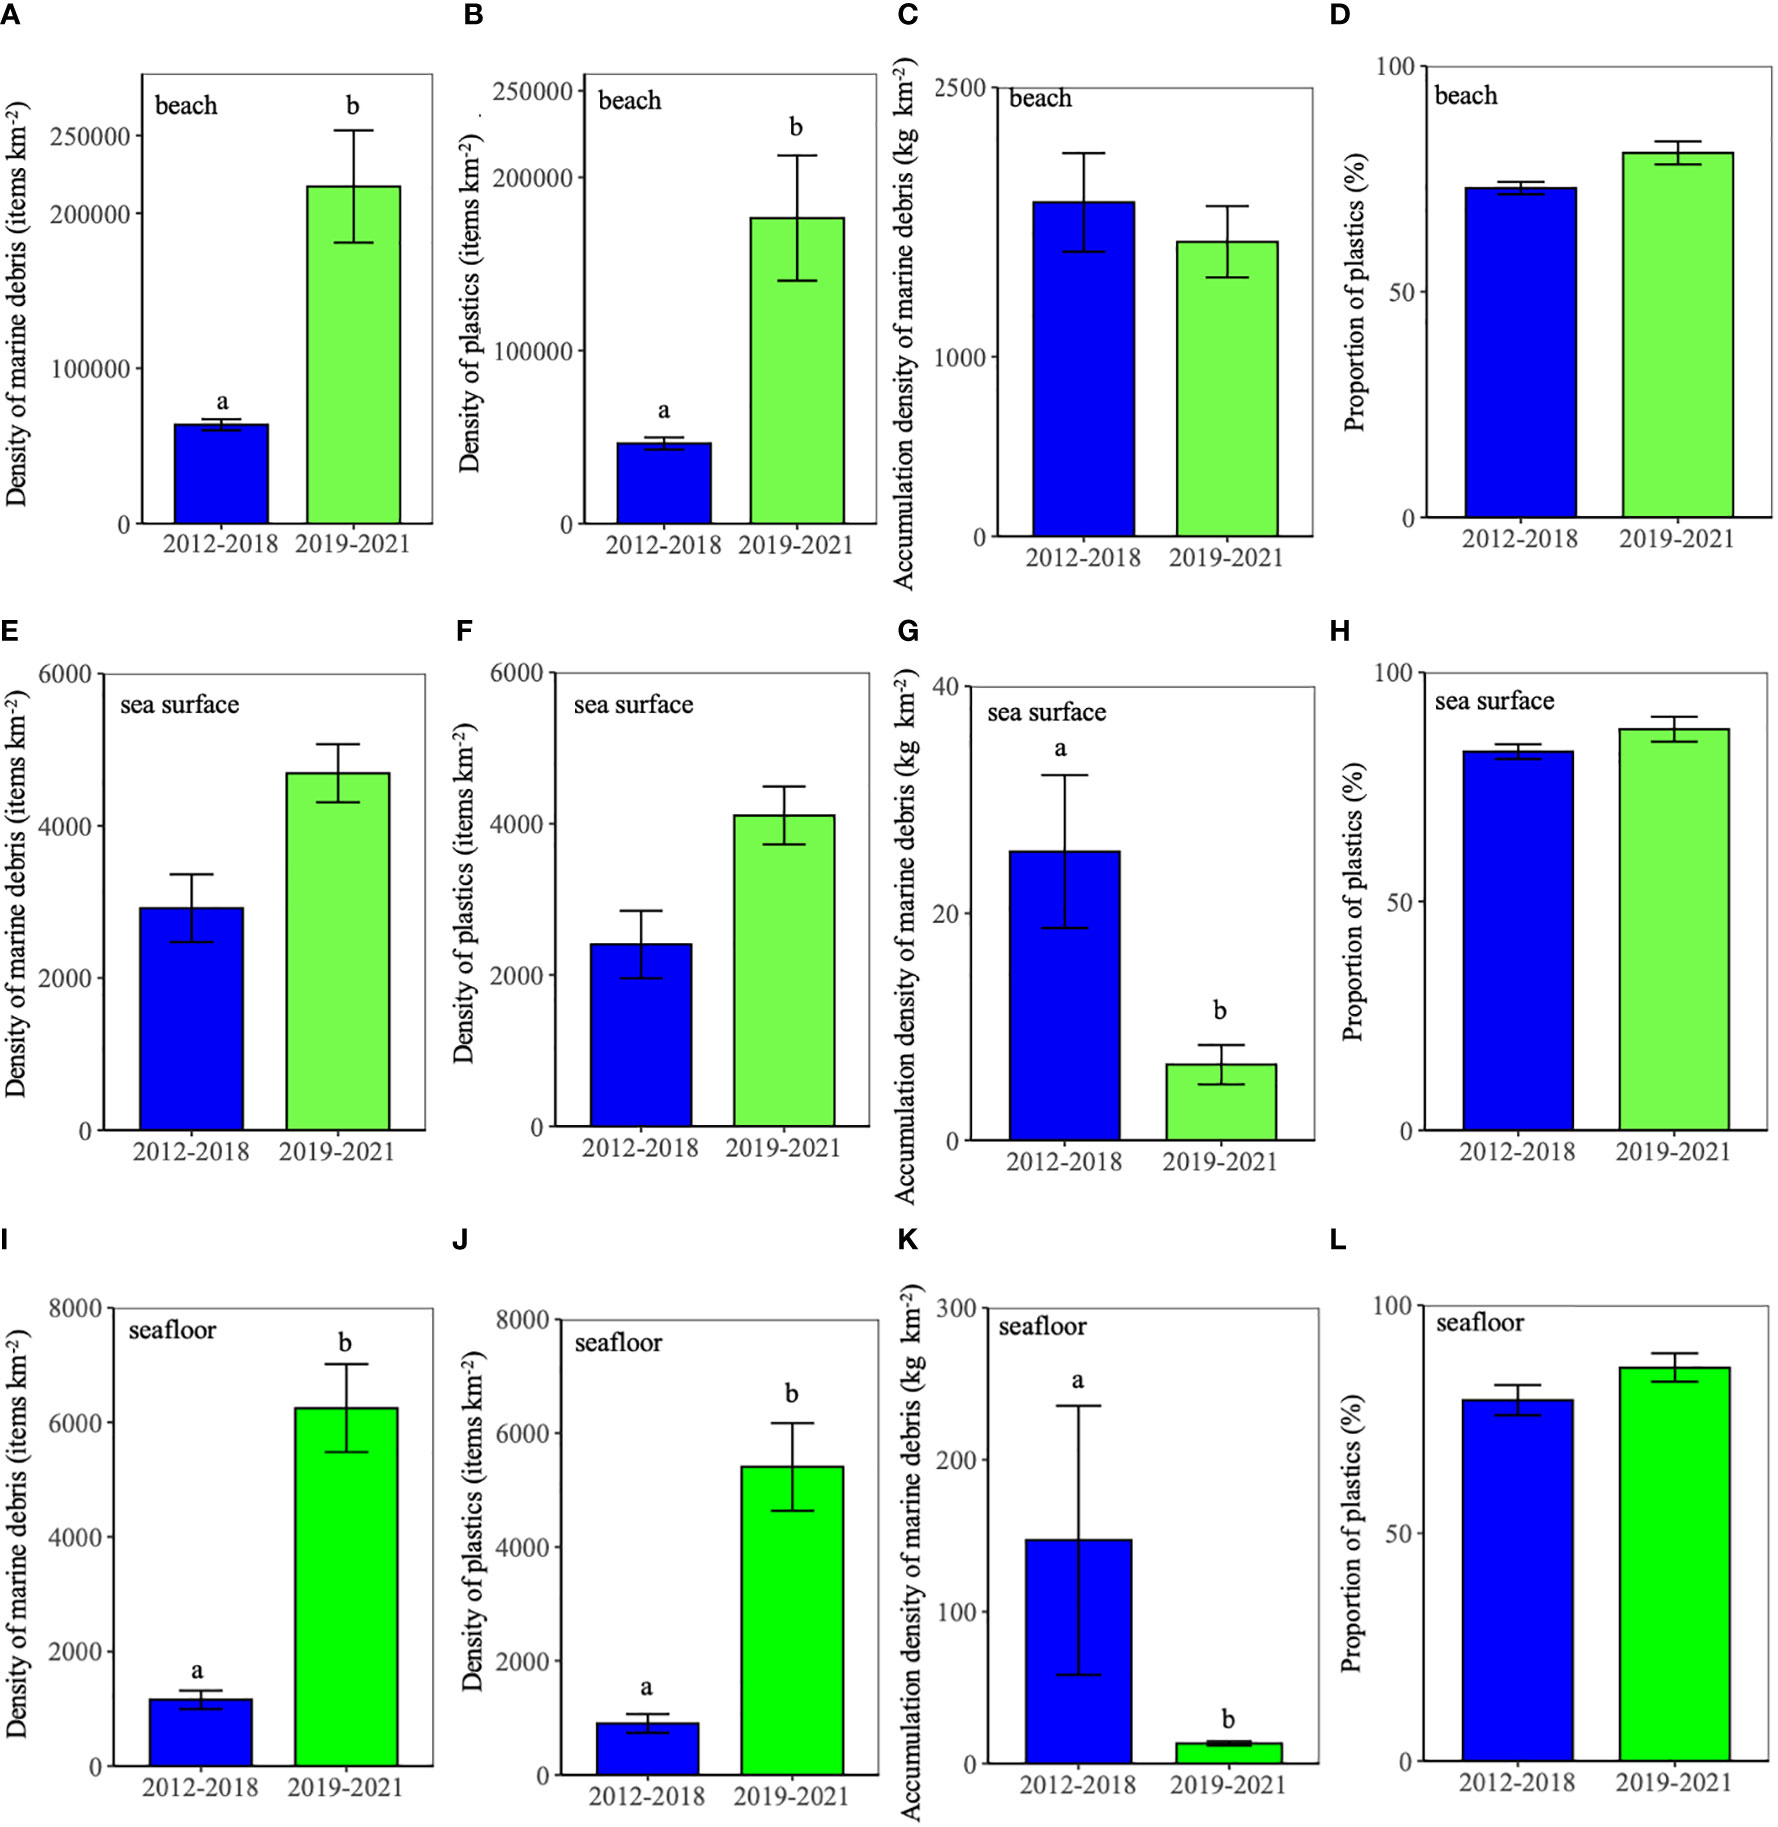
Figure 3 Comparison of the density and accumulation density of marine debris (including plastics), as well as the proportion plastics in marine debris between the pandemic and pre-pandemic periods in different environmental compartments of the beach sea continuum. (A–D) beach, (E–H) sea surface, (I–L) seafloor. Groups with significant differences were denoted by different letters above the error-bars.
Characteristics of debris distribution in the beach-sea continuum
Our results show that the density, accumulation density and major components of marine debris varied on different interfaces of the beach-sea continuum. Specifically, plastics are the major components of marine debris in the beach-sea continuum and there were significant differences in the proportion of plastics among the three interfaces (ANOVA, F-value=5.1, P<0.05, Figure 4A). The proportion of plastics in marine debris on sea surfaces (83.3 ± 1.3%) was significantly higher than that on beaches (74.1 ± 2.5%) (Tukey HSD test, P<0.001) but not significantly different from that on seafloors (81.1 ± 3.0%) (Tukey HSD test, P=0.59). There were also significant differences in the accumulation densities of marine debris (ANOVA, F-value=75.1, P<0.001, Figure 4B), as were the density of marine debris (Kruskal-Wallis test, χ2(2)=20.6, P<0.001, Figure 4C) and plastics (Kruskal-Wallis test, χ2(2)=20.7, P<0.001, Figure 4D) on the different interfaces of the beach-sea continuum. In particular, the accumulation density of marine debris (1,787.4 ± 220.0 kg km–2) was significantly higher on beaches than those on both sea surfaces (21.6 ± 5.7 kg km–2) (Tukey HSD test, P<0.001) and seafloors (117.5 ± 70.4 kg km–2) (Tukey HSD test, P<0.001). The density of marine debris (104,682.4 ± 27,793.0 items km–2) was significantly higher on beaches than those on both sea surfaces (3,320.8 ± 446.0 items km–2) (Mann-Whitney test, P<0.001) and seafloors (2,453.7 ± 868.4 items km–2) (Mann-Whitney test, P<0.001). Similarly, the density of plastics (85,373.0 ± 21,633.8 items km–2) was significantly higher on beaches than those on both sea surfaces (2,915.4 ± 365.8 items km–2) (Mann-Whitney test, P<0.001) and seafloors (2,254.2 ± 717.1 items km–2) (Mann-Whitney test, P<0.001, Figure 4D).
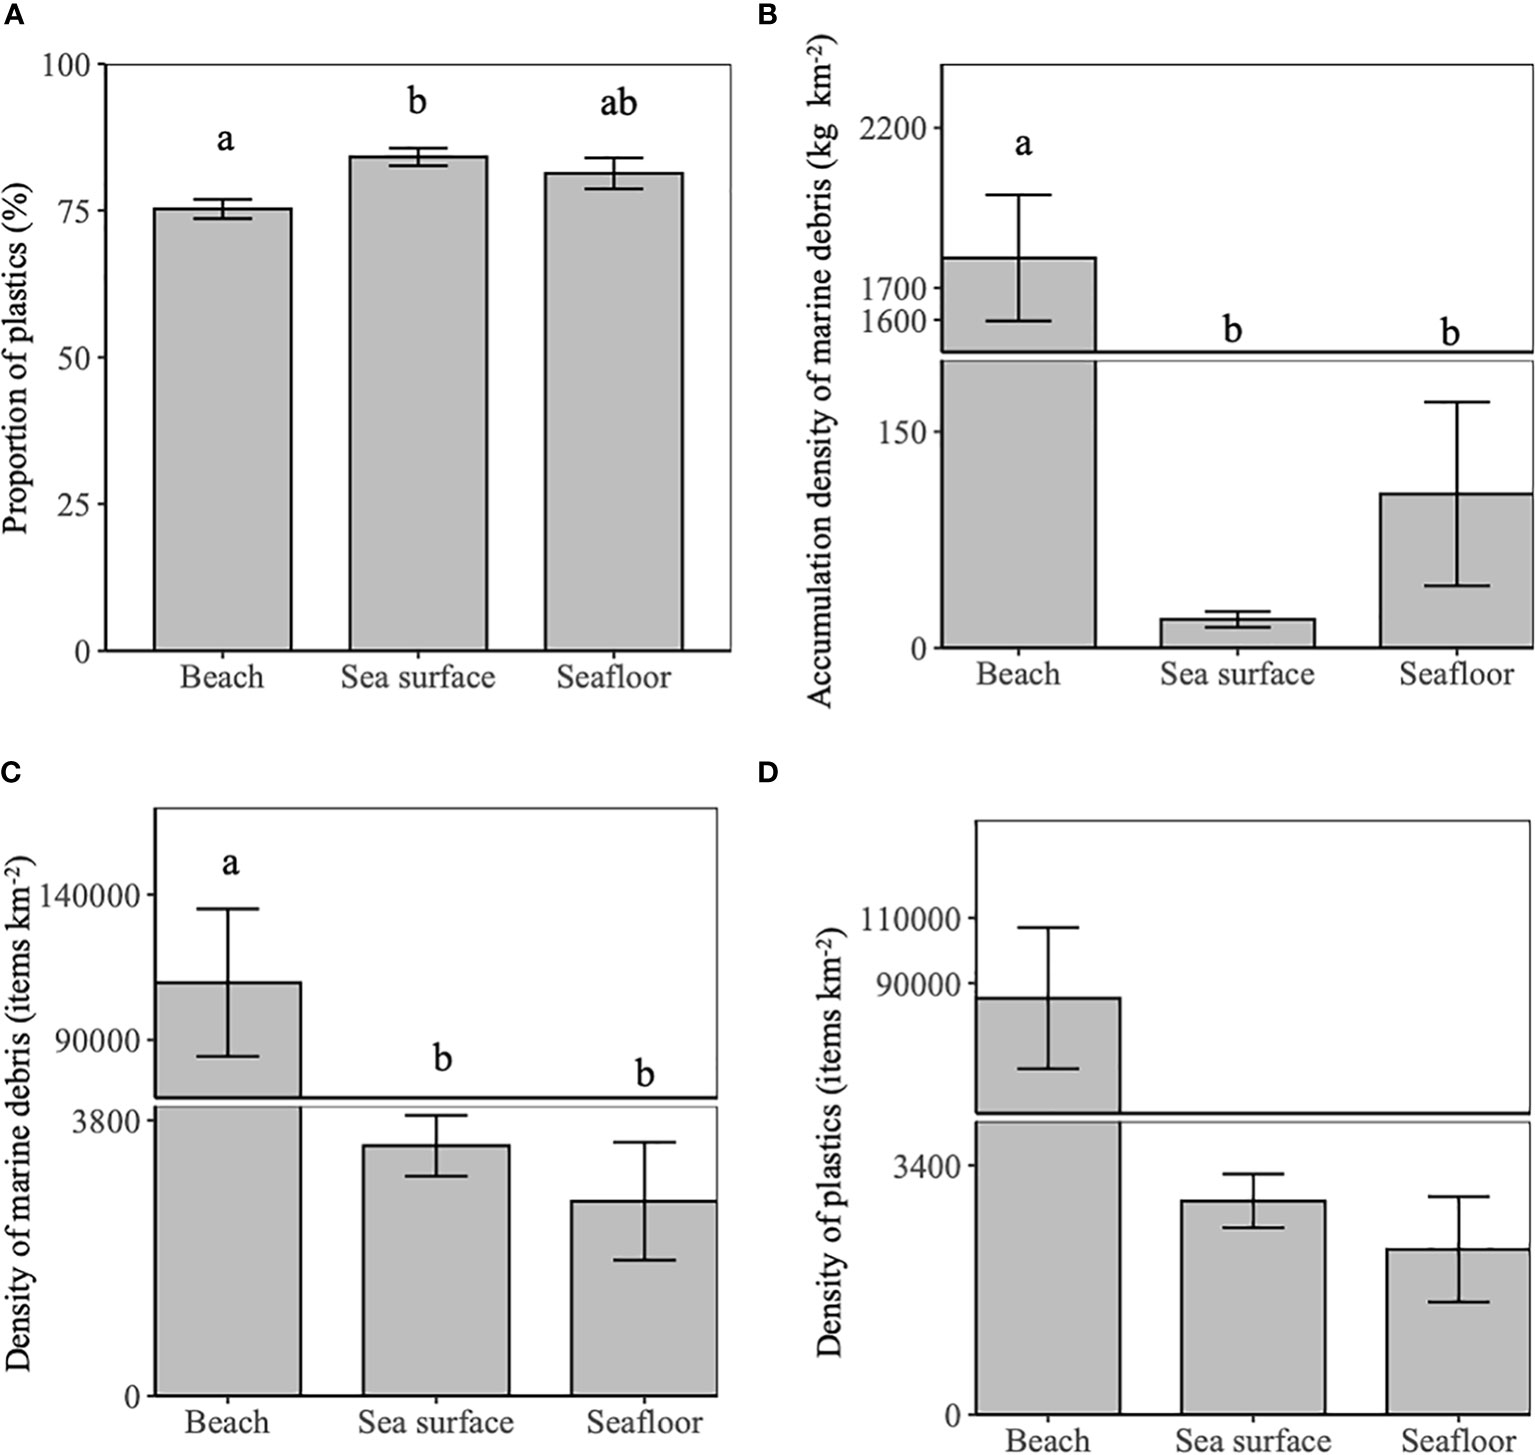
Figure 4 Differences in characteristics of marine debris in beach, sea surface and seafloor in China using time series data during 2012–2021. (A) proportion of plastics in marine debris, (B) accumulation density of marine debris, (C) density of marine debris, and (D) density of plastics in marine debris. Significant differences among the groups were denoted by different letters above the error-bars.
Relationships between the density and accumulation density of marine debris on different interfaces of the beach-sea continuum
Our results show that the density and accumulation density of marine debris on different interfaces were tightly related. Specifically, there are very significant exponential relationships between the density of seafloor and beach debris using both the national data (R2 = 0.8, P<0.001, Figure 5A, Supplementary Information Table S1) and data from available monitoring stations (R2 = 0.49, P<0.01, Figure 5B). The relationship between the density of sea surface and seafloor debris is significant and is represented by a power function (R2 = 0.59, P<0.01, Figure 5C, Supplementary Information Table S1), as is the relationship between the density of sea surface and beach debris (R2 = 0.47, P<0.05, Figure 5D, Supplementary Information Table S1). There are very significant and strong exponential relationships between the density of seafloor and beach plastics (R2 = 0.83, P<0.001, Figure 6A, Supplementary Information Table S2). The relationship between sea surface and seafloor plastics is represented by a power function (R2 = 0.6, P<0.01, Figure 6B), as is the relationship between sea surface and beach plastics (R2 = 0.48, P<0.05, Figure 6C). A significant exponential relationship was found between the proportion of plastics in marine debris on sea surfaces and that on beaches (R2 = 0.42, P<0.05, Figure 7A, Supplementary Information Table S3). There is a very significant and strong linear relationship between the accumulation density of debris on sea surfaces and that on seafloors (R2 = 0.86, P<0.001, Figure 7B, Supplementary Information Table S3), and a significant linear relationship between the accumulation density of debris on seafloors and that on beaches (R2 = 0.6, P<0.05, Figure 7C, Supplementary Information Table S3). However, there is not a significant relationship between the accumulation density of debris on sea surfaces and that on beaches (P=0.89).
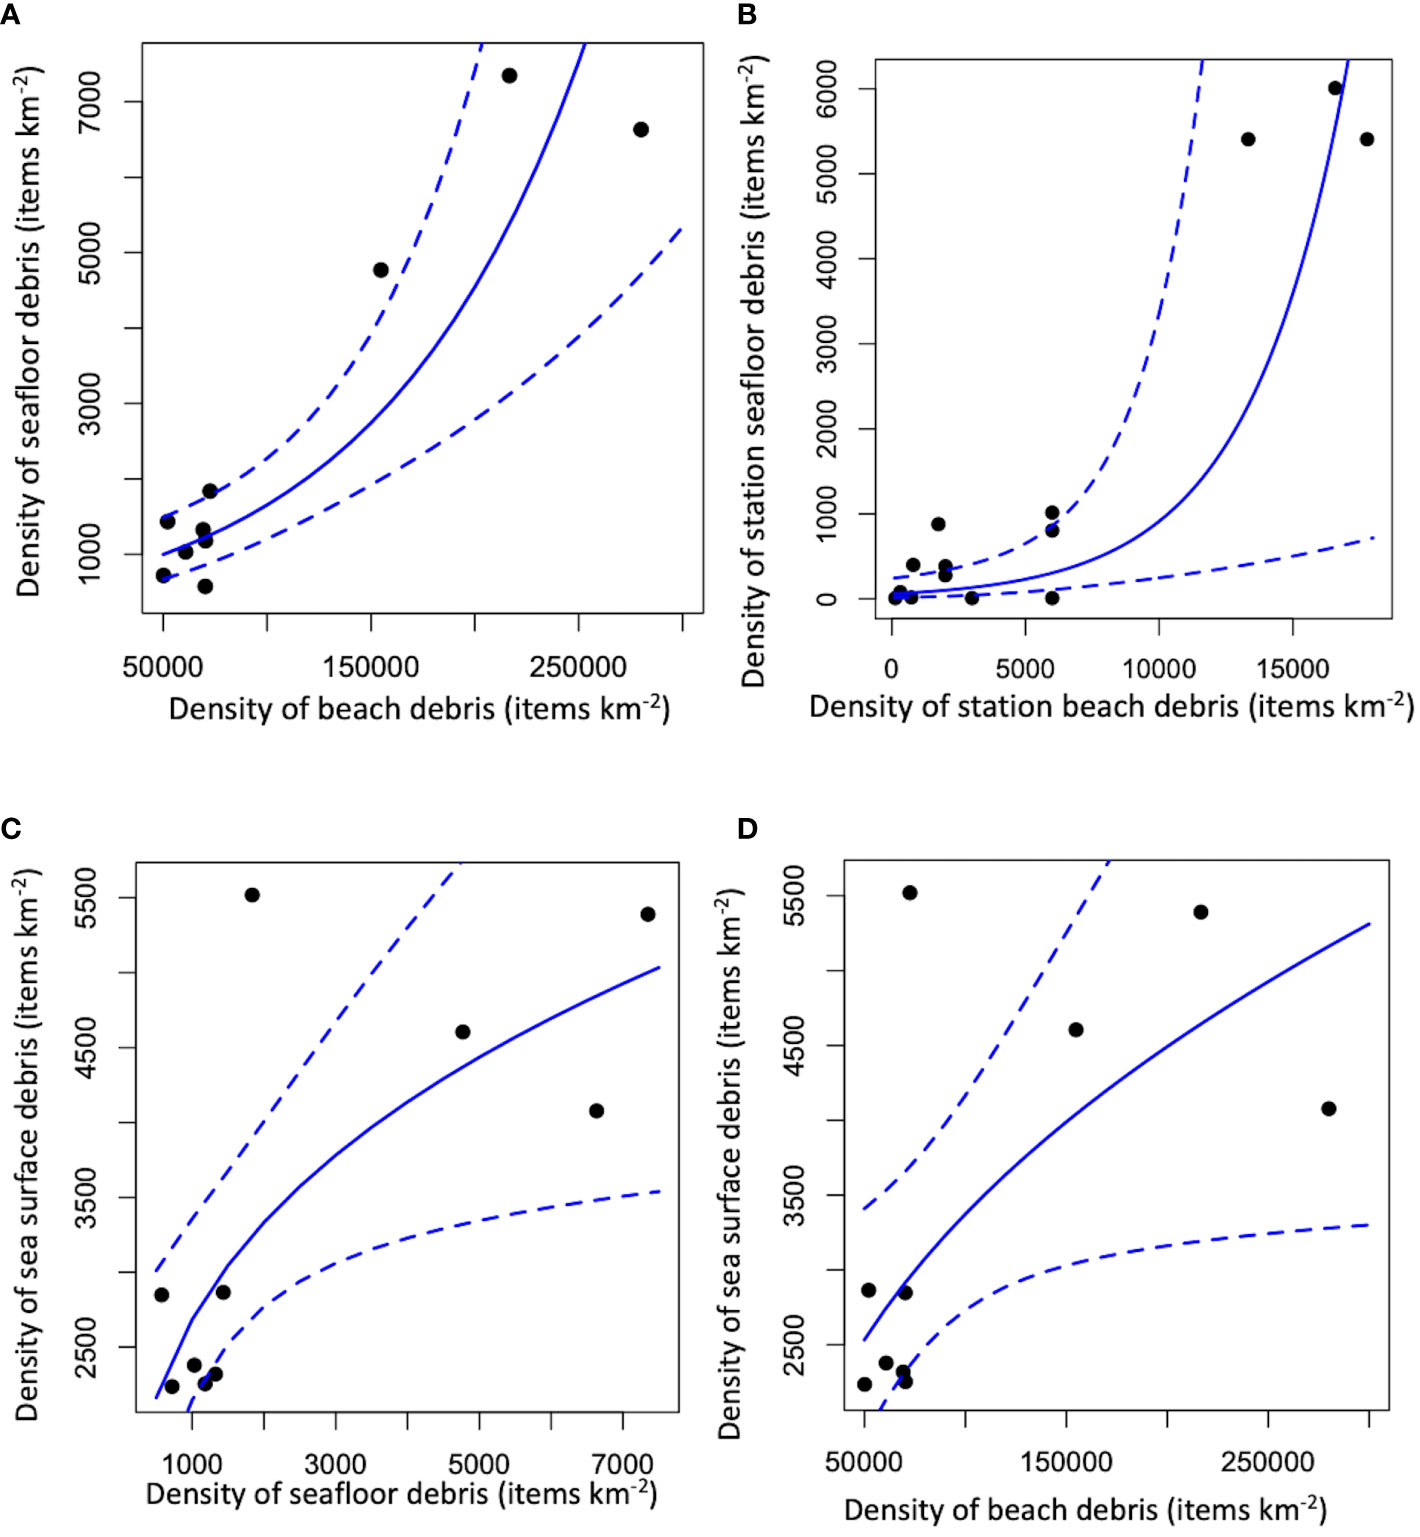
Figure 5 Relationships among the density of marine debris in the beach-sea continuum. (A) the relationship between the density of seafloor and beach debris, (B) the relationship between the density of seafloor and beach debris using available monitoring stations, (C) the relationship between the density of sea surface and seafloor debris, (D) the relationship between the density of sea surface and beach debris.
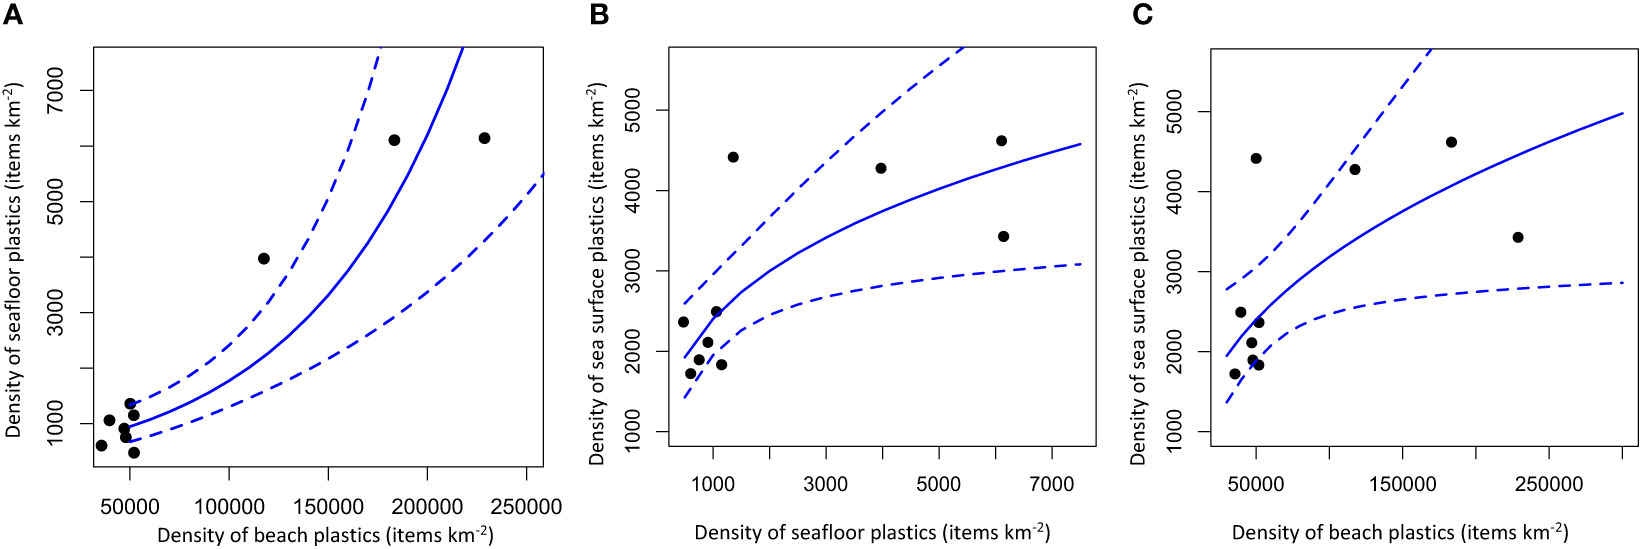
Figure 6 Relationships among the density of plastics in the beach-sea continuum. (A) the relationship between the density of seafloor and beach plastics, (B) the relationship between the density of sea surface and seafloor plastics, (C) the relationship between the density of sea surface and beach plastics.
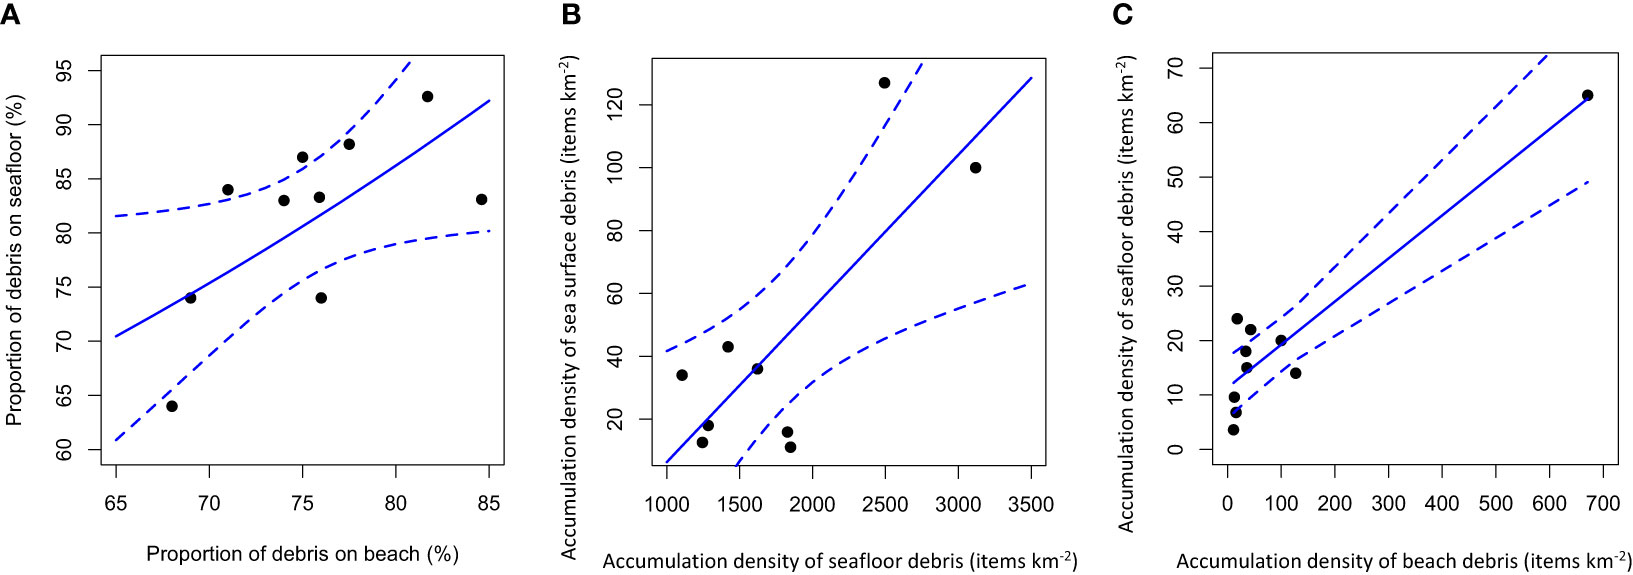
Figure 7 Relationships among the accumulation density of and the proportion of plastics in marine debris in the beach-sea continuum. (A) the relationship between the proportion of plastics in marine debris on seafloors and on beaches, (B) the relationship between the accumulation density of sea surface and seafloor debris, (C) the relationship between the accumulation density of seafloor and beach debris.
Discussion
Changes in debris density and accumulation density in the beach-sea continuum
Our results reflect that the density and accumulation density of marine debris in the beach-sea continuum changed over time without clear annual patterns. Although the generation of debris, in particular plastics, may increase over time (Geyer et al., 2017; UNEP, 2021), there are many factors determining uncertainties in the amount of discarded debris in the environment, including but not limited to debris mismanagement and the methods of debris disposal. The density of debris on China’s beaches during 2012–2021 ranged between 50, 142 items km–2 and 280, 043 items km–2, of which both the lower and upper limits are one order of magnitude higher than that during 2007-2011 surveys (8,000-63,000 items km–2) (Zhou et al., 2016). Our results are consistent with Serra-Goncalves et al. (2019) who showed that the density of debris on 64.2% beaches worldwide fell in the range of 0–5,000,000 items km–2 (Table 1). The density of debris on China’s sea surfaces and seafloors during 2012-2021 ranged from 2,236 to 5,519 items km–2 and 575-7,348 items km–2, and were also higher than those (1,210-3,717 items km–2 and 200-3,000 items km–2) during 2007-2011 (Zhou et al., 2016). The density of plastics during 2012-2021 on China’s sea surfaces (1,721.7 – 4,415.2 items km–2) falls in the range of that for the Red Sea (0 – 613,937 items km–2) (Martin et al., 2019) but below the range of that for the Mediterranean Sea (2,250 – 8,500,000 items km–2) (Pedrotti et al., 2022) and Hawaii Island beaches (404,000–68,300,000 items km–2) (Brignac et al., 2019). However, the density of plastics on China’s seafloors (477.4 – 6,106.2 items km–2) goes beyond that for the coastal seas of Northwestern Europe (0–1,835 items km–2) (Maes et al., 2018). The trawling nets used for collecting sea debris were made of plastics, which may confound the density of plastics collected from sea surfaces and seafloors.
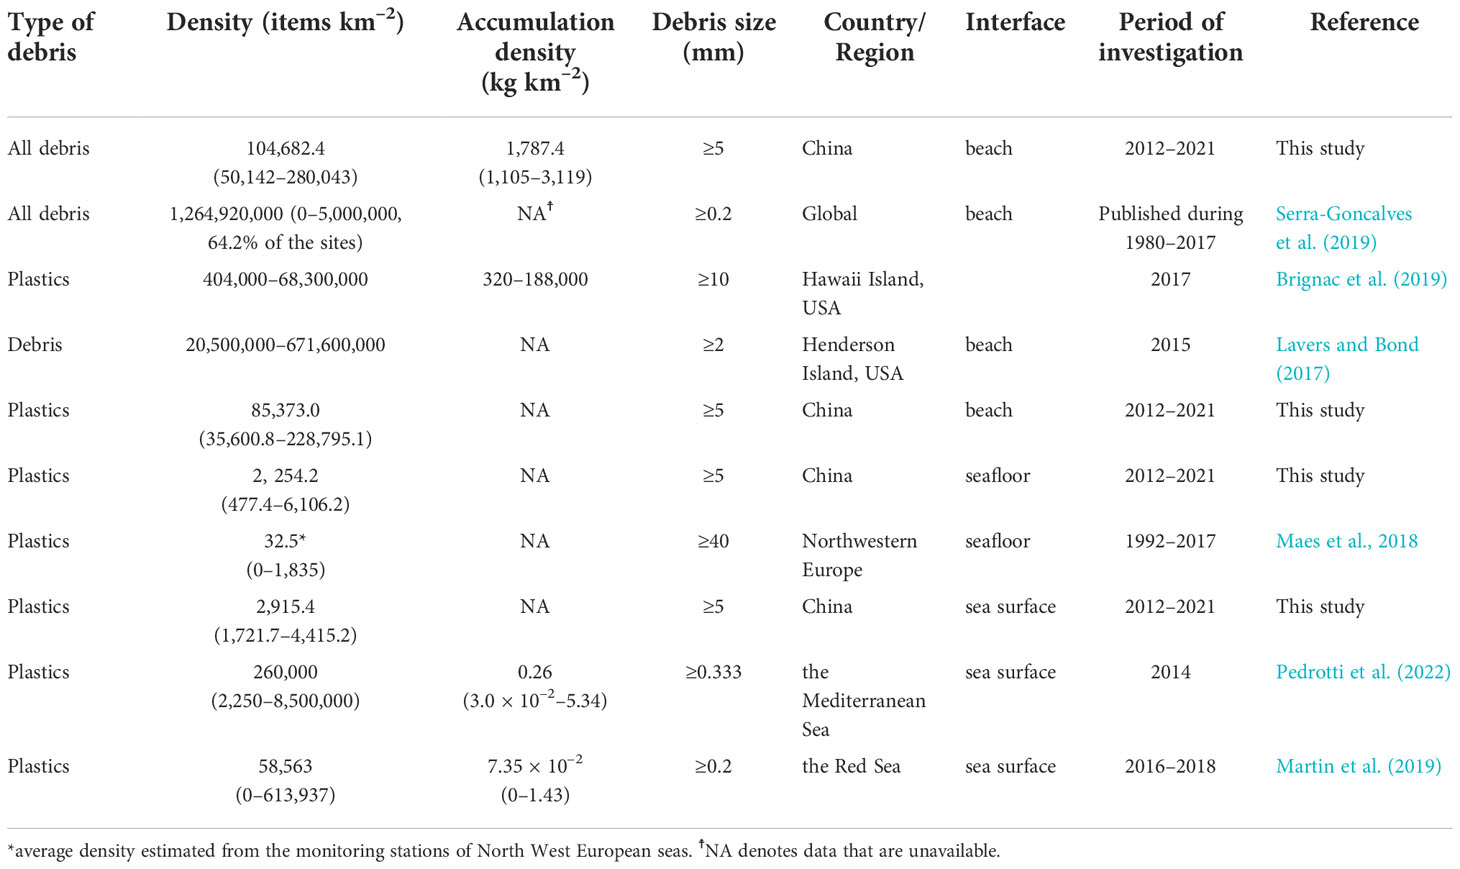
Table 1 Comparison of the density and accumulation density of marine debris in Chinese beach-sea continuum with that for the global and regional data.
Further, other factors may increase the uncertainties in the density of marine debris in the beach-sea continuum, such as extreme weather events disasters, the COVID-19 pandemic and varying coastal clean-up efforts. In 2019, super-typhoon Lekima hit most of Chinese coastal regions from Shandong in Northern China to Zhejiang in Southern China and had much more widespread impact than other super-typhoons such as Mangkhut which only affect part of Southern China (Ouyang et al., 2021). The typhoon resulted in severe landslides and debris flows (Liang et al., 2022), and may transport much more debris to beaches than usual as witnessed by the dramatic increase (11-fold) in the density of marine debris on beaches after Mangkhut (Lo et al., 2020). In general, the density of marine debris on Chinese beaches (154,816–280,043 items km–2) during the pandemic period (2019–2021) was one order of magnitude higher than that (50,142–72,581 items km–2) during the pre-pandemic period (2012–2018). This may be partly due to the increased use of facial/surgical masks and other disposable plastics as well as mismanaged debris transported to beaches via rivers or other avenues. More than eight million tons of pandemic-associated waste have been generated with more than 25,000 tons entering the global oceans (Peng et al., 2021). Moreover, it was estimated that an annual increase of around 0.15–0.39 million tons of plastic debris arising from the pandemic could end up in the global oceans (Chowdhury et al., 2021). Cordova et al. (2021) revealed a 5% increase in the density of debris in riverine debris released to Jakarta Bay, Indonesia during the Coronavirus pandemic. Coastal clean-up activities were suggested to reduce the quantity of debris on beaches (Sulochanan et al., 2019).
Variation in debris density and accumulation density on different interfaces of the beach-sea Continuum
Our results reflect that in general, the density and accumulation density of marine debris and plastics were significantly higher on beaches than those on sea surfaces and seafloors. The latter two were not significantly different. This pattern is consistent with that for coastal wetlands and adjacent coastal waters, where plastics density in coastal wetland sediments (46 –176.2 items kg–1) was 2–3 orders of magnitude higher than that in water column (0.43 items kg–1) (Ouyang et al., 2022). For microplastics, seawater samples correspond to volume-reduced samples taken with nets, accounting for the lower density in these environments compared to sediments (Hidalgo-Ruz et al., 2012). While microplastics in the oceanic waters primarily come from land sources (Allen et al., 2022), large debris discarded on beaches and other land-based sources may be not readily transported to the seas through wind transport or surface runoff.
The density of marine debris and plastics on the same interface of the beach-sea continuum reported from different sources show large differences. The average density of plastics in China’s beaches estimated in this study (104,682.4 items km–2) is four orders of magnitude lower than the global average (1,264,920,000 items km–2) (Serra-Goncalves et al., 2019). The average density of plastics on the seafloor of the Chinese seas (2,254.2 items km–2) is two orders of magnitude higher than that of Northwestern European seas (32.5 items km–2) (Maes et al., 2018). The average density of plastics on the sea surface of the Chinese seas (2, 915.4 items km–2) is one order of magnitude lower than that of the Red Sea (58,563 items km–2) (Pedrotti et al., 2022) and two orders of magnitude lower than that of the Mediterranean Sea (260,000 items km–2) (Martin et al., 2019). The accumulation density of plastics in the Mediterranean Sea (0.26 kg km–2) is one order of magnitude higher than that in the Red Sea (7.35 × 10⁻² kg km–2). The differences in debris density and/or accumulation density estimated from different sources may arise from different debris sizes, sampling methods and sampling depths in various studies (Ouyang et al., 2022), as well as regional plastics pollution status. There are other problems in the current report on plastics density, e.g., the different units (e.g., items m–1, items km–2 and items kg–1) used in different studies (Serra–Goncalves et al., 2019). The use of linear design in field surveys usually use items m–1 to describe the density of plastics along a sampling site which could hardly be transformed to items km–2 without the sampling width. Similarly, the use of items kg–1 cannot be transformed to items km–2 without sampling depth. These problems make it difficult to compare debris density from different studies. We call for a uniform standard on reporting debris density, which will facilitate the effective comparison of plastics density among different regions and to harness plastics pollution.
Exchange of marine debris in different interfaces of the beach-sea continuum
We found that the density and accumulation density of seafloor and/or sea surface debris were closely related to those of beach debris along the Chinese beach-sea continuum, which verifies our hypothesis. Our results suggest that debris on the beaches can be exchanged with sea surfaces and seafloors. Sources of debris on four Mediterranean beaches are attributed to beachgoers, wind, and/or runoff transport of debris from land (Prevenios et al., 2018). At the global scale, it was predicted that at least 77% of positively buoyant marine plastic debris released from land-based sources is either beached or floating in coastal waters (Onink et al., 2021). Debris deposited along shorelines can be caught in the nearshore currents whereas terrestrial sources of debris dominate sites of tourism (e.g., beaches) and near river outflows (Ryan et al., 2009) and can be carried to the seas by river runoff. Fragmented micro-debris (e.g., microplastics) were abundant in eight coastal beaches in Guangdong, China and can be transported to the seas during storm events (Fok et al., 2017). Land-based debris, which was transported to seawater, also increased significantly after extreme weather events (e.g. typhoons) (Jian et al., 2022). The mass and weights of marine debris were significantly higher in wet seasons than those in dry seasons in 25 beaches in Hong Kong, likely due to more debris transported during storm or wind events (Lo et al., 2020). Resuspension and re-floating of marine debris were also predicted to have dramatic impacts on the advection-diffusion of debris from beaches to coastal waters (Critchell and Lambrechts, 2016). Therefore, wind, river runoff, storms and resuspension can all be drivers of debris exchange between beaches and the seas.
Our results also indicate the close relationship between the density/accumulation density of debris and plastics on sea surfaces and seafloors. Plastics comprise different polymers and can be buoyant, neutrally-buoyant or sink in seawater. Plastics on sea surfaces with a density which exceeds that of seawater sink and accumulate on the seafloor. Low density plastics can be submerged if they meet water fronts. The attachment of fouling organisms (i.e., biofouling) can result in buoyant microplastics to sink (Barnes et al., 2009; Browne et al., 2010). Microbial biofilm formation is the initial step for fouling (Dobretsov et al., 2010) while in the consecutive steps so-called epiplastic organisms (e.g., diatoms, ciliates and a wide array of other organisms) will attach on the biofilm (Reisser et al., 2014). In the marine environment, plastics, particularly microplastics have a hydrophobic surface, can rapidly accumulate microbial biofilms which further facilitate the colonization of algae and invertebrates on the surface of plastics, and thus increased density of particles (Andrady, 2011). Vertical transport and mixing related to internal tides also control the transport of floating debris on sea surfaces (van Sebille et al., 2020). Smaller and more angular microplastics are easier to form marine aggregates (de Haan et al., 2019) which facilitate deposition to seafloors. Accordingly, density, biofouling, aggregation and vertical mixing can all contribute to plastics exchange between sea surfaces and sea floors.
Conclusions
Our results reveal that there were no clear annual patterns in the density and accumulation density of marine debris on different interfaces of the Chinese beach-sea continuum, while a clear-cut difference was found for those between the pandemic (2019–2021) and pre-pandemic (2012–2018) periods. The density of marine debris on beaches, sea surfaces and seafloors peaked in 2019 (280,043 items km–2), 2020 (5,519 items km–2) and 2020 (7,348 items km–2), respectively, but all show sporadic changes over time during 2012–2021, as did the accumulation density of marine debris on different interfaces. The density of marine debris on beaches and seafloors in the pandemic period were 3 to 5 folds of those in the pre-pandemic period while no significant differences were found for the comparison on sea surfaces.
Our results found that the density and/or accumulation density of seafloor and sea surface debris were related and both were closely related to that of beach debris. This pattern may be due to the exchange of marine debris on different interfaces of the beach-sea continuum. Drivers of the beach-sea exchange in debris may include riverine and wind transport, horizontal large-scale flow, vertical mixing and resuspension, aggregation, biofouling and biological degradation. Accordingly, effective management of marine debris pollution should not focus on pollution monitoring within one interface but should take united actions on different interfaces in the continuum, e.g., the beach-sea continuum. There are large disparities in the density and accumulation density of marine debris between this study and other global or regional studies, likely due to different debris sizes, sampling methods and survey depths. It underscores the importance of using uniform standards on reporting the density and accumulation density of marine debris in future studies.
Data availability statement
The raw data supporting the conclusions of this article will be made available by the authors, without undue reservation.
Author contributions
The data were collected and analysed by XO. The initial version of the manuscript was drafted by XO with revision by ZY. All authors contributed to the article and approved the submitted version.
Funding
This study was supported by the National Natural Science Foundation of China (Nos. 52239005, 52271280) and PI project of Southern Marine Science and Engineering Guangdong Laboratory (Guangzhou) (GML2022009).
Conflict of interest
The authors declare that the research was conducted in the absence of any commercial or financial relationships that could be construed as a potential conflict of interest.
Publisher’s note
All claims expressed in this article are solely those of the authors and do not necessarily represent those of their affiliated organizations, or those of the publisher, the editors and the reviewers. Any product that may be evaluated in this article, or claim that may be made by its manufacturer, is not guaranteed or endorsed by the publisher.
Supplementary material
The Supplementary Material for this article can be found online at: https://www.frontiersin.org/articles/10.3389/fmars.2022.1031714/full#supplementary-material
References
Abbasi S., Soltani N., Keshavarzi B., Moore F., Turner A., Hassanaghaei M. (2018). Microplastics in different tissues of fish and prawn from the musa estuary, Persian gulf. Chemosphere 205, 80–87. doi: 10.1016/j.chemosphere.2018.04.076
Adyel T. M. (2020). Accumulation of plastic waste during COVID-19. Science 369 (6509), 1314–1315. doi: 10.1126/science.abd9925
Allen D., Allen S., Abbasi S., Baker A., Bergmann M., Brahney J., et al. (2022). Microplastics and nanoplastics in the marine-atmosphere environment. Nat. Rev. Earth Environ. 3 (6), 393–405. doi: 10.1038/s43017-022-00292-x
Allen R., Jarvis D., Sayer S., Mills C. (2012). Entanglement of grey seals halichoerus grypus at a haul out site in Cornwall, UK. Mar. pollut. Bull. 64 (12), 2815–2819. doi: 10.1016/j.marpolbul.2012.09.005
Andrady A. L. (2011). Microplastics in the marine environment. Mar. pollut. Bull. 62 (8), 1596–1605. doi: 10.1016/j.marpolbul.2011.05.030
Barnes D. K., Galgani F., Thompson R. C., Barlaz M. (2009). Accumulation and fragmentation of plastic debris in global environments. Philos. Trans. R. Soc. B: Biol. Sci. 364 (1526), 1985–1998. doi: 10.1098/rstb.2008.0205
Benson N. U., Bassey D. E., Palanisami T. (2021). COVID pollution: impact of COVID-19 pandemic on global plastic waste footprint. Heliyon 7 (2), e06343. doi: 10.1016/j.heliyon.2021.e06343
Besseling E., Foekema E. M., van den Heuvel-Greve M. J., Koelmans A. A. (2017). The effect of microplastic on the uptake of chemicals by the lugworm arenicola marina (L.) under environmentally relevant exposure conditions. Environ. Sci. Technol. 51 (15), 8795–8804. doi: 10.1021/acs.est.7b02286
Bouwman H., Evans S. W., Cole N., Yive N. S. C. K., Kylin H. (2016). The flip-or-flop boutique: Marine debris on the shores of St brandon's rock, an isolated tropical atoll in the Indian ocean. Mar. Environ. Res. 114, 58–64. doi: 10.1016/j.marenvres.2015.12.013
Brignac K. C., Jung M. R., King C., Royer S.-J., Bickley L., Lamson M. R., et al. (2019). Marine debris polymers on main Hawaiian island beaches, Sea surface, and seafloor. Environ. Sci. Technol. 53 (21), 12218–12226. doi: 10.1021/acs.est.9b03561
Browne M. A., Chapman M. G., Thompson R. C., Zettler L. A. A., Jambeck J., Mallos N. J. (2015). Spatial and temporal patterns of stranded intertidal marine debris: Is there a picture of global change? Environ. Sci. Technol. 49 (12), 7082–7094. doi: 10.1021/es5060572
Browne M. A., Galloway T. S., Thompson R. C. (2010). Spatial patterns of plastic debris along estuarine shorelines. Environ. Sci. Technol. 44 (9), 3404–3409. doi: 10.1021/es903784e
Cheung P. K., Cheung L. T. O., Fok L. (2016). Seasonal variation in the abundance of marine plastic debris in the estuary of a subtropical macro-scale drainage basin in south China. Sci. Total Environ. 562, 658–665. doi: 10.1016/j.scitotenv.2016.04.048
Chowdhury H., Chowdhury T., Sait S. M. (2021). Estimating marine plastic pollution from COVID-19 face masks in coastal regions. Mar. pollut. Bull. 168, 112419. doi: 10.1016/j.marpolbul.2021.112419
Cordova M. R., Nurhati I. S., Riani E., Nurhasanah, Iswari M. Y. (2021). Unprecedented plastic-made personal protective equipment (PPE) debris in river outlets into Jakarta bay during COVID-19 pandemic. Chemosphere 268, 129360. doi: 10.1016/j.chemosphere.2020.129360
Critchell K., Lambrechts J. (2016). Modelling accumulation of marine plastics in the coastal zone; what are the dominant physical processes? Estuarine Coast. Shelf Sci. 171, 111–122. doi: 10.1016/j.ecss.2016.01.036
Daniel D. B., Ashraf P. M., Thomas S. N. (2022). Impact of 2018 kerala flood on the abundance and distribution of microplastics in marine environment off Cochin, southeastern Arabian Sea, India. Regional Stud. Mar. Sci. 53, 102367. doi: 10.1016/j.rsma.2022.102367
de Haan W. P., Sanchez-Vidal A., Canals M., Amblas D., Ayma A., Calafat A., et al. (2019). Floating microplastics and aggregate formation in the Western Mediterranean Sea. Mar. pollut. Bull. 140, 523–535. doi: 10.1016/j.marpolbul.2019.01.053
Derraik J. G. B. (2002). The pollution of the marine environment by plastic debris: a review. Mar. pollut. Bull. 44 (9), 842–852. doi: 10.1016/S0025-326X(02)00220-5
Dobretsov S. V., Gosselin L. A., Qian P. Y. (2010). Effects of solar PAR and UV radiation on tropical biofouling communities. Mar. Ecol. Prog. Ser. 402, 31–43. doi: 10.3354/meps08455
Duan J., Han J., Cheung S. G., Chong R. K. Y., Lo C.-M., Lee F. W.-F., et al. (2021). How mangrove plants affect microplastic distribution in sediments of coastal wetlands: Case study in shenzhen bay, south China. Sci. Total Environ. 767, 144695. doi: 10.1016/j.scitotenv.2020.144695
Du H., Huang S., Wang J. (2022). Environmental risks of polymer materials from disposable face masks linked to the COVID-19 pandemic. Sci. Total Environ. 815, 152980. doi: 10.1016/j.scitotenv.2022.152980
Fang C., Zheng R., Zhang Y., Hong F., Mu J., Chen M., et al. (2018). Microplastic contamination in benthic organisms from the Arctic and sub-Arctic regions. Chemosphere 209, 298–306. doi: 10.1016/j.chemosphere.2018.06.101
Foekema E. M., De Gruijter C., Mergia M. T., van Franeker J. A., Murk A. J., Koelmans A. A. (2013). Plastic in north sea fish. Environ. Sci. Technol. 47, 8818–8824. doi: 10.1021/es400931b
Fok L., Cheung P. K., Tang G., Li W. C. (2017). Size distribution of stranded small plastic debris on the coast of guangdong, south China. Environ. pollut. 220, 407–412. doi: 10.1016/j.envpol.2016.09.079
Fox J., Weisberg S. (2011). An {R} companion to applied regression, second edition (Thousand Oaks, CA: Sage).
Geyer R., Jambeck J. R., Law K. L. (2017). Production, use, and fate of all plastics ever made. Sci. Adv. 3 (7), e1700782. doi: 10.1126/sciadv.1700782
Gregory M. R., Ryan P. G. (1997). “Pelagic plastics and other seaborne persistent synthetic debris: a review of southern hemisphere perspectives,” in Marine debris–-Sources, impacts and solutions, vol. pp . Eds. Coe J. M., Rogers D. B. (New York: Springer-Verlag), 49–66.
Haque M. S., Sharif S., Masnoon A., Rashid E. (2021). SARS-CoV-2 pandemic-induced PPE and single-use plastic waste generation scenario. Waste Manage. Res. 39, 3–17. doi: 10.1177/0734242X20980828
Hidalgo-Ruz V., Gutow L., Thompson R. C., Thiel M. (2012). Microplastics in the marine environment: a review of the methods used for identification and quantification. Environ. Sci. Technol. 46 (6), 3060–3075. doi: 10.1021/es2031505
Jian Q., Wang S., Zhang P., Zhang J., Zhao L., Liu D. (2022). Microplastic variations in land-based sources of coastal water affected by tropical typhoon events in zhanjiang bay, China. Water 14 (9), 1455. doi: 10.3390/w14091455
Lavers J. L., Bond A. L. (2017). Exceptional and rapid accumulation of anthropogenic debris on one of the world's most remote and pristine islands. Proc. Natl. Acad. Sci. U.S.A. 114 (23), 6052–6055. doi: 10.1073/pnas.1619818114
Lebreton L. C., van der Zwet J., Damsteeg J. W., Slat B., Andrady A., Reisser J. (2017). River plastic emissions to the world’s oceans. Nat. Commun. 8, 15611. doi: 10.1038/ncomms15611
Liang X., Segoni S., Yin K., Du J., Chai B., Tofani V., et al. (2022). Characteristics of landslides and debris flows triggered by extreme rainfall in daoshi town during the 2019 typhoon lekima, zhejiang province, China. Landslides 19 (7), 1735–1749. doi: 10.1007/s10346-022-01889-5
Liu J., Vethaak A. D., An L., Liu Q., Yang Y., Ding J. (2021). An environmental dilemma for China during the COVID-19 pandemic: The explosion of disposable plastic wastes. Bull. Environ. Contamination Toxicol. 106 (2), 237–240. doi: 10.1007/s00128-021-03121-x
Lo H. S., Lee Y. K., Po B. H. K., Wong L. C., Xu X., Wong C. F., et al. (2020). Impacts of typhoon mangkhut in 2018 on the deposition of marine debris and microplastics on beaches in Hong Kong. Sci. Total Environ. 716, 137172. doi: 10.1016/j.scitotenv.2020.137172
Maes T., Barry J., Leslie H. A., Vethaak A. D., Nicolaus E. E. M., Law R. J., et al. (2018). Below the surface: Twenty-five years of seafloor litter monitoring in coastal seas of north West europe, (1992–2017). Sci. Total Environ. 630, 790–798. doi: 10.1016/j.scitotenv.2018.02.245
Marin C. B., Niero H., Zinnke I., Pellizzetti M. A., Santos P. H., Rudolf A. C., et al. (2019). Marine debris and pollution indexes on the beaches of Santa catarina state, Brazil. Regional Stud. Mar. Sci. 31, 100771. doi: 10.1016/j.rsma.2019.100771
Martin C., Agustí S., Duarte C. M. (2019). Seasonality of marine plastic abundance in central red Sea pelagic waters. Sci. Total Environ. 688, 536–541. doi: 10.1016/j.scitotenv.2019.06.240
MEE (2018–2021a). Bulletin of the Chinese marine eco-environmental conditions (China: Ministry of Ecology and Environment).
Not C., Lui C. Y. I., Cannicci S. (2020). Feeding behaviour is the main driver for microparticle intake in mangrove crabs. Limnology Oceanography Lett. 5, 84–91. doi: 10.1002/lol2.10143
Onink V., Jongedijk C. E., Hoffman M. J., van Sebille E., Laufkötter C. (2021). Global simulations of marine plastic transport show plastic trapping in coastal zones. Environ. Res. Lett. 16 (6), 064053. doi: 10.1088/1748-9326/abecbd
Ouyang X., Duarte C. M., Cheung S. G., Tam N. F. Y., Cannicci S., Martin C., et al. (2022). Fate and effects of macro- and microplastics in coastal wetlands. Environ. Sci. Technol. 56 (4), 2386–2397. doi: 10.1021/acs.est.1c06732
Ouyang X., Guo F., Lee S. Y. (2021). The impact of super-typhoon mangkhut on sediment nutrient density and fluxes in a mangrove forest in Hong Kong. Sci. Total Environ. 766, 142637. doi: 10.1016/j.scitotenv.2020.142637
Panti C., Baini M., Lusher A., Hernandez-Milan G., Bravo Rebolledo E. L., Unger B., et al. (2019). Marine litter: One of the major threats for marine mammals. outcomes from the European cetacean society workshop. Environ. pollut. 247, 72–79. doi: 10.1016/j.envpol.2019.01.029
Parton K. J., Galloway T. S., Godley B. J. (2019). Global review of shark and ray entanglement in anthropogenic marine debris. Endangered Species Res. 39, 173–190. doi: 10.3354/esr00964
Pedrotti M. L., Lombard F., Baudena A., Galgani F., Elineau A., Petit S., et al. (2022). An integrative assessment of the plastic debris load in the Mediterranean Sea. Sci. Total Environ. 838, 155958. doi: 10.1016/j.scitotenv.2022.155958
Peng Y., Wu P., Schartup Amina T., Zhang Y. (2021). Plastic waste release caused by COVID-19 and its fate in the global ocean. Proc. Natl. Acad. Sci. 118 (47), e2111530118. doi: 10.1073/pnas.2111530118
Prevenios M., Zeri C., Tsangaris C., Liubartseva S., Fakiris E., Papatheodorou G. (2018). Beach litter dynamics on Mediterranean coasts: Distinguishing sources and pathways. Mar. pollut. Bull. 129 (2), 448–457. doi: 10.1016/j.marpolbul.2017.10.013
Qian J., Tang S., Wang P., Lu B., Li K., Jin W., et al. (2020). From source to sink: Review and prospects of microplastics in wetland ecosystems. Sci. Total Environ. 758, 143633. doi: 10.1016/j.scitotenv.2020.143633
R Core Team (2022). A language and environment for statistical computing (Vienna, Austria: R Foundation for Statistical Computing).
Reisser J., Proietti M., Shaw J., Pattiaratchi C. (2014). Ingestion of plastics at sea: does debris size really matter? Front. Mar. Sci. 1, 70. doi: 10.3389/fmars.2014.00070
Ryan P. G., Moore C. J., van Franeker J. A., Moloney C. L. (2009). Monitoring the abundance of plastic debris in the marine environment. Philos. Trans. R. Soc. B: Biol. Sci. 364 (1526), 1999–2012. doi: 10.1098/rstb.2008.0207
SBOA (2012–2017a). Bulletin of the Chinese marine environmental conditions (China: State Bureau of Oceanic Administration).
SBOA (2015). Technological guideline for the monitoring and assessment of marine debris (China (in Chinese: State Bureau of Oceanic Administration).
Serra-Gonçalves C., Lavers J. L., Bond A. L. (2019). Global review of beach debris monitoring and future recommendations. Environ. Sci. Technol. 53 (21), 12158–12167. doi: 10.1021/acs.est.9b01424
Shevealy S., Courtney K., Parks J. E. (2012). The Honolulu strategy: A global framework for prevention and management of marine debris. (Nairobi:UNEP and United States National Oceanic and Atmospheric Administration (NOAA).
Sulochanan B., Veena S., Ratheesh L., Padua S., Rohit P., Kaladharan P., et al. (2019). Temporal and spatial variability of beach litter in mangaluru, India. Mar. pollut. Bull. 149, 110541. doi: 10.1016/j.marpolbul.2019.110541
UNEP (2021). From pollution to solution: A global assessment of marine litter and plastic pollution (Nairobi: United Nations Environment Programme).
van Sebille E., Aliani S., Law K. L., Maximenko N., Alsina J. M., Bagaev A., et al. (2020). The physical oceanography of the transport of floating marine debris. Environ. Res. Lett. 15, 023003. doi: 10.1088/1748-9326/ab6d7d
Zhang H. (2017). Transport of microplastics in coastal seas. Estuarine Coast. Shelf Sci. 199, 74–86. doi: 10.1016/j.ecss.2017.09.032
Zhang Y., Kang S., Allen S., Allen D., Gao T., Sillanpää M. (2020). Atmospheric microplastics: A review on current status and perspectives. Earth-Science Rev. 203, 103118. doi: 10.1016/j.earscirev.2020.103118
Keywords: marine debris, beach, sea surface, density, plastics, seafloor
Citation: Ouyang X and Yang Z (2022) Characteristics and patterns of marine debris in the Chinese beach-sea continuum. Front. Mar. Sci. 9:1031714. doi: 10.3389/fmars.2022.1031714
Received: 30 August 2022; Accepted: 21 November 2022;
Published: 01 December 2022.
Edited by:
Jian Sheng, Texas A&M University Corpus Christi, United StatesReviewed by:
Ibnu Faizal, Universitas Padjadjaran, IndonesiaJuan Pablo Seco Pon, Institute of Marine and Coastal Research (IIMyC), Argentina
Megan Rose Lamson, Hawai’i Wildlife Fund, United States
Copyright © 2022 Ouyang and Yang. This is an open-access article distributed under the terms of the Creative Commons Attribution License (CC BY). The use, distribution or reproduction in other forums is permitted, provided the original author(s) and the copyright owner(s) are credited and that the original publication in this journal is cited, in accordance with accepted academic practice. No use, distribution or reproduction is permitted which does not comply with these terms.
*Correspondence: Xiaoguang Ouyang, x.ouyang@gmlab.ac.cn