Temporal patterns in coral reef fish assemblages with varying disturbance levels: A tale of two National Parks in Hawai´i
 Atsuko Fukunaga
 Sheila A. McKenna2
  John H. R. Burns
- 1Cooperative Institute for Marine and Atmospheric Research, University of Hawai´i at Mānoa, Honolulu, HI, United States
- 2National Park Service, Pacific Island Network Inventory and Monitoring, Hawai´i National Park, HI, United States
- 3National Park of American Samoa, Interior Region 12, Pago Pago, American Samoa, United States
- 4MEGA Lab, University of Hawai´i at Hilo, Hilo, HI, United States
Long-term ecological monitoring of coral reefs can reveal the state of the reef communities and responses of different reef components to various pulse and press disturbance events. Here, we describe long-term monitoring of reef fish assemblages from two U.S. National Parks in Hawai‘i, Kaloko-Honokōhau National Historical Park (KAHO) and Kalaupapa National Historical Park (KALA) over the past decade. These two parks experience different anthropogenic disturbances as KAHO is highly accessible with multiple types of adjacent land use while KALA is relatively inaccessible, surrounded by large expanses of native forest, and known for having the highest documented fish biomass within the main Hawaiian Islands. The fish assemblages in KAHO were numerically dominated by small-bodied damselfish Chromis spp. and herbivorous surgeonfishes Acanthurus nigrofuscus, Ctenochaetus strigosus and Zebrasoma flavescens, while those in KALA were numerically dominated by Chromis vanderbilti, A. nigrofuscus, Thalassoma duperrey and Paracirrhites arcatus. Multivariate control charts detected anomalies in the fish assemblages in some years. In KAHO, gradual shifts in the assemblages were detected in recent years due to changes (both increases and decreases) in relative abundances of numerically dominant species including Chromis agilis, C. vanderbilti, A. nigrofuscus, C. strigosus and Z. flavescens. There was a documented reduction in live coral cover in KAHO due to a bleaching event in 2015, and potential delayed effects of the coral mortality on the fish assemblages were found particularly in the North and South regions of the park. In KALA, increases in the abundances of Acanthurus (A. blochii, A. leucopareius, A. nigrofuscus, A. thompsoni and A. triostegus) and C. strigosus were found in 2014, likely due to a large recruitment event that had not been well reported. As localized thermal stress events were detected in both KAHO and KALA in 2019, continuous monitoring of these two parks is critical to assess how the coral-reef ecosystems under two different human-use scenarios respond to repeated heating events and whether there are immediate as well as delayed effects on reef organisms resulting from losses of live coral tissue and a subsequent decrease in structural complexity provided by the coral.
Introduction
Coral reefs worldwide have been under increasing levels of stress due to warming ocean temperatures and changes in ocean chemistry (Hoegh-Guldberg et al., 2007; Hughes et al., 2018). Thermal stress coupled with increases in the intensity and frequency of extreme weather events, such as storms and flooding, can lead to coral bleaching and subsequent mortality (Loya et al., 2001; Couch et al., 2017) or physical destruction of coral reefs (Woodley et al., 1981; Pascoe et al., 2021). In addition to these “pulse” disturbances, long-term continuous “press” disturbances including nutrient input, contaminants, and sedimentation from adjacent land use, as well as decreases in herbivorous fishes due to unsustainable fishing practices, can gradually alter the state of coral reefs (Brown et al., 1990; Done, 1992; Hunter et al., 1995; Bellwood et al., 2004).
Benthic habitats of coral reefs affect distributions and abundances of reef fishes (Graham and Nash, 2013; Fukunaga et al., 2020). Structural complexity of coral provides three-dimensional structure for reef organisms, and reductions in live coral cover can result in decreases in fish abundance and diversity (Komyakova et al., 2013). Reef fishes can also be influenced by their prey availability, and decreases in corallivorous fish abundance have been reported following mass coral mortality due to coral bleaching (Magel et al., 2020) and Acanthaster outbreaks (Kayal et al., 2012). Press disturbances can also have direct and/or indirect negative impacts on abundances of reef fishes (DeMartini et al., 2013; Foo et al., 2021). Ecological monitoring of coral reefs that can capture changes in coral-reef communities resulting from both pulse and press disturbances are, therefore, critical in coral-reef management and allow resource managers to respond to changes with different options.
Coral reef species diversity in the Hawaiian archipelago is relatively low compared to species diversity in the Indo-West Pacific Ocean due to geographic isolation (Grigg, 1983). The isolation, however, also results in relatively high levels of endemism of reef fishes (Friedlander et al., 2003; Grigg et al., 2008). This makes fish assemblages on Hawaiian coral reefs unique and valuable. The U.S. National Park Service (NPS) manages two park areas encompassing coral reefs in the state of Hawai’i: Kaloko-Honokōhau National Historical Park (KAHO) located on the west side of the island of Hawai‘i and Kalaupapa National Historical Park (KALA) located on the north shore of the island of Moloka‘i (Figure 1). The spatial extent of the marine area enclosed by the park boundaries is 2.4 km2 for KAHO and 8.1 km2 for KALA. The reefs inside each park consist primarily of coral colonies on basalt boulder habitat, however KAHO has interspersed aggregated reef structures while KALA has only isolated coral colonies (Brown et al., 2016). Each park supports diverse coral-reef communities as well as endangered/threatened marine organisms including sea turtles and Hawaiian monk seals (Brown et al., 2016).
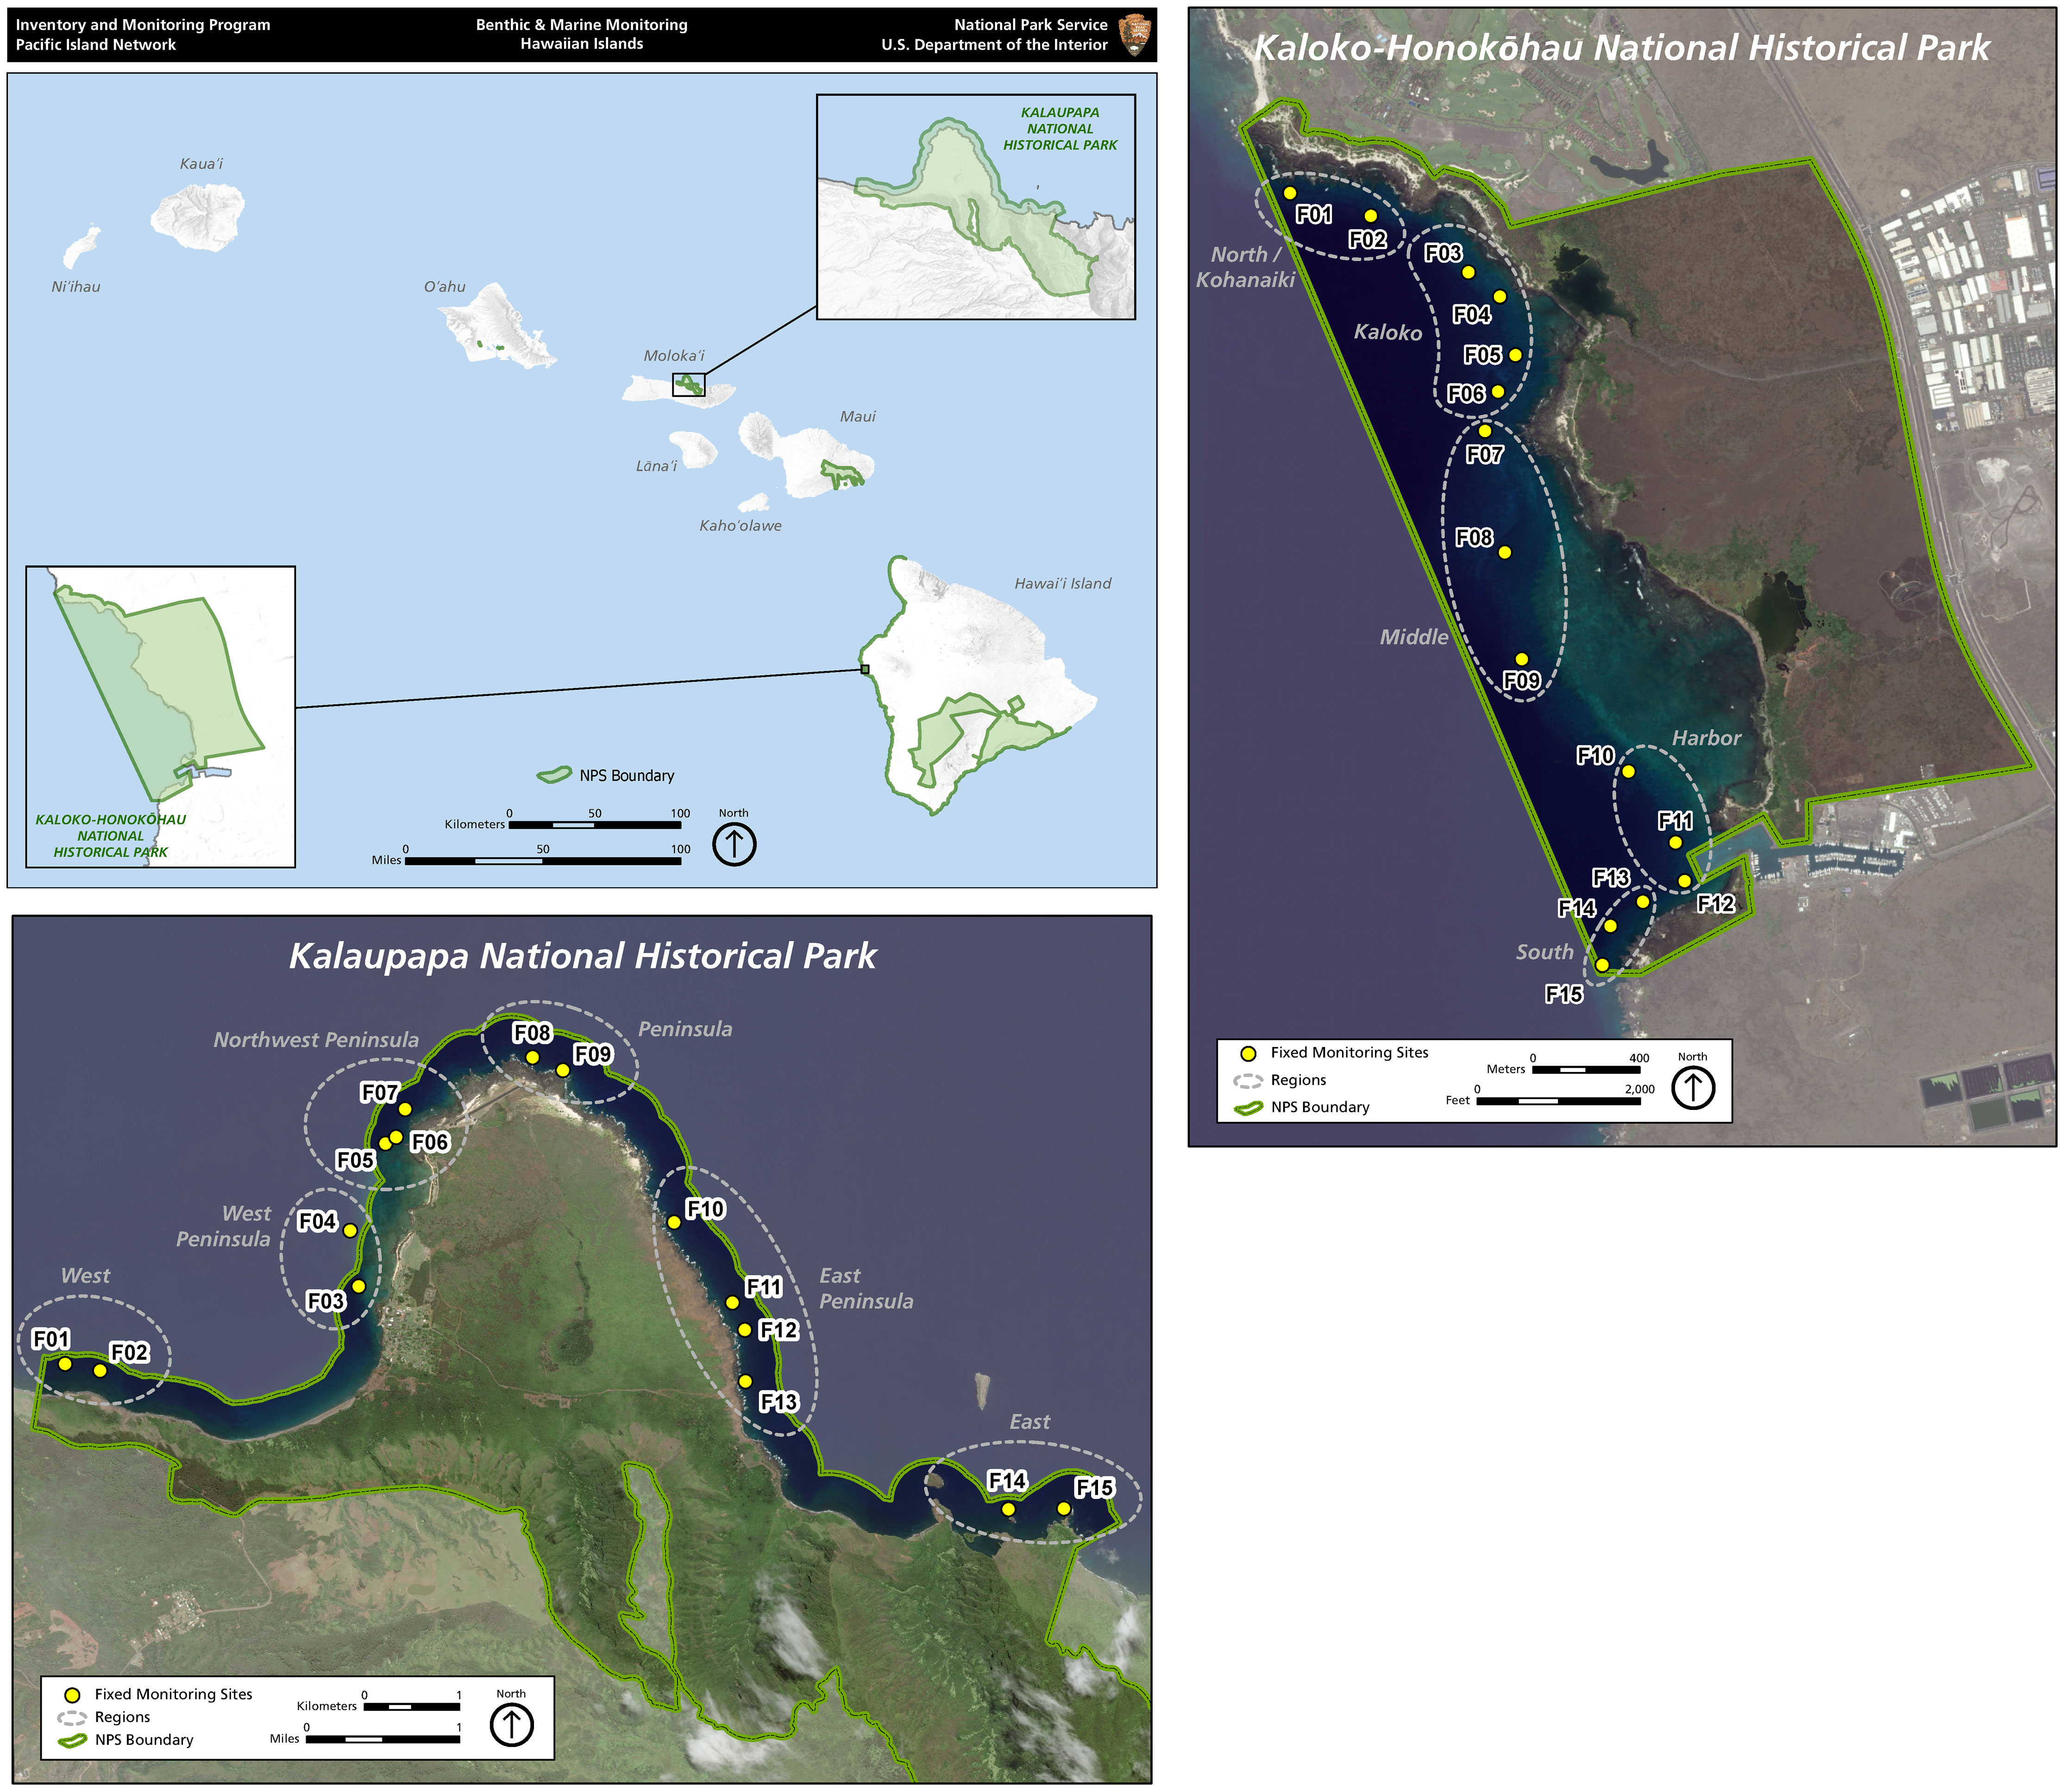
Figure 1 Map of the main Hawaiian Islands, showing the locations of the two national parks and permanent survey sites within each park.
Of the two parks, KAHO is located approximately 5 km north of Kailua-Kona where the highest human population density and runoff associated with impervious surfaces occur along the coastline of West Hawai‘i and approximately one million domestic and international tourists arrive every year (Gove et al., 2019). KAHO is more accessible and has substantially more visitors and users of their marine resource than KALA, including fishers targeting regulated species using permitted fishing gear. In addition to these press disturbances, coral reefs in KAHO were impacted by the global-scale coral bleaching event in 2014 - 2017, during which some coral reefs in Hawai‘i exhibited mass bleaching in 2014 and 2015 (Williams et al., 2016; Couch et al., 2017; Eakin et al., 2019). In KAHO, 77% of coral colonies experienced bleaching in 2015 that resulted in a reduction in the mean live coral cover from 33% to 12% (McCutcheon and McKenna, 2021).
In contrast, KALA is isolated geographically by 500-meter cliffs abutting the ocean and surrounding forest with only a foot trail leading into the peninsula. Human access is strictly limited by a permit system according to Hawai‘i state law. Access by boat within the quarter-mile offshore park boundary also requires a permit and is limited seasonally due to high wave events. Threats to coral reefs in KALA due to direct human activities are thus limited, particularly in comparison to those in KAHO. Fishing pressure in KALA is also minimal (Brown et al., 2022), and this location has the highest documented fish biomass in the main Hawaiian Islands (Friedlander et al., 2019), although fish assemblages in the main Hawaiian Islands are overall in a degraded state compared to those in the Northwestern Hawaiian Islands that are largely uninhabited (Friedlander et al., 2018). In addition, coral colonies in KALA experienced little to no bleaching during the 2014 - 2017 global-scale coral bleaching event, maintaining the mean live coral cover of approximately 10% (McCutcheon and McKenna, 2021). Although a localized thermal stress event in 2019 caused 23% of the colonies to bleach, no significant coral mortality was observed (McCutcheon and McKenna, 2021).
Here we utilized long-term annual reef monitoring data collected by the NPS Pacific Island Inventory and Monitoring Network (PACN) and investigated temporal changes in numerical abundance of reef fish assemblages in the two national parks in Hawai‘i (i.e., KAHO and KALA). We hypothesized that the fish assemblages in KAHO would show shifts in the assemblage structure due to the bleaching, as well as existing press disturbances, while those in KALA would be stable. We employed distance-based multivariate control charts (MCCs) to analyze the repeated observations within each park, as this approach allows for investigation of natural temporal variability in a biological community at each site without the need for a site of comparison (e.g., a “control” site in the Before-After-Control-Impact design) and to identify observations outside of the natural variability (Anderson and Thompson, 2004). We then investigated individual species if MCCs identified any observations outside the natural variability (i.e., anomalous years). The present study offers baseline information about the fish assemblages in the two national parks and how their species compositions have changed over time in recent years. These data provide valuable insights into how disturbance events may alter reef habitats and subsequently impact fish assemblages.
Materials and methods
Survey design
Underwater surveys in KAHO and KALA are conducted annually through the NPS PACN that implements co-located fish and benthic surveys using the marine fish protocol (Brown et al., 2011a) and benthic marine community protocol (Brown et al., 2011b) along 30 (15 fixed/permanent plus 15 temporary/rotational) transects at survey sites ranging from 10 to 20 m in depth. The present study focused on fish data from the 15 fixed/permanent transects from each park to utilize the repeated observations and examine site-specific temporal changes in the fish assemblages.
Fish surveys were conducted during summer months from 2007 to 2011 and from 2014 to 2019 at 15 fixed monitoring sites in KAHO and from 2006 to 2019 at 15 fixed sites in KALA. No fish surveys were conducted in KAHO in 2012 and 2013 due to staffing shortages. For each park, permanent survey sites were numbered and grouped based on geographical proximity as well as habitat characteristics that reflected the similarity of overall environmental conditions at the sites (Figure 1). For KAHO, the 15 sites were grouped into five regions based on geographic location and benthic composition: North (01 and 02), Kaloko (03, 04, 05 and 06), Middle (07, 08 and 09), Harbor (10, 11 and 12) and South (13, 14 and 15). The Kaloko and Harbor regions have relatively high live coral cover (mostly Porites corals) whereas the North, Middle and South regions are basaltic pavement/boulder habitats with relatively high abundance of Pocillopora meandrina colonies at the sites 01 and 15 (Table 1). For KALA, the 15 sites were grouped into six regions based on geographic location and wave exposure: West (01 and 02), West Peninsula (03 and 04), Northwest Peninsula (05, 06 and 07), Peninsula (08 and 09), East Peninsula (10, 11, 12 and 13) and East (14 and 15). Sites 01-07 experience winter northwest swells but are shielded from northeast trade-wind swell by the peninsula. Sites 10-15 are primarily impacted by northeast trade wind swell with a secondary impact from dampened northwest winter storm swell. Sites 08 and 09 experience both swell types and subjected to the largest waves. Habitat types of the KALA survey sites are basaltic rock/boulder except for the sites 05 and 06, which are basaltic pavement (Table 1). Isolated colonies of P. meandrina are present in the Northwest Peninsula and Peninsula regions except for the site 06 (Table 1). At each survey site, divers who were formally trained for fish identification and survey methods in Hawaiian waters laid a 25-m transect tape parallel to the reef crest along a constant depth contour, enumerated all fishes within 2.5 m on either side of the transect tape (5-m belt) to the lowest possible taxonomic level and visually estimated sizes of all individuals (Brown et al., 2011a).
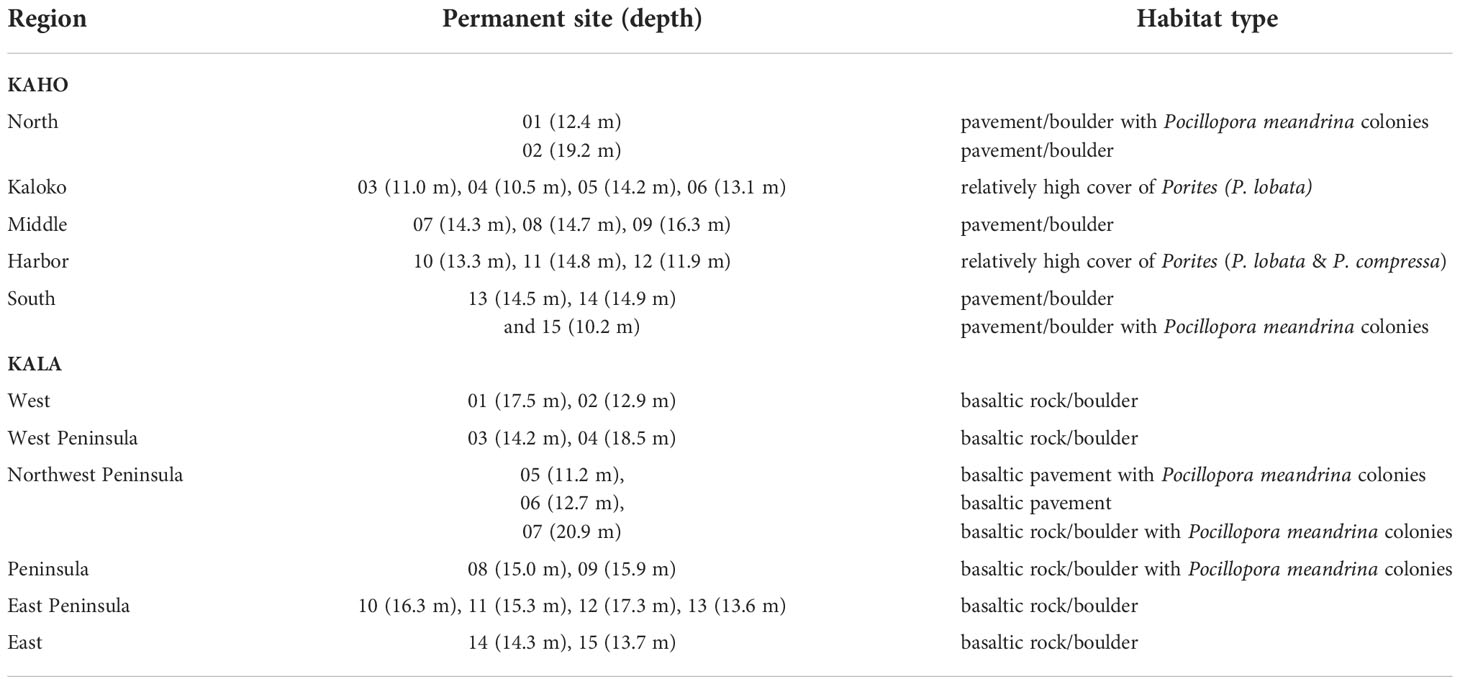
Table 1 Grouping and water depths of KAHO and KALA permanent survey sites.
Data analysis
To focus on reef fishes, transient pelagic and semi-pelagic fishes, including the families Carangidae, Belonidae (single observation in the KAHO dataset), Carcharhinidae, Ginglymostomatidae, Dasyatidae and Myliobatidae, were excluded from the analysis. We also focused on numerical abundance of fishes instead of biomass to evaluate the structure of fish assemblages wholistically by giving an equal weight to each individual regardless of their size (i.e., avoiding analysis based on biomass that would give larger individuals more weights). Species that did not account for at least 3% of the total fish numerical abundance at a site in any of the surveys were also excluded as interpreting changes in the abundances of rare species is not practical. The 3% cutoff was chosen because it retained approximately 97% of individual reef fish recorded in the study while reducing the number of taxa to approximately half for analysis (see Results for details). The fish assemblage structure was then calculated from the reduced dataset on the basis of the Bray-Curtis dissimilarity after square-root transformation of the fish counts (Clarke, 1993) and used for analyses of fish assemblages over time.
Data from the two parks were analyzed and presented separately due to differences in disturbance levels, disturbance history and environmental conditions. Specifically, we focused on analyzing temporal patterns in the fish assemblages within each park, rather than directly comparing the structures of the fish assemblages between the two parks. Distance-based multivariate control charts (MCCs) were constructed for each region within a park using the vegan package (Oksanen et al., 2022) and custom R scripts in the statistical software R version 4.0.3 (R Core Team, 2020). MCCs are plots of two distances (dt and dbt) calculated in multivariate space based on any distance or dissimilarity measure (Anderson and Thompson, 2004). The distance dt is the distance/dissimilarity between the observation at time t and the centroid of all observations prior to the time t at a given site, while the distance dbt is the distance/dissimilarity between the observation at time t and the centroid of observations designated as a baseline (see Eqs. 4-7 in Anderson and Thompson, 2004 for the equations to calculate dt and dbt). Here, we constructed MCCs for each region within a park to focus on overall temporal trends rather than details at each of the 15 sites. We first obtained the centroid of survey sites within each region for each time point in the space of the Bray-Curtis dissimilarity and used these centroids to calculate dt and dbt. For dbt, the first two years of data (i.e., 2007 and 2008 for KAHO and 2006 and 2007 for KALA) were designated as a baseline to test for changes in the fish assemblages since the beginning of the monitoring. Bootstrapping techniques were used to obtain 50% and 95% confidence bounds for both dt and dbt based on resampling of 1000 times. The 50% confidence bound (i.e., median) is a good representation of the temporal trend in the data. The 95% confidence bound was used as an upper confidence limit under which the status of a given region within each park was considered stable or within natural variability.
We utilized similarity percentage analysis (SIMPER: Clarke and Warwick, 2001) in the software package PRIMER 7 (Clarke and Gorley, 2015) if MCCs indicated changes in fish assemblages that were considered outside natural variability. SIMPER within-group similarity analysis was first used to identify fish taxa that were consistently present in high abundance in each region in “typical” years based on MCCs. SIMPER between-group dissimilarity analysis was then used to identify taxa that contributed to the differences in fish assemblages in the potentially anomalous years as identified by MCCs. Anomalies in fish assemblage structure were considered in comparison to either all previous years or the baseline years based on the results of MCCs.
Results
KAHO
Over the 11 years, 35,447 individuals of reef fishes belonging to 126 taxonomic groups (123 species and 3 groups identified to genus), excluding pelagic and semi-pelagic species, were identified and enumerated along the 15 fixed transects. More than half of these taxonomic groups did not account for 3% or more of fish abundance in any surveys, so excluding less-common species resulted in 34,247 individuals belonging to 52 species for analysis. For all regions (i.e., North, Kaloko, Middle, Harbor and South), the mean numbers of species and fish counts were relatively stable and did not visually show any obvious decreasing or increasing trends (Figure 2).
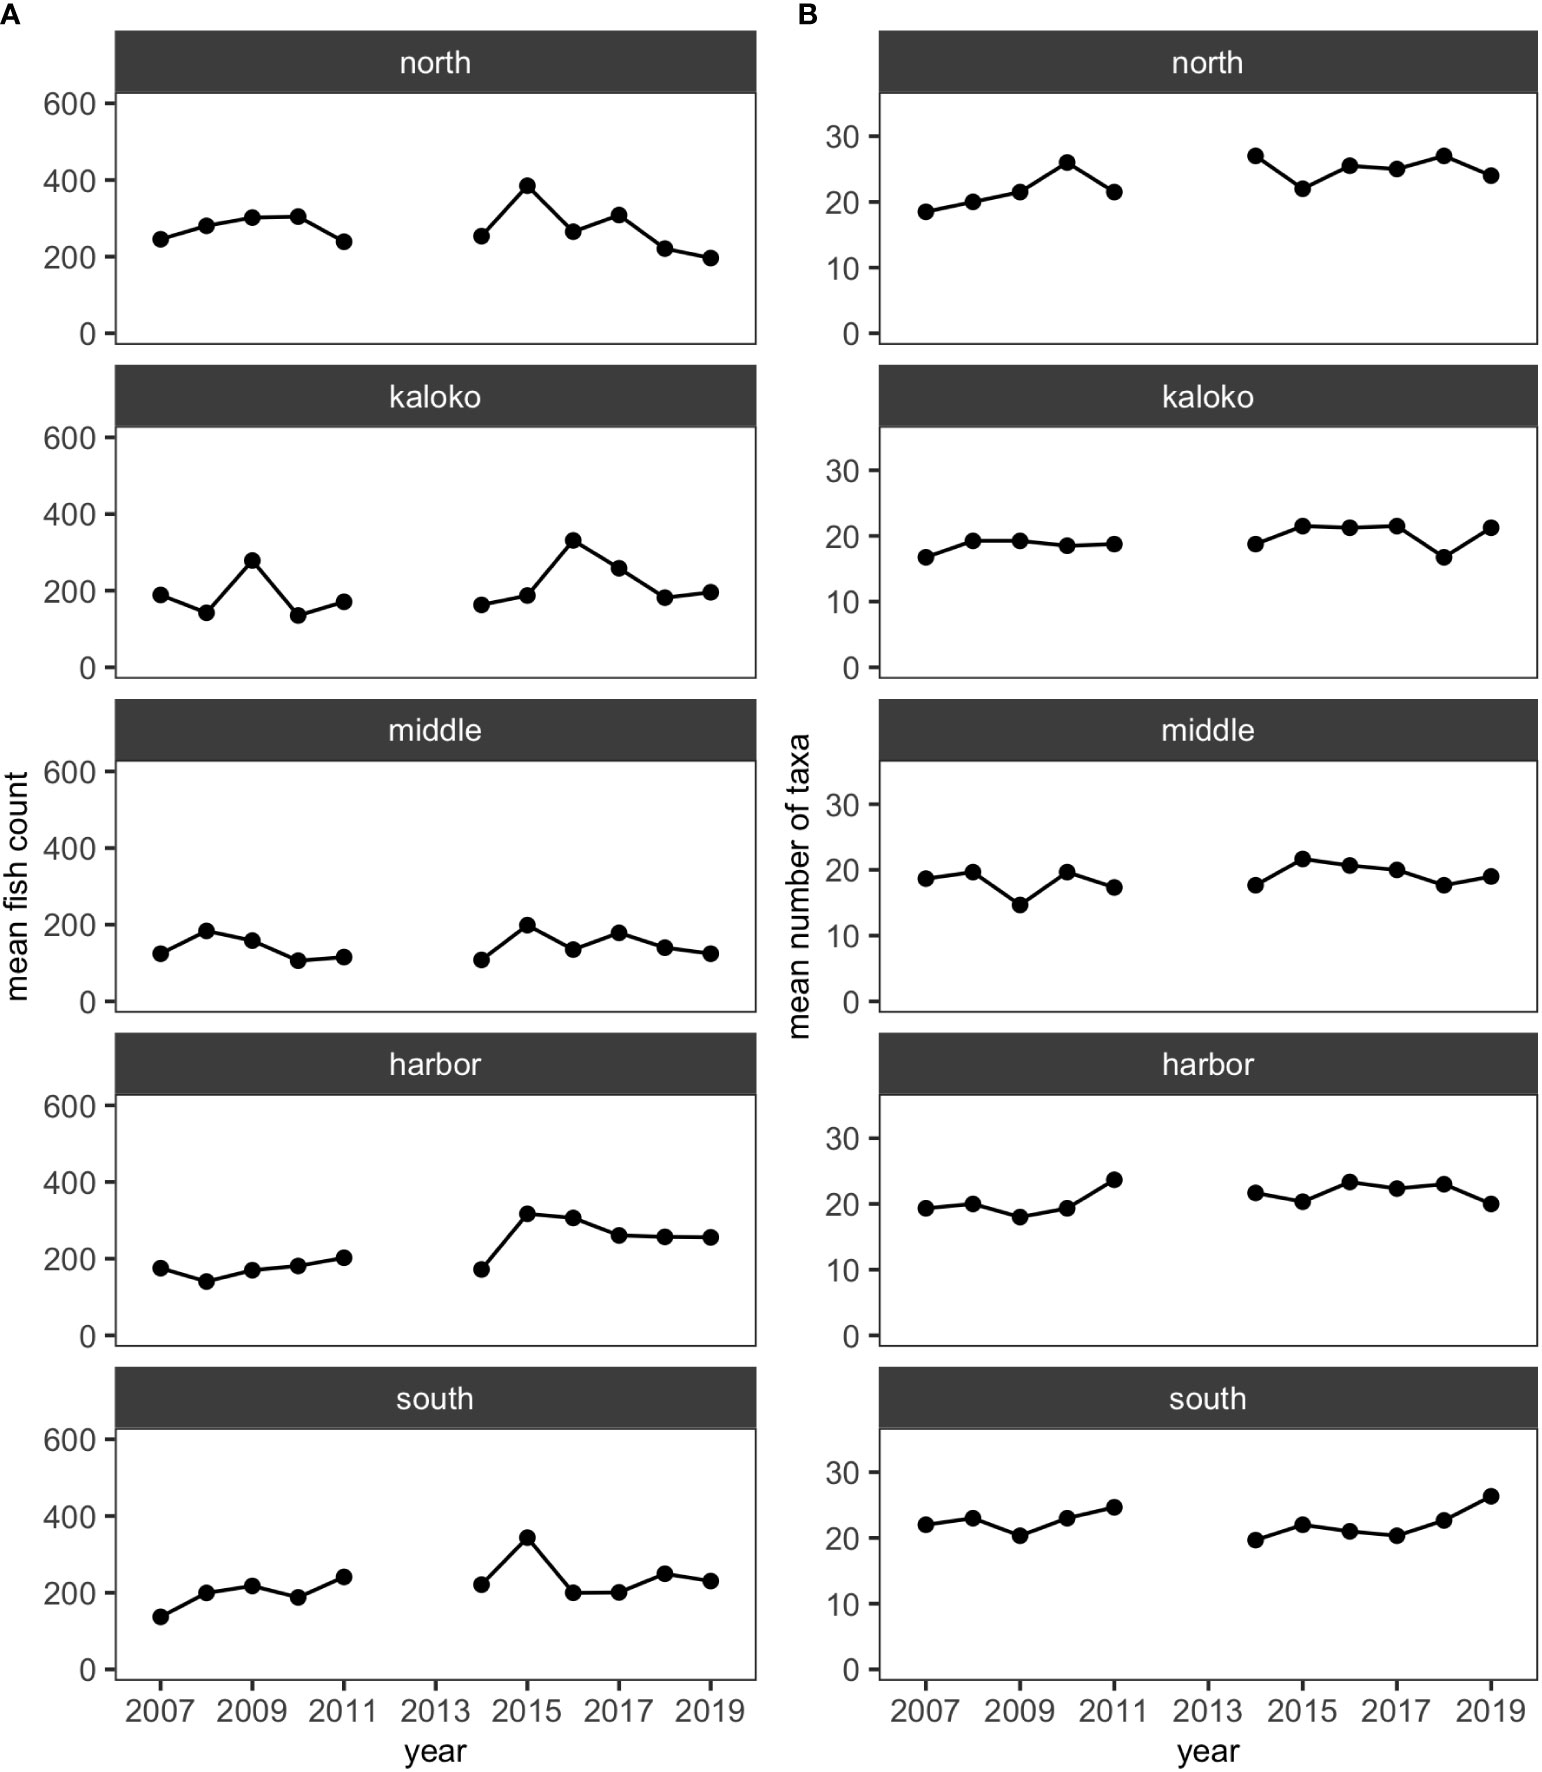
Figure 2 Plots showing (A) the mean numbers of fish counts and (B) the mean numbers of fish taxa in each of the five regions in KAHO using the reduced dataset.
MCCs detected shifts in the structure of KAHO fish assemblages in recent years on the basis of the Bray-Curtis measure. The shift was mostly gradual and often only detected by dbt (distance to the baseline) values and not dt (distance to all previous years) values (Figure 3). For the North, Middle and South regions, the shifts occurred in the last two years of the study (i.e., 2018 and/or 2019), while dbt values identified potentially anomalous years in the Harbor region in 2016 and 2018. In Kaloko, an overall shift in the fish assemblage was detected in 2014, with changes in the assemblages exceeding the dbt upper confidence limit in 2015, 2017 and 2018. The exact timing of the shift in the Kaloko region was, however, difficult to determine due to the lack of surveys in 2012 and 2013. Visualization of the assemblage structure based on the Bray-Curtis measure using principal coordinate analysis also confirmed a gradual shift in fish assemblages in each region (Figure S1).
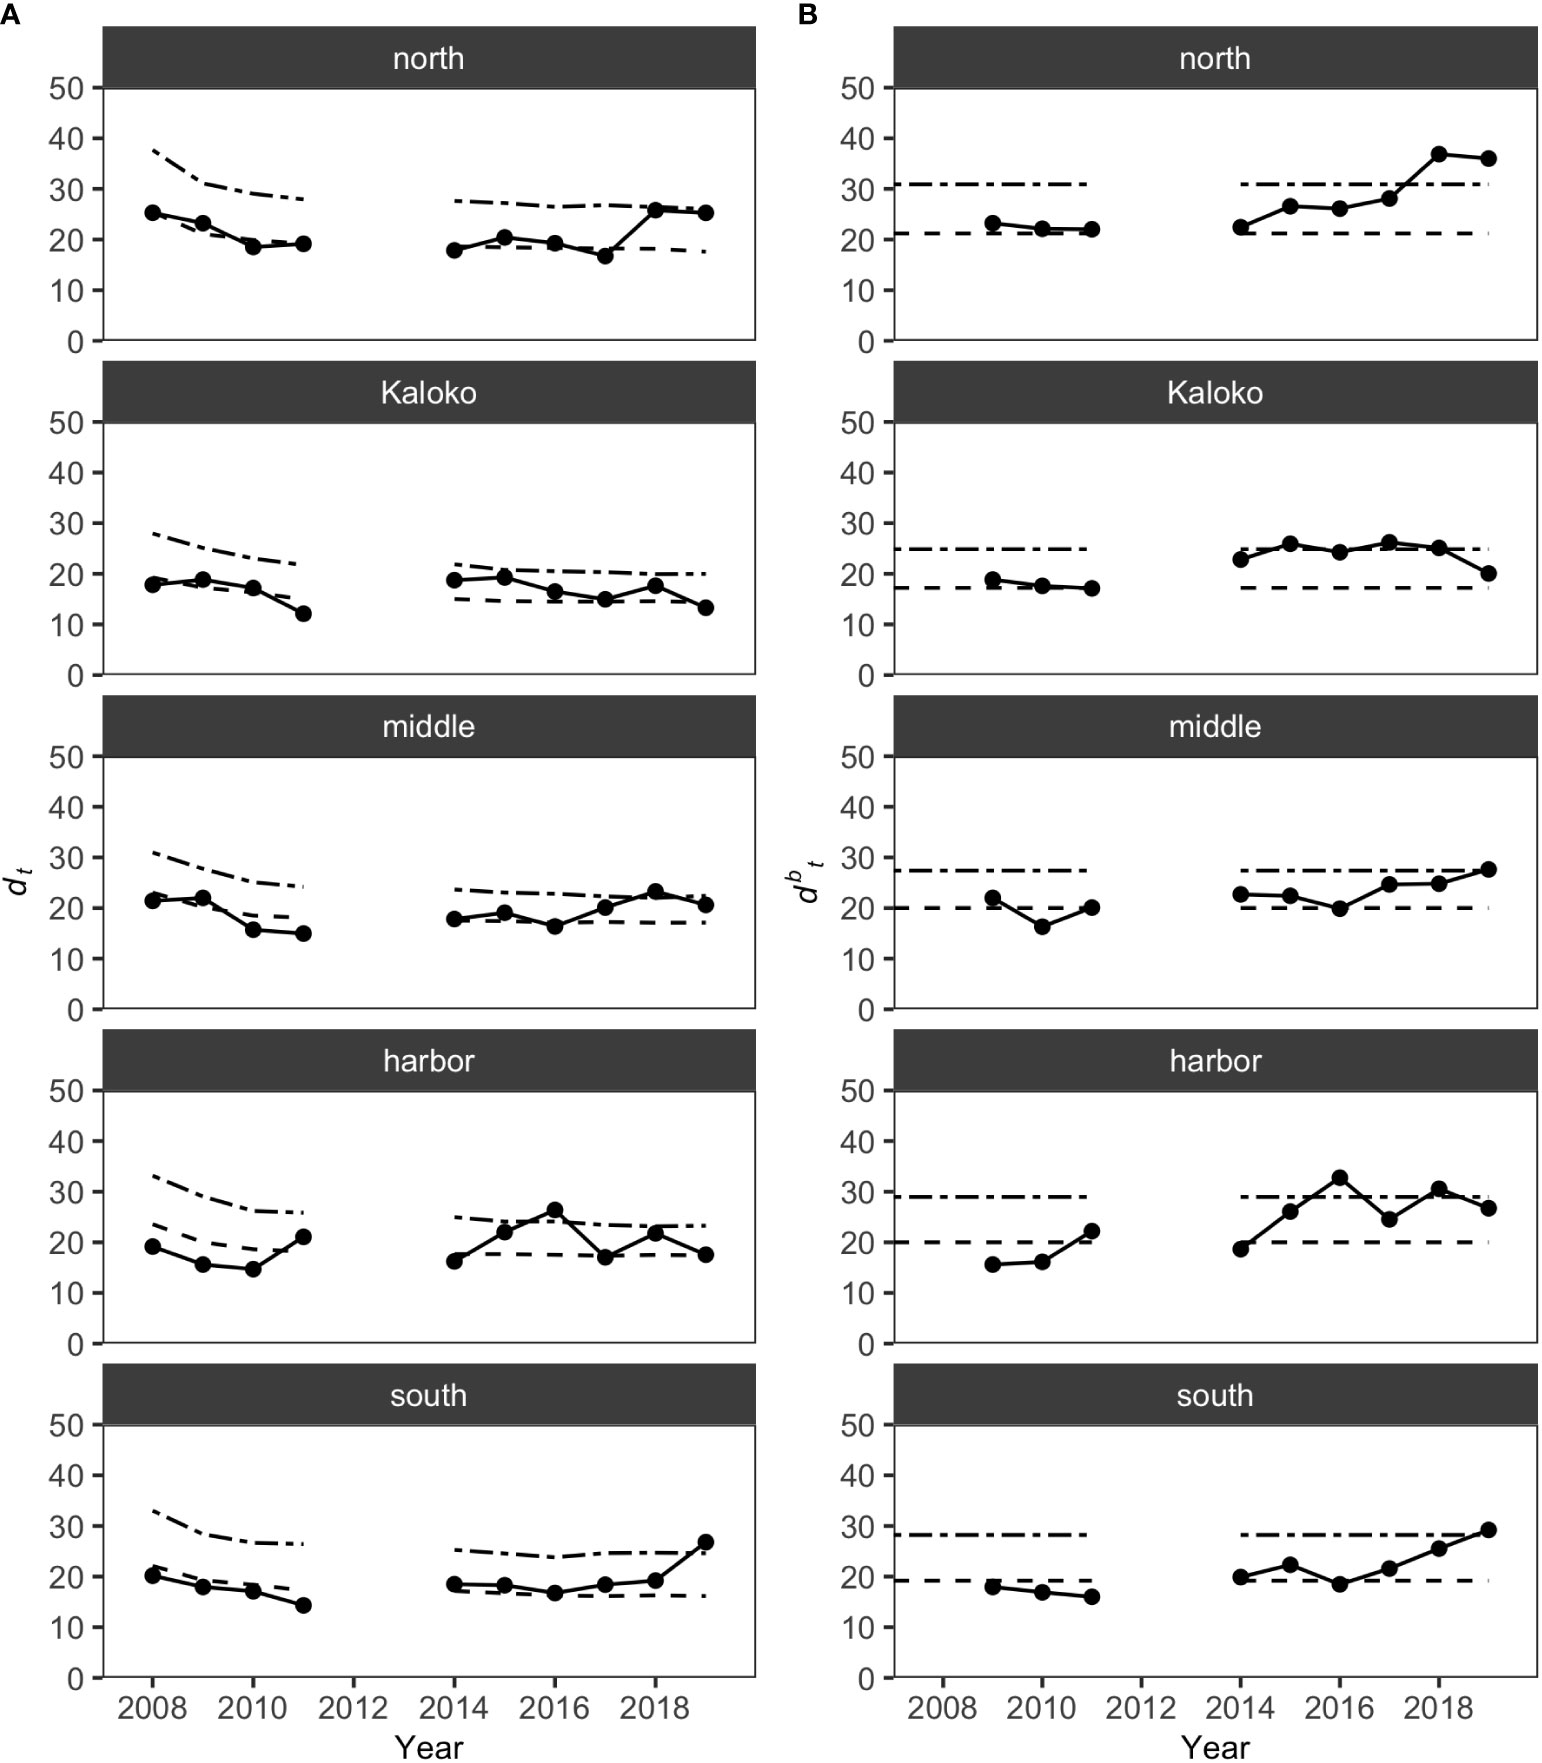
Figure 3 Results of MCCs for KAHO fish assemblages showing (A) dt values and (B) dbt values. Dashed lines on each plot show 50 percentile confidence bounds as representations of the temporal trends, and dash-dotted lines show 95 percentile confidence bounds as upper confidence limits under which the status of the regions were considered stable or within natural variability.
Fish species that were consistently present in high abundance in typical years were relatively similar among different regions, although some differences were detected (Table 2). For example, Chromis vanderbilti was highly abundant in the North, Kaloko and Middle regions but not in the Harbor and South regions. Ctenochaetus strigosus was also highly abundant in the North, Kaloko, Harbor and South regions but not in the Middle region. The Harbor region was somewhat distinct from all other regions due to higher abundances of the corallivores Chaetodon multicinctus and Plectroglyphidodon johnstonianus and lower abundances of C. vanderbilti, Acanthurus nigrofuscus than the other regions.
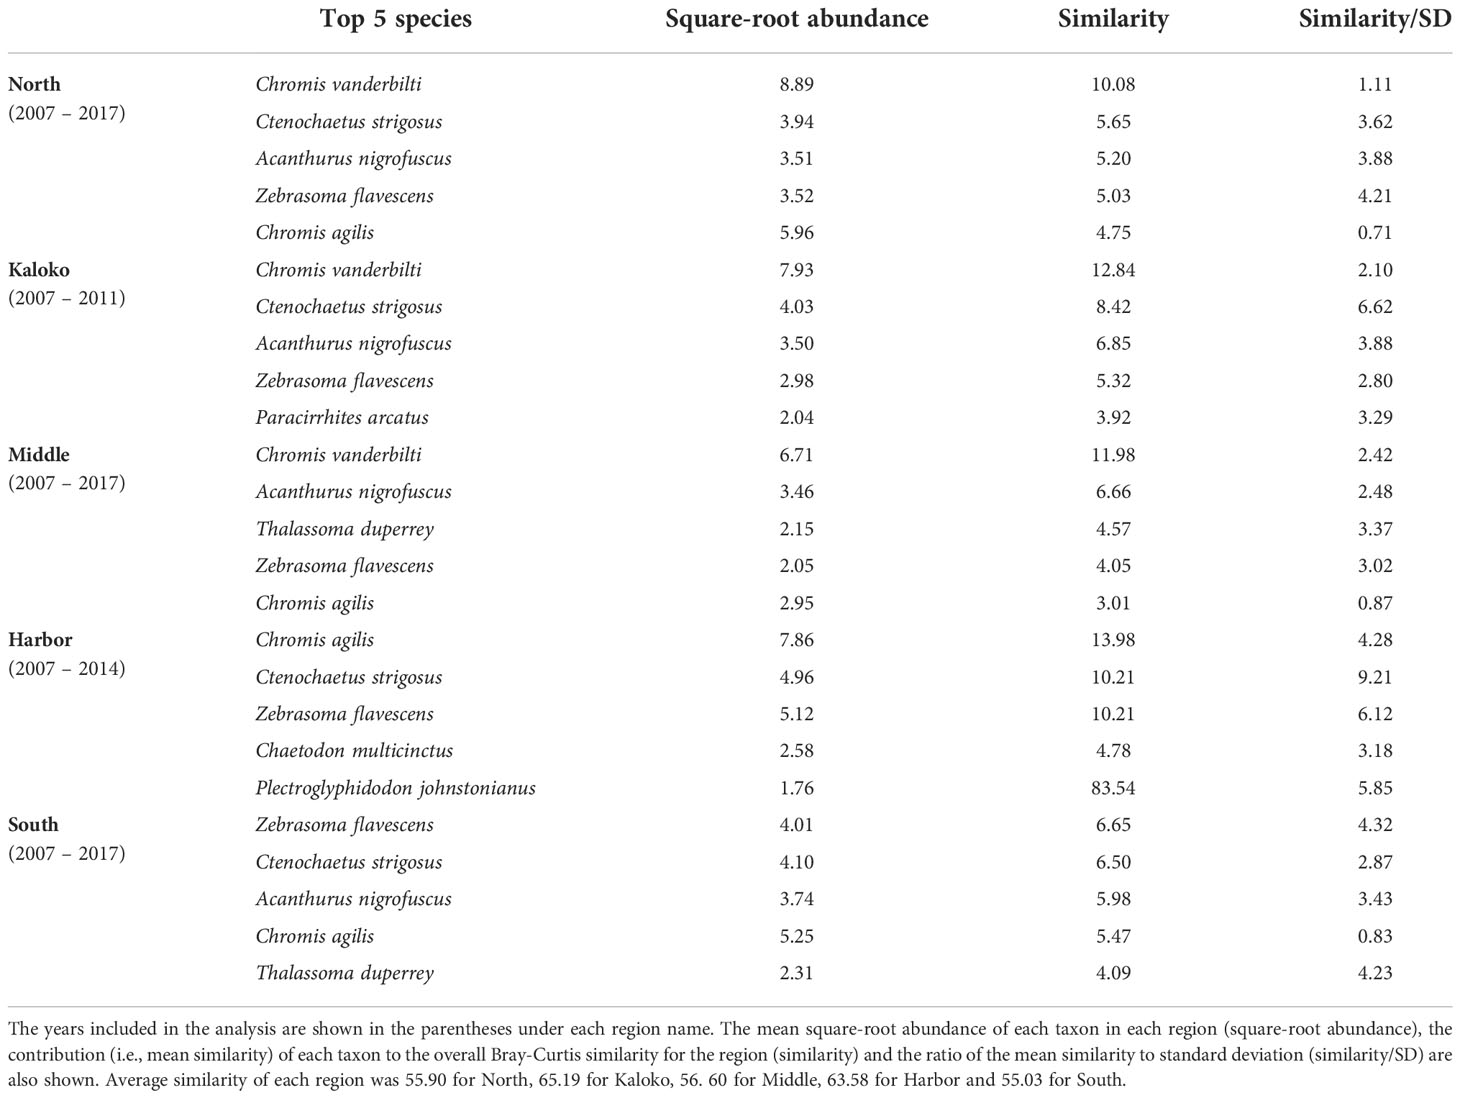
Table 2 Results of SIMPER analysis showing the top five species that were consistently present in high abundance in each region of KAHO in “typical” years identified by MCCs.
The changes in fish assemblages that were identified as outside natural variability by MCCs were mostly due to changes in abundances of common species, such as Chromis agilis, C. vanderbilti, A. nigrofuscus, C. strigosus and Zebrasoma flavescens (Table 3). Some notable and consistent changes in fish assemblages included decreases in the abundances of the genus Chromis and increases in the abundances of the genus Abudefduf in the North region, increases in the abundance of C. agilis in the Kaloko and Middle regions (i.e., middle section of KAHO) and decreases elsewhere, decreases in the abundances of C. strigosus in the Middle and South regions and increases in the abundance of Z. flavescens in the Harbor region.
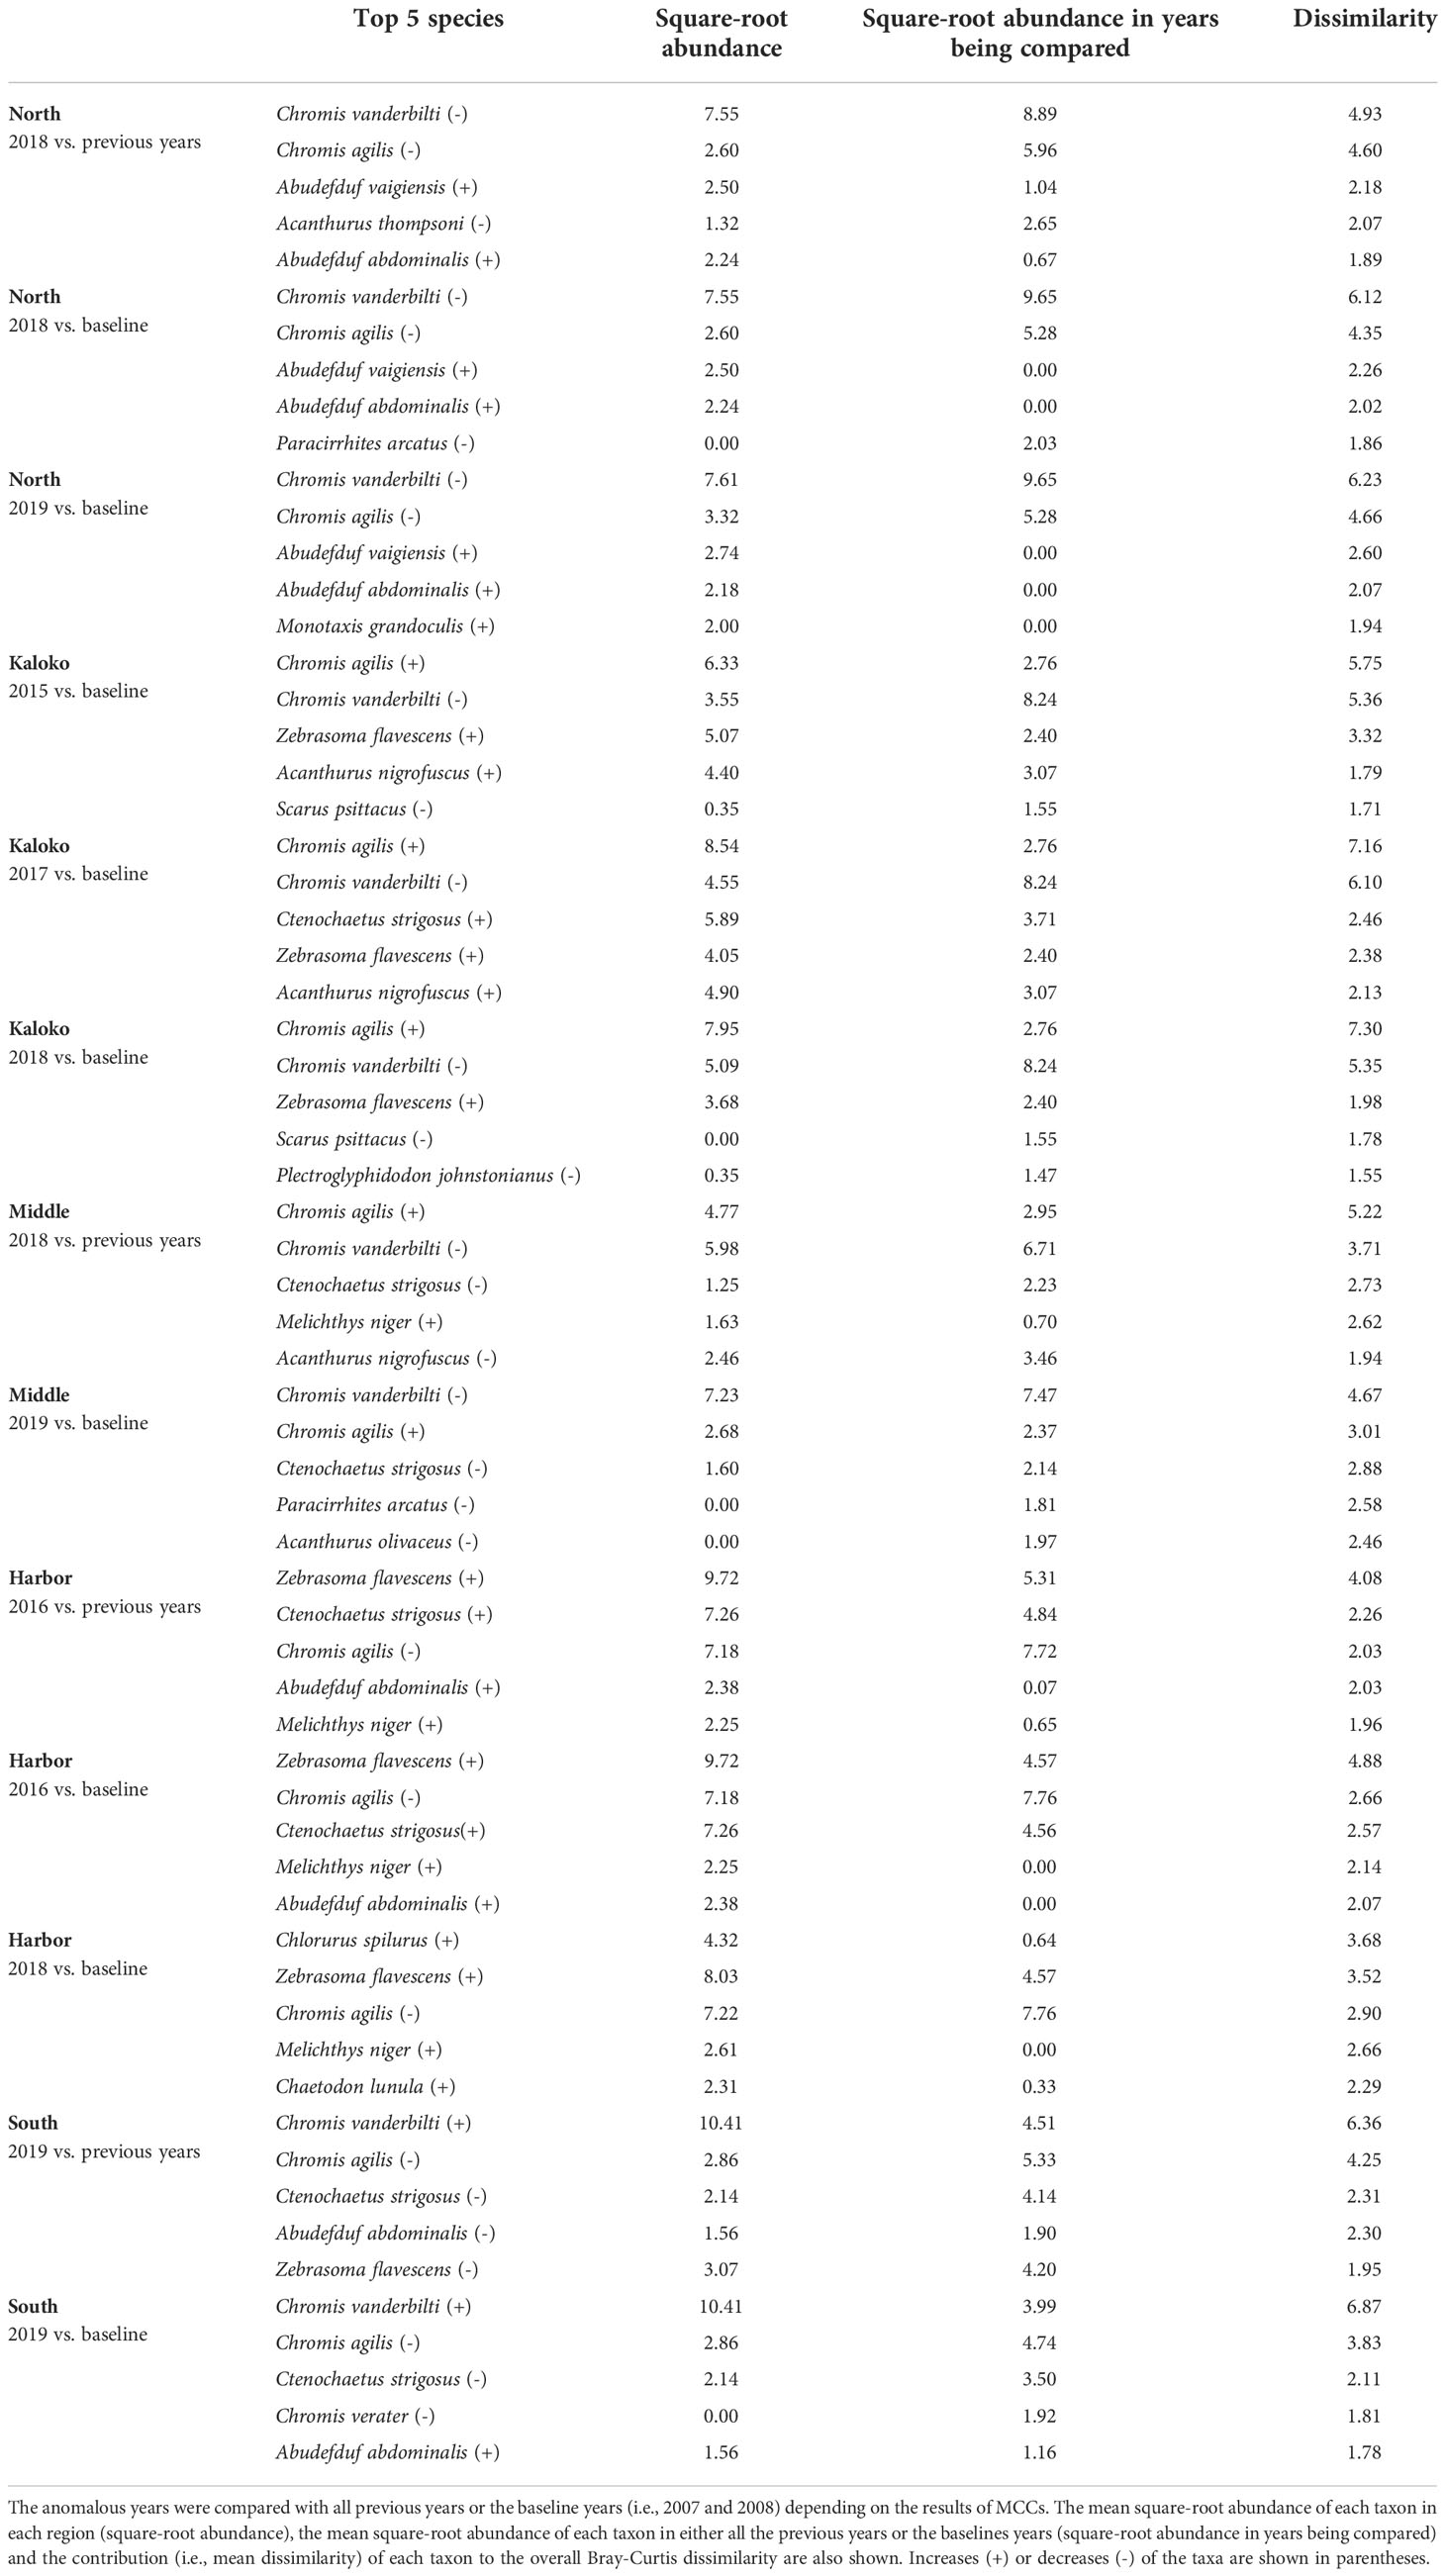
Table 3 Results of SIMPER analysis showing the top five species that contributed to separating fish assemblages of KAHO in anomalous years as identified by MCCs.
KALA
Over the 14 years of the study, 39,091 individuals of reef fishes belonging to 138 taxonomic groups (136 species and 2 groups identified to genus), excluding pelagic and semi-pelagic species, were identified along the 15 fixed transects. Similar to KAHO, a little over half of these groups did not account for 3% or more of fish abundance in any surveys. Excluding less-common species generated a smaller dataset with 38,047 individuals belonging to 62 species and one genus group for analysis. The mean number of species and fish counts were relatively stable at each region (i.e., West, West Peninsula, Northwest Peninsula, Peninsula, East Peninsula and East) and did not visually show any obvious trends (Figure 4).
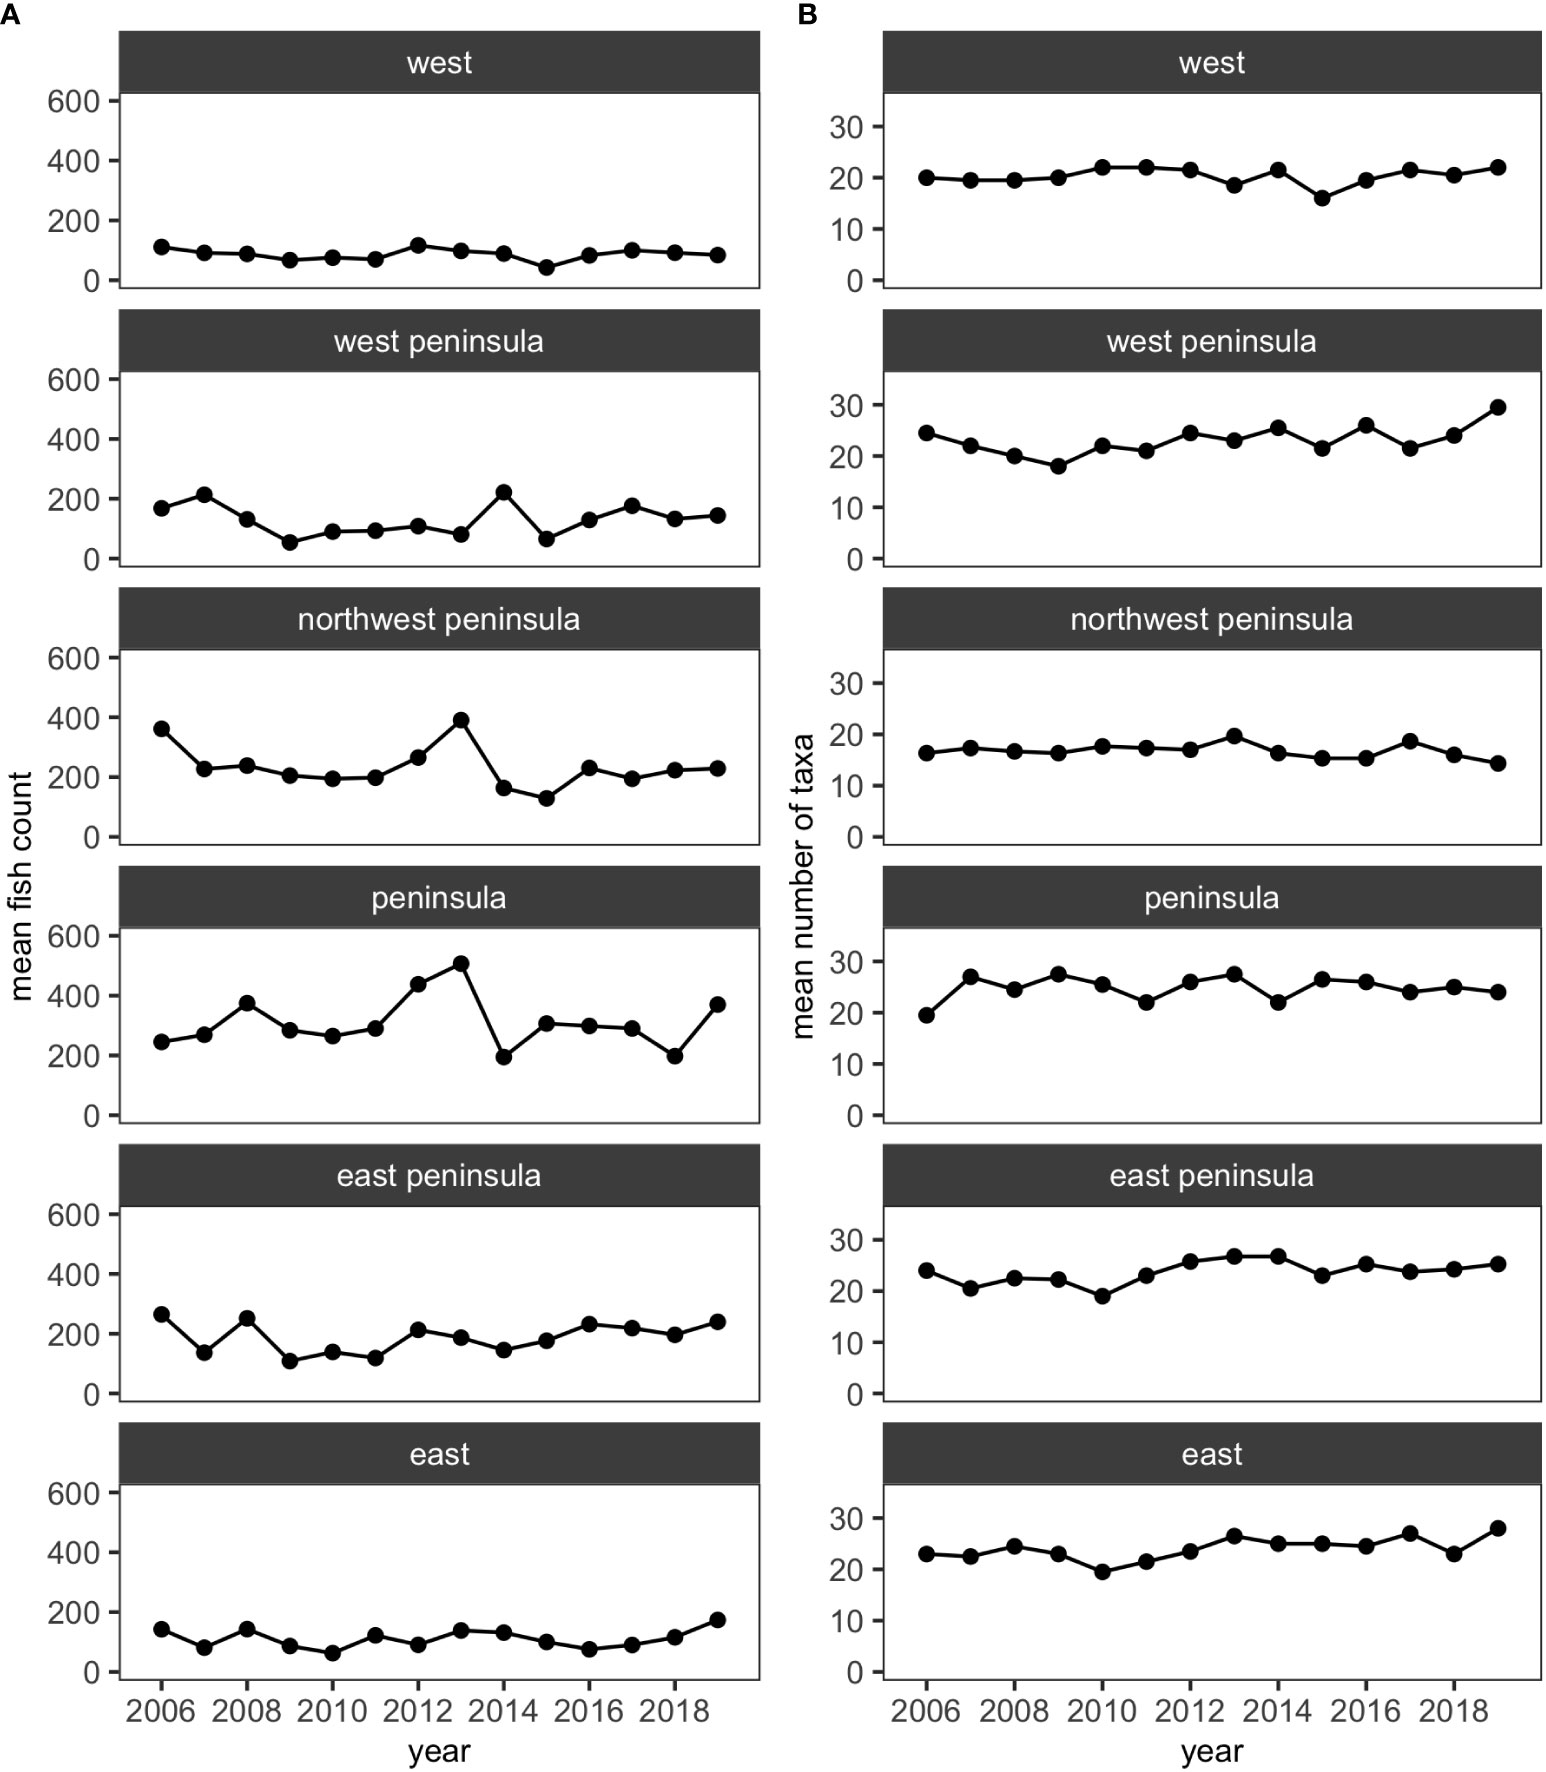
Figure 4 Plots showing (A) the mean numbers of fish counts and (B) the mean numbers of fish taxa in each of the five regions in KALA using the reduced dataset.
MCCs detected two potentially anomalous years in the structure of KALA fish assemblages on the basis of the Bray-Curtis measure; dt and dbt values exceeded the upper confidence limit in 2014 in all regions except for the West Peninsula region and in 2015 in the West region (Figure 5). The West Peninsula region also had a dbt value exceeding the upper confidence limit in 2009, and this was due to a decrease in the overall fish count as observed in the dips in the total fish count and the number of fish taxa in the region (Figure 4). Fish taxa that were consistently present in high abundance during typical years as identified by MCCs were slightly more variable among regions than those in KAHO. Some common taxa were, however, consistently found at multiple regions, and these included A. nigrofuscus, C. vanderbilti, C. strigosus, Sufflamen bursa and Thalassoma duperrey (Table 4). C. vanderbilti was particularly abundant from the Northwest Peninsula to the East Peninsula and had considerable contributions to the within-group similarities in the regions (Table 4).
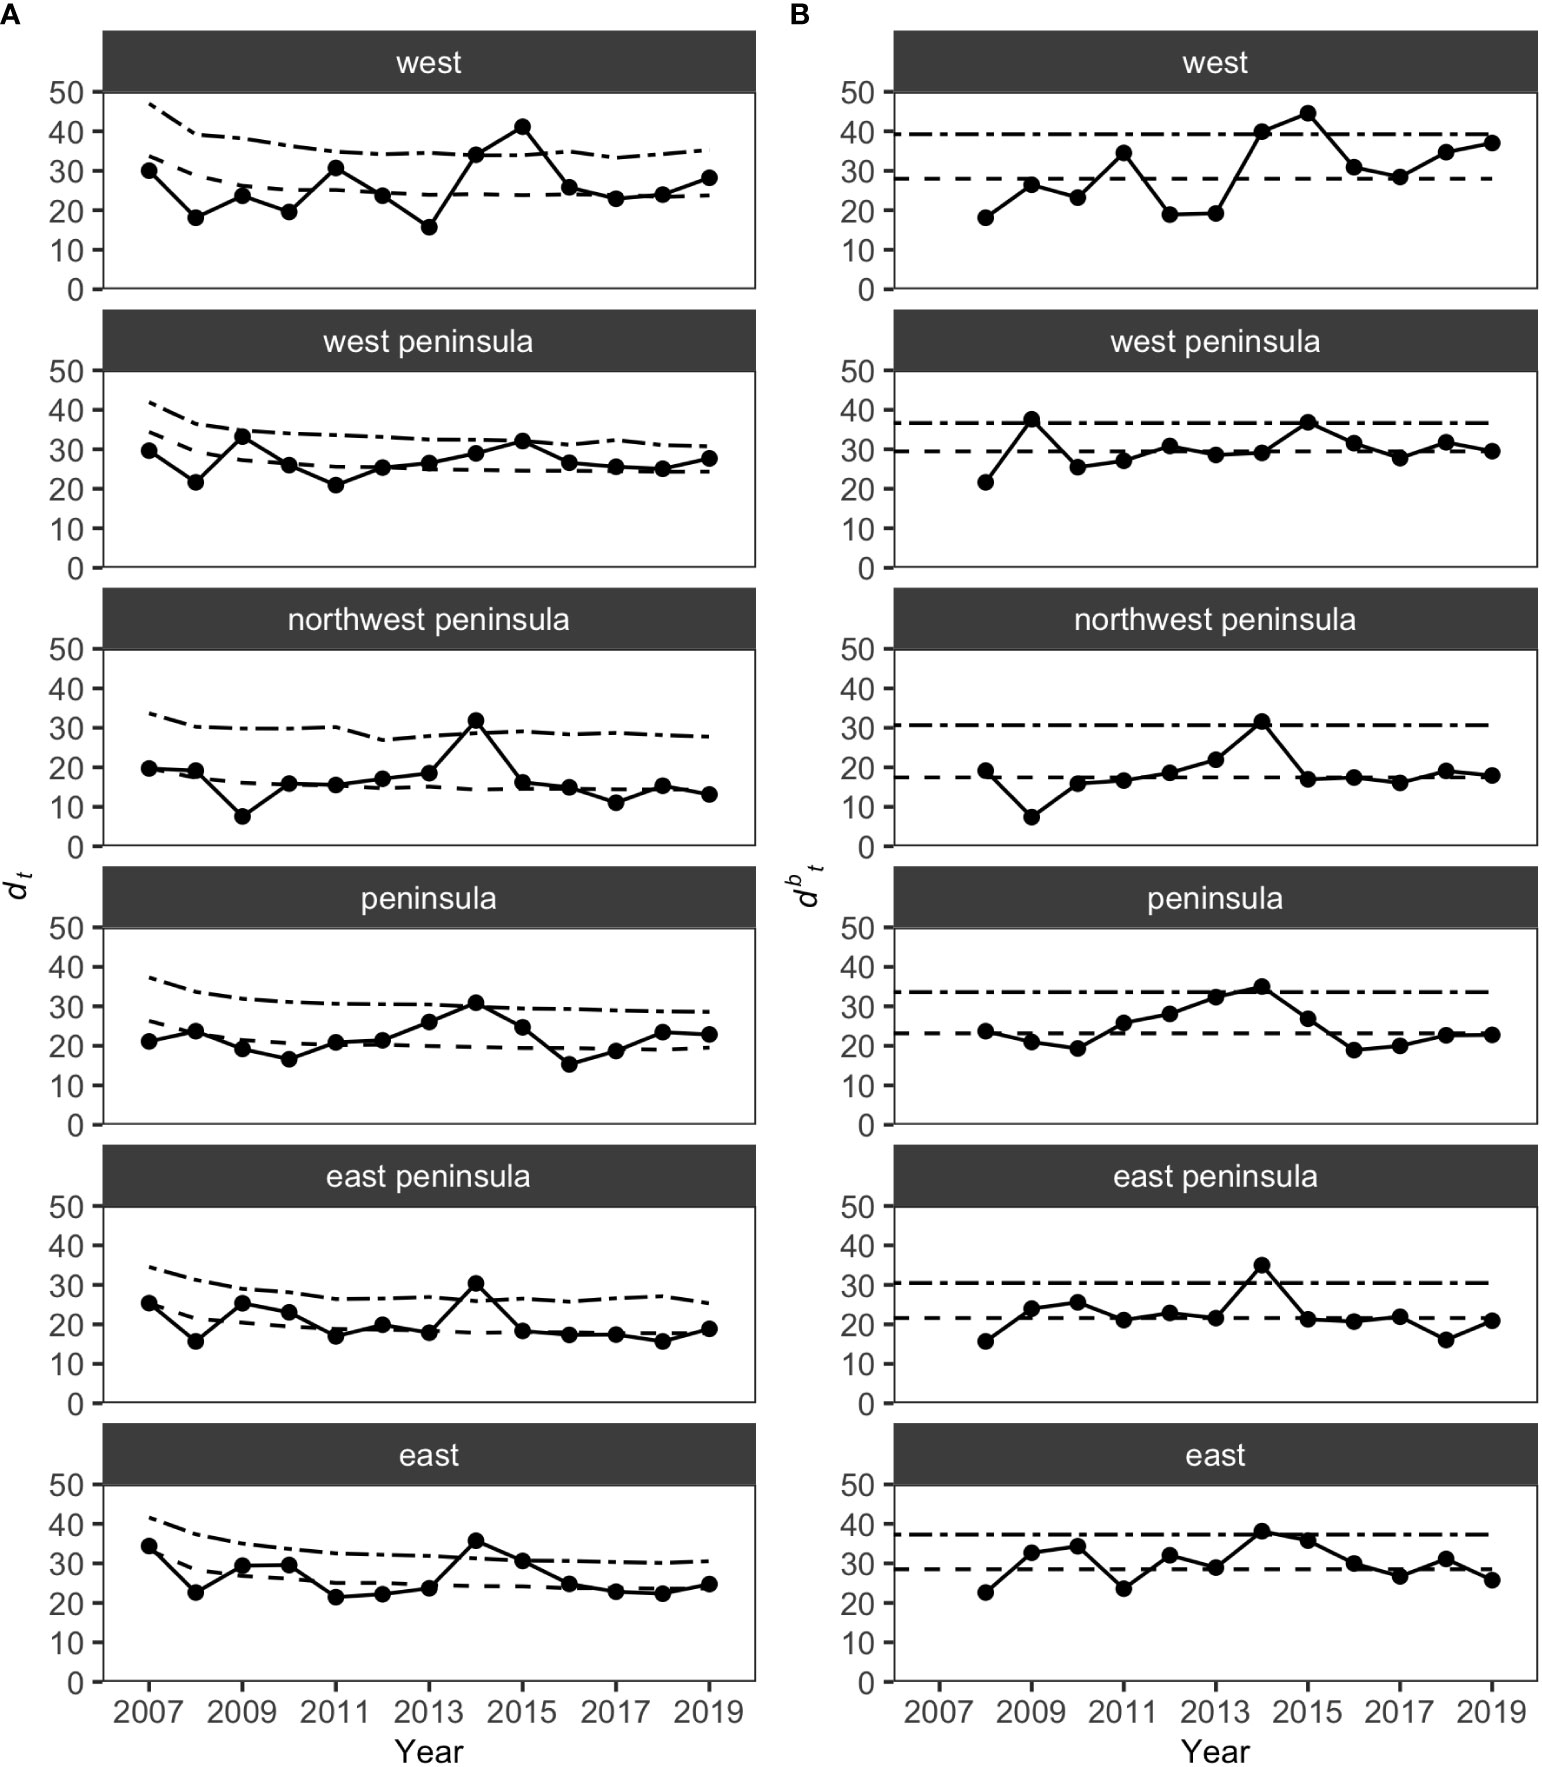
Figure 5 Results of MCCs for KALA fish assemblages showing (A) dt values and (B) dbt values. Dashed lines on each plot show 50 percentile confidence bounds as representations of the temporal trends, and dash-dotted lines show 95 percentile confidence bounds as upper confidence limits under which the status of the regions were considered stable or within natural variability.
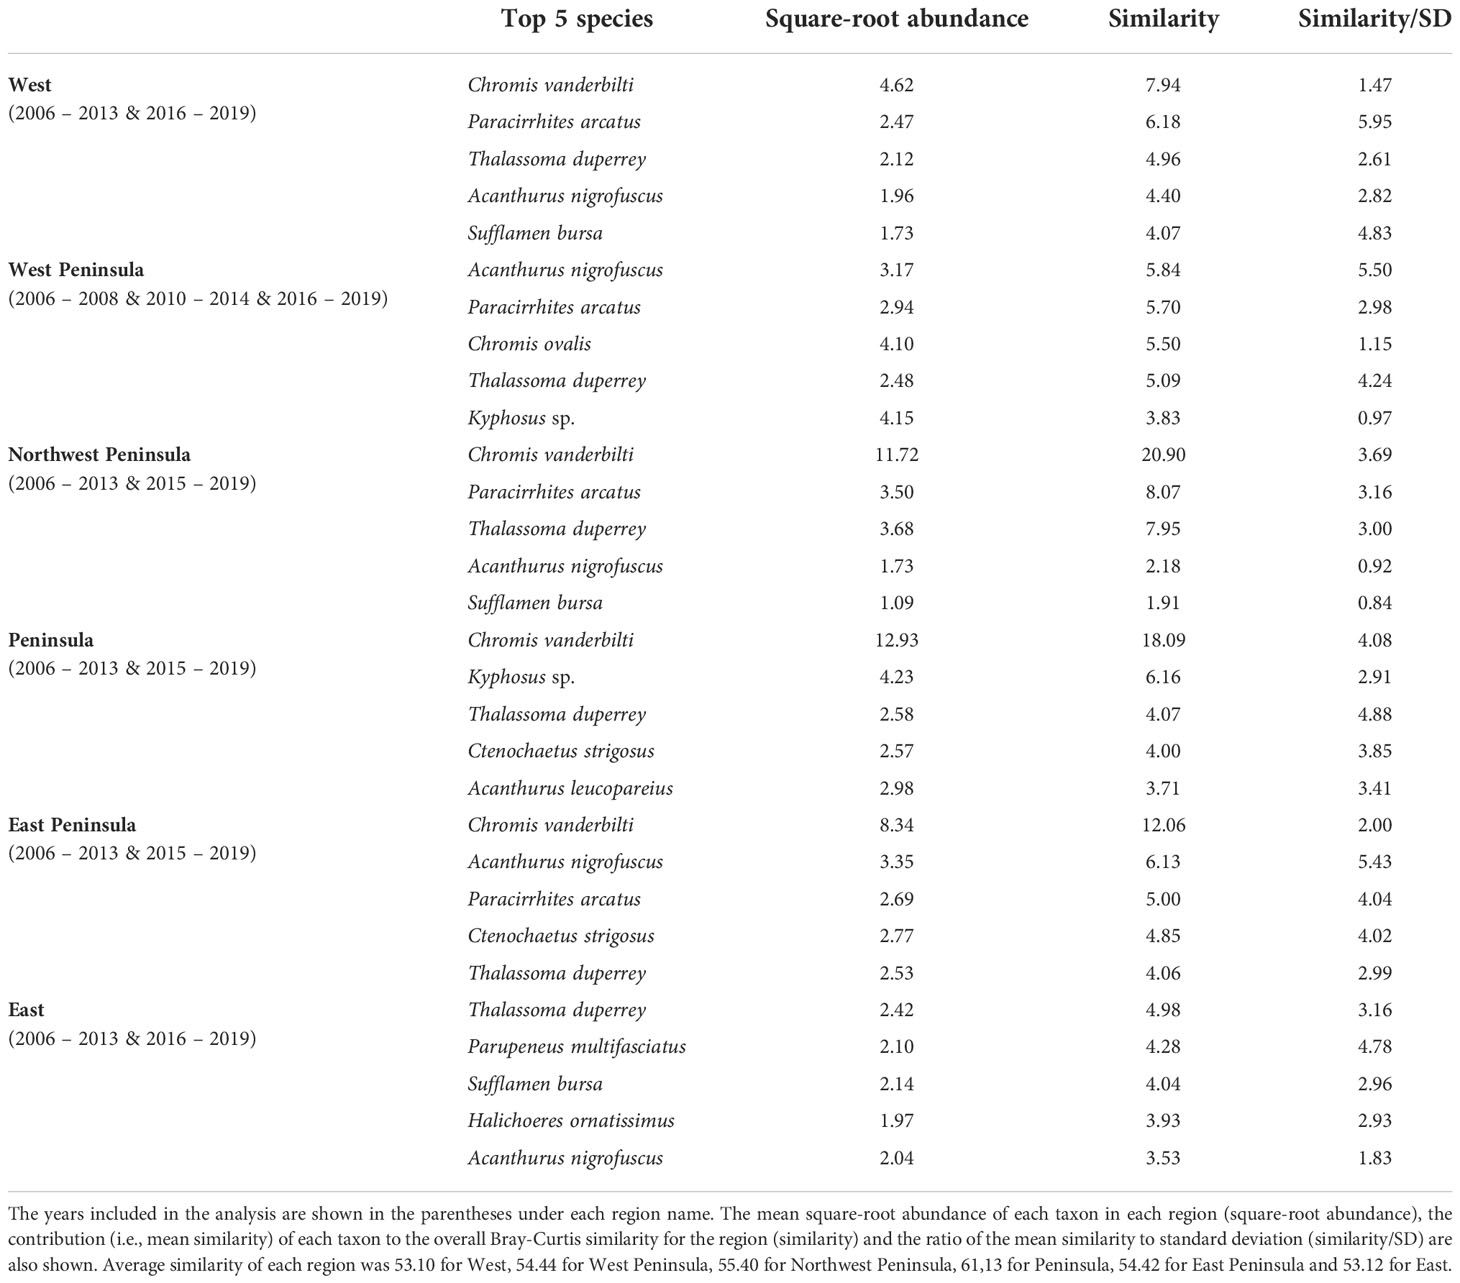
Table 4 Results of SIMPER analysis showing the top five species that were consistently present in high abundance in each region of KALA in “typical” years identified by MCCs.
Overall, the 2014 anomaly was characterized by increases in the abundance of Acanthurus (A. blochii, A. leucopareius, A. nigrofuscus, A. thompsoni and A. triostegus) and Ctenochaetus strigosus (Table 5). On the other hand, the 2015 anomaly in the West region was due to no observations of C. vanderbilti (the most numerically abundant fish species in the West region in non-anomalous years), decreases in the abundances of T. duperrey and Parupeneus multifasciatus and an increase in the abundance of C. verater (Table 6). The corallivore P. johnstonianus was also not detected in 2015, resulting in a decrease when being compared with the 2006 and 2007 baseline data (Table 6), but this species was never consistently abundant and was not detected in the region in 2011 and from 2014 to 2019.
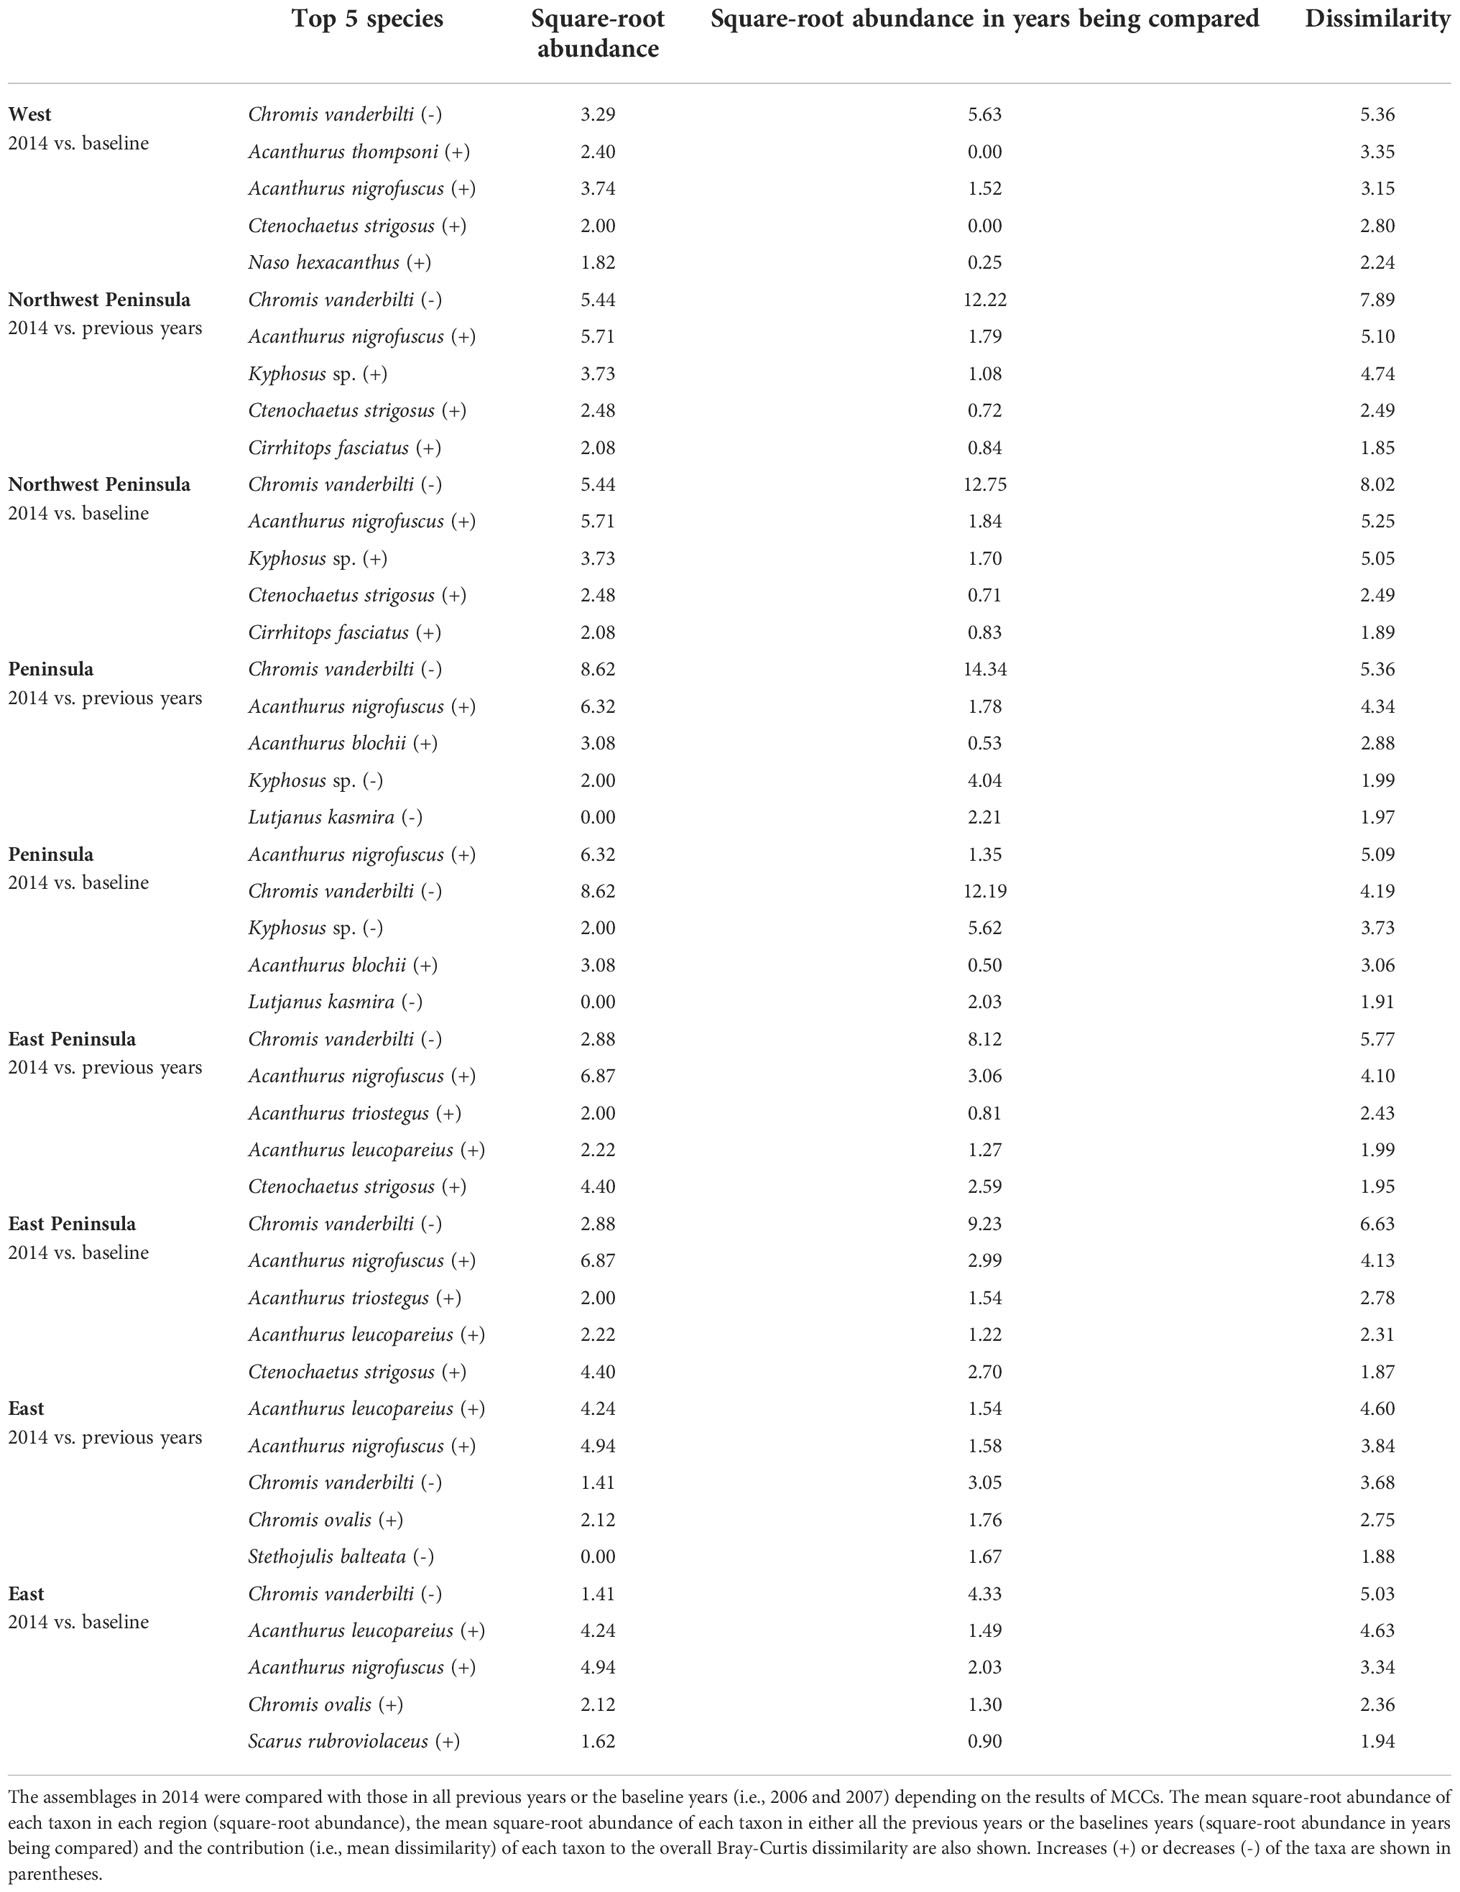
Table 5 Results of SIMPER analysis showing the top five species that contributed to separating fish assemblages of KALA in 2014 years as identified by MCCs.
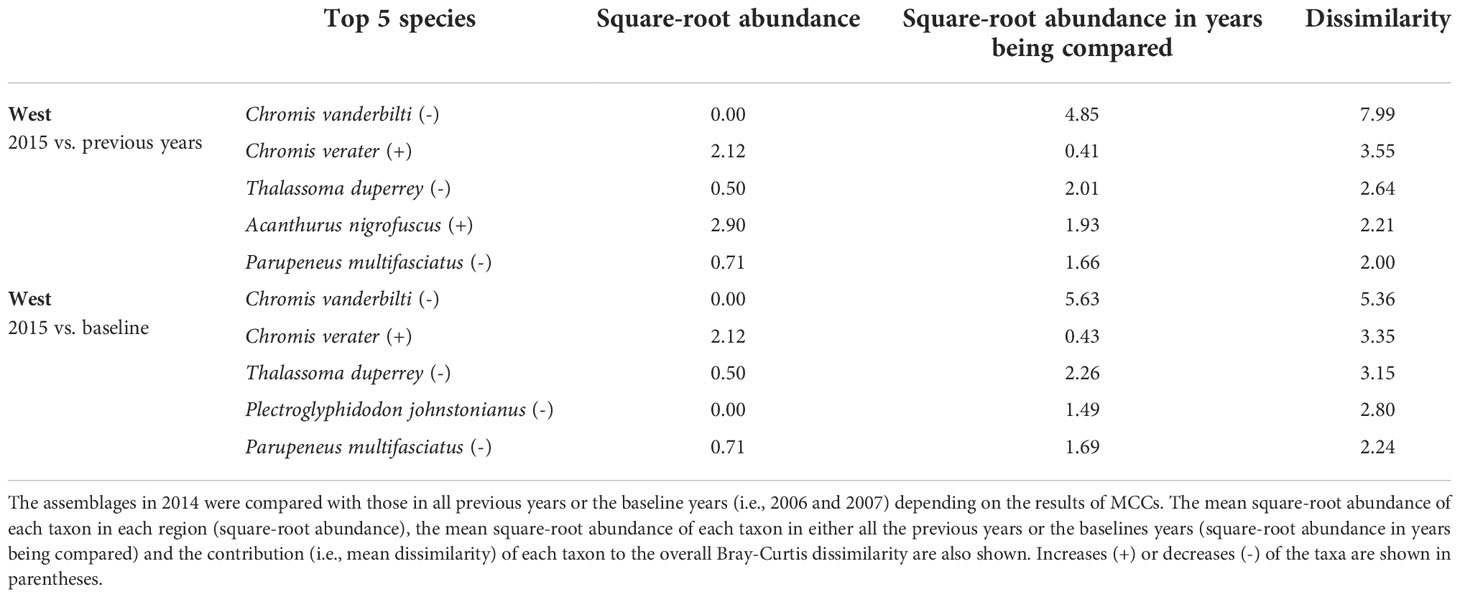
Table 6 Results of SIMPER analysis showing the top five species that contributed to separating fish assemblages of KALA in 2015 years as identified by MCCs.
Discussion
The coral reefs in the two parks in the present study experience different natural and anthropogenic disturbances. Although they are both in a degraded state in comparison to reefs in the uninhabited Northwestern Hawaiian Islands (Friedlander et al., 2018), KALA is relatively inaccessible due to its remoteness, and receives minimal fishing pressure whereas KAHO is highly accessible for recreational and commercial uses, is influenced by adjacent land use, groundwater and runoff (Brown et al., 2016; Gove et al., 2019) and impacted by the global-scale bleaching event in 2015. Here we employed MCCs and detected two types of anomalies in the fish assemblages at KAHO and KALA: 1) gradual shifts in the KAHO fish assemblages in recent years that were better captured by dbt values, and 2) changes in the KALA fish assemblages in 2014 and, to a lesser extent, 2015 that were captured by both dt and dbt values. MCCs are a relatively new approach to analyzing fish assemblages (Anderson and Thompson, 2004), and a modified version of this approach has been previously applied to fish assemblages in Hawai‘i (Fukunaga and Kosaki, 2017). This technique statistically tests for temporal changes within a site that are beyond natural variability. In both cases, the anomalies in the present study were characterized by changes (i.e., both increases and decreases) in relative abundances of numerically dominant fish species such as Chromis agilis, Chromis vanderbilti, Acanthurus nigrofuscus, Ctenochaetus strigosus and Zebrasoma flavescens.
In KALA, changes in species abundance that contributed to the 2014 anomaly were consistent across regions. The abundances of Acanthurus (A. blochii, A. leucopareius, A. nigrofuscus, A. thompsoni and A. triostegus) and C. strigosus all increased. There are some accounts that 2014 was an exceptionally good recruitment year for some fishes in the main Hawaiian Islands (e.g., C. strigosus and Z. flavescens in west Hawai‘i Island; Walsh et al., 2019). Post-hoc analyses comparing the size frequency of these fishes between years prior to 2014 and year 2014 clearly show large increases in the proportion of juvenile abundance in 2014 for both Acanthurus spp. (Figure S2A) and C. strigosus (Figure S2B). As no such anomaly was detected in KAHO in 2014, the recruitment event was potentially site specific. To our knowledge, this was the first study to document the recruitment event on another Hawaiian Island besides Hawai‘i (Walsh et al., 2019). The species identification of the recruits in the present study can facilitate the understanding of the spatial extent of the event through analysis of existing reef monitoring data throughout Hawai‘i. For the 2015 anomaly in the West region, the complete disappearance of C. vanderbilti is somewhat inexplicable, but their abundance returned to the typical level in subsequent years. A shift in the distribution of C. vanderbilti has been previously reported in response to a storm disturbance (Walsh, 1983), so their temporary disappearance in the West region might be a response to an unknown localized physical condition. C. vanderbilti also often occurs in aggregation (Randall, 2007), so it is possible that there happened to be no C. vanderbilti along the two transects in the region in that particular year. The absence of C. vanderbilti in the entire West region during the 2015 season, however, is further supported by the lack of this species on the three temporary transects that were in close proximity (0.5 – 1.0 km) to the fixed transects in that year (Brown et al., 2022).
In KAHO, there were no obvious patterns detected across the regions or habitat types that explained the changes in species abundance in anomalous years, but the changes were mostly consistent within each region across years. This observation confirms that the gradual shifts captured by dbt values in KAHO were likely trends occurring within individual regions rather than turnover of various species that happened to occur over consecutive years. Mechanisms of the shifts are unclear but may be partly related to the 2015 mass coral bleaching (e.g., Olsen et al., 2022). For example, the 2015 bleaching event resulted in complete loss of the branching coral Pocillopora meandrina along the 15 fixed transects (McCutcheon and McKenna, 2021), and P. meandrina was relatively abundant in the North (Site 01; Table 1) and South (Site 15; Table 1) regions. Therefore, the observed shifts in the fish assemblages in these two regions could be a delayed effect of the bleaching event as the branching structure of P. meandrina slowly eroded over time. In the North region, decreases in the abundance of Paracirrhites arcatus, which utilizes pocilloporids as their preferred habitat (Coker et al., 2015), contributed to the shift in the structure of fish assemblage in 2018 (Table 3). Further post-hoc investigations reveal that the abundance of P. arcatus at Site 01 was, on average, 6.5 individuals per transect before the bleaching event but reduced to 2-3 individuals after the bleaching then to no individuals in 2018 and 2019. Similarly, P. arcatus abundance at Site 15 decreased from 6.8 individuals on average before the bleaching event to 0-2 individuals after the bleaching event, even though this species was not among the top five species contributing to the observed shift in the South region.
Although decreases in fish abundance and diversity are often reported following coral bleaching events (Pratchett et al., 2011), there was no clear decrease in either the total fish counts or the number of fish taxa corresponding to the shifts in fish assemblages in KAHO (Figure 2). Corallivores are generally susceptible to coral loss and degradation of reef habitats due to their coral dependency (Pratchett et al., 2011; Magel et al., 2020). Unlike other trophic groups whose distributions are associated with habitat structure, abundances of corallivores are affected by both habitat structure and live coral cover (Fukunaga et al., 2020); thus more immediate responses could be expected from corallivores than other trophic groups that respond to structural changes of coral reefs. In the Harbor region of KAHO where the two corallivores Chaetodon multicinctus and Plectroglyphidodon johnstonianus were consistently present in high abundance in non-anomalous years, no large decreases in their abundances were observed after the bleaching in 2015 (Table 3). There was a decrease in the abundance of P. johnstonianus in Kaloko, the other region with high coral cover, but this occurred only in 2018 (Table 3). The lack of clear effects of bleaching on corallivores in the Kaloko and Harbor regions are likely due to the high abundance of Porites corals (Table 1), which were not affected by the 2015 bleaching event as severely as P. meandrina (McCutcheon and McKenna, 2021).
Despite the existing press disturbances from aquatic commercial and recreational activities and adjacent land use in KAHO, and documented negative impacts of such disturbances on fish assemblages in Hawai‘i (DeMartini et al., 2013; Foo et al., 2021) and elsewhere (Chabanet et al., 1995; Arias-Godínez et al., 2019), there were no clear declining trends in the fish assemblages associated with the anomalies. The direction of changes in species abundance was not consistent across regions in KAHO (e.g., C. vanderbilti decreasing in the North and Kaloko regions but increasing in the South region and C. strigosus increasing in the Kaloko and Harbor regions but decreasing in the Middle and South regions).This suggests that the shift in the fish assemblage in each region could be the result of local anthropogenic factors specific to the region, as well as potential interactions of multiple local factors having varying effects on different fish species. Such mixed responses of reef fishes to disturbance events have previously been shown through meta-analysis by Wilson et al. (2006). In that study, the negative impacts of coral losses were relatively consistent among corallivores and coral-dwelling fishes, but effects on other trophic groups varied depending on types of disturbances (loss of live coral tissue vs. habitat complexity), individual study locations, and fish species.
The long-term fish monitoring data from the two national parks in the present study showed the relatively stable state of the KALA fish assemblages and recent shifts in KAHO fish assemblages and offer important baseline information for future monitoring and management activities for each park. Using MCCs with a new dataset each year will allow managers to quickly identify temporal shifts in the fish assemblages that are beyond natural variability and to trigger more detailed investigations into potential causes, including the identities of fish species responsible for the shifts and potential environmental factors contributing to the shifts. Despite the relatively small spatial extent of 2.4 km2, KAHO experiences a variety of local anthropogenic pressures, and the levels may vary among the regions within the park. While isolating the effects of individual local factors or separating the effects of coral bleaching and local anthropogenic factors could be difficult due to their potential interactions, mapping the spatial extent of potential impacts of each local factor inside the marine area can help identify the primary concerns for each region, facilitating region-specific analyses between the fish assemblage and environmental variables. An additional component to reconstruct the reefs in three dimensions using photogrammetric techniques has recently been added to the monitoring program, and this allows for quantification of structural loss separate from live coral loss. As localized thermal stress events were detected in both KAHO and KALA in 2019 (McCutcheon and McKenna, 2021), continuous monitoring of these two parks is critical to assess how the coral reefs ecosystems under two different regimes respond to repeated thermal and other disturbance stress events.
Data availability statement
The datasets presented in this study can be found in online repositories. The names of the repository/repositories and accession number(s) can be found below: https://irma.nps.gov/Portal.
Ethics statement
The monitoring surveys were conducted under the permits, KAHO-2014-SCI-0006, KAHO-2016-SCI-0009, KAHO-2019-SCI-0002 and KALA-2013-SCI-0007, issued by the National Park Service.
Author contributions
AF and JB conceived the ideas behind the manuscript, and all authors made substantial intellectual contributions to develop the manuscript. SM, EB and AM collected the data. AF analysed the data and led the writing of the manuscript. All authors contributed to the article and approved the submitted version.
Funding
This project was funded by the National Park Service under Hawaii-Pacific Islands Cooperative Ecosystems Study Unit (CESU) Cooperative Agreement P20AC01074, and this study was supported by CESU agreement between PACN I&M and UH Hilo MEGA lab.
Acknowledgments
We thank Sallie Beavers, Kelly Kozar, Ryan Monello and the rest of the staff, past and present, at PACN, KAHO and KALA for their support and assistance with data collection, field logistics, and data management. We also thank Lindsey Kramer for reviewing earlier versions of the manuscript, Mark Wasser for generating the maps of the study sites and the editor and reviewers for their input that improved the manuscript.
Conflict of interest
The authors declare that the research was conducted in the absence of any commercial or financial relationships that could be construed as a potential conflict of interest.
Publisher’s note
All claims expressed in this article are solely those of the authors and do not necessarily represent those of their affiliated organizations, or those of the publisher, the editors and the reviewers. Any product that may be evaluated in this article, or claim that may be made by its manufacturer, is not guaranteed or endorsed by the publisher.
Supplementary material
The Supplementary Material for this article can be found online at: https://www.frontiersin.org/articles/10.3389/fmars.2022.1038365/full#supplementary-material
References
Anderson M. J., Thompson A. A. (2004). Multivariate control charts for ecological and environmental monitoring. Ecol. Appl. 14, 1921–1935. doi: 10.1890/03-5379
Arias-Godínez G., Jiménez C., Gamboa C., Cortés J., Espinoza M., Alvarado J. J. (2019). Spatial and temporal changes in reef fish assemblages on disturbed coral reefs, north pacific coast of Costa Rica. Mar. Ecol. 40, e12532. doi: 10.1111/maec.12532
Bellwood D. R., Hughes T. P., Folke C., Nyström M. (2004). Confronting the coral reef crisis. Nature 429, 827–833. doi: 10.1038/nature02691
Brown E., Annandale S., Kageyama K., Lee S. J., Tice K. (2022). Kalaupapa national historical park marine fish trend report for 2006–2015: Pacific island network (Fort Collins, Colorado: National Park Service). doi: 10.36967/nrr-2289961
Brown E., Beets J., Brown P., Craig P., Friedlander A., Jones T., et al. (2011a). Marine fish monitoring protocol: Pacific islands network (Fort Collins, Colorado: National Park Service).
Brown B. E., Le Tissier M. D. A., Scoffin T. P., Tudhope A. W. (1990). Evaluation of the environmental impact of dredging on intertidal coral reefs at ko phuket, Thailand, using ecological and physiological parameters. Mar. Ecol. Prog. Ser. 65, 273–281.
Brown E. K., McKenna S. A., Beavers S. C., Clark T., Gawel M., Raikow D. F. (2016). Informing coral reef management decisions at four U.S. national parks in the pacific using long-term monitoring data. Ecosphere 7, e01463. doi: 10.1002/ecs2.1463
Brown E., Minton D., Daniel R., Klasner F., Basch L., Snyder A., et al. (2011b). Pacific islands network benthic marine community monitoring protocol (Fort Collins, Colorado: National Park Service).
Chabanet P., Dufour V., Galzin R. (1995). Disturbance impact on reef fish communities in reunion island (Indian ocean). J. Exp. Mar. Biol. Ecol. 188, 29–48. doi: 10.1016/0022-0981(94)00184-F
Clarke K. R. (1993). Non-parametric multivariate analyses of changes in community structure. Aust. J. Ecol. 18, 117–143. doi: 10.1111/j.1442-9993.1993.tb00438.x
Clarke K. R., Warwick R. M. (2001). Change in marine communities: an approach to statistical analysis and interpretation (Plymouth, UK: PRIMER-E).
Coker D. J., Hoey A. S., Wilson S. K., Depczynski M., Graham N. A. J., Hobbs J.-P. A., et al. (2015). Habitat selectivity and reliance on live corals for indo-pacific hawkfishes (family: Cirrhitidae). PLoS One 10, e0138136. doi: 10.1371/journal.pone.0138136
Couch C. S., Burns J. H. R., Liu G., Steward K., Gutlay T. N., Kenyon J., et al. (2017). Mass coral bleaching due to unprecedented marine heatwave in papahānaumokuākea marine national monument (Northwestern Hawaiian islands). PLoS One 12, e0185121. doi: 10.1371/journal.pone.0185121
DeMartini E., Jokiel P., Beets J., Stender Y., Storlazzi C., Minton D., et al. (2013). Terrigenous sediment impact on coral recruitment and growth affects the use of coral habitat by recruit parrotfishes (F. scaridae). J. Coast. Conserv. 17, 417–429. doi: 10.1007/s11852-013-0247-2
Done T. J. (1992). Phase shifts in coral reef communities and their ecological significance. Hydrobiologia 247, 121–132. doi: 10.1007/BF00008211
Eakin C. M., Sweatman H. P. A., Brainard R. E. (2019). The 2014–2017 global-scale coral bleaching event: insights and impacts. Coral Reefs 38, 539–545. doi: 10.1007/s00338-019-01844-2
Foo S. A., Walsh W. J., Lecky J., Marcoux S., Asner G. P. (2021). Impacts of pollution, fishing pressure, and reef rugosity on resource fish biomass in West Hawaii. Ecol. Appl. 31. e0221310.1002/eap.2213
Friedlander A. M., Brown E. K., Jokiel P. L., Smith W. R., Rodgers K. S. (2003). Effects of habitat, wave exposure, and marine protected area status on coral reef fish assemblages in the Hawaiian archipelago. Coral Reefs 22, 291–305. doi: 10.1007/s00338-003-0317-2
Friedlander A. M., Donovan M. K., Koike H., Murakawa P., Goodell W. (2019). Characteristics of effective marine protected areas in hawaiʻi. Aquat. Conservation: Mar. Freshw. Ecosyst. 29, 103–117. doi: 10.1002/aqc.3043
Friedlander A. M., Donovan M. K., Stamoulis K. A., Williams I. D., Brown E. K., Conklin E. J., et al. (2018). Human-induced gradients of reef fish declines in the Hawaiian archipelago viewed through the lens of traditional management boundaries. Aquat. Conservation: Mar. Freshw. Ecosyst. 28, 146–157. doi: 10.1002/aqc.2832
Fukunaga A., Kosaki R. K. (2017). Use of multivariate control charts to assess the status of reef fish assemblages in the northwestern Hawaiian islands. PeerJ 5, e3651. doi: 10.7717/peerj.3651
Fukunaga A., Kosaki R. K., Pascoe K. H., Burns J. H. R. (2020). Fish assemblage structure in the northwestern Hawaiian islands is associated with the architectural complexity of coral-reef habitats. Diversity 12, 430. doi: 10.3390/d12110430
Gove J. M., Lecky J., Walsh W. J., Ingram R. J., Leong K., Williams I., et al. (2019). West Hawai’i integrated ecosystem assessment ecosystem status report (Honolulu, Hawaii: Pacific Island Fisheries Science Center).
Graham N. A. J., Nash K. L. (2013). The importance of structural complexity in coral reef ecosystems. Coral Reefs 32, 315–326. doi: 10.1007/s00338-012-0984-y
Grigg R. W. (1983). Community structure, succession and development of coral reefs in Hawaii. Mar. Ecol. Prog. Ser. 11, 1–14. doi: 10.3354/meps011001
Grigg R. W., Polovina J., Friedlander A. M., Rohmann S. O. (2008). “. biology of coral reefs in the northwestern Hawaiian islands,” in Coral reefs of the USA. Eds. Riegl B. M., Dodge R. E. (Dordrecht, Netherlands: Springer), 573–594.
Hoegh-Guldberg O., Mumby P. J., Hooten A. J., Steneck R. S., Greenfield P., Gomez E., et al. (2007). Coral reefs under rapid climate change and ocean acidification. Science 318, 1737–1742. doi: 10.1126/science.1152509
Hughes T. P., Kerry J. T., Baird A. H., Connolly S. R., Dietzel A., Eakin C. M., et al. (2018). Global warming transforms coral reef assemblages. Nature 556, 492–496. doi: 10.1038/s41586-018-0041-2
Hunter C. L., Stephenson M. D., Tjeerdema R. S., Crosby D. G., Ichikawa G. S., Goetzl J. D., et al. (1995). Contaminants in oysters in kaneohe bay, Hawaii. Mar. pollut. Bull. 30, 646–654. doi: 10.1016/0025-326X(95)00039-P
Kayal M., Vercelloni J., Lison de Loma T., Bosserelle P., Chancerelle Y., Geoffroy S., et al. (2012). Predator crown-of-thorns starfish (Acanthaster planci) outbreak, mass mortality of corals, and cascading effects on reef fish and benthic communities. PLoS One 7, e47363. doi: 10.1371/journal.pone.0047363
Komyakova V., Munday P. L., Jones G. P. (2013). Relative importance of coral cover, habitat complexity and diversity in determining the structure of reef fish communities. PLoS One 8, e83178. doi: 10.1371/journal.pone.0083178
Loya Y., Sakai K., Yamazato K., Nakano Y., Sambali H., van Woesik R. (2001). Coral bleaching: the winners and the losers. Ecol. Lett. 4, 122–131. doi: 10.1046/j.1461-0248.2001.00203.x
Magel J. M. T., Dimoff S. A., Baum J. K. (2020). Direct and indirect effects of climate change-amplified pulse heat stress events on coral reef fish communities. Ecol. Appl. 30, e02124. doi: 10.1002/eap.2124
McCutcheon A. L., McKenna S. A. (2021). Coral bleaching, mortality and benthic community assemblages on the reefs within the pacific island network national parks (Fort Collins, Colorado: National Park Service).
Oksanen J., Simpson G. L., Blanchet F. G., Kindt R., Legendre P., Minchin P. R., et al. (2022) Vegan: Community ecology package. Available at: https://CRAN.R-project.org/package=vegan.
Olsen A. Y., Larson S., Padilla-Gamiño J. L., Klinger T. (2022). Changes in fish assemblages after marine heatwave events in West hawai’i island. Mar. Ecol. Prog. Ser. 698, 95–109. doi: 10.3354/meps.14156
Pascoe K. H., Fukunaga A., Kosaki R. K., Burns J. H. R. (2021). 3D assessment of a coral reef at Lalo atoll reveals varying responses of habitat metrics following a catastrophic hurricane. Sci. Rep. 11, 12050. doi: 10.1038/s41598-021-91509-4
Pratchett M. S., Hoey A. S., Wilson S. K., Messmer V., Graham N. A. J. (2011). Changes in biodiversity and functioning of reef fish assemblages following coral bleaching and coral loss. Diversity 3, 424–452. doi: 10.3390/d3030424
Randall J. E. (2007). Reef and shore fishes of the Hawaiian islands (Honolulu, USA: Sea Grant College Program, University of Hawaii).
R Core Team (2020). "R: A Language and Environment for Statistical Computing". v 4.0.3. (Vienna, Austria: R Foundation for Statistical Computing).
Walsh W. J. (1983). Stability of a coral reef fish community following a catastrophic storm. Coral Reefs 2, 49–63. doi: 10.1007/BF00304732
Walsh W. J., Cotton S., Jackson L., Kramer L., Lamson M., Marcoux S., et al. (2019). “Findings and recommendations of effectiveness of the West hawai’i regional fishery management area (WHRFMA),” in Report to the thirtieth legislature 2020 regular session (Honolulu, Hawaii: Division of Aquatic Resources, State of Hawai’i).
Williams I. D., White D. J., Sparks R. T., Lino K. C., Zamzow J. P., Kelly E. L. A., et al. (2016). Responses of herbivorous fishes and benthos to 6 years of protection at the kahekili herbivore fisheries management area, Maui. PLoS One 11, e0159100. doi: 10.1371/journal.pone.0159100
Wilson S. K., Graham N. A. J., Pratchett M. S., Jones G. P., Polunin N. V. (2006). Multiple disturbances and the global degradation of coral reefs: are reef fishes at risk or resilient? Global Change Biol. 12, 2220–2234. doi: 10.1111/j.1365-2486.2006.01252.x
Keywords: coral reef, fish, multivariate control chart, Kaloko-Honokōhau National Historical Park, Kalaupapa National Historical Park, long-term ecological monitoring, coral bleaching
Citation: Fukunaga A, McKenna SA, Brown EK, McCutcheon AL and Burns JHR (2022) Temporal patterns in coral reef fish assemblages with varying disturbance levels: A tale of two National Parks in Hawai´i. Front. Mar. Sci. 9:1038365. doi: 10.3389/fmars.2022.1038365
Received: 06 September 2022; Accepted: 15 November 2022;
Published: 01 December 2022.
Edited by:
Thierry Work, United States Department of the Interior, United StatesReviewed by:
Edson A. Vieira, Federal University of Rio Grande do Norte, BrazilRodrigo Riera, University of Las Palmas de Gran Canaria, Spain
Copyright © 2022 Fukunaga, McKenna, Brown, McCutcheon and Burns. This is an open-access article distributed under the terms of the Creative Commons Attribution License (CC BY). The use, distribution or reproduction in other forums is permitted, provided the original author(s) and the copyright owner(s) are credited and that the original publication in this journal is cited, in accordance with accepted academic practice. No use, distribution or reproduction is permitted which does not comply with these terms.
*Correspondence: Atsuko Fukunaga, atsuko.fukunaga@hawaii.edu