Tropical cyclone Wind Pump induced chlorophyll-a enhancement in the South China Sea: A comparison of the open sea and continental shelf
 Ying Li1,2
  Danling Tang1,2*
- 1State Key Laboratory of Tropical Oceanography, South China Sea Institute of Oceanology, Chinese Academy of Sciences; Southern Marine Science and Engineering Guangdong Laboratory (Guangzhou), Guangzhou, China
- 2University of Chinese Academy of Sciences, Beijing, China
The continental shelf and open sea region have different ocean physical and environmental responses to tropical cyclones (TC). The present study firstly compared the grid-based maximum response (GMR) of sea surface chlorophyll a (Chl-a) to TCs Wind Pump between the continental shelf (depths 50-200m) and open sea (depths>200 m) region in the South China Sea (SCS) during 1998-2020, using multiple-satellite data. For all TC events, the average Chl-a increases by 0.13 mg/m3. The comparisons between the pre- and post-TC periods show that Chl-a increases by 0.18 mg/m3 (115%) in the continental shelf and 0.07 mg/m3 (57%) in the open sea region, respectively. In both areas, TC-induced Chl-a enhancement (Chl_en) strongly depends on TC maximum wind speed and translation speed. The strong and fast-moving TCs and weak and slow-moving TCs both induce the maximum Chl_en in the continental shelf region. While in the open sea, the maximum Chl_en was induced by the strong and slow-moving TCs. Overall, our results reveal that the TC wind pump’s effects on Chl-a enhancement are stronger in the continental shelf region than in the open sea.
1 Introduction
The South China Sea (SCS; defined here as a region covering 3°-22°N and 105°–120°E, Figure 1A) is a semi-enclosed ocean basin connected to the Northwest Pacific Ocean by the Luzon Strait (Hu et al., 2000). Tropical cyclones (TCs), one of the most powerful meteorological activities on earth, have dramatic effects on the upper ocean environment (Peduzzi et al., 2012; Menkes et al., 2016; Sui et al., 2022). TCs are frequent, with roughly 8 TCs coming through the South China Sea each year (Pan et al., 2018). And the continental shelf and the open sea region, usually divided by the 200m isobaths, have different physical and biological conditions. Understanding the effect of water depth on chlorophyll a (Chl-a) enhancement induced by TC is an essential issue in assessing the general mechanism of the upper ocean response to a TC (Foltz et al., 2015).
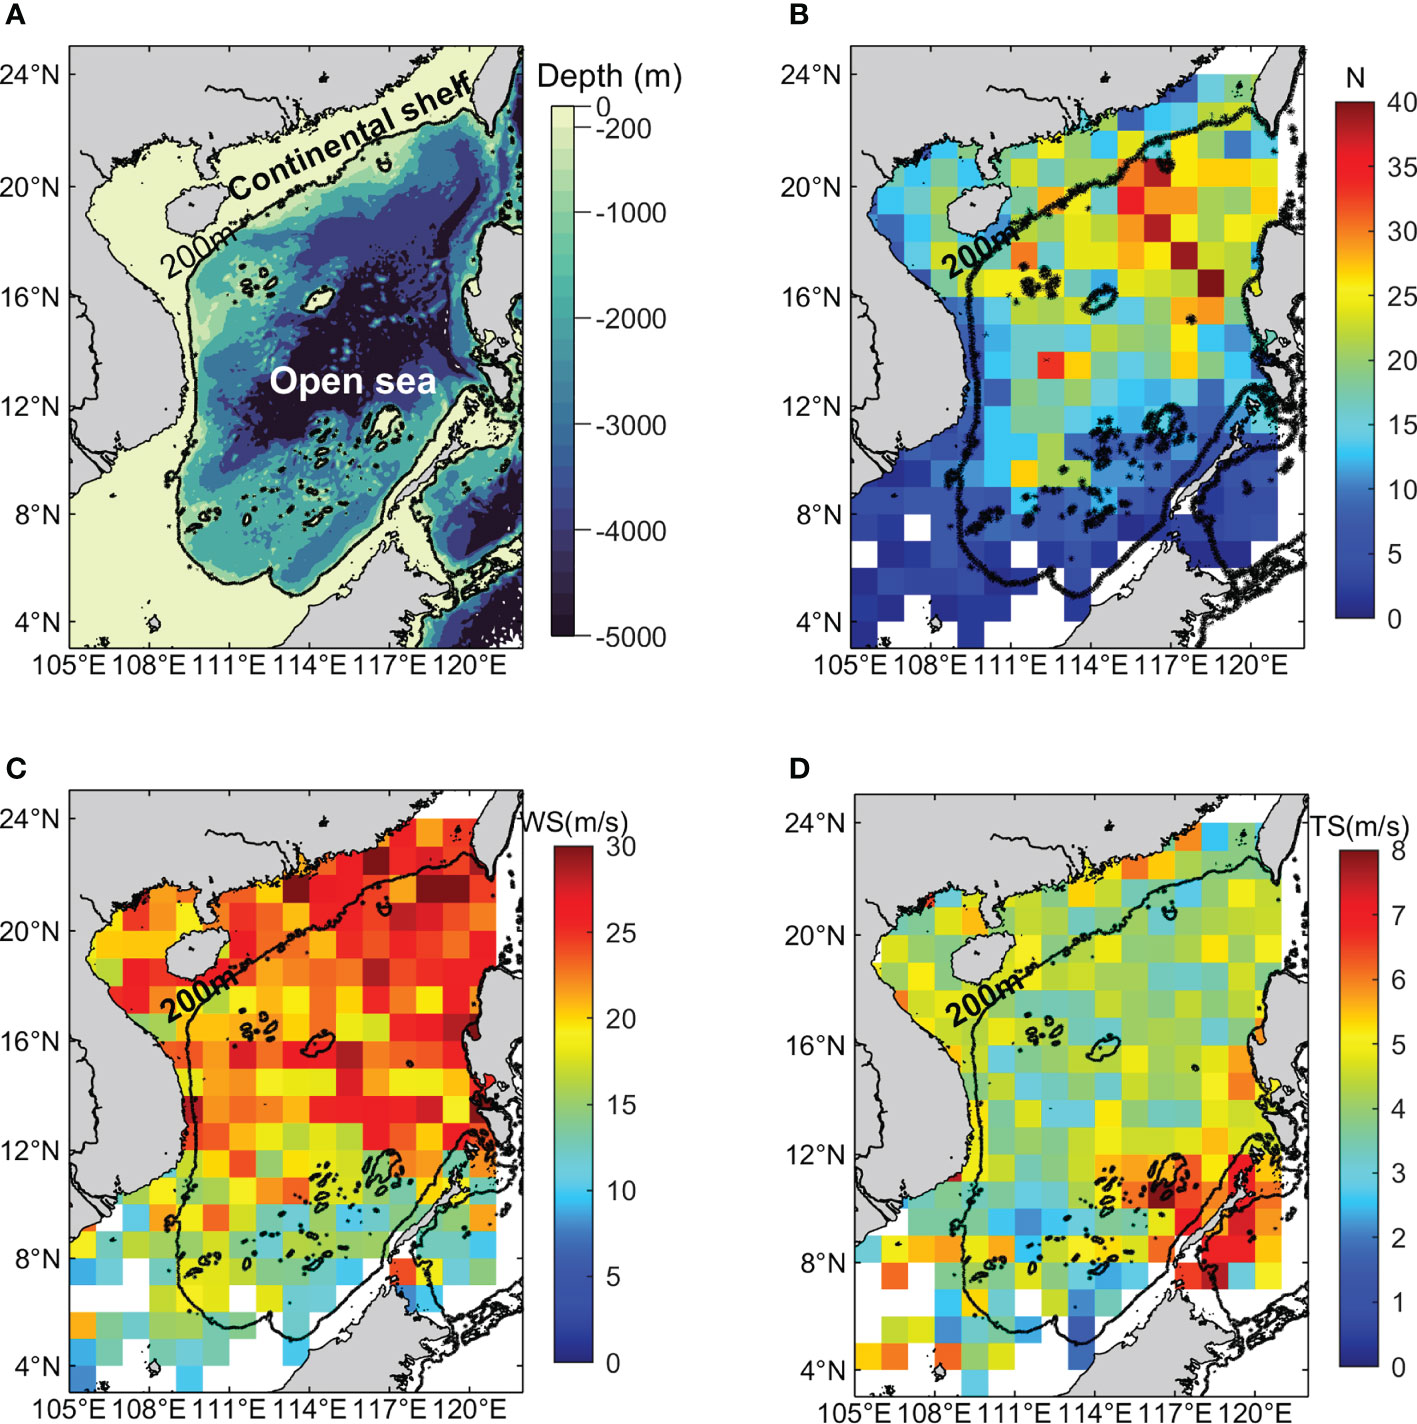
Figure 1 (A) Topography of the South China Sea basin (extrapolated from ETOPO1 gridded bathymetry data). The black contour represents the 200-m isobath; (B-D) Geographic distribution of the number of TC track points, mean TC wind speed and mean TC translation speed in the SCS between 1998 and 2020. The TC number is defined as the number of all identified TC track points in each 1°×1° pixel.
In the past decades, numerous studies have been devoted to quantifying and understanding the phytoplankton bloom generated by individual TCs in the continental shelf (Li et al., 2009; Zhou et al., 2011; Zhang et al., 2014, 2019; Yang et al., 2015; Qiu et al., 2019) and open sea (Shang et al., 2008; Ye et al., 2013; Liu et al., 2019c; Liu et al., 2020)region in the SCS. And multi-parameter approaches like satellite observations (Lin et al., 2003), in-situ observations (Maneesha et al., 2011), Bio-Argo (Chacko, 2017; Roy Chowdhury et al., 2022) and model simulations (Subrahmanyam et al., 2002; Sui et al., 2022) were used to study the TC-induced Chl-a enhancement.
Previous studies showed that the water depth has a non-negligible effect on the variations of dynamic responses in the water column during TC events (Cubukcu et al., 2000; Chen et al., 2003). They reported that the water depth acts to cool the sea surface by intensifying the deep-water currents, turbulent mixing and upwelling near the coast. For a storm approaching cross-shelf, the response is primarily baroclinic and only weakly dependent on the water depth using model simulation (Cooper and Thompson, 1989b, 1989a; Tuleya, 1994). By comparing the ocean responses to TCs over different water depths, researchers found that TC effects differed significantly, and in the shallower area, the depth-integrated primary productivity increased mostly (Chen et al., 2017). We need a feasible comprehensive investigation to understand the mechanisms of water depth’s act on the TC-induced Chl-a enhancement.
TC characteristics, normally including intensity measured by the maximum surface wind speed and translation speed, can strongly affect the Chl-a concentration after TCs (Sun et al., 2010; Zhao et al., 2017; Chacko, 2019). By comparing the phytoplankton blooms triggered by two typhoons with different intensities and translation speeds in the SCS, scientists found that slow-moving TC had a longer-lasting mixing/upwelling effect on the region around its wake, inducing a stronger phytoplankton bloom, while strong typhoon can induce a bloom over a larger area (Zhao et al., 2008). TC severity varies widely, from a tropical depression to Category 5, significantly impacting the regional marine ecosystem (Zhao and Wang, 2018). However, the TC characteristics and water depth’s combined effects on TC-induced Chl-a enchantment in the SCS remains unknown.
There are two questions to be answered. 1) What is the different mechanism between the continental shelf and open sea’s act on the enhancement of Chl-a after TC? 2) what are the ocean responses to TCs with different wind speed and translation speed considering the water depth in the SCS? The present research aims to reveal the role of the water depth and its potential mechanisms on the timing and magnitude of TC-induced Chl-a enhancement. Here, using a grid-based maximum response method (Li et al., 2020), we analyzed the climatological relationship between Chl-a concentration and water depth of TCs’ paths based on 23-year (1998–2020) satellite-derived data to detect the effect of water depth on the characteristics of Chl-a enhancement. We also examined the relationship among water depth, nutricline, Chl-a, and TCs’ factors, based on the related hypotheses to explain the mechanism of TC-induced phytoplankton bloom.
2 Materials and methods
2.1 Satellite data
To improve the spatial coverage of Chl-a data, considering the influence of thick clouds and heavy rainfall on remote sensing during TC passages, the merged daily Chl-a products with 4 km × 4 km resolution during 1998-2020 were used in this study. This dataset was provided by the GlobColour project (https://hermes.acri.fr/), and it combines multiple satellite products including those from the Sea-Viewing Wide Field-of-View Sensor (SeaWiFS), Medium Resolution Imaging Spectrometer (MERIS), Moderate Resolution Imaging Spectroradiometer (MODIS), and Visible Infrared Imaging Radiometer Suite (VIIRS), which is merged into the products using the Garver-Siegel-Maritorena (GSM) model (Maritorena and Siegel, 2005; Maritorena et al., 2010). The merged product nearly doubles the data coverage of any single mission.
The TC track data were acquired from the Joint Typhoon Warning Center (JTWC, http://www.metoc.navy.mil/jtwc/). This best track data provides the 1-minute maximum sustained 10 m wind speed and the location (longitude/latitude) of the TC center at a 6-h interval.
The wind stress vector with a 0.25° × 0.25° resolution were calculated based on daily data from the Copernicus Programme (https://marine.copernicus.eu/). The Ekman pumping velocity (EPV, positive means upwards) was calculated from the surface wind stress vector (τ) as , where f is the Coriolis force parameter, and ρω is the sea water density set to 1025 kg/m3.
Monthly climatological nitrate profiles were from the World Ocean Atlas 2018 (WOA18, https://www.ncei.noaa.gov/access/world-ocean-atlas-2018/). This dataset has a spatial resolution of 1°×1°, and 54 vertical layers at standard depth levels were included. The nutricline was defined as the depth at which the concentration first reached 1 μmol/kg from the surface downward (Liao et al., 2021).
The bathymetry data was derived from the ETOPO1 (https://ngdc.noaa.gov/mgg/global/global.html), a global relief model of earth’s surface that integrates land topography and ocean bathymetry. This dataset has a spatial resolution of 1 arc-minute, developed by the National Geophysical Data Center (NGDC).
2.2 Methods
2.2.1 Delineation of TC-influenced areas
We revised Bresenham’s Line algorithm to obtain the TC-influenced area (Bresenham, 1965). Firstly, each TC track point is plotted as a grid on a 0.04° × 0.04° (i.e., the spatial resolution of Chl-a data) gridded map (Figures 2A, B). Secondly, the approximation line of the original TC track is drawn using Bresenham’s line algorithm (Figure 2C). Then, by parallel shifting this approximate trajectory (Figure 2E), a TC-influenced area of any width can be obtained (Figure 2D). Since the upper ocean response to TCs is asymmetric at most times, stronger currents (Price, 1981), sea surface cooling (Liu et al., 2019a; Liu et al., 2019b), and phytoplankton bloom (Pan et al., 2017) were found in the right side of TC track in previous studies; the TC-influenced area was built that extended 1° leftward and 2° rightward from the each TC track (Figure 2F).
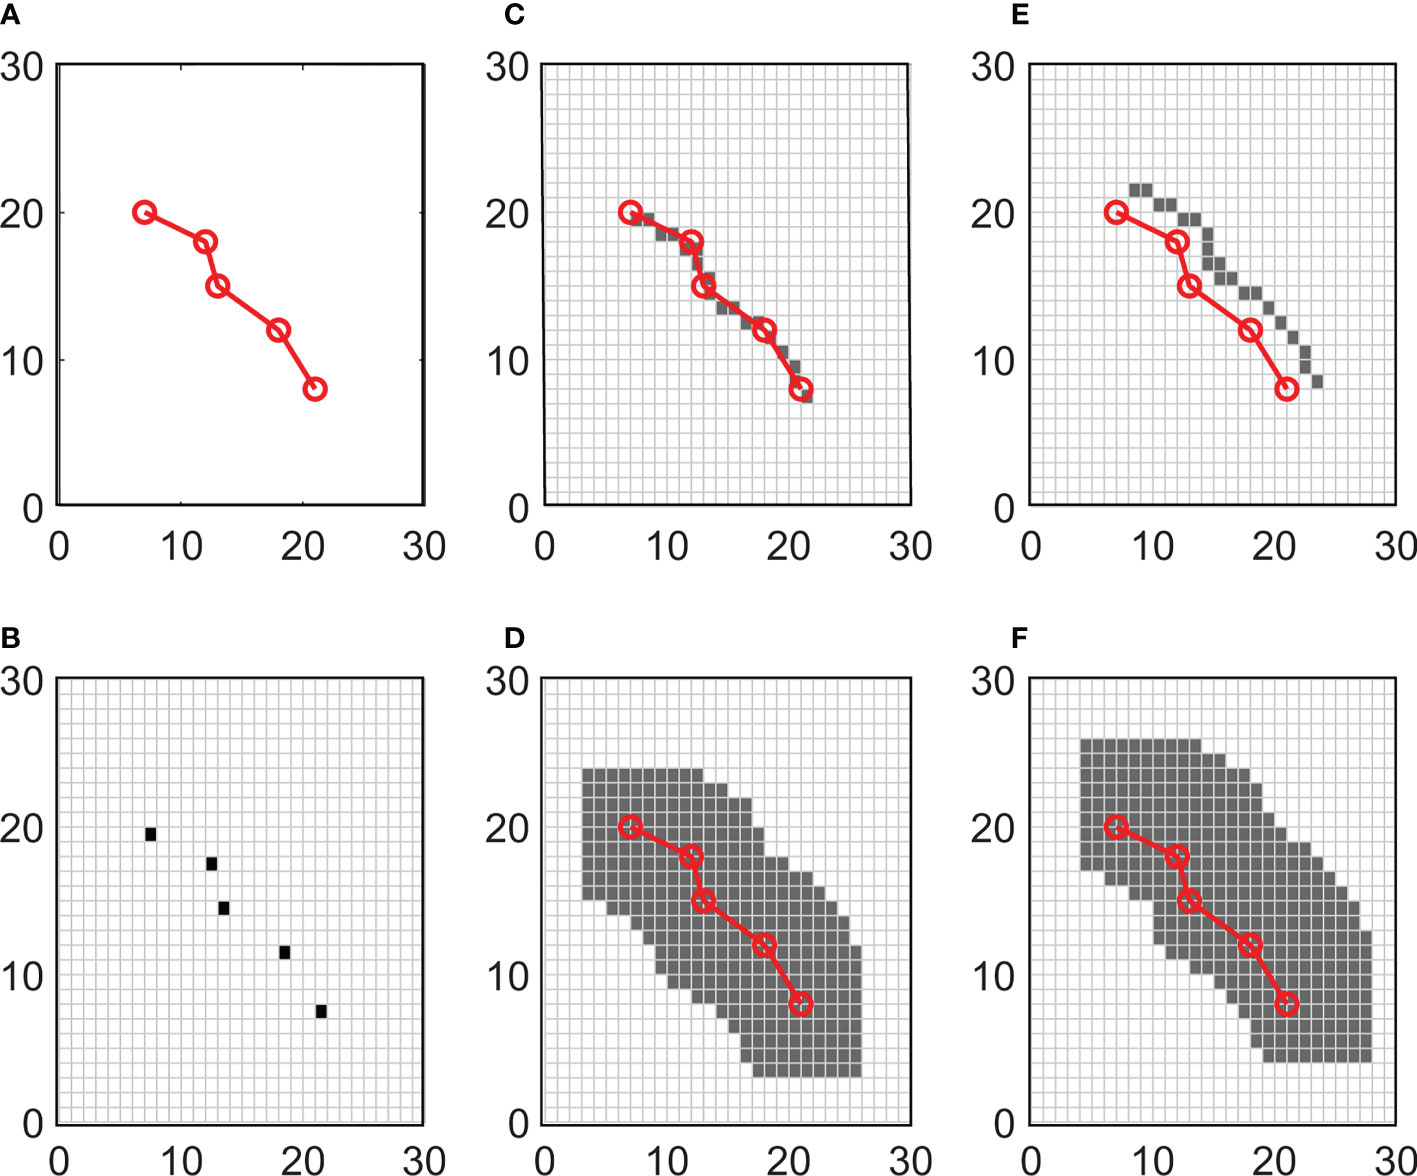
Figure 2 Schematic diagram of the TC-influenced area determined by Bresenham’s line algorithm. (A, B) TC track points are plotted as a grid on a 0.04° × 0.04° gridded map; (C) the approximation line of the original TC track is drawn using Bresenham’s line algorithm. (D) TC-influenced area of equal width is obtained; (E) parallel shifting this approximate trajectory; (F) the TC-influenced area that extended 1° leftward and 2° rightward from the TC track.
In this study, the TCs with track points less than four (i.e., the lingering time in the SCS is shorter than one day) are excluded, and each TC track is divided into two individual cases based on its location (continental shelf and open sea region). Furthermore, to exclude the influences of the Pearl River diluted water and coastal upwelling, we did not extend our study area farther shoreward to the coastal water region (depths< 50m) as the suspended sediments caused by strong wind mixing and bottom reflectance may affect the quality of satellite retrieved Chl-a.
2.2.2 The grid-based maximum response method
To obtain the average Chl-a enhancement in the TC-influenced area of each event, the grid-based maximum response (GMR) method was used (Li et al., 2020) in this study. Figure 3 displays an instance of a Chl-a bloom in the open sea region that was affected by the TC Durian in 2006. The TC-influenced area is firstly identified by the method illustrated in 2.2.1 (see dark grey shading in Figure 3A). Since the initial forcing time by the TC varies with location, the Chl-a time series is recorded for each grid (Figure 3B). The Chl-a response period was defined as the period from the start time t (0) to the end time t (13) because the maximum increase in Chl-a in previous studies rarely occurred more than two weeks after the passage of a TC.
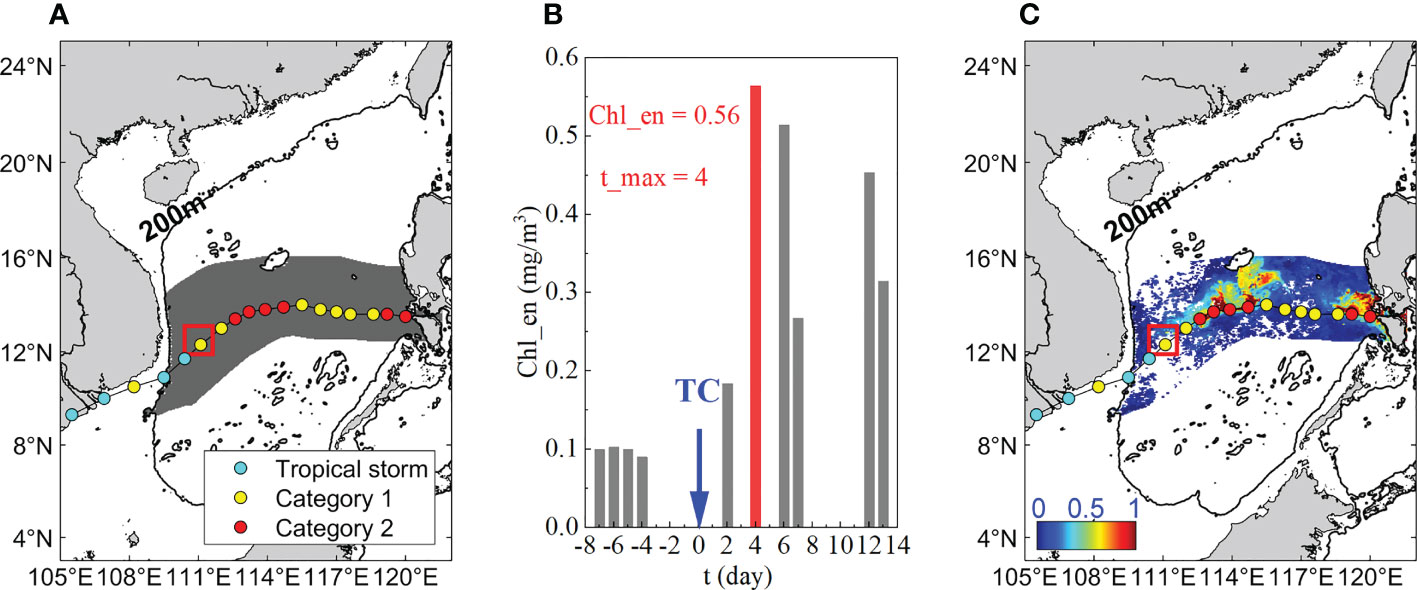
Figure 3 (A)TC Durian influenced area in the open sea region. The 6-hourly locations of TC centers are annotated with solid circles, and different colors denote different Saffir-Simpson Hurricane Wind Scale; (B) timeseries of the Chl-a enhancement at 109°E, 13°N (i.e., the red rectangle in (A, C); (C) composite Chl_en plot.
Second, for each grid i, we calculate the initial Chl-a concentration by averaging the Chl-a from t (-7) to t (-1). The responding Chl-a is calculated by finding the maximum Chl-a within the period t (0) to t (13). The Chl-a enhancement at grid i is then calculated as the responding Chl-a minus the initial Chl-a:
Where dval is the number of days with valid Chl-a values from time t (-7) to t (-1). As for the grid marked by a red rectangle in Figure 3A, the dval is four (i.e., t (-7), t (-6), t (-5), t (-4)), and the Chl-a reached its maximum four days after the passage (Figure 3B).
Third, the maximum Chl-a enhancement in each grid is plotted on a new map (Figure 3C). The resulting map is the Chl-a response map obtained by the GMR method. Overall, the TC-induced Chl-a enhancement (Chl_en) can be evaluated as follows:
where n is the number of valid grids in the TC-influenced area (Note that we only calculated the TC event whose number of nonzero grids accounted for over 50% of the total grids in the influenced area).
3 Results
3.1 General TC features
TCs are common in the SCS, and 299 TC events occurred during the past 23 years. In total, there were 960 (2,577) TC locations in the continental shelf (open sea) region, respectively. The spatial distribution of the TC track points at each 1° × 1° grid demonstrated that approximately 53% of TCs are in the northern SCS (north of 16°N; Figure 1B). In this region, TCs were most frequently observed to the west of Luzon Strait, with 20% of TCs located east of 115°E (16°–21°N). In contrast, the southern SCS was of sparse TC activities. Although the continental shelf was not the region where TCs were most frequently observed, TCs had considerable great intensity in this area, especially in the northern SCS (Figure 1C). However, the pattern of TC translation speed was quite different from that of TC wind speed. The fastest TCs were found at the southeast SCS (Figure 1D). Both the average TC wind speed and the translation speed in the continental shelf region were faster than that in the open region in the SCS (Table 1), accompanied by a larger range.
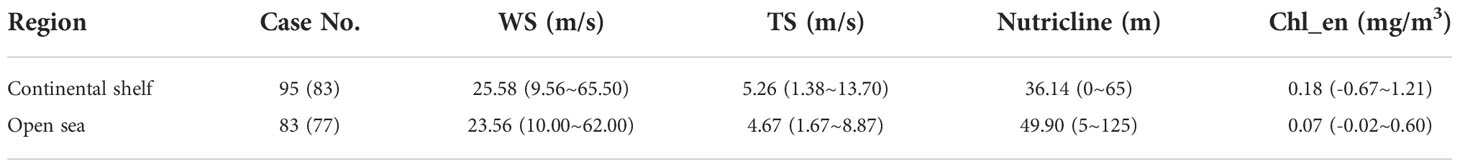
Table 1 The TC case numbers (those in parentheses show the number with a phytoplankton bloom, i.e., Chl_en >0), TC wind speed (WS), translation speed (TS), nutricline and TC-induced Chl_en in the continental shelf and open sea region in the SCS.
The monthly number of TC events also exhibited significant seasonal variability (Figure 4A). In the second half of the year (i.e., from July to December), the number of TC events was 248, accounting for about 83% of the total. Furthermore, strong TCs with the intensity of category 4&5 also occurred almost exclusively during these months. Prominent annual changes in TCs were also obvious in Figure 4B, with a mean value of ~11 TCs per year, a little higher than those documented in some previous studies (Wang and Xiu, 2022). This is mainly because we took the tropical depression and tropical storm into account. The annual variation of TC wind speed and translation speed is shown in (Figures 5A, B). Note that the TC wind speed and translation speed were firstly calculated from each TC event and then averaged each year in the continental shelf and open sea region, respectively. In most years, the TC wind speed is higher in the continental shelf than in the open sea region, which suggested the TC’s destruction of the coastal environment may be more severe than in the open sea (Mei and Xie, 2016; Li and Chakraborty, 2020). At the same time, no significant trend was found for the TC wind speed. However, during the study period (1998-2020), the TC translation speed exhibited a significant increasing trend of 0.065 (0.075) m s-1 year-1 at the 95% confidence level in the continental shelf (open sea) region, respectively (Figure 5B). This is generally consistent with previous findings in the South China Sea (Chang et al., 2020) and the Western North Pacific (Gong et al., 2022) during a similar period.
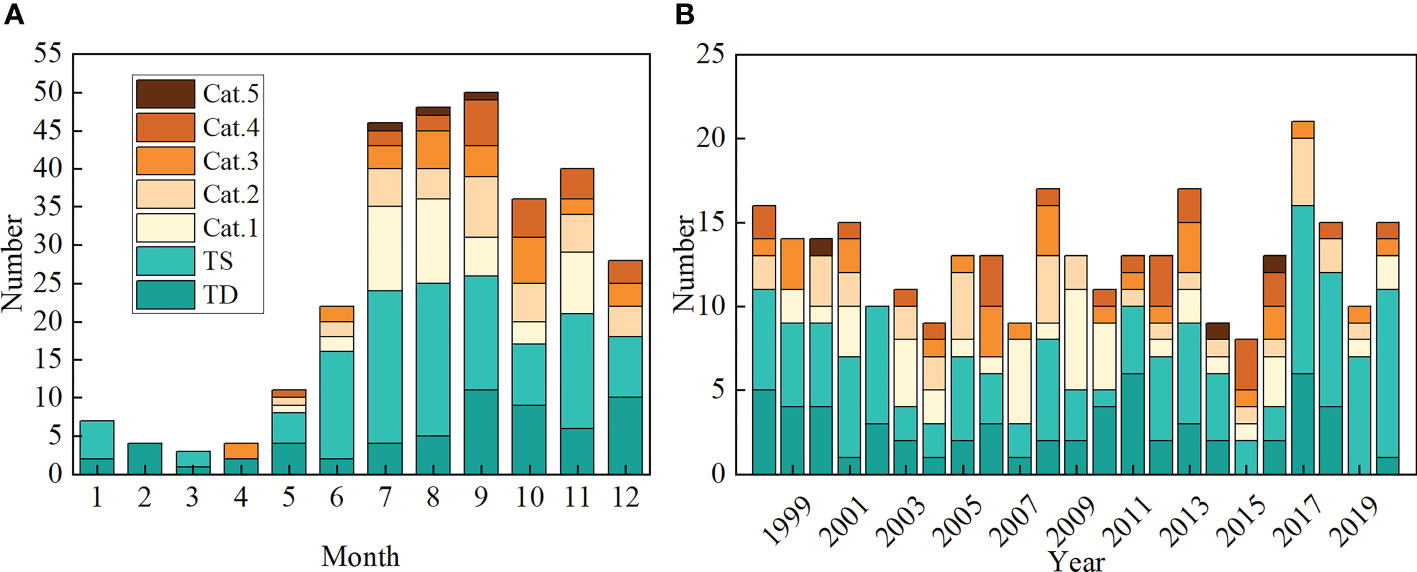
Figure 4 Statistics of TCs in the South China Sea between 1998 and 2020: (A) monthly and (B) annual number of TC events classified by the Saffir-Simpson Hurricane Wind Scale.
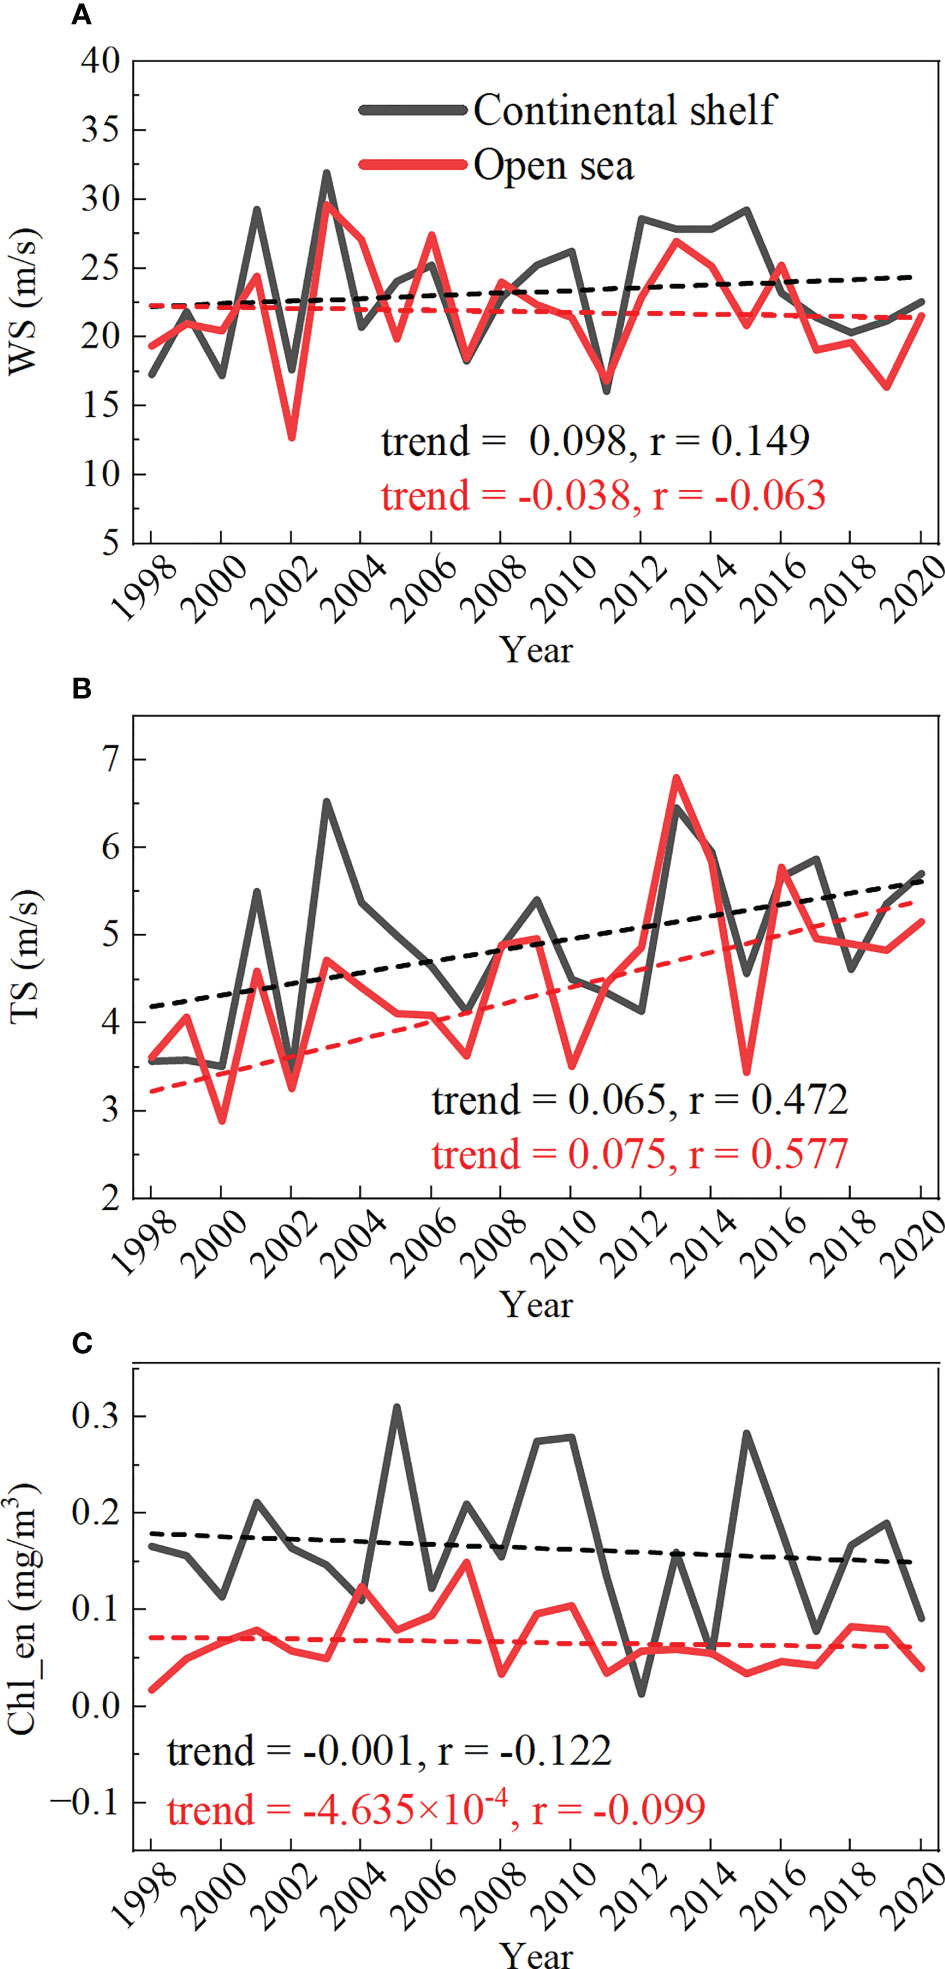
Figure 5 Time series of annual-mean (A) wind speed (m/s); (B) translation speed (m/s); (C) TC-induced Chl-a enhancement (mg/m3) and their linear trends.
3.2 Response of Chl-a to TCs
As mentioned earlier in section 2.2.1, we divided the TC tracks into two individual cases to study their varying impact on the Chl-a enhancement in the two regions. Details on averaged TC information are given in Table 2. In the continental shelf region, Chl-a increased 83 times (87% of all events), and the average Chl-a increased by 0.13 mg/m3, with the maximal increase reaching up to 1.21 mg/m3. While in the open sea region, increases in Chl-a occurred 77 times (93% of all events), and the comparisons between the pre-and post-TC periods show that Chl-a increased on average by 0.07mg/m3, with the maximal increase reaching up to 0.60 mg/m3. In general, the average Chl_en in the continental shelf was 2.6 times higher than that in the open sea area, and the former has a larger range of Chl_en variation, while the latter has a higher proportion of TC-induced Chl-a enchantment (i.e., Chl_en>0).
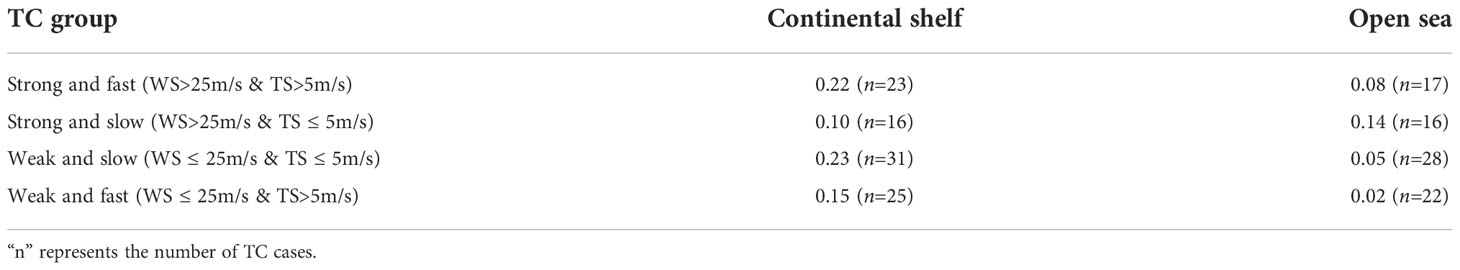
Table 2 TC-induced Chl_en (mg/m3) of four groups categorized based on the average of TC wind speed (WS) and translation speed (TS).
Figure 6 shows the temporal evolution of the composite area-mean Chl_en induced by TCs in the continental shelf and open sea region. Within three days after TC, the Chl-a concentration started to decrease and recover to its original level (i.e., 7-d mean Chl-a concentration before TC), which was probably due to the vertical mixing process immediately altering the spatial and vertical distribution of phytoplankton (Qiu et al., 2019). Afterward, the Chl-a in the two regions both increased and decreased three times, and the three high values occurred on days 4-5, 7, and 9-10 after TC, respectively. Among them, the highest value occurred at the third rise (i.e., days 9-10). In the continental shelf area, it is ~0.13 mg/m3. And in the open sea area, it is ~0.06 mg/m3, approximately half of that in the continental shelf area. The reason for this interesting result may be the grazing effect of zooplankton (Zhou et al., 2011). Mainly due to the lack of nutrient supply, Chl-a reached its maximum value at a longer time in the open sea than in the continental shelf area. This result is generally consistent with previous findings in the SCS (Zhao et al., 2008). After three oscillations, the Chl-a recovered to the level before TC on day 15 (16) in the continental shelf (open sea) region, respectively.
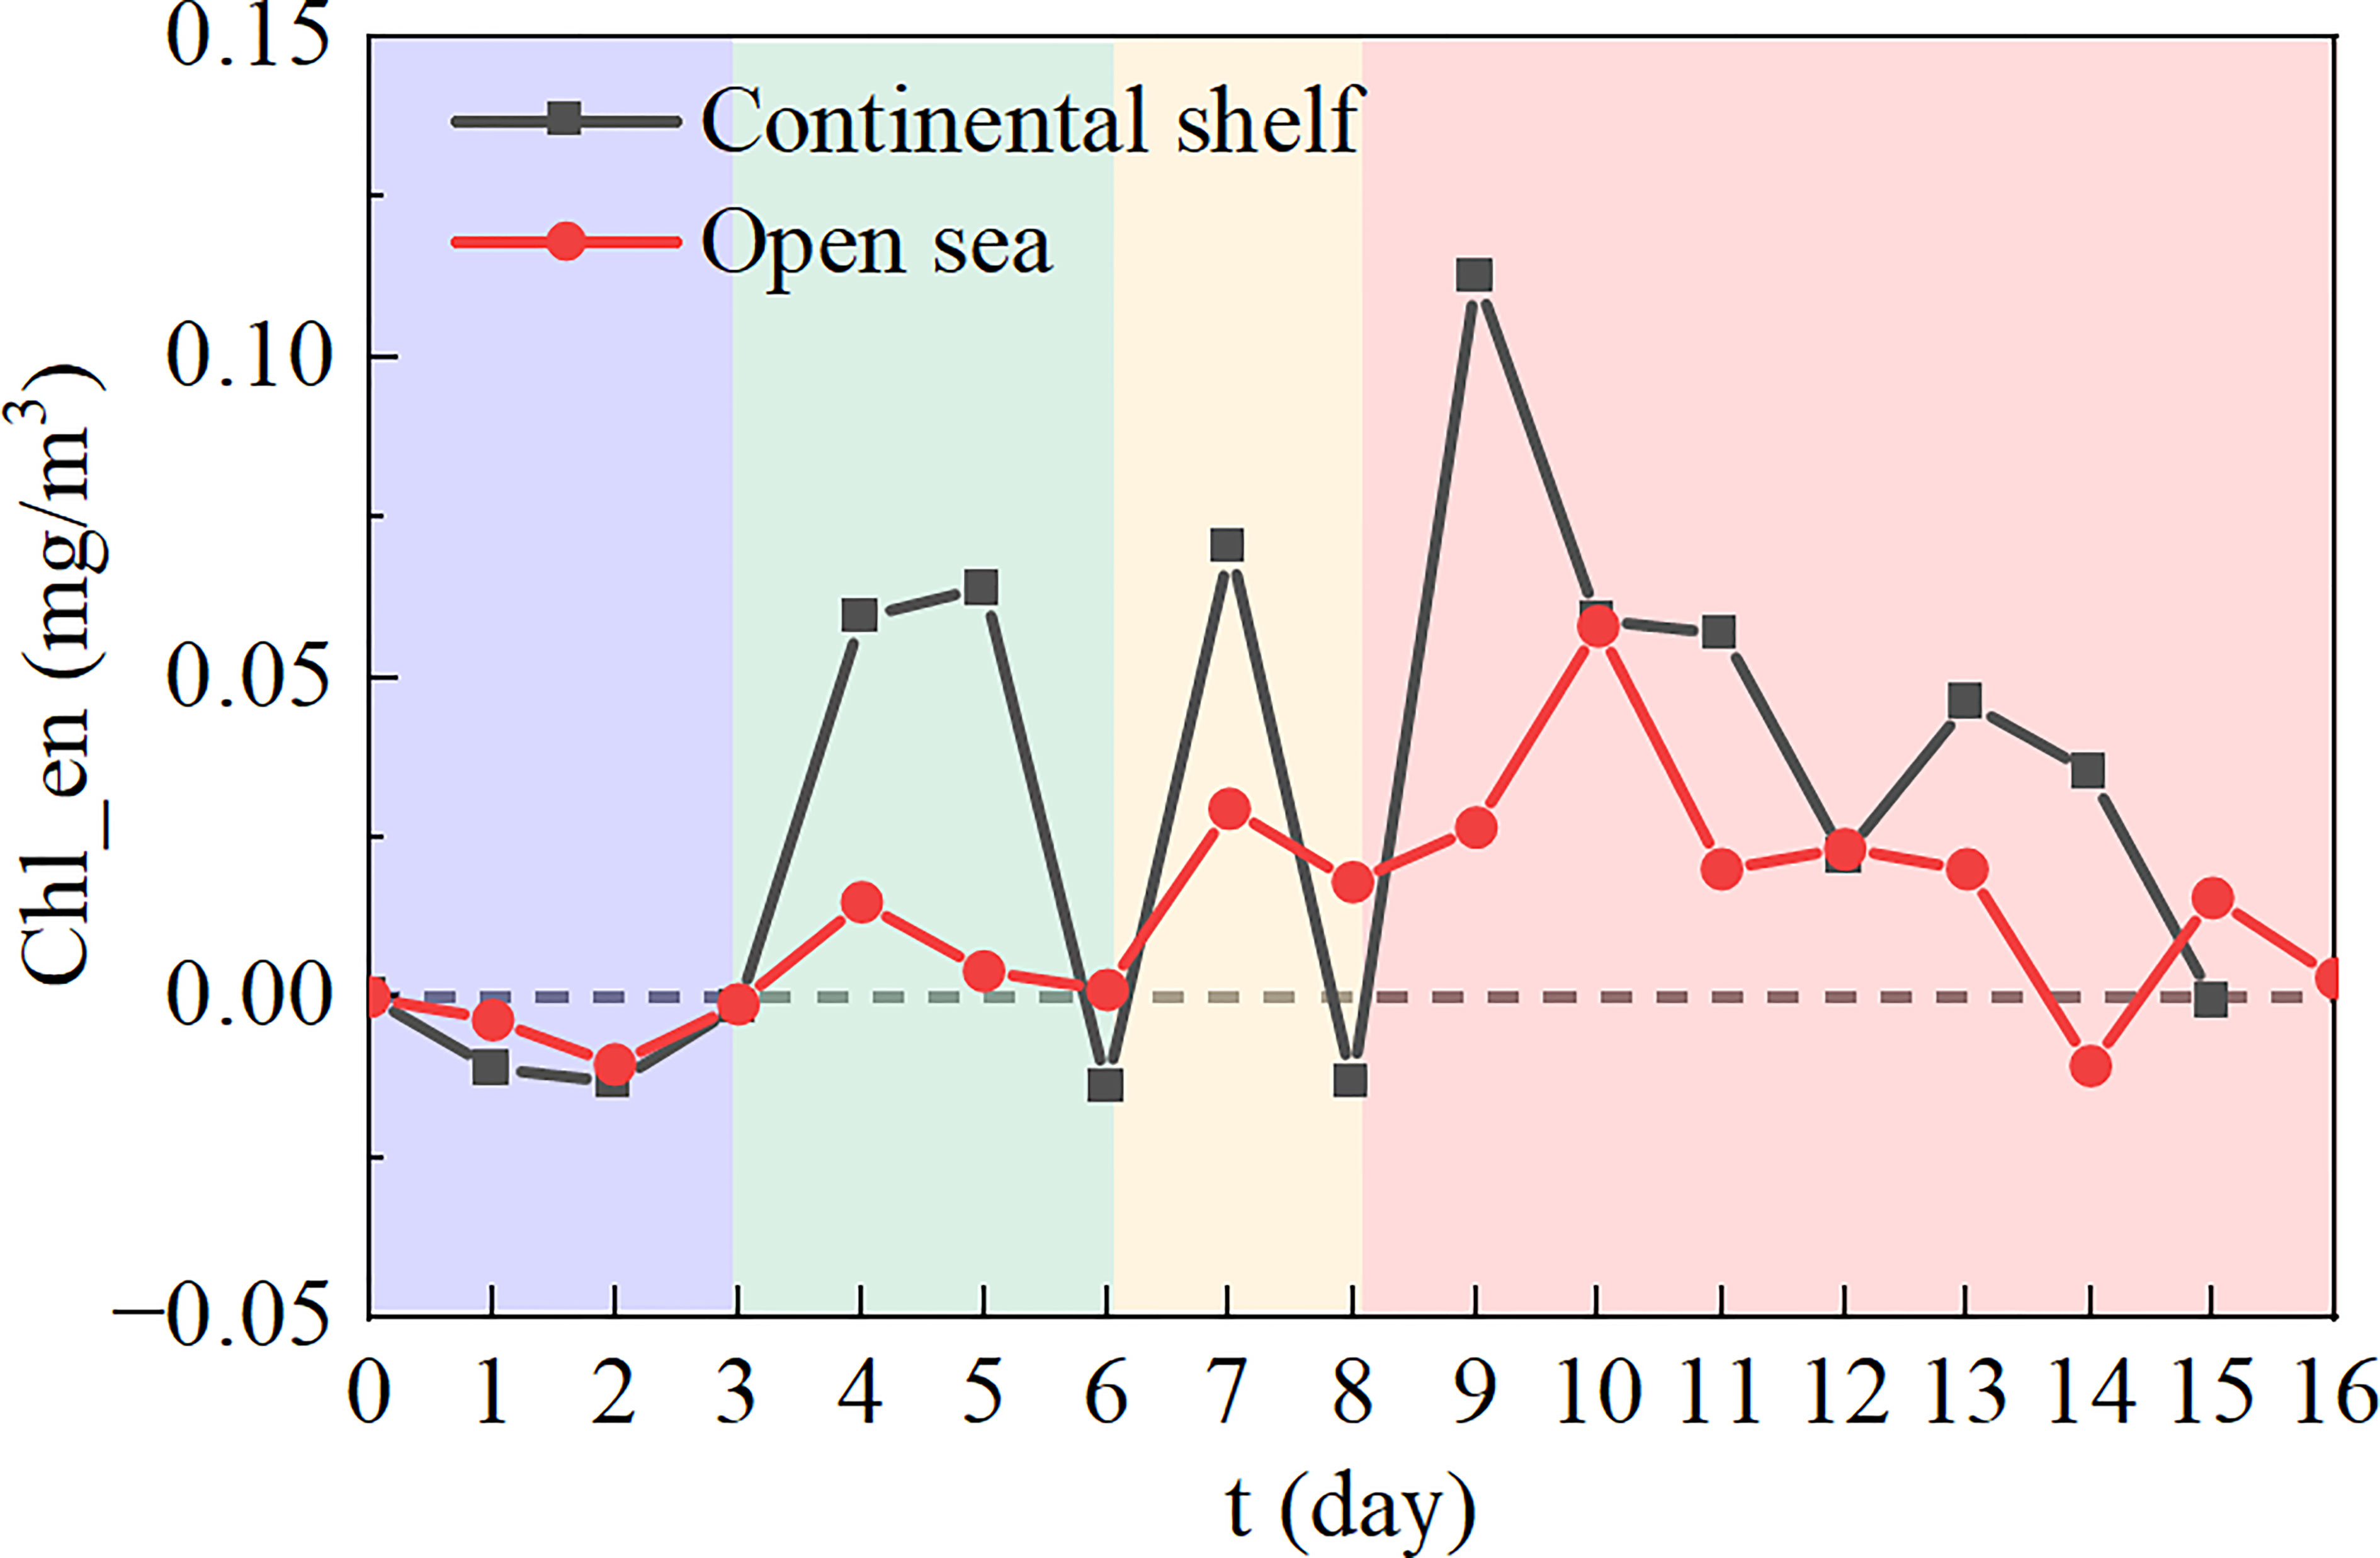
Figure 6 Timeseries of Chl_en in the continental shelf area (black curve) and open sea area (red curve). The shading indicates different stages of variations in Chl_en.
3.3 Effect of TCs’ characteristics on Chl-a
To examine the dependence of TC-induced Chl_en on TC wind speed and translation speed, we divided the TCs into four groups (Table 2). The Chl-a response to TCs with specified wind speed and translation speed varied significantly between the two regions (Figure 7). In the continental shelf region, both the strong and fast-moving and weak and slow-moving TCs can induce the highest Chl_en at ~0.23 mg/m3 among all the four groups, which means even a weak TC can cause a phytoplankton bloom as a strong TC. This phenomenon has been discussed in previous case studies (Zhang et al., 2014; Yang et al., 2015; Zhao et al., 2017). In contrast, the strong and slow-moving TCs engender the least Chl_en at 0.10 mg/m3. However, in the open sea region, the strong and slow-moving TCs can induce the highest Chl_en at 0.14 mg/m3, while the weak and fast-moving TCs triggered the least Chl_en at 0.02 mg/m3. Overall, the Chl_en in the continental shelf region is ~3.89 times that in the open sea region for identical TC forcing.
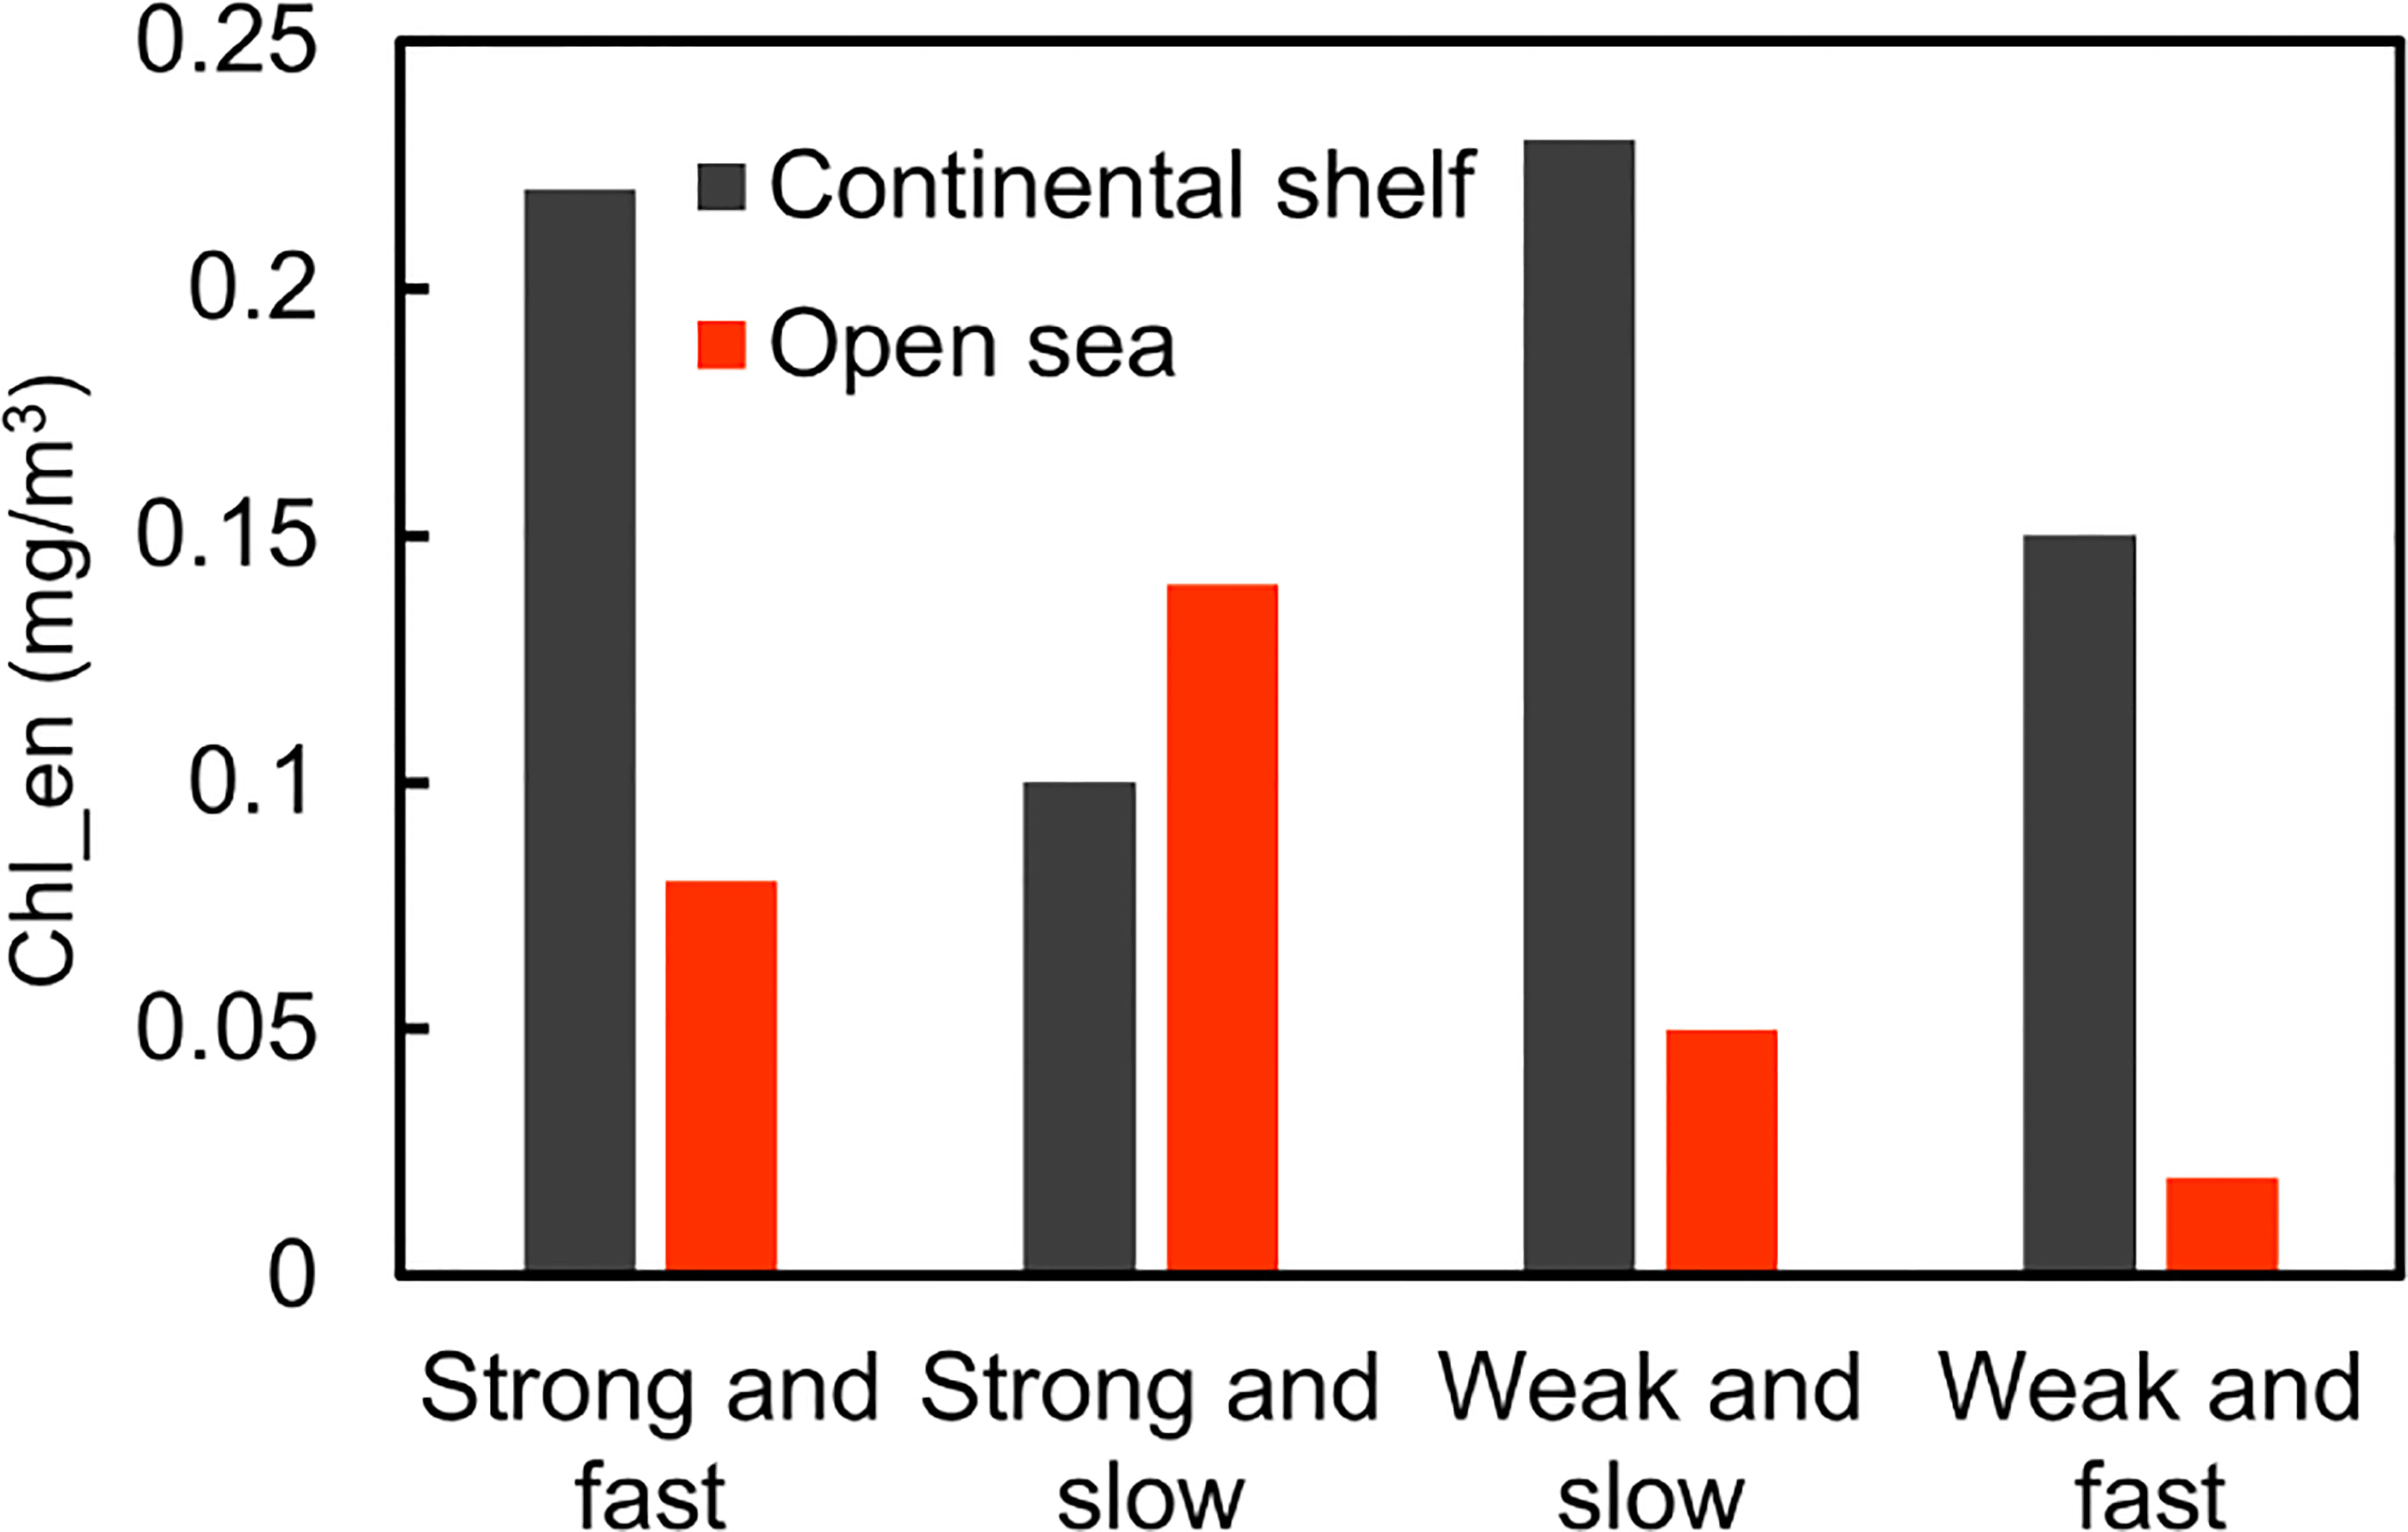
Figure 7 Average Chl_en induced by four groups of TCs in the continental shelf (black bar) and open sea (red bar) regions.
Here we examined the TC Durian in 2006 to explain the relationship between the Chl_en and the TC wind speed and translation speed. Durian originated in the Northwest Pacific and moved westwards through the middle of the South China Sea before landing (Figure 8A). On average, the Chl_en in the continental shelf (~0.44 mg/m3) was twice that in the open sea (~0.22 mg/m3) region (Figure 8C). According to the grid proportion with different Chl_en, the ratio of grids with Chl_en greater than 0.2 mg/m3 in the continental shelf is higher than that in the open sea region (Figures 8B, C). And TC Durian was a strong and slowing-moving TC in the open sea region, while it turned into a weak and fast-moving TC in the continental shelf region.
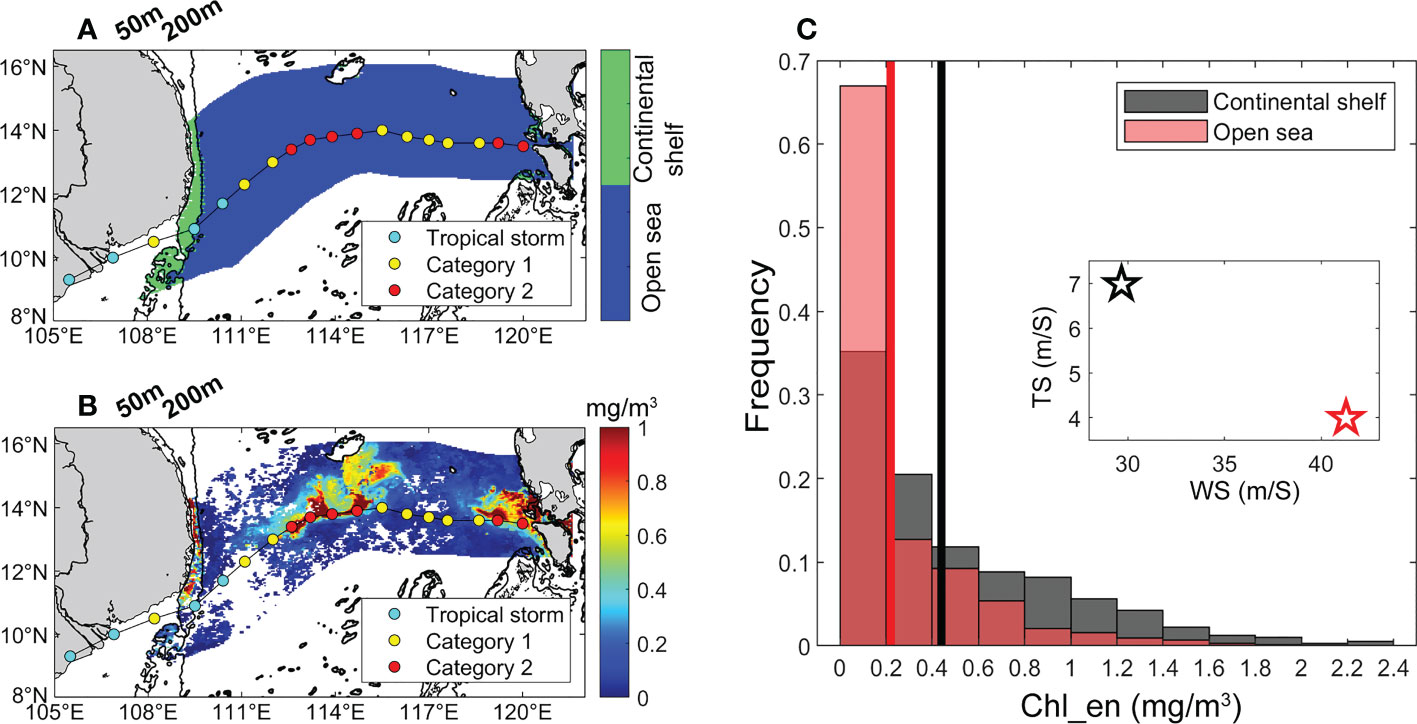
Figure 8 (A) TC Durian influenced area in the continental shelf (green shading) and open sea (blue shading) region. The black contour represents the 50-m and 200-m isobaths; (B) composite Chl_en plot; (C) Frequency histogram of the proportion of grids with different Chl_en to total non-empty grids of the TC-influenced area in the continental shelf (black bar) and open sea (red bar) region. The black and red lines represent the average Chl_en in the two regions. The black and red pentacles represent the average wind speed and translation speed of TC Durian in the two regions.
The partial correlation coefficient was calculated among the Chl_en and TC wind speed, translation speed and water depth (nutricline)under the TC tracks in the continental shelf (open sea) region (Tables 3, 4). For all TC events in the open sea area, Chl_en and wind speed are positively correlated (r=0.50, p<0.01); rather, Chl_en and translation speed are negatively correlated (r= -0.31, p<0.01). This result is quantitively consistent with the previous studies. There is also a significant positive correlation between the Chl_en and nutricline (r = 0.31, p<0.01). The deeper the nutricline is, the higher the nutrient content phytoplankton can use to support their growth after TC’s passing. For the strong and slow-moving TCs, the linear correlation becomes stronger for both Chl_en and wind speed (r=0.77, p<0.01) and Chl_en and translation speed (r = -0.65, p<0.05). What’s more, there is a strong linear correlation between Chl_en and nutricline for the strong and fast-moving TCs (r = 0.70, p<0.01). While for the other two groups (i.e., the weak and slow-moving and weak and fast-moving TCs), no significant correlations were found. As for the TCs in the continental shelf region, there is only one significant negative correlation between Chl_en and water depth underneath the TC track for the strong and fast-moving TCs (r= -0.48, p<0.05). This probably indicates that the shallower the depth under the TC track, the higher the sea surface Chl-a concentration can be triggered. The correlation between the Chl_en and EPV is positive (negative) in the open sea (continental shelf) region, which suggests that upwelling plays a more important role in TC-induced Chl_en in the open sea region.
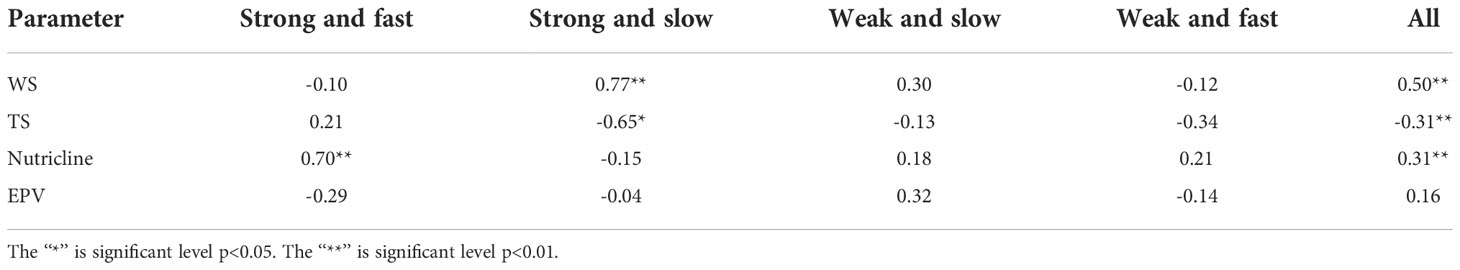
Table 3 The Partial correlation coefficients between the Chl_en and TC wind speed (WS), translation speed (TS), nutricline and Ekman pumping velocity (EPV) in the open sea region.
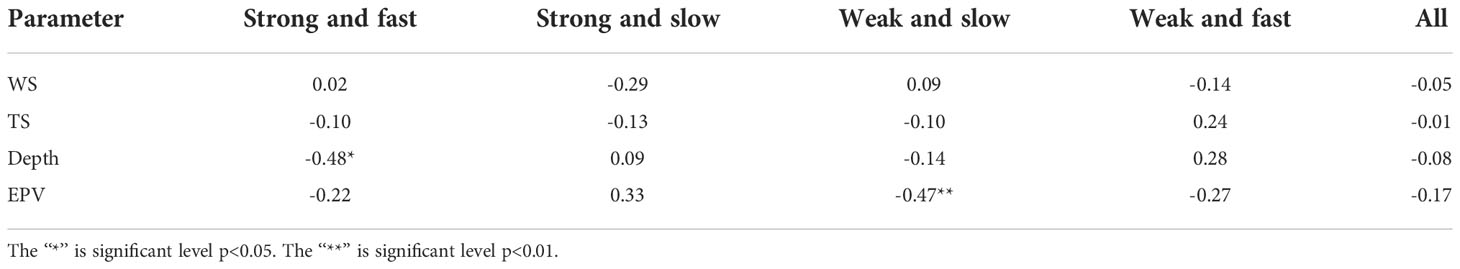
Table 4 The Partial correlation coefficients between the Chl_en and TC wind speed (WS), translation speed (TS), water depth and Ekman pumping velocity (EPV) in the continental shelf region.
4 Discussion
4.1 Seasonal variation of TC-induced Chl_en
In the SCS, the nutricline and the chlorophyll maximum layer are always below the mixed layer (Kuss et al., 2021). When the mixed layer after a TC is deeper than the chlorophyll maximum layer, a high Chl-a concentration can be transmitted to the sea surface (Wang et al., 2010); when the mixed layer is deeper than the nutricline, more nutrients are transported to the euphoric layer, which promotes the growth of phytoplankton (Palter, 2015). Moreover, the bloom can remain for a week or even longer if the disturbance reaches deeper than the nutricline (Lu et al., 2018). Thus, upper ocean conditions play an important role in the injection of nutrients from the subsurface to the surface layer (Zhang et al., 2021). Our study also showed that the responses of phytoplankton to TCs have distinct characteristics in different seasons, which may be due to seasonal changes in the upper ocean conditions of the SCS.
In Autumn, TCs in the continental shelf region are with the characteristics of the highest wind speeds and translation speed, resulting in the highest Chl_en during the whole year (Figure 9). However, in winter, TCs in the open sea region with the characteristics of the highest wind speeds and the third translation speed, and the second highest Chl_en were found. This phenomenon in the two seasons is like the strong and fast-moving (Autumn) and weak and slow-moving (Winter) TCs shown in Figure 7, even though the nutricline was rather deeper (Note that the nutricline in Figure 9C is the mean nutricline in the TC-influenced area). In the open sea area, the strongest responses of Chl-a were found in Winter. The TCs are with characteristics of strong and slow-moving. Besides, the nutricline in Winter is the shallowest, which means nutrient-rich water can be easily injected into the euphotic zone and support the growth of phytoplankton.
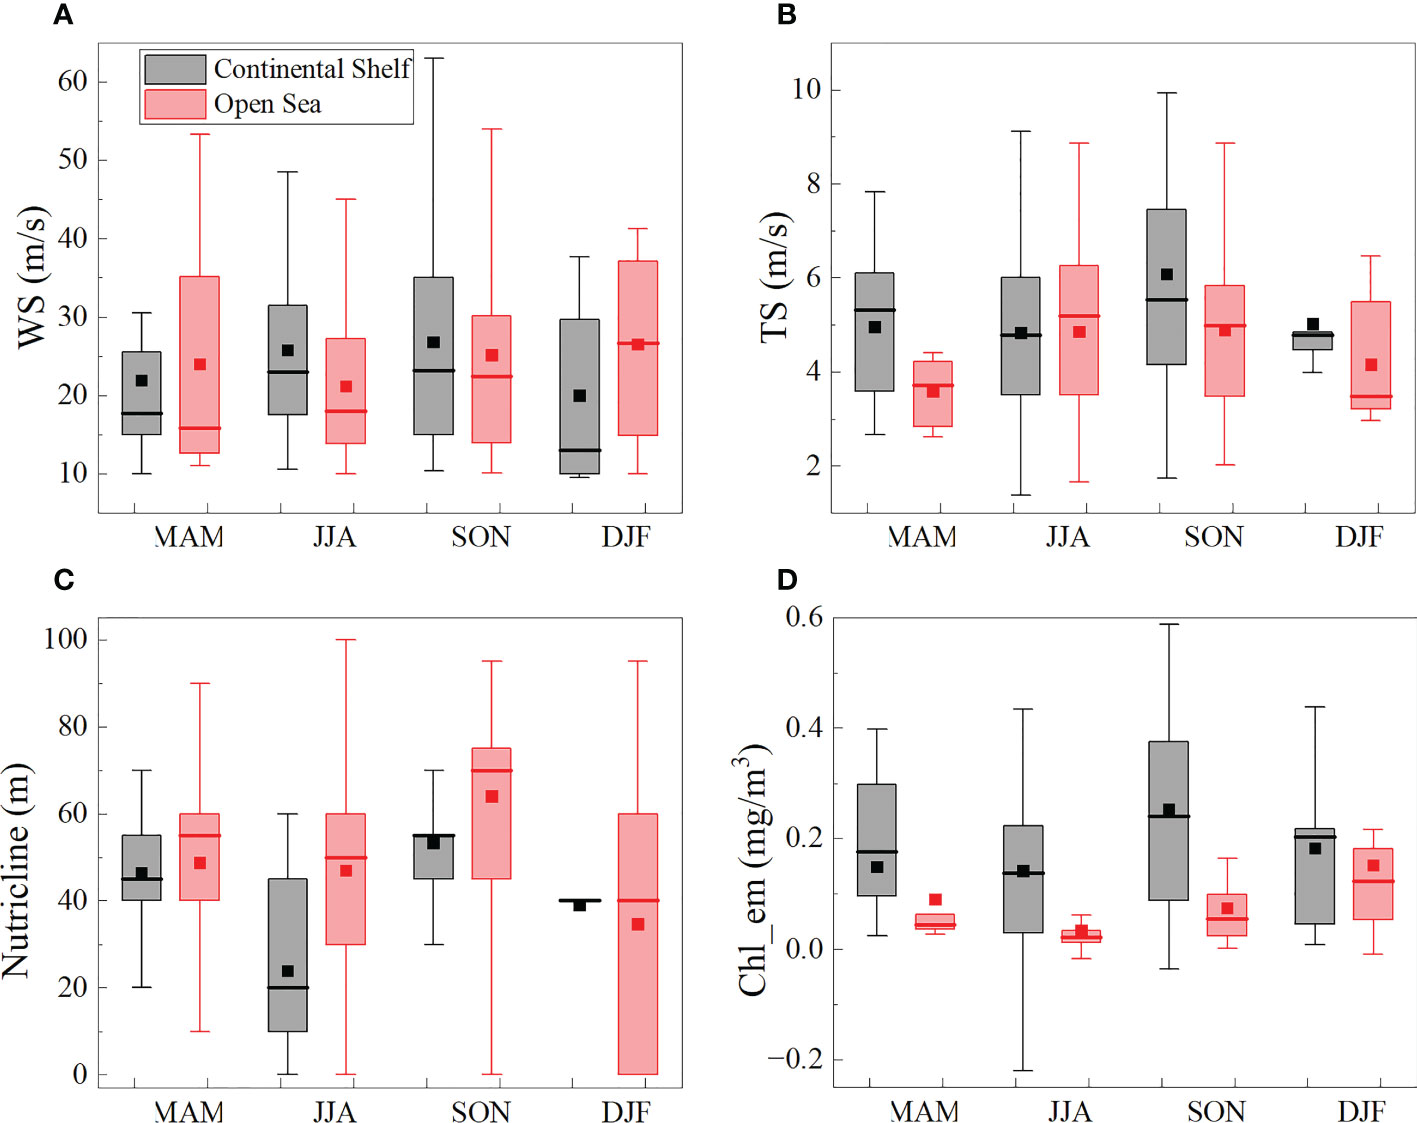
Figure 9 Seasonal variations of TCs (A) wind speeds; (B) translation speeds; (C) nutricline (only in the open sea region); (D) Chl_en. Spring (March-May, MAM), Summer (June-August, JJA), Autumn (September-November, SON), Winter (December-February, DJF). The central box represents the values from the lower to upper quartile (25 to 75 percentile). The middle line represents the median. The horizontal line extends from the minimum to the maximum value. The rectangular point represents the mean-value.
4.2 The difference between TC-induced Chl_en in the continental shelf and open sea region
TCs can induce upwelling or vertical mixing of the seawater, one of the most important drivers in the supply of nutrients from the deep layer to the euphotic zone. The nutrients upward can support an increase in Chl-a concentration. These processes can easily occur in the continental shelf region where the stratification is shallower and easily broken up by TCs (Chen et al., 2017). Under low-intensity TCs, the continental shelf water remains stratified, and the oceanic response is similar to the open sea (Cooper and Thompson, 1989a). Hence, in the continental shelf area, the weak and slow-moving TCs can trigger the highest Chl-a enhancement, whose mechanism is like the strong and slow-moving TCs in the open sea area. While the strong and fast-moving TCs have a relatively short impact time on the coastal ocean, the calm ocean environment after TC is suitable for the growth of phytoplankton with the rich-nutrients water diluted from the runoff. The nutrient is not a limiting factor for the phytoplankton growth in the continental shelf, compared to the open sea region.
In continental shelf and open sea regions, the mechanisms of TC-induced Chl_en are quite different. This is due to several factors, such as side boundaries, bottom friction, and variable stratification (Kundu, 1976). The normal velocity at the side boundary of the shelf sea area is 0, so the near-inertial motion near the coast can be suppressed, resulting in a weak near-inertial current. In addition, the side boundary can induce the divergence of the upper flow (Dutkiewicz et al., 2019). The resultant combination of intense wind, boundary depth-driven turbulence, and shallow nutricline may inject nutrients intensively into the euphotic zone. In the continental shelf area, the calm water conditions following the storm are critical for phytoplankton growth (Zheng and Tang, 2007; Zhao et al., 2009; Chen et al., 2017).
5 Conclusion
This study compared the tropical cyclone Wind Pump-induced Chl-a enhancement between the continental shelf and the open sea region in the SCS, using a grid-based maximum method and multi-platform satellite data during 1998-2020. The major conclusions include the following: 1) Stronger Chl-a responses were observed in the continental shelf than in the open sea region. 2) TC-induced Chl_en strongly depends on the TC characteristics. In the continental shelf region, both strong and fast-moving and weak and slow-moving TCs induce the largest Chl-a enhancement. However, in the open sea region, the largest Chl-a enhancement was induced by the strong and slow-moving TCs. 3) The main mechanisms of TC-induced Chl_en can differ in the two regions. In the continental shelf region, a stable marine environment is the most critical factor for phytoplankton growth. In the open sea area, whether the disturbance caused by the TC can reach the maximum chlorophyll layer and the subsequent nutrient supply is the key to a phytoplankton bloom. In this paper, due to the lack of in-situ data, only the surface Chl-a variations were analyzed. We will try to use higher spatial and temporal resolution data from numerical model to obtain the vertical variation of TC-induced Chl_en in the two regions in future work.
Data availability statement
The original contributions presented in the study are included in the article/supplementary material. Further inquiries can be directed to the corresponding author.
Author contributions
YL contributed to the conceptualization, methodology, investigation, writing—original draft preparation, and visualization. DT contributed to the funding acquisition, project administration, conceptualization, supervision, and writing—review and editing. All authors contributed to the article and approved the submitted version.
Funding
This work was supported by Guangdong Special Support Program for Key Talents Team under grant [2019BT02H594], Key Special Projects of Southern Marine Science and Engineering Guangdong Laboratory Introduced Talents Team) and Guangdong Remote Sensing Center for Marine Ecology and Environment (GDRS) under grants [GML2021GD0810 and GML2019ZD0602], the National Natural Science Foundation of China under grants[41876136 and 41430968], Guangdong Key Lab of Remote Sensing (LORS) under grant [2017B030301005], Key Project of Guangdong Institute for International Strategic under grant [17ZDA24] and Innovation Academy of South China Sea Ecology and Environmental Engineering, Chinese Academy of Sciences under grant [ISEE2019ZR02].
Acknowledgments
The authors acknowledge the GlobColour Project of ESA for the merged chlorophyll-a data (http://www.globcolour.info/index.html), the Joint Typhoon Warning Center (JTWC) for the tropical cyclone data (https://www.metoc.navy.mil/jtwc), the National Geophysical Data Center for the ETOPO1 ocean bathymetry data (https://ngdc.noaa.gov/mgg/global/) and the World Ocean Atlas (WOA18) for the nitrate data (https://www.ncei.noaa.gov/). We would like to thank Dr. Evgeny Morozov for sharing the MATLAB code of Bresenham’s line algorithm.
Conflict of interest
The authors declare that the research was conducted in the absence of any commercial or financial relationships that could be construed as a potential conflict of interest.
Publisher’s note
All claims expressed in this article are solely those of the authors and do not necessarily represent those of their affiliated organizations, or those of the publisher, the editors and the reviewers. Any product that may be evaluated in this article, or claim that may be made by its manufacturer, is not guaranteed or endorsed by the publisher.
References
Bresenham J. E. (1965). Algorithm for computer control of a digital plotter. IBM Syst. J. 4, 25–30. doi: 10.1147/sj.41.0025
Chacko N. (2017). Chlorophyll bloom in response to tropical cyclone hudhud in the bay of Bengal: Bio-argo subsurface observations. Deep Sea Res. Part Oceanogr. Res. Pap. 124, 66–72. doi: 10.1016/j.dsr.2017.04.010
Chacko N. (2019). Differential chlorophyll blooms induced by tropical cyclones and their relation to cyclone characteristics and ocean pre-conditions in the Indian ocean. J. Earth Syst. Sci. 128, 177. doi: 10.1007/s12040-019-1207-5
Chang Y.-T., Lin I.-I., Huang H.-C., Liao Y.-C., Lien C.-C. (2020). The association of typhoon intensity increase with translation speed increase in the south China Sea. Sustainability 12, 939. doi: 10.3390/su12030939
Chen D., He L., Liu F., Yin K. (2017). Effects of typhoon events on chlorophyll and carbon fixation in different regions of the East China Sea. Estuar. Coast. Shelf Sci. 194, 229–239. doi: 10.1016/j.ecss.2017.06.026
Chen C.-T. A., Liu C.-T., Chuang W. S., Yang Y. J., Shiah F.-K., Tang T. Y., et al. (2003). Enhanced buoyancy and hence upwelling of subsurface kuroshio waters after a typhoon in the southern East China Sea. J. Mar. Syst. 42, 65–79. doi: 10.1016/S0924-7963(03)00065-4
Cooper C., Thompson J. (1989a). Hurricane-generated currents on the outer continental-shelf .2. model sensitivity studies. J. Geophys. Res.-Oceans 94, 12540–12554. doi: 10.1029/JC094iC09p12540
Cooper C., Thompson J. D. (1989b). Hurricane-generated currents on the outer continental shelf: 1. model formulation and verification. J. Geophys. Res. Oceans 94, 12513–12539. doi: 10.1029/JC094iC09p12513
Cubukcu N., Pfeffer R. L., Dietrich D. E. (2000). Simulation of the effects of bathymetry and land–Sea contrasts on hurricane development using a coupled ocean–atmosphere model. J. Atmospheric Sci. 57, 481–492. doi: 10.1175/1520-0469(2000)057<0481:SOTEOB>2.0.CO;2
Dutkiewicz S., Hickman A. E., Jahn O., Henson S., Beaulieu C., Monier E. (2019). Ocean colour signature of climate change. Nat. Commun. 10, 578. doi: 10.1038/s41467-019-08457-x
Foltz G. R., Balaguru K., Leung L. R. (2015). A reassessment of the integrated impact of tropical cyclones on surface chlorophyll in the western subtropical north Atlantic. Geophys. Res. Lett. 42, 1158–1164. doi: 10.1002/2015GL063222
Gong D., Tang X., Chan J. C. L., Wang Q. (2022). Trends of tropical cyclone translation speed over the Western north pacific during 1980-2018. Atmosphere 13, 896. doi: 10.3390/atmos13060896
Hu J., Kawamura H., Hong H., Qi Y. (2000). a review on the currents in the south china sea: Seasonal circulation, south china sea warm current and kuroshio intrusion. J. Oceanogr. 57. 607–624 doi: 10.1023/A:1011117531252
Kundu P. K. (1976). An analysis of inertial oscillations observed near oregon coast. J. Phys. Oceanogr. 6, 879–893. doi: 10.1175/15200485(1976)006<0879:AAOIOO>2.0.CO;2
Kuss J., Frazão H. C., Schulz-Bull D. E., Zhong Y., Gao Y., Waniek J. J. (2021). The impact of typhoon “Mangkhut” on surface water nutrient and chlorophyll inventories of the south China Sea in September 2018. J. Geophys. Res. Biogeosciences 126, e2021JG006546. doi: 10.1029/2021JG006546
Li L., Chakraborty P. (2020). Slower decay of landfalling hurricanes in a warming world. Nature 587, 230–234. doi: 10.1038/s41586-020-2867-7
Liao J., Xu J., Li R., Shi Z.. (2021). Photosynthesis-irradiance response in the eddy dipole in the western south china sea. J. Geophys. Res. Oceans 126, e2020JC016986. doi: 10.1029/2020JC016986
Lin I., Liu W. T., Wu C.-C., Wong G. T. F., Hu C., Chen Z., et al. (2003). New evidence for enhanced ocean primary production triggered by tropical cyclone. Geophys. Res. Lett. 30, 1718. doi: 10.1029/2003GL017141
Li J., Sun L., Yang Y., Cheng H. (2020). Accurate evaluation of Sea surface temperature cooling induced by typhoons based on satellite remote sensing observations. Water 12, 1413. doi: 10.3390/w12051413
Liu Y., Tang D., Evgeny M. (2019c). Chlorophyll concentration response to the typhoon Wind-Pump induced upper ocean processes considering air–Sea heat exchange. Remote Sens. 11, 1825. doi: 10.3390/rs11151825
Liu Y., Tang D., Tang S., Morozov E., Liang W., Sui Y. (2020). A case study of chlorophyll a response to tropical cyclone Wind Pump considering Kuroshio invasion and air-sea heat exchange. Sci. Total Environ. 741, 140290. doi: 10.1016/j.scitotenv.2020.140290
Liu X., Wei J., Zhang D.-L., Miller W. (2019a). Parameterizing Sea surface temperature cooling induced by tropical cyclones: 1. theory and an application to typhoon mats). J. Geophys. Res. Oceans 124, 1215–1231. doi: 10.1029/2018JC014117
Liu X., Zhang D.-L., Guan J. (2019b). Parameterizing Sea surface temperature cooling induced by tropical cyclones: 2. verification by ocean drifters. J. Geophys. Res. Oceans 124, 1232–1243. doi: 10.1029/2018JC014118
Li G., Wu Y., Gao K. (2009). Effects of typhoon kaemi on coastal phytoplankton assemblages in the south China Sea, with special reference to the effects of solar UV radiation. J. Geophys. Res. Biogeosciences 114, G04029. doi: 10.1029/2008JG000896
Lu J., Jiang J., Li A., Ma X. (2018). Impact of typhoon chan-hom on the marine environment and sediment dynamics on the inner shelf of the East China Sea: In-situ seafloor observations. Mar. Geol. 406, 72–83. doi: 10.1016/j.margeo.2018.09.009
Maneesha K., Sarma V. V. S. S., Reddy N. P. C., Sadhuram Y., Murty T. V. R., Sarma V. V., et al. (2011). Meso-scale atmospheric events promote phytoplankton blooms in the coastal bay of Bengal. J. Earth Syst. Sci. 120, 773–782. doi: 10.1007/s12040-011-0089-y
Maritorena S., d’Andon O. H. F., Mangin A., Siegel D. A. (2010). Merged satellite ocean color data products using a bio-optical model: Characteristics, benefits and issues. Remote Sens. Environ. 114, 1791–1804. doi: 10.1016/j.rse.2010.04.002
Maritorena S., Siegel D. A. (2005). Consistent merging of satellite ocean color data sets using a bio-optical model. Remote Sens. Environ. 94, 429–440. doi: 10.1016/j.rse.2004.08.014
Mei W., Xie S.-P. (2016). Intensification of landfalling typhoons over the northwest pacific since the late 1970s. Nat. Geosci. 9, 753–757. doi: 10.1038/ngeo2792
Menkes C. E., Lengaigne M., Lévy M., Ethé C., Bopp L., Aumont O., et al. (2016). Global impact of tropical cyclones on primary production. Glob. Biogeochem. Cycles 30, 767–786. doi: 10.1002/2015GB005214
Pan S., Shi J., Gao H., Guo X., Yao X., Gong X. (2017). Contributions of physical and biogeochemical processes to phytoplankton biomass enhancement in the surface and subsurface layers during the passage of typhoon damrey. J. Geophys. Res. Biogeosciences 122, 212–229. doi: 10.1002/2016JG003331
Pan J., Huang L., Devlin A. T., Lin H. (2018). Quantification of typhoon-induced phytoplankton blooms using satellite multi-sensor data. Remote Sens. 10, 318. doi: 10.3390/rs10020318
Peduzzi P., Chatenoux B., Dao H., De Bono A., Herold C., Kossin J., et al. (2012). Global trends in tropical cyclone risk. Nat. Clim. Change 2, 289–294. doi: 10.1038/nclimate1410
Price J. F. (1981). Upper ocean response to a hurricane. J. Phys. Oceanogr. 11, 153–175. doi: 10.1175/1520-0485(1981)011<0153:UORTAH>2.0.CO;2
Qiu D., Zhong Y., Chen Y., Tan Y., Song X., Huang L. (2019). Short-term phytoplankton dynamics during typhoon season in and near the pearl river estuary, south China Sea. J. Geophys. Res. Biogeosciences 124, 274–292. doi: 10.1029/2018JG004672
Roy Chowdhury R., Prasanna Kumar S., Chakraborty A. (2022). A study on the physical and biogeochemical responses of the bay of Bengal due to cyclone madi. J. Oper. Oceanogr. 15, 104–125. doi: 10.1080/1755876X.2020.1817659
Shang S., Li L., Sun F., Wu J., Hu C., Chen D., et al. (2008). Changes of temperature and bio-optical properties in the south China Sea in response to typhoon linglin. Geophys. Res. Lett. 35, L10602. doi: 10.1029/2008GL033502
Subrahmanyam B., Rao K. H., Srinivasa Rao N., Murty V. S. N., Sharp R. J. (2002). Influence of a tropical cyclone on chlorophyll-a concentration in the Arabian Sea. Geophys. Res. Lett. 29, 22-1-22–4. doi: 10.1029/2002GL015892
Sui Y., Sheng J., Tang D., Xing J. (2022). Study of storm-induced changes in circulation and temperature over the northern south China Sea during typhoon linfa. Cont. Shelf Res. 249, 104866. doi: 10.1016/j.csr.2022.104866
Sun L., Yang Y.-J., Xian T., Lu Z., Fu Y.-F. (2010). Strong enhancement of chlorophyll a concentration by a weak typhoon. Mar. Ecol. Prog. Ser. 404, 39–50. doi: 10.3354/meps08477
Tuleya R. E. (1994). Tropical storm development and decay: Sensitivity to surface boundary conditions. Mon. Weather Rev. 122, 291–304. doi: 10.1175/1520-0493(1994)122<0291:TSDADS>2.0.CO;2
Wang J., Tang D., Sui Y. (2010). Winter phytoplankton bloom induced by subsurface upwelling and mixed layer entrainment southwest of Luzon strait. J. Mar. Syst. 83, 141–149. doi: 10.1016/j.jmarsys.2010.05.006
Wang Y., Xiu P. (2022). Typhoon footprints on ocean surface temperature and chlorophyll-a in the south China Sea. Sci. Total Environ. 840, 156686. doi: 10.1016/j.scitotenv.2022.156686
Yang B., Hou Y., Hu P., Liu Z., Liu Y. (2015). Shallow ocean response to tropical cyclones observed on the continental shelf of the northwestern south China Sea. J. Geophys. Res. Oceans 120, 3817–3836. doi: 10.1002/2015JC010783
Ye H. J., Sui Y., Tang D. L., Afanasyev Y. D. (2013). A subsurface chlorophyll a bloom induced by typhoon in the south China Sea. J. Mar. Syst. 128, 138–145. doi: 10.1016/j.jmarsys.2013.04.010
Zhang H., He H., Zhang W.-Z., Tian D. (2021). Upper ocean response to tropical cyclones: a review. Geosci. Lett. 8, 1. doi: 10.1186/s40562-020-00170-8
Zhang Z., Wang Y., Zhang W., Xu J. (2019). Coastal ocean response and its feedback to typhoon hat) over the south China Sea: A numerical study. J. Geophys. Res. Atmospheres 124, 13731–13749. doi: 10.1029/2019JD031377
Zhang S., Xie L., Hou Y., Zhao H., Qi Y., Yi X. (2014). Tropical storm-induced turbulent mixing and chlorophyll-a enhancement in the continental shelf southeast of hainan island. J. Mar. Syst. 129, 405–414. doi: 10.1016/j.jmarsys.2013.09.002
Zhao H., Pan J., Han G., Devlin A. T., Zhang S., Hou Y. (2017). Effect of a fast-moving tropical storm washi on phytoplankton in the northwestern south China Sea. J. Geophys. Res. Oceans 122, 3404–3416. doi: 10.1002/2016JC012286
Zhao H., Tang D., Wang Y. (2008). Comparison of phytoplankton blooms triggered by two typhoons with different intensities and translation speeds in the south China Sea. Mar. Ecol. Prog. Ser. 365, 57–65. doi: 10.3354/meps07488
Zhao H., Tang D., Wang D. (2009). Phytoplankton blooms near the pearl river estuary induced by typhoon nuri. J. Geophys. Res. Oceans 114, C12027. doi: 10.1029/2009JC005384
Zhao H., Wang Y. (2018). Phytoplankton increases induced by tropical cyclones in the south China Sea during 1998–2015. J. Geophys. Res. Oceans 123, 2903–2920. doi: 10.1002/2017JC013549
Zheng G. M., Tang D. (2007). Offshore and nearshore chlorophyll increases induced by typhoon winds and subsequent terrestrial rainwater runoff. Mar. Ecol. Prog. Ser. 333, 61–74. doi: 10.3354/meps333061
Keywords: tropical cyclone, South China Sea, continental shelf, open sea, chlorophyll-a
Citation: Li Y and Tang D (2022) Tropical cyclone Wind Pump induced chlorophyll-a enhancement in the South China Sea: A comparison of the open sea and continental shelf. Front. Mar. Sci. 9:1039824. doi: 10.3389/fmars.2022.1039824
Received: 08 September 2022; Accepted: 17 November 2022;
Published: 02 December 2022.
Edited by:
Fan Wang, Institute of Oceanology, (CAS), ChinaReviewed by:
Zhongfeng Qiu, Nanjing University of Information Science and Technology, ChinaRiyanka Roy Chowdhury, Indian Institute of Technology Kharagpur, India
Copyright © 2022 Li and Tang. This is an open-access article distributed under the terms of the Creative Commons Attribution License (CC BY). The use, distribution or reproduction in other forums is permitted, provided the original author(s) and the copyright owner(s) are credited and that the original publication in this journal is cited, in accordance with accepted academic practice. No use, distribution or reproduction is permitted which does not comply with these terms.
*Correspondence: Danling Tang, lingzistdl@126.com