Effects of habitat loss on migratory shorebird community structure at stopover sites: A case study in the Yellow River Delta, China
 Houlang Duan
 Xiubo Yu1,2
 - 1Key Laboratory of Ecosystem Network Observation and Modelling, Institute of Geographic Sciences and Natural Resources Research, Chinese Academy of Sciences, Beijing, China
- 2College of Resources and Environment, University of Chinese Academy of Sciences, Beijing, China
- 3The Yellow River Delta National Nature Reserve Bureau Shandong, Dongying, Shandong, China
Coastal wetlands in China provide important stopover sites for migratory shorebird species. The loss of natural wetlands caused by land reclamation over the past few decades poses a major threat to shorebird populations. Although habitat loss at key stopover sites has been shown to lead to reductions in shorebird populations, the effects of habitat loss at specific stopover sites on shorebird populations remain unclear. Here, we used shorebird diversity indices and landscape metrics to elucidate the long-term (19952020) effects of habitat change on shorebird community structure in the Yellow River Delta, which is an important stopover site for shorebirds along the Yellow Sea coast. The results showed that the habitat area, largest patch index, mean patch area, and the aggregation index decreased over 25 years. By contrast, the number of patches and patch density increased over the same period. The richness, Shannon-Wiener index, Pielou index, and Simpson index of the shorebird community increased from 1995 to 2020, while abundance of shorebird declined by 90.14%. Declines in the abundance of species were more pronounced in larger-bodied ones than in smaller-bodied species (T=1.156, df=42, p=0.02). On the other hand, there were no significant differences in the decline in the abundance of threatened species and non-threatened species (T=-0.483, df=42, p=0.632) and coastal specialist species and generalist/inland specialist species (T=-1.197, df=42, p=0.239). The decrease in mean patch area significantly contributed to the reduction in abundance of shorebirds (N=6, p=0.01), and its effects were more pronounced on larger-bodied ones than on smaller-bodied species (T=-2.113, df=42, p=0.04). These results suggest that habitat loss in the Yellow River Delta has contributed to declines in shorebird populations and that larger-bodied ones are more sensitive to habitat change than smaller-bodied species. Existing wetlands are in urgent need of conservation, and further land reclamation in this region should be avoided. In addition, the development of conservation plans for coastal wetlands requires consideration of variation in the responses of different functional groups to habitat change.
1. Introduction
China has over 18,000 km of coastline spanning 11 provinces, municipalities, and autonomous regions, and this coastline supports 40% of the Chinese population; it is also an economically important region that accounts for 58.6% of China’s Gross Domestic Product (Yu and Zhang, 2020). Aside from their importance as natural resources, coastal wetlands are key components of the landscape and perform important ecological functions (Zhou et al., 2020). Coastal wetlands in China provide key habitats for migratory waterbirds and biodiverse groups of neritic organisms (Bai et al., 2015).
China’s coasts are considered key habitats for biodiversity conservation. These habitats are continually being lost because of land reclamation and the invasion of alien species driven by economic development (Paulson Institute, 2016; Duan et al., 2022a). According to the second national survey of wetland resources in China in 2014 (SFA, 2014), the surface of coastal wetlands in China has decreased by 21.91% since the first national survey of wetland resources in 2003.
Waterbirds are important indicators of wetland ecosystem health, and their populations are highly sensitive to changes in coastal wetlands (Duan et al., 2020; Wang et al., 2022). Shorebird populations in particular are more sensitive to disturbance compared with other groups of waterbirds (Duan et al., 2022b). Previous surveys have shown that many shorebird populations are declining rapidly because of reductions in tidal flats along the Yellow Sea coast (Studds et al., 2017; Chan et al., 2019). However, these surveys have generally been conducted in wintering regions. A recently published study conducted at a broad geographical scale has shown that the relationship between coastal wetland loss and shorebird population change is weak according to stopover site data collected in the Yellow and Bohai Seas; although large changes in the abundances of shorebirds were observed, bird communities were generally similar between periods at the same sites (Wang et al., 2022). This suggests that the area of the stopover sites on which shorebird populations depend is small; thus, clarifying the relationship between coastal wetland loss and changes in shorebird populations requires studies conducted over small spatial scales.
In addition, quantifying the responses of waterbird populations to habitat changes caused by coastal wetland loss is important for determining which conservation actions need to be taken to mitigate declines in waterbird biodiversity. A previous study has shown that the efficiency of the conservation of waterbird populations and their habitat is enhanced when variation in the response of waterbird functional groups to habitat change is considered (Li et al., 2022). An increasing number of studies have shown that threatened shorebird species, larger-bodied species, and coastal specialist species are less likely to stopover or feed in artificial wetlands (Jackson et al., 2020). Whether the effects of changes in coastal habitats vary among functional groups remains unclear, yet this information is critically important for the development of habitat management plans.
The Yellow River Delta (YRD) is the largest estuarine wetland along the coasts of the Yellow and Bohai Seas. Shorebird populations of more than 20 species in the YRD meet the Ramsar 1% criterion (exceeding 1% of the total population in the flyway) (Xia et al., 2016). There is an inevitable conflict between land development and habitat conservation (Hou et al., 2021). We used shorebird survey data and land-use data to characterize the effects of long-term habitat change (1995–2020) on shorebird populations in the YRD. We hypothesized that habitat changes pose a more serious threat to threatened species, larger-bodied species, and coastal specialist species than to non-threatened species, smaller-bodied species, and generalist/inland specialist species. The findings of this study provide new insights that could aid the conservation and management of key shorebird habitats.
2. Materials and methods
2.1. Study area
This study was conducted in the YRD along the Dongying coast (37°35′N–38°12′N, 118°33′E–119°20′E), which is an important stopover site for migratory shorebirds along the East Asian–Australasian Flyway (EAAF) migratory route (Figure 1). The total area of YRD is 4785.5 km2, and represents only 4.5% of Yellow and Bohai Seas. It is a Ramsar site and includes the YRD National Nature Reserve, which was established in 1992. This region includes multiple habitat environment, i.e. tidal flats, estuarine delta, saltpan and mariculture. It hosts globally threatened species, such as the Eastern Curlew (Numenius madagascariensis) and Great Knot (Calidris tenuirostris), and the number of total shorebirds migrating northward through this region annually is greater than 130,000 (Li et al., 2018). Most coastal wetlands have been converted to artificial wetlands for mariculture, saltpans, and construction land because of land reclamation (Ma et al., 2019). This has had a significant effect on the surface and quality of shorebird habitat and thus the stability of shorebird populations (Hou et al., 2021).
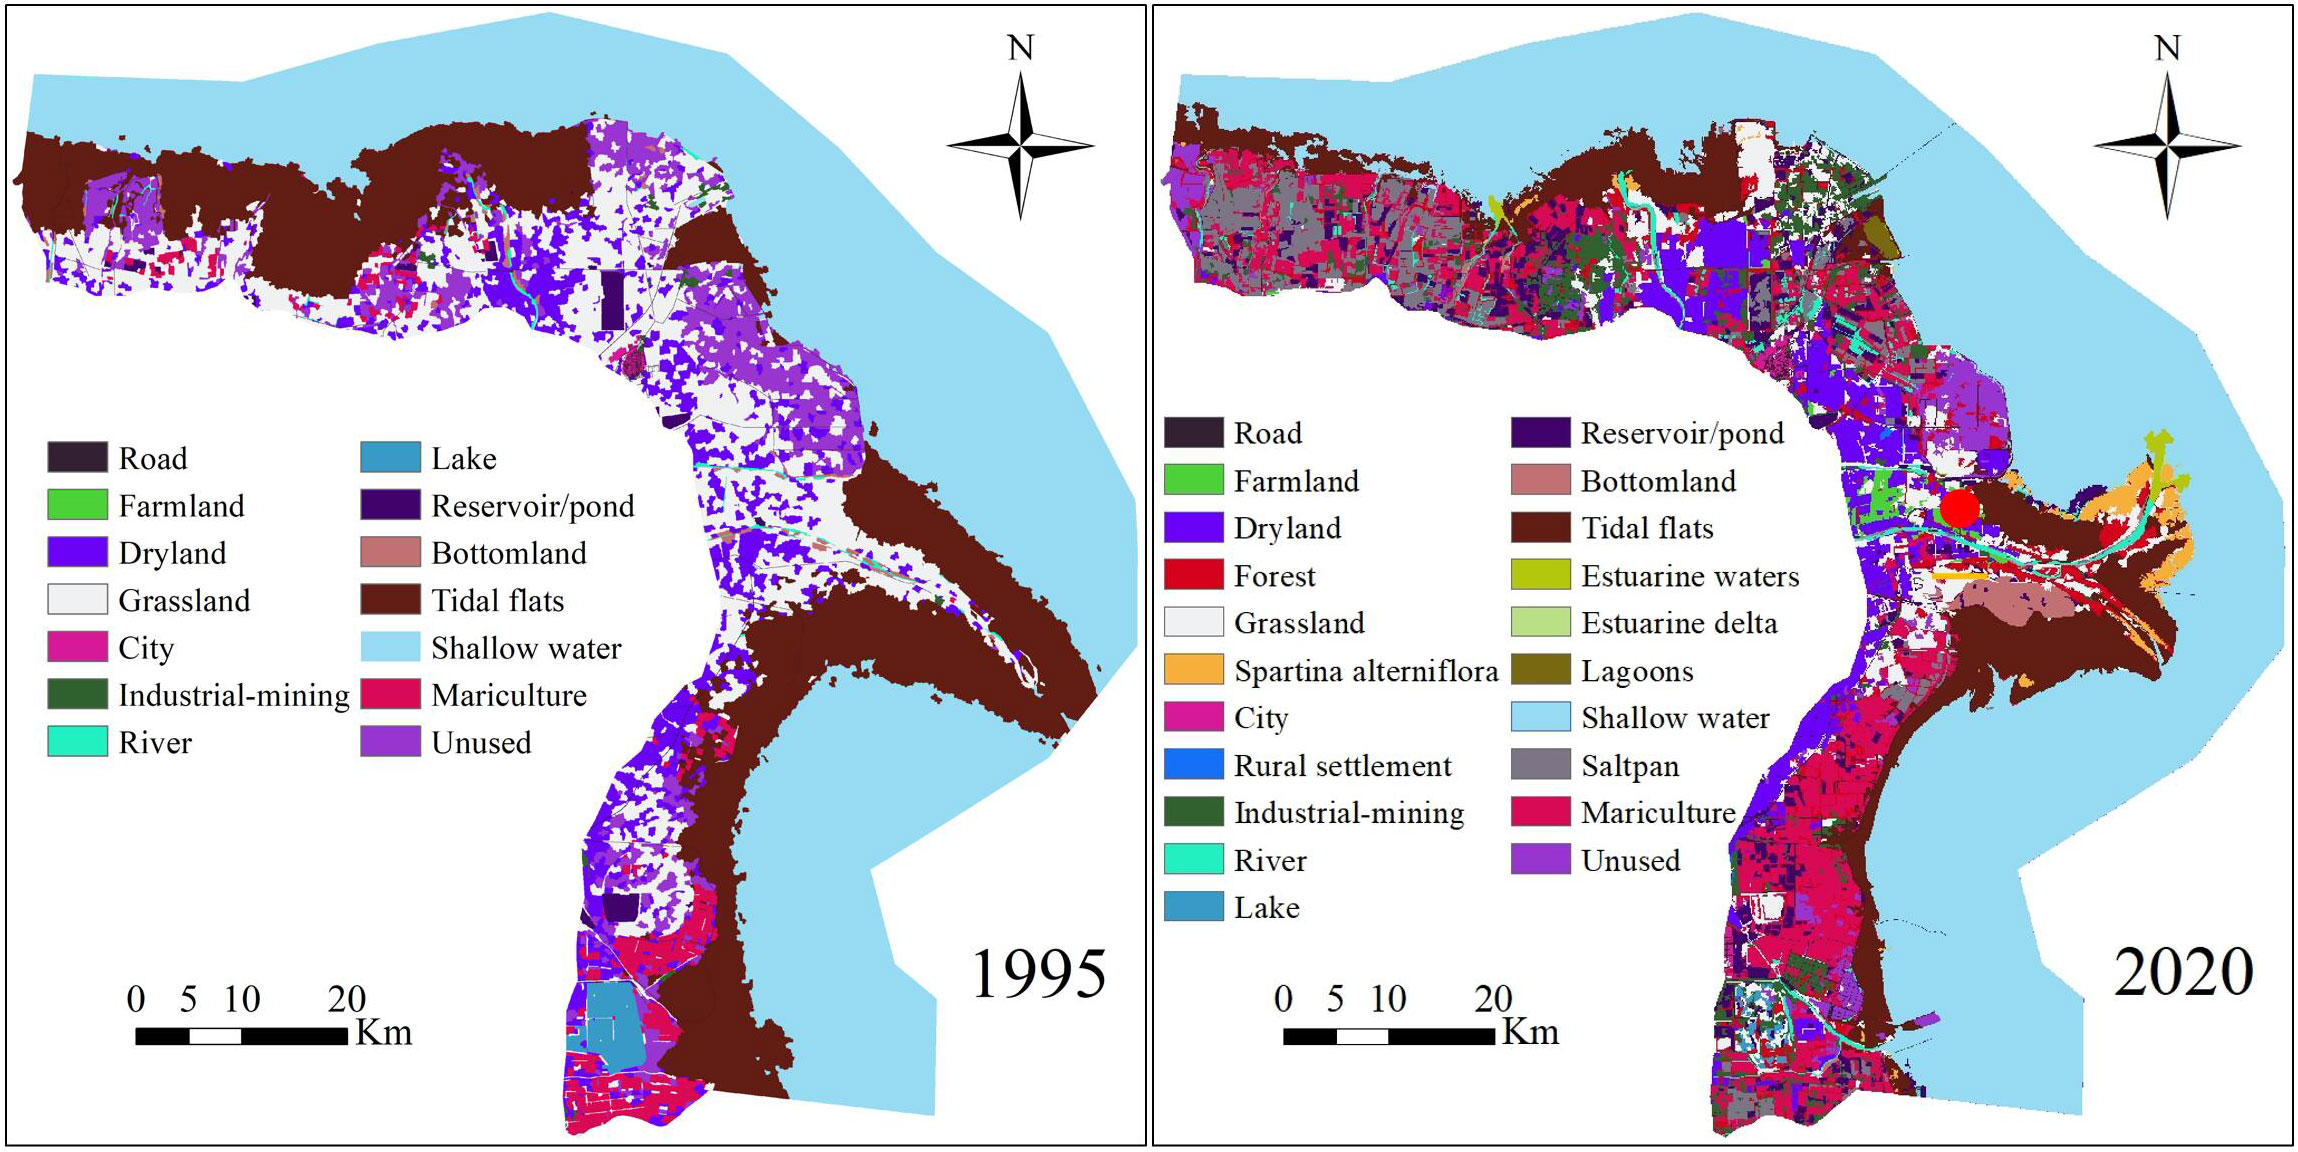
Figure 1 Study area of Yellow River Delta and its land use types in 1995 and 2020.
2.2. Land cover data
Land cover maps of the YRD for 1995, 2000, 2005, 2010, 2015, and 2020 were interpreted using the object-oriented classification method on the basis of Landsat TM/ETM and Landsat 8 OLI data at a scale of 1:100000, and the spatial resolution of these data was 30 m × 30 m. Images with total cloud cover less than 5% were selected from the Geospatial Data Cloud (www.gscloud.cn/sources/) and the USGS Global Visualization Viewer (GloVis) (http://glovis.usgs.gov). The classification system for the land cover map was the same as that used in Di et al. (2014). Given that alien plant Spartina alterniflora is a major threat to shorebird species (Jackson et al., 2021), the distribution of S. alterniflora in 2010, 2015, and 2020 for the YRD (S. alterniflora has been spreading since 2010 [Yu et al., 2022]) at a spatial resolution of 30 m × 30 m was interpreted using object-based image analysis, support vector machine methods, and field investigations on the basis of Landsat OLI. S. alterniflora distribution data were obtained from the Northeast Institute of Geography and Agroecology, Chinese Academy Sciences (Mao et al., 2019). We used the “Mosaic To New Raster” tool in ArcGIS 10.5 to merge the S. alterniflora distribution layer with the land cover maps for 2010, 2015, and 2020. The land cover data in YRD for 1995 and 2020 see (Figure 1).
2.3. Identification of shorebird habitat
2.3.1. InVEST habitat quality model
The Natural Capital Project has developed a decision-making support software known as the InVEST model (Integrated Valuation of Environmental Services and Tradeoffs; version 3.7.0), and this was used to assess the value of ecosystem services and biodiversity (Hong et al., 2021). The habitat module of the InVEST model was used to assess habitat quality through consideration of habitat type and threat factors (Sharp et al., 2016). The specific equation is below:
where Qxj is the habitat quality in grid cell x with land type j, Hj represents the habitat suitability in land type j, Dxj represents the effects of threat factors on grid cell x with land type j, and z and k are the scaling constant and half-saturation constant, which were 2.5 and 0.5 respectively considered as frequently used value in habitat module of InVEST model (Sharp et al., 2016).
2.3.2. Input data
The InVEST habitat model was affected by habitat type, habitat suitability, threat sources, the sensitivity of habitat to threat factors, threat characteristics, and habitat accessibility. (1) Habitat type for YRD in 1995, 2000, 2005, 2010, 2015, and 2020 was determined at the level of the grid cell at a resolution of 30 m × 30 m, and information on habitat type was extracted from land cover data between 1995 and 2020. Habitat types included farmland, reservoirs/ponds, bottomlands, tidal flats, estuarine waters, estuarine deltas, saltpans, mariculture, and unused land. (2) Habitat suitability was between 0 (lowest suitability) and 1 (highest suitability) and was determined following the method of Li et al. (2018). The habitat suitability of farmland, saltpan, and mariculture was adjusted on the basis of the field investigation. Habitat suitability can be found in Supplementary Table 1, and input Files was in.csv format.
(3) Potential threats to habitat include construction land, roads, invasion of alien species, and the human population. Thus, cities, rural settlements, industrial mining, mariculture, roads, unused land, and the presence of Spartina alterniflora are all considered threat sources. These were extracted from land cover data between 1995 and 2020 at a spatial resolution of 30 m × 30 m. (4) The sensitivity of habitat to threat factors indicates the relative sensitivity of habitat to each threat source. (5) Threat characteristics include the relative intensity, maximum disturbance distance, and type of distance-based decay. Specific parameter values for the sensitivity of habitat to threat factors and threat characteristics were collected from Li et al. (2018) and are provided in Supplementary Table 1; both input files were in.csv format.
(6) Habitat accessibility indicates the relative accessibility of the boundary of protected areas to each threat source. YRD National Nature Reserve was established in 1992 with the aim of reducing the intensity of human activity and conserving biodiversity. YRD National Nature Reserve was divided into three parts on the basis of permissible levels of human activity: the core area, experimental area, and buffer zone. Habitat accessibility data were obtained from the shapefile boundaries of the core area, experimental area, and buffer zone in ArcGIS 10.5. We set the attribute values for the shapefiles of the core area, experimental area, and buffer zone to 0.1, 0.5, and 1.0, respectively, with higher values indicating greater habitat accessibility. The shapefile boundaries of the core area, experimental area, and buffer zone were acquired from the Institute of Geographic Sciences and Natural Resources Research, Chinese Academy of Sciences (http://english.igsnrr.cas.cn/).
2.3.3. Habitat quality assessment
We ran the habitat module of the InVEST model (v3.7.0) using the above input data to estimate the distribution of shorebird habitat in 1995, 2000, 2005, 2010, 2015, and 2020. Habitat quality ranged from 0 to 1, with values closer to 1 indicating high habitat quality. We reclassified the habitat quality values into a binary format in which areas with habitat quality above and below 0.7 were considered suitable and unsuitable shorebird habitat, respectively (Sharp et al., 2016).
2.4. Measurements of landscape metrics
Landscapes can be defined by the spatial relationships among all components including landscape composition and landscape configuration. Landscape composition is mainly related to the presence and area of patches, and landscape configuration refers to the spatial distribution and spatial character of patches within the landscape. They are usually calculated using a spatial pattern analysis program in FRAGSTATS (Kevin and Marks, 1995).
The vector and raster versions of the FRAGSTATS program are used to process shapefiles and raster files, respectively. This study used the raster version to calculate landscape metrics. Raster images of shorebird habitat in.tif format in 1995, 2000, 2005, 2010, 2015, and 2020 were exported using ArcGIS 10.5 and used as the input data in the FRAGSTATS program.
Landscape composition metrics and landscape configuration metrics of shorebird habitat in 1995, 2000, 2005, 2010, 2015, and 2020 for the YRD were calculated using FRAGSTATS (v4.2.1). Landscape composition metrics included total area (TA), largest patch index (LPI), and mean patch area (AREA_MN). Landscape configuration metrics included number of patches (NP), patch density (PD), and the aggregation index (AI). Definitions and methods used to calculate these metrics are provided in Yohannes et al. (2020). TA is the total area of the landscape in hectares. LPI is the proportion of the largest patch to the total area of the landscape. NP represents the number of patches in the landscape. AREA_MN is the average area of patches in the landscape in hectares.
PD represents the sparseness of the patch distribution in the landscape, and it can be calculated by equation (2):
AI represents the connectivity between patches in the landscape, and larger AI values indicate greater aggregation. It was calculated using equation (3):
where gii is the number of similar adjacent patches in the landscape.
We inputted the raster files (.tif format) of shorebird habitat between 1995 and 2020 into FRAGSTATS software (v4.2.1) and calculated the landscape metrics TA, LPI, AREA_MN, NP, PD, and AI at the landscape level. All results were output as.csv files.
2.4.1. Variation in landscape metrics
For each landscape metric, we calculated the percentage rate of change to quantify variation between 1995 and 2020. It was calculated using equation (4):
where LMchange is the percentage rate of change in each landscape metric from 1995 to 2020; LM2020 and LM1995 represent the landscape metric values in 2020 and 1995, respectively.
2.5. Shorebird data collection and processing
2.5.1. Shorebird data
Shorebird surveys in 2005, 2010, 2015, and 2020 for the YRD were conducted once a month by experienced observers from the YRD National Nature Reserve Management Bureau and Dongying City Bird Watching Association. In addition, shorebird population data for the peak of northward migration in March to May 1995 and 2000 were collected from Barter (2002). Generally, field surveys in the two different survey periods were conducted in the same regions during the daytime on sunny days. The number of shorebird species observed in the YRD is highest during the northward migration period according to previous studies (Bai et al., 2015) therefore, only survey data collected between March and May were compared. For each shorebird species, the highest number of observed individuals between March and May was used as the abundance for that species in each year. Eventually, we acquired the abundance of each shorebird species in 1995, 2000, 2005, 2010, 2015, and 2020.
2.6. Calculation of the diversity index
2.6.1. Diversity index measurement
We calculated several shorebird diversity indices, i.e. richness, abundance, Shannon Wiener index (SHDI), Pielou index (E), and Simpson’s Index (D) in 1995, 2000, 2005, 2010, 2015, and 2020. The formulas for SHDI, E, and D are shown below:
where pi is the proportion of the abundance of ith shorebird species of the total abundance in the YRD, and S is the richness.
2.6.2. Change in diversity indices
We calculated differences from 1995 to 2020 in richness, abundance, SHDI, E, and D as follows:
where DIchange represents the difference in each diversity index between 1995 and 2000. DI2020 and DI1995 are the diversity indices in 2020 and 1995, respectively.
2.7. Relationships between landscape metrics and diversity indices
2.7.1. Test at the community level
To determine how changes in habitat affected shorebird diversity, we conducted partial Mantel tests. A partial Mantel test measures the correlation between two matrices containing measures of distance (Cox and Hinkley, 1974). It has been widely used to characterize the effects of environmental change on communities. Partial Mantel tests are more effective than other types of correlation analyses when sample sizes are low.
In this study, distance matrices were made using six predictor variables, TA, LPI, AREA_MN, NP, PD, and AI, in 1995, 2000, 2005, 2010, and 2020; distance matrices were also made using five response variables, i.e. richness, abundance, SHDI, E, and D, in 1995, 2000, 2005, 2010, and 2020. Partial Mantel tests were run using the linKET package in R version 4.0.4 (Huang, 2021). Detailed code is available at Figshare (http://doi.org/10.6084/m9.figshare.21406911).
2.7.2. Test at the functional group level
The abundance of threatened species, larger-bodied species, and coastal specialist species is lower than the abundance of non-threatened species, smaller-bodied species, and generalist/inland specialist species in artificial wetlands according to a previous study (Jackson et al., 2020). We thus hypothesized that threatened species, larger-bodied species, and coastal specialist species are more vulnerable to the effects of habitat change.
We divided all shorebird species into three sets of two functional groups: threatened species and non-threatened species, larger-bodied species and smaller-bodied species, and coastal specialist species and generalist/inland specialist species. We defined threatened species as globally threatened species, including critically endangered species, endangered species, vulnerable species, and near-threatened species, and non-threatened species as least concern species. The threatened status of shorebird species was determined using the IUCN Red List (https://www.iucnredlist.org/; IUCN, 2022). Jackson et al. (2020) reported that shorebird species with body mass less than 250 g were more likely to feed in artificial wetlands; we divided shorebird species into two groups, larger-bodied species (i.e., species with body mass greater than 250 g) and smaller-bodied species (i.e., species with body mass less than 250 g). Coastal specialist species and generalist/inland specialist species were classified according to Jackson et al. (2020). Detailed species lists for these six functional groups can be found in Supplementary Table 2.
We calculated changes in the abundance of each species between 1995 and 2020, and using independent two-sample tests in SPSS 22.0 to compare differences in the magnitude of change between functional groups. We also conducted Pearson correlation analysis in SPSS 22.0 to determine the correlation coefficients between AREA_MN and the abundance between 1995 and 2020 for each species at the functional group level. We used independent two-sample tests in SPSS 22.0 to compare differences in correlation coefficients between functional groups. The magnitude of the change and correlation coefficients in the abundance of threatened species, larger-bodied species, and coastal specialist species was greater than that in the abundance of non-threatened species, smaller-bodied species, and generalist/inland specialist species, respectively. We thus suspect that habitat change has pronounced effects on threatened species, larger-bodied species, and coastal specialist species.
3. Results
3.1. Landscape metrics
Shorebird habitats in the Yellow River Delta (YRD) between 1995 and 2020 were mainly distributed along the coastal region according to the InVEST model (Figure 2). Habitat TA and LPI increased initially from 1995 to 2000 and then declined gradually between 2000 and 2020 (Table 1). Habitat total area (TA), largest patch index (LPI) declined by 34.99% and 58.87%, respectively, from 1995 to 2020 (Table 1). Mean patch area (AREA_MN) and aggregation index (AI) declined from 1995 to 2005, increased between 2005 and 2010, and then declined gradually from 2010 to 2020. Generally, AREA_MN decreased by 88.10%, and AI decreased by 2.65% between 1995 and 2020 (Table 1).
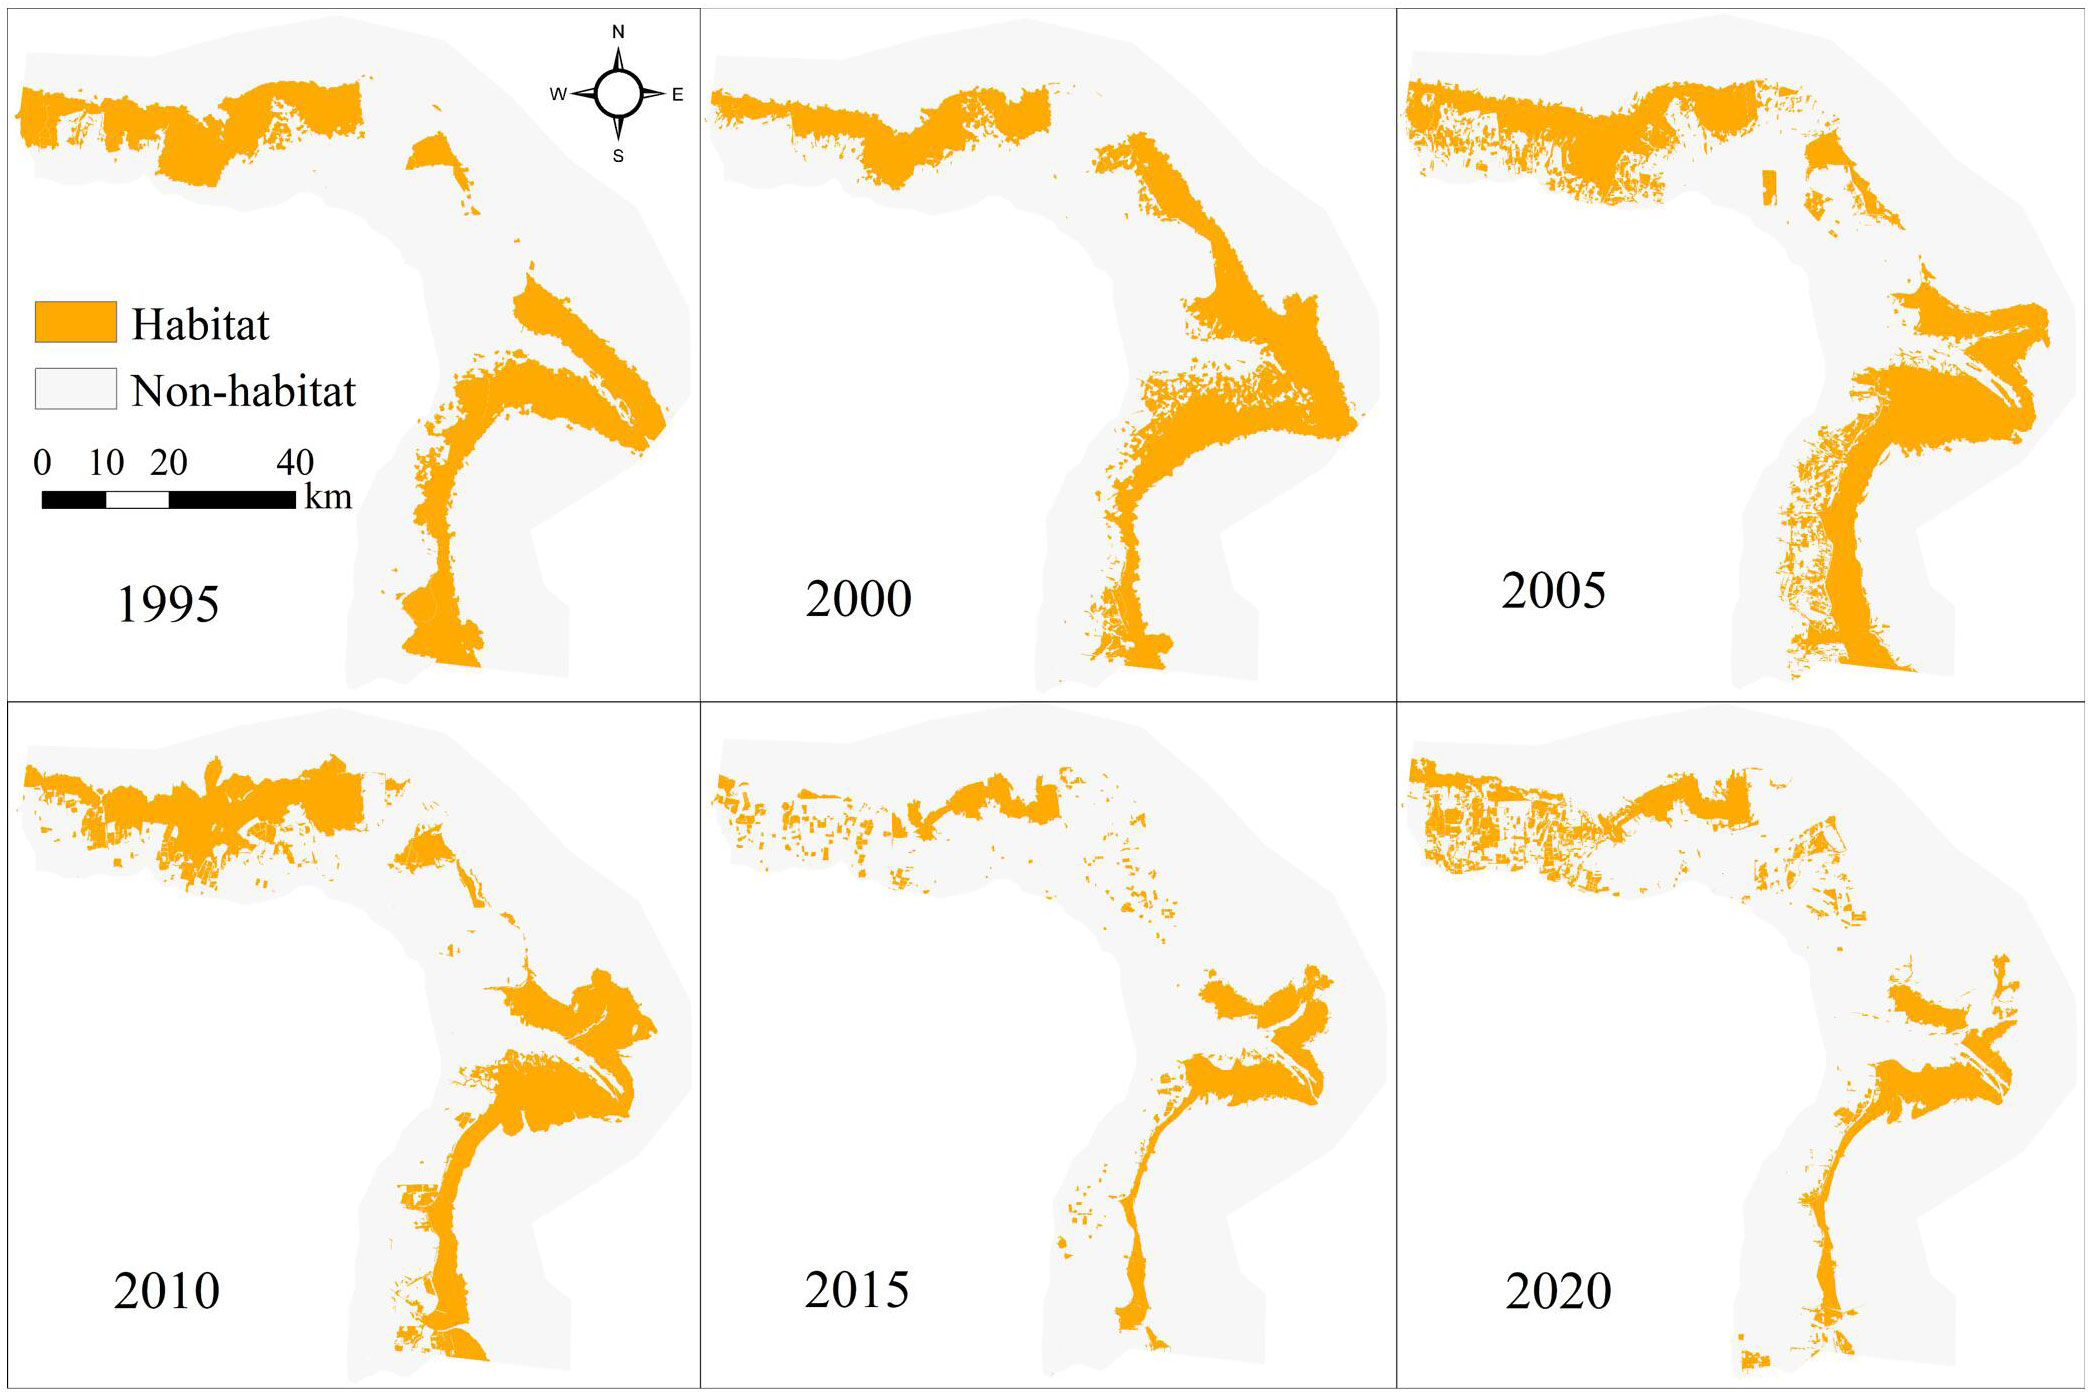
Figure 2 The distribution of shorebird habitat in the Yellow River Delta between 1995 and 2020 according to the InVEST model.
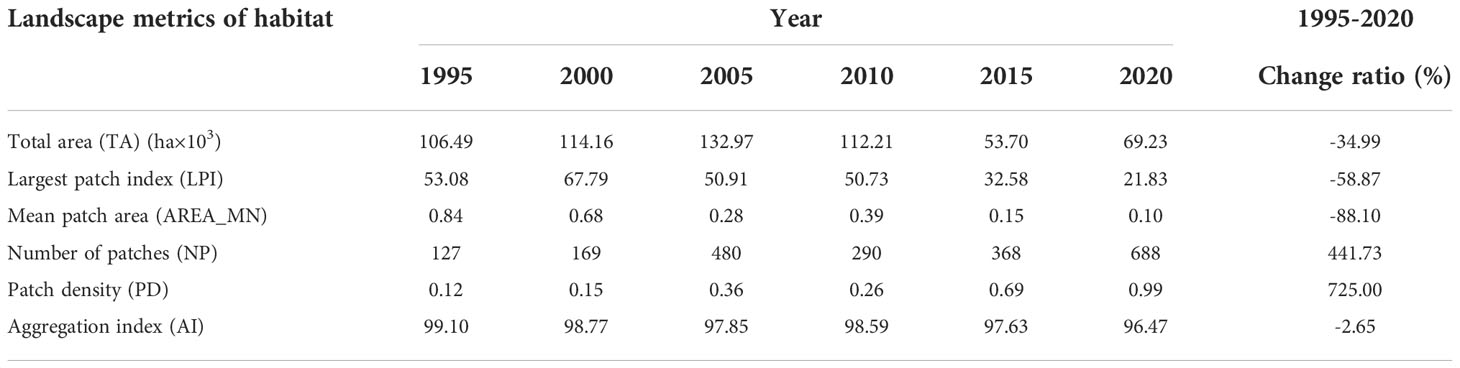
Table 1 Variation in the landscape metrics of shorebird habitat in the Yellow River Delta between 1995 and 2020.
Number of patches (NP) and patch density (PD) increased by 441.73% and 725.00%, respectively, between 1995 and 2020. NP and PD increased initially from 1995 to 2005, declined from 2005 to 2010, and then increased gradually between 2010 and 2020 (Table 1).
3.2. Shorebird community structure
3.2.1. Observed shorebirds
A total of 45 shorebird species from 4 orders and 6 families were observed between 1995 and 2020, including 13 globally threatened species and 32 non-threatened species. A total of eight nationally protected species (NPS) were observed, including 1 NPS-Class I species, Nordmann’s Greenshank (Tringa guttifer), and 7 NPS-Class II species, Eurasian Curlew (Numenius arquata), Asian Dowitcher (Limnodromus semipalmatus), Eastern Curlew, Great Knot, Ruddy Turnstone (Arenaria interpres), Broad-billed Sandpiper (Limicola falcinellus), and Little Curlew (Numenius minutus). A total of 17 shorebird species between 1995 and 2020 (37.8%) met the Ramsar 1% criterion (exceeding 1% of the total population in the flyway) (Table 2).
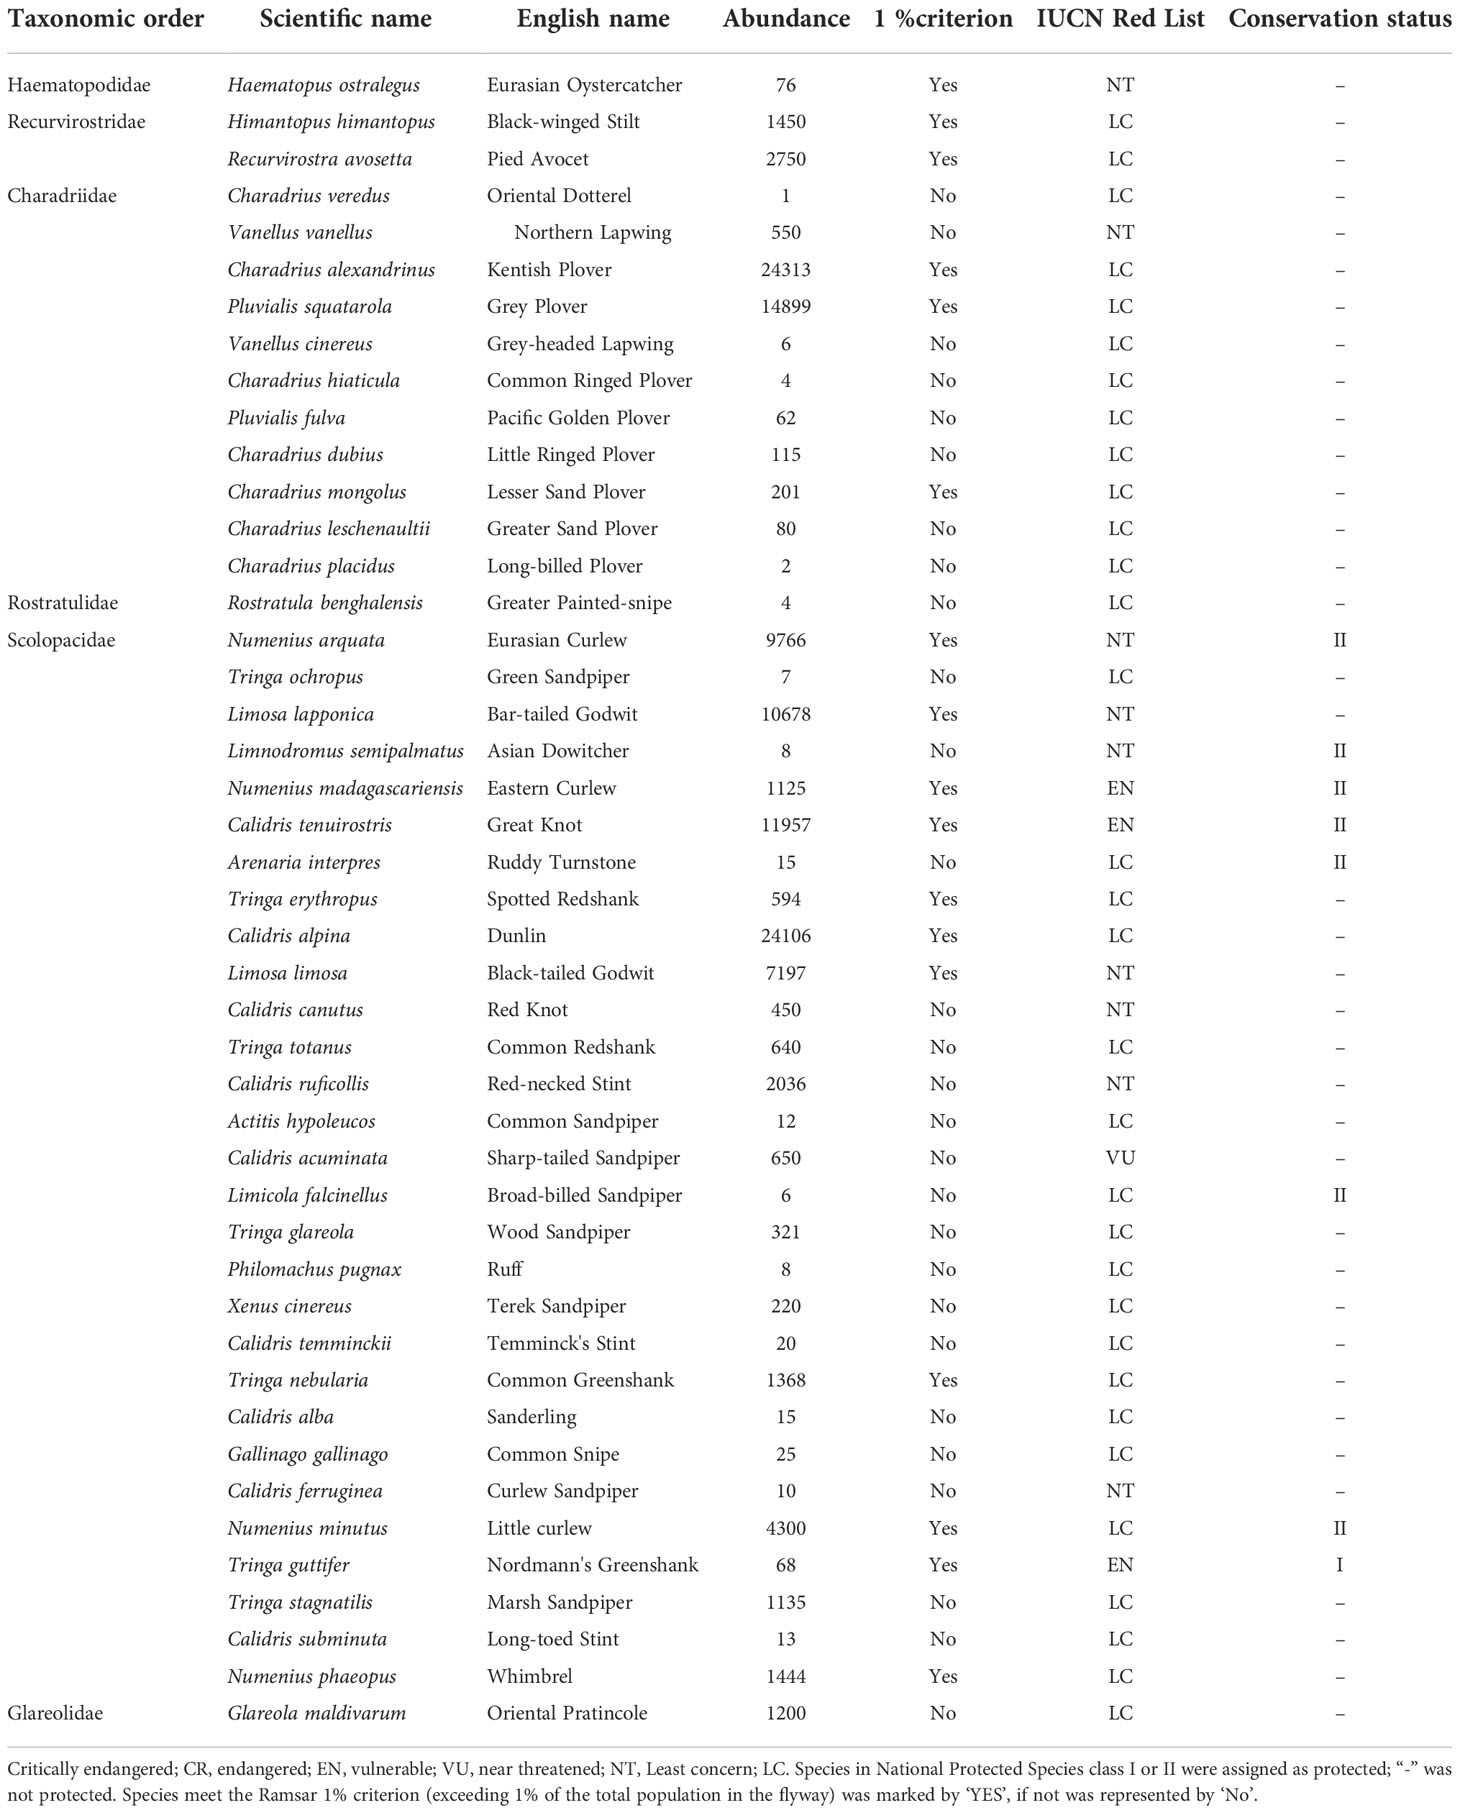
Table 2 Maximum abundance of shorebirds and their IUCN Red List and conservation status throughout the 25-year survey period.
3.3. Variation in diversity indices
From 1995 to 2020, the richness, Shannon-Wiener index (SHDI), Pielou index (E), and Simpson index (D) increased by 2.63%, 17.60%, 16.77%, and 2.96%, respectively, and no significant changes were observed in any of these variables. By contrast, the abundance of shorebird species declined sharply from 1995 to 2020, and the overall decline in the abundance over this period was 90.14% (Table 3). The abundance of 19 shorebird species declined, including the Grey Plover (Pluvialis squatarola, 98.66% reduction), Dunlin (Calidris alpina, 98.59% reduction), Eastern Curlew (98.05% reduction), Lesser Sand Plover (Charadrius mongolus, 98.01% reduction), Kentish Plover (Charadrius alexandrinus, 97.74% reduction), Bar-tailed Godwit (Limosa lapponica, 96.72% reduction), Whimbrel (Numenius phaeopus, 96.26% reduction), Little Curlew (95.99% reduction), Common Greenshank (Tringa nebularia, 95.73% reduction), Great Knot (94.48% reduction), Spotted Redshank (Tringa erythropus, 88.89% reduction), Marsh Sandpiper (Tringa stagnatilis, 88.19% reduction), Eurasian Oystercatcher (Haematopus ostralegus, 81.58% reduction), Red-necked Stint (Calidris ruficollis, 81.54% reduction), Black-tailed Godwit (Limosa limosa, 69.43% reduction), Eurasian Curlew (67.67% reduction), Common Sandpiper (Actitis hypoleucos, 66.67% reduction), Wood Sandpiper (Tringa glareola, 52.63% reduction), and Ruff (Philomachus pugnax, 52.63% reduction) (Figure 3).
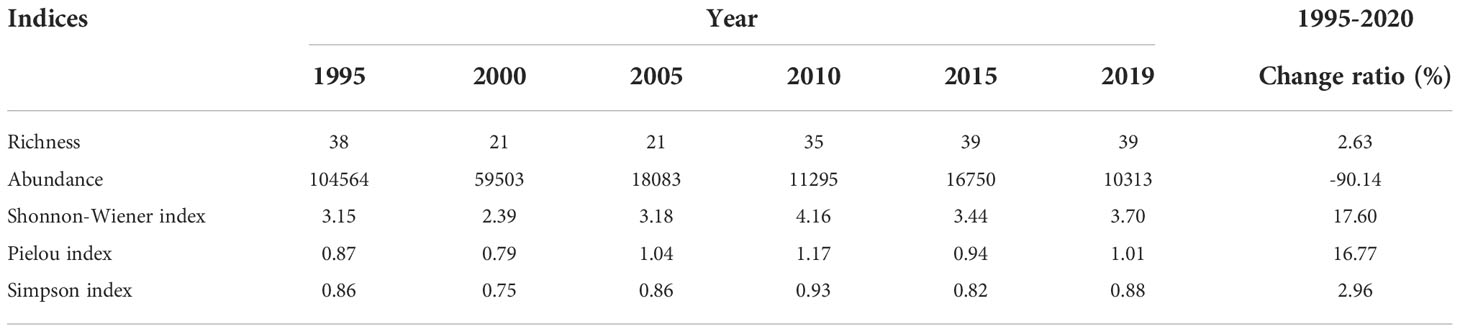
Table 3 Changes in richness, abundance, Shannon-Wiener index, Pielou index, and Simpson index between 1995 and 2020 in the Yellow River Delta.
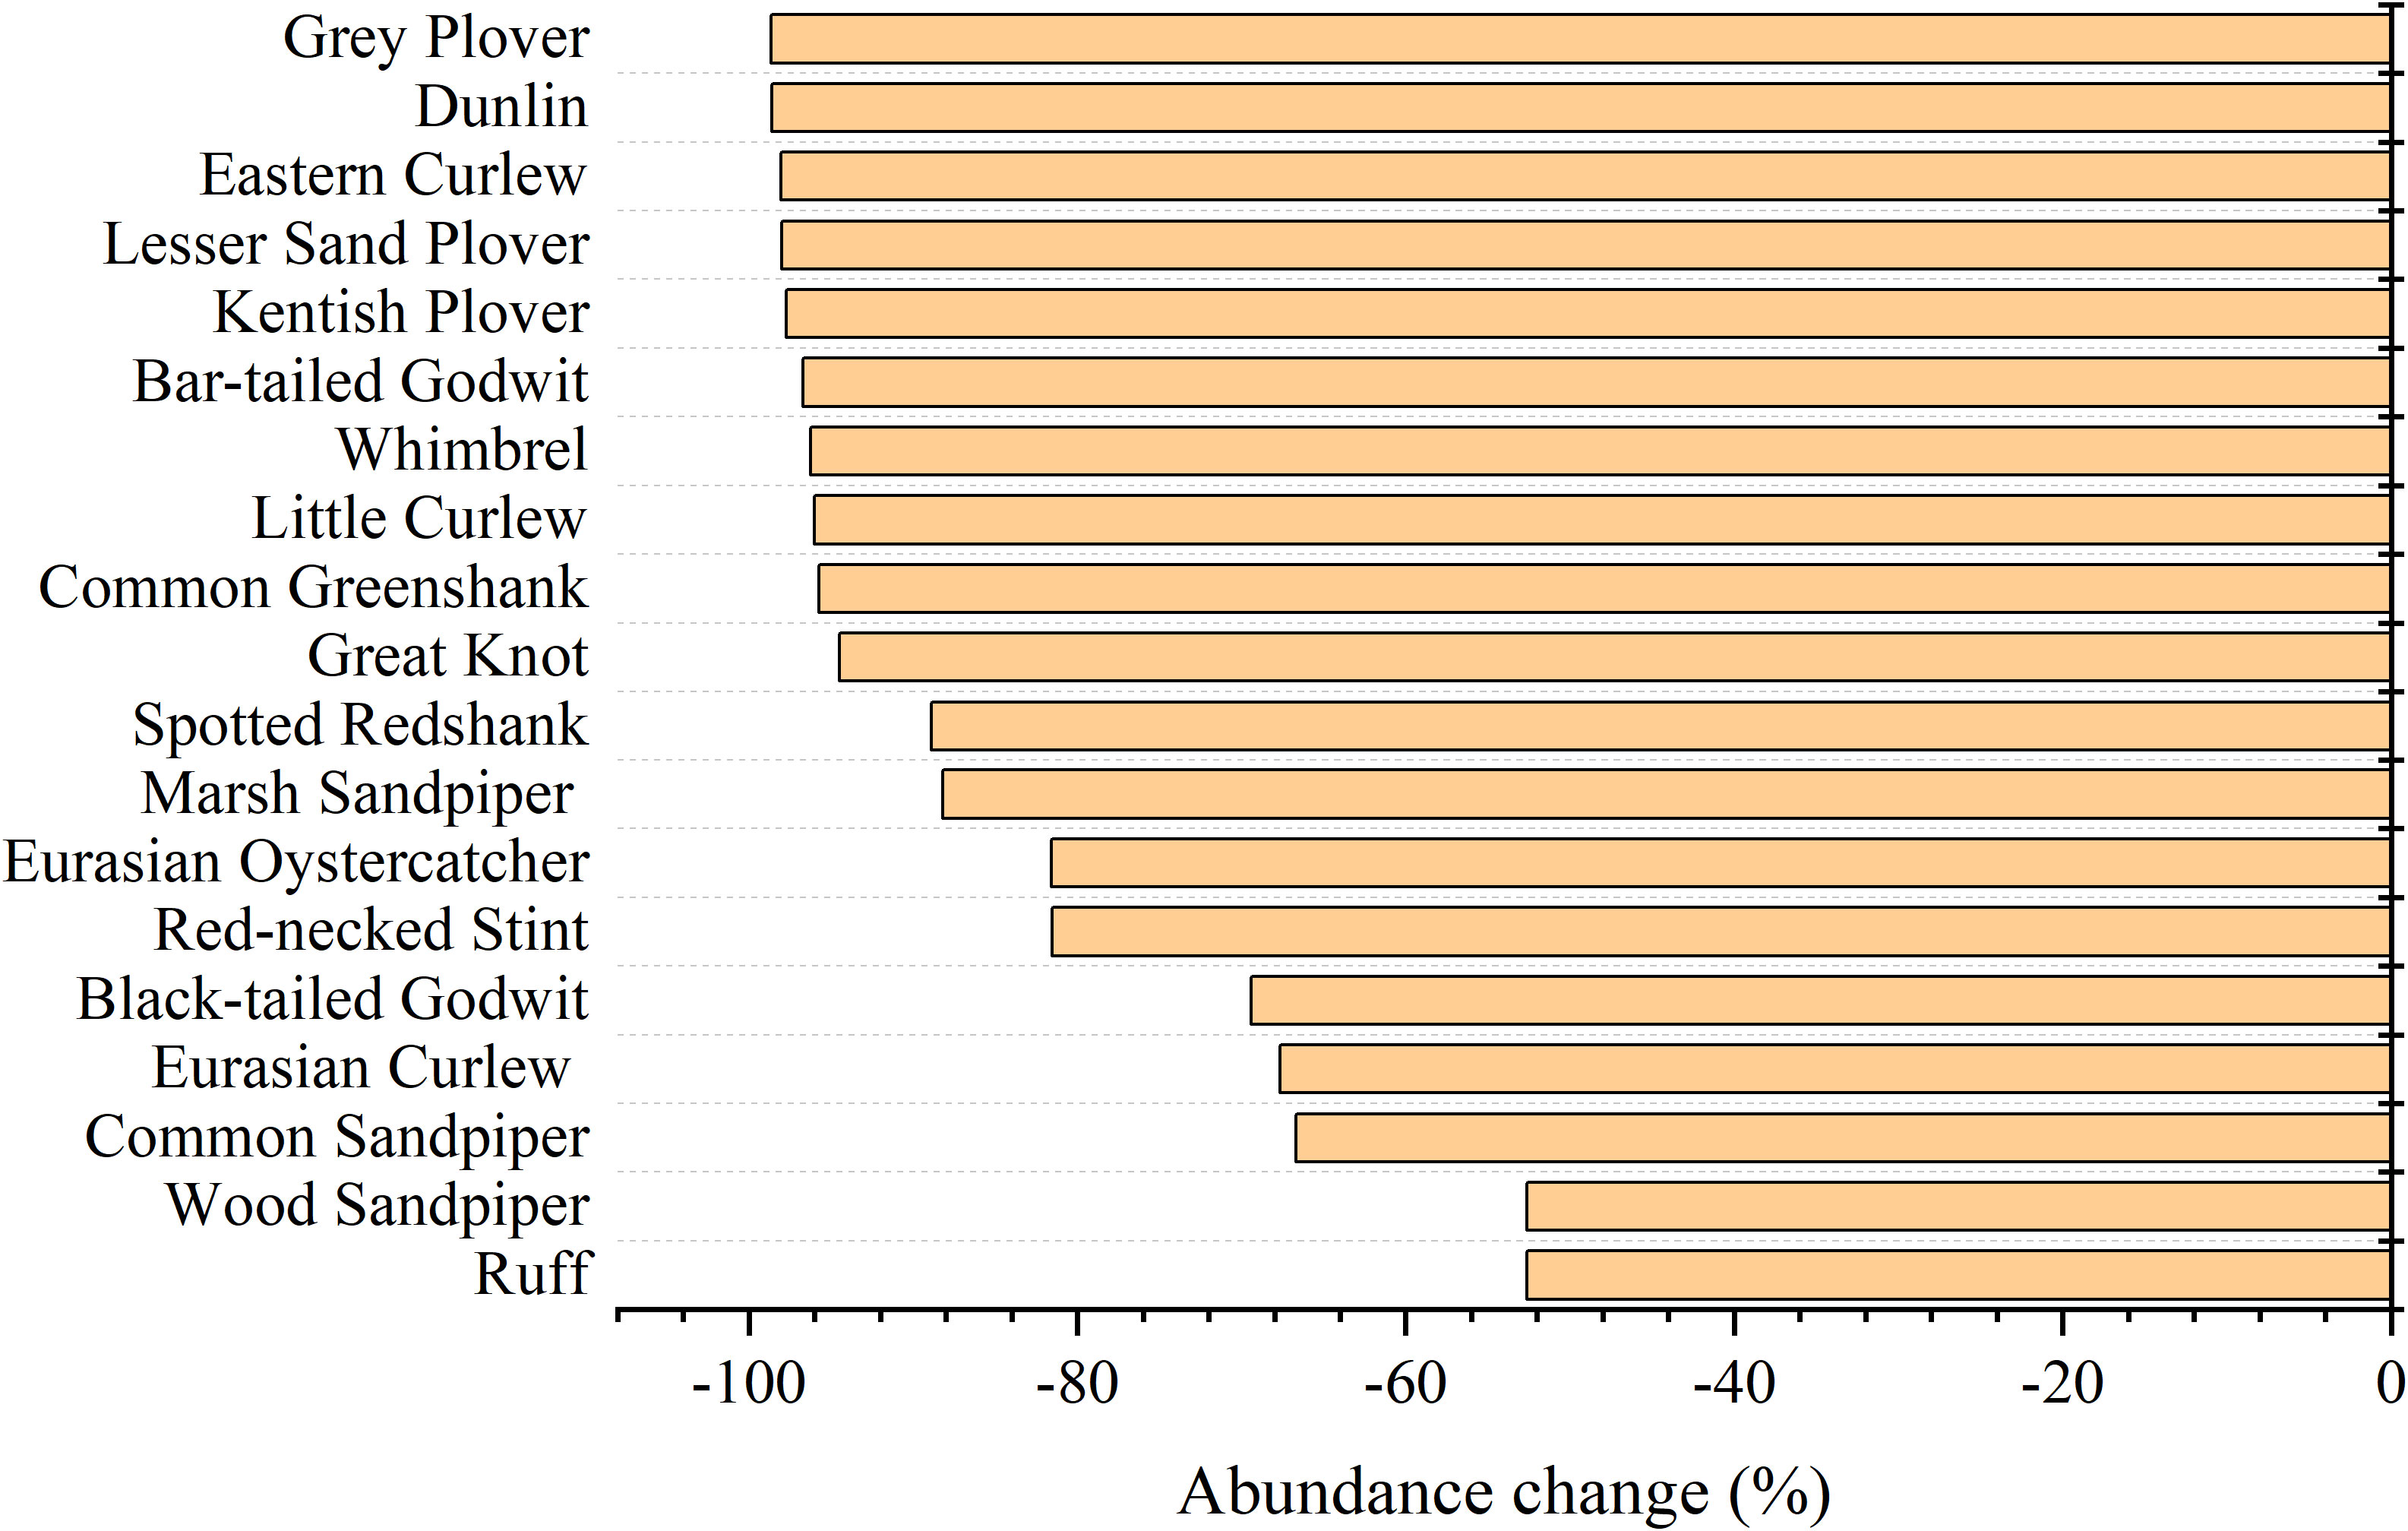
Figure 3 Changes in the abundance of shorebird species in the Yellow River Delta from 1995 to 2020.
3.4. Responses of shorebird community structure to habitat change
At the community level, there was a significant positive relationship between the AREA_MN of shorebird habitat and the abundance of shorebird species (N=6, p=0.01) (Figure 4). This result indicated that decreases in the AREA_MN of shorebird habitat from 1995 to 2020 contributed to reductions in the abundance of species. In addition, the AREA_MN of shorebird habitat was not significantly related to other diversity indices including richness, SHDI, E, and D. There were no significant relationships of the landscape metrics TA, LPI, NP, PD, and AI with richness, abundance, SHDI, E, and D.
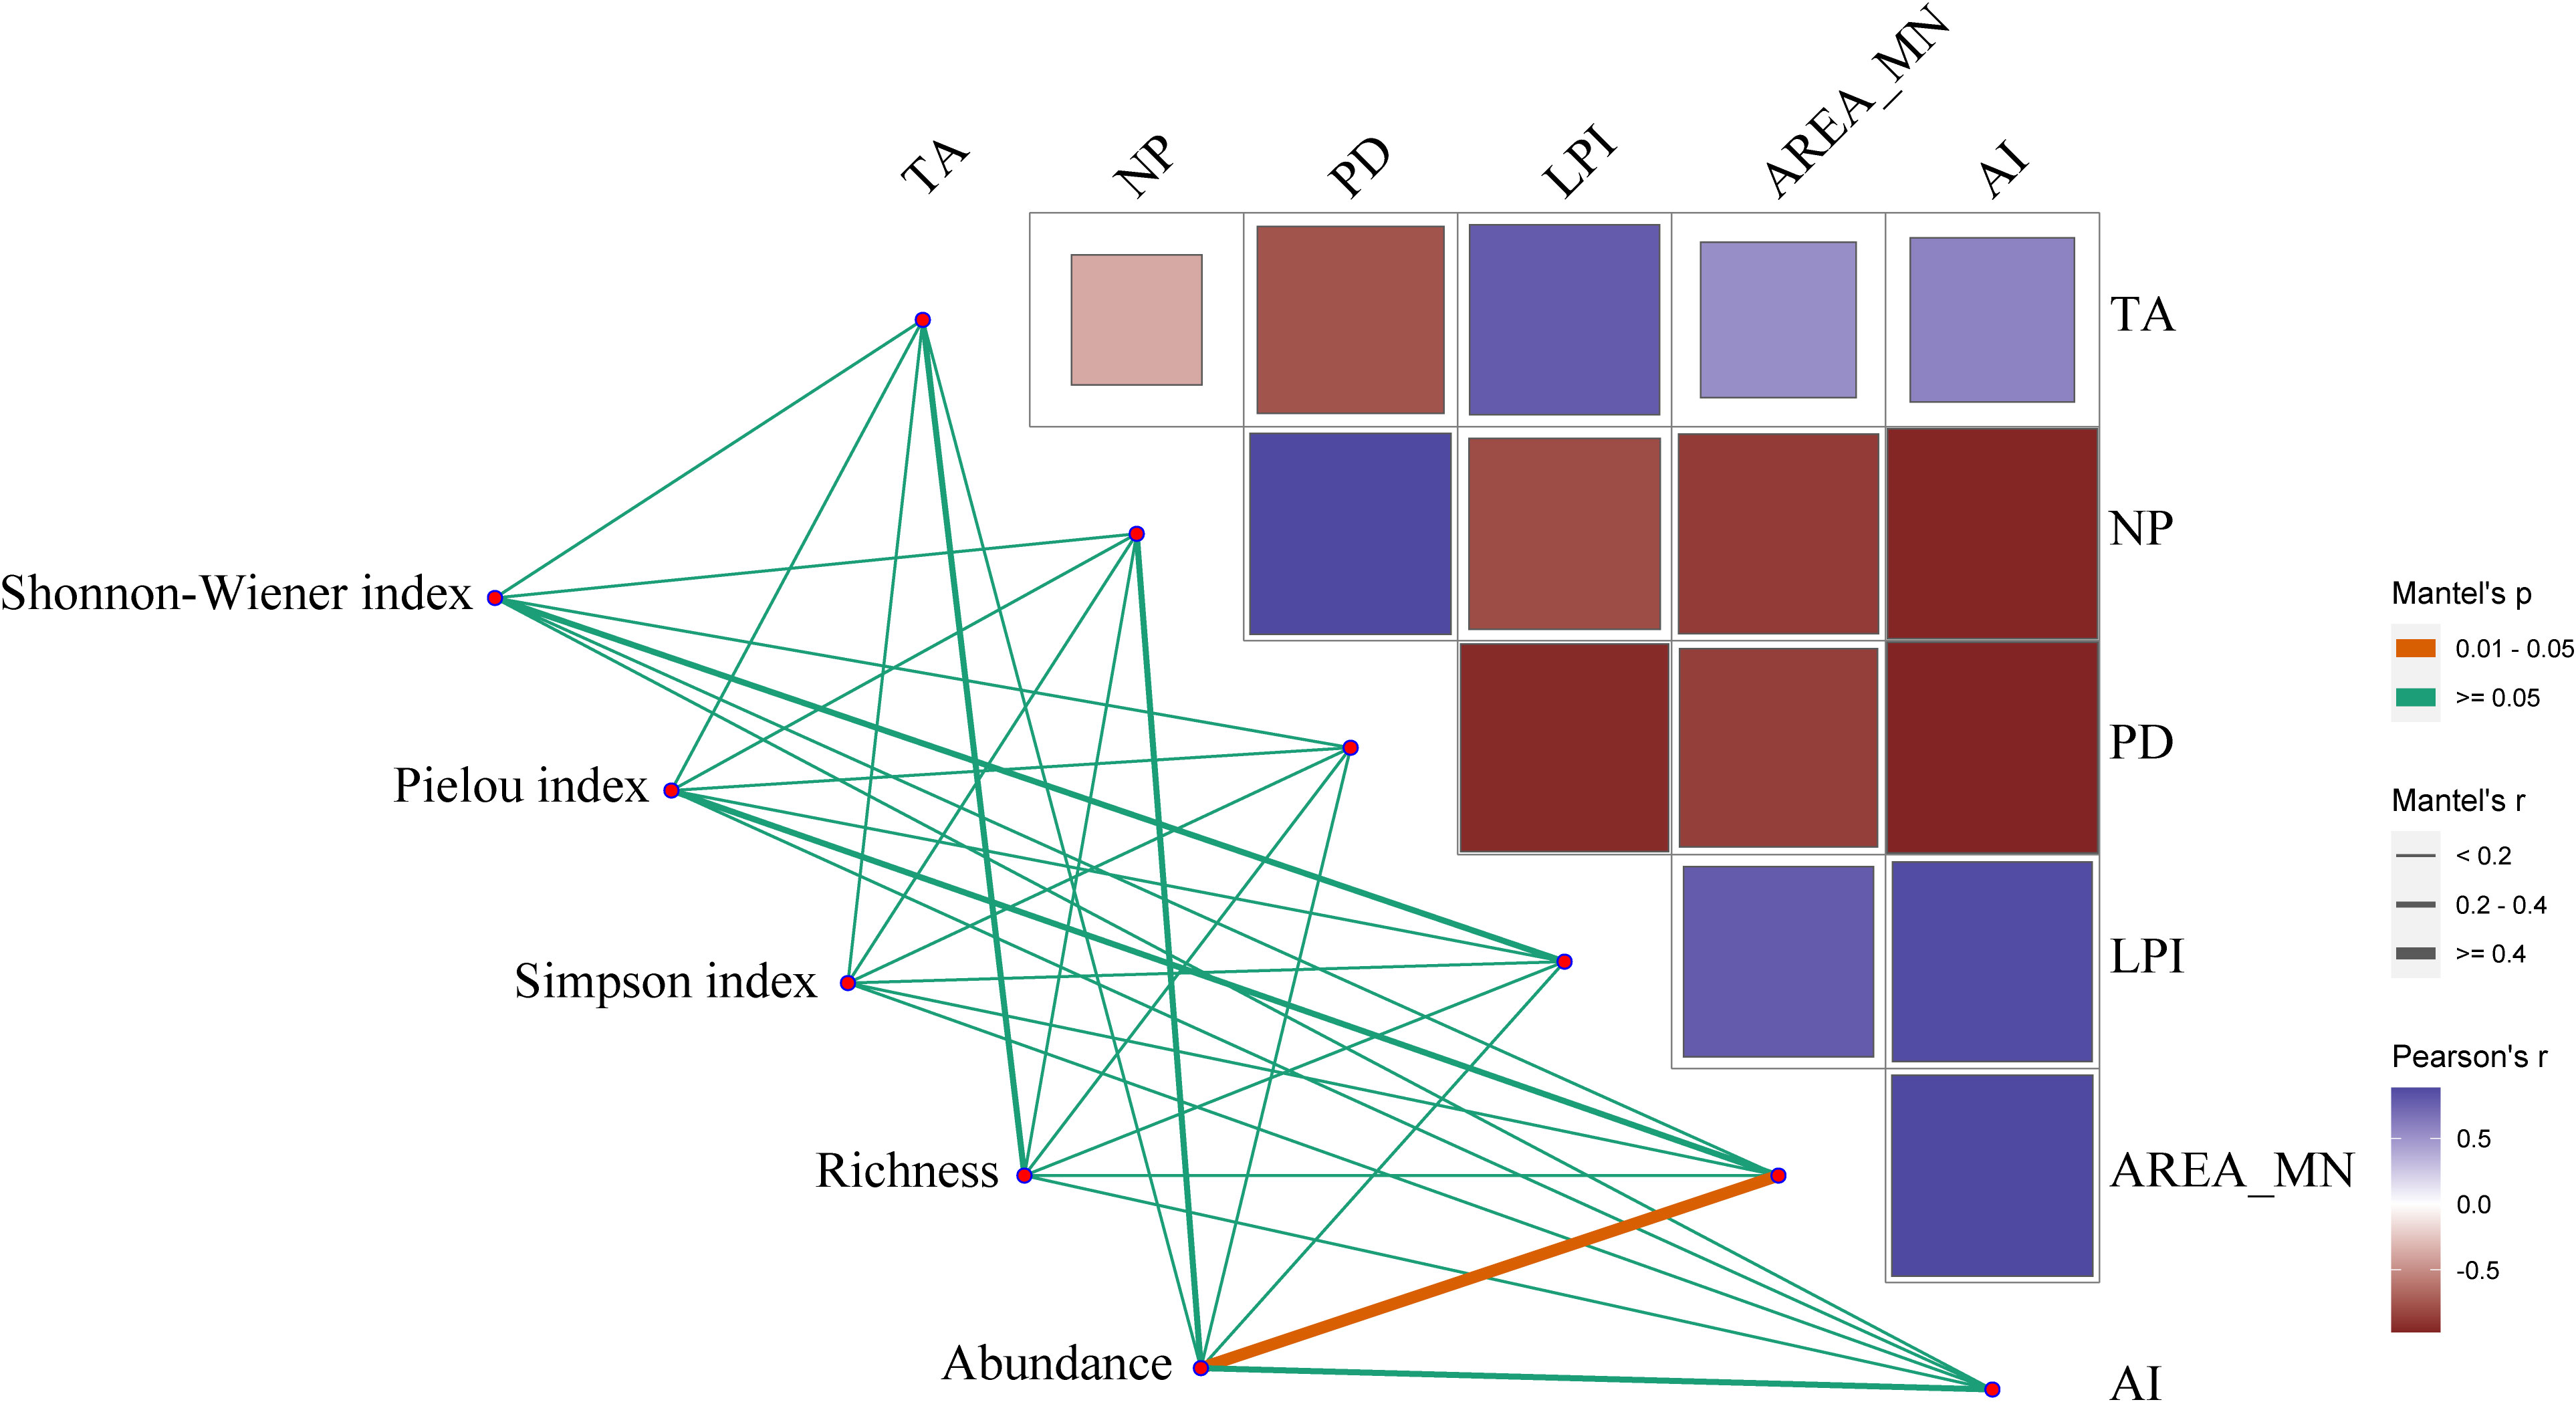
Figure 4 Relationships between the landscape metrics of shorebird habitat and shorebird diversity indices in the Yellow River Delta. Pairwise comparisons between shorebird diversity indices and landscape metrics of habitat are indicated by a color gradient denoting Pearson’s correlation coefficients. The non-orange lines indicate non-significant relationships, and the orange line indicates a significant relationship (p< 0.05). The thickness of the line is positively correlated with the strength of the relationship. TA, total area; LPI, largest patch index; AREA_MN, mean patch area; NP, number of patches; PD, patch density; AI, aggregation index.
At the functional group level, the decline in the abundance of larger-bodied species was greater than that of smaller-bodied species (T=1.156, df=42, p=0.02) (Figure 5). There were no significant differences in the decline in the abundance of threatened species and non-threatened species (T=-0.483, df=42, p=0.632) and coastal specialist species and generalist/inland specialist species (T=-1.197, df=42, p=0.239). The correlation coefficient between AREA_MN and the abundance of larger-bodied species was significantly greater than that between AREA_MN and the abundance of smaller-bodied species (T=-2.113, df=42, p=0.04) (Figure 6). This indicates that decreases in AREA_MN had a stronger effect on the abundance of larger-bodied species than on the abundance of smaller-bodied species. The correlation coefficient between AREA_MN and the abundance in threatened species and coastal specialist groups was not significantly higher than that between AREA_MN and non-threatened species (T=1.502, df=42, p=0.141) and between AREA_MN and generalist/inland specialist species (T=1.713, df=42, p=0.09). These findings indicate that the effects of declines in the AREA_MN of habitat on the abundance of threatened species and coastal specialist species are similar to the effects of the declines in the AREA_MN of habitat on non-threatened species and generalist/inland specialist species.
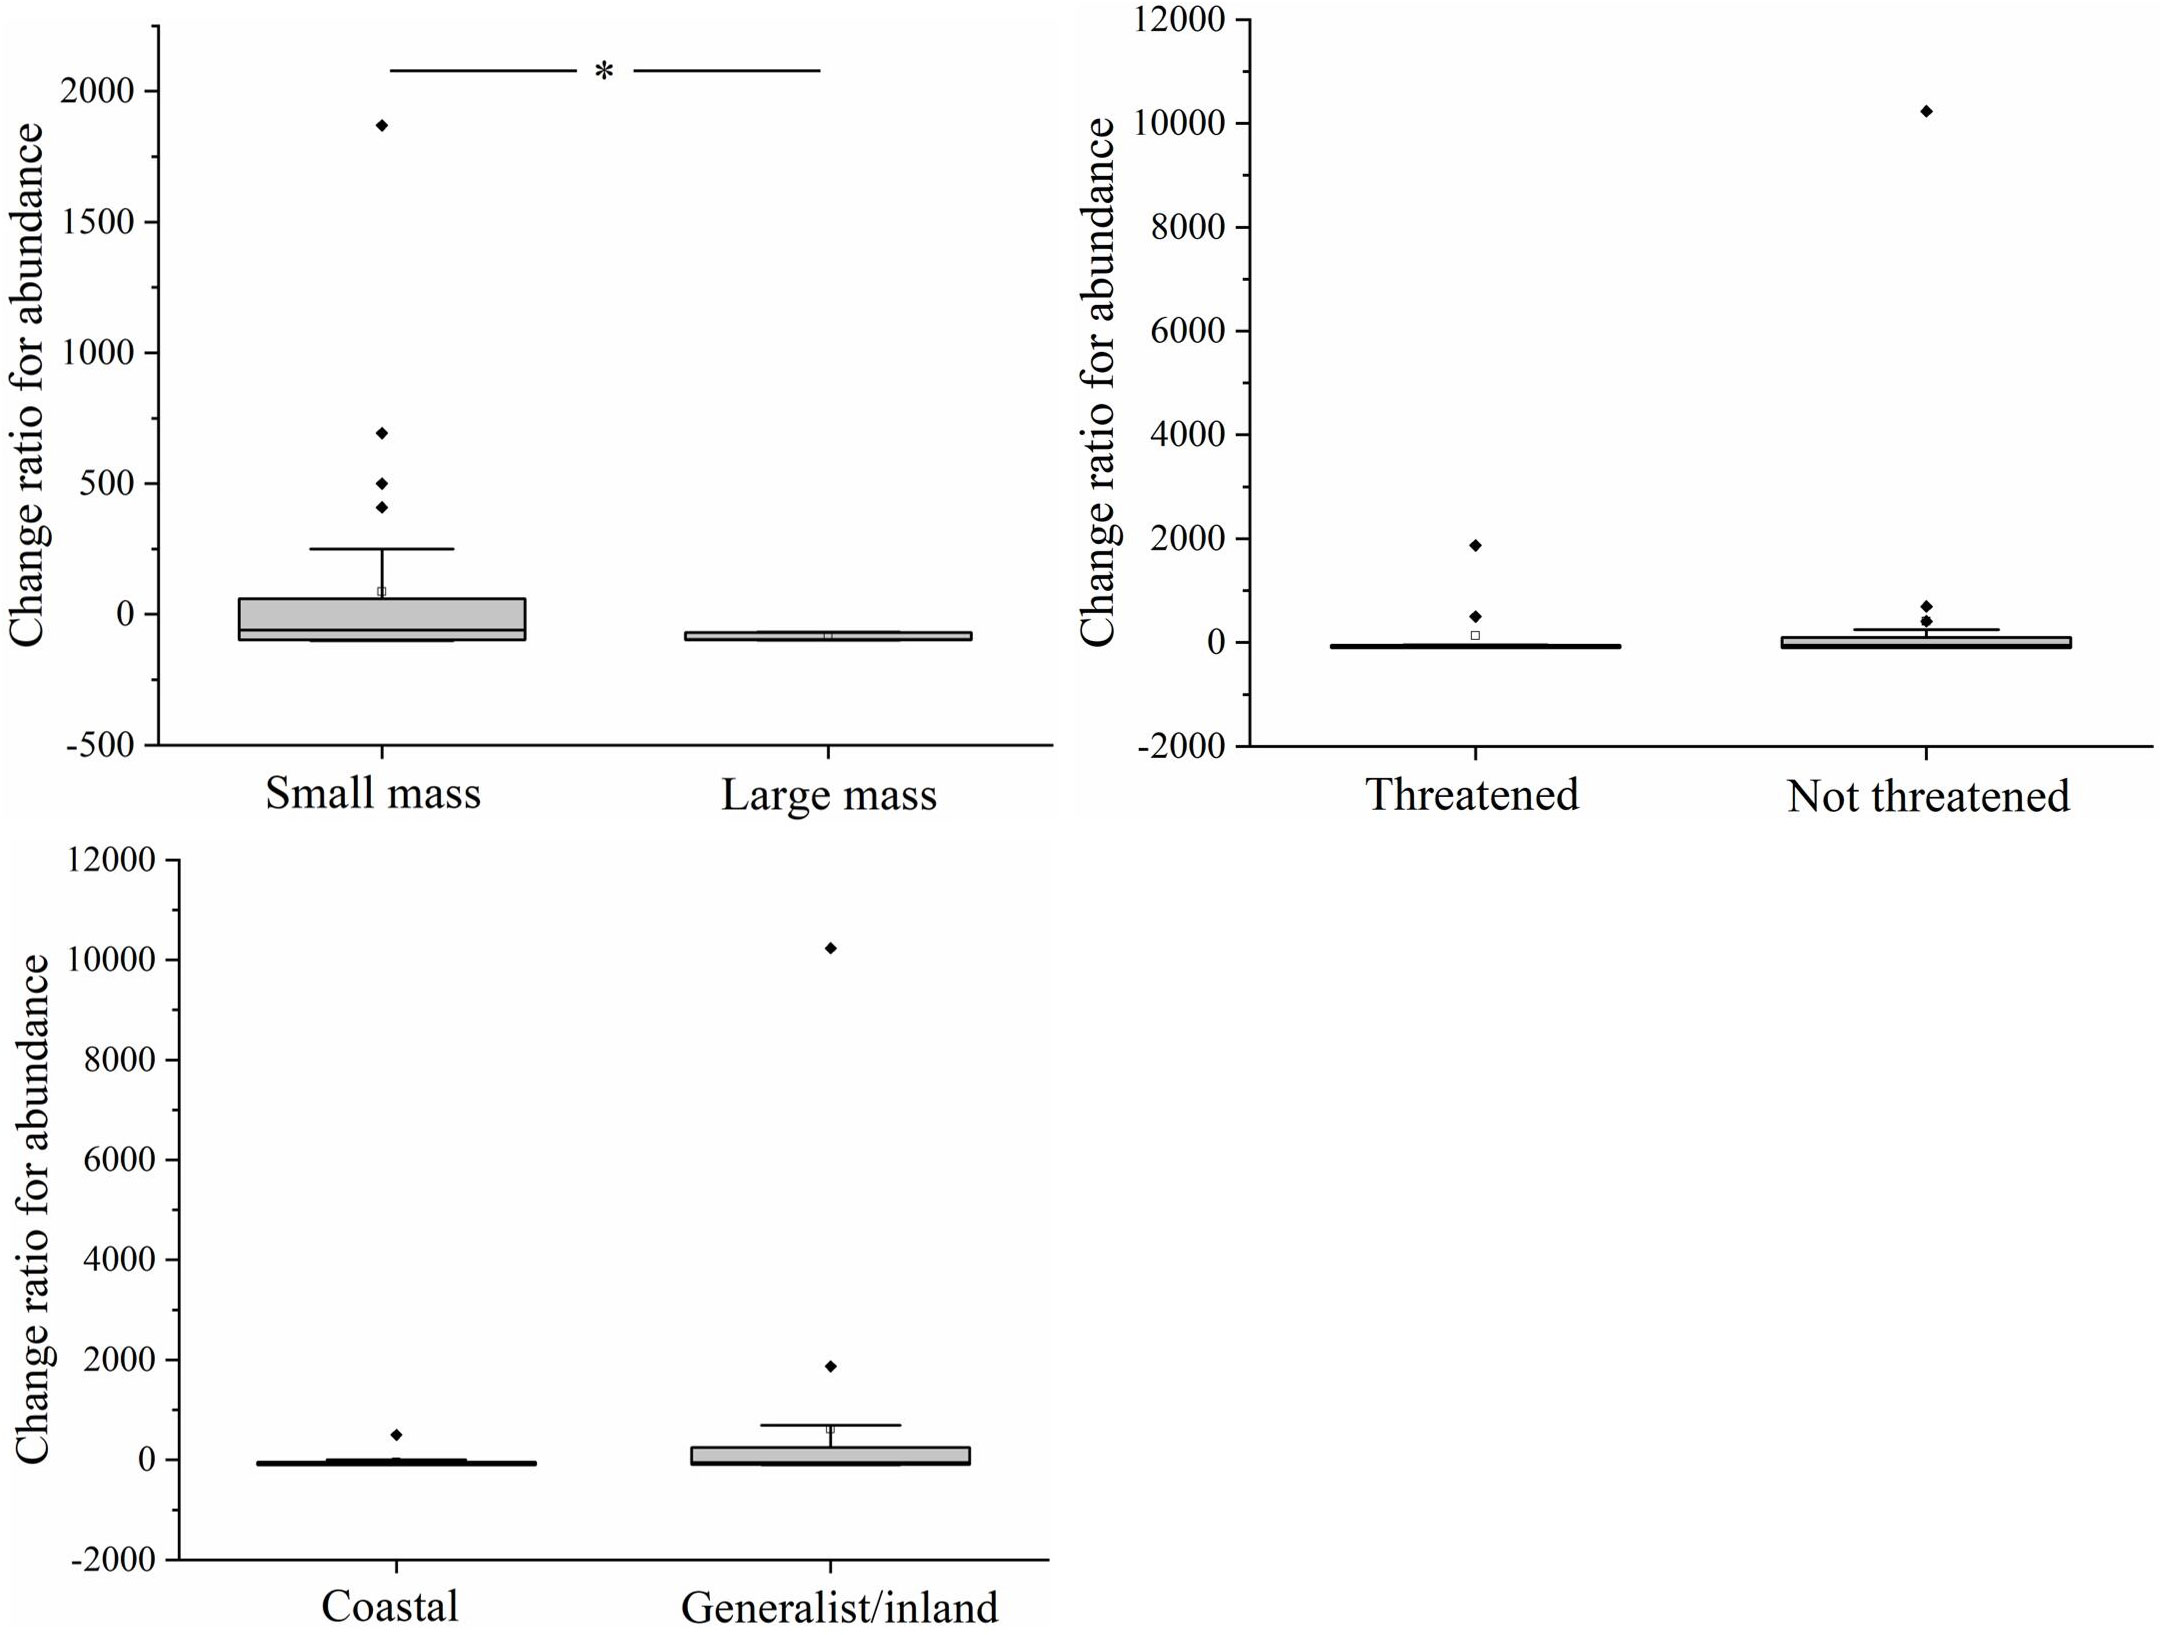
Figure 5 Differences in changes in the abundance of each species between functional groups in the Yellow River Delta. White squares represent mean values, horizontal bars within boxes represent median values, the upper and lower limits of boxes represent the maxima and minima, respectively, and whiskers represent 1% and 99%. Black squares represent abnormal value. *means significant at the 0.05 level.
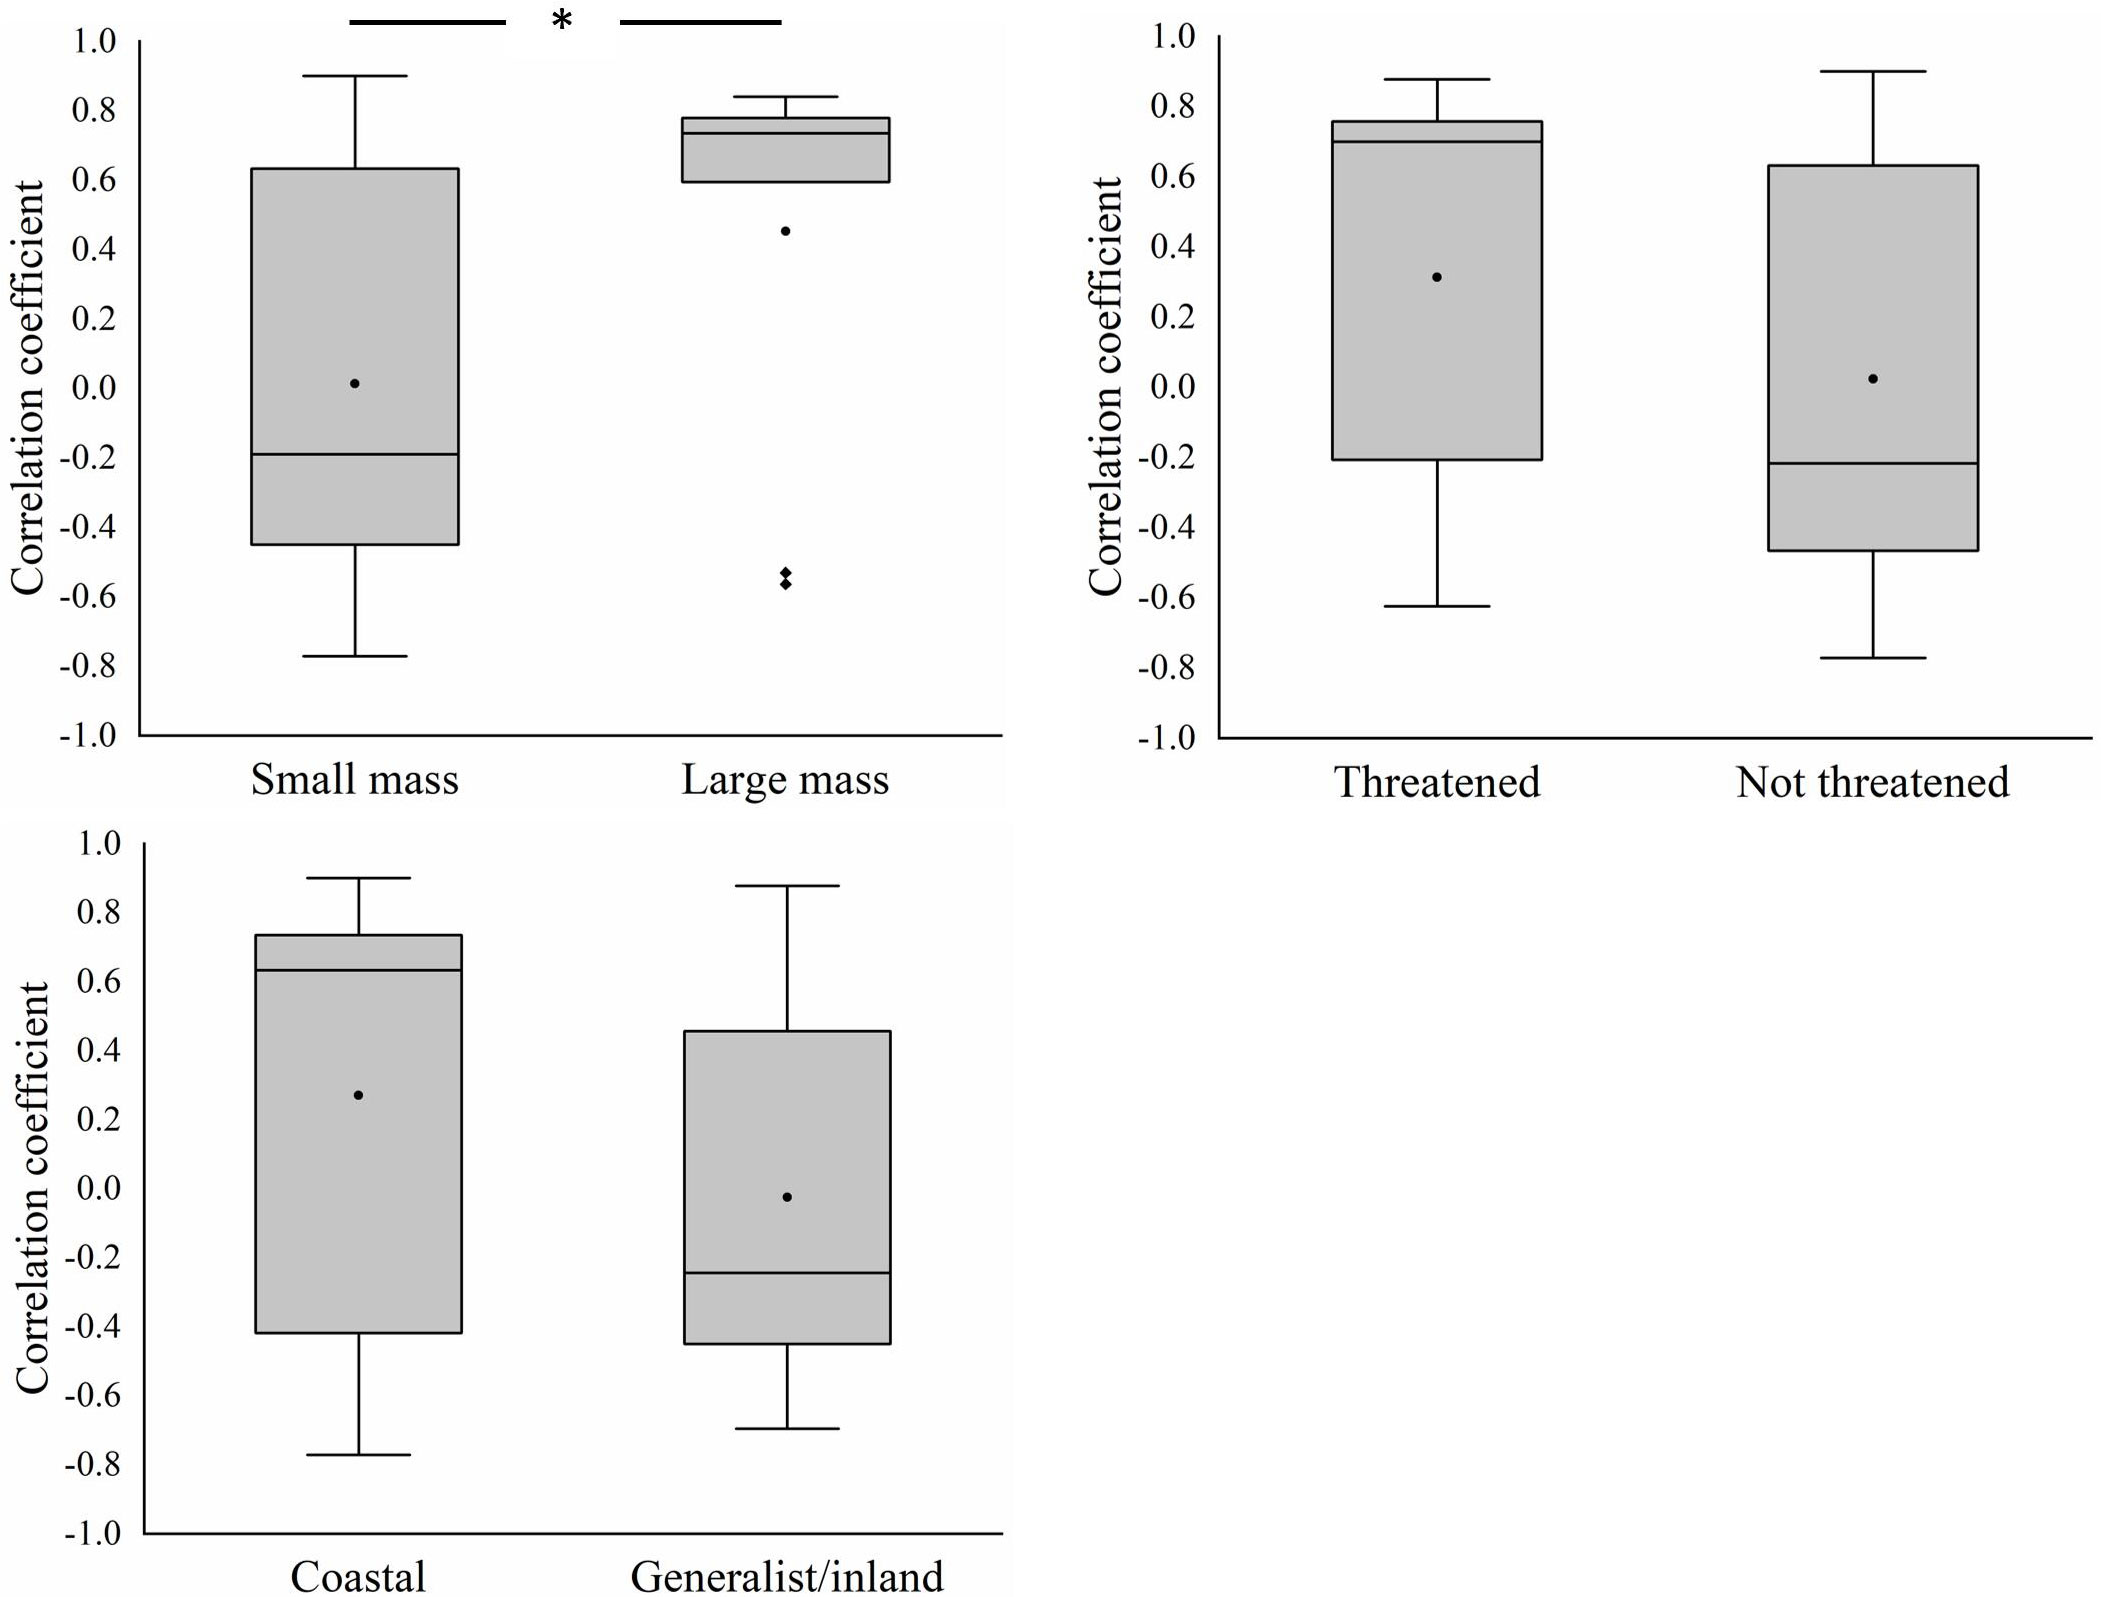
Figure 6 Differences in the correlation coefficients between mean patch area and the abundance of different groups of shorebird species in the Yellow River Delta. Black circles represent mean values, horizontal bars within boxes represent median values, the upper and lower limits of boxes represent the maxima and minima, respectively, and whiskers represent 1% and 99%. Black squares represent abnormal value. *means significant at the 0.05 level.
4. Discussion
Waterbird diversity is sensitive to environmental change, especially habitat change caused by land reclamation (Lei et al., 2017). In this study, we examined the response of shorebird community structure to habitat changes in the Yellow River Delta, an important stopover site for migratory shorebirds. The total area of habitat, largest patch index, mean patch area, and aggregation index decreased from 1995 to 2020, and the number of patches and patch density increased over this period. The abundance of shorebird species declined over this period, and the richness, Shannon-Wiener index, Pielou index, and Simpson index increased. The decline in the mean patch area of shorebird habitat significantly contributed to the reduction in the abundance of shorebirds, and the decline in the mean patch area had a stronger effect on the abundance of larger-bodied species than on the abundance of smaller-bodied species.
4.1. Changes in the landscape metrics of shorebird habitat
Natural wetlands have degraded and disappeared because of land reclamation and the invasion of Spartina alterniflora over the past few decades in the Yellow River Delta (Jackson et al., 2021). These changes have had major effects on the composition and configuration of shorebird habitat. The results of this study indicate that the largest patch index and mean patch area have decreased by more than 50% from 1995 to 2020, and the number of patches and patch density increased by more than 400% and 700%, respectively. This suggests that the continuous decline of coastal wetland habitat has resulted in habitat fragmentation because most large patches have been converted to various small patches (Li et al., 2021). Previous studies have indicated that shorebird species prefer large habitat patches (Murray and Fuller, 2015; Zhang et al., 2017); thus, increases in the number of small habitat patches and decreases in habitat TA might pose major threats to the stability of migratory shorebird populations.
4.2. Changes in diversity indices
A total of 45 shorebird species, including 13 globally threatened species, were observed in the Yellow River Delta between 1995 and 2020 during the spring. The abundance of more than 30% of species met the Ramsar 1% criterion (exceeding 1% of the total population in the flyway). This indicates that the Yellow River Delta is a critically important site for the conservation of migratory shorebirds. Its importance has also been demonstrated in a previous study showing that the abundance of 17 shorebird species meets the Ramsar 1% criterion in the Yellow River Delta according to surveys conducted between 2005 and 2013 (Xia et al., 2016).
The total abundance of 45 shorebird species declined from 1995 to 2020, and the overall decline was greater than 90%. Decreases in the abundance of 19 shorebird species were greater than 50%, and these included globally threatened species, such as the Eurasian Oystercatcher, Eurasian Curlew, Bar-tailed Godwit, Eastern Curlew, Great Knot, Black-tailed Godwit, and Red-necked Stint. These findings are consistent with the results of Li et al. (2018) showing that the total abundance of shorebird species has declined by 60.27% and that the abundance of 11 shorebird species has decreased significantly over the last few decades in the Yellow River Delta. These patterns indicate that migratory shorebird species are in need of urgent conservation attention. In addition, the richness, Shannon-Wiener index, Pielou index, and Simpson index of the shorebird community slightly increased between 1995 and 2020. A previous study has shown that artificial wetlands can attract various shorebirds to feed or stopover (Jackson et al., 2019); the conversion of natural wetlands to saltpans and mariculture areas can provide diverse habitats that increase shorebird diversity in the Yellow River Delta.
4.3. Relationship between the shorebird community and habitat changes
At the community level, the sharp reduction in the mean patch area of shorebird habitat contributed to the continuous decline in the total abundance of shorebird species between 1995 and 2020 in the Yellow River Delta. Previous studies have shown that the loss of coastal wetlands in the Yellow Sea region has caused declines in the populations of seven shorebird species at an annual rate of 8% (Studds et al., 2017). The Yellow River Delta is an important component of the Yellow Sea region, and this result indicates that habitat loss might pose a serious threat to migratory shorebird species.
At the functional group level, declines in the abundance of larger-bodied species over the past few decades have been more pronounced than those in smaller-bodied species. Larger-bodied shorebird species were more sensitive to declines in mean patch area than smaller-bodied species. A previous study has shown that larger-bodied species are less likely to feed in artificial wetlands (Jackson et al., 2020). This indicates that populations of these species are less capable of adapting to habitat change. Furthermore, there were no significant differences in the effects of declines in the mean patch area on the abundance of threatened species and non-threatened species and the abundance of coastal specialist species and generalist/inland specialist species. This might stem from the small sample sizes because survey data were collected over six periods between 1995 and 2020 in the Yellow River Delta. In addition, the comparison is between 1995 and 2020 only.
4.4. Conservation implications
This study indicate that the habitat loss posed a serious threat to shorebird species, especially larger-bodied species. A previous study has indicated that habitat loss at one stopover site is unlikely to be offset by the conservation of other habitats (Wang et al., 2022); thus, the conservation of existing natural wetlands in the Yellow River Delta is important for maintaining the stability of shorebird populations. The establishment of Yellow River Delta National Nature Reserve have been so far important for reducing human activity and conserving biodiversity. We recommend that the boundary of the reserve be enlarged to include the surrounding habitat that was included in the InVEST model. In addition, the results of this study highlight the urgency with which the conservation of larger-bodied species needs to be prioritized. We recommend that some larger-bodied, globally threatened shorebirds, such as the Eurasian Oystercatcher, Bar-tailed Godwit, and Black-tailed Godwit, be listed as nationally protected species to promote their conservation.
Long-term systematic survey data along with remote sensing data can provide insights into population trends and the factors driving them; these data can also aid conservation and management. There is thus a need to clarify the responses of shorebird populations to changes in habitat at the scale of migratory networks, including breeding areas, stopover sites, and non-breeding areas. Shorebird surveys have been conducted in China, South Korea (Moores et al., 2016), Japan (Amano et al., 2010), New Zealand (Riegen and Sagar, 2020), and Australia (Clemens et al., 2016), but not in North Korea and Southeast Asia. The implementation of integrated and standardized monitoring systems is needed to acquire long-term shorebird survey data along the EAAF. Understanding the responses of shorebird populations to environmental changes along their migratory routes should be a central goal of future research.
Data availability statement
The raw data supporting the conclusions of this article will be made available by the authors, without undue reservation.
Ethics statement
Ethical review and approval was not required for the animal study because this study used the shorebird survey data and remote sensing data to reveal the relationship between landscape change on waterbird diversity. It did not include any actions to harm any animal.
Author contributions
XY and HD planned and designed the research; HD, KS, CZ, and HL collected data; HD analyzed data and wrote the manuscript; HD and XY. collaboratively revised the manuscript.
Funding
This research was jointly supported by the National Natural Science Foundation of China (42101105) and the Key Laboratory of Coastal Environmental Processes and Ecological Remediation, YICCAS (Grant No. 2020KFJJ02).
Acknowledgments
We appreciate Lin Zhang for assistance with mapping. We thank Dehua Mao for providing Spartina alterniflora distribution data.
Conflict of interest
The authors declare that the research was conducted in the absence of any commercial or financial relationships that could be construed as a potential conflict of interest.
Publisher’s note
All claims expressed in this article are solely those of the authors and do not necessarily represent those of their affiliated organizations, or those of the publisher, the editors and the reviewers. Any product that may be evaluated in this article, or claim that may be made by its manufacturer, is not guaranteed or endorsed by the publisher.
Supplementary material
The Supplementary Material for this article can be found online at: https://www.frontiersin.org/articles/10.3389/fmars.2022.1049765/full#supplementary-material
References
Amano T., Sz´ekely T., Koyama K., Amano H., Sutherland W. J. (2010). A framework for monitoring the status of populations: an example from wader populations in the east asian-australasian flyway. Biol. Conserv. 143, 2238–2247. doi: 10.1016/j.biocon.2011.06.006
Bai Q. Q., Chen J. Z., Chen Z. H., Dong G. T., Dong W. X., Fu Kan V. W., et al. (2015). Identification of coastal wetlands of international importance for waterbirds: A review of China coastal waterbird surveys 2005–2013. Avian Res. 6, 1–16. doi: 10.1186/s40657-015-0021-2
Barter M. (2002). Shorebirds of the yellow Sea: Importance, threats and conservation status. Wetland Int. Oceania 104, 1–299. doi: 10.1071/muv104n3_br1
Chan Y. C., Tibbitts T. L., Lok T., Hasse C. J., Peng H. B., Ma Z., et al. (2019). Filling knowledge gaps in a threatened shorebird flyway through satellite tracking. J. Appl. Ecol. 56, 2305–2315. doi: 10.1111/1365-2664.13474
Clemens R., Rogers D. I., Hansen B. D., Gosbell K., Minton C. D. T., Straw P., et al. (2016). Continental-scale decreases in shorebird populations in Australia. Emu. 116, 119–135. doi: 10.1071/MU15056
Di X. H., Hou X. Y., Wu L. (2014). Land use classification system for China's coastal zone based on remote sensing. Res Sci. 36, 0463–0472.
Duan H. L., Xia S. X., Jackson M. V., Zhao N., Liu Y., Teng J. K., et al. (2020). Identifying new sites of significance to waterbirds conservation and their habitat modification in the yellow and bohai seas in China. Glob. Ecol. Conserv. 22, e01031. doi: 10.1016/j.gecco.2020.e01031
Duan H. L., Yu X. B., Xia S. X., Liu Y. (2022b). Combining bootstrapping procedure and citizen science data to elucidate waterbirds’ dependence on coastal wetland. Front. Mar. Sci. 9. doi: 10.3389/fmars.2022.888535
Duan H. L., Yu X. B., Zhang L., Xia S. X., Liu Y., Mao D. H., et al. (2022a). An evaluating system for wetland ecological risk: Case study in coastal mainland China. Sci. Total Environ. 828, 154535. doi: 10.1016/j.scitotenv.2022.154535
Hong H. J., Kim C. K., Lee H. W., Lee W. K. (2021). Conservation, restoration, and sustainable use of biodiversity based on habitat quality monitoring: A case study on jeju island, south korea, (1989–2019). Land 10, 774. doi: 10.3390/land10080774
Hou X. Y., Nin J. C., Xing Q. G., Yu X. B. (2021). Remote sensing on wetland habitat evolution in the yellow river delta (Beijng: Science Press).
IUCN (2022) The IUCN red list of threatened species. Available at: https://www.iucnredlist.org (Accessed 20 July 2022).
Jackson M. V., Carrasco L. R., Choi C. Y., Li J., Ma Z. J., Melville D. S., et al. (2019). Multiple habitat use by declining migratory birds necessitates joined-up conservation. Ecol. Evol. 9, 2505–2515. doi: 10.1002/ece3.4895
Jackson M. V., Choi C. Y., Amano T., Estrella S. M., Lei W. P., Moores N., et al. (2020). Navigating coasts of concrete: Pervasive use of artificial habitats by shorebirds in the Asia-pacific. Biol. Conserv. 247, 1–11. doi: 10.1016/j.biocon.2020.108591
Jackson M. V., Fuller R. A., Gan X. J., Li J., Mao D. H., Melville D. S., et al. (2021). Dual threat of tidal flat loss and invasive spartina alterniflora endanger important shorebird habitat in coastal mainland China. J. Environ. Manage. 278, 111549. doi: 10.1016/j.jenvman.2020.111549
Kevin M., Marks B. J. (1995). FRAGSTATS: spatial pattern analysis program for quantifying landscape structure. gen. tech. rep. PNW-GTR-351. Portland, OR (Pacific Northwest Research Station: U.S. Department of Agriculture, Forest Service), 122.
Lei G. C., Zhang Z. W., Yu X. B., Zhang M. X. (2017). Blueprint of coastal wetland conservation and management in China (Beijing: Science Press).
Li X. W., Hou X. Y., Song Y., Shan K., Zhu S., Yu X. B., et al. (2018). Assessing changes of habitat quality for shorebirds in stopover sites: a case study in yellow river delta, China. Wetlands 39, 67–77. doi: 10.1007/s13157-018-1075-9
Li Y. F., Mao D. H., Wang Z. M., Wang X., Tan X. Y., Jia M. M., et al. (2021). Identifying variable changes in wetlands and their anthropogenic threats bordering the yellow Sea for water bird conservation. Glob. Ecol. Conserv. 27, e01613. doi: 10.1016/j.gecco.2021.e01613
Li N., Tang N., Wang Z., Zhang L. (2022). Response of different waterbird guilds to landscape changes along the yellow sea coast: A case study. Ecol. Indic. 142, 109298. doi: 10.1016/j.ecolind.2022.109298
Ma T. T., Li X. W., Bai J. H., Cui B. S. (2019). Habitat modification in relation to coastal reclamation and its impacts on waterbirds along china’ s coast. Glob. Ecol. Conserv. 17, e00585. doi: 10.1016/j.gecco.2019.e00585
Mao D. H., Liu M. Y., Wang Z. M., Li L., Man W. D., Jia M. M., et al. (2019). Rapid invasion of spartina alterniflora in the coastal zone of mainland China: Spatiotemporal patterns and human prevention. Sensors 19, 2308. doi: 10.3390/s19102308
Moores N., Rogers D. I., Rogers K., Hansbro P. M. (2016). Reclamation of tidal flats and shorebird declines in saemangeum and elsewhere in the republic of Korea. Emu. 116, 136–146. doi: 10.1071/MU16006
Murray N. J., Fuller R. A. (2015). Protecting stopover habitat for migratory shorebirds in East Asia. J. Ornithol. 156, 217–225. doi: 10.1007/s10336-015-1225-2
Paulson Institute (2016). Blueprint of coastal wetland conservation and management in China (Beijing: Higher Education press. Institute of Geographic Sciences and Natural Resources Research, CAS).
Riegen A. C., Sagar P. M. (2020). Distribution and numbers of waders in New Zealand, 1983-1994 Notornis. 67, 591634.
SFA (2014). Results of the second national wetland resources survey in China. Land Greening 2), 6–7.
Sharp R., Tallis H. T., Ricketts T., Guerry A. D., Wood S. A., Chaplin-Kramer R., et al. (2016). “InVEST +VERSION+ user’s guide. 2018 International Conference on Computing Sciences and Engineering, ICCSE 2018 - Proceedings,” (2018). 16 (3), 1–6.
Studds C. E., Kendall B. E., Murray N. J., Wilson H. B., Rogers D. I., Clemens R. S., et al. (2017). Rapid population decline in migratory shorebirds relying on yellow Sea tidal mudflats as stopover sites. Nat. Commun. 8, 1–7. doi: 10.1038/ncomms14895
Wang X. D., Chen Y., Melville D. S., Choi C. Y., Tan K., Liu J. J., et al. (2022). Impacts of habitat loss on migratory shorebird populations and communities at stopover sites in the yellow Sea. Biol. Conserv. 269, 109547. doi: 10.1016/j.biocon.2022.109547
Xia S. X., Yu X. B., Millington S., Liu Y., Jia Y. F., Wang L. Z., et al. (2016). Identifying priority sites and gaps for the conservation of migratory waterbirds in china's coastal wetlands. Biol. Conserv. 210, 72–82. doi: 10.1016/j.biocon.2016.07.025
Yohannes H., Soromessa T., Argaw M., Dewan A. (2020). Changes in landscape composition and configuration in the beressa watershed, blue Nile basin of Ethiopian highlands: historical and future exploration. Heliyon 6, e04859. doi: 10.1016/j.heliyon.2020.e04859
Yu X. B., Zhang L. (2020). Green paper of china’s coastal wetland conservation (Beijing: Science Press).
Yu X. B., Zhang L., Yang B. (2022). Green paper of china’s coastal wetland conservation (Beijing: Science Press).
Zhang Q., Ma K. M., Li J. Y., Zhang Y. X. (2017). The effect of stopover wetlands on migratory waterbirds at different scales: a review. Acta Ecol. Sin. 37, 2520–2529. doi: 10.5846/stxb201510262158
Keywords: habitat change, shorebird diversity, functional groups, land degradation, conservation and management
Citation: Duan H, Yu X, Shan K, Zhang C and Liu H (2022) Effects of habitat loss on migratory shorebird community structure at stopover sites: A case study in the Yellow River Delta, China. Front. Mar. Sci. 9:1049765. doi: 10.3389/fmars.2022.1049765
Received: 21 September 2022; Accepted: 18 November 2022;
Published: 01 December 2022.
Edited by:
Caterina Bergami, National Research Council (CNR), ItalyReviewed by:
Hong Mingsheng, China West Normal University, ChinaGaia Bazzi, Istituto Superiore per la Protezione e la Ricerca Ambientale (ISPRA), Italy
Copyright © 2022 Duan, Yu, Shan, Zhang and Liu. This is an open-access article distributed under the terms of the Creative Commons Attribution License (CC BY). The use, distribution or reproduction in other forums is permitted, provided the original author(s) and the copyright owner(s) are credited and that the original publication in this journal is cited, in accordance with accepted academic practice. No use, distribution or reproduction is permitted which does not comply with these terms.
*Correspondence: Houlang Duan, duanhl@igsnrr.ac.cn