A three-dimensional experimental study on bank retreat: The coupled role of seepage and surface flow
 Keyu Wang
 Zheng Gong
 Kun Zhao1
 - 1State Key Laboratory of Hydrology-Water Resources and Hydraulic Engineering, Hohai University, Nanjing, China
- 2Hydropower & Pumped Storage Engineering Div., PowerChina Northwest Engineering Co. Ltd., Xi’an, China
- 3Jiangsu Key Laboratory of Coast Ocean Resources Development and Environment Security, Hohai University, Nanjing, China
The coupled role of seepage and surface flow on bank retreat has long been neglected, partly due to the concealment and complexity of seepage erosion. To fill this gap, we set up a three-dimensional laboratory experiment to explore bank retreat process in response to seepage and surface flow. During each experiment, we measured the changes of total soil stress, matric suction, and water content within the bank, as well as flow velocity and suspended sediment concentration near the bank. Results show that a rapid decrease in matric suction, the bank toe undercutting consequent to seepage erosion, the formation of tension crack on the bank top, and the occurrence of toppling or shear failure is the typical sequence of the observed bank retreat process under seepage flow. The inclusion of surface flow erodes slump blocks and so promotes cantilever formation, leading to additional bank failure. Compared with the case where only seepage is considered, the frequency of toppling failure under the coupled effect of seepage and surface flow decreases, but the contribution to the bank retreat increases by 37 %. The time taken to collapse in three-dimensional experiments is at least 1.5 h earlier than that of two-dimensional experiments, indicating the importance of preferential flow pathways of seepage. Overall, this research illustrates how surface flow interacts with seepage flow to control bank retreat process and is indeed a first step toward a fully understanding of multifactor-driven bank retreat.
Introduction
Bank retreat is a key process of fluvial and coastal environments, affecting a series of physical and ecological issues such as channel, evolution, the establishment of biological habitats, and the safety of engineering construction (Thorne and Lewin, 1979; Darby and Thorne, 1996; Millar, 2000; Simon et al., 2000; Goodson et al., 2002; Eaton et al., 2004). Bank retreat is generally categorized into flow-induced bank erosion and collapse (Thorne & Tovey, 1981; Simon et al., 2000). Because of its concealment and complexity (Hagerty, 1991; Fox and Wilson, 2010), the role of seepage in bank retreat has been paid more attention to by scientists and widely studied. The loss of soil matric suction is the key process of bank retreat under the action of seepage, and the subsequent bank retreat process can be divided into four main mechanisms from the failure patterns: toppling, shear (Figure 1A), undercutting (Figure 1B), and tensile failure (Thorne & Tovey, 1981; Fox and Wilson, 2010).
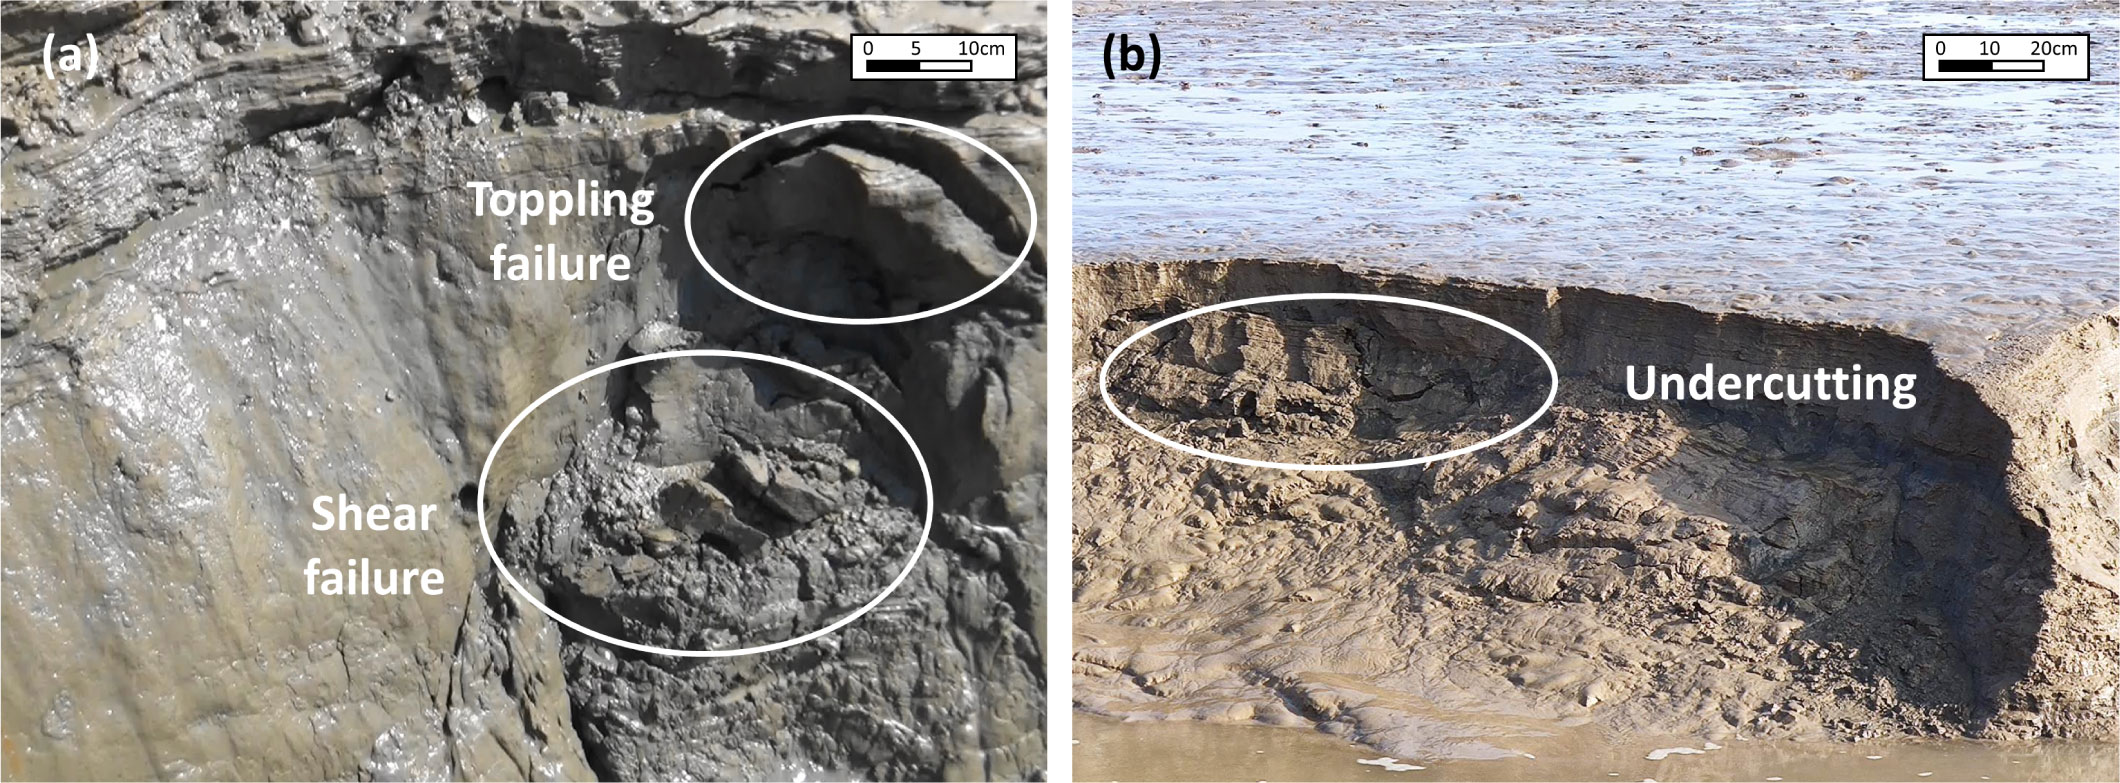
Figure 1 Field photograph showing bank retreat process caused by seepage: (A) toppling and shear failure; (B) seepage undercutting. These photos were taken from Jiangsu coast, eastern China.
Laboratory studies have been conducted to explore the mechanism of seepage-induced bank retreat. The experiments show that pore-water pressure plays an important role in the process of seepage erosion, when the unsaturated bank soil is close to saturation, but the shear strength decreases obviously, leading to an increase in seepage erosion rate by an order of magnitude (Fox and Felice, 2014; Khanal et al., 2020). Pore-water pressure and matric suction change with the groundwater level; the former is associated with instability, whereas the latter affects apparent cohesion (Simon et al., 2000; Darby et al., 2007; Rinaldi et al., 2008; Rinaldi and Nardi, 2013). In the period of flood receding or low tides, the hydrostatic pressure decreases rapidly, and the hysteretic change of the average groundwater level leads to the relatively high pore-water pressure, which is adverse to the stability of the bank (Gong et al., 2018; Simon et al., 2000). Therefore, bank collapse mostly occurs during water level falling (Deng et al., 2019). Another key factor of seepage erosion is the gradient force of seepage. The shear strength of the soil decreases resulting from the increase of water content, the tensile or "pop out" failure occurs when the seepage pressure is greater than the shear strength of the soil. The changes of seepage gradient force and shear strength of the soil are the reasons for the tensile or "pop out" failure observed in the experiment (Chu-Agor et al., 2008). When the seepage gradient force is smaller than the resistance of the soil block, the movement of particles (i.e., seepage erosion) and soil undercutting lead to bank collapse, which is caused by the coupled effect of seepage and pore-water pressure accumulation (Chu-Agor et al., 2008). Fox et al. (2007) found that the effect of seepage undercutting on bank erosion is slightly greater as compared with the increase of soil pore-water pressure. The tension crack is the result of the decrease in matric suction and the bending moment induced by undercutting in the process of seepage. Several studies show that the increase in seepage head leads to the increase in the erodibility of clayey soil, the advancing speed of wetting front and the speed of bank collapse. For the same seepage head, the volume of slump block decreases with bank height, whereas the contribution of seepage erosion to the total sediment increases (Fox et al., 2006; Al-Madhhachi et al., 2011).
Most of the above experimental studies were carried out using 2D lysimeter (e.g., Fox et al., 2006), neglecting the difference along the width direction. In addition, the 2D model cannot simulate heterogeneous cantilever failure, complex flow characteristics near and inside bank, longitudinal gradient of sediment transport, pore-water pressure, or slump block effect (Fox et al., 2007; Patsinghasanee et al., 2017). Slump block plays a certain role in protecting the bank, hindering further erosion of surface flow and the undercutting process of seepage. The transportation of slump blocks in the riverbed is related to the secondary bank collapse and the scouring and silting deformation process, and the change of the riverbed will, in turn, affect the bank stability (Fox and Felice, 2014). Only after surface flow or artificial removal of bank toe will the undercutting of seepage continue, which indicates the necessity of studying surface and seepage erosion at the same time in the future (Midgley et al., 2013).
Recently, studies have been conducted to investigate the influence of surface flow on bank retreat. The characteristics of surface flow is a main factor. (Aldefae and Alkhafaji, 2021) found that the soil erosion rate of bank decreases with the decrease of surface flow velocity. (Duong and Do, 2019) paid attention to the fluctuation rate of surface flow and the influence of soil properties of bank. Results show that, for constant water level, the bank with higher soil density and cohesion favors larger and deeper cantilever collapse. When the water level change rate is low, the infiltration of surface flow becomes the main factor of bank retreat, whereas when the water level change rate is high, the bank retreat is mainly caused by cantilever toppling failure. Zhao et al. (2020) were mainly concerned about the effect of bank height and near-bank water depth. They found that bank retreat rate first increases and then decreases with increased ratio of bank height to near-bank water depth. Some scholars were more concerned about the type of failures and bank shape after collapse. Samadi et al. (2013) carried out experiments by artificial excavation instead of surface flow and compared the stress and deformation distribution obtained by the numerical model with the laboratory observation results. They found that bank collapse is controlled by toppling failure rather than shear failure. Patsinghasanee et al. (2017) analyzed and studied the mechanism of cantilever failure through numerical simulation of the experimental results and field data of the U-Tapao river bank in Thailand and developed a numerical model, which can simulate the failure mechanism and cantilever shape of the bank. By analysis of the three-dimensional (3D) structure of the failure surface of the bank, Zhang et al. (2021) found that there is a linear negative correlation between the failure surface angle and the bank retreat distance.
Previous studies on bank retreat tend to focus on a single process at a time, whereas bank retreat results from the interaction of multiple factors (Wolman, 1959; Thorne and Tovey, 1981; Lawler et al., 1997). In short, an isolated view of the role of factors such as surface flow or seepage in bank retreat may lead to deviations in the prediction of related processes (Darby et al., 2007).
This study aims to set up a laboratory experiment with a scale similar to natural systems to (1) reproduce 3D tidal channel bank retreat process under the action of seepage and/or surface flow, (2) obtain near-bank morphology under the influence of different seepage head and duration, and (3) investigate the effect of bank collapse/erosion on flow velocity and suspended‐sediment concentrations (SSCs), analyze the similarities and differences between 2D and 3D experiments. By addressing these objectives, the purpose of this study is to open up new possibilities for understanding the bank stability under the coupled action of multiple factors.
Materials and methods
Experimental setup
Muddy tidal flats of Jiangsu coast are selected as research site. Contrary to previous studies whereby downscaled physical models are applied to study the collapse process of riverbanks (Fox et al., 2006; Fox et al., 2007; Lindow et al., 2009; Karmaker and Dutta, 2013), we use the soil and flow conditions similar to field tidal channels to build the model for the experiment. The comparison of soil and flow parameters and bank morphology between field observations and laboratory models is summarized in Table 1.
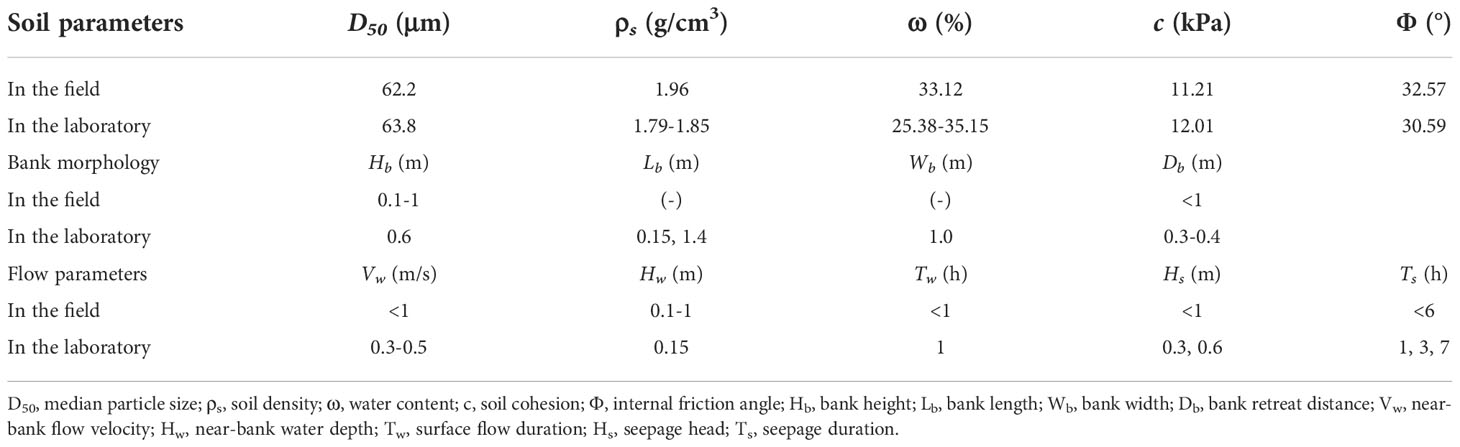
Table 1 Soil and flow parameters in field observations and flume experiments.
The soil and flow parameters in field observations and flume experiments in Table 1 were measured by almost the same measuring methods. A ruler or tape measure was used to measure the bank morphology (Hb, Lb, Wb, Db) and water depth (Hw, Hs). Flow velocity probes (CSY02-8, made by Nanjing Hydraulic Research Institute with accuracy around 0.01 m/s) were used to measure the near-bank flow velocity (Vw). In the field, the ring sampler method (accuracy up to 0.1 g/cm3) was used to measure the soil density (ρs). The soil samples were sealed and brought back to the laboratory, then the soil water content (ω) was measured by oven-drying method (accuracy up to 0.1%), and the soil cohesion (c) and internal friction angle (Ф) were measured by direct shear test of remolded soil (accuracy of 0.1 kPa and 0.1°, respectively). In addition, the sediment particle size (D50) and category were obtained by MALVERN MASTERSIZER 3000 (the error range was less than 0.6%). The soil parameters in the flume experiments were also obtained by the abovementioned methods.
The experiments were conducted in a glass‐wall current flume 25- m long, 1.2- m wide, and 0.6- m deep (Figure 2A). Two water tanks were built at both ends of the flume and connected through valves and steel tubes. An energy dissipation pool composed of cobbles and gravel was arranged at one end of the flume to ensure that the water in the flume flows smoothly before it flows through the bank of the model. A tailgate was set at the other end of the flume to adjust the flow speed and water level height.
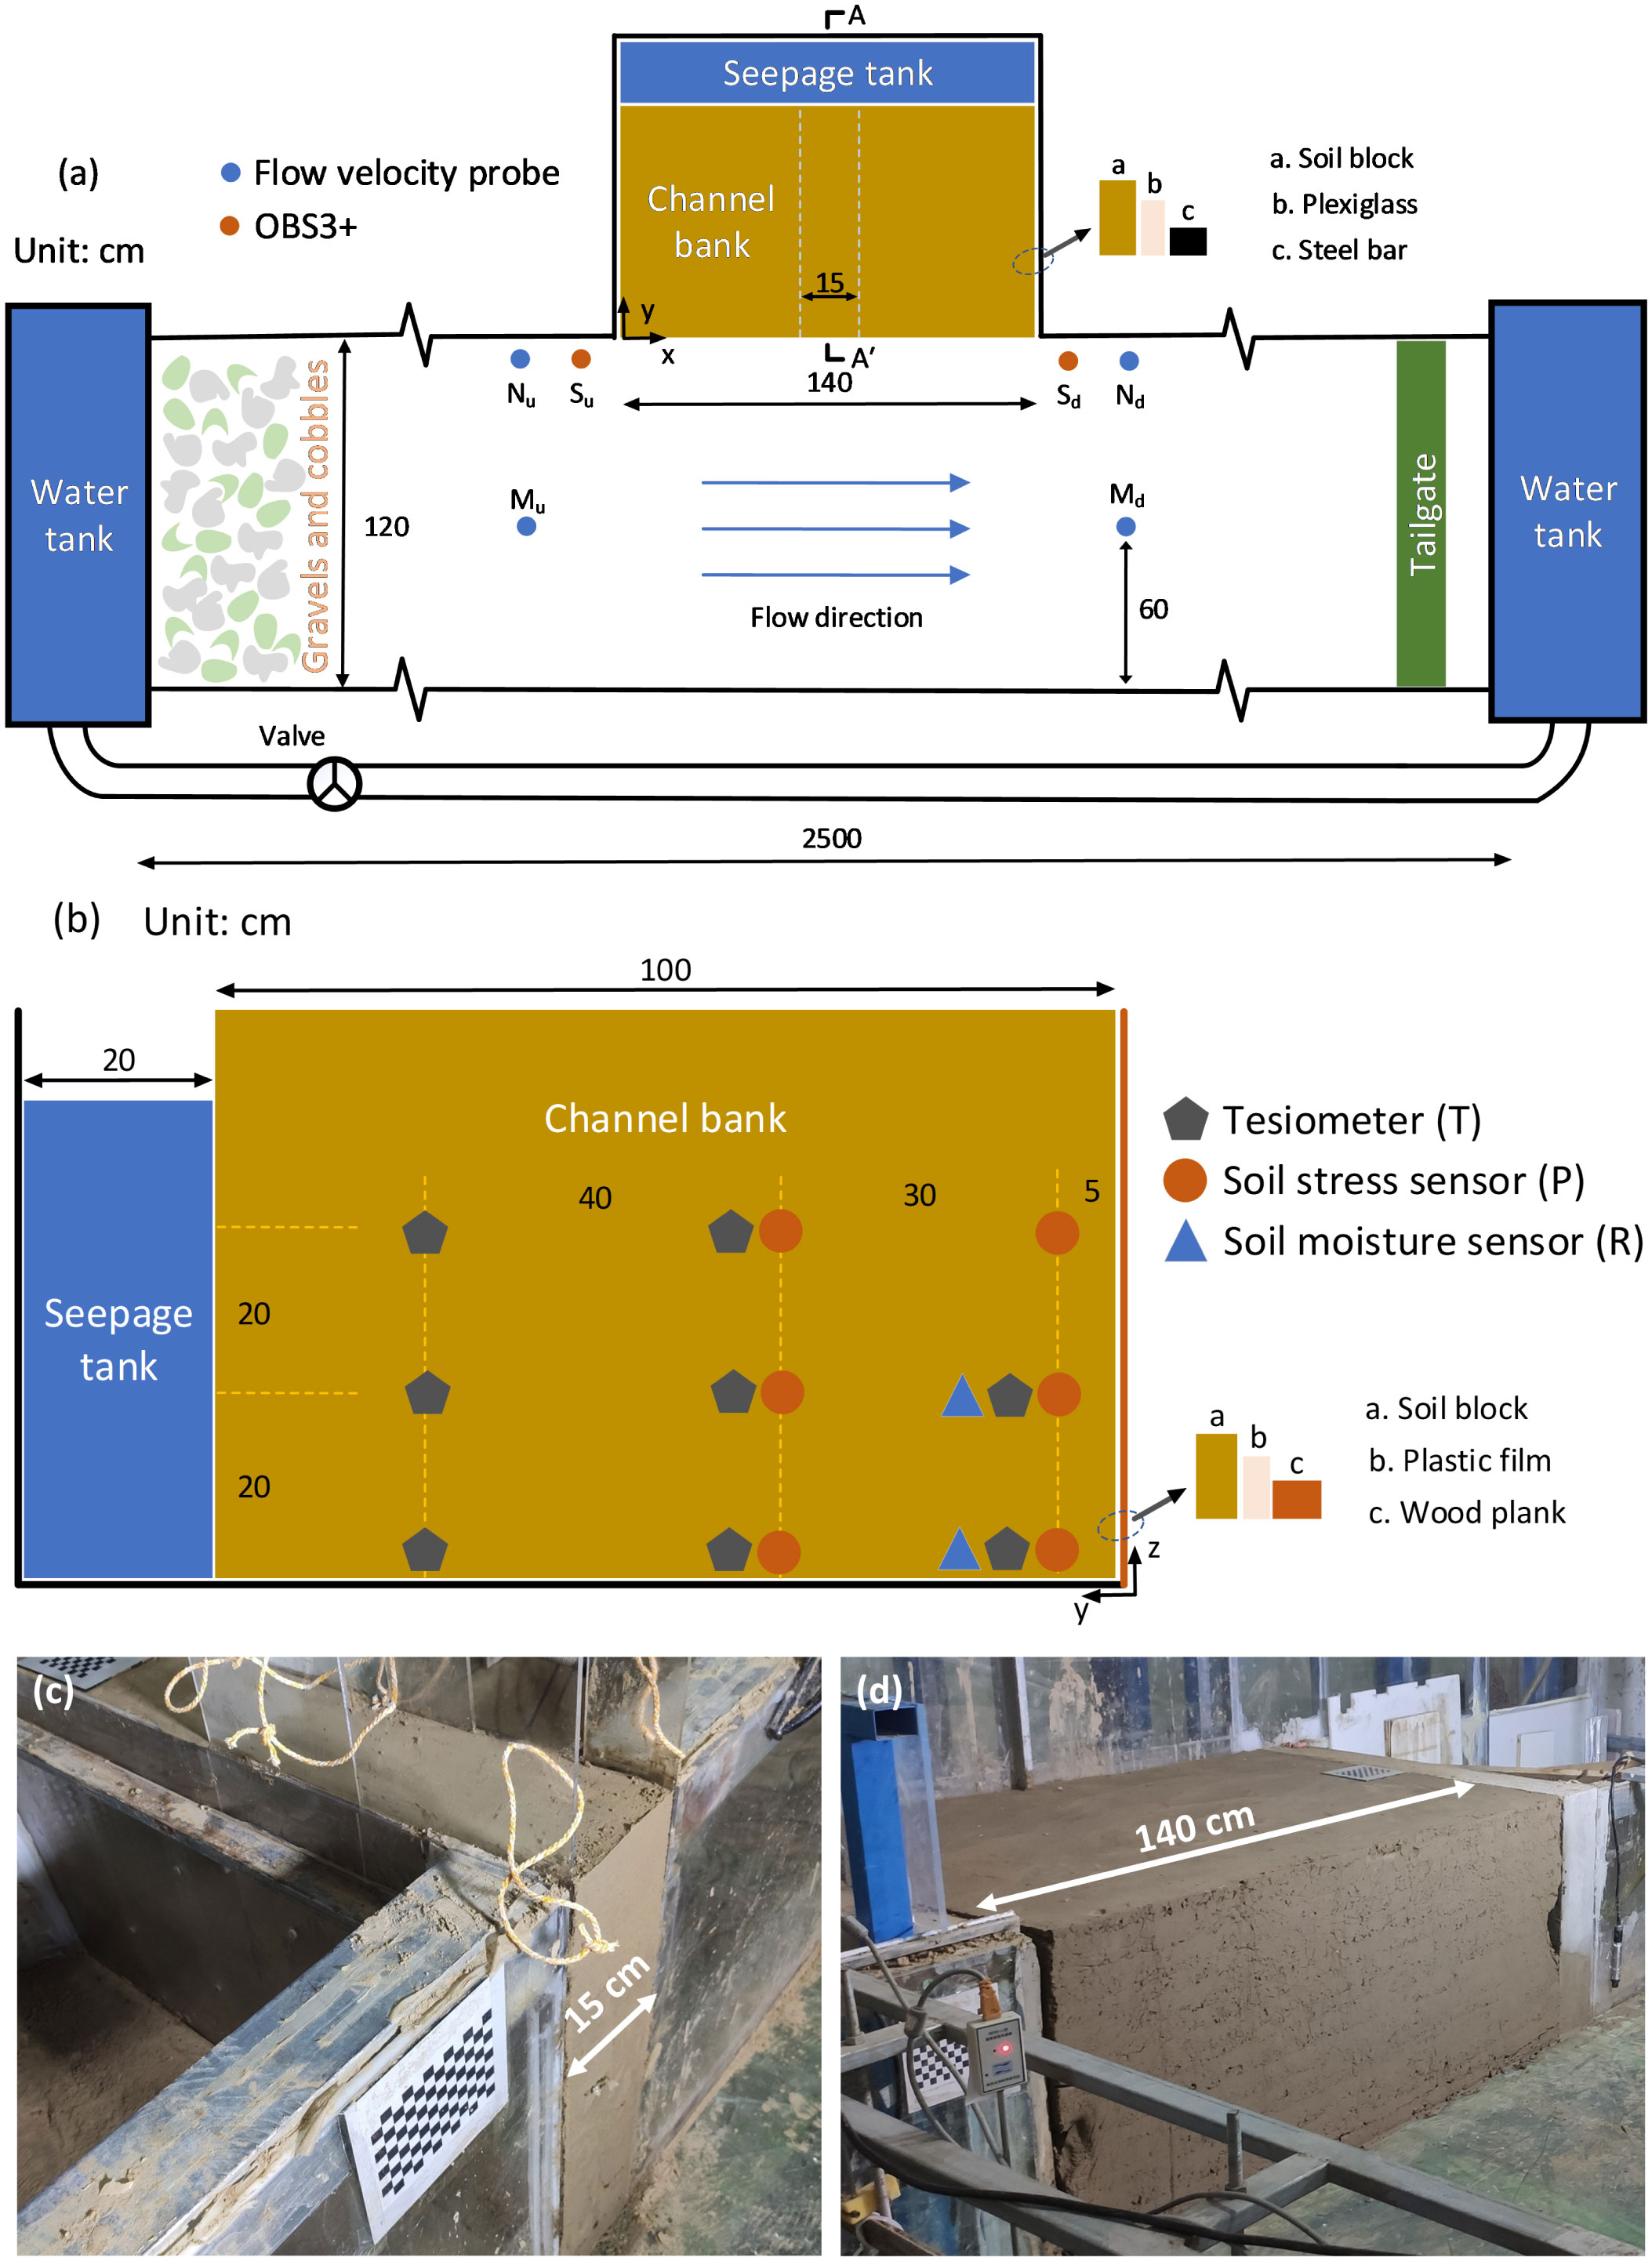
Figure 2 Experimental setup: (A) top view of the flume showing the position of the bank, the flow velocity probes, and the Optical Back Scatterings (OBSs); (B) lateral view of the simulated bank (A-A’ cross section in panel (A), showing the position of tensiometers, soil stress, and soil moisture sensors; (C) 2D channel bank; (D) 3D channel bank. Detailed position of tensiometers, stress and soil moisture sensors, flow velocity probes, and the OBSs is summarized in Table 2.
A soil tank made of plexiglass was placed on one side of the flume with dimensions (length × width × height) of 1.4 × 1.2 × 1 m (Figure 2A). A porous plate was arranged in the soil tank to separate the seepage tank from the channel bank. The porous plate was filled with glass wool to prevent soil backflow. The inlet and outlet were set up to control seepage head, and a filter was used to ensure a constant water level. The plexiglass side walls on both sides of the channel are removable, so that the bank length can decrease to 0.15 m (represented by the white dotted lines in Figure 2A). It was qualified for simulating experiments carried out by predecessors in the lysimeter. Under the condition that the width of the channel bank was set to 1 m (y direction in Figure 2B) and the height was set to 0.6 m (z direction in Figure 2B), the model experiments with a length of 0.15 m and 1.4 m (x direction in Figure 2A) can be called 2D experiments and 3D experiments, respectively.
The soil collected from the field site was used to build the bank. To facilitate soil layer compaction, a wooden plate was set in front of the soil block. Also, a plastic film was arranged between the bank and the plate to reduce the friction of plate removal on the soil. In order to reduce the squeezing effect of the side wall of the plexiglass box on the soil (Fox et al., 2007), two extractable plexiglass boards were arranged on both sides of the bank (Samadi et al., 2013). After the completion of the bank model, the plate in front of the bank and the plexiglass boards on both sides were carefully removed. The bank was successively built by creating a series of specified weight 20- cm‐high layers, and the soil layer was compacted with a hand hammer. Each layer was left under self‐gravity for about 16 h after compaction to allow for sufficient drainage and consolidation. Two checkerboards made of ceramic were set at the top and in front of the bank in order to estimate bank deformation and retreat more accurately and conveniently. Figures 2C, D show the example of the completed 2D and 3D experimental models.
Experimental procedures and data collection
Six experiments were carried out under different seepage head and duration (Table 2). We used 2D experimental equipment to conduct the first three experiments. Seepage heads of the EXP 1 and EXP 2 were set to 60 and 30 cm, respectively. There was no soil internal probe in EXP 3, since this experiment is used to compare the influence of probes and wires in 2D experiments. The 3D experimental equipment was used to carry out the latter three experiments. The seepage duration of EXP 4 and EXP 6 was set to 1 and 3 h, respectively, and we only used surface flow to scour the bank in EXP 5, which was used to analyze the failure type and process of the bank with or without seepage.
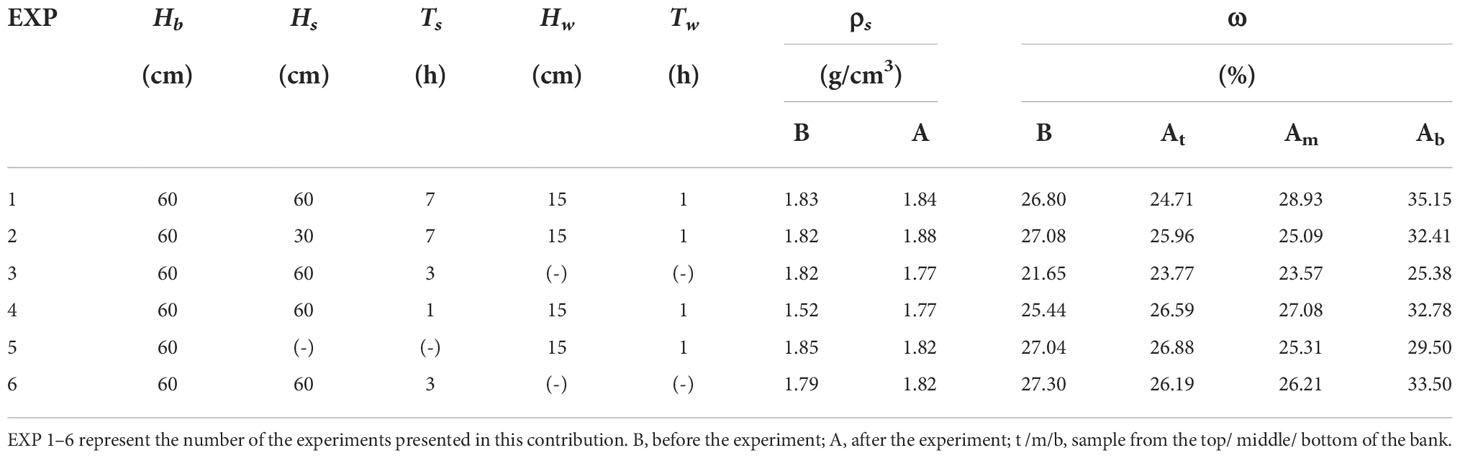
Table 2 Summary of experimental parameters.
At the beginning of each experiment, we injected water into the seepage tank through the inlet, rising the water level up to the target. The seepage head was then kept constant by turning on the outlet. The surface flow was included in front of the bank after a certain period of time. Two cameras were used to record the morphological changes of the bank in front of and directly above the bank during the experiments. In order to measure the flow velocity of the near-bank and mid-channel of the flume, the velocity probes were set in the position of upstream and downstream about 0.5 m from the bank. To measure the SSCs during each experiment, two OBSs were set at about 0.2 m from the upstream and downstream of the bank. Since the near-bank water depth (Hw) was set to 0.15 m, the flow velocity probes and the OBSs were arranged at a height of about 0.07 m from the bottom of the flume. A series of tensiometers, soil stress, and moisture sensors were set up in the channel bank (Figure 2B) to measure the changes of soil matric suction, total stress, and water content during the experiment. The above soil and water sensors were connected to the data collector through wires to record the data automatically. Planimetric and vertical positions of each instrument during the six experiments are listed in Table 3. After each experiment, soil samples were collected to measure the geotechnical parameters, including soil density (core cutter method) and water content of the bank top, middle, and bottom (oven drying method) (Table 2). In the EXP 4 and EPX 5, the flow was sampled upstream and downstream of the bank at every 10 min to calibrate the OBSs. The image, soil, and flow data were analyzed after each experiment through the following steps: (1) sorting out the failure type and process of each experiment through video and photos; (2) using image technology to obtain the bank line change and retreat scale; (3) analyzing the changes of geotechnical parameters in the process of each experiment; and (4) analyzing the changes of flow velocity and suspended‐sediment concentration during each experiment.
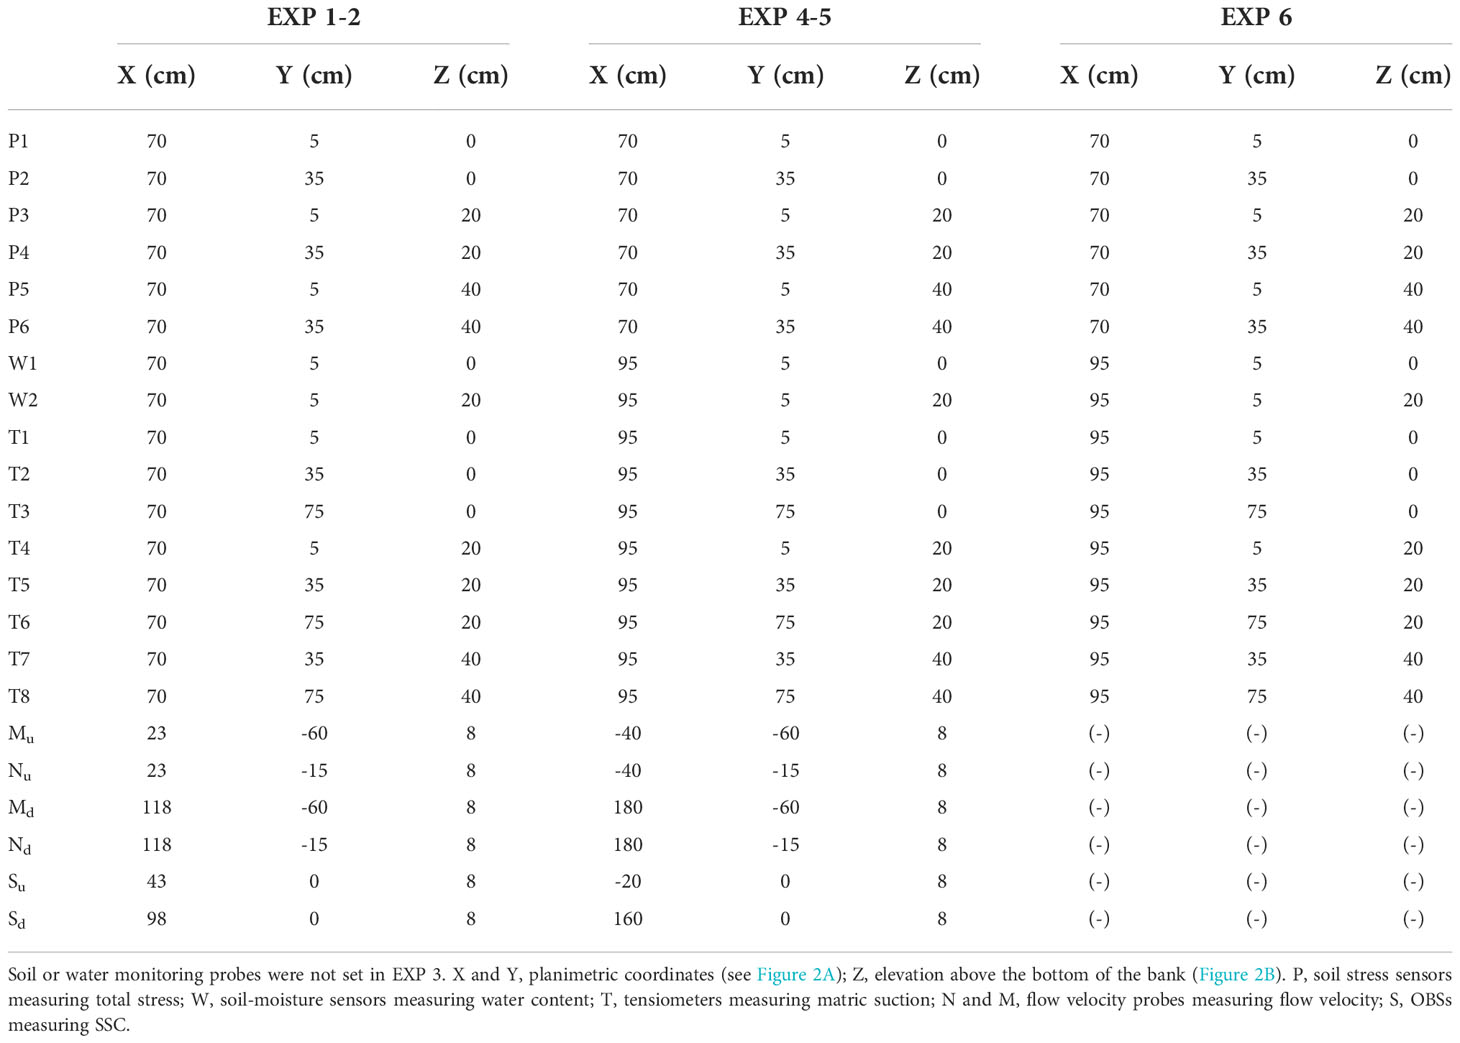
Table 3 Planimetric and vertical positions of tensiometers, stress, and soil moisture sensors, flow velocity probes, and OBSs during the six experiments.
According to the phenomena during the experiment, combined with the failure mode proposed by (Thorne and Tovey, 1981; Fox and Wilson, 2010), the bank failure types under the coupled effect of seepage and surface flow are defined and classified as follows: (1) seepage erosion: This process can be considered as the consequence of decrease of matric suction and shear strength in lower part of the bank under the effect of seepage and results in the commonly observed movement and undercutting of soil particles; (2) shear failure: When the shear stress of the cantilever block along the vertical plane under the action of gravity exceeds the shear strength of the soil, the cantilever block slips into the flume along the shear surface; (3) tensile failure: When the tensile stress caused by the weight of the cantilever block is greater than the tensile strength of the bank, the tensile failure occurs on the bank top. The tension crack propagates vertically downward, which shortens the effective length of the vertical sliding surface, and further leads to the occurrence of toppling failure; (4) toppling failure: As a result of the weight of the overhanging cantilever, this type of failure occurs when the rotational moment at the neutral axis exceeds the restoring moment of the cohesive force, the cantilever block rotates forward and falls into the flume.
Results
Bank collapse patterns and temporal change of the bank line
The failure process during each experiment is recorded by two cameras located on the front and above of the bank (Figures 3 and 4). The type and timing of bank failures of each experiment were recorded in Table 4.
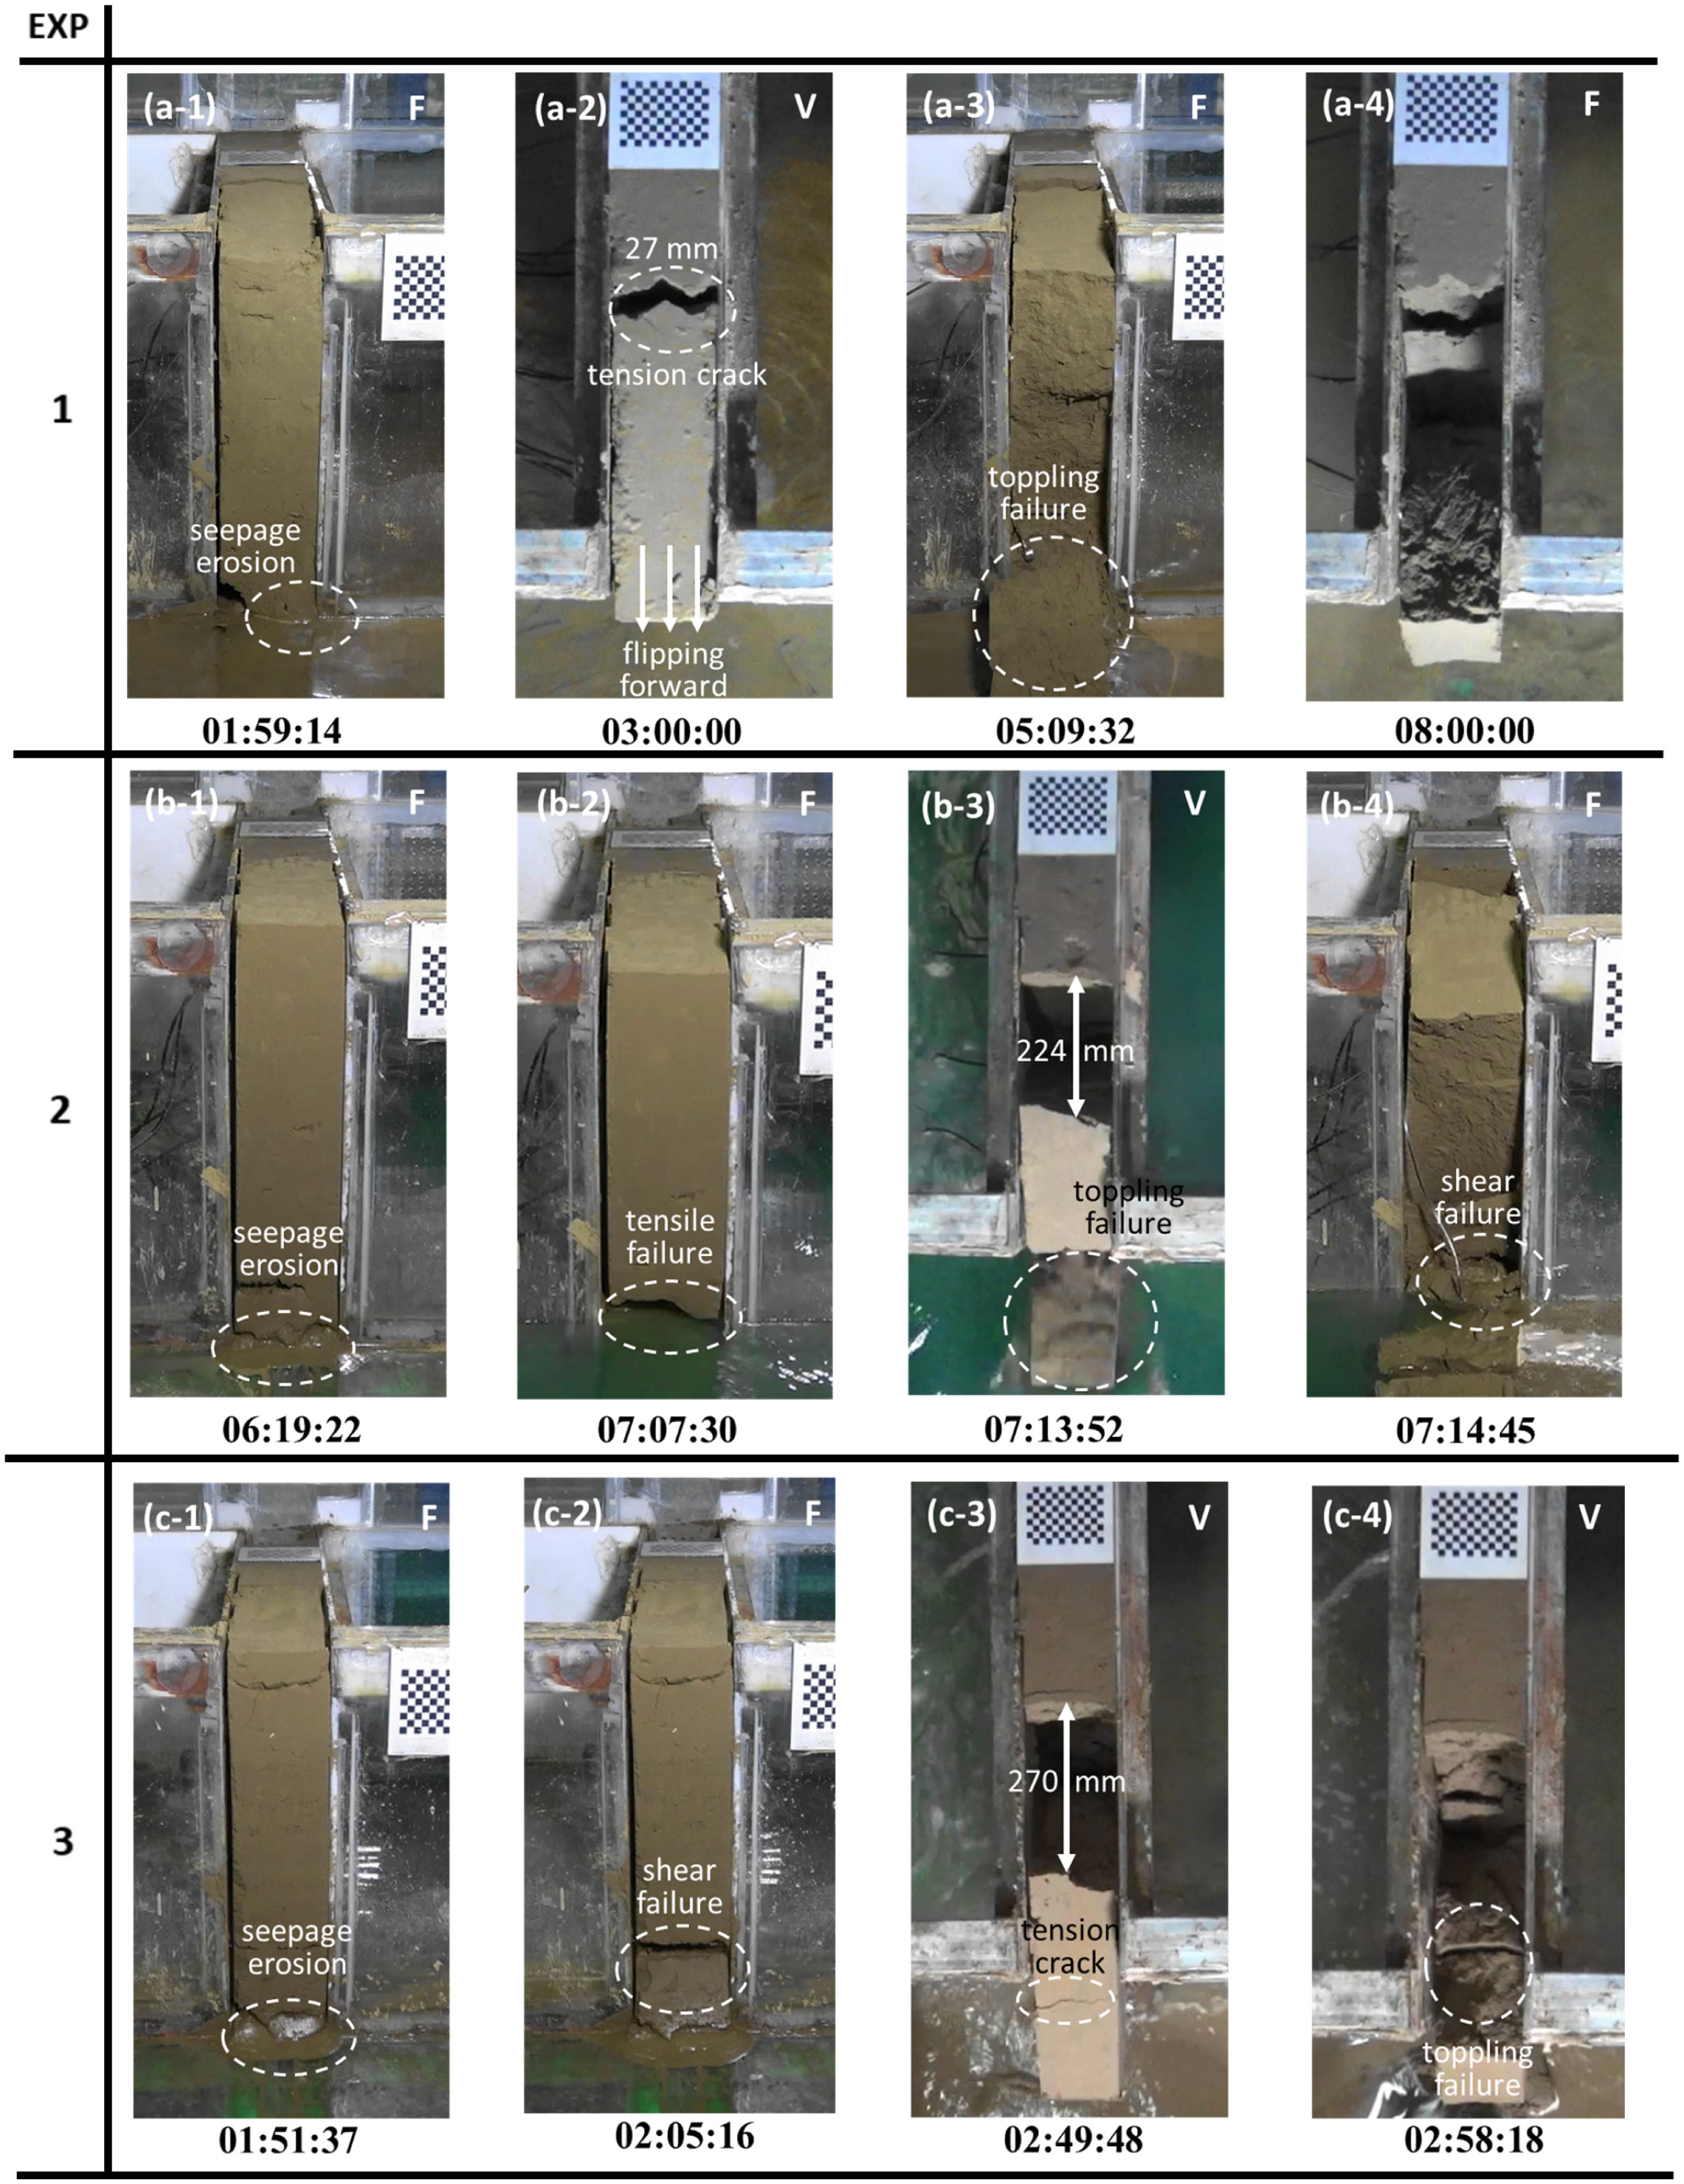
Figure 3 Photos of bank profile evolution during each 2D experiment: (A) EXP 1: Hs = 60 cm, Ts = 7 h, Hw = 15 cm, Tw = 1 h; (B) EXP 2: Hs = 30 cm, Ts = 7 h, Hw = 15 cm, Tw = 1 h; (C) EXP 3: Hs = 60 cm, Ts = 3h. F, front view; V, vertical view.
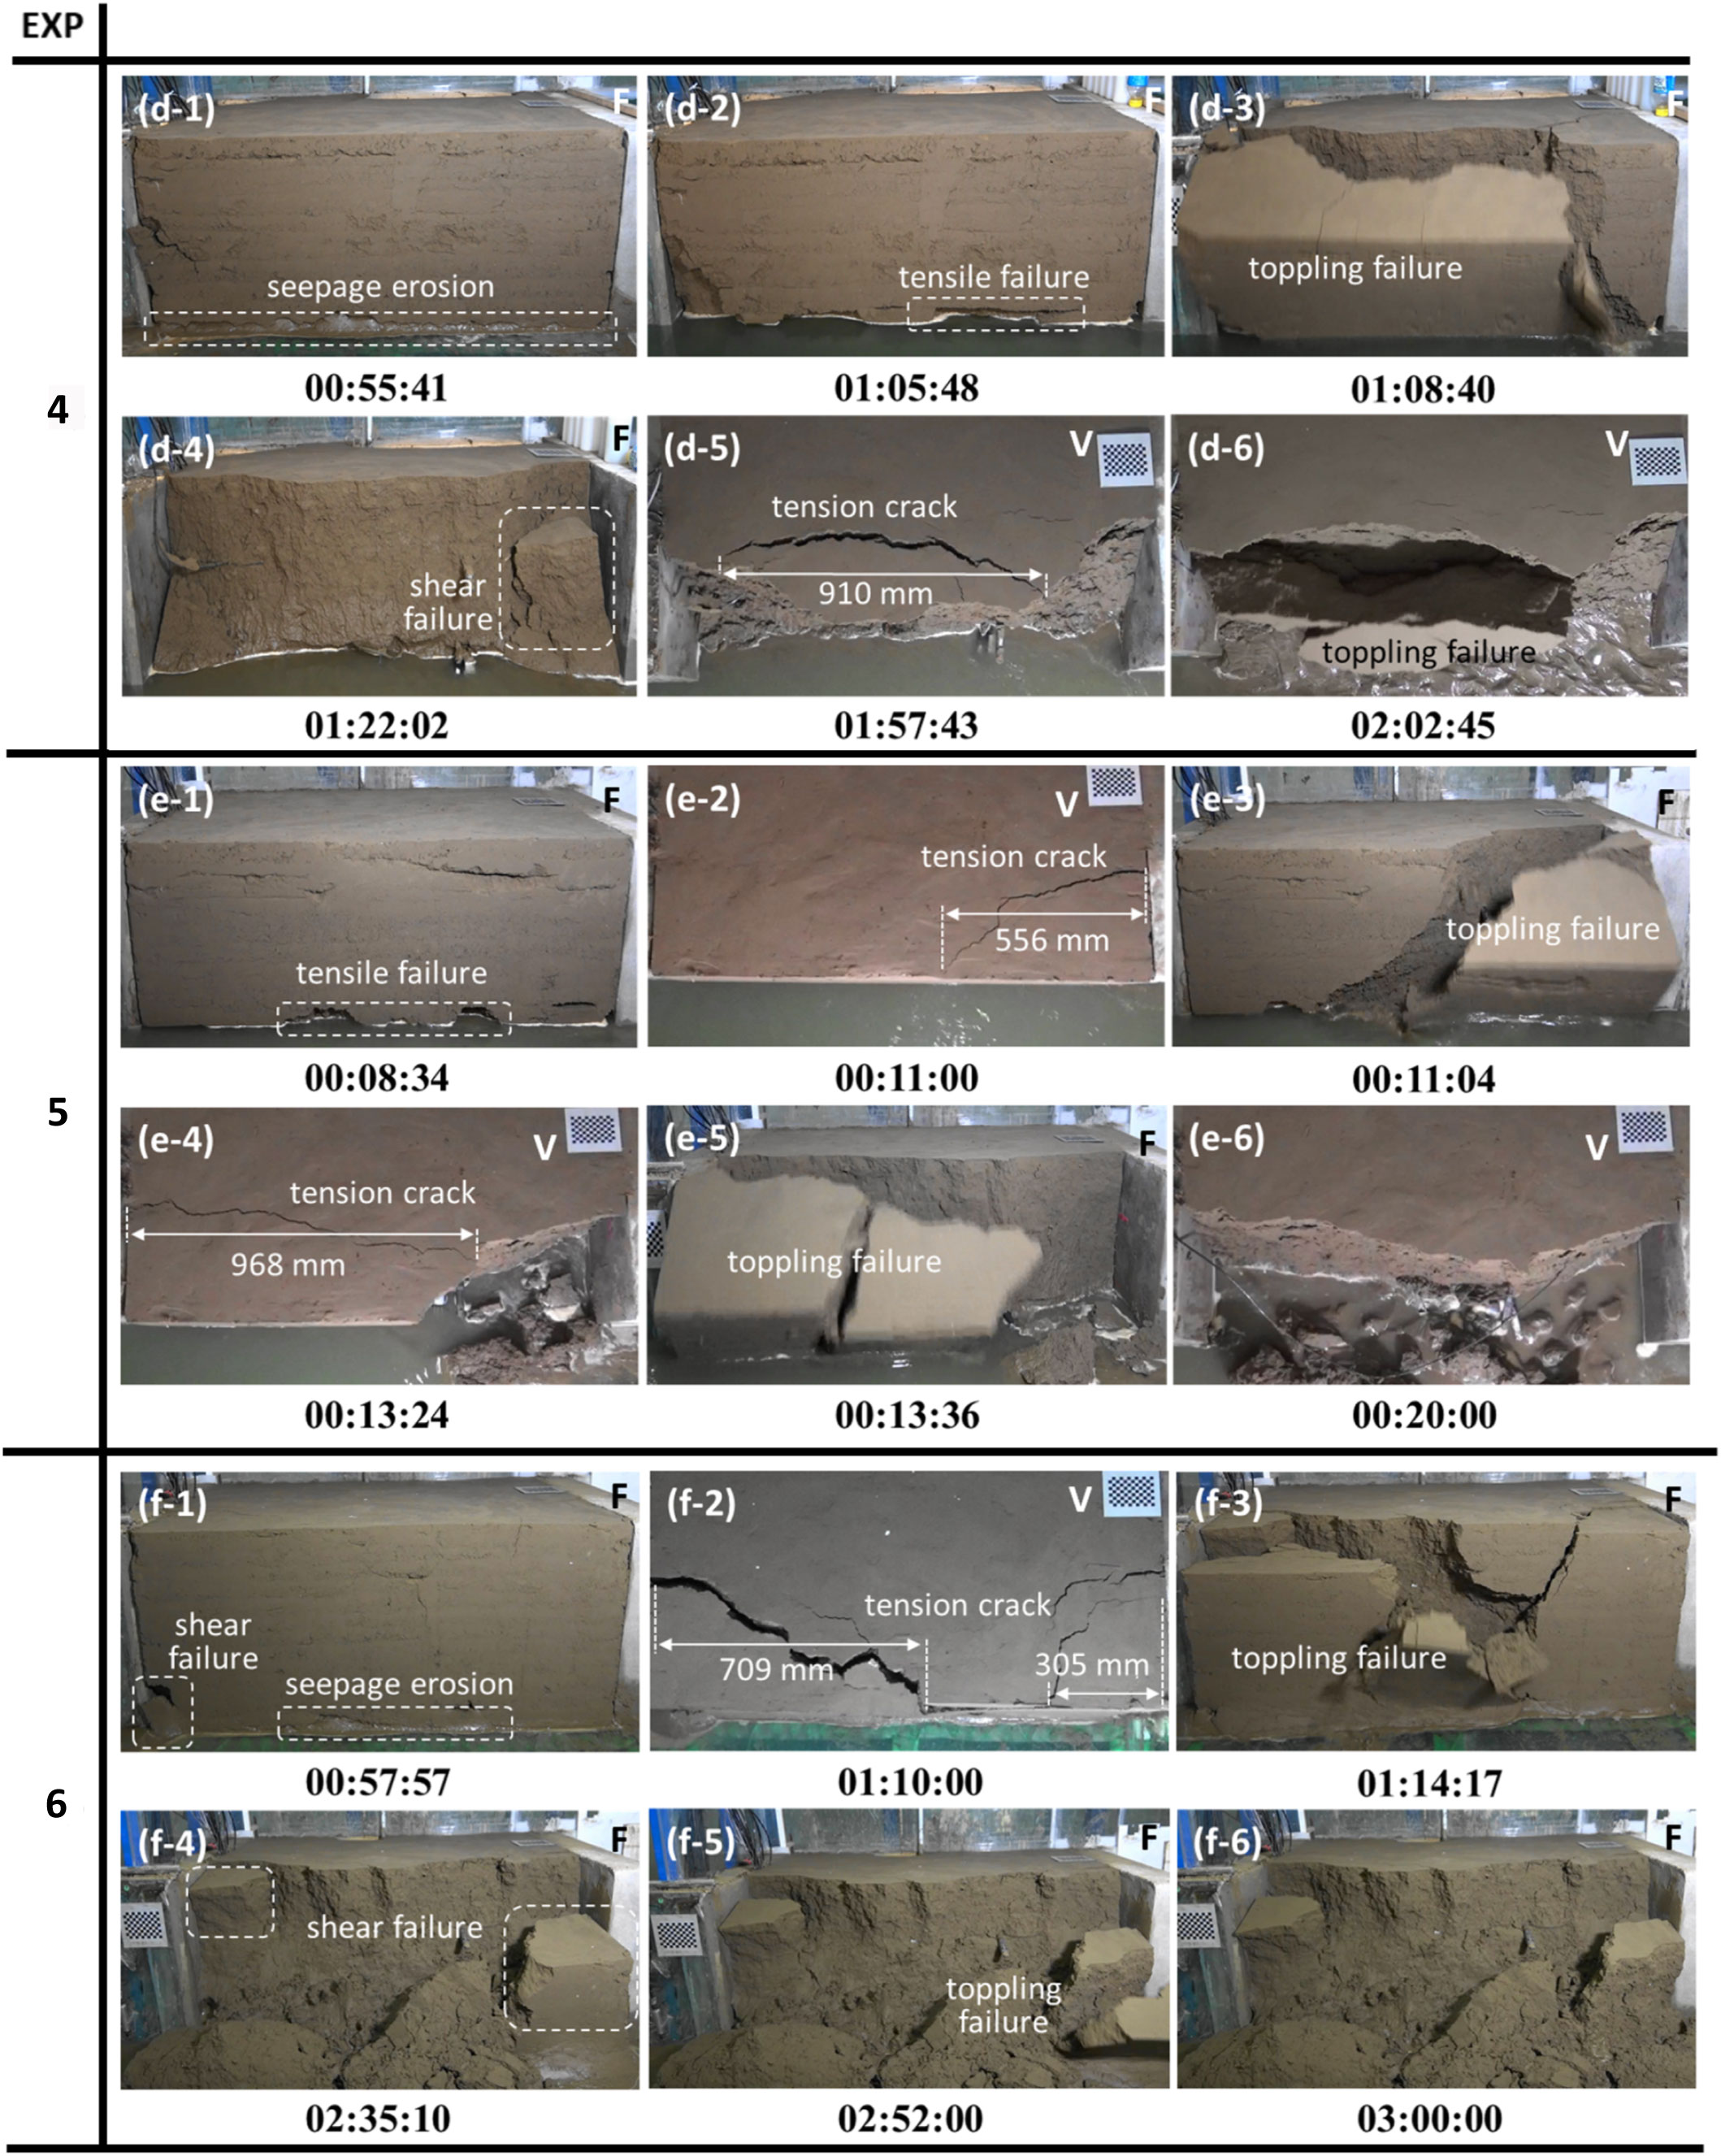
Figure 4 Photos of bank profile evolution during each 3D experiment: (D) EXP 4: Hs = 60 cm, Ts = 1 h, Hw = 15 cm, Tw = 1 h; (E) EXP 5: Hw = 15 cm, Tw = 1 h; (F) EXP 6: Hs = 60 cm, Ts = 3 h. F, front view; V, vertical view.
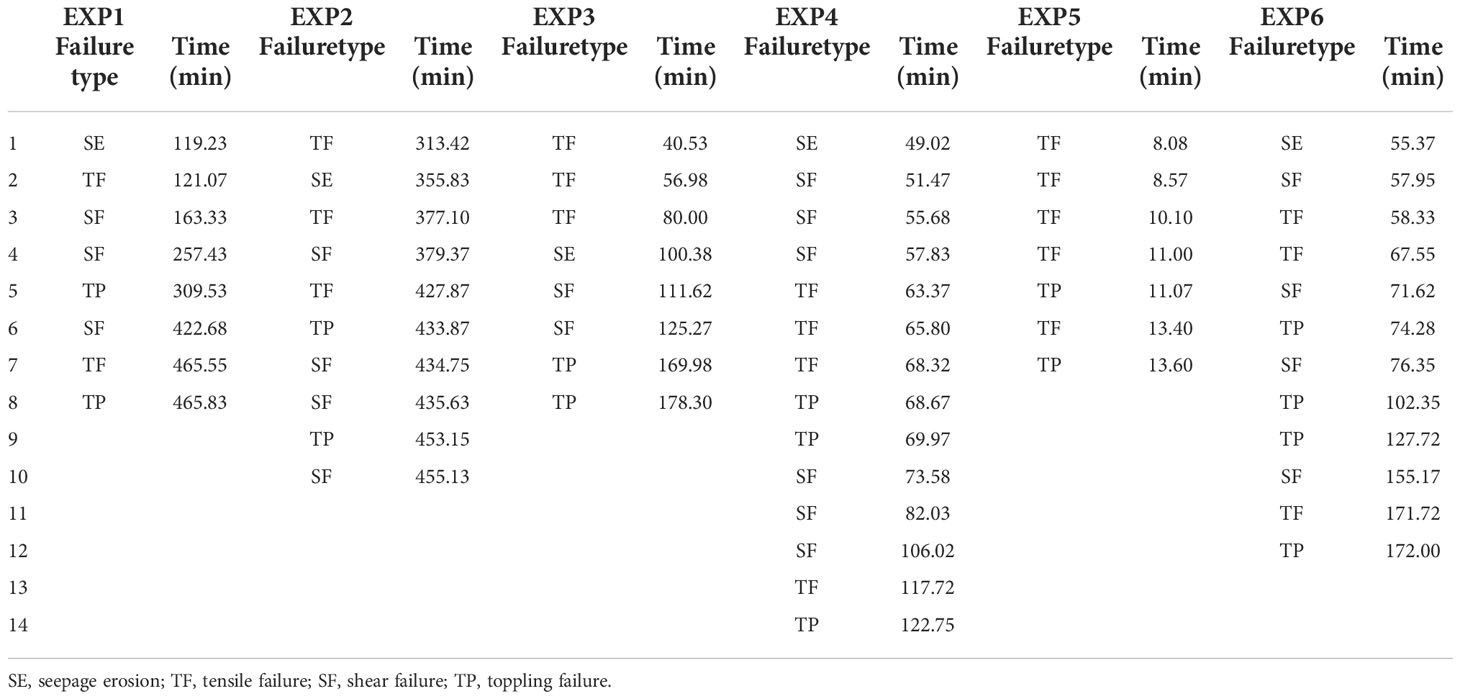
Table 4 Summary of failure types and time in each experiment.
EXP 1 (Hs = 60 cm, Ts = 7 h, Hw = 15 cm, Tw = 1 h). The starting time of the experiment was defined as the time when the water level in the seepage tank rose to a constant value. At 119 min (Figure 3A1), the softening of soil was observed at the bank toe. A little soil block on the left side fell off, through which part of the seepage flowed into the flume, and the soil on the right was squeezed and discharged into the flume. Under the action of gravity, one tension crack of 15- cm long was observed on the bank top at 121 min, and then the block in front of the crack slowly flipped forward with increased width of the crack. At 180 min (Figure 3A2), the crack width on the bank top increased to 27 mm. After about 2 h (309 min, Figure 3A3), another tension crack appeared at the top of the forward inclined block, followed by a massive toppling failure. When the experiment was carried out to 7 h (420 min), surface flow was included in front of the bank for scouring. The submerged slump blocks were quickly eroded by the current, which accelerated the formation of the cantilever and the process of flipping the block forward. By the time of 7.5 h (450 min), the width of the tension crack had expanded to 201 mm. All the slump blocks consequent to toppling failures were eroded by the current. After about 15 min, obvious tension cracks appeared at the top of block, and then toppling failure occurred. By the end of the 8 h (480 min, Figure 3A4) experiment, the soil block had been completely flipped into the flume.
EXP 2 (Hs = 30 cm, Ts = 7 h, Hw = 15 cm, Tw = 1 h). Different from EXP 1, the seepage head of EXP 2 was reduced to 30 cm. It was evident that the retreat process of the bank of EXP 2 under the action of seepage slowed down greatly. For example, when the experiment was carried on for 6 h, tension cracks appeared on the bank top. After 13 min (313 min), a tension crack about 10 cm appeared at the bank bottom, and then (319 min, Figure 3B1) we observed the phenomenon of seepage undercutting. Before the surface flow was included at 7 h (420 min), the forward flipping process of the soil block was very slow. In the case of 427 min (Figure 3B2), a tensile failure occurred above the soil–water interface, and then a small piece of soil fell off into the current. The rapid erosion of the soil at the bank bottom by surface flow greatly accelerated the process of forward flipping and overturning of the upper soil. The tension cracks and subsequent toppling failure at the bank top were observed at 7 h 13 min (433 min, Figure 3B3) and 7 h 33 min (453 min), respectively. A shear failure occurred near the bank bottom (434 min, Figure 3B4). By the end of the 8 h (480 min) experiment, the failure scale of the bank was basically the same as that of EXP1.
EXP 3 (Hs = 60 cm, Ts = 3 h). In view of the appearance of sensors and wires after toppling failure in EXP 1 (Figure 3A3) and EXP 2 (Figure 3B4) and the phenomenon that the soil was flipping too slowly under the condition of seepage, taking into account the larger volume of the sensors relative to the 2D experimental soil (although the volume of the sensors used had been reduced as much as possible) and the pulling force of the wire on the forward inclination of the soil block, we set EXP 3 without any sensor for comparison to analyze the influence of sensors and wires in 2D experiments. At the beginning of 1.5 h of seepage (90 min), several tension cracks appeared at the bank top, and then (111 min, Figure 3C1) a massive undercutting was observed at the bank toe. After about 14 min (125 min, Figure 3C2), shear failure of soil appeared at the bank toe and slid into the flume. The forward flipping of the block was obviously faster after the occurrence of the tension crack on the bank top of EXP 3 than that in EXP 1 and EXP 2. The width of the top tension crack had reached 270 mm at nearly 3 h (169 min, Figure 3C3), another tension crack appeared at the top of the front flipping block and the toppling failure occurred subsequently. At the end of the experiment (178 min, Figure 3C4), the failure scale of the bank was basically the same as that of EXP 1 and EXP 2. In summary, the retreat process of EXP 3 was greatly accelerated under the condition of only seepage, which shows that the sensors and wires had obvious inhibitory effect on the forward flipping process of bank in 2D experiment. In addition, 2D experiment cannot simulate inhomogeneous cantilever failure, complex flow characteristics near and inside cohesive bank, longitudinal gradient of sediment transport, pore-water pressure, or slump block effect (Fox et al., 2007; Patsinghasanee et al., 2017). Therefore, it is necessary to adopt 3D experiment (EXP 4–6) with larger bank width.
EXP 4 (Hs = 60 cm, Ts = 1 h, Hw = 15 cm, Tw = 1 h). Massive erosion was observed at the bank toe after about 1 h (55 min, Figure 4D1). After the inclusion of surface flow (65 min, Figure 4D2), we observed the tensile failure above the soil–water interface. The submerged soil block was washed rapidly, accelerating the formation of the cantilever, and huge tension cracks appeared at the bank top after 3 min (68 min, Figure 4D3). Subsequently, a large-scale toppling failure occurred, generating slump blocks at the bank toe. On the one hand, the newly formed bank toe retarded the further scouring of the bank by the surface flow; on the other hand, the toppling failure caused the expansion of the flow section in front of the bank, leading to the reduction of the flow velocity and the slowing down of the scouring rate on the bank. Subsequently (82 min, Figure 4D4), under the action of gravity, the soil mass on the right side of the bank slid into the flume vertically. Near the end of the experiment (117 min, Figure 4D5), a tension crack about 910 mm appeared at the bank top and expanded continuously, and then (122 min, Figure 4D6) a toppling failure occurred in the block in front of the crack. The shape of the final bank profile was characterized by the upper vertical scarp and the middle and lower gentle slope.
EXP 5 (Hw = 15 cm, Tw = 1 h). We did not set seepage in EXP 5 in order to compare with other experiments to analyze the specific role of seepage in the process of bank retreat. Similar to EXP 4, shortly after the inclusion of surface flow (8 min, Figure 4E1), the bank toe was eroded by the current, and a series of tensile failures appeared above the water surface. A few minutes later (11 min, Figure 4E2), a tension crack about 556 mm was observed at the bank top, and the crack immediately extended to the bank toe, followed by a massive toppling failure. At about 13 min (Figure 4E4), another tension crack about 948 mm appeared on the bank top, then a toppling failure occurred in the block in front of the crack. No other failure was observed until the end of the 1h experiment. The final bank was characterized by vertical shape (Figure 4E6).
EXP 6 (Hs = 60 cm, Ts= 3 h). When the inclusion of seepage was close to 1 hour (57 min, Figure 4F1), the shear failure and seepage erosion of small pieces of soil were observed on the left and middle of the bank toe, respectively. This phenomenon reflected the important characteristics of the preferential flow pathways of seepage under the condition of 3D experiment. After a period of time (70 min, Figure 4F2), two tension cracks about 709 and 305 mm appeared on the left and right sides of the bank top and expanded continuously. Then, (74 min, Figure 4F3) a toppling failure occurred on the left bank, and the slump blocks entered the flume to form the bank toe. At the time of 155 min (Figure 4F4), the shear failure of a large piece of soil occurred on both the left and right sides of the bank, after a period of time (172 min, Figure 4F5), a toppling failure occurred on the right part of the bank. By the end of the 3h experiment (180 min, Figure 4F6), the final bank shape was characterized by upper vertical scarp, middle, and lower gentle slope, which was similar to that of EXP 4.
Figure 5 shows the evolution of bank line over time. After the sediment at the bank toe is quickly washed away, the toppling failure occurs on the formed cantilever. The first toppling failure of EXP 4 and EXP 5 occurs around the inclusion of surface flow 10 min, and the interval between the first and second toppling failure in the two experiments is 1–2 min. The first two toppling failures of EXP 4 and EXP 5 extend to the leftmost or rightmost end of the bank. The retreat distance of the middle in EXP 4 (Figure 5A) and EXP 5 (Figure 5B) is about 20-25 cm, of the left and right sides is close to 40 cm, but the failure sequence of the two sides is different in the two experiments. This phenomenon is different from that reported in Zhao et al. (2020), where the first toppling failure is concentrated in the middle of the bank, and the bank line is curved. This discrepancy can be ascribed to the usage of plexiglass boards on both sides of the bank, which greatly reduces the stress concentration on both sides of the bank. In order to reduce the influence of the sides on the test results, the general test only takes part of the soil near the middle of the bank for analysis. The soil mass washed away by flow cannot be reused, so the amount of soil mass used in the experiment is too large. The operation of extracting the boards before the experiment makes the experimental results closer to the actual situation in the field and can also reduce the waste of materials in the experiment. Different from EXP 5, we observed the third toppling failure in the middle of the bank about 1 h after the second toppling failure in EXP 4. It is worth noting that the toppling failure is not only based on the cantilever but is also the result of the reduction of soil matric suction in the middle and lower part of the bank and the bending moment induced by undercutting due to the influence of seepage. Compared with the condition of considering only surface flow, this failure reflects different toppling failure mechanism and higher failure frequency under the coupled effect of seepage and surface flow.
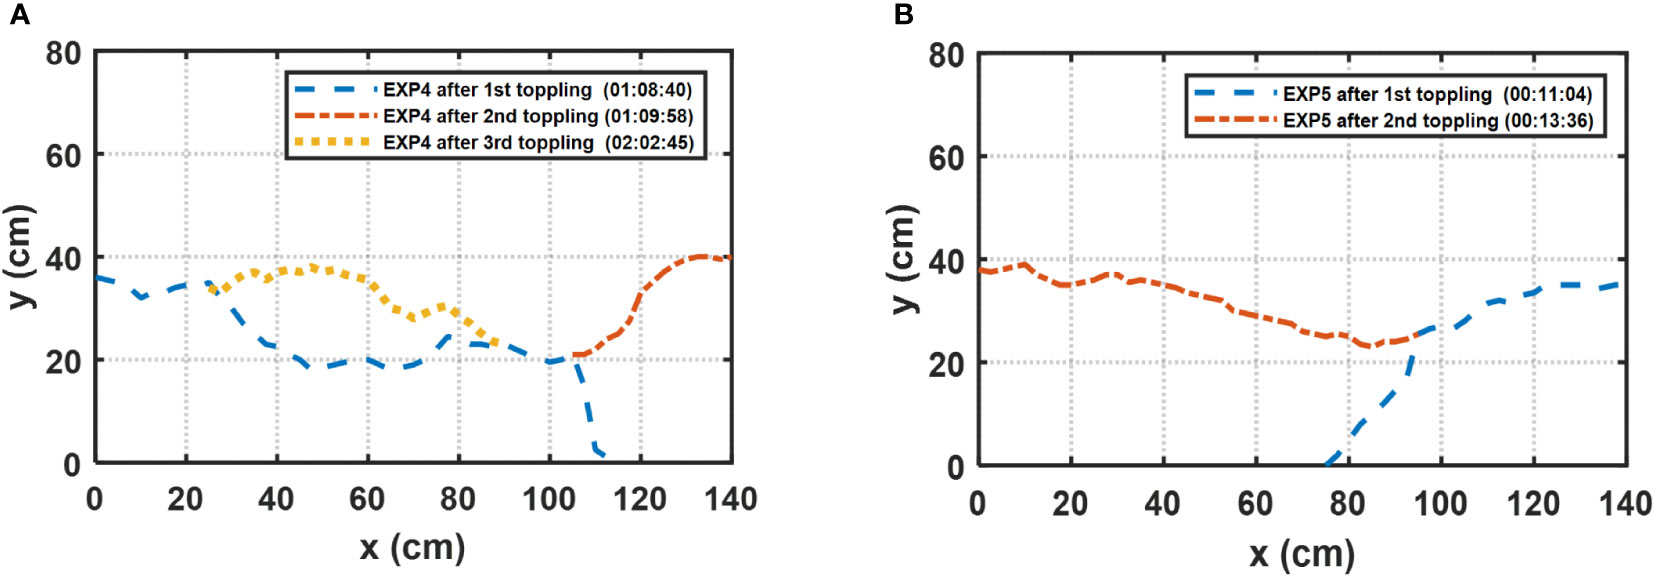
Figure 5 Bank line evolution of experiments extracted from Figure 4: (A) EXP 4; (B) EXP 5. The x and y directions are consistent with those in Figure 2A.
Geotechnical parameters
Figure 6 shows the changes of soil total stress, matric suction, water content with time, and different failure types during each experiment.
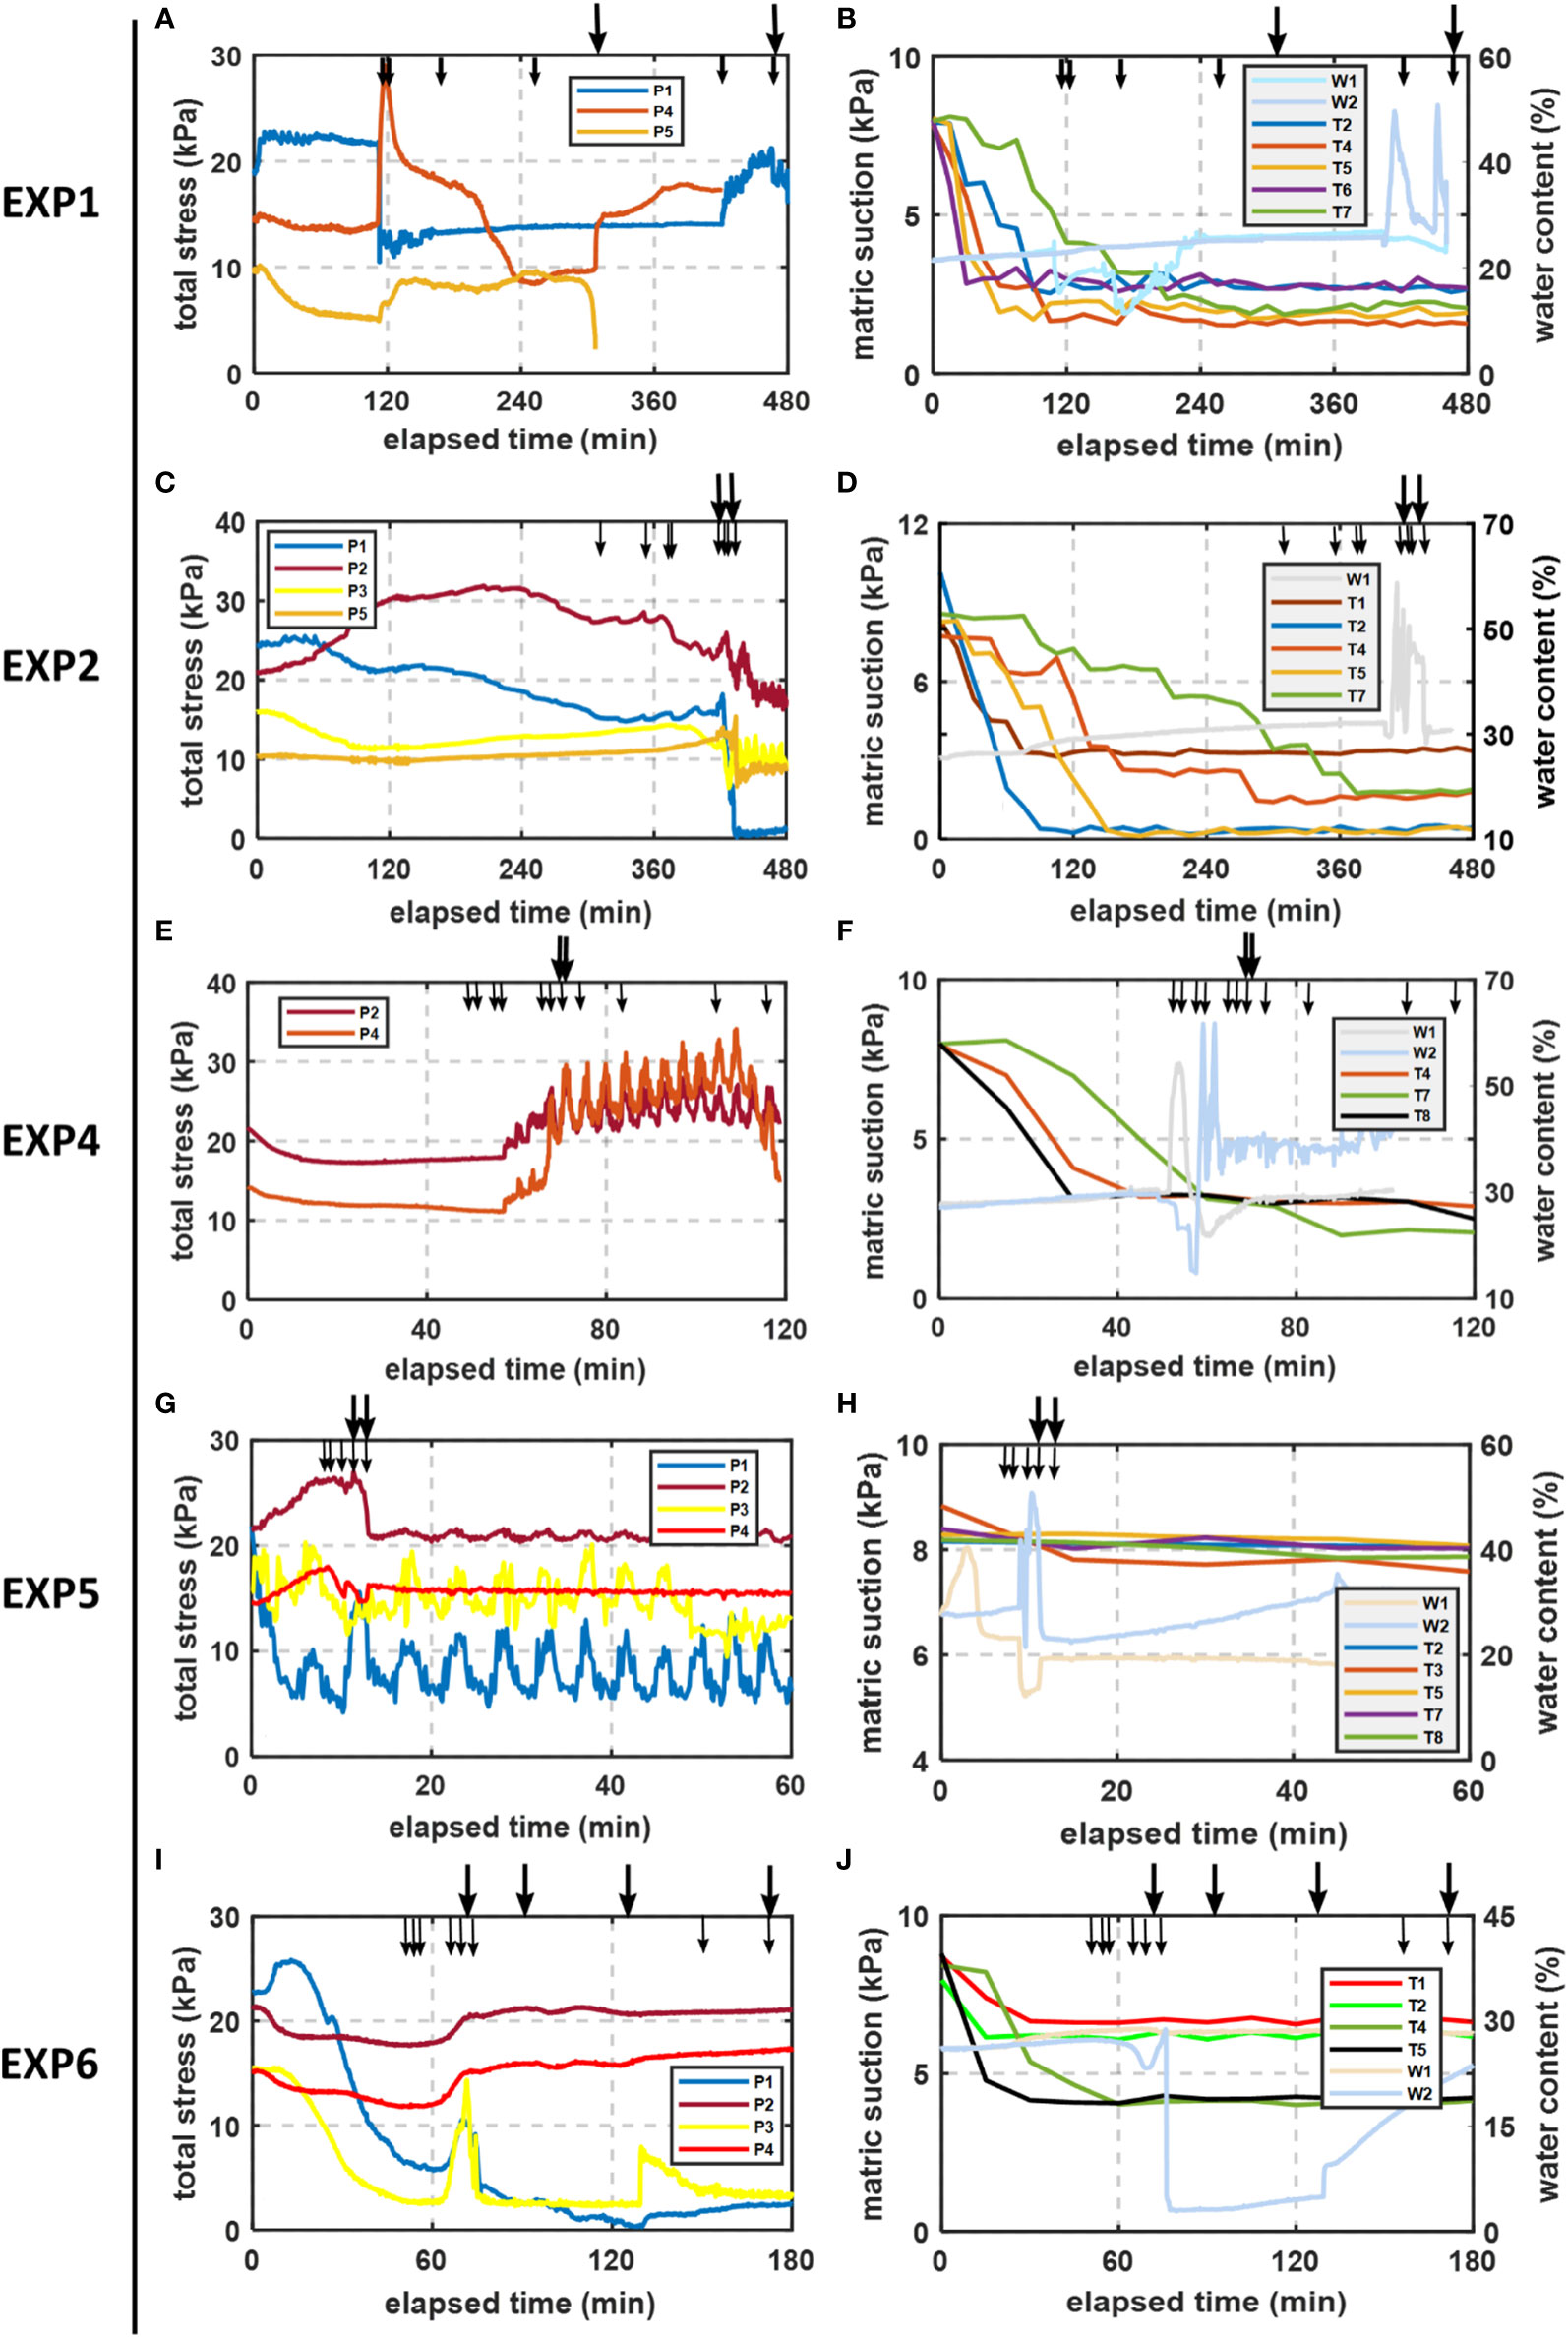
Figure 6 Temporal evolution of soil total stress, matric suction, and water content: (A) total stress in EXP 1; (B) matric suction and water content in EXP 1; (C) total stress in EXP 2; (D) matric suction and water content in EXP 2; (E) total stress in EXP 4; (F) matric suction and water content in EXP 4; (G) total stress in EXP 5; (H) matric suction and water content in EXP 5; (I) total stress in EXP 6; (J) matric suction and water content in EXP 6. Arrows indicate the occurrence of bank failure: large arrows represent toppling failure whereas the small arrows indicate seepage erosion, tensile, and shear failures. P, soil stress sensor; W, soil moisture sensor; T, tensiometer. Position of sensors can be found in Figure 2 and Table 2.
EXP 1 (Hs = 60 cm, Ts = 7 h, Hw = 15 cm, Tw = 1 h) (Figures 6A, B). In the first 2 h of the experiment, the soil moisture content at R1 and R2 increased slightly as seepage entered the bank, and the data of matric suction sensor decreased rapidly. At 119 min, undercutting and shear failure occurred at the bank toe, leading to a rapid decrease in P1. Tension cracks occurred at the bank top under the action of soil gravity and induced bending moment; P4 and P5 were increased in varying degrees under the influence of stress concentration. In the process of slowly flipping the bank forward, the value of P4 decreased gradually. At 339 min, the stress concentration and release made P4 increase rapidly and the subsequent toppling failure pulled P5 away from the soil, resulting in a sharp decrease in the value. The numerical change rate of each matric suction sensor can reflect the advancing rate of the saturation line in the soil, and the change rate was T2, T5, T4, T6, and T7 in turn. The saturation line advanced the fastest in the lower part of the bank, followed by the middle part. The upper part is the slowest. After 2 h of the experiment, the matric suction of the middle and lower part of the soil was basically stable, the bank was close to saturation, and the upper (T7) part is close to saturation in about 5 h of the experiment. After the surface flow was included in the experiment at 7 h, under the influence of repeated toppling and shear failures, the water content at W2 changed greatly, and P1 increased slightly due to the action of water pressure.
EXP 2 (Hs = 30 cm, Ts = 7 h, Hw = 15 cm, Tw = 1 h) Figures 6C, D. Similar to EXP 1, the matric suction decreased gradually under the action of seepage. As the seepage head was half of EXP 1, the saturation line advancing speed slowed down significantly, and the bottom erosion and bank top tension cracks were observed at 6 h of the experiment. Before the surface flow was included, P1 at the front of the bank toe gradually decreased under the influence of seepage, and the vibration caused by the inclusion of surface flow made the values of sensors fluctuate obviously. After the two toppling failures of 433 min and 453 min, the values of each soil stress sensor decreased obviously, and the lack of soil above P1 led to its value close to 0.
EXP 4 (Hs = 60 cm, Ts = 1 h, Hw = 15 cm, Tw = 1 h) (Figures 6E, F). The saturation line advancing rate of the 3D experiment was about twice as fast as that of the 2D (EXP 1) due to the existence of the preferential flow pathways. At 1 h of the experiment, the matric suction was basically stable, and the total soil stress of P2 and P4 decreased slightly under the action of seepage. After the surface flow was included, the water content of W2 near the water surface increased significantly. Under the action of bending moment, P4 increased greatly due to stress concentration before the two massive toppling failures ( 68 and 69 min).
EXP 5 (Hw = 15 cm, Tw = 1 h) (Figures 6G, H). Under the condition of lack of seepage, there was no obvious change in the matric suction of the soil during the EXP 5. The soil at the bank toe was scoured by surface flow, and P1 decreased obviously; the formation of cantilever led to the increase of soil total stress at P2 and P4 in varying degrees. The soil stress was released after two adjacent massive toppling failures (11 and 13 min), and P2 decreased rapidly. The slump blocks formed bank toe, which hindered the scouring of surface flow and the formation of cantilever. Under the condition that the soil properties inside the bank did not change obviously due to the lack of seepage, no other damage was observed in the rest of the experiment.
EXP 6 (Hs = 60 cm, Ts = 3 h). Similar to the changes observed in EXP 4, the matric suction decreased significantly and remained stable in the first hour of EXP 6 (Figures 6I, J). The stress of P1 and P3 located in front of the bank decreased obviously under the influence of seepage, and the stress in P2 and P4 in the middle part decreased slightly. The toppling failure at 70 min made P1 and P3 increase rapidly and then decrease sharply. The value of W2 leaked into the air decreased rapidly after the failure. After another toppling failure of 127 min, the soil block covered it, so its value increased accordingly. P2 and P4 located in the middle of the bank were not greatly affected by the subsequent shear and toppling failures.
Flow velocity and suspended‐ sediment dynamics
Figure 7 shows the change of flow velocity in the near-bank (Nd) and mid-channel (Md) downstream of the bank after the inclusion of surface flow in EXP 1 (Figure 7A), EXP 2 (Figure 7B), EXP 4 (Figure 7C) and EXP 5 (Figure 7D), and Figure 8 shows the change of sediment concentration in the upstream (Su) and downstream (Sd) flow of the bank after the inclusion of surface flow in EXP 4 (Figure 8A) and EXP 5 (Figure 8B).
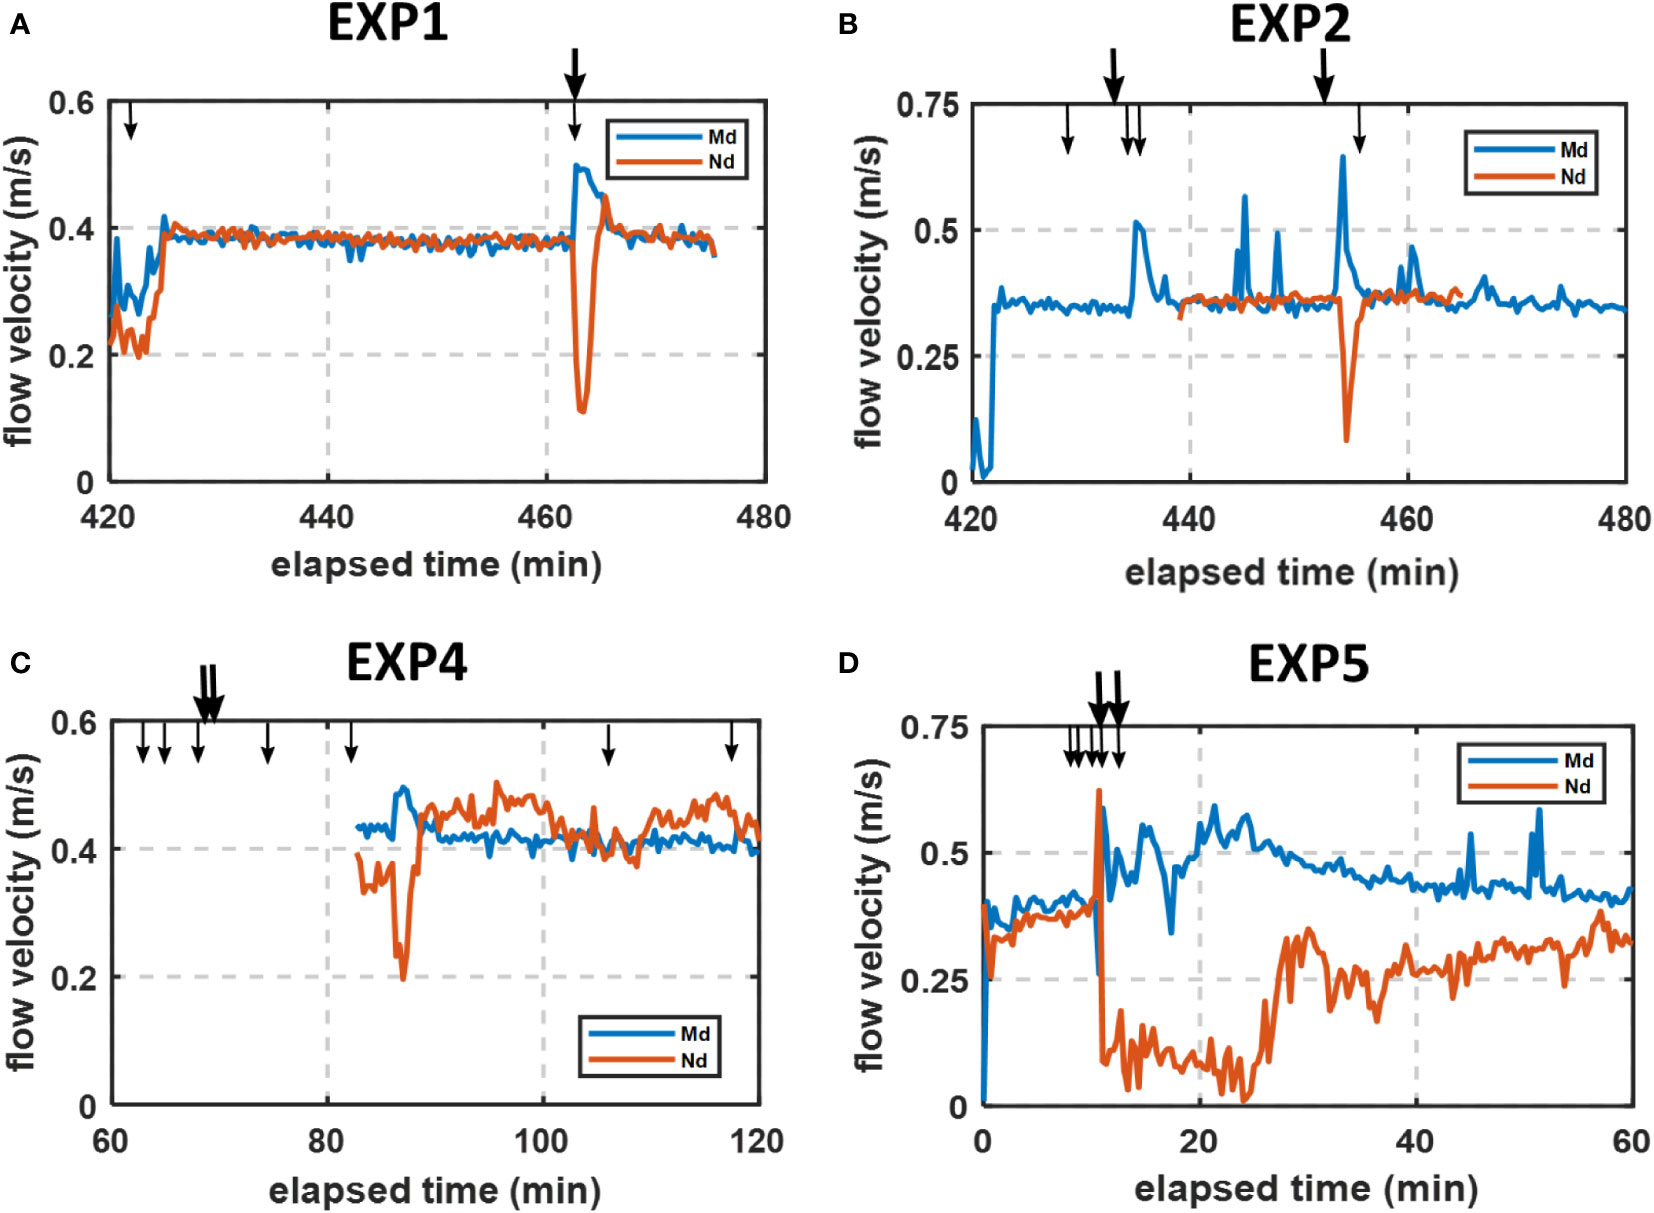
Figure 7 Flow velocity during each experiment and occurrence of bank failures: (A) EXP 1; (B) EXP 2; (C) EXP 4; (D) EXP 5. Md and Nd indicate midchannel and near-bank velocity of downstream, respectively. Flow direction is consistent with Figure 2A. Arrows are consistent with Figure 5. Position of sensors can be found in Figure 2 and Table 2. Due to the trouble of the velocity probe in the experiment, the velocity data of about the first 19 min in EXP 2 (Nd) and the first 22 min in EXP 4 were unfortunately lost.
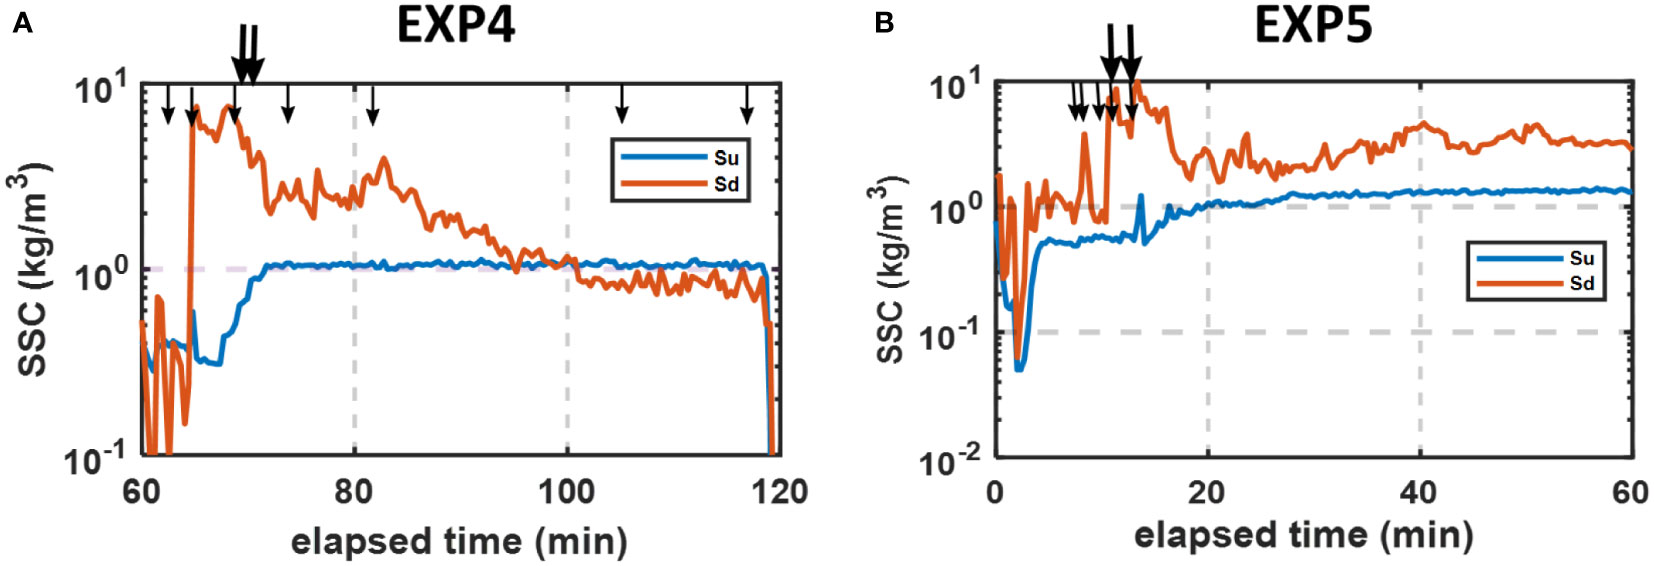
Figure 8 Time series of suspended sediment concentration (SSC) upstream (Su) and downstream (Sd) of the bank: (A) EXP 4; (B) EXP 5. Flow direction is consistent with Figure 2A. Arrows are consistent with Figure 5. Position of sensors can be found in Figure 2 and Table 2.
After the inclusion of surface flow, the velocity in the flume increased rapidly in a few minutes and basically maintained at 0.4 m/s, during which the soil at the bank toe is partially shearing under the influence of surface flow. The following large toppling failures occurred and the blocks fell into the flume to form the bank toe, which hindered the surface flow to a certain extent, and the near-bank velocity decreased rapidly. Due to the constriction of the cross section, the velocity in the mid-channel increased accordingly. As the current gradually washed the bank toe away, the near-bank and mid-channel velocity returned to 0.4 m/s and remained stable. Some temporary increase and decline of flow velocity in the mid-channel of EXP 2 should be related to the instability of flow.
In the 3D experiments, the erosion of the surface flow to the bank toe led to a sharp increase of sediment content in the downstream, and the tensile failures caused by the loss of soil matrix suction provided more sediment for the current. The slump blocks caused by massive toppling and shear failures kept the sediment content in the downstream at a high level for a long time. With the surface flow gradually scouring away the slump blocks in the flume, the sediment content in the downstream decreased obviously. In EXP 4, the sediment concentration in the downstream after 100 min was even lower than that in the upstream, which may be due to the vertical displacement of the downstream OBS probe.
Failures’ contribution to bank retreat
Since the erosion volume is commonly small and difficult to estimate, we take shear failure and toppling failure as the main driving factor of bank retreat. Figure 9 shows the number of times and distance of bank retreat caused by various types of failures of EXP 4-6. There is no shear failure of EXP 5 under the action of surface flow, and the contribution rate of two large-scale toppling failures to the bank retreat is up to 100 % (29.57 cm). In contrast, the frequency of shear failure (four times) and toppling failure (four times) under seepage in EXP 6 is higher, and three tensile failures are observed during the experiment. The contribution of shear failure in the bank retreat (43 %, 12.06 cm) is close to that of the toppling failure (57 %, 16.07 cm). The retreat distance of the bank is the smallest among the three experiments. Under the coupled effect of seepage and surface flow, there are more shear failures in EXP 4 (six times), but the contribution of bank retreat is small (6 %, 2.21 cm). Three large-scale toppling failures play a dominant role in bank retreat (94 %, 32.14 cm). The total bank retreat distance is the largest.
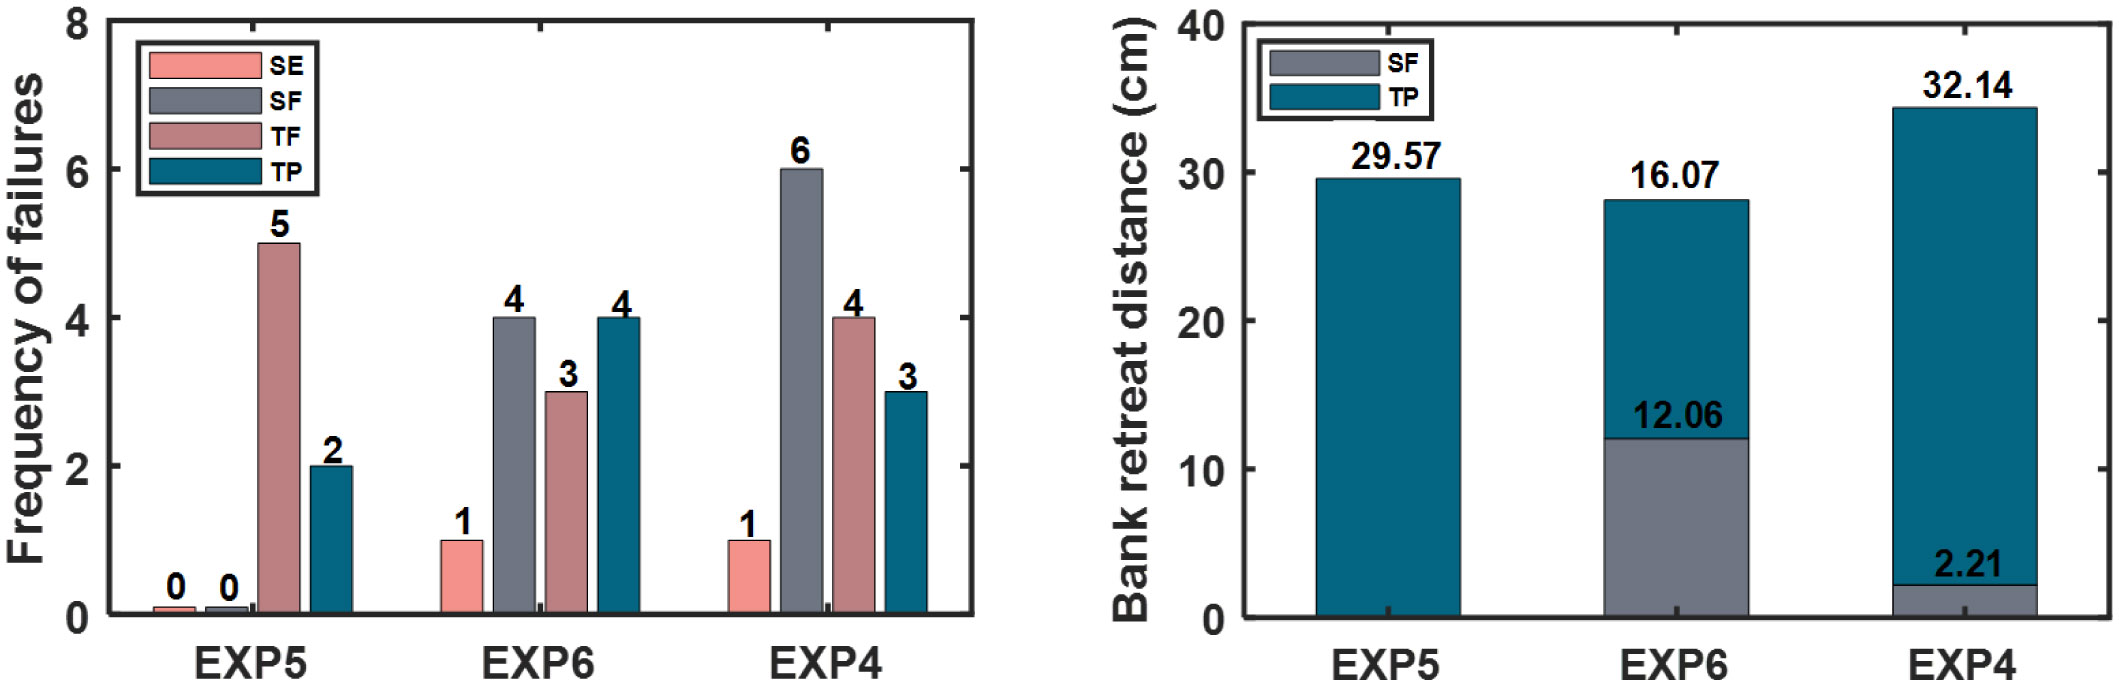
Figure 9 Frequency and contribution to bank retreat of each type of failures in 3D experiments. SE, seepage erosion; SF, shear failure; TF, tensile failure; TP, toppling failure.
Discussion
Observed mechanisms of bank failure
Undercutting, tensile failure, shear failure, and toppling failure caused by seepage are several common types of bank failure reported in previous studies (Fox et al., 2006; Midgley et al., 2013; Fox and Felice, 2014), all of which were observed in the experiments of this research. We use laboratory experiments to study the bank retreat under the coupled effect of seepage and surface flow in order to show the similarities and differences of bank failure under 2D and 3D experimental conditions. The bank failure process and mechanism under these two conditions are analyzed as follows.
For 2D experiments (Figure 10A), after the beginning of seepage, the saturation line advanced fastest at the bank toe, followed by the middle, and the slowest in the upper part (Figures 6B-T2, B-T4, B-T5-7). The matric suction of the soil on the bank decreased rapidly with the advance of the saturation line (Figure 10B), and the shear strength of the soil obviously decreased. The bottom soil moved and undercut on a small scale under the action of seepage (Figures 3A1-C1). As the result of the undercutting induction and the gravity of the upper soil, there was a large torque in the middle of the bank, which caused an obvious increase of soil stress in this position (Figure 6A-P4). Subsequently, tension cracks appeared at the bank top (Figure 3A2). With the bank flipping forward, the width of the tension crack on the bank top increased continuously. The overturned block was affected by the moment, and tension cracks were observed at the top, followed by large-scale toppling failures (Figures 3A3, C3). The total stress changed in the middle and top of the bank showed the process of stress concentration and release in a short time (Figures 6A-P4, A-P5). The slump blocks accumulated at the bank toe, hindering the process of seepage undercutting and having a protective effect to the bank. The above experimental phenomena are similar to those reported in previous researches (Fox et al., 2006; Midgley et al., 2013; Fox and Felice, 2014). The existence of sensors and wires in the soil obviously delayed the process of bank flipping and toppling failures. Under the condition of the same seepage head (Figures 3EXP1, EXP3), the time difference of massive toppling failures can reach 2–4 h. The decrease of seepage head (Figure 3B1) greatly slowed down the advancing speed of the saturation line, and it was observed that the time of tension cracks at the bank top and seepage undercutting at the bank toe was delayed accordingly. With the inclusion of surface flow, the soil at the bank toe was scoured rapidly, and the soil near the soil–water interface had a tensile failure due to the loss of matric suction (Figure 3B2), which accelerated the formation of the cantilever. Under the action of torque, the soil stress was concentrated at the endpoint of the cantilever (Figure 10C). The process of bank flipping and toppling failure was greatly accelerated, soon the slump blocks fell into the flume. Either it was eroded by surface flow and transformed into suspended sediment or it was submerged by current and converted into gentle slope bank toe, so it was difficult to continue to erode. The final bank shape was mainly characterized by the gentle slope at the bottom and the vertical in the middle and upper part (Figure 10D).
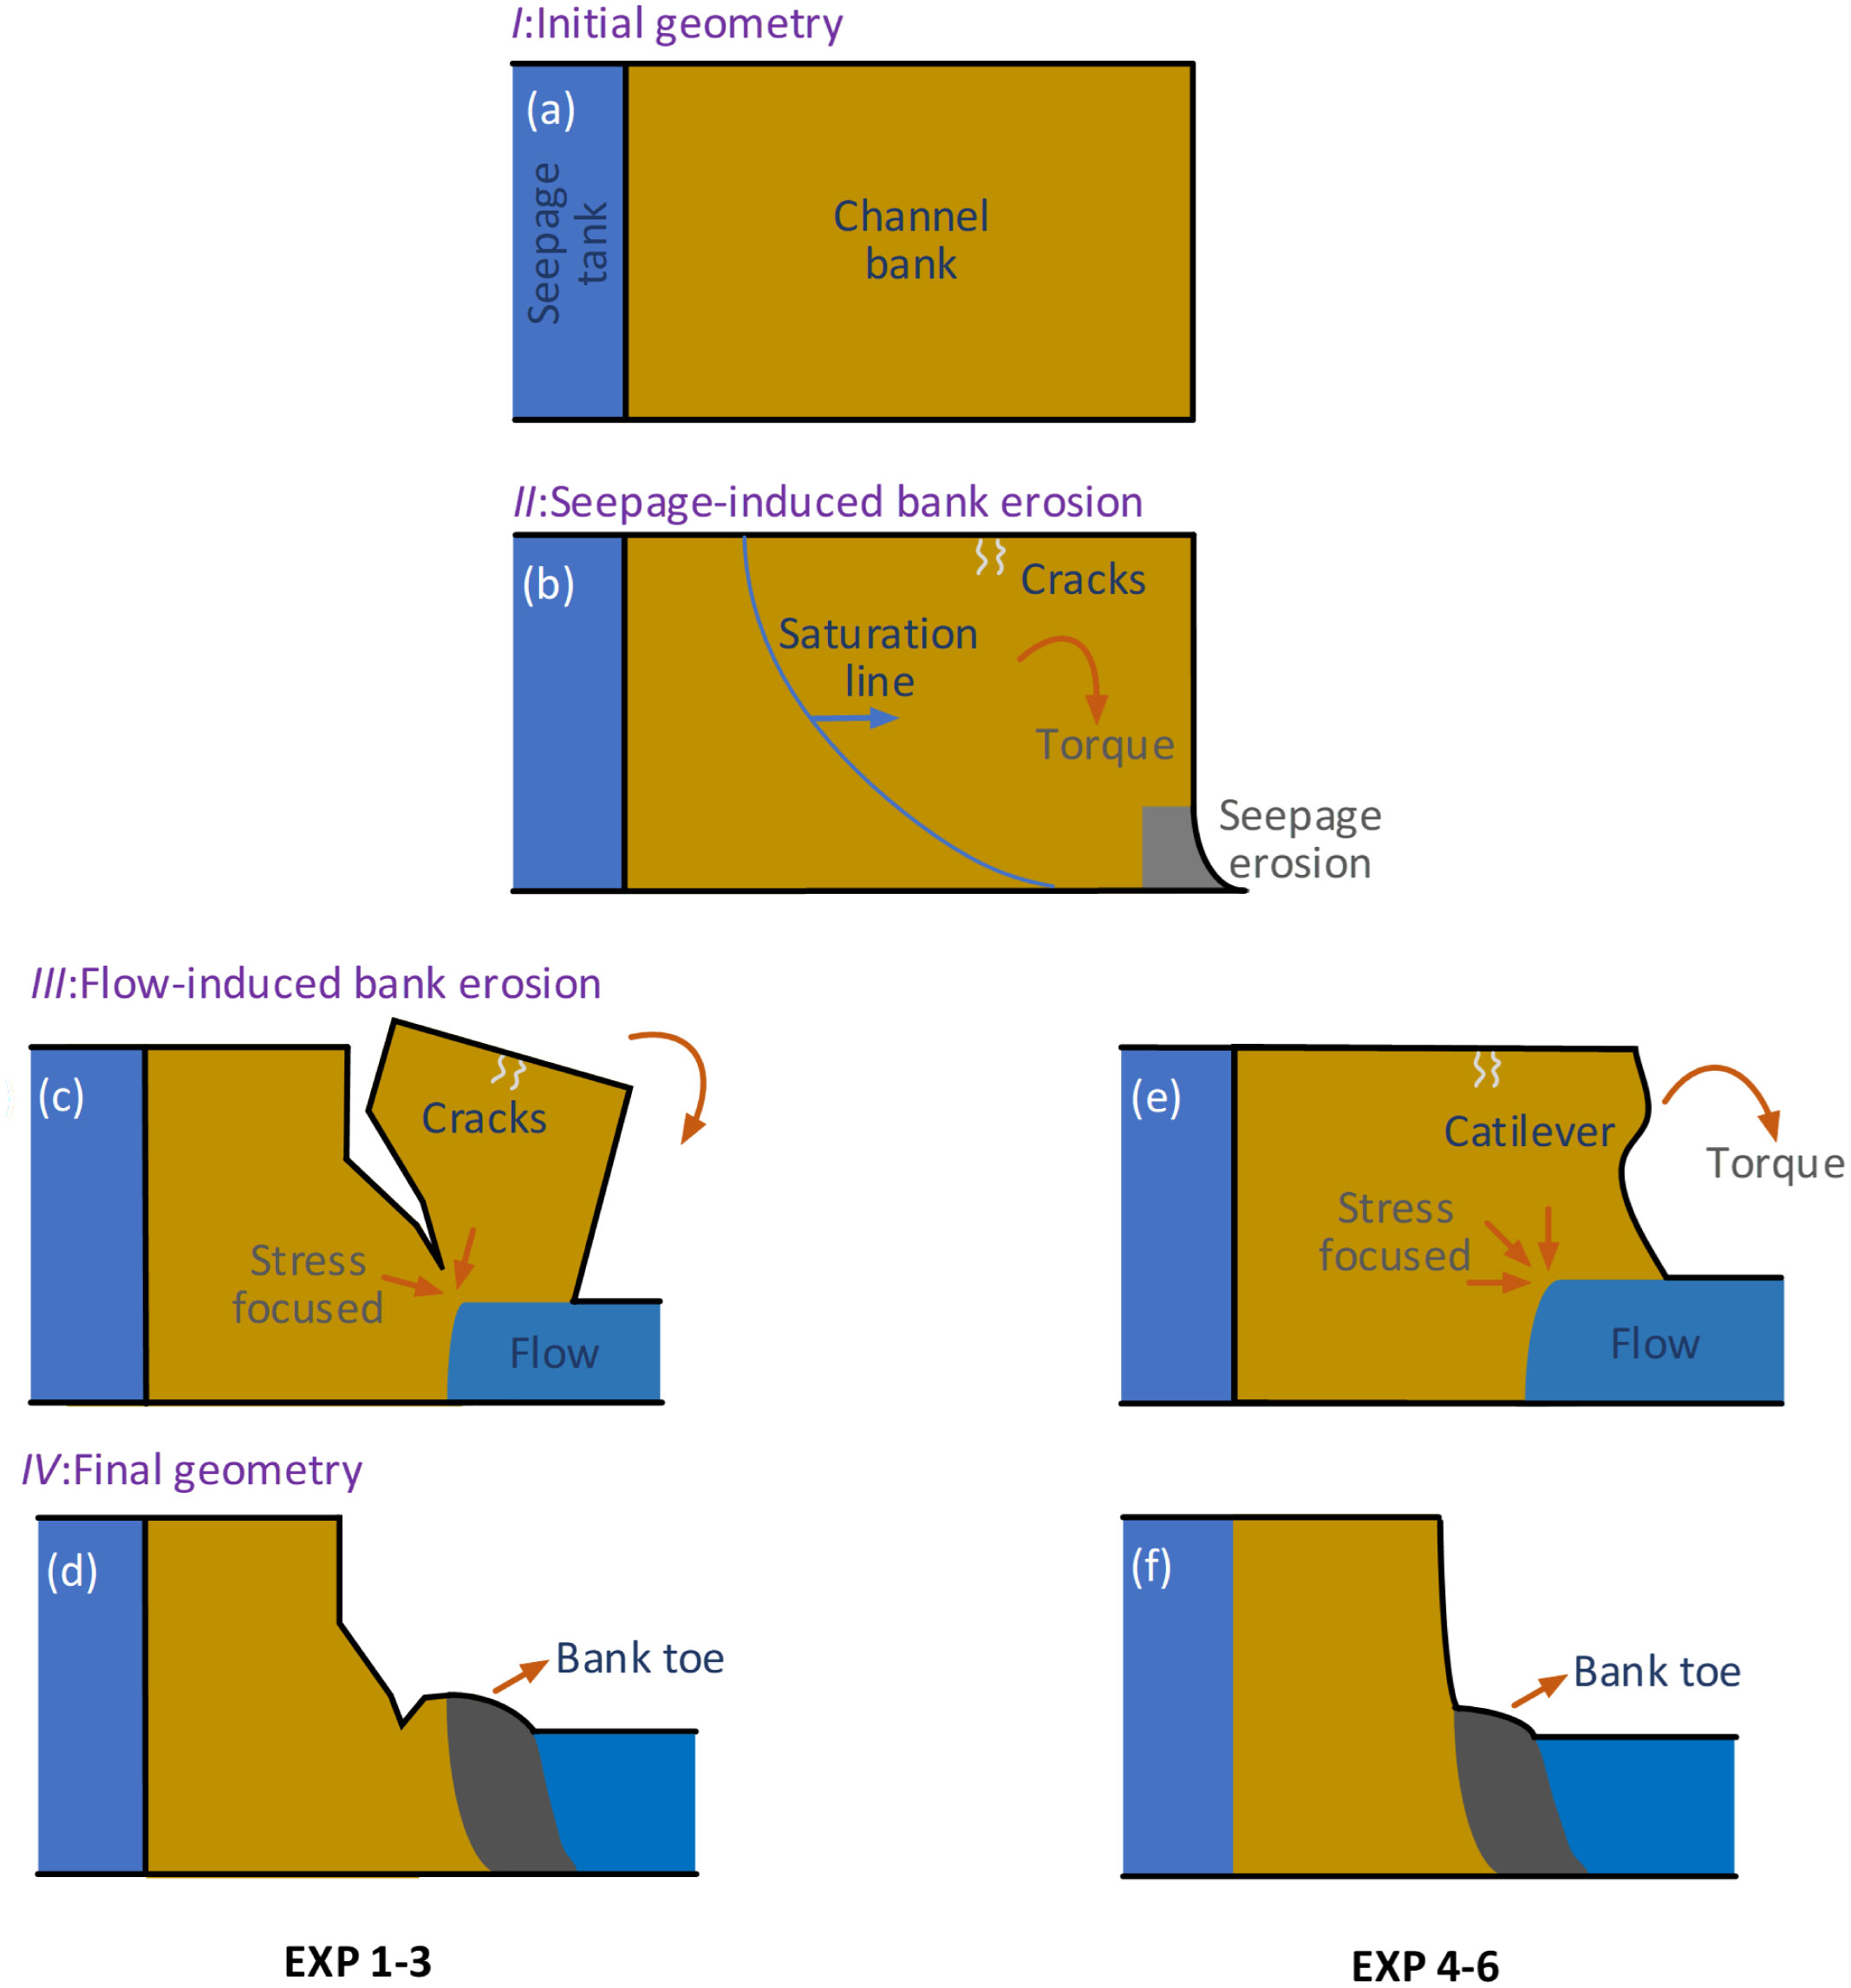
Figure 10 Conceptual sketch of the evolution of bank profiles. (A) Initial geometry; (B) Seepage-induced bank erosion; (C) Flow-induced bank erosion in 2D experiments; (D) Final geometry in 2D experiments; (E) Flow-induced bank erosion in 3D experiments; (F) Final geometry in 3D experiments.
For 3D experiments, at the initial stage of the experiment, the undercutting process at the bank toe under the action of seepage was basically similar to that of 2D (Figures 10A, B). It is worth noting that due to the inhomogeneity of 3D soil and complex internal flow characteristics, the preferential flow pathways of seepage can be reflected in the experiment: shear failures and undercutting caused by seepage were observed on the left and middle of the bank toe in EXP 6 (Figure 4F1). Under the condition of similar other factors, the advancing rate of the saturation line in 3D soil (Figures 6F, J) was about twice as fast as that in 2D soil (Figure 6B). The bank retreat process of 3D soil (EXP 6) was obviously faster than that of 2D soil (EXP 3). It was observed that the time taken to undercutting and toppling failures of seepage in EXP 6 was 1–1. 5h earlier than that of EXP 3. Under the action of seepage, the soil moisture content increased, leading to the decrease in matric suction and shear strength. When the shear stress along the vertical plane exceeded its shear strength, shear failures can also lead to large-scale bank erosion (Figures 4D4, F4). The slump blocks formed by shear and toppling failures accumulated at the toe of the bank, delaying the process of seepage undercutting and other failures (Figure 4F6). For EXP 4, when surface flow was included after 1 h of seepage, the bank toe was eroded rapidly. Soon the cantilever was formed, the stress was concentrated at the endpoint of the cantilever (Figure 10E). Under the action of bending moment, a long- tension crack appeared at the bank top, and then a large-scale toppling failure occurs quickly (Figure 4F3). The slump blocks falling into the flume was washed by current, and the rest formed bank toe, on the one hand, delaying the undercutting of seepage. On the other hand, it hindered the process of surface flow erosion to form a cantilever, resulting in the formation of a bank with a vertical cliff in the upper part and a gentle slope in the lower part (Figure 10F). To sum up, it is not difficult to find that compared with the 2D experiment, the failure time in the 3D experiment is shorter, the type of failures is more, and it is less affected by the sensors volume and wires. It has advantages in simulating inhomogeneous cantilever failure, internal complex flow characteristics, collapsed block effect, and so on.
The role of surface flow and seepage
Through experiments, we find that the main role of seepage on bank retreat is to change the properties of soil by reducing its matrix suction and shear strength, and therefore cause different types of failures. In EXP 6, where bank retreat is controlled by seepage, many times of seepage undercutting, tensile failure, shear failure, and toppling failure had been observed in the experimental process. In addition, the failure time distribution was more uniform. Finally, the bank was characterized by the middle and upper vertical scarp and the lower gentle slope. We took the coupled effect of seepage and surface flow as retreat factor in EXP 4; the toppling failures occurred at the bank top before the end of the experiment (Figure 4D5) proved that, under the influence of seepage, the formation of cantilever was not a necessary condition for toppling failure.
One of the main roles of surface flow is to scour the bank bottom to form a cantilever, creating conditions for large-scale toppling and destruction. We used the surface flow as the retreat factor in EXP 5, the matric suction in the bank remains nearly constantly (Figure 6H), which was also reported in the similar experiment of Bo et al. (2011). The cantilever formed by the surface flow scouring the shore bottom provided the basis for the subsequent two adjacent large-scale toppling failures. No other damage had been observed since then, and the shape of the bank was vertically steep (Figure 4E6). The other main role of surface flow is to scour the collapsed bank soil, so that the seepage erosion inside the bank and the surface flow erosion of the bank bottom can continue. In the EXP 6 with seepage as the erosion factor, the first toppling failure (Figure 4F3) led to the accumulation of large pieces of slump blocks on the bank toe, delaying the seepage erosion and subsequent failures. While in the EXP 4 and EXP 5 with surface flow as the erosion factor(s), this situation was improved by the erosion of the slump blocks by the surface flow. This is basically consistent with the conclusions obtained by Midgley et al. (2013) and Fox and Felice (2014) through experiments.
Comparing and analyzing the failure frequency and the contribution of bank retreat caused by seepage and surface flow, based on our experiments, we find that only surface flow erosion experiment will overestimate the contribution of toppling failure to bank retreat, neglecting the toppling and shear failure due to the decrease of soil matric suction caused by seepage. However, only considering seepage will lead to the excessive contribution of shear failure to the bank retreat, and neglecting the scouring effect of surface flow on the slump blocks will lead to a small total bank retreat distance simulated. Therefore, it is necessary to consider the bank retreat under the coupled effect of seepage and surface flow, as well as the influence of vegetation, waves, and other factors in the future.
Differences between fluvial and tidal systems
Most of the previous studies on bank retreat focused on the layered bank in the river system (Lindow et al., 2009; Karmaker and Dutta, 2013), not only the experimental models with reduced scale were used in laboratories (Fox et al., 2006; Chu-Agor et al., 2008) but also mathematical model researches (Darby et al., 2007; Lai et al., 2015; Zhao et al., 2021). Less attention is paid to tidal channels, which is affected by tidal currents in the coastal environment. There are some similarities between river and tidal channel systems, such as the complex network structure and meandering characteristics (Marani et al., 2002; Solari et al., 2002; Coco et al., 2013; Finotello et al., 2020). It is basically feasible to use the method of river bank retreat in the study of tidal channel system, but the effects caused by the differences between the two systems need to be considered.
There are obvious differences in the morphological characteristics between the tidal channel and the river systems: the tidal channel gradually narrows toward the shore, showing a funnel shape (Van der Wegen and Roelvink, 2008; Lanzoni and D'Alpaos, 2015; Zhao et al., 2019), and has a tighter spatial distribution feature (Hughes, 2012) than the river system; the tidal net has obvious breakpoints in scale ratio, whereas the river remains scale invariance (Fagherazzi et al., 1999). Another significant difference between the two systems is the current driving force: The flow in tidal channel is greatly affected by tides and waves (Hibma et al., 2004; De Swart and Zimmerman, 2009; Bendoni et al., 2014), the tidal current takes the tidal cycle as the time scale, reciprocates in the tidal channel, its velocity changes violently, and the maximum velocity occurs at the beginning of high tide and late ebb tide (Zhang et al., 2016). The river is mainly affected by topography and upstream runoff, taking the season as the time scale, its flow pattern is stable, and the maximum velocity appears at the same time as the high water level (Bayliss-Smith et al., 1979). As a result of the coupled effect of seepage and surface flow during ebb tides and the erosion of overbank flow during flood or ebb peak in tidal environments, the model or empirical relationship originally developed for river morphodynamics may no longer be applicable to tidal environments (Zhao et al., 2022). The existence of reciprocating flow makes the soil saturation in the tidal channel bank always maintain a high level. The different submergence duration of soil on both sides of sea and land leads to the spatial difference of soil strength and failure frequency (D'Alpaos et al., 2006). Simon et al. (2000) suggested that the bank collapse is mainly caused by the rapid loss of hydrostatic pressure during the flood recession. Therefore, the frequent occurrence of ebb tide has a significant impact on the retreat of the tidal channel bank.
Limited by the experimental conditions, we used the steady uniform flow to simulate the bank retreat process of the tidal channel in the late ebb tide. If the reciprocating flow is used as the driving force of the flow, the bank will be more affected by the lateral infiltration and overbank flow. The process of the increase of water content in the front and middle and upper soil, the decrease of matrix suction and shear strength will be accelerated. The movement of soil particles and block slip caused by seepage will not only exist at the bank bottom but also be observed in the middle and upper part of the bank. The sequence randomness of seepage undercutting, surface flow erosion, shear failure and toppling failure will be enhanced, the failure frequency will be higher, and the receding distance of the bank will increase to a certain extent. Considering the special morphological structure and the hydraulic characteristics of the reciprocating flow in the tidal environment, the bank retreat of tidal channel deserves more attention.
Conclusions
We use laboratory experiments, similar to natural systems, to explore the 3D bank retreat process under the coupled effect of seepage and surface flow. Seepage erosion, tensile failure, shear failure, and toppling failure are observed in the experiments.
Seepage infiltration causes a rapid decrease in soil matric suction within 1–2 h, and the shear strength decreases accordingly. The undercutting phenomenon caused by seepage is observed at the bank toe, and then tension cracks appear on the bank top. Toppling failure and shear failure occur later. The deposition of slump blocks at the bank toe hinders the progress of seepage erosion. The scouring of surface flow can not only weaken the protective effect of bank toe but also promote the formation of cantilever and accelerate the process of bank retreat.
The number of times and contribution of various types of failures on bank retreat will be misestimated by the single analysis of the role of factors. Only considering the role of seepage will lead to excessive contribution of shear failure in the simulation of bank retreat, and the total retreat distance will be too smaller; only considering surface flow will neglect the toppling and shear failure of soil due to the decrease of matric suction. Considering the coupled effect of multi-factors of bank retreat will be a feasible direction for follow-up research.
Under the influence of the inhomogeneity of natural soil, the preferential flow pathways make the bank retreat rate faster and the failure types more diverse, which is fully demonstrated by 3D experiments. Compared with the 2D experiment, the 3D experiment is less affected by the sensors and wires in the soil and can be used to simulate the longitudinal gradient of sediment transport, the complex flow characteristics in soil and the effect of slump blocks.
Data availability statement
The original contributions presented in the study are included in the article/supplementary material. Further inquiries can be directed to the corresponding author.
Author contributions
KW: Data collection and analysis, Manuscript writing. ZG: Review, Editing, Project administration, Funding support. KZ: Review and Editing. ST: Data collection. KLZ: Review and Editing. All authors contributed to the article and approved the submitted version.
Funding
This work is funded by National Key Research and Development Program of China (2022YFC3106204) and National Nature Science Foundation of China (51925905, 52201318).
Acknowledgments
The authors thank Liang Geng, BeiBei Xu, Chuang Jin, and Ran Ge for their comments on the manuscript. KW acknowledges SiQi Pan and YunZhou Chen for contributing to the data collection.
Conflict of interest
Author KW was employed by PowerChina Northwest Engineering Co. Ltd.
The remaining authors declare that the research was conducted in the absence of any commercial or financial relationships that could be construed as a potential conflict of interest.
Publisher’s note
All claims expressed in this article are solely those of the authors and do not necessarily represent those of their affiliated organizations, or those of the publisher, the editors and the reviewers. Any product that may be evaluated in this article, or claim that may be made by its manufacturer, is not guaranteed or endorsed by the publisher.
References
Aldefae A. H., Alkhafaji R. A. (2021). Experimental and numerical modeling to investigate the riverbank’s stability. SN Appl. Sci. 3 (2), 1–16. doi: 10.1007/s42452-021-04168-5
Al-Madhhachi A. S. T., Fox G. A., Tyagi A. K., Hanson G. J., Bulut R. (2011). Measuring the erodibility of cohesive soils influenced by seepage forces using a laboratory jet erosion test device(Louisville, Kentucky: American Society of Agricultural and Biological Engineers), p. 1. doi: 10.13031/2013.37396
Bayliss-Smith T. P., Healey R., Lailey R., Spencer T., Stoddart D. R. (1979). Tidal flows in salt marsh creeks. Estuar. Coast. Mar. Sci. 9 (3), 235–255. doi: 10.1016/0302-3524(79)90038-0
Bendoni M., Francalanci S., Cappietti L., Solari L. (2014). On salt marshes retreat: Experiments and modeling toppling failures induced by wind waves. J. Geophysical Res. 119 (3), 603–620. doi: 10.1002/2013JF002967
Bo N., Wu S. Q., Tan Y. F., Xie X. H., Jun Y. A. N., Yan Z. M., et al. (2011). Coupling effect of seepage flow and river flow on the bank failure. J. Hydrodynamics Ser. B. 23 (6), 834–840. doi: 10.1016/S1001-6058(10)60183-7
Chu-Agor M. L., Fox G. A., Cancienne R. M., Wilson G. V. (2008). Seepage caused tension failures and erosion undercutting of hillslopes. J. Hydrol. 359 (3-4), 247–259. doi: 10.1016/j.jhydrol.2008.07.005
Coco G., Zhou Z., Van Maanen B., Olabarrieta M., Tinoco R., Townend I. (2013). Morphodynamics of tidal networks: Advances and challenges. Mar. Geol. 346, 1–16. doi: 10.1016/j.margeo.2013.08.005
D'Alpaos A., Lanzoni S., Mudd S. M., Fagherazzi S. (2006). Modeling the influence of hydroperiod and vegetation on the cross-sectional formation of tidal channels. Estuarine Coast. Shelf. Sci. 69 (3-4), 311–324. doi: 10.1016/j.ecss.2006.05.002
Darby S. E., Rinaldi M., Dapporto S. (2007). Coupled simulations of fluvial erosion and mass wasting for cohesive river banks. J. Geophysical Res.: Earth Surface 112 (F3), F03022. doi: 10.1029/2006jf000722
Darby S. E., Thorne C. R. (1996). Numerical simulation of widening and bed deformation of straight sand-bed rivers. I: Model development. J. Hydraulic Eng. 122 (4), 184–193. doi: 10.1061/(asce)0733-9429(1996)122:4(184
Deng S., Xia J., Zhou M. (2019). Coupled two-dimensional modeling of bed evolution and bank erosion in the upper JingJiang reach of middle Yangtze river. Geomorphology 344, 10–24. doi: 10.1016/j.geomorph.2019.07.010
De Swart H. E., Zimmerman J. T. F. (2009). Morphodynamics of tidal inlet systems. Annu. Rev. Fluid Mechanics 41, 203–229. doi: 10.1146/annurev.fluid.010908.165159
Duong Thi T., Do Minh D. (2019). Riverbank stability assessment under river water level changes and hydraulic erosion. Water 11 (12), 2598. doi: 10.3390/w11122598
Eaton B. C., Church M., Millar R. G. (2004). Rational regime model of alluvial channel morphology and response. Earth Surface Processes Landforms 29 (4), 511–529. doi: 10.1002/esp.1062
Fagherazzi S., Bortoluzzi A., Dietrich W. E., Adami A., Lanzoni S., Marani M., et al. (1999). Tidal networks: 1. automatic network extraction and preliminary scaling features from digital terrain maps. Water Resour. Res. 35 (12), 3891–3904. doi: 10.1029/1999WR900236
Finotello A., D’Alpaos A., Bogoni M., Ghinassi M., Lanzoni S. (2020). Remotely-sensed planform morphologies reveal fluvial and tidal nature of meandering channels. Sci. Rep. 10 (1), 1–13. doi: 10.1038/s41598-019-56992-w
Fox G. A., Chu-Agor M., Wilson G. V. (2007).Erosion of noncohesive sediment by groundwater seepage: Lysimeter experiments and modeling. Soil Sci. Soc. Am. J. 71, 1822–1830. doi: 10.2136/sssaj2007.0090
Fox G. A., Felice R. G. (2014). Bank undercutting and tension failure by groundwater seepage: Predicting failure mechanisms. Earth Surface Processes Landforms 39 (6), 758–765. doi: 10.1002/esp.3481
Fox G. A., Wilson G. V. (2010). The role of subsurface flow in hillslope and stream bank erosion: a review. Soil Sci. Soc. America J. 74 (3), 717–733. doi: 10.2136/sssaj2009.0319
Fox G. A., Wilson G. V., Periketi R. K., Cullum R. F. (2006). Sediment transport model for seepage erosion of streambank sediment. J. Hydrol. Eng. 11 (6), 603–611. doi: 10.1061/(ASCE)1084-0699(2006)11:6(603
Gong Z., Zhao K., Zhang C., Dai W., Coco G., Zhou Z. (2018). The role of bank collapse on tidal creek ontogeny: A novel process-based model for bank retreat. Geomorphology 311, 13–26. doi: 10.1016/j.geomorph.2018.03.016
Goodson J. M., Gurnell A. M., Angold P. G., Morrissey I. P. (2002). Riparian seed banks along the lower river dove, UK: their structure and ecological implications. Geomorphology 47 (1), 45–60. doi: 10.1016/S0169-555X(02)00140-X
Hagerty D. J. (1991). Piping/sapping erosion. I: Basic considerations. J. Hydraulic Eng. 117 (8), 991–1008. doi: 10.1061/(ASCE)0733-9429(1991)117:8(991
Hibma A., Stive M. J. F., Wang Z. B. (2004). Estuarine morphodynamics. Coast. Eng. 51 (8-9), 765–778. doi: 10.1016/j.coastaleng.2004.07.008
Hughes Z. J. (2012). “Tidal channels on tidal flats and marshes,” in Principles of tidal sedimentology (Dordrecht: Springer), 269–300.
Karmaker T., Dutta S. (2013). Modeling seepage erosion and bank retreat in a composite river bank. J. Hydrol. 476, 178–187. doi: 10.1016/j.jhydrol.2012.10.032
Khanal A., Fox G. A., Guertault L. (2020). Tidal channels on tidal flats and marshes. in principles of tidal sedimentology. Trans. ASABE 63 (4), 1123–1131. doi: 10.13031/trans.13835
Lai Y. G., Thomas R. E., Ozeren Y., Simon A., Greimann B. P., Wu K. (2015). Modeling of multilayer cohesive bank erosion with a coupled bank stability and mobile-bed model. Geomorphology 243, 116–129. doi: 10.1016/j.geomorph.2014.07.017
Lanzoni S., D'Alpaos A. (2015). On funneling of tidal channels. J. Geophysical Res. 120 (3), 433–452. doi: 10.1002/2014JF003203
Lawler D. M., Thorne C. R., Hooke J. M. (1997). “Bank erosion and instability”, in Applied fluvial geomorphology for river engineering and management (Singapore: John Wiley & Sons), 137–172.
Lindow N., Fox G. A., Evans R. O. (2009). Seepage erosion in layered stream bank material. Earth Surface Processes Landforms 34 (12), 1693–1701. doi: 10.1002/esp.1874
Marani M., Lanzoni S., Zandolin D., Seminara G., Rinaldo A. (2002). Tidal meanders. Water Resour. Res. 38 (11), 7–1. doi: 10.1029/2001WR000404
Midgley T. L., Fox G. A., Wilson G. V., Heeren D. M., Langendoen E. J., Simon A. (2013). Seepage-induced streambank erosion and instability: in situ constant-head experiments. J. Hydrol. Eng. 18 (10), 1200–1210. doi: 10.1061/(ASCE)HE.1943-5584.0000685
Millar R. G. (2000). Influence of bank vegetation on alluvial channel patterns. Water Resour. Res. 36 (4), 1109–1118. doi: 10.1029/1999WR900346
Patsinghasanee S., Kimura I., Shimizu Y., Nabi M., Chub-Uppakarn T. (2017). Coupled studies of fluvial erosion and cantilever failure for cohesive riverbanks: Case studies in the experimental flumes and U-tapao river. J. Hydro-environment Res. 16, 13–26. doi: 10.1016/j.jher.2017.04.002
Rinaldi M., Mengoni B., Luppi L., Darby S. E., Mosselman E. (2008). Numerical simulation of hydrodynamics and bank erosion in a river bend. Water Resour. Res. 44 (9), W09428. doi: 10.1029/2008WR007008
Rinaldi M., Nardi L. (2013). Modeling interactions between riverbank hydrology and mass failures. J. Hydrol. Eng. 18 (10), 1231–1240. doi: 10.1061/(ASCE)HE.1943-5584.0000716
Samadi A., Amiri-Tokaldany E., Davoudi M. H., Darby S. E. (2013). Experimental and numerical investigation of the stability of overhanging riverbanks. Geomorphology 184, 1–19. doi: 10.1016/j.geomorph.2012.03.033
Simon A., Curini A., Darby S. E., Langendoen E. J. (2000). Bank and near-bank processes in an incised channel. Geomorphology 35 (3-4), 193–217. doi: 10.1016/j.geomorph.2012.03.033
Solari L., Seminara G., Lanzoni S., Marani M., Rinaldo A. (2002). Sand bars in tidal channels part 2. tidal meanders. J. Fluid Mechanics 451, 203–238. doi: 10.1017/S0022112001006565
Thorne C. R., Lewin J. (1979). “Bank processes, bed-material move-ment and planform development in a meandering river,” in Adjustment of the fluvial system. Eds. Rhodes D. D., Williams G. P. (Dubuque, Iowa: Kendall Hunt), 117–137.
Thorne C. R., Tovey N. K. (1981). Stability of composite river banks. Earth Surface Processes Landforms 6 (5), 469–484. doi: 10.1002/esp.3290060507
Van der Wegen M., Roelvink J. A. (2008). Long-term morphodynamic evolution of a tidal embayment using a two-dimensional, process-based model. J. Geophysical Res. 113 (C3), C03016. doi: 10.1029/2006JC003983
Wolman M. G. (1959). Factors influencing erosion of a cohesive river bank. Am. J. Sci. 257 (3), 204–216. doi: 10.2475/ajs.257.3.204
Zhang Q., Gong Z., Zhang C., Townend I., Jin C., Li H. (2016). Velocity and sediment surge: What do we see at times of very shallow water on intertidal mudflats? Continental Shelf. Res. 113, 10–20. doi: 10.1016/j.csr.2015.12.003
Zhang K., Gong Z., Zhao K., Wang K., Pan S., Coco G. (2021). Experimental and numerical modeling of overhanging riverbank stability. J. Geophysical Res. 126 (10), e2021JF006109. doi: 10.1029/2021JF006109
Zhao K., Coco G., Gong Z., Darby S. E., Lanzoni S., Xu F., et al. (2022). A review on bank retreat: Mechanisms, observations, and modeling. Rev. Geophysics 60 (2), e2021RG000761. doi: 10.1029/2021RG000761
Zhao K., Gong Z., Xu F., Zhou Z., Zhang C. K., Perillo G. M. E., et al. (2019). The role of collapsed bank soil on tidal channel evolution: A process-based model involving bank collapse and sediment dynamics. Water Resour. Res. 55 (11), 9051–9071. doi: 10.1029/2019WR025514
Zhao K., Gong Z., Zhang K., Wang K., Jin C., Zhou Z., et al. (2020). Laboratory experiments of bank collapse: The role of bank height and near-bank water depth. J. Geophysical Res. 125 (5), e2019JF005281. doi: 10.1029/2019JF005281
Keywords: bank retreat, bank collapse, seepage, matric suction, surface flow
Citation: Wang K, Gong Z, Zhao K, Tang S and Zhang K (2022) A three-dimensional experimental study on bank retreat: The coupled role of seepage and surface flow. Front. Mar. Sci. 9:1054077. doi: 10.3389/fmars.2022.1054077
Received: 26 September 2022; Accepted: 10 November 2022;
Published: 02 December 2022.
Edited by:
Yifei Zhao, Nanjing Normal University, ChinaReviewed by:
Andrea Gasparotto, University of Exeter, United KingdomLiqin Zuo, Nanjing Hydraulic Research Institute, China
Copyright © 2022 Wang, Gong, Zhao, Tang and Zhang. This is an open-access article distributed under the terms of the Creative Commons Attribution License (CC BY). The use, distribution or reproduction in other forums is permitted, provided the original author(s) and the copyright owner(s) are credited and that the original publication in this journal is cited, in accordance with accepted academic practice. No use, distribution or reproduction is permitted which does not comply with these terms.
*Correspondence: Zheng Gong, gongzheng@hhu.edu.cn