Meta-analysis reveals controls on oyster predation
 Kinsey N. Tedford
 Max C. N. Castorani
- Department of Environmental Sciences, University of Virginia, Charlottesville, VA, United States
Predators can have strong roles in structuring communities defined by foundation species. Accumulating evidence shows that predation on reef-building oysters can be intense and potentially compromise efforts to restore or conserve these globally decimated foundation species. However, understanding the controls on variation in oyster predation strength is impeded by inconsistencies in experimental methodologies. To address this challenge, we conducted the first meta-analysis to quantify the magnitude, uncertainty, and drivers of predator effects on oysters. We synthesized 384 predator-exclusion experiments from 49 peer-reviewed publications over 45 years of study (1977 to 2021). We characterized geographic and temporal patterns in oyster predation experiments, determined the strength of predator effects on oyster mortality and recruitment, and assessed how predation varies with oyster size, environmental conditions, the predator assemblage, and experimental design. Predators caused an average 4.3× increase in oyster mortality and 46% decrease in recruitment. Predation increased with oyster size and varied with predator identity and richness. Unexpectedly, we found no effects of latitude, tidal zone, or tidal range on predation strength. Predator effects differed with experiment type and tethering method, indicating the importance of experimental design and the caution warranted in extrapolating results. Our results quantify the importance of predation for oyster populations and suggest that consideration of the drivers of oyster predation in restoration and conservation planning may hasten recovery of these lost coastal foundation species.
Introduction
Predators can influence populations of foundation species and have strong cascading effects on the ecosystems that foundation species create and maintain (Dayton, 1972; Ellison, 2019). With the recognition that predators are potentially important in most ecosystems, research now focuses on quantifying the strength of predatory effects, understanding how the environment mediates variation in predation, and resolving the underlying mechanisms. Changes in predator effects over space and time have been attributed to differences in environmental conditions that alter the abundance, morphology, or behavior of prey or predators (Marcora et al., 2013, Kroeker et al., 2016, Penaluna et al., 2016; Reynolds et al., 2018). For instance, gradients in water depth and wave exposure alter the survival of reef-building corals by mediating the abundance of predatory parrotfish (Huertas et al., 2021). Resolving the causes of variation in predator effects is pressing considering recent accelerating and widespread losses of foundation species associated with changes in their predators, such as declines in canopy-forming forest trees, marsh grasses, and coral reefs (Ellison et al., 2005; Silliman et al., 2013).
Testing the direct effects of predators on their prey involves controlled experiments that manipulate the presence, absence, density, or identity of predators (among other factors). However, inconsistent methodologies and other idiosyncrasies among studies limit the direct comparisons needed to improve general knowledge (Borer et al., 2005). Moreover, while manipulative experiments are useful for inferring mechanisms, such studies are often limited to relatively small spatial scales, few locations, and short durations, further limiting the generality provided by a single experiment (Thrush et al., 1997). Standardizing and synthesizing knowledge from individual experiments can improve understanding of the consequences of predation in complex, natural ecosystems. Meta-analysis of published results is a powerful tool to meet this challenge and can reveal potential experimental biases and artifacts in well-studied systems (Peterson and Black, 1994; Koricheva et al., 2013).
Reef-building oysters are ideal for studying the patterns and drivers of variation in predation strength on foundation species. Predation on oysters has been the subject of intense study because oysters are vital to creating coastal habitat, sustaining biodiversity, and enhancing or stabilizing important ecosystem functions (Grabowski, 2004; Zu Ermgassen et al., 2016; Smith et al., 2022, Smith et al., in press). Oysters are prey to a diversity of resident and transitory reef predators occupying distinct functional groups (e.g., fishes, crabs, gastropods) and varying in their lethality (O'Connor et al., 2008). Moreover, predators may interact in ways that alter per-capita predation rates, such as interspecific competition or intraguild predation (McCoy et al., 2012; Schweiss and Rakocinski, 2020). Oyster reefs are found across a broad range of shallow marine and estuarine environments in temperate to tropical seas worldwide. They occur in intertidal and subtidal zones across gradients in salinity, tidal range, and water temperature (Byers et al., 2015; Lowe et al., 2017). Predator composition and abundance vary greatly due to natural geographic patterns (e.g., predatory fish are more common in areas of higher water temperatures and lower latitudes; Grabowski et al., 2020) and human modification of coastal food webs (e.g., overfishing of oyster predators or introducing non-native predators; Myers et al., 2007; Cheng et al., 2022). Understanding how predators affect oyster populations is important given the > 85% global decline in oysters and the substantial restoration efforts focused on re-establishment and conservation, which can yield mixed results (Beck et al., 2011; Duarte et al., 2020, Smith et al., in press).
Despite widespread losses of oyster reefs, there have been no standardized and integrated quantitative assessments of the influence of predators on oysters and how their effects vary with environmental factors. To resolve this gap, we used meta-analysis to systematically quantify the magnitude and uncertainty associated with predator effects on oysters. Specifically, we aimed to (1) characterize geographic and temporal patterns in oyster predation experiments, (2) determine the general direction and strength of predator effects on oyster mortality and recruitment, and (3) assess how variation in predation strength is associated with oyster size, environmental conditions, the composition and richness of the predator community, and experimental design. Our meta-analysis improves understanding of predator effects on a highly valued but globally decimated foundation species by resolving how predation is mediated by variation in biotic and abiotic factors. Our study also reveals important biases introduced by methodological decisions in predation experiments. These findings improve understanding of the controls on oyster populations and may help reduce uncertainty in restoration planning.
Methods
Literature review
We performed a comprehensive literature search for peer-reviewed studies that experimentally examined the effects of predators on oysters. We followed Preferred Reporting Items for Systematic Reviews and Meta-Analyses (PRISMA) standards for meta-analysis reporting (Moher et al., 2010; Supplementary Material: Figure S1; Table S1). We searched for publications that contained a predator removal experiment using the following search string on Web of Science: (predat* OR consume* OR top-down OR biotic OR trophic) AND (oyster* OR Crassostrea OR Ostrea OR Saccostrea OR Magallana OR Lopha OR Ostreola) AND (experiment* OR manipulat* OR assay OR transplant* OR tethe* OR cage*; 1900–2021). We performed this search on September 25, 2021 and 778 peer-reviewed publications were returned to review. We identified additional peer-reviewed publications from in-text citations, Google Scholar search-term alerts, and communication with publication authors. Two researchers reviewed all titles, keywords, and abstracts of the 788 candidate publications for any mention of an oyster predation study or an experiment on an oyster reef. Based on this screening, we excluded 643 publications (yielding 145 candidate publications).
Study inclusion criteria
For inclusion, studies had to experimentally manipulate oyster predator presence or absence using a physical barrier (e.g., cage, fence, net, or mesocosm tank). Thus, each experiment included a treatment that excluded all predators from oysters and a ‘control’ which exposed oysters to a natural or manipulated predator assemblage. When multiple experimental treatments within an experiment shared a control, they were considered as separate measures (Englund et al., 1999; Poore et al., 2012; Kimbro et al., 2013). We only included studies that identified oysters (Superfamily Ostreoidea) to species-level and reported a quantitative measure of juvenile or adult oyster mortality (or survival) or oyster recruitment as the response variable. We excluded studies on oyster larvae due to insufficient sample size (two publications). Based on our study inclusion criteria after reading the full text, we identified 49 out of 145 publications that were suitable for data extraction.
Data extraction
For each suitable experiment, we extracted the means or sums, samples sizes, and variances (when reported) of oyster responses from text, tables, graphs, or directly from study authors by request. To extract data from publications, we used metaDigitise 1.0.0 (Pick et al., 2019) within the R statistical computing environment (version 1.4.1717; R Core Team, 2021). Oyster mortality and survival were measured as proportions, percentages, or counts of individuals either dead or alive at the end of the experiment. For oyster mortality, we also extracted data from studies that reported mean daily mortality coefficients, per capita rates or mass of oysters consumed, and the ratio of live oysters to dead oysters (as indicated visually by substrate attachment ‘scars’; Baillie and Grabowski, 2019). We converted survival measurements to mortality by subtraction (mortality = 1 – survival). We measured oyster recruitment as the number or density of newly settled oyster larvae (‘spat’) that naturally recruited to a surface and survived at least two weeks (Newell et al., 2000). If data were reported as a time series, we used data from the final sampling period to maximize the probability of detecting a predator effect (Englund et al., 1999; Eger and Baum, 2020).
To address our third goal of determining the causes of variation in oyster predation, we collected metadata on oysters, abiotic environment, predator assemblages, and experimental design. Specifically, we recorded oyster species and size, assigning two size-class categories based on oyster shell heights (SH): small (≤ 25 mm) and large (> 25.1 mm). If a size range was given, we used the maximum value to group them into the same categories. We excluded studies that categorized oysters as spat but did not supply SH measurements. We recorded geographic location (latitude), salinity, tidal range, tidal zone (intertidal vs. subtidal), and water temperature. For predator enclosure studies, we recorded the identity and species richness (no. species) of predators in each treatment. We further grouped the predator assemblages based on predator identity and the number of predator species within the enclosure: (1) conch or drill (Gastropoda) (1 species), (2) crab (Brachyura) (1 species), (3) crab (Brachyura) (2 species), and (4) multi-taxon (≥ 2 species.) (Supplementary Material: Table S2 for a full list of predator species). The multi-taxon group consisted of a combination of conchs, drills, crabs, and/or fishes exposed to oyster prey and each other within the same enclosure.
We recorded the experiment duration, experiment type (predator exclosure vs. predator enclosure), mesh size used in caging experiments, experiment location (field vs. lab), oyster ‘tethering’ method (naturally settled vs. manually adhered with glue), and oyster recruitment substrate (living or dead oyster shell vs. artificial substrate such as ceramic, concrete, or plastic). The treatment constituting a ‘control’ differed based on experiment type: in exclosure experiments, control treatments exposed oysters to ambient predator communities; in enclosure experiments, control treatments confined oysters with a manipulated predator assemblage (Kimbro et al., 2013). Field studies were situated within the natural environment (e.g., near an existing oyster reef or on a mudflat), while lab experiments occurred indoors or outdoors. Lab enclosures used pools or tanks, sometimes filled with altered seawater (e.g., aerated, modified temperature).
Calculation of effect sizes
For oyster mortality and recruitment, we calculated effect sizes using the natural log response ratio, LRR = l n (), where is the mean (or sum) in the control group exposing oysters to predators and. . is the mean (or sum) in the treatment excluding predators (Hedges et al., 1999; Koricheva et al., 2013). We used the LRR because estimates of variance were not available for 43% of effect sizes (41% of publications); however, we tested the robustness of this chosen metric (Supplementary Material: Figures S2–5). If the mean or sum value of the response was zero, we replaced the zero with the minimum value that was likely to be detected with the associated sampling method (e.g., a count of 1 for the number of individuals tethered; Poore et al., 2012). An LRR = 0 indicates no difference between treatments allowing predators and excluding predators (i.e., no effect of predators). An LRR < 0 indicates that predators decreased oyster mortality or recruitment. An LRR > 0 indicates that predators increased oyster mortality or recruitment.
Statistical analyses
To address our second goal, determining the general direction and strength of predator effects on oysters, we fit intercept-only linear mixed effects models for each response variable (i.e., LRR of oyster mortality and recruitment), with a random intercept term for publication to control for within-study correlation (Zuur et al., 2009).
To address our third goal, identifying the drivers of variability in predation strength, we used linear mixed effects models to predict the LRR of oyster mortality and recruitment. As described above, we assembled metadata on 15 potential predictor variables describing (1) oyster species and size, (2) the abiotic environment (latitude, salinity, tidal range, tidal zone, water temperature), (3) predator taxon group (for enclosure studies including identity and species richness), and (4) experimental design (cage mesh size, experiment duration, experiment type, experiment location, recruitment substrate, tethering method). However, high multi-collinearity among continuous variables and missing combinations of levels of categorical factors prevented the use of all potential predictors (Table 1). We tested for multicollinearity by calculating variance inflation factors using the R package performance 4.1.1 (Lüdecke et al., 2021). We also excluded categorical predictors with < 2 publications per level. For instance, we excluded oyster species, tidal range, salinity, and water temperature as predictors for oyster mortality because they were highly correlated with latitude or tidal zone (Table 1). Cage mesh size, experiment type, and experiment location were too unbalanced or data-poor to include in all of the models (Table 1). We analyzed mortality data from studies using predator exclosures and enclosures separately because preliminary analyses showed a large difference in effect sizes between these two experiment types. Due to data constraints, the same set of predictors could not be used for predator exclosure and enclosure studies.
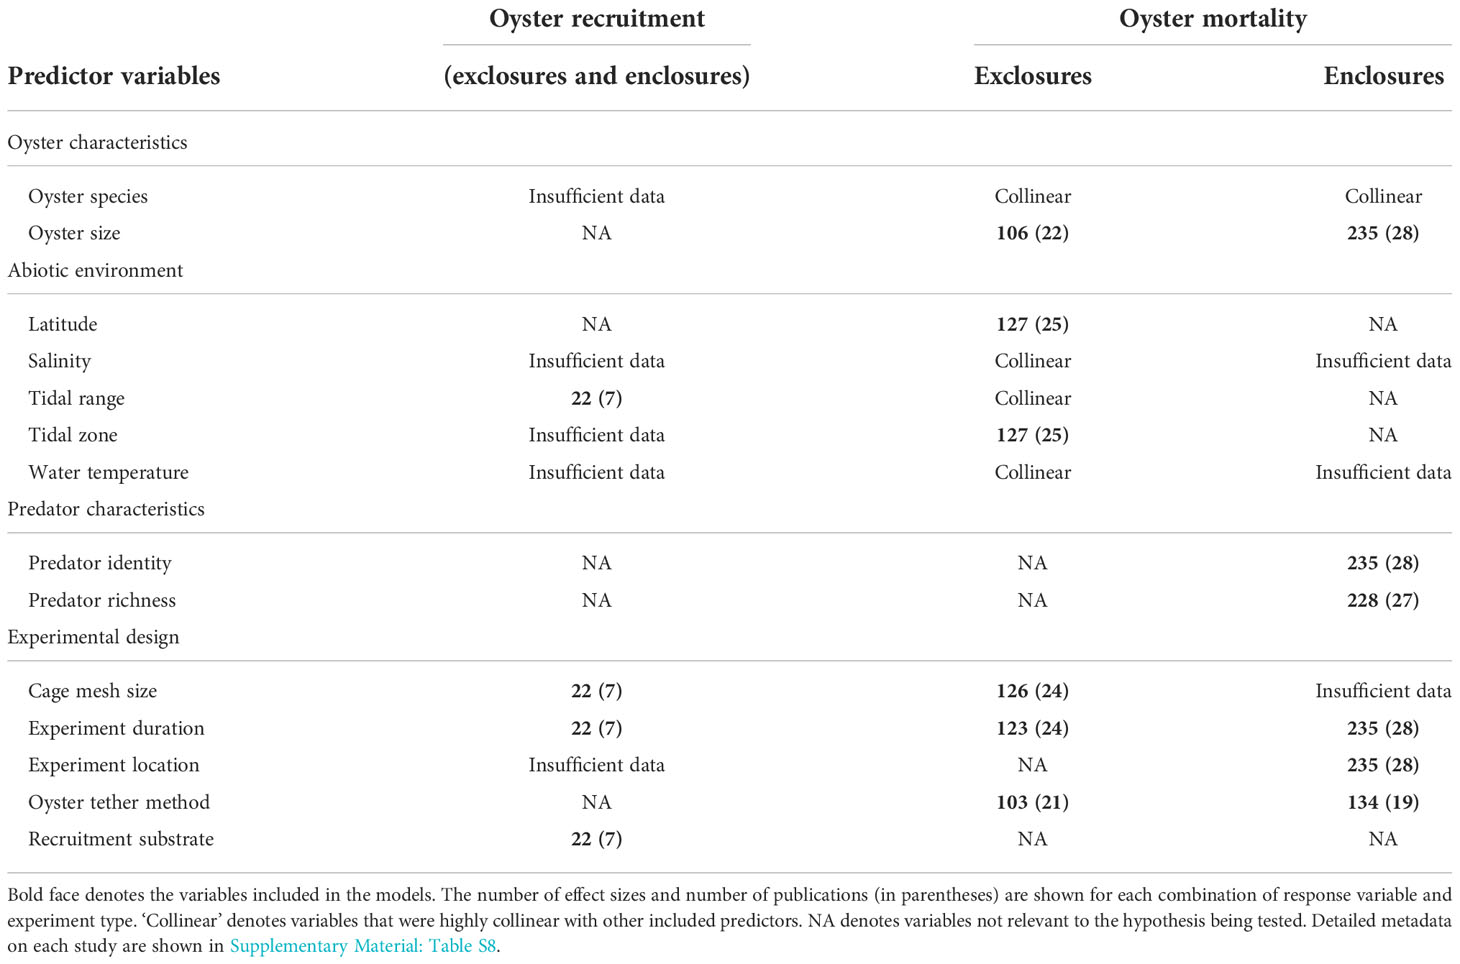
Table 1 Predictor variables collected for each of the 384 predation experiments organized by response variable (oyster recruitment or mortality) and, for oyster mortality, experiment type (exclosures or enclosures).
Models of oyster recruitment and mortality included the remaining balanced, data-rich predictors as fixed effects and publication as a random intercept term to allow for within-study correlation. For each response variable, we started with the full model (all possible predictors) and performed stepwise backward model selection to iteratively remove nonsignificant predictors (p > 0.05) and find the most parsimonious model with only significant terms, hereafter referred to as the reduced model (Zuur et al., 2009). We focus our results on the reduced model with the least constrained dataset (i.e., the maximum number of studies with data on the significant predictors), but model coefficients and significance were similar to both the full model and the reduced model with the most constrained datasets (i.e., the minimum number of studies with data on both significant and nonsignificant predictors; Supplementary Material: Tables S3–5).
We used model-estimated partial residuals to estimate and visualize effect sizes for individual significant predictors while holding other fixed and random covariates constant using visreg 2.7.0 (Breheny and Burchett, 2017). We used post hoc tests to estimate pairwise differences using emmeans 1.6.3 (Lenth, 2021). For intercept-only models, we calculated the percentage change between the treatment and control groups as 100 × e(LRR–1). We ensured that model residuals met assumptions of normality and homogeneity using DHARMa 0.4.3 (Hartig, 2021). All models were constructed using lme4 1.1.27.1 (Pinheiro et al., 2021) or glmmTMB 1.1.2.2 (Brooks et al., 2017). Lastly, we performed several tests of publication bias and model sensitivity to ensure our findings were robust (Supplementary Material: Figures S2–9, Table S6).
Results
Temporal, geographic, and taxonomic trends in oyster predation studies
The 49 peer-reviewed publications that met our inclusion criteria were published between 1977 and 2021, yielding n = 384 individual effect sizes included in our final analyses (Figure 1A; Supplementary Material Figure S10, Table S7). The number of suitable studies increased beginning in the 2000s. Studies reporting oyster mortality were common (47 publications), while those reporting recruitment were much rarer (7 publications). The vast majority (93%) of effect sizes were from studies along the U.S. Atlantic, Gulf, and Pacific Coasts (Figure 1B). Studies meeting our criteria were absent outside of North America and northern Europe (Germany and the British Isles). Taxonomically, Crassostrea virginica was overrepresented (83% of all measurements) relative to other oyster species (C. gigas, Ostrea edulis, and O. lurida).
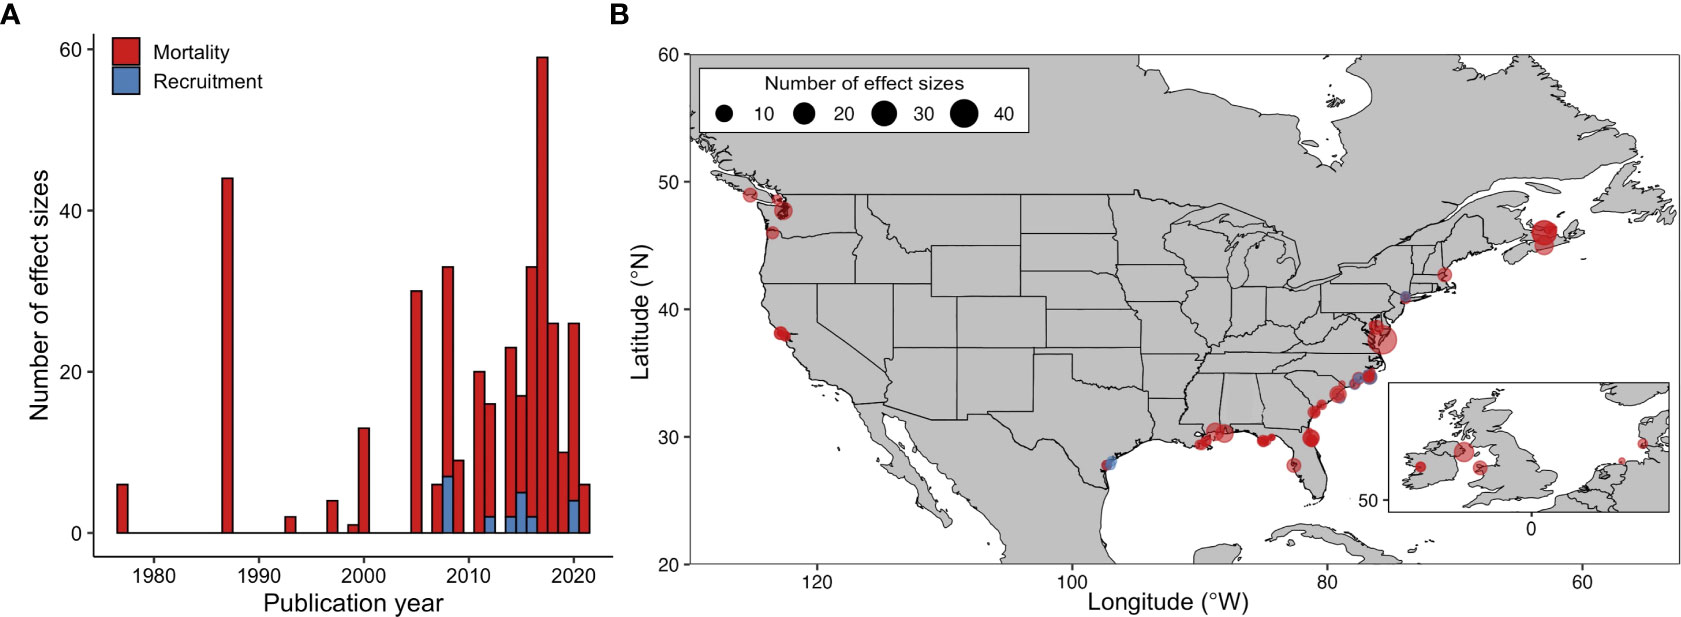
Figure 1 The annual number of individual predator exclusion experiments (or effect sizes) included in the meta-analysis (A). Global distribution of experiments (B) that measured oyster mortality (n = 362) and recruitment (n = 22). Points indicate the location of suitable studies; larger points indicate more effect sizes. Panel A legend also corresponds to panel B.
Predator effects on mortality and recruitment
Predator access resulted, on average, in a 4.3× increase in oyster mortality (post hoc test of difference from zero: t1,359 = 8.6, p < 0.001; Figure 2A) and a 46% decrease in recruitment (t1,19 = –4.5, p < 0.001; Figure 2B).
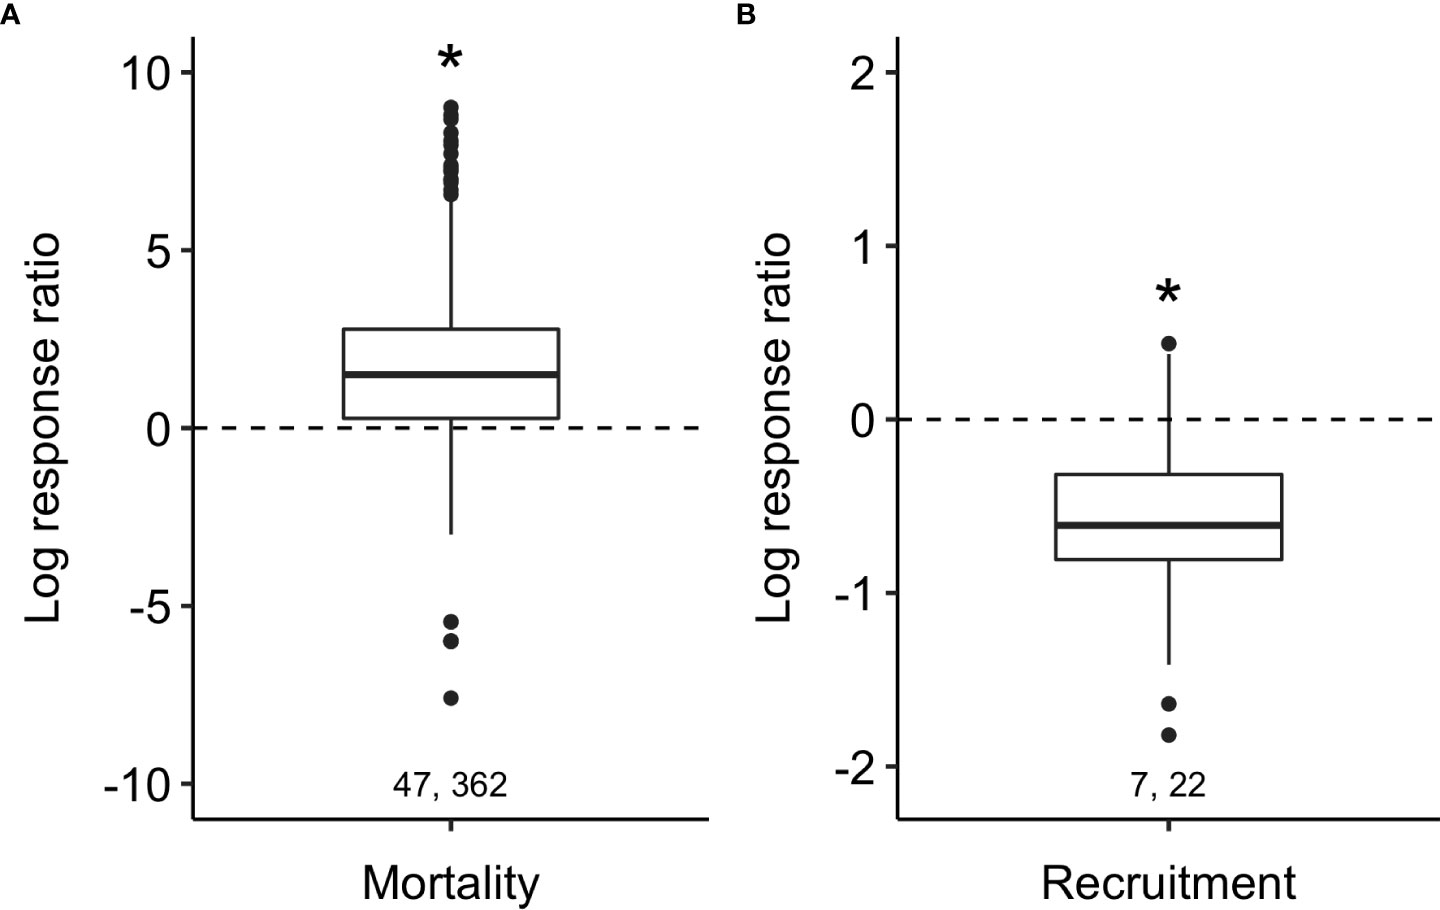
Figure 2 Predators increased oyster mortality (A) and decreased recruitment (B) across the entire meta-dataset. Boxplots show median (bold lines) effect sizes and interquartile ranges (boxes) with outliers greater than 1.5 × IQR (whiskers). Pairs of numbers represent the number of published papers (left) and the number of independent experiments (right). The dotted line at zero is the effect size expected if there is no effect of predators and asterisks show where means differ from zero (p < 0.01). Note difference in y-axis scale between the two panels.
Effects of oyster size
In predator exclosure experiments, predators increased oyster mortality in both small (≤ 25 mm) and large (> 25.1 mm) oyster size categories (t1,89 = 3.1, p = 0.002; t1,89 = 5.6, p < 0.001; respectively). However, predator effects were 1.7× stronger in the larger size class (partial residual LRR: 3.15 vs. 1.86; Table 2; Figure 3; Supplementary Material: Figure S3, Table S3). Our size analysis for the exclosure experiments included C. virginica and C. gigas, and their shell heights ranged from 2.0 to 75.0 mm (small size-class category μ ± SE: 13.6 ± 0.8 mm and large size-class category: 57.7 ± 2.2 mm).
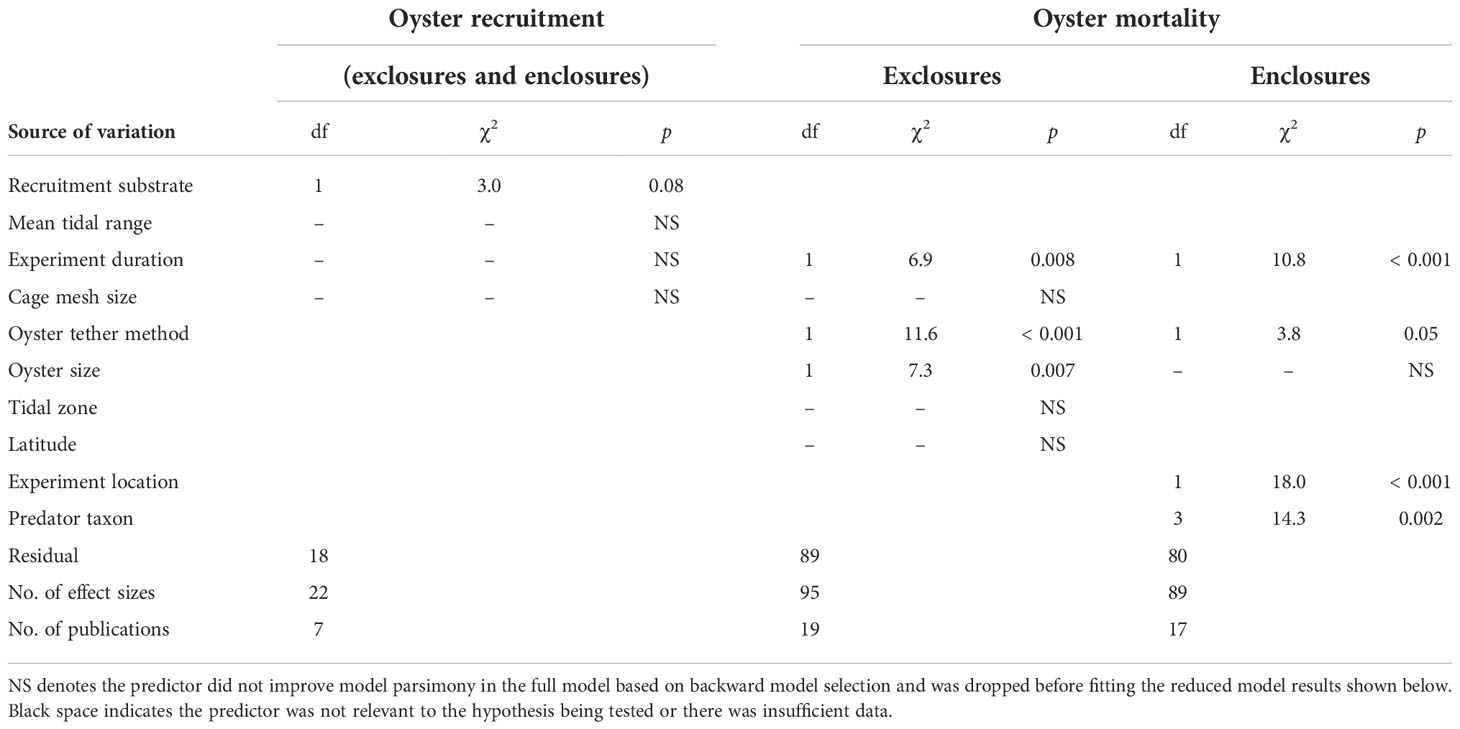
Table 2 Results of the linear mixed-effect models organized by response variable and experiment type.
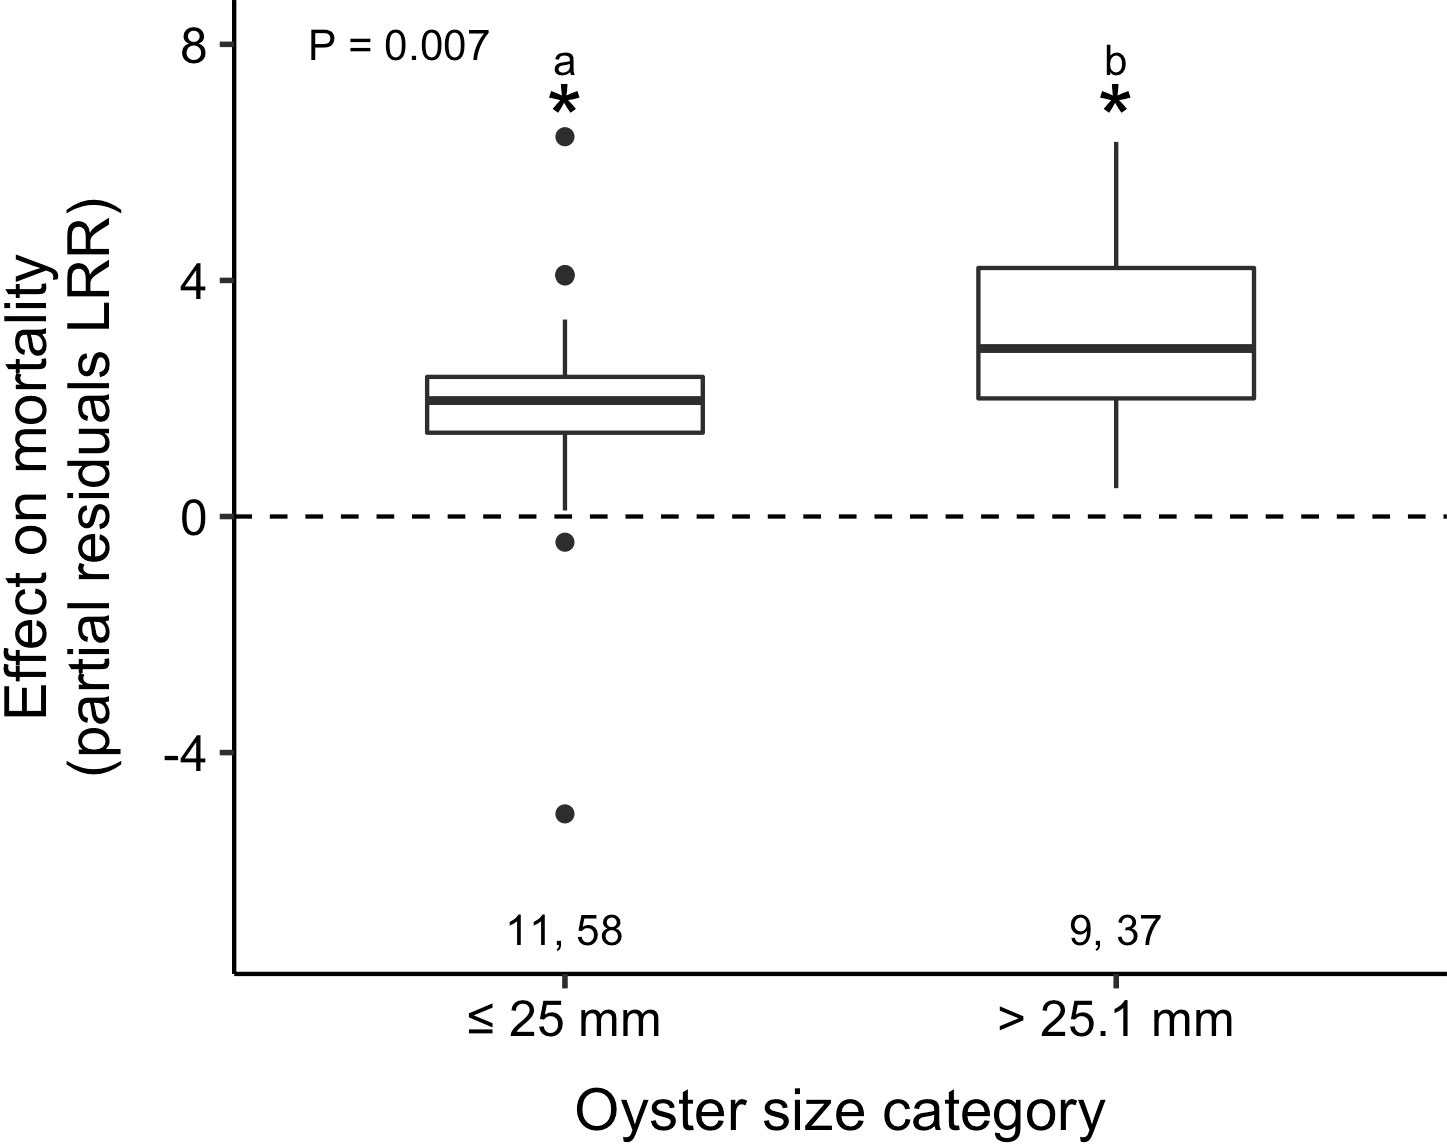
Figure 3 Predators increased oyster mortality across both size categories, but effects were strongest on large oysters (> 25.1 mm shell height). Boxplots show partial residuals and p-value indicates the respective main effect displayed from mixed-effects models. Lowercase letters represent results from post-hoc tests and those that do not share a common letter are significantly different (p ≤ 0.05). Pairs of numbers and asterisks as in Figure 2.
However, predator effects did not differ between oyster size categories in enclosure experiments (p = 0.9; Supplementary Material: Figure S11A, Table S4). In addition to C. virginica and C. gigas, analysis of enclosure experiments included O. lurida and O. conchaphila, and their shell heights ranged from 5.0 to 100.0 mm (small size-class category: 10.8 ± 0.7 mm and large size-class category: 42.9 ± 2.2 mm).
Effects of environmental conditions
In predator exclosure studies, tidal zone (p = 0.2; Supplementary Material: Figure S12A, Table S3) and latitude (p = 0.9; Supplementary Material: Figure S12B, Table S3) had no detectable effects on oyster mortality from predation.
Likewise, mean tidal range, which varied from 0.2 to 1.4 m (0.9 ± 0.09 m), had no effect on oyster recruitment in predation experiments (p = 0.6; Supplementary Material: Figure S13A, Table S5). Studies reported on reefs located in both intertidal and subtidal habitats, and across a range of salinities (5.5 to 41.7 ppt) and water temperatures (9.0 to 30.7°C).
Effects relative to predator identity
In enclosure experiments confining oysters with known predators, all types of predators increased mortality (Figure 4; Table 2; Supplementary Material: Figure S4, Table S4). However, the strength of predator effects varied with the type of predator(s) used in the experiment: gastropod and multi-taxon predator treatments were 5.8× stronger relative to the two-species crab treatments (partial residual LRR: 2.27–2.29 vs. 0.40; post hoc pairwise comparisons: t1,80 = –3.1, p = 0.003; t1,80 = –3.3, p = 0.001; respectively). There was no difference in predator effects between the one- and two-species crab treatments (t1,80 = 1.7, p = 0.1), or between the one-species crab treatment and any other group (gastropods: t1,80 = -1.6, p = 0.1 and multi-taxon: t1,80 = -1.7, p = 0.08).
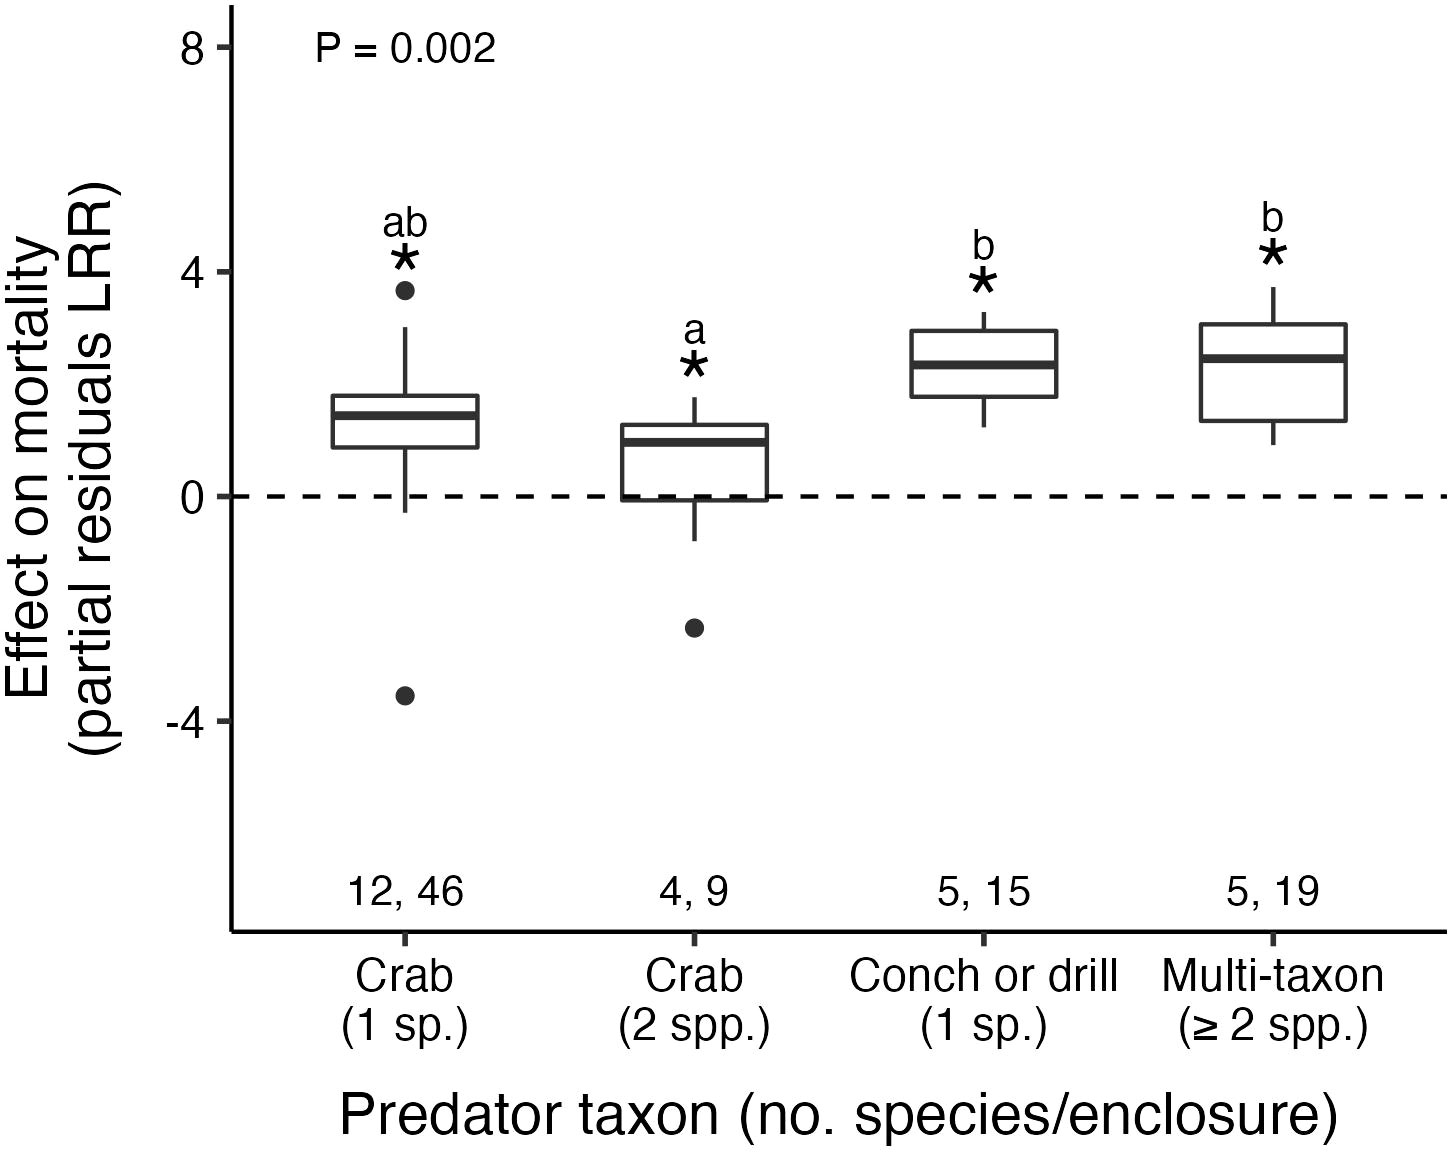
Figure 4 Oyster mortality varied based on predator taxon. Pairs of numbers, boxplots, asterisks, letters, and p-value as in Figure 3.
Most of these enclosure experiments included only one predator species (69% of effect sizes) and, of those, the most common predators were either mud crabs or oyster drills. A combination of crabs and oyster drills was the most common multi-taxon treatment (63% of effect sizes).
Role of experimental design on predator effects
Oyster predation strength differed between experiments that exposed oysters to the natural predator community (exclosures) and those that confined oysters with known predators (enclosures). Predators increased oyster mortality in both exclosure and enclosure experiments (i.e., LRR > 0), but predator effects were 5.1× stronger in the enclosures (partial residual LRR: 0.98 vs. 0.19; = 0.03; Figure 5). We further explored the effect of experiment location (field vs. lab) within enclosure studies and found that predator effects were 3.9× stronger in lab studies relative to field studies (partial residual LRR: 4.96 vs. 1.28; Table 2; Supplementary Material: Figure S11B, Table S4). However, after incorporating the field exclosure experiments without additional covariates, the difference between field and lab enclosures was no longer maintained (t1,362 = –1.1, p = 0.3; Supplementary Material: Figure S14).
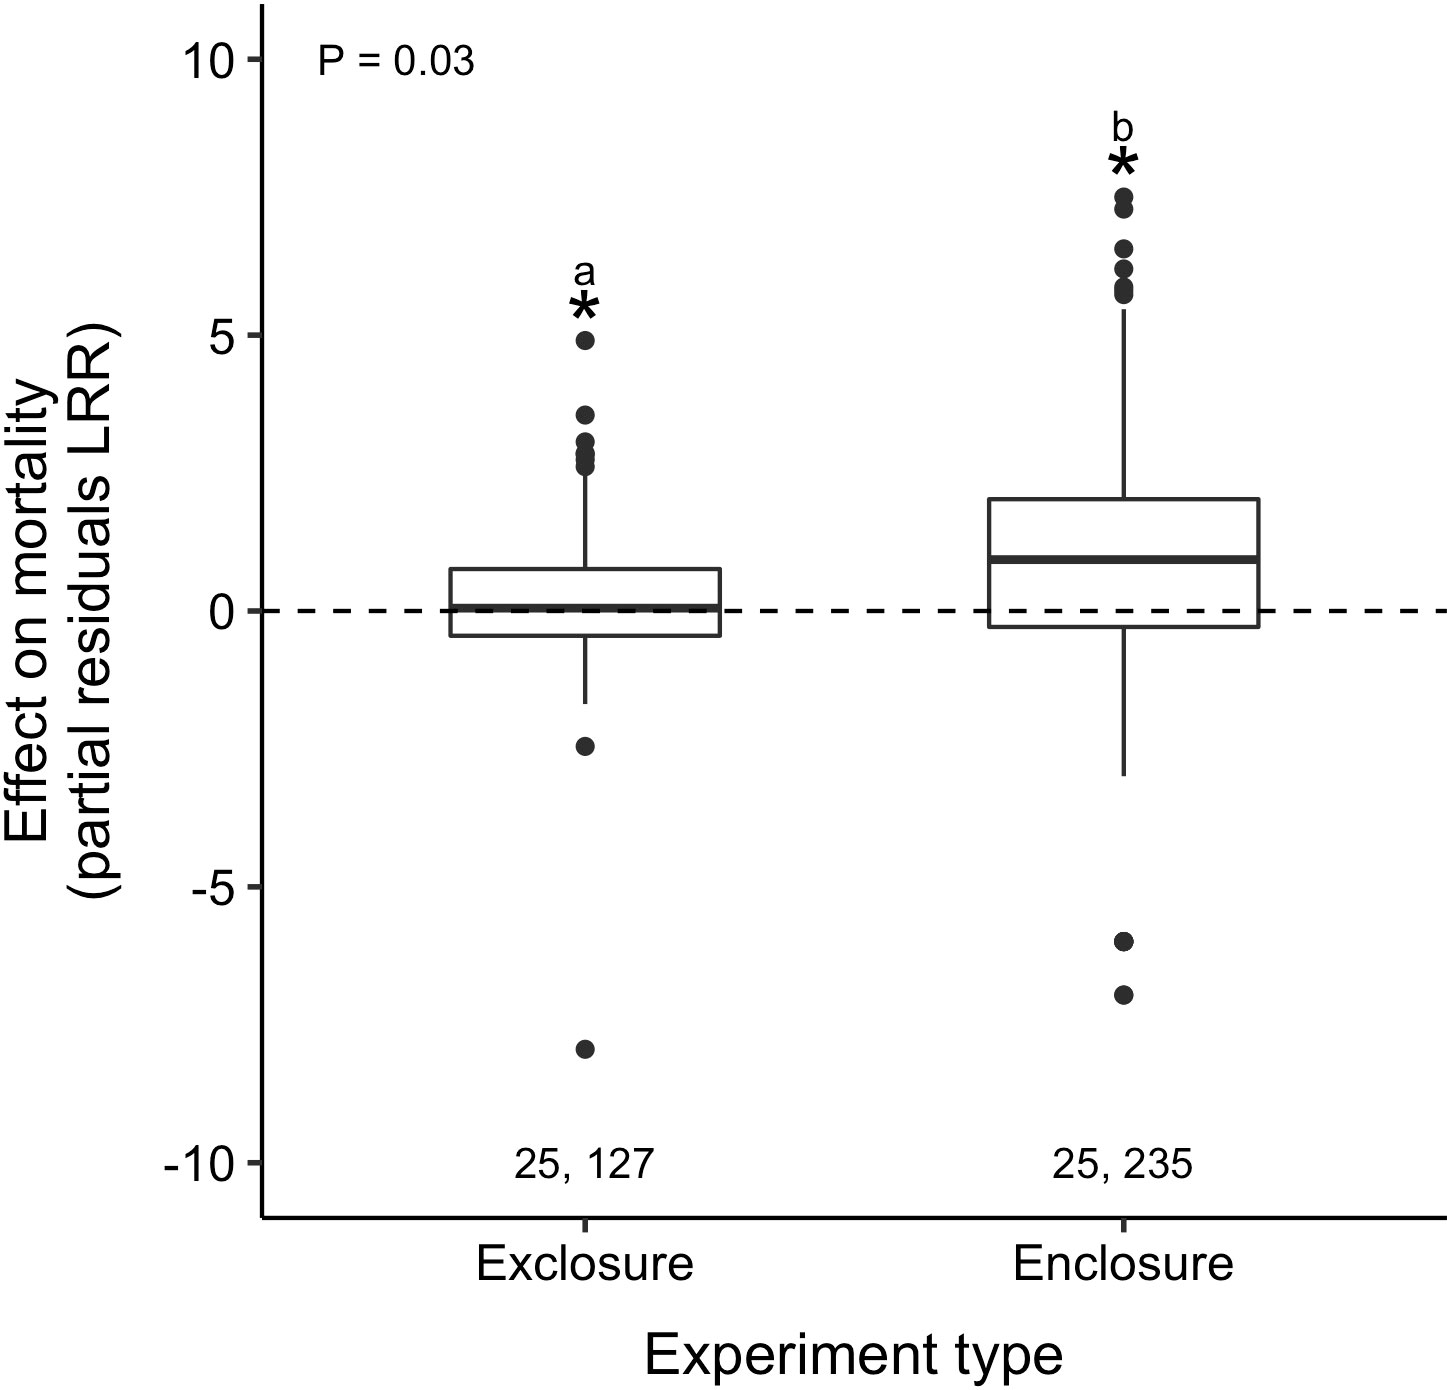
Figure 5 Predators increased oyster mortality across both experiment types, but effects were strongest in enclosures when oysters were confined with known predators. Pairs of numbers, boxplots, asterisks, letters, and p-value as in Figure 3.
Predator effects on mortality weakened by 0.4% per day as the duration of exclosure experiments increased (Table 2; Figure 6A; Supplementary Material: Table S3). Interestingly, however, predator effects strengthened by 3% per day as the duration of enclosure studies increased (Table 2; Figure 6B; Supplementary Material: Table S4). Experiment duration had no detectable influence on predator effects on oyster recruitment (p = 0.7; Table 2; Supplementary Material: Figure S13B, Table S5). In all types of studies, experiment duration was right skewed, limiting inference about longer experiments. Exclosure experiments measuring mortality were longer than enclosures, with a median of 30 days for exclosures compared to 6 days for enclosures. Oyster recruitment studies lasted longer than both types of mortality studies, with a median of 98 days. More than half (62%) of the field studies reporting the experiment’s time of year occurred either exclusively in or during parts of the summer.
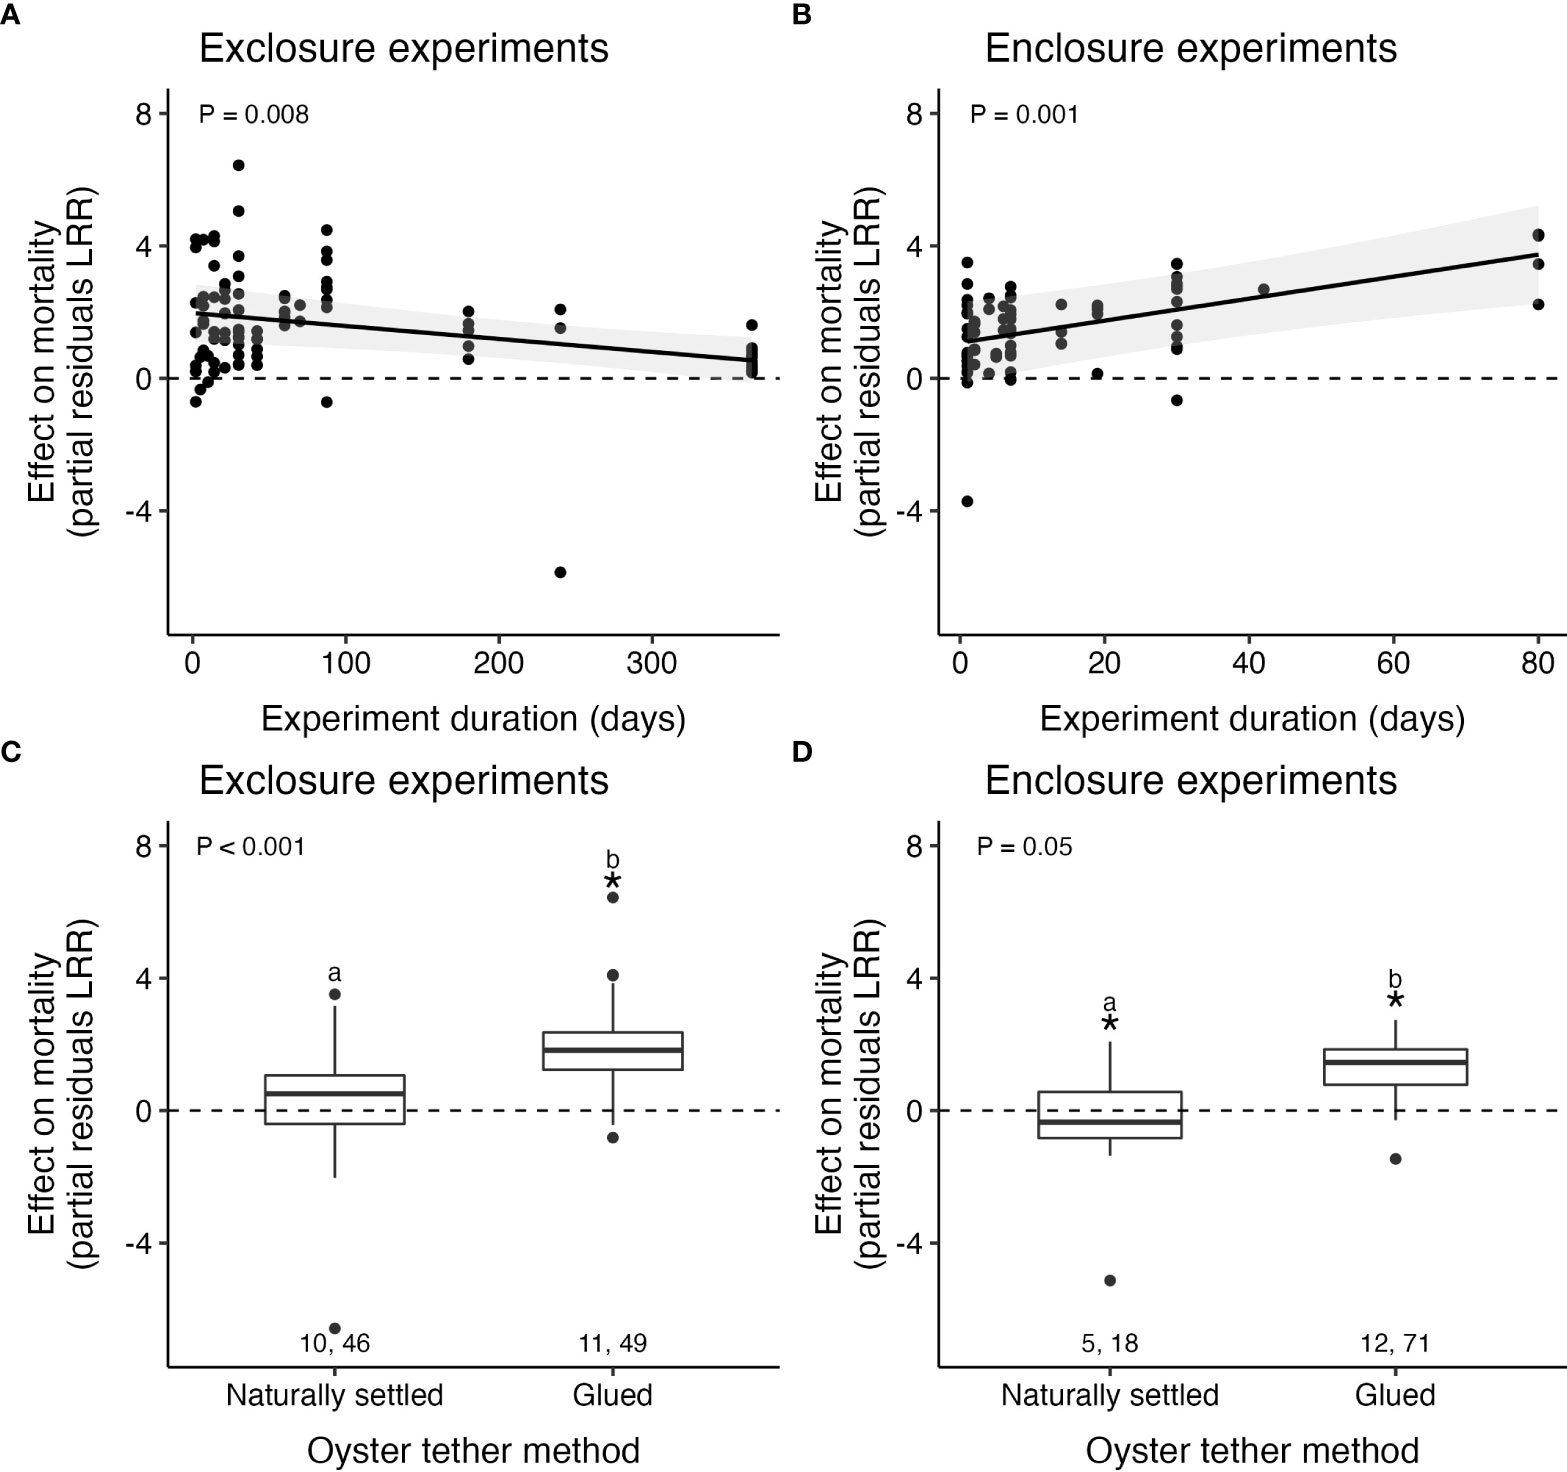
Figure 6 Predator effects on oyster mortality weakened as experiment duration increased in exclosures (A), while the opposite pattern was detected in enclosure experiments (B). Predators increased mortality in oysters tethered with glue relative to naturally settled individuals in both exclosure (C) and enclosure (D) experiments. For panels A and B, points show partial residuals, lines indicate the model-estimated predicted fits and shading displays 95% confidence intervals. Pairs of numbers, boxplots, asterisks, letters, and p-values as in Figure 3.
Predators increased mortality for oysters tethered with glue and those that were naturally settled in both exclosure and enclosure experiments (Table 2; Figures 6C, D; Supplementary Material: Figures S3, 4). Regardless of experiment type, predicted predator effects were 2.5 to 4.3× stronger on glued oysters relative to naturally settled oysters (partial residual LRR: 2.50 vs. 0.97 for exclosure studies and 1.28 vs. –0.30 for enclosure studies). Predators caused marginal decreases in oyster recruitment across both types of recruitment substrate (artificial substrate or oyster shell; Table 2; Supplementary Material: Table S5, Figure S13C). Cage mesh size, which varied from 1.0 to 50.0 mm (μ ± SE: 16.2 ± 1.5 mm), had no detectable effect on oyster mortality (p = 0.6; Table 2; Supplementary Material: Figure S12C; Table S5) or recruitment (p = 0.8) in predation experiments (Table 2; Supplementary Material: Figure S13D, Table S3).
Publication bias and model sensitivity
To ensure our findings were robust, we conducted sensitivity analyses in which we used a ‘drop-one’ approach to explore whether any study caused extreme leverage on the grand mean LRR (Lefcheck et al., 2019). For each model, we systematically dropped each study, recomputed the LRR, and compared the means of the new and old values using a two-sided t-test. We found no differences between old and new LRR values (p > 0.05; Supplementary Material: Figure S6). In addition, we used several approaches to verify that our results were not affected by publication bias: (1) inspection of funnel plots (Møller and Jennions, 2001; Supplementary Material: Figure S7), (2) calculation of Rosenthal’s fail-safe number (Rosenthal, 1979; Supplementary Material: Table S6), (3) calculation of Cook’s distance, (4-5) exploration of the relationship between effect sizes and peer-reviewed publication identification (Supplementary Material: Figure S8) and publication year (Supplementary Material: Figure S9), and (6) tests of spatial autocorrelation. Lastly, we examined data where variances were available and found similar trends for LRRs weighted by the inverse of the variances and sample sizes (Lefcheck et al., 2019; Supplementary Material: Figures S2–5). These analyses indicate that our findings were robust to effect-size metric, selecting reporting, and dissemination bias.
Discussion
Our meta-analysis demonstrates that predators have strong effects on imperiled coastal foundation species by increasing mortality and decreasing recruitment of reef-building oysters. Although several individual studies have shown that predation can influence oyster populations, this meta-analysis represents the first systematic quantification of results from oyster predation experiments and the first analysis of how predator effects are mediated by oyster size, environmental conditions, the predator assemblage, and experimental design. Our results indicate that oyster predation is structured by oyster size, predator identity, and predator richness. Unexpectedly, we found that latitude, tidal zone, and tidal range had no consistent effects on predation strength. Large differences in predator effects among different types of experiments, oyster tethering methods, and study duration demonstrate the biases introduced by experimental design and the caution warranted in interpreting results from individual studies. For coastal managers and conservation practitioners, our findings suggest that outplanting small (vs. large) oysters will not necessarily yield greater mortality and that siting restorations in areas with low densities of predators, especially gastropods, may improve oyster survival and the success of restoration projects.
Oyster size mediates predation
We discovered that predation is a significant cause of oyster mortality across all oyster sizes (2.0 to 75.0 mm SH) in field exclosure experiments. However, consistent with other published studies on size-selective predation (Hamilton and Caselle, 2015; Stevenson et al., 2016), predator effects on mortality were stronger on the largest individuals. If the amount of energy gained by predator consumption outweighs the energy expended for collection, it is more advantageous for predators to prey on larger individuals (Hamilton and Caselle, 2015). Size-selection for the largest prey is often dependent on the predator’s gape size and bite force (Wainwright, 1987; Quinn and Kinnison, 1999). For example, cownose rays showed the greatest predation success on oysters 30 to 70 mm SH (lowest predation on 15 to 25 mm and > 75 mm SH) because they are within ray gape limitations (Fisher et al., 2011).
By contrast, oyster size did not explain significant heterogeneity in effect sizes in enclosure experiments. We speculate that smaller and fewer predators may have been used inside the enclosures (average enclosure height: 0.7 ± 0.05 m; average enclosure width: 1.0 ± 0.1 m; n = 75), or there were fewer oyster prey options (in terms of abundance and size) relative to exclosure experiments. A lack of preference in prey size has also been shown in smaller granivorous rodents (Pons and Pausas, 2007) and predatory tropical fish (Holmes and McCormick, 2010).
Latitude and tidal zone had limited effects on predation
Eastern oysters (C. virginica) and Pacific oysters (C. gigas) exist across a large geographic range and have broad tolerances to spatial and temporal variation in environmental conditions (salinity, water temperature, tidal range; Fabioux et al., 2005; Dridi et al., 2007; Byers et al., 2015; Lowe et al., 2017). Hence, it is perhaps not surprising that we did not detect any changes to predation based on latitude or tidal zone for these two oyster species included in our analyses of predator exclosure studies. This conclusion contrasts with several other taxa (insects, crustaceans, corals, birds, fishes) that show stronger predation strength in lower latitudes and depths (Fox and Bellwood, 2007; Schemske et al., 2009; Roslin et al., 2017). Although our analysis included studies across nearly 30 degrees of latitude (27°N to 54°N), our inference about how latitude influences oyster predation on an annual basis is limited because most field studies in our meta-analysis lasted less than three months (84%) and occurred during summer (62%), when predation rates may be high irrespective of latitude (Brown et al., 2008). Latitudinal trends in oyster predation may be more evident in studies that integrate predation across the year, such as field experiments lasting a year or longer, or models incorporating seasonal demographic rates.
Predator identity may influence predation
We found that predator effects were strongest in studies enclosing gastropods (conchs and drills) or multiple predator taxonomic groups, and weakest in studies enclosing two crab species (studies enclosing one crab species showed intermediate predation effects). The two-crab species predator treatment had the lowest sample size (9 effect sizes from 4 unrelated publications) and, while the cause of this result is currently unclear, we can speculate about possible explanations. The two-crab species treatments included combinations of blue crabs (Callinectes sapidus), stone crabs (Menippe mercenaria), graceful crabs (Cancer gracilis), red rock crabs (Cancer productus), or mud crabs (Panopeus herbstii). Our finding of relatively weak predator effects on oysters in the two-crab treatment is consistent with the hypothesis that intra-guild predation may partly release prey from predator control (Vance-Chalcraft et al., 2007). We speculate that within a confined area, these crabs may have interfered with or attacked one another, thereby weakening oyster predation (O'Connor et al., 2008; Byers et al., 2017; Geraldi et al., 2021). Oyster predation experiments from Byers et al. (2017) (included in this meta-analysis) noted dead mud crabs in treatments with blue crabs suggesting that intraguild predation may have improved oyster survival. Like many terrestrial and aquatic ecosystems, intraguild predation may be an important factor on oyster reefs in determining how the risks from multiple predators combine to affect habitat-forming prey (e.g., mussel beds, Byrnes et al., 2006; kelp forests, Leighton and Tyler, 2021). Moreover, contrary to the positive influences of predator richness on prey survivorship (McCoy et al., 2012; Griffin et al., 2013), we found no differences in oyster mortality effect sizes between the multi-taxon and either of the single-species predator treatments. This result could be explained by generalist predators preferring to feed on oysters (as opposed to other predator species within the enclosures; Byers et al., 2017; Geraldi et al., 2021), thereby strengthening the predator effect in the multi-taxon predator treatment. A conch or drill was also included in most multi-predator taxon treatments (68% of effect sizes), further supporting the conclusion that gastropods are particularly effective in reducing oyster survival. Nevertheless, further study is needed to test these hypotheses on oyster reefs and evaluate the robustness and generality of our results.
Experimental design alters estimates of predation effects
Our analyses demonstrated that investigator decisions about study design strongly affect the measured effects of predators on oyster mortality. First, enclosure experiments may overestimate the impact of predator effects, as we found ~5× higher oyster mortality in enclosures relative to exclosures. This new finding for oysters is consistent with prior studies on the effects of enclosures on algae and invertebrates (e.g., sponges, isopods, crabs) in freshwater and marine ecosystems, such as streams and rocky benthic ecosystems (Hillebrand, 2009; Farias et al., 2012). Enclosures allow for manipulations that are not always possible in the field (e.g., examining effects of predator identity, richness, abundance), but lack natural spatial and temporal environmental variation (e.g., currents, waves) that stress predators and provide prey with temporary refugia (the ‘consumer stress model’; Menge and Olson, 1990). Additionally, simple predator assemblages in enclosures do not represent the complexity of real communities and their potential for interactions that disrupt predation, such as competition between predators or predation on mesopredators (Aronson et al., 2001; He and Silliman, 2016). Enclosures can also constrain predator foraging movements and limit the number of prey options, which can accentuate predator effects (Peterson and Black, 1994; O'Connor and Bruno, 2009). However, while these artifacts associated with predator enclosures are probably stronger than those associated with predator exclosures (Peterson and Black, 1994), we cannot rule out the possibility that exclosure studies may underestimate predator effects. This could occur, for instance, if the fouling of predator-exclusion cages diminishes water flow and increases oyster mortality, and such caging artifacts are not accounted for using ‘procedural control’ treatments.
Interestingly, the effects of experiment duration diverged based on experiment type. Oyster predator effects weakened over time in predator exclosures but strengthened over time in predator enclosures. We speculate that predator effects in enclosures strengthen over time due to the factors described above that intensify predation rates: a lack of abiotic and biotic stresses that disrupt predation, little or no choice of prey, and constrained predator movement (Feminella and Hawkins, 1995; Borer et al., 2005; Hillebrand, 2009). By contrast, exclosure studies may see a weakening of the relative influence of predation if non-predation factors gradually reduce prey survival in caged plots (or in both caged and uncaged plots). For instance, over relatively long time periods, predator effects may be overwhelmed by disease, competition, disturbance, or abiotic stress that reduce survival across treatments and make mortality estimates among treatments more similar (Preisser and Strong, 2004; Menge et al., 2016). The weakening predator effect over time could also be due to habituation of the predators in the presence of oysters, which has also been documented on coral reefs (Koval et al., 2020).
Across all experiments, we found large differences in oyster mortality between prey tethering methods (naturally settled vs. glued oysters). The potential challenges to using tethering to assess predation rates have been well described (e.g., Peterson and Black, 1994; Aronson and Heck, 1995; Baker and Waltham, 2020), yet few oyster predation studies adequately address potential artifacts or biases of those methods (but see Kulp and Peterson, 2016). Only one publication in our analyses made direct comparisons between tethering methods (Baillie and Grabowski, 2019), finding that naturally settled oysters experienced lower mortality than artificially glued ones (consistent with our result). In this study, naturally settled oysters were smaller than the glued oysters, and the authors speculated that sedimentation and algal overgrowth obscured the smaller, naturally settled oysters from predators (Baillie and Grabowski, 2019). In addition, naturally settled oysters may be harder for predators to remove from the substrate because their natural adhesive produces a stronger bond (Burkett et al., 2010). This finding is similar to predation on coral reefs, which shows higher mortality on corals using glue (vs. corals attached with cement; Koval et al., 2020).
Artificial recruitment plates or tiles may introduce potential biases because they often use a construction materials like ceramic or plastic that cannot perfectly mimic natural substrata (Peterson and Black, 1994; Aronson and Heck, 1995). We found a marginal difference in predator effects on oyster recruitment between different substrate types, suggesting that artificial substrata may introduce significant biases to estimates of predation potential relative to shell or other natural materials. Nevertheless, natural substrata are more difficult to standardize among treatments and replicates.
Future directions
Our meta-analysis revealed several important research gaps. Given the global extent of oysters, we were surprised to find few suitable predation studies for species other than C. virginica. More research is needed to determine the global applicability of our findings, particularly for oyster reefs beyond North America and in the tropics (Richardson et al., 2022). Additionally, due to low sample sizes or multi-collinearity, we were unable to examine the effects of several factors that have been suggested to affect oyster predation rates, such as abiotic conditions (dissolved oxygen, elevation, flow velocity, inundation period, salinity; Ruesink, 2007; Knights et al., 2012), biotic factors (parasites, pathogens, and competitors; Carroll et al., 2021), and landscape characteristics (reef size and shape, distance to other habitats; Micheli and Peterson, 1999; Carroll et al., 2015). We also showed that predators have a strong influence on oyster recruitment, but we were unable to infer mechanisms due to limited sample sizes. Lastly, given the high expected mortality during the larval stage (Baker and Mann, 1992), future research should seek to study how predators influence survival of these early-life stages that are crucial to population recovery and persistence.
Conclusions
Our quantitative synthesis is the first to show that, across a range of environments, predators have strong impacts on oysters. This finding for oyster reefs is similar to meta-analyses examining predator or herbivore effects on prey in terrestrial (Shurin et al., 2002; Salo et al., 2010) and aquatic (Gruner et al., 2008; Hillebrand, 2009; Poore et al., 2012; He and Silliman, 2016; Wesner, 2016) ecosystems. Our results also echo those from meta-analyses in other intertidal habitats which show that herbivore characteristics (e.g., species identity) and study duration mediate herbivore effects on foundational primary producers (Poore et al., 2012; He and Silliman, 2016).
Lastly, beyond advancing our understanding of predation on foundation species, our results revealed broad trends and a greater mechanistic understanding that can inform how predators may influence the success of oyster restoration, which has increased globally in response to catastrophic oyster declines (Beck et al., 2011; Duarte et al., 2020, Smith et al., in press). Our analyses revealed exceptionally high predation on larger oysters. Because per-capita fecundity increases exponentially with oyster size (e.g., Mroch et al., 2012), our results suggest that predators may limit reef-scale reproductive output and diminish metapopulation connectivity and persistence (Castorani et al., 2017; Theuerkauf et al., 2021). Our results suggest that restoring oyster reefs in areas with few gastropod predators may improve restoration outcomes by enhancing recruitment, survival, and fecundity.
Author contributions
Both authors conceived of the study. KT compiled and analyzed the data, and wrote the manuscript. MC contributed to data analysis, interpreting results, and revising the manuscript. All authors contributed to the article and approved the submitted version.
Funding
This research was funded by National Science Foundation grant 1832221 to the Virginia Coast Research Long Term Ecological Research project. KT was also supported by a Jefferson’s Scholar Foundation Fellowship and a Virginia Sea Grant Graduate Research Fellowship.
Acknowledgments
We are grateful to the authors of the primary studies who collected the empirical data, whose published data allowed us to undertake the meta-analysis. We thank E.A. Eareckson who assisted with data extraction. We also thank R.S. Smith and two reviewers for comments that improved this manuscript.
Conflict of interest
The authors declare that the research was conducted in the absence of any commercial or financial relationships that could be construed as a potential conflict of interest.
Publisher’s note
All claims expressed in this article are solely those of the authors and do not necessarily represent those of their affiliated organizations, or those of the publisher, the editors and the reviewers. Any product that may be evaluated in this article, or claim that may be made by its manufacturer, is not guaranteed or endorsed by the publisher.
Supplementary material
The Supplementary Material for this article can be found online at: https://www.frontiersin.org/articles/10.3389/fmars.2022.1055240/full#supplementary-material
References
Aronson R. B., Heck J. K. L. (1995). Tethering experiments and hypothesis testing in ecology. Mar. Ecol. Prog. Ser. 121, 307–309. doi: 10.3354/meps121307
Aronson R. B., Heck K. L., Valentine J. F. (2001). Measuring predation with tethering experiments. Mar. Ecol. Prog. Ser. 214, 311–312. doi: 10.3354/meps214311
Baillie C. J., Grabowski J. H. (2019). Factors affecting recruitment, growth and survival of the eastern oyster Crassostrea virginica across an intertidal elevation gradient in southern new England. Mar. Ecol. Prog. Ser. 609, 119–132. doi: 10.3354/meps12830
Baker S. M., Mann R. (1992). Effects of hypoxia and anoxia on larval settlement, juvenile growth, and juvenile survival of the oyster Crassostrea virginica. Biol. Bull. 182, 265–269. doi: 10.2307/1542120
Baker R., Waltham N. (2020). Tethering mobile aquatic organisms to measure predation: A renewed call for caution. J. Exp. Mar. Biol. Ecol. 523, 151270. doi: 10.1016/j.jembe.2019.151270
Beck M. W., Brumbaugh R. D., Airoldi L., Alvar C., Coen L. D., Crawford C., et al. (2011). Oyster reefs at risk and recommendations for conservation, restoration, and management. Bioscience 61, 107–116. doi: 10.1525/bio.2011.61.2.5
Borer E. T., Seabloom E. W., Shurin J. B., Anderson K. E., Blanchette C. A., Broitman B., et al. (2005). What determines the strength of a trophic cascade? Ecology 86, 528–537. doi: 10.1890/03-0816
Breheny P., Burchett W. (2017). Visualization of regression models using visreg. R J. 9, 56–71. doi: 10.32614/RJ-2017-046
Brooks M. E., Kristensen K., van Benthem K. J., Magnusson A., Berg C. W., Nielsen A., et al. (2017). glmmTMB balances speed and flexibility among packages for zero-inflated generalized linear mixed modeling. R J. 9, 378–400. doi: 10.32614/RJ-2017-066
Brown K. M., George G. J., Peterson G. W., Thompson B. A., Cowan J. J. H. (2008). Oyster predation by black drum varies spatially and seasonally. Estuaries Coasts 31, 597–604. doi: 10.1007/s12237-008-9045-8
Burkett J. R., Hight L. M., Kenny P., Wilker J. J. (2010). Oysters produce an organic–inorganic adhesive for intertidal reef construction. J. Am. Chem. Soc. 132, 12531–12533. doi: 10.1021/ja104996y
Byers J. E., Grabowski J. H., Piehler M. F., Hughes A. R., Weiskel H. W., Malek J. C., et al. (2015). Geographic variation in intertidal oyster reef properties and the influence of the tidal prism. Limnol. Oceanogr. 60, 1051–1063. doi: 10.1002/lno.10073
Byers J. E., Holmes Z. C., Malek J. C. (2017). Contrasting complexity of adjacent habitats influences the strength of cascading predatory effects. Oecologia 185, 107–117. doi: 10.1007/s00442-017-3928-y
Byrnes J., Stachowicz J., Hultgren K. M., Hughes A. R., Olyarnik S. V., Thornber C. S. (2006). Predator diversity strengthens trophic cascades in kelp forests by modifying herbivore behaviour. Ecol. Lett. 9, 61–71. doi: 10.1111/j.1461-0248.2005.00842.x
Carroll J. M., Dashiell R., Watts J. C., Hunter E. A. (2021). Tidal level affects the prevalence and impacts of pests and parasites on oysters (Crassostrea virginica) on intertidal reef in Georgia, USA. Mar. Biol. 168, 1–11. doi: 10.1007/s00227-021-03848-5
Carroll J. M., Marion J. P., Finelli C. M. (2015). A field test of the effects of mesopredators and landscape setting on juvenile oyster, Crassostrea virginica, consumption on intertidal reefs. Mar. Biol. 162, 993–1003. doi: 10.1007/s00227-015-2643-7
Castorani M. C. N., Reed D. C., Raimondi P. T., Alberto F., Bell T. W., Cavanaugh K. C., et al. (2017). Fluctuations in population fecundity drive variation in demographic connectivity and metapopulation dynamics. Proc. R. Soc. B: Biol. Sci. 284, 20162086. doi: 10.1098/rspb.2016.2086
Cheng B. S., Blumenthal J., Chang A. L., Barley J., Ferner M. C., Nielsen K. J., et al. (2022). Severe introduced predator impacts despite attempted functional eradication. Biol. Invasions 24, 725–739. doi: 10.1007/s10530-021-02677-3
Dayton P. K. (1972). “Toward an understanding of community resilience and the potential effects of enrichments to the benthos at McMurdo sound, Antarctica,” in Proceedings of the colloquium on conservation problems in Antarctica (Lawrence, KS: Allen Press).
Dridi S., Romdhane M. S., Elcafsi M. (2007). Seasonal variation in weight and biochemical composition of the pacific oyster, Crassostrea gigas in relation to the gametogenic cycle and environmental conditions of the bizert lagoon, Tunisia. Aquaculture 263, 238–248. doi: 10.1016/j.aquaculture.2006.10.028
Duarte C. M., Agusti S., Barbier E., Britten G. L., Castilla J. C., Gattuso J. P., et al. (2020). Rebuilding marine life. Nature 580, 39–51. doi: 10.1038/s41586-020-2146-7
Eger A. M., Baum J. K. (2020). Trophic cascades and connectivity in coastal benthic marine ecosystems: A meta-analysis of experimental and observational research. Mar. Ecol. Prog. Ser. 656, 139–152. doi: 10.3354/meps13430
Ellison A. M. (2019). Foundation species, non-trophic interactions, and the value of being common. iScience 13, 254–268. doi: 10.1016/j.isci.2019.02.020
Ellison A. M., Bank M. S., Clinton B. D., Colburn E. A., Elliott K., Ford C. R., et al. (2005). Loss of foundation species: Consequences for the structure and dynamics of forested ecosystems. Front. Ecol. Environ. 3, 479–486. doi: 10.1890/1540-9295(2005)003[0479:LOFSCF]2.0.CO;2
Englund G., Sarnelle O., Cooper S. D. (1999). The importance of data-selection criteria: meta-analyses of stream predation experiments. Ecology 80, 1132–1141. doi: 10.1890/0012-9658(1999)080[1132:TIODSC]2.0.CO;2
Fabioux C., Huvet A., Lesouchu P., Lepennec M., Pouvreau S. (2005). Temperature and photoperiod drive reproductive internal clock. Aquaculture 250, 458–470. doi: 10.1016/j.aquaculture.2005.02.038
Farias N. E., Meretta P. E., Cledón M. (2012). Population structure and feeding ecology of the bat star Asterina stellifera (Möbiu): Omnivory on subtidal rocky bottoms of temperate seas. J. Sea Res. 70, 14–22. doi: 10.1016/j.seares.2012.02.002
Feminella J. W., Hawkins C. P. (1995). Interactions between stream herbivores and periphyton: A quantitative analysis of past experiments. J. North Am. Benthological Soc. 14, 465–509. doi: 10.2307/1467536
Fisher R. A., Call G. C., Grubbs R. D. (2011). Cownose ray (Rhinoptera bonasus) predation relative to bivalve ontogeny. J. Shellfish Res. 30, 187–196. doi: 10.2983/035.030.0126
Fox R. J., Bellwood D. R. (2007). Quantifying herbivory across a coral reef depth gradient. Mar. Ecol. Prog. Ser. 339, 49–59. doi: 10.3354/meps339049
Geraldi N. R., Vozzo M. L., Fegley S. R., Anton A., Peterson C. H. (2021). Oyster abundance on subtidal reefs depends on predation, location, and experimental duration. Ecosphere 13, e4087. doi: 10.1002/ecs2.4087
Grabowski J. H. (2004). Habitat complexity disrupts predator-prey interactions but not the trophic cascade on oyster reefs. Ecology 85, 995–1004. doi: 10.1890/03-0067
Grabowski J. H., Gouhier T. C., Byers J. E., Dodd L. F., Hughes A. R., Piehler M. F., et al. (2020). Regional environmental variation and local species interactions influence biogeographic structure on oyster reefs. Ecology 101, e02921. doi: 10.1002/ecy.2921
Griffin J. N., Byrnes J. E. K., Cardinale B. J. (2013). Effects of predator richness on prey suppression: a meta-analysis. Ecology 94, 2180–2187. doi: 10.1890/13-0179.1
Gruner D. S., Smith J. E., Seabloom E. W., Sandin S. A., Ngai J. T., Hillebrand H., et al. (2008). A cross-system synthesis of consumer and nutrient resource control on producer biomass. Ecol. Lett. 11, 740–755. doi: 10.1111/j.1461-0248.2008.01192.x
Hamilton S. L., Caselle J. E. (2015). Exploitation and recovery of a sea urchin predator has implications for the resilience of southern California kelp forests. Proc. R. Soc. B: Biol. Sci. 282, 20141817. doi: 10.1098/rspb.2014.1817
Hartig F. (2021). DHARMa: Residual diagnostics for hierarchical (multi-level/mixed) regression models. Available at: https://cran.r-project.org/web/packages/DHARMa/index.html.
Hedges L. V., Gurevitch J., Curtis P. S. (1999). The meta-analysis of response ratios in experimental ecology. Ecology 80, 1150–1156. doi: 10.1890/0012-9658(1999)080[1150:TMAORR]2.0.CO;2
He Q., Silliman B. R. (2016). Consumer control as a common driver of coastal vegetation worldwide. Ecol. Monogr. 86, 278–294. doi: 10.1002/ecm.1221
Hillebrand H. (2009). Meta-analysis of grazer control of periphyton biomass across aquatic ecosystems. J. Phycol. 45, 798–806. doi: 10.1111/j.1529-8817.2009.00702.x
Holmes T. H., McCormick M. I. (2010). Size-selectivity of predatory reef fish on juvenile prey. Mar. Ecol. Prog. Ser. 399, 273–283. doi: 10.3354/meps08337
Huertas V., Morais R. A., Bonaldo R. M., Bellwood D. R. (2021). Parrotfish corallivory on stress-tolerant corals in the anthropocene. PloS One 16, e0250725. doi: 10.1371/journal.pone.0250725
Kimbro D. L., Cheng B. S., Grosholz E. D. (2013). Biotic resistance in marine environments. Ecol. Lett. 16, 821–833. doi: 10.1111/ele.12106
Knights A. M., Firth L. B., Walters K. (2012). Interactions between multiple recruitment drivers: post-settlement predation mortality and flow-mediated recruitment. PloS One 7, e35096. doi: 10.1371/journal.pone.0035096.t005
Koricheva J., Gurevitch J., Mengersen K. (2013). Handbook of meta-analysis in ecology and evolution (Princeton, NJ: Princeton University Press).
Koval G., Rivas N., D’Alessandro M., Hesley D., Santos R., Lirman D. (2020). Fish predation hinders the success of coral restoration efforts using fragmented massive corals. PeerJ 8, e9978. doi: 10.7717/peerj.9978
Kroeker K. J., Sanford E., Rose J. M., Blanchette C. A., Chan F., Chavez F. P., et al. (2016). Interacting environmental mosaics drive geographic variation in mussel performance and predation vulnerability. Ecol. Lett. 19, 771–779. doi: 10.1111/ele.12613
Kulp R. E., Peterson B. J. (2016). Evaluating the impact of mesopredators on oyster restoration in the new York metropolitan region. J. Shellfish Res. 35, 801–807. doi: 10.2983/035.035.0408
Lefcheck J. S., Hughes B. B., Johnson A. J., Pfirrmann B. W., Rasher D. B., Smyth A. R., et al. (2019). Are coastal habitats important nurseries? A meta-analysis. Conserv. Lett. 75, e12645–e12612. doi: 10.1111/conl.12645
Leighton L. R., Tyler C. L. (2021). Emergent effects of two rocky intertidal predators on prey: Interaction of crabs and sea-stars may reduce mussel mortality. J. Exp. Mar. Biol. Ecol. 539, 151542. doi: 10.1016/j.jembe.2021.151542
Lenth R. L. (2021). Emmeans: Estimated marginal means, aka least-squares means. Availabe at: https://CRAN.R-project.org/package=emmeans.
Lowe M. R., Sehlinger T., Soniat T. M., Peyre M. K. L. (2017). Interactive effects of water temperature and salinity on growth and mortality of Eastern oysters, Crassostrea virginica: A meta-analysis using 40 years of monitoring data. J. Shellfish Res. 36, 683–697. doi: 10.2983/035.035.0408
Lüdecke D., Ben-Chachar S., Patil I., Waggoner P., Makowski D. (2021). Performance: An R package for assessment, comparison and testing of statistical models. J. Open Source Softw. 6, 3139. doi: 10.21105/joss.03139
Møller A. P., Jennions M. (2001). Testing and adjusting for publication bias. Trends Ecol. Evol. 16, 580–586. doi: 10.1016/S0169-5347(01)02235-2
Marcora P. I., Renison D., País-Bosch A. I., Cabido M. R., Tecco P. A. (2013). The effect of altitude and grazing on seedling establishment of woody species in central Argentina. For. Ecol. Manage. 291, 300–307. doi: 10.1016/j.foreco.2012.11.030
McCoy M. W., Stier A. C., Osenberg C. W. (2012). Emergent effects of multiple predators on prey survival: The importance of depletion and the functional response. Ecol. Lett. 15, 1449–1456. doi: 10.1111/ele.12005
Menge B. A., Cerny-Chipman E. B., Johnson A., Sullivan J., Gravem S., Chan F. (2016). Sea Star wasting disease in the keystone predator Pisaster ochraceus in Oregon: Insights into differential population impacts, recovery, predation rate, and temperature effects from long-term research. PloS One 11, e0153994. doi: 10.1371/journal.pone.0157302
Menge B. A., Olson A. M. (1990). Role of scale and environmental factors in regulation of community structure. Trends Ecol. Evol. 5, 52–57. doi: 10.1016/0169-5347(90)90048-1
Micheli F., Peterson C. H. (1999). Estuarine vegetated habitats as corridors for predator movements. Conserv. Biol. 13, 869–881. doi: 10.1046/j.1523-1739.1999.98233.x
Moher D., Liberati A., Tetzlaff J., Altman D. G. (2010). Preferred reporting items for systematic reviews and meta-analyses: The PRISMA statement. Ann. Internal Med. 8, 336341. doi: 10.7326/0003-4819-151-4-200908180-00135
Mroch R. M., Eggleston D. B., Puckett B. J. (2012). Spatiotemporal variation in oyster fecundity and reproductive output in a network of no-take reserves. J. Shellfish Res. 31, 1091–1101. doi: 10.2983/035.031.0420
Myers R. A., Baum J. K., Shepherd T. D., Powers S. P., Peterson C. H. (2007). Cascading effects of the loss of apex predatory sharks from a coastal ocean. Science 315, 1846–1850. doi: 10.1126/science.1138657
Newell R. I. E., Alspach G. S., Kennedy V. S., Jacobs D. (2000). Mortality of newly metamorphosed eastern oysters (Crassostrea virginica) in mesohaline Chesapeake bay. Mar. Biol. 136, 665–676. doi: 10.1007/s002270050726
O'Connor M. I., Bruno J. F. (2009). Predator richness has no effect in a diverse marine food web. J. Anim. Ecol. 78, 732–740. doi: 10.1111/j.1365-2656.2009.01533.x
O'Connor N. E., Grabowski J. H., Ladwig L. M., Bruno J. F. (2008). Simulated predator extinctions: Predator identity affects survival and recruitment of oysters. Ecology 89, 428–438. doi: 10.1890/06-2029.1
Penaluna B. E., Dunham J. B., Noakes D. L. (2016). Instream cover and shade mediate avian predation on trout in semi-natural streams. Ecol. Freshw. Fish 25, 405–411. doi: 10.1111/eff.12221
Peterson C. H., Black R. (1994). An experimentalist’s challenge: when artifacts of intervention interact with treatments. Mar. Ecol. Prog. Ser. 111, 289–297. doi: 10.3354/meps111289
Pick J. L., Nakagawa S., Noble D. W. (2019). Reproducible, flexible and high-throughput data extraction from primary literature: The metaDigitise r package. Methods Ecol. Evol. 10, 426–431. doi: 10.1111/2041-210X.13118
Pinheiro J., Bates D., DebRoy S., Sarkar D., R Core Team (2021). Nlme: linear and nonlinear mixed effects models. Availabe at: https://CRAN.R-project.org/package=nlme.
Pons J., Pausas J. G. (2007). Rodent acorn selection in a Mediterranean oak landscape. Ecol. Res. 4, 535–541. doi: 10.1007/s11284-006-0053-5
Poore A. G. B., Campbell A. H., Coleman R. A., Edgar G. J., Jormalainen V., Reynolds P. L. (2012). Global patterns in the impact of marine herbivores on benthic primary producers. Ecol. Lett. 15, 912–922. doi: 10.1111/j.1461-0248.2012.01804.x
Preisser E. L., Strong D. R. (2004). Climate affects predator control of an herbivore outbreak. Am. Nat. 163, 754–762. doi: 10.1086/383620
Quinn T. P., Kinnison M. T. (1999). Size-selective and sex-selective predation by brown bears on sockeye salmon. Oecologia 121, 273–282. doi: 10.1007/s004420050929
R Core Team (2021). R: a language and environment for statistical computing (Vienna, Austria: R Foundation for Statistical Computing).
Reynolds P. L., Stachowicz J. J., Hovel K., Boström C., Boyer K., Cusson M., et al. (2018). Latitude, temperature, and habitat complexity predict predation pressure in eelgrass beds across the northern hemisphere. Ecology 99, 29–35. doi: 10.1002/ecy.2064
Richardson M. A., Zhang Y., Connolly R. M., Gillies C. L., McDougall C. (2022). Some like it hot: The ecology, ecosystem benefits, and restoration potential of oyster reefs in tropical waters. Front. Mar. Sci. 9. doi: 10.3389/fmars.2022.873768
Rosenthal R. (1979). The file drawer problem and tolerance for null results. psychol. Bull. 86, 638–641. doi: 10.1037/0033-2909.86.3.638
Roslin T., Hardwick B., Novotny V., Petry W. K., Andrew N. R., Asmus A., et al. (2017). Higher predation risk for insect prey at low latitudes and elevations. Science 356, 742–744. doi: 10.1126/science.aaj1631
Ruesink J. L. (2007). Biotic resistance and facilitation of a non-native oyster on rocky shores. Mar. Ecol. Prog. Ser. 331, 1–9. doi: 10.3354/meps331001
Salo P., Banks P. B., Dickman C. R., Korpimäki E. (2010). Predator manipulation experiments: Impacts on populations of terrestrial vertebrate prey. Ecol. Monogr. 80, 531–546. doi: 10.1890/09-1260.1
Schemske D. W., Mittelbach G. G., Cornell H. V., Sobel J. M., Roy K. (2009). Is there a latitudinal gradient in the importance of biotic interactions? Annu. Rev. Ecol. Evol. Systematics 40, 245. doi: 10.1146/annurev.ecolsys.39.110707.173430
Schweiss V. R., Rakocinski C. F. (2020). Destabilizing effects on a classic tri-trophic oyster reef cascade. PloS One 15, e0242965. doi: 10.1371/journal.pone.0242965
Shurin J. B., Borer E. T., Seabloom E. W., Anderson K., Blanchette C. A., Broitman B., et al. (2002). A cross-ecosystem comparison of the strength of trophic cascades. Ecol. Lett. 5, 785–791. doi: 10.1046/j.1461-0248.2002.00381.x
Silliman B. R., McCoy M. W., Angelini C., Holt R. D., Griffin J. N., van de Koppel J. (2013). Consumer fronts, global change, and runaway collapse in ecosystems. Annu. Rev. Ecol. Evolution Systematics 44, 503–538. doi: 10.1146/annurev-ecolsys-110512-135753
Smith R. S., Cheng S. L., Castorani M. C. N. (in press) Meta-analysis of ecosystem services associated with oyster restoration. Conserv. Biol., e13966. Available at: https://castorani.evsc.virginia.edu/wp-content/uploads/2022/09/Smith-et-al-2022-Conservation-Biology.pdf.
Smith R. S., Lusk B., Castorani M. C. N. (2022). Restored oyster reefs match multiple functions of natural reefs within a decade. Conserv. Lett., e12883. doi: 10.1111/conl.12883
Stevenson C. F., Demes K. W., Salomon A. K. (2016). Accounting for size-specific predation improves our ability to predict the strength of a trophic cascade. Ecol. Evol. 6, 1041–1053. doi: 10.1002/ece3.1870
Theuerkauf S. J., Puckett B. J., Eggleston D. B. (2021). Metapopulation dynamics of oysters: Sources, sinks, and implications for conservation and restoration. Ecosphere 12, e03573. doi: 10.1002/ecs2.3573
Thrush S. F., Schneider D. C., Legendre P., Whitlach R. B., Dayton P. K., Hewitt J. E., et al. (1997). Scaling-up from experiments to complex ecological systems: where to next? J. Exp. Mar. Biol. Ecol. 261, 243–254. doi: 10.1016/S0022-0981(97)00099-3
Vance-Chalcraft H. D., Rosenheim J. A., Vonesh J. R., Osenberg C. W., Sih A. (2007). The influence of intraguild predation on prey suppression and prey release: a meta-analysis. Ecology 88, 2689–2696. doi: 10.1890/06-1869
Wainwright P. C. (1987). Biomechanical limits to ecological performance: mollusk-crushing by the Caribbean hogfish, Lachnolaimus maximus (Labridae). J. Zool. 213, 283–297. doi: 10.1111/j.1469-7998.1987.tb03704.x
Wesner J. S. (2016). Contrasting effects of fish predation on benthic versus emerging prey: a meta-analysis. Oecologia 180, 1205–1211. doi: 10.1007/s00442-015-3539-4
Zu Ermgassen P. S. E., Grabowski J. H., Gair J. R., Powers S. P. (2016). Quantifying fish and mobile invertebrate production from a threatened nursery habitat. J. Appl. Ecol. 53, 596–606. doi: 10.1111/1365-2664.12576
Keywords: experimental design, foundation species, meta-analysis, oyster reefs, population dynamics, predation
Citation: Tedford KN and Castorani MCN (2022) Meta-analysis reveals controls on oyster predation. Front. Mar. Sci. 9:1055240. doi: 10.3389/fmars.2022.1055240
Received: 27 September 2022; Accepted: 30 November 2022;
Published: 21 December 2022.
Edited by:
Mark Botton, Fordham University, United StatesReviewed by:
Cristian J. Monaco, Institut Français de Recherche pour l’Exploitation de la Mer (IFREMER), FranceLaura K. Reynolds, University of Florida, United States
Copyright © 2022 Tedford and Castorani. This is an open-access article distributed under the terms of the Creative Commons Attribution License (CC BY). The use, distribution or reproduction in other forums is permitted, provided the original author(s) and the copyright owner(s) are credited and that the original publication in this journal is cited, in accordance with accepted academic practice. No use, distribution or reproduction is permitted which does not comply with these terms.
*Correspondence: Kinsey N. Tedford, ktedford@virginia.edu