Limited conservation efficacy of large-scale marine protected areas for Pacific skipjack and bigeye tunas
 John Hampton
 Patrick Lehodey
 Inna Senina1
  Simon Nicol
- 1Oceanic Fisheries Programme, Pacific Community, Noumea, New Caledonia
- 2Mercator Ocean International, Toulouse, France
- 3Centre for Conservation Biology and Genomics and the Institute for Applied Ecology, University of Canberra, Bruce, ACT, Australia
- 4Ministry of Fisheries and Marine Resources Development, Bairiki, Kiribati
Large-scale, no-take marine protected areas (MPAs) have been established in several locations in the Pacific and expansion of such areas to reach 30% of the ocean area is actively promoted in some quarters. Justification for the establishment of large oceanic MPAs often includes the conservation benefits that they would bring for tuna stocks, which are the subject of important commercial fisheries in the Pacific. The aim of this paper was to evaluate the conservation efficacy of an existing MPA, the Phoenix Islands Protected Area (PIPA) and a series of large hypothetical MPAs each constituting approximately 33% of the western and central Pacific Ocean, for two important and contrasting tuna species, skipjack and bigeye tuna. The evaluation was conducted by comparing control and counterfactual simulations in which the estimated population and fishery dynamics of the species were modelled using a high-resolution modelling framework known as SEAPODYM (Spatial Ecosystem And Population DYnamics Model). We found that stock-wide conservation benefits of the PIPA for these species, assuming that total fishing effort is maintained, to be weak to non-existent, and only modest increases in spawning biomass of both species occur within and in the near vicinity of the PIPA itself. For the larger 33% hypothetical MPAs, changes in stock-wide spawning biomass were estimated to be -0.1% to +5.8% for skipjack tuna and +4.8% to +12.0% for bigeye tuna. Conservation efficacy of MPAs for species such as tropical tunas is limited by their wide larval dispersal and high mobility of later life stages, which spatially dissipate the protective effects of MPAs. Also, the displacement of fishing effort from MPAs to areas remaining open can have negative consequences for stocks and fisheries performance in those areas. We conclude that large oceanic MPAs are not likely to be effective frontline management tools for tropical tunas and other species having similar life history characteristics.
1 Introduction
Governments have declared several large-scale, oceanic, marine protected areas (MPAs) in the Pacific Ocean in recent years (Supplementary Table 1), while others are currently under consideration (Govan, 2020). Among the established MPAs, the Phoenix Islands Protected Area (PIPA), the Palau National Marine Sanctuary (PNMS) and the Pacific Remote Islands Monument (PRIM), occur in prime tropical tuna fishing grounds and are designated as no-take reserves in which all forms of extractive fishing are prohibited.
The proponents of large-scale, oceanic MPAs, particularly those in the tropical Pacific, often cite the benefits to tuna conservation, inter alia, as a major rationale for their establishment. For example, in respect of the PIPA it has been claimed that “the reserve is a major spawning ground for tuna, so its closure will have a major contribution to the conservation and rejuvenation of fish stocks and to global food security”, and “closing PIPA would be the single most effective act of marine conservation in history and a big step in preventing the world’s last major population of skipjack tuna from becoming as depleted as those of the Atlantic and Indian Oceans” (Oceana, 2016).
MPAs such as PIPA and PNMS are areas in which tropical tuna species, skipjack (Katsuwonus pelamis), yellowfin (Thunnus albacares) and bigeye (T. obesus) tuna, frequently spawn (Hernández et al., 2019), and hence it has been often assumed that MPAs will offer protection to spawning populations. Other potential benefits, such as spill-over of enhanced populations within the MPA into adjacent fished areas are also frequently cited (e.g., PICRC and COS, 2019; Medoff et al., 2022).
Despite claims that large, oceanic MPAs will benefit tuna stocks, their value, in common with spatial management approaches more broadly (Hilborn, 2018; Hilborn et al., 2021), to tuna conservation and to adjacent fisheries have not been quantitatively evaluated using realistic assumptions regarding tuna population dynamics and spatial connectivity. Tunas spawn widely throughout the tropical Pacific, their larvae are redistributed by ocean currents, and they develop habitat-driven movement capability as they grow beyond the first few months of life (Lehodey et al., 2008). The species biology, particularly the dispersal and movement characteristics, and the distribution of the population and fisheries in relation to the size and location of the MPAs will influence MPA efficacy as a fishery management and conservation tool (Gaines et al., 2010; Fulton et al., 2015; Ovando et al., 2021). Therefore, these characteristics need to be considered to understand the likely contribution of MPAs to tuna conservation and management.
The aim of this paper was to evaluate the conservation efficacy for two important and contrasting tuna species, skipjack and bigeye tuna, of an existing MPA, the PIPA, and a series of large hypothetical MPAs each constituting approximately 33% of the western and central Pacific Ocean (WCPO, Pacific Ocean west of 150°W, Figure 1). The evaluation was designed specifically to take account of the spatial population and fishery dynamics of these species as well as the size and location of the MPAs.
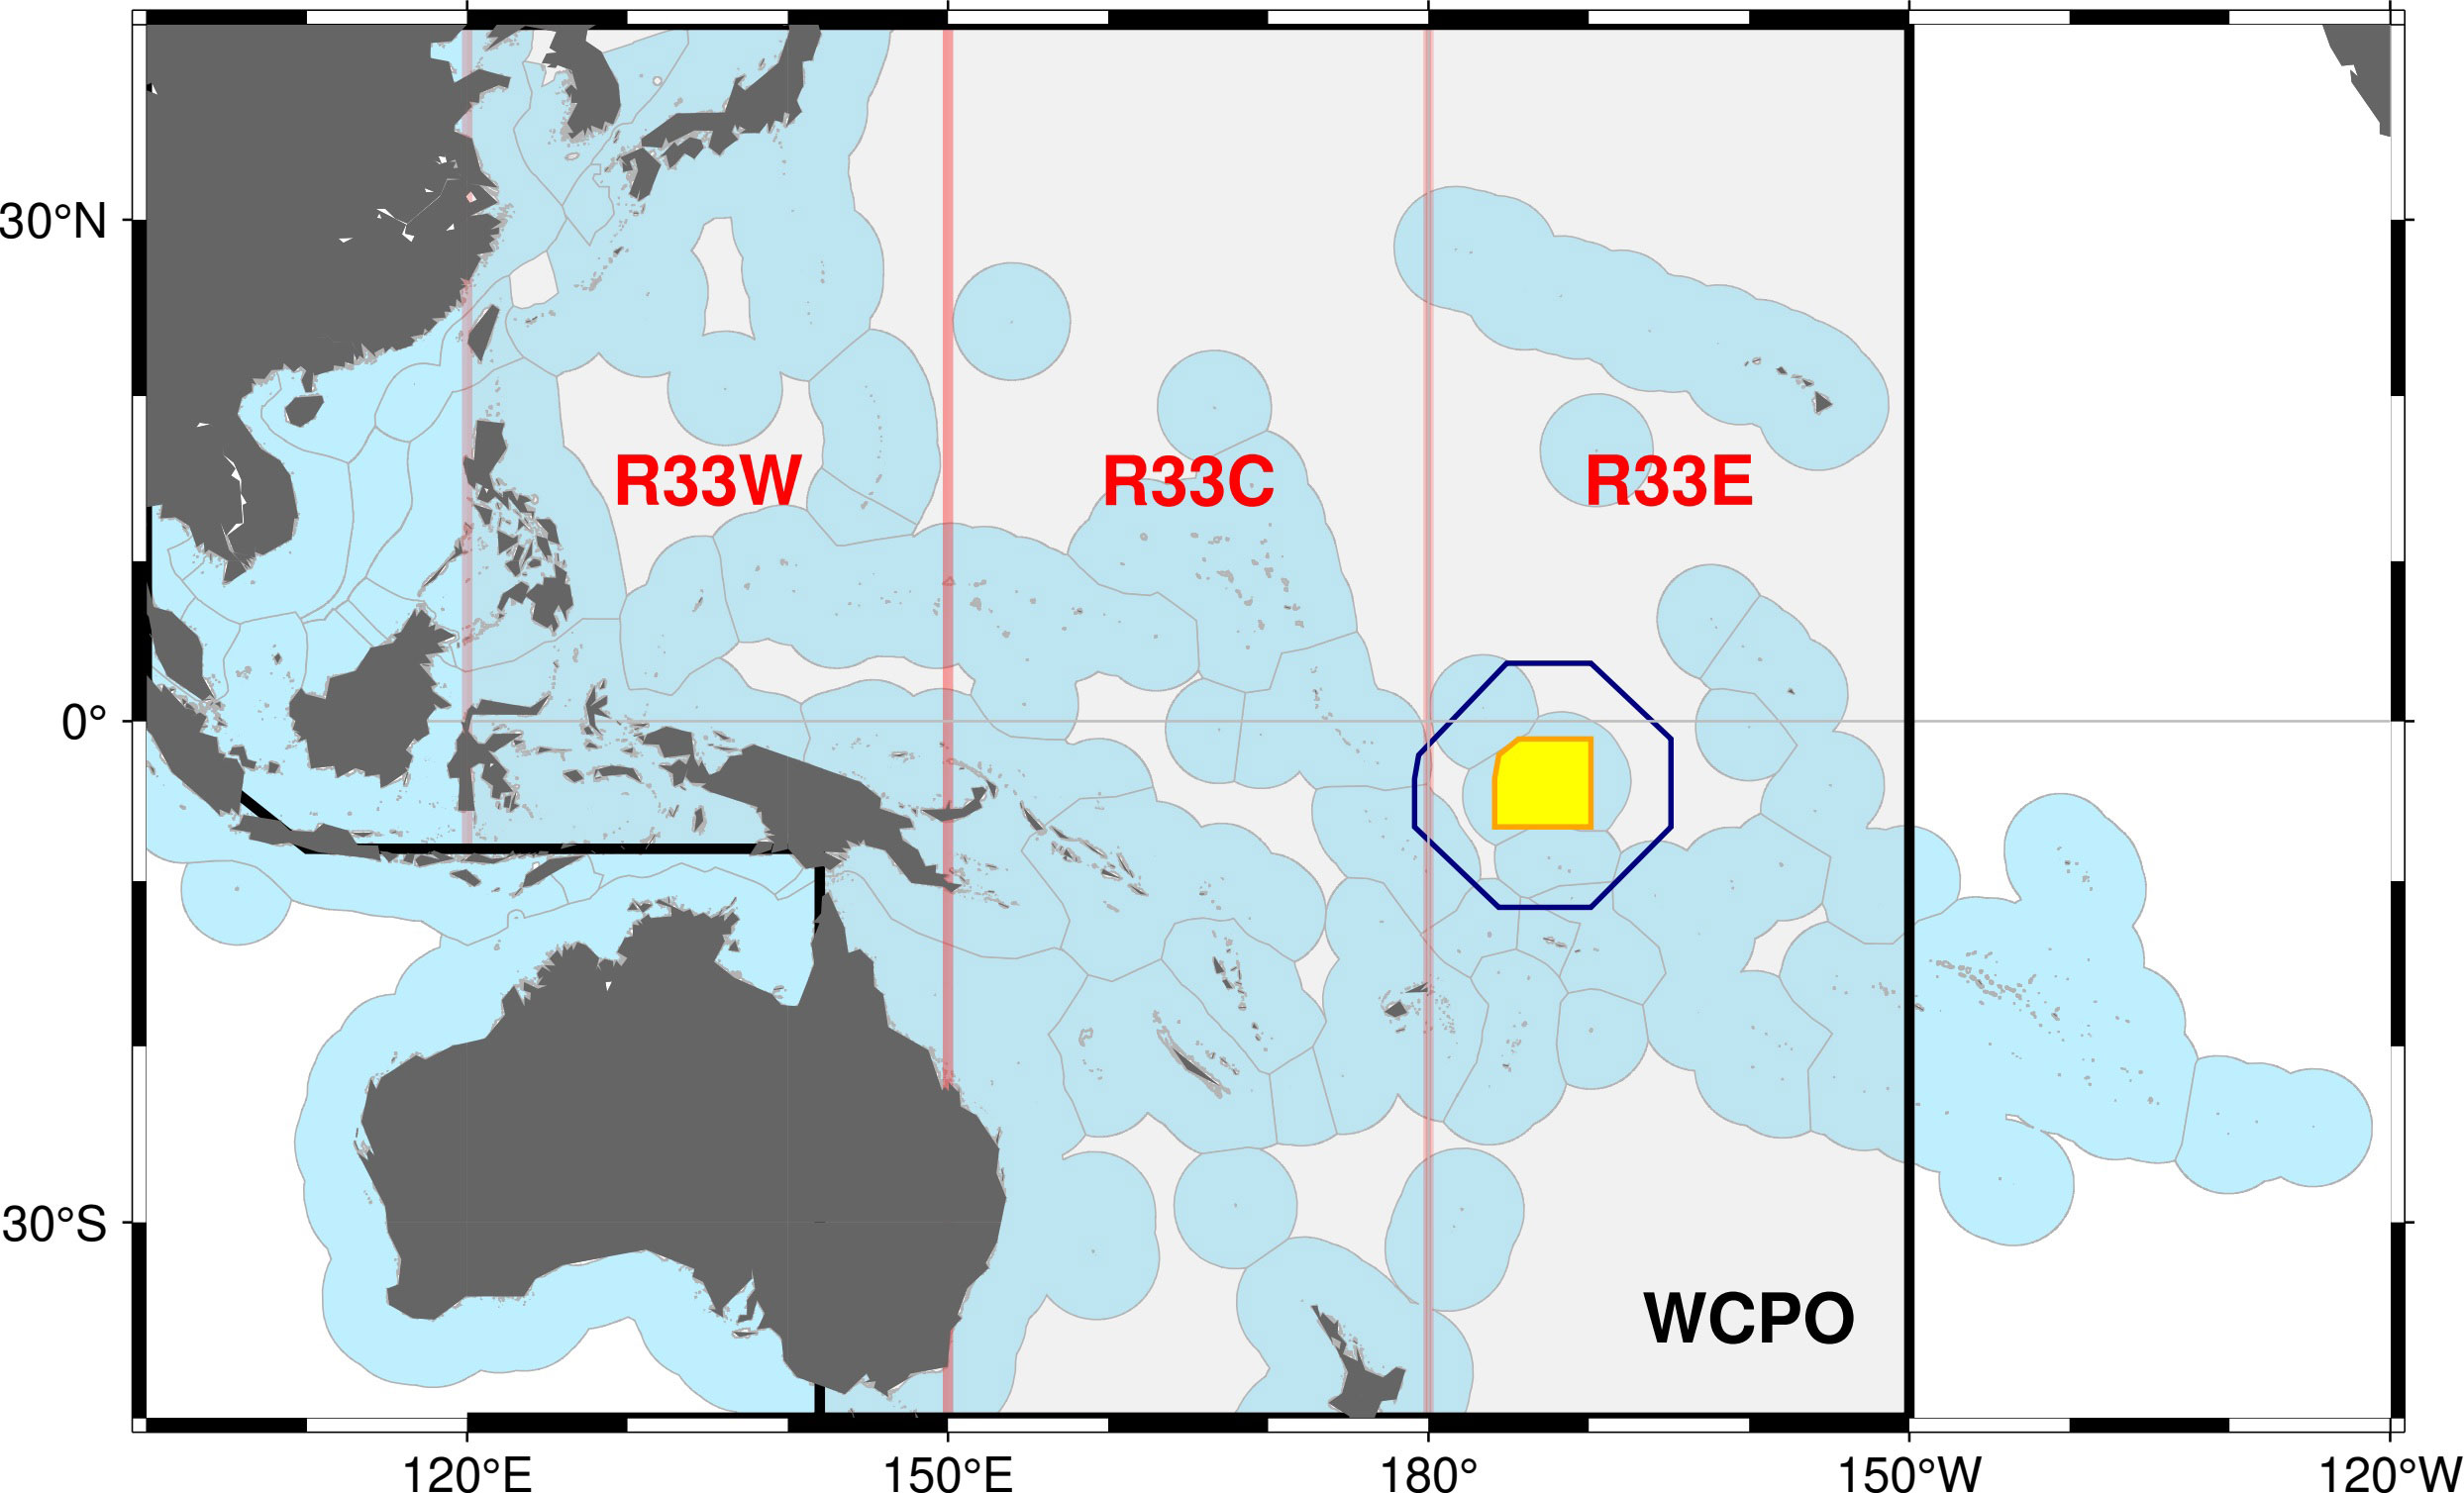
Figure 1 The western and central Pacific Ocean showing the Exclusive Economic Zones of coastal States (light blue), PIPA (yellow), the five-degree spill-over area (blue line) and the western (R33W), central (R33C) and eastern (R33E) zones of the western and central Pacific Ocean (WCPO, delineated by the thick black line) evaluated as hypothetical large oceanic Marine Protected Areas.
We chose the PIPA as the main case study for this paper because it is located within the core habitat of tropical tuna in the WCPO (Figure 1) and, prior to its declaration, had annual catches of skipjack tuna of up to 110,000 t (6% of the total WCPO catch) and of bigeye tuna of up to 5,000 t (3% of the WCPO catch; Figure 2). However, the PIPA comprises only 0.6% of the area of the WCPO between the latitudes 40°N and 40°S (the approximate limits of skipjack and bigeye tuna distribution). As a result, the PIPA might not be expected, a priori, to be highly impactful on these tuna stocks over their entire range. Therefore, we also investigated the efficacy of three much larger, hypothetical closures, each representing approximately 33% of the WCPO (Figure 1). Closures of this magnitude are currently being advocated globally (e.g., Roberts et al., 2019) to protect biodiversity and the abundance of fished populations.
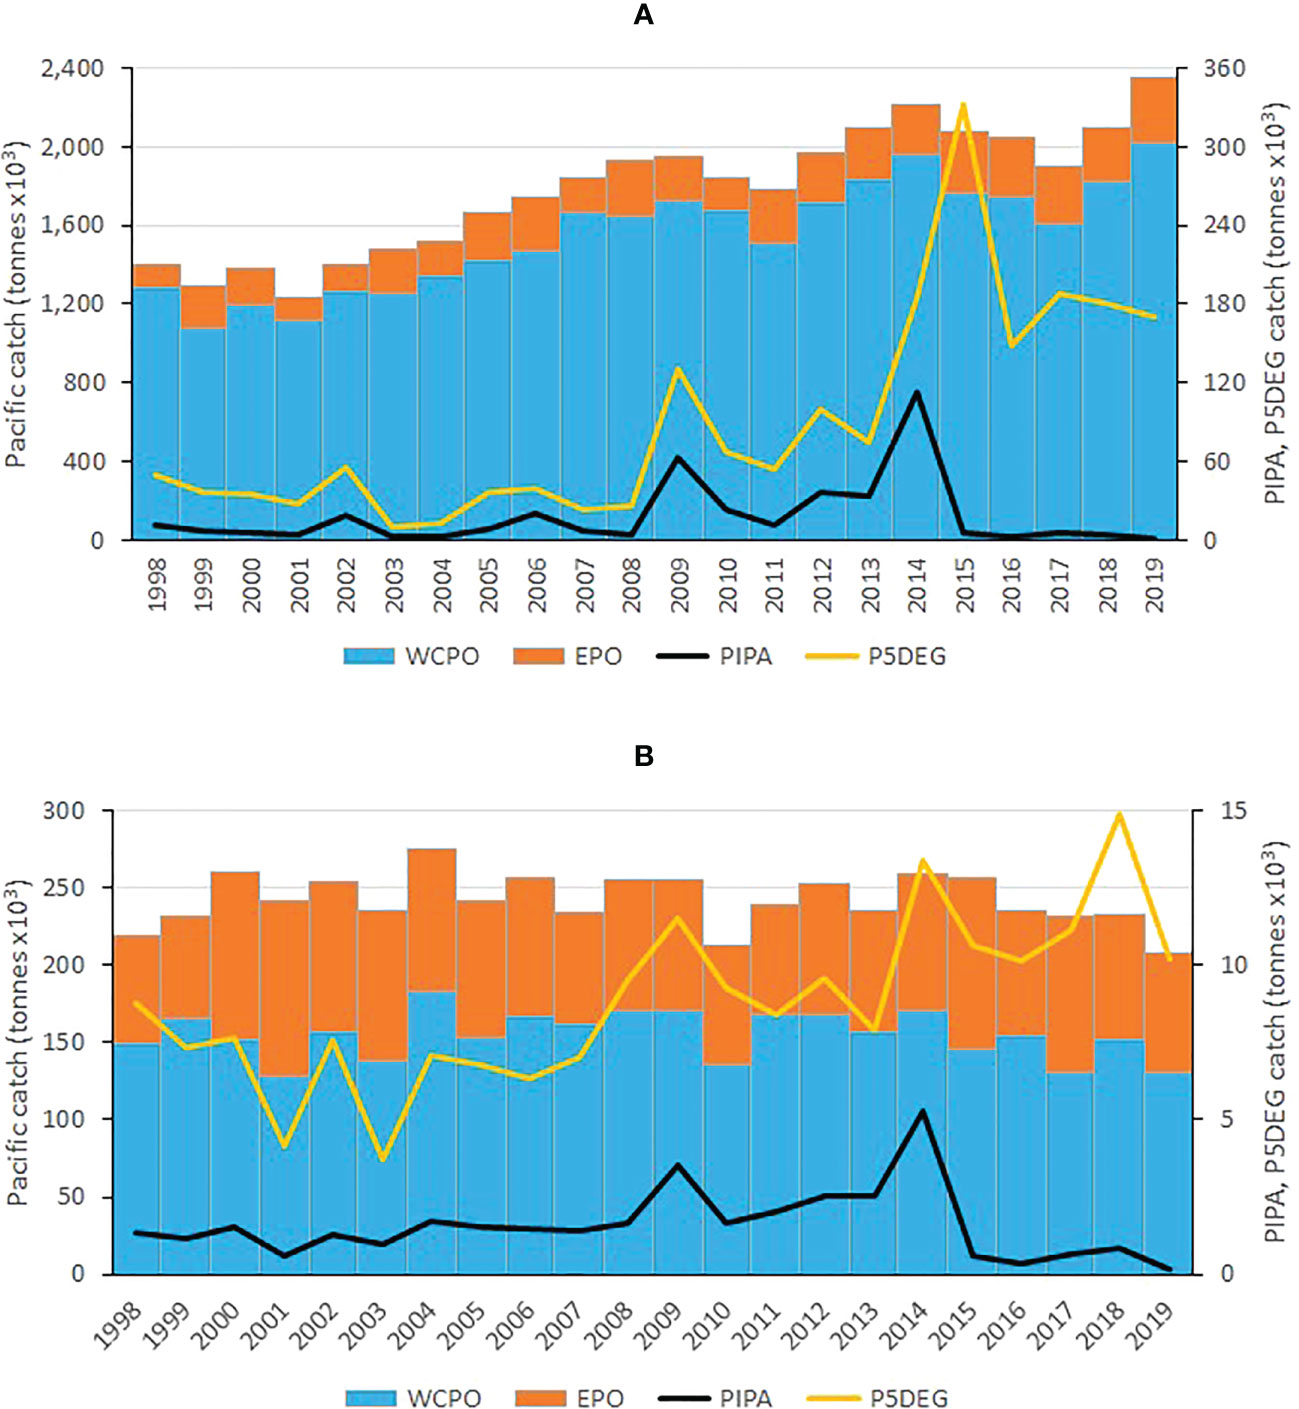
Figure 2 Skipjack (A) and bigeye (B) tuna annual catches in the western and central Pacific Ocean (WCPO, the Pacific Ocean west of 150°W), eastern Pacific Ocean (EPO, the Pacific Ocean east of 150°W), the Phoenix Islands Protected Area (PIPA) and the five-degree spill-over area surrounding the PIPA (P5DEG). See Figure 1 for the area definitions.
Skipjack tuna constitutes two-thirds of the total WCPO tuna catch (3 million t in 2019; Hare et al., 2021), about 40% of the global tuna catch (WCPFC, 2020), is the key target species of the large tropical purse seine and a smaller pole-and-line fishery and is critical for the economic and social well-being of Pacific Islanders (Gillett, 2016). Skipjack is a small (maximum size ~90 cm fork length), fast-growing and relatively short-lived (~4 yr.) tuna species thought to be highly resilient to fishing and capable of sustaining current annual catches in the WCPO approaching 2 million t (Vincent et al., 2019). By contrast, bigeye tuna is larger (maximum size ~180 cm fork length in the WCPO), longer lived (>10 yr.), supports considerably smaller annual catches in the WCPO of <200,000 t and is more heavily exploited than skipjack tuna (Ducharme-Barth et al., 2020; Hare et al., 2021). Bigeye tuna is the main target species of the tropical longline fishery, which targets larger fish sizes for the sashimi market. Also, small juvenile bigeye tuna are caught in the tropical purse seine and other surface fisheries targeting skipjack tuna. The importance and contrasting population dynamics and exploitation of these two species in the WCPO motivated their selection as case studies to evaluate the contribution of spatial closures such as PIPA, and the much larger hypothetical 33% closures, to the conservation of tuna and similar species in the Pacific region.
2 Materials and methods
2.1 Modelling approach
Evaluations of the efficacy of a management intervention are often undertaken using statistical methods to detect changes in populations before and after the intervention (e.g., Medoff et al., 2022). However, this approach can have difficulty in separating the effects of the intervention, particularly if implemented recently, from contemporaneous changes in the fisheries or the environment. Additionally, “before and after” analyses clearly are unsuitable for evaluating interventions that may be under consideration but have not yet been implemented. In these circumstances, modelling approaches (reviewed in detail by Fulton et al., 2015) may be used to evaluate the conservation and fisheries implications of management interventions, including MPAs.
To investigate the conservation efficacy of MPAs for tropical tunas, we posit that the modelling framework used needs to meet the following criteria: a) the biological characteristics, including movement, of the species being investigated need to be adequately represented by the model; b) the spatial scope of the model should cover the geographical range of the stocks and the fisheries that impact them; c) the spatial resolution of the model needs to be suitable to represent the geography of the MPA in relation to the spatial dynamics of the stocks and fisheries; and d) the model should be fitted to data and be able to realistically characterize both fisheries and environmental impacts on the stocks.
SEAPODYM (Spatial Ecosystem And POpulation DYnamics Model) is a high-resolution modeling approach for simulating and estimating fish population distribution, abundance, mortality and movement in relation to the physical, biogeochemical and biological environment (Bertignac et al., 1998; Lehodey et al., 2008; Senina et al., 2008; Senina et al., 2020). It incorporates physical, biogeochemical and biological environmental forcing, which allows the impact of El Niño Southern Oscillation (ENSO) variability on the subject species to be incorporated into the modeling. SEAPODYM is parameterized by fitting to fishery catch, size composition, and, if available, tagging data, using a maximum likelihood approach (Senina et al., 2020). These characteristics make SEAPODYM a suitable modeling platform to investigate the conservation benefits and fishery impacts of MPAs on highly mobile tuna stocks.
SEAPODYM for skipjack tuna in the Pacific Ocean is described in detail in Senina et al. (2020). Briefly, the estimation model is resolved in four dimensions – two-dimensional space (2° of latitude and longitude and three vertical layers), time (monthly, over the period 1979 – 2010) and skipjack tuna age, aggregated to four life stages (larvae, small juveniles, autonomous juveniles and adults). A set of physical, biogeochemical and biological environmental variables was used to describe tuna habitat and define conditions for spawning, feeding, survival and movement. Model parameters, including the fishery-related parameters (age selectivity and catchability) were estimated using a maximum likelihood estimation (MLE) approach by fitting to high-resolution catch, length composition and conventional tagging data. The skipjack fisheries data were classified by 15 separate fisheries, defined by operational area, fishing nation and gear type (purse seine, pole and line, longline and other) or fishing method (Supplementary Table 2).
A similar model development was followed for bigeye tuna (Senina et al., 2021). With the recent availability of updated environmental forcing data sets, it was possible to conduct model optimization and validation for bigeye tuna over the period 1998-2019, the same period used for the simulation study (see below). The fisheries data were classified by 20 separate fisheries (Supplementary Table 3).
To investigate spatial management issues and scenarios, we downscaled the optimized SEAPODYM models, adapting them for a higher spatial resolution, 0.25°, to allow representation of smaller spatial scales and to provide more realistic prediction of spatial processes in simulated scenarios. We maintained the monthly temporal resolution in all simulations. The technical details involved in converting from coarse to high spatial resolution are provided in Supplementary Material section 3.
2.2 Control and counterfactual simulation design
The most common approach for assessing the efficacy of an existing management intervention, such as a MPA, is to develop a model of the system that includes the intervention as the control, and to compare that to a counterfactual model that excludes the intervention (Fulton et al., 2015). However, that approach is not conducive to evaluating prospective management interventions (such as the hypothetical 33% MPAs considered here), or those, such as the PIPA, that have been only recently implemented. In such cases, the control model is more appropriately defined as the status quo (i.e., without any implementation of prospective interventions such as the 33% MPAs, but including any recent interventions such as the PIPA) and the counterfactual or “treatment” model as the system that includes the management intervention in a retrospective fashion throughout the duration of the simulation period (e.g., Sibert et al., 2012). We have adopted this latter approach. Our control simulations for skipjack and bigeye tuna, referred to as Fref, were conducted using the downscaled SEAPODYM formulation for the period 1998 – 2019, monitoring skipjack and bigeye tuna spawning biomass (SB) as the key conservation metric, as per stock assessments conducted for the Western and Central Pacific Fisheries Commission (WCPFC) (Vincent et al., 2019; Ducharme-Barth et al., 2020). This control therefore includes the implementation of the PIPA closure from 1 January 2015 (McDermott et al., 2018).
The first counterfactual conducted was a no-fishing simulation, denoted F0, in which all fishing effort and catches were set to zero. This provides an estimate of what the populations would have been in the absence of fishing, allowing the overall impact of fishing on skipjack and bigeye tuna SB at each time step to be estimated by the formula:
Counterfactual (or “treatment”) simulations were then run to estimate the effects of the PIPA and hypothetical 33% closures. These simulations assumed that the management intervention was implemented for the entire 1998 – 2019 model period. In the case of the PIPA, this approach allowed for a longer period (17 years) to differentiate from the control, covering several El Niño and La Niña episodes, compared to the alternative approach of modelling the removal of the PIPA in 2015-2019 (5 years) as the counterfactual and comparing that to the control. In all simulations, we redistributed rather than removed the fishing effort from areas simulated to be closed. We chose this approach because we wanted to estimate the impacts of the spatial closures alone rather than impacts resulting from a change in total fishing activity.
Two scenarios for redistributing fishing effort that had occurred in the PIPA area prior to 2015 were investigated. In the first (P-All), the pre-2015 PIPA fishing activity was reallocated proportionately to the same fleets and areas outside of the PIPA, thus maintaining the overall levels of fishing. In the second (P-5deg), the pre-2015 PIPA fishing activity was redistributed proportionately to the same fleets within 5 degrees of the PIPA boundary (Figure 1), computed using Manhattan distance (Black, 2019), again maintaining the overall levels of fishing. These scenarios represent realistic alternative effort redistribution hypotheses following the implementation of a MPA. Results were compiled at three spatial scales – the overall stock area, assumed to be the area of the WCPO for management purposes, the PIPA itself and the 5-degree area peripheral to the PIPA into which spill-over could potentially occur (Figure 1). The difference in SB between the control (Fref) and counterfactual simulations (computed similarly to eq. 1) in these areas is then a direct measure of the effect of the PIPA closure on SB.
Three counterfactual simulations were conducted for the closure of approximately 33% of the WCPO within longitudinal bands of 120°E-150°E (R33W), 150°E-180°E (R33C) and 180°E-150°W (R33E) (Figure 1). Catch and fishing effort that occurred within the area considered to be closed were redistributed proportionately to the same fleets in the remaining two areas. For each closure, SB was recorded in each of the 3 regions and for the WCPO area (Figure 1).
3 Results
3.1 Overall impacts of fishing
WCPO skipjack tuna SB in both the Fref and F0 simulations rose in the late 1990s, declined to 2016 and then increased in the later years of the simulations (Figure 3A). The difference between the Fref and F0 levels indicates an average impact of fishing on skipjack tuna SB in the WCPO of -18%, increasing from around -12% in 1998 to -21% in 2019. This modest impact of fishing is reflected in the average spatial distributions of larvae and SB for the Fref and F0 simulations (Figure 4). In the PIPA (Figure 3B) and P-5deg (Figure 3C) areas, skipjack tuna SB fell from a relatively high level in the late 1990s and was stable through the remainder of the time series apart from a sharp increase peaking in early 2016. The impact of fishing on skipjack tuna SB in the PIPA averaged -10% for 1998-2019, increasing from -7% in 1998 to -22% in 2014, the last year in which PIPA was open to commercial fishing. During 2015-2019, when the PIPA was closed, the impact of fishing averaged -19%. This impact is a combination of pre-PIPA-closure fishing of age classes still in the PIPA and because, even though the PIPA itself is closed, the stock within the PIPA is still impacted by fishing in other parts of the stock distribution because of skipjack tuna movement. In the PIPA P-5deg area, impacts are like those in the PIPA, averaging -11% for 1998-2019, increasing from -9% in 1998 to -20% in 2019. During the PIPA closure, the impact of fishing in the P-5deg area averaged -20%.
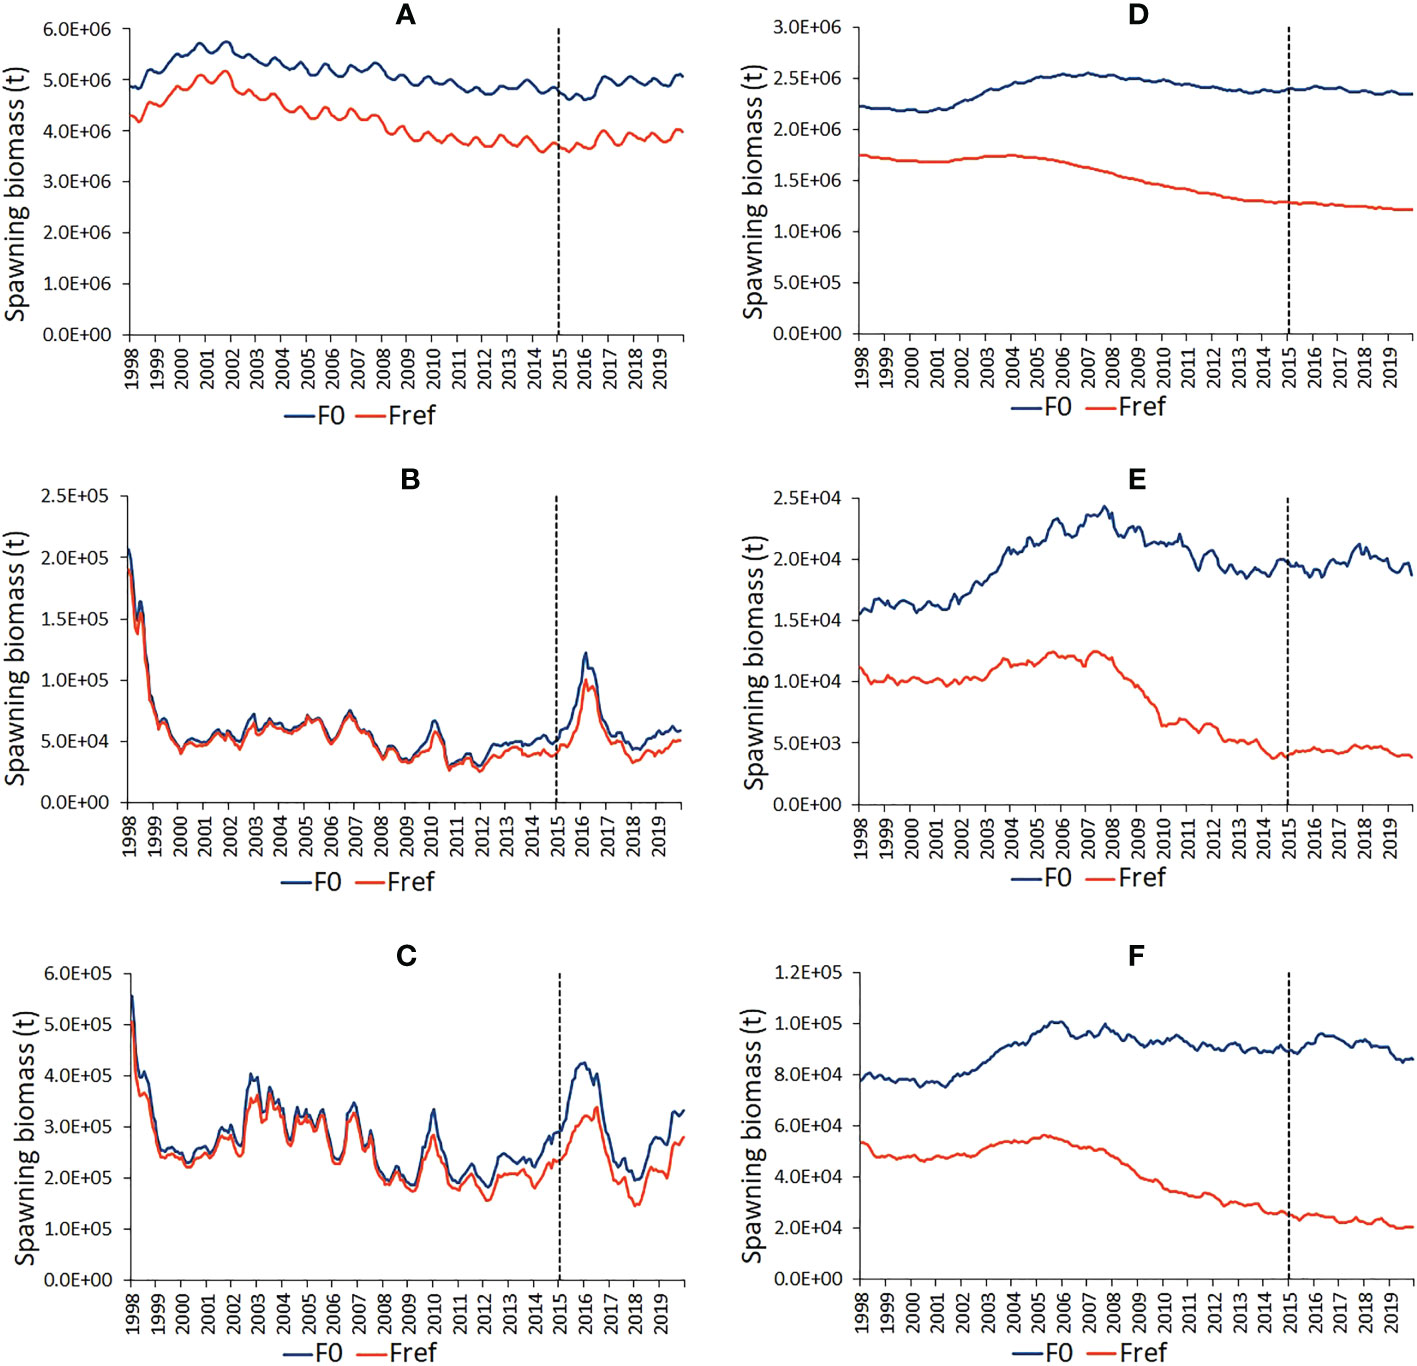
Figure 3 Time series of estimated skipjack (A-C) and bigeye (D-F) tuna spawning biomass under the observed fishing activity (Fref) and in the absence of fishing (F0) in the western and central Pacific Ocean (A, D), in the PIPA (B, E) and in the PIPA five-degree spill-over area (C, F). The vertical dashed lines indicate the implementation of the PIPA closure.
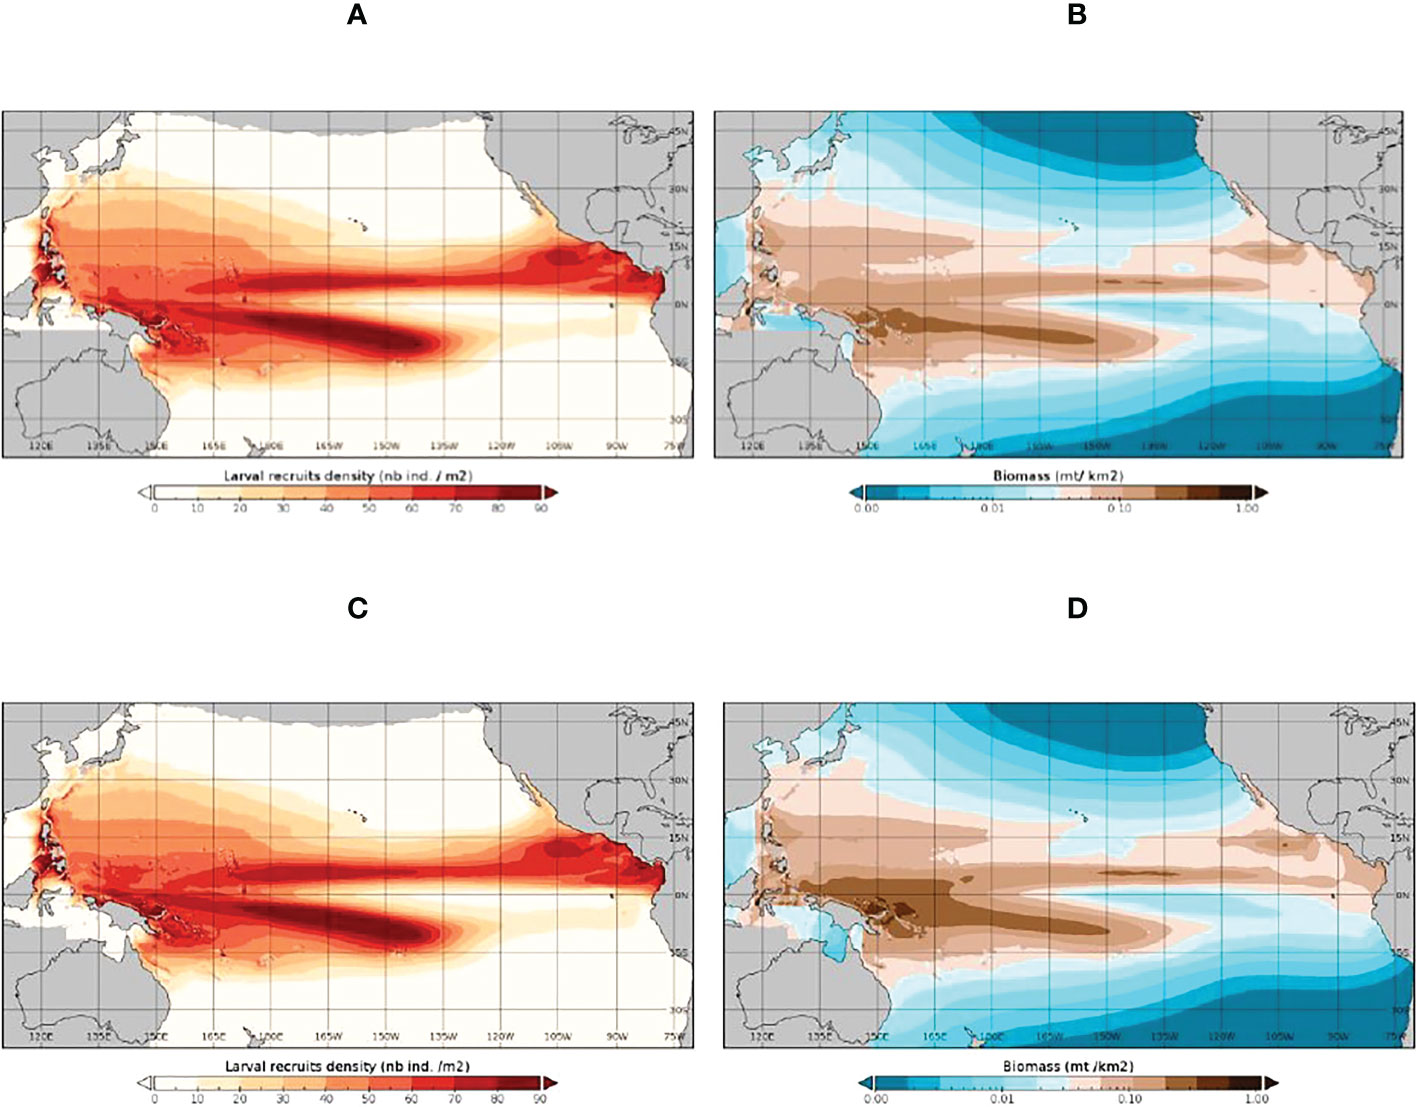
Figure 4 The SEAPODYM-simulated 1998-2019 average distribution of skipjack tuna larvae (A, C) and spawning biomass (B, D) under the observed (Fref) level of fishing (A, B) and under unexploited (F0) conditions (C, D).
Bigeye tuna shows substantially higher SB fishing impacts than skipjack tuna in the WCPO (-48% in 2019, Figure 3D), and even stronger impacts in the PIPA (-79% in 2019, Figure 3E) and P-5deg areas (-77% in 2019, Figure 3F), which are located close to productive longline fishing grounds in the central equatorial Pacific (Figure 1, Supplementary Figure 1). There is little difference in the Fref and F0 average spatial distributions of bigeye tuna larvae; however unlike skipjack tuna, there is an obvious difference in the Fref and F0 distributions of bigeye tuna SB reflecting the stronger fishing impacts (Figure 5). Bigeye tuna SB did not show reduced fishing impacts following the 2015 implementation of the PIPA within the PIPA itself or in the surrounding P-5deg area – fishing impacts, for the reasons given for skipjack tuna, remained as high if not higher than those estimated in the years leading up to the PIPA closure.
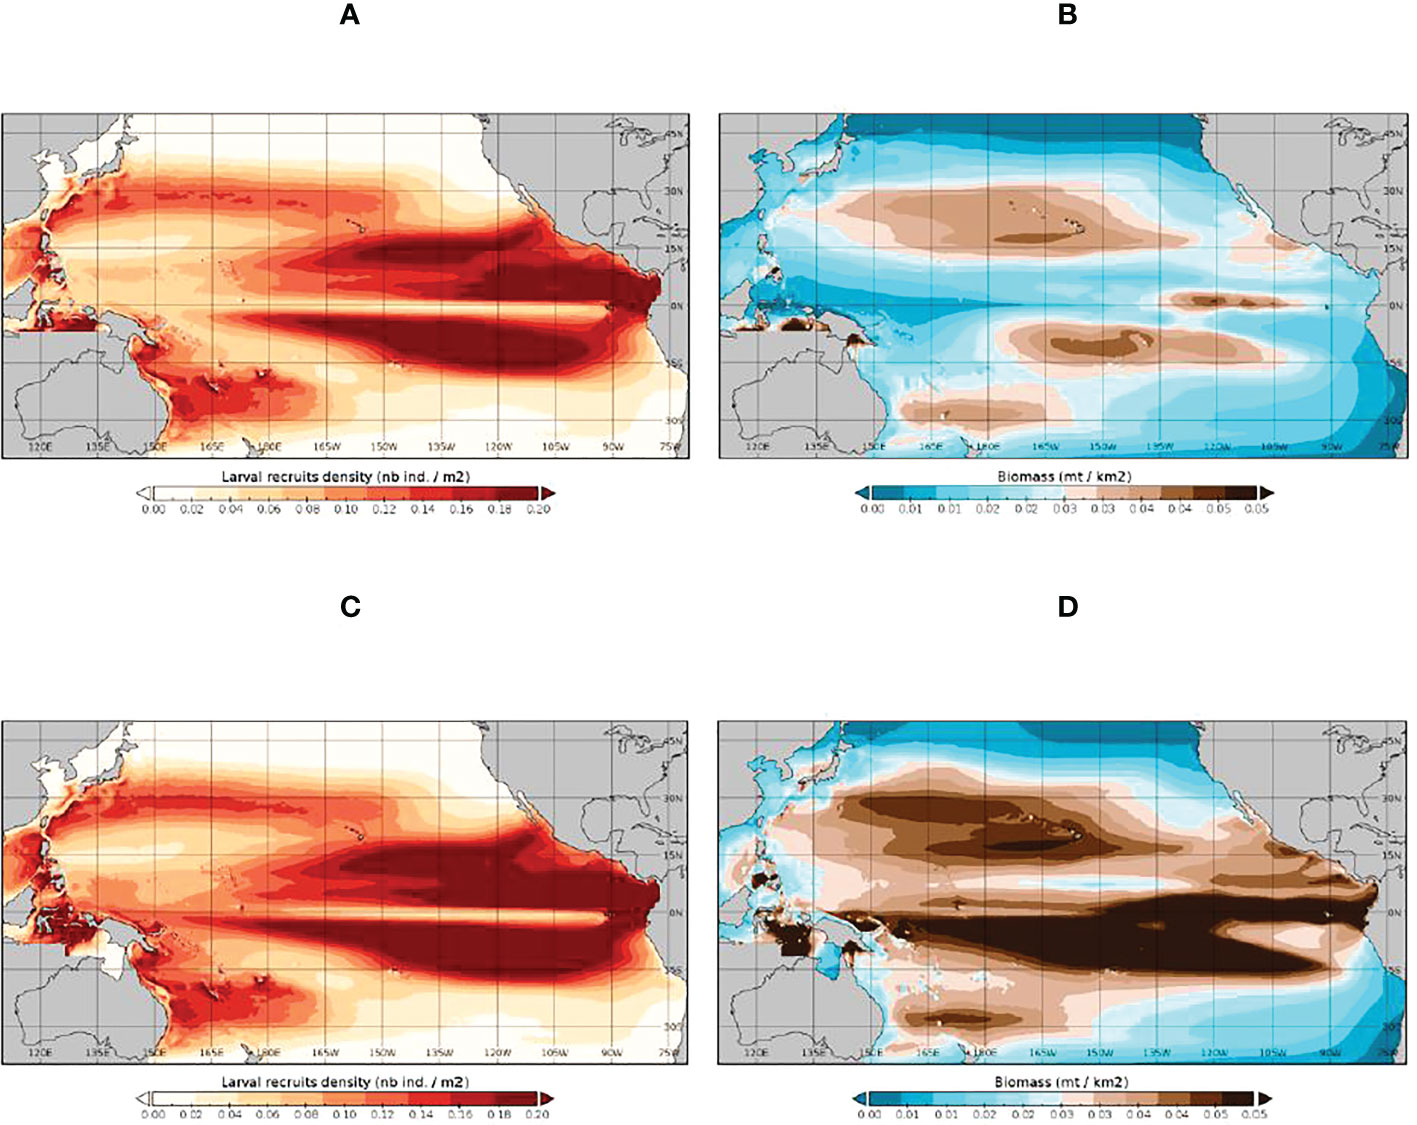
Figure 5 The SEAPODYM-simulated 1998-2019 average distribution of bigeye tuna larvae (A, C) and spawning biomass (B, D) under the observed (Fref) level of fishing (A, B) and under unexploited (F0) conditions (C, D).
3.2 Conservation benefits of PIPA closure
3.2.1 Skipjack tuna
The 1998-2019 changes in skipjack tuna SB for the counterfactual simulations in relation to Fref are summarised on average in Table 1 and as time series changes in Figures 6A-C. The changes are very small, e.g., 0.0% (range of monthly estimates -0.2-0.2%) for the WCPO, +2.6% (0.04-18.7) in the PIPA and +1.0% (0.1-4.6) for the P-5deg region for the P-All scenario (Table 1). Larger benefits are seen for some individual months, as indicated by the ranges in Table 1, particularly for the smaller PIPA and P-5deg areas. Similar results were obtained for the alternative effort redistribution scenario P-5deg. In the P-5deg spill-over area, the benefits of the PIPA closure are slightly weaker than in the PIPA itself, but greater than in the WCPO overall, indicating a weak spillover effect. These results indicate negligible conservation benefits of the PIPA closure for skipjack tuna at any of the spatial scales examined.
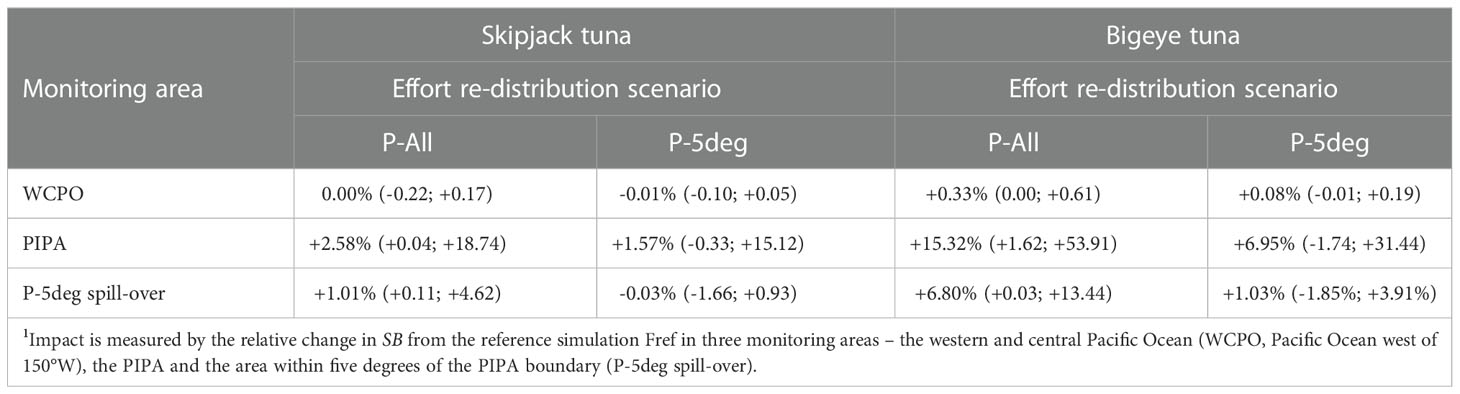
Table 1 Average impact1 (monthly range in parentheses) on skipjack and bigeye tuna spawning biomass (SB) of hypothetical PIPA closures during 1998-2019 for two catch/effort redistribution scenarios for 1998-2014 – proportionate redistribution to the same fleets operating in non-PIPA area (P-All) and reallocation to the area within five degrees of the PIPA boundary (P-5deg).
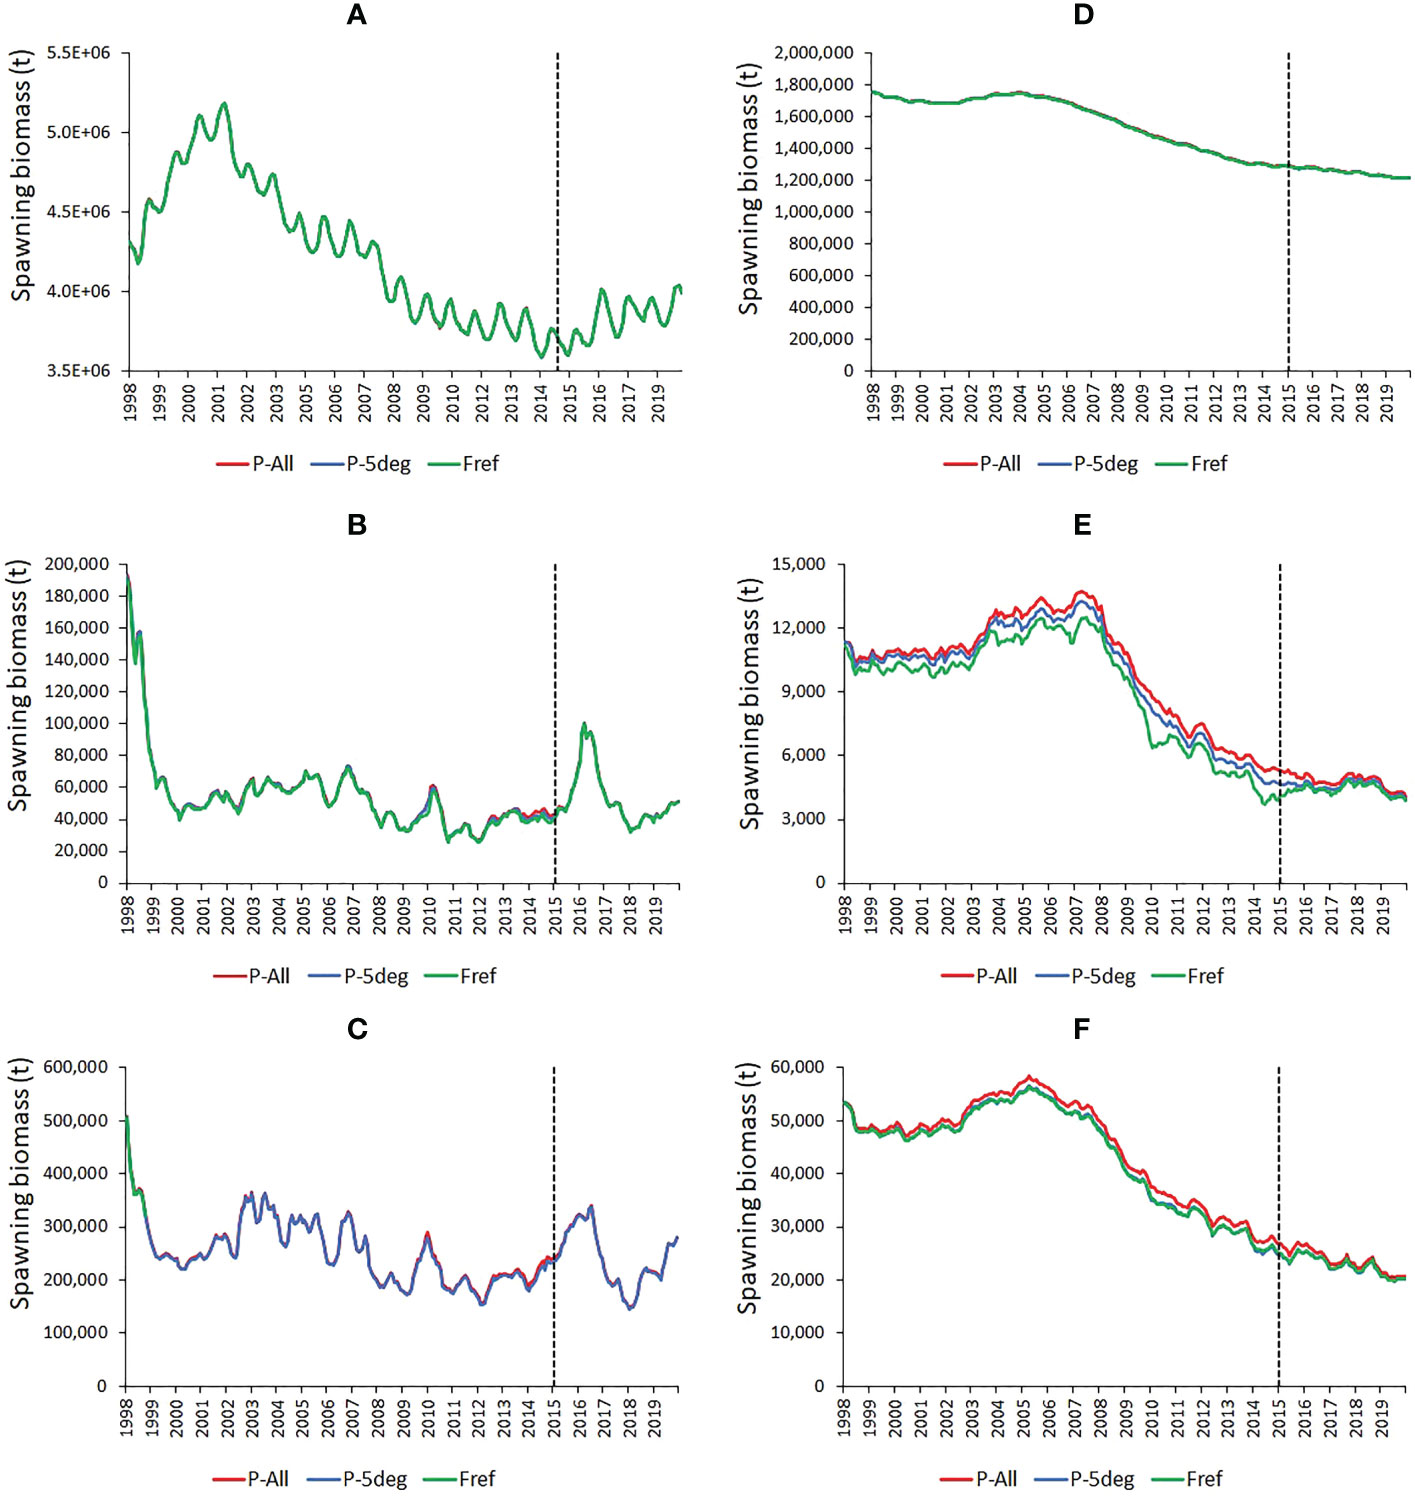
Figure 6 Time series of estimated change in skipjack (A-C) and bigeye (D-F) tuna spawning biomass (SB) for the observed fishing activity (Fref) and for retrospective PIPA closures under two catch/effort redistribution assumptions (P-All and P-5deg) in the western and central Pacific Ocean (A, D), in the PIPA (B, E) and in the PIPA five-degree spill-over area (C, F). The vertical dashed lines indicate the implementation of the actual PIPA closure.
3.2.2 Bigeye tuna
The estimated conservation benefits of the retrospective PIPA closure on bigeye tuna SB are greater than those estimated for skipjack tuna; +0.3% (0.0-0.6) in the WCPO, +15.3% (1.6-53.9) in the PIPA and +6.8% (0.0-13.4) in the P-5deg spill-over area under the P-All effort redistribution scenario during 1998-2019 (Table 1, Figures 6D-F). The benefits are weaker, and are negative for some time periods, for the P-5deg effort redistribution scenario.
3.3 Conservation benefits of 33% spatial closures
3.3.1 Skipjack tuna
WCPO stock-wide skipjack tuna SB (Figure 7A; Table 2) is increased relative to the Fref level by an estimated +5.8% on average (0.5-9.8) (Table 2) under a closure of the western-most segment of the WCPO (R33W). However, closures in the central (R33C) and eastern (R33E) areas have little conservation impact at the WCPO stock-wide scale. Skipjack tuna SB in the individual areas, particularly R33W (+23.5%) and R33C (+16.1%), is substantially increased by local closures; however, area-specific SB is negatively impacted by closures in either of the other areas; notably R33W SB is strongly negatively impacted (-13.8%) by the R33C closure, due to the displacement of fishing activity from R33C to R33W (Figure 7B; Table 2). Catches and catch-per-unit-effort (CPUE) are impacted by the closures, depending on which area is closed and where particular fisheries occur. For example, tropical purse seine fishery catches and CPUE are strongly negatively impacted by the R33C closure (by -24% over the period, see Supplementary Figure 5) since this fishery occurs primarily in the closed region and therefore its effort is transferred to the adjacent regions under this closure.
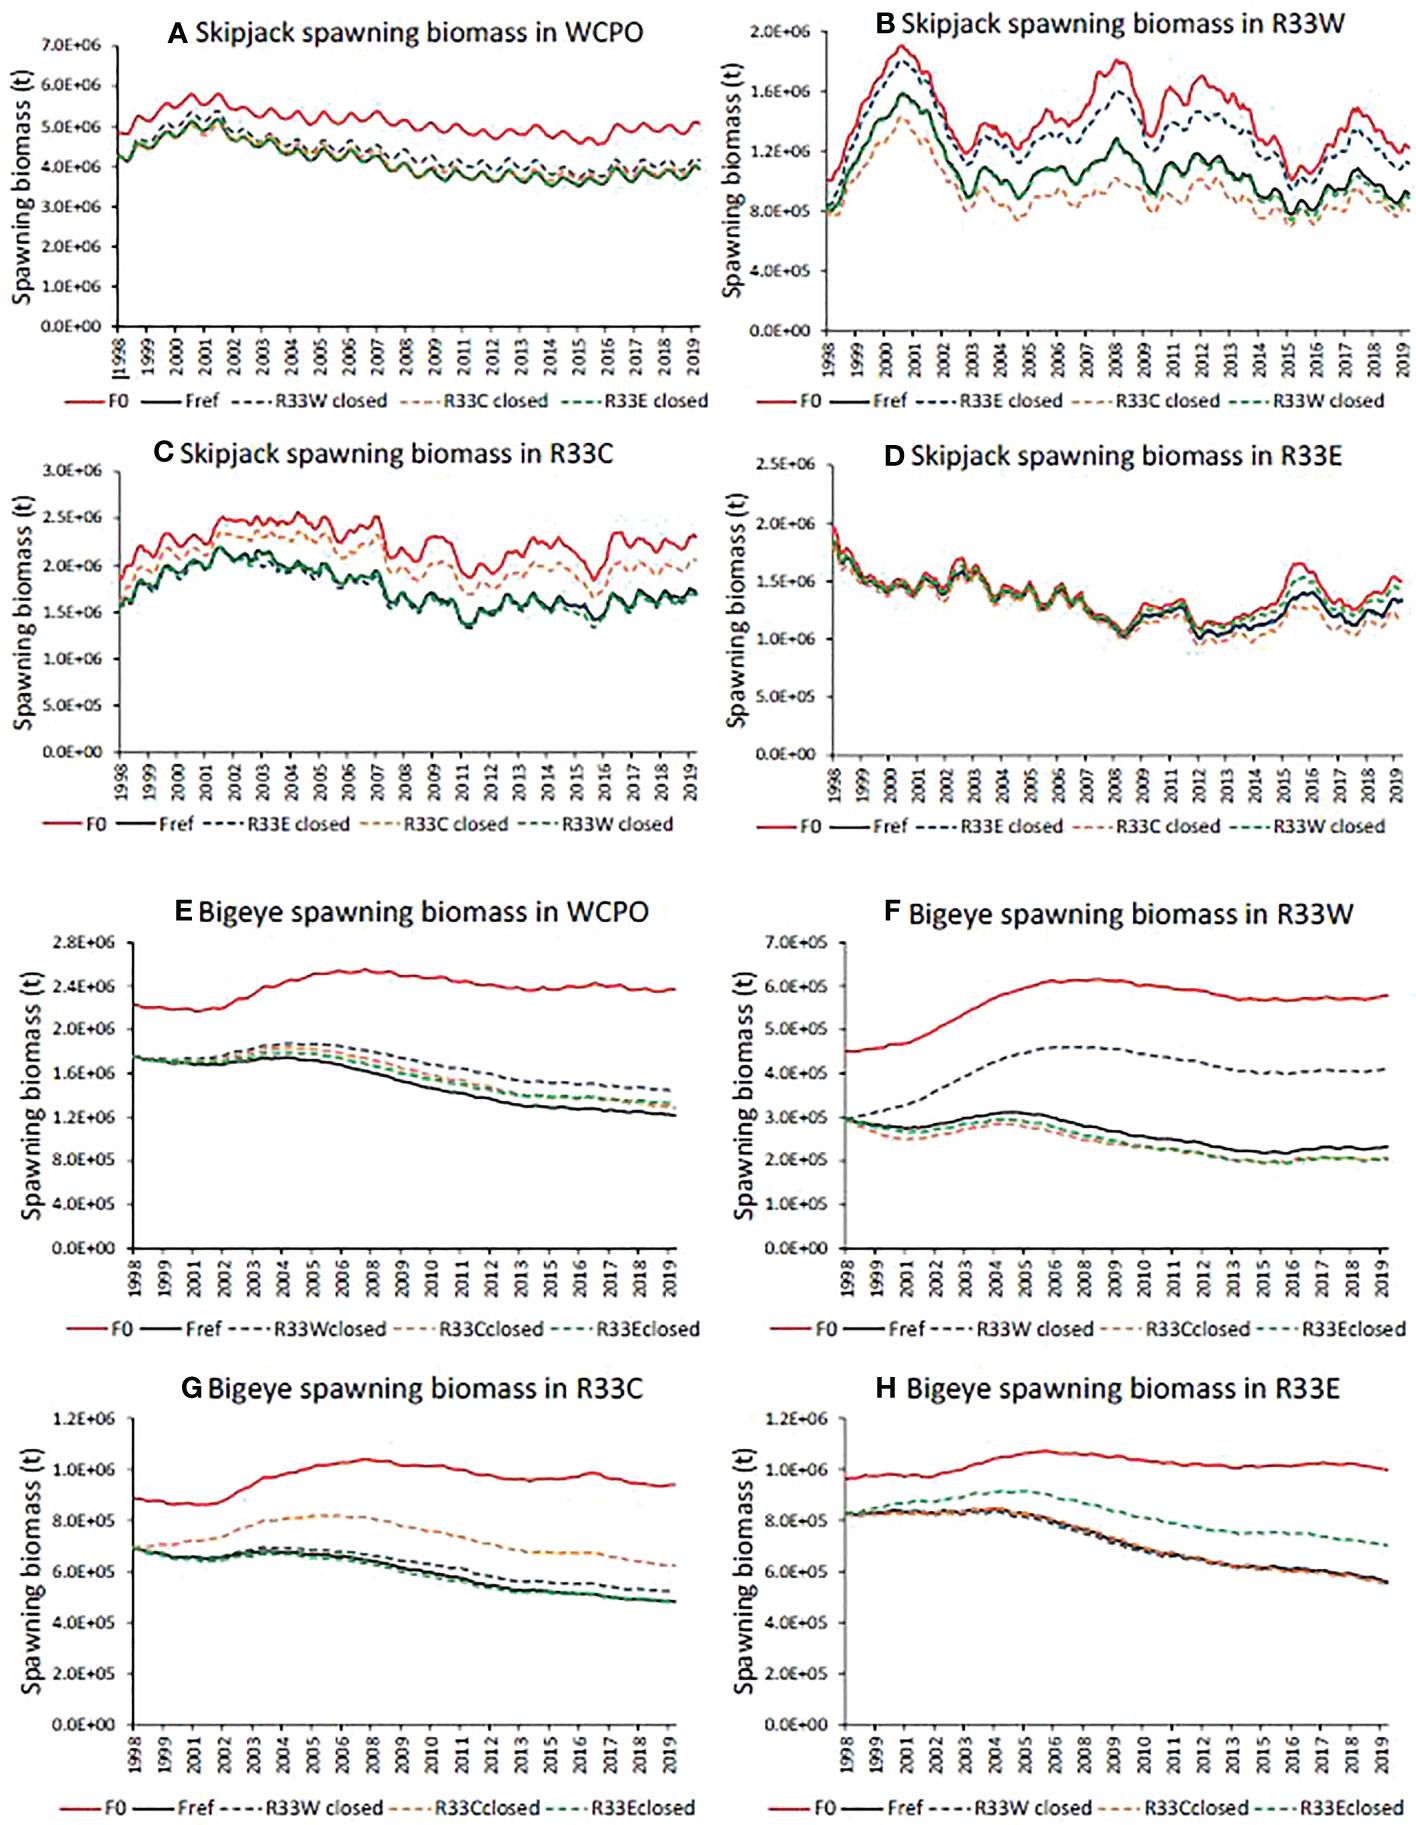
Figure 7 Time series of estimated skipjack (A-D) and bigeye (E-H) tuna spawning biomass in the absence of fishing (F0), under the observed fishing activity (Fref) and for retrospective large closures of approximately 33% of the western and central Pacific Ocean (WCPO) in the west (R33W), central (R33C) and eastern areas (R33E) compiled for the WCPO (A, E), R33W (B, F), R33C (C, G) and R33E (D, H). See Figure 1 for a description of the areas.
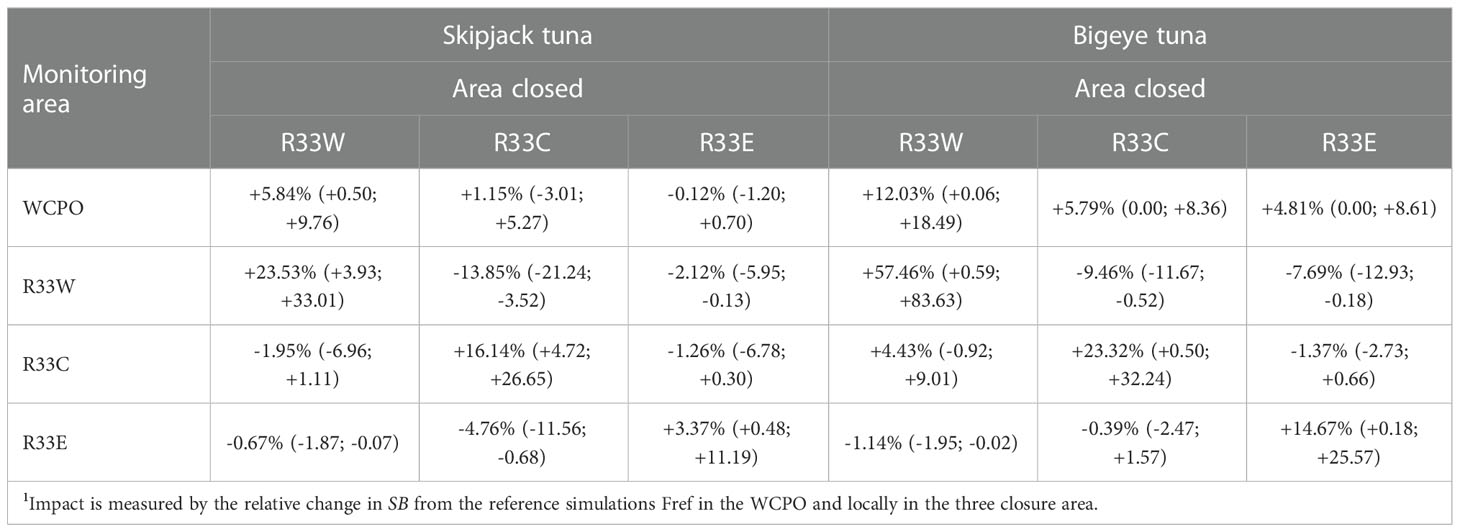
Table 2 Average impact1 (monthly range in parentheses) on skipjack and bigeye tuna spawning biomass (SB) of hypothetical large spatial closures corresponding to approximately 33% of the western and central Pacific Ocean (WCPO, Pacific Ocean west of 150°W) in western (R33W), central (R33C) and eastern (R33E) zones during 1998-2019.
3.3.2 Bigeye tuna
The conservation benefits of the 33% spatial closures are greater for bigeye tuna than for skipjack tuna – increases in WCPO SB of +12.0% (0.1-18.5) for the R33W closure, +5.8% (0-8.4) for the R33C closure, and +4.8% (0-8.6) for the R33E closure were estimated (Figure 7E; Table 2). Likewise, local increases in bigeye tuna SB in the closed areas were also greater, +57.5% (0.6-83.6) in R33W, +23.3% (0.5-32.2) in R33C and +14.7% (0.2-25.6) in R33E. However, bigeye tuna SB in R33W was moderately negatively impacted by closures in R33C (-9.5%) and in R33E (-7.7%) due to the displacement of fishing activity from the closed areas to R33W (Figure 7F; Table 2). As for skipjack tuna, catches and CPUE of bigeye tuna are impacted by the various closures. For the longline fishery that targets bigeye tuna, average catches and CPUE over the period 1998-2019 are negatively impacted by closures in R33W (-6.3%) and in R33E (-4.0%) but are positively impacted by the R33C closure (+1.9%), with considerable time-series variation in impacts (Supplementary Figure 6).
4 Discussion
This work represents the first quantitative evaluation of the conservation benefits for two major, commercially important tuna species with contrasting demographic and exploitation characteristics, skipjack and bigeye tuna, of an actual spatial closure, the PIPA, in the Pacific region. The analysis shows that the conservation benefits for skipjack tuna within the MPA, near-MPA and stock-wide scales are negligible. Benefits for bigeye tuna are slightly greater, but not of a magnitude that would make a meaningful contribution to conservation. These results span a 22-year period comprising considerable environmental variation, including strong El Niño and La Niña events. El Niño conditions have been shown to expand the western Pacific warm pool (sea surface temperature >28.5°C) and skipjack tuna distribution from the tropical western Pacific into the tropical central and eastern Pacific (Lehodey et al., 1997). The 1998 and 2015-2016 skipjack tuna SB peaks in the central-Pacific-located PIPA (Figure 3B) and P-5deg areas (Figure 3C) are likely related to the strong El Niño events that occurred around those times (Hanich et al., 2018).
The results pertaining to the PIPA, which are broadly consistent with an empirical study of the impacts of a similar sized MPA (the British Indian Ocean Territory) on bigeye and yellowfin tuna in the Indian Ocean (Curnick et al., 2020), are not surprising. The PIPA is a small area relative to the distribution of the highly mobile skipjack (Sibert and Hampton, 2003) and bigeye tuna (Schaefer et al., 2015) stocks. Furthermore, although both species spawn in the PIPA (Hernández et al., 2019), they also spawn broadly in the tropical WCPO (Figures 4A, 5A) and are subject to current velocities that result in high levels of passive drift (Scutt Phillips et al., 2019). The PIPA on average is estimated by SEAPODYM to supply only 1.3% and 0.9% of the total WCPO reproductive output for skipjack and bigeye tuna, respectively (Supplementary Table 4). It is therefore clear that some expectations for the impact of PIPA on tuna conservation (e.g., Oceana, 2016) were overly optimistic. The Kiribati Government has recently decided to re-open the PIPA to controlled commercial fishing. The results presented here show that there would be no consequential negative conservation impacts on skipjack or bigeye tuna resulting from the implementation of this decision.
Our results also show that even for much larger hypothetical closures comprising approximately 33% of the WCPO area, conservation impacts on skipjack tuna would likely be modest, with average changes in SB of up to +5.8% across the WCPO. Larger increases were estimated in the zones assumed to be closed, e.g., +23.5% for the western zone and +16.1% for the central zone; however, these need to be counter-balanced by reductions in SB of up to -13.8% in the zones remaining open, resulting from the additional concentration of fishing activity transferred from the closed zones. The results for the more heavily exploited bigeye tuna show higher conservation benefits, with average changes in WCPO SB of +4.8% to +12.0%.
We conclude that large-scale oceanic MPAs such as the PIPA or even the much larger spatial closures, generate very modest increases in stock-wide biomass of skipjack tuna, which is currently subject to moderate exploitation pressure, or even the more heavily exploited bigeye tuna at recent historical levels of exploitation. The conservation benefits that were estimated, even for the large spatial closures, were not of a magnitude to suggest that they could be effective frontline management tools for tuna in the WCPO. Note that our estimates pertain explicitly to the protective effects of MPAs in providing fishing refugia within their boundaries rather than any secondary effects that MPAs might have on modifying total, stock-wide levels of fishing. Various fishery controls, such as catch and effort limits and seasonal closures of purse seine sets on fish aggregation devices, have been implemented in the WCPO since 2010 (WCPFC, 2022) and are reflected in both the Fref and counterfactual simulations.
The reasons for the lack of effectiveness of spatial closures are rooted in the population dynamics of species such as skipjack and bigeye tuna, which have wide distributions and are highly mobile (Hilborn et al., 2021). This results in fishing impacts, even from a spatially restricted source, being dispersed to some extent throughout the range of the stock. The corollary is that MPAs can only provide protection from fishing when the fish are present in the MPA, and these protective gains are dissipated when fish move beyond the limits of the MPA. Additionally, MPAs do not control the level of stock-wide fishing activity, but typically move it into that part of the fishery that remains open (Sibert et al., 2012; Hilborn et al., 2021). As shown in the R33 scenarios here, large spatial closures that crowd fishing effort into the remaining two-thirds of the fishing grounds, could reduce local abundance in those areas and result in decreased economic performance of fishing vessels – lower per-vessel catches and catch-per-unit-effort. Proposals to close the high seas to fishing (White and Costello, 2014; Sumaila et al., 2015) maybe also produce negative effects of this nature. Unless carefully designed, large spatial closures may also impact negatively on onshore processing and service facilities in developing economies, whose competitive advantage substantially relies on proximity to fishing grounds for vessels supplying and/or using those facilities. The R33 closure scenarios that we have examined here are naïve in the sense that they were used only for demonstration purposes and ignored the reality that large closures of this sort would be difficult if not impossible to implement in a politically acceptable and equitable way. Similarly, while “marine corridors” or spatiotemporally dynamic MPAs have been proposed to increase effectiveness for highly mobile species (O’Leary et al., 2018; Boerder et al., 2019; Gilman et al., 2019), their near real-time implementation at scale in oligotrophic, tropical zones are likely to be even more problematic. In the case of tuna fisheries, more direct control of catch and effort through a multilateral regional fisheries management organization such as WCPFC is likely to be a more effective and equitable management tool and result in less social upheaval, particularly for nearshore tuna fisheries that contribute to food security in places like the Pacific Islands and Southeast Asia.
These conclusions are based on high-resolution spatial models of skipjack and bigeye tuna population dynamics and fisheries. The models assimilate current understanding of stock demographics and available fishery and conventional tagging data through the parameter estimation process (Senina et al., 2020; Senina et al., 2021). The models therefore provide the best current representation of age-specific movement, reproduction, mortality, exploitation, and the environmentally driven seasonal, inter-annual and spatial distribution of abundance, which is critical for the evaluation of spatial management schemes.
However, no model is perfect, and these are no exception. Some caveats of our modelling approach to bear in mind are: (i) we are modelling the dynamics of single pelagic species, assumed to be a single, self-replenishing stock and with no consideration of species interactions through competition for prey or inter-species predation; (ii) we do not model the impact on prey species of predation by the modelled pelagic species; and (iii) the model results are conditioned on the oceanographic forcing reanalyses used in the simulations, and while these are the best currently available, it is possible that they contain biases in some areas. We have not attempted to estimate sensitivity of our results to these and other possible sources of uncertainty. However, the approach taken for the evaluation of comparing retrospective reference and counterfactual simulations (Fulton et al., 2015) would tend to reduce the risk of such uncertainties impacting our conclusions as any errors or bias would tend to affect both simulations in a similar way. The retrospective approach, compared to the alternative of attempting to project into the future, has the added advantage of working with known historical fishery distributions and oceanic environmental properties that are required to drive the simulations. The period covered by the study (1998-2019) encompasses the full range of typically observed environmental variability in the Pacific, including several strong El Niño and La Niña events, thus capturing any interactions between spatial management effectiveness and environmental variability.
Our findings have contrasted two species of tropical tuna with differing population dynamics and degrees of fishing-induced biomass depletion, and should also be informative regarding the likely effects of MPAs on other widely distributed, mobile pelagic species such as yellowing tuna, whose population and exploitation characteristics lie somewhere between skipjack and bigeye tuna. However, our examples do not include species whose biomass has been depleted to levels below biological sustainability limits or stocks that systematically migrate to discrete spawning grounds. How MPAs might contribute to the conservation of pelagic stocks with these characteristics remains untested. No tropical tuna stocks in the WCPO have been depleted to levels below their biological sustainability levels (Hare et al., 2021). Similarly, while stock structure for tropical tuna stocks in the Pacific remains uncertain (Moore et al., 2020), the most recent information from genetic studies has not detected strong evidence of fidelity to discrete spawning grounds (Grewe et al., 2015; Anderson et al., 2020; Natasha et al., 2022).
We recognise that large oceanic MPAs such as the PIPA may have conservation value in areas not analysed in this paper, for example in the protection of coral reef ecosystems and their resident species that might otherwise be heavily fished. However, where the objectives of, and justification for, MPAs include enhancing the conservation of widely distributed pelagic species, this should be carefully evaluated during the planning stage, for example using methods such as those of Ovando et al. (2021) and that presented in this paper. This would allow expectations to be realistic and evaluated against the likely economic and social costs and benefits that would occur.
Data availability statement
The data analyzed in this study is subject to the following licenses/restrictions: Fisheries data used in this study are held by the Pacific Community on behalf of its members. Such data are available to third parties with the approval of the owners of the data. Reasonable requests for access to data will be facilitated by the Pacific Community. Environmental data used in the SEAPODYM models are publicly available and can be provided on request to the authors. Requests to access these datasets should be directed to Dr John Hampton, johnh@spc.int.
Author contributions
JH, PL and IS designed and contributed equally to the study, IS developed the SEAPODYM models and the associated high-resolution models used in the simulations, PL conducted the simulations, JH and PL wrote the paper, with contributions and review by IS, SN, JSP and KT. KT provided information on the PIPA and relevant fisheries management context.
Funding
Funding for this work was provided from Pacific Community donors, predominantly the Governments of Australia, France and New Zealand.
Acknowledgments
We thank Peter Williams and Jules Lehodey for their assistance with data compilation and production of figures. The manuscript was improved by the comments of two referees.
Conflict of interest
The authors declare that the research was conducted in the absence of any commercial or financial relationships that could be construed as a potential conflict of interest.
Publisher’s note
All claims expressed in this article are solely those of the authors and do not necessarily represent those of their affiliated organizations, or those of the publisher, the editors and the reviewers. Any product that may be evaluated in this article, or claim that may be made by its manufacturer, is not guaranteed or endorsed by the publisher.
Supplementary material
The Supplementary Material for this article can be found online at: https://www.frontiersin.org/articles/10.3389/fmars.2022.1060943/full#supplementary-material
References
Anderson G., Lal M., Stockwell B., Hampton J., Smith N., Nicol S., et al. (2020). No population genetic structure of skipjack tuna (Katsuwonus pelamis) in the tropical western and central pacific assessed using single nucleotide polymorphisms. Front. Mar. Sci. 7, 570760. doi: 10.3389/fmars.2020.570760
Bertignac M., Lehodey P., Hampton J. (1998). A spatial population dynamics simulation model of tropical tunas using a habitat index based on environmental parameters. Fish. Oceanogr. 7, 326–334. doi: 10.1046/j.1365-2419.1998.00065.x
Black P. E. (2019). “Manhattan Distance,” in Dictionary of algorithms and data structures. Ed. Black P. E. (Gaithersburg: National Institute of Standards and Technology). Available at: https://www.nist.gov/dads/HTML/manhattanDistance.html.
Boerder K., Schiller L., Worm B. (2019). Not all who wander are lost: improving spatial protection for large pelagic fishes. Mar. Pol. 105, 80–90. doi: 10.1016/j.marpol.2019.04.013
Curnick D. J., Collen B., Koldewey H. J., Jones K. E., Kemp K. M., Ferretti F. (2020). Interactions between a large marine protected area, pelagic tuna and associated fisheries. Front. Mar. Sci. 7, 318. doi: 10.3389/fmars.2020.00318
Ducharme-Barth N., Vincent M., Hampton J., Hamer P., Williams P., Pilling G. (2020). Stock assessment of skipjack tuna in the western and central Pacific Ocean. WCPFC-SC16-2020/SA-WP-03-Rev3 (Pohnpei: Western and Central Pacific Fisheries Commission).
Fulton E. A., Bax N. J., Bustamante R. H., Dambacher J. M., Dichmont C., Dunstan P. K., et al. (2015). Modelling marine protected areas: insights and hurdles. Philos. Trans. R. Soc Lond. B Biol. Sci. 370, 20140278. doi: 10.1098/rstb.2014.0278
Gaines S. D., White C., Carr M. H., Palumbi S. R. (2010). Designing marine reserve networks for both conservation and fisheries management. Proc. Natl. Acad. Sci. U.S.A. 107, 18286–18293. doi: 10.1073/pnas.0906473107
Gillett R. (2016). Fisheries in the economies of pacific island countries and territories (Noumea: Pacific Community).
Gilman E., Kaiser M. J., Chaloupka M. (2019). Do static and dynamic marine protected areas that restrict pelagic fishing achieve ecological objectives? Ecosphere 10, e02968. doi: 10.1002/ecs2.2968
Govan H. (2020). Renewed calls for marine conservation must not bulldoze the democratic route that has allowed small island nations to improve fisheries and incomes without damaging the marine ecology. Samudra Rep. 83, 53–54.
Grewe P., Feutry P., Hill P., Gunasekera R., Schaefer K., Itano D. G., et al. (2015). Evidence of discrete yellowfin tuna (Thunnus albacares) populations demands rethink of management for this globally important resource. Sci. Rep. 5, 16916. doi: 10.1038/srep16916
Hanich Q., Rotjan R., Aqorau T., Bailey M., Campbell B., Gray N., et al. (2018). Unravelling the blue paradox: incomplete analysis yields incorrect conclusions about phoenix islands protected area closure. Proc. Natl. Acad. Sci. U.S.A. 115, E12122–E12123. doi: 10.1073/pnas.1815600115
Hare S. R., Williams P. G., Castillo-Jordán C., Hamer P. A., Hampton W. J., Scott R. D., et al. (2021). “The western and central pacific tuna fishery: 2020 overview and status of stocks,” in Tuna fisheries assessment report no. 21 (Noumea: Pacific Community). Available at: https://purl.org/spc/digilib/doc/qkpa2.
Hernández C. M., Willing J., Willis C., Thorrold S. R., Llopiz J. K., Rotjan R. D. (2019). Evidence and patterns of tuna spawning inside a large no-take marine protected area. Sci. Rep. 9, 10772. doi: 10.1038/s41598-019-47161-0
Hilborn R., Agostini V. N., Chaloupka M., Garcia S. M., Gerber L. R., Gilman E., et al. (2021). Area-based management of blue water fisheries: Current knowledge and research needs. Fish 23, 492–518. doi: 10.1111/faf.12629
Lehodey P., Bertignac M., Hampton J., Lewis A., Picaut J. (1997). El Niño Southern Oscillation and tuna in the western Pacific. Nature 389, 715–718.
Lehodey P., Senina I., Murtugudde R. (2008). A spatial ecosystem and populations dynamics model (SEAPODYM) – modeling of tuna and tuna-like populations. Prog. Oceanogr 78, 304–318. doi: 10.1016/j.pocean.2008.06.004
McDermott G. R., Meng C., McDonald G. G., Costello C. J. (2018). The blue paradox: preemptive overfishing in marine reserves. Proc. Natl. Acad. Sci. U.S.A. 116, 5319–5325. doi: 10.1073/pnas.1802862115
Medoff S., Lynham J., Raynor J. (2022). Spillover benefits from the world’s largest fully protected MPA. Science 378, 313–316. doi: 10.1126/science.abn0098
Moore B. R., Bell J. D., Evans K., Farley J., Grewe P. M., Hampton J., et al. (2020). Defining the stock structures of key commercial tunas in the pacific ocean I: current knowledge and main uncertainties. Fish. Res. 230, 105525. doi: 10.1016/j.fishres.2020.105525
Natasha J., Stockwell B. L., Marie A., Hampton J., Smith N., Nicol S., et al. (2022). No population structure of bigeye tunas (Thunnus obesus) in the western and central pacific ocean indicated by single nucleotide polymorphisms. Front. Mar. Sci. 9, 799684. doi: 10.3389/fmars.2022.799684
Oceana (2016). Global fishing watch reveals a fisheries management success in the phoenix islands (Washington, DC: Oceana). Available at: https://usa.oceana.org/sites/default/files/pipa_report_final_low_res_3_7_16.pdf.
O’Leary B. C., Ban N. C., Fernandez M., Friedlander A. M., García-Borboroglu P., Golbuu Y., et al. (2018). Addressing criticisms of large-scale marine protected areas. Bioscience 68, 359–370. doi: 10.1093/biosci/biy021
Ovando D., Caselle J. E., Costello C., Deschenes O., Gaines S. D., Hilborn R., et al. (2021). Assessing the population-level conservation effects of marine protected areas. Conserv. Biol. 35, 1861–1870. doi: 10.1111/cobi.13782
PICRC and COS (2019). Palau’s national marine sanctuary: Managing ocean change and supporting food security (Palau: Palau International Coral Reef Center and the Stanford Center for Ocean Solutions). Available at: http://picrc.org/picrcpage/palau-national-marine-sanctuaryhttps://oceansolutions.stanford.edu/pnms-report.
Roberts C., Page R., O’Leary B., Allen H., Yates K., Tudhope A., et al. (2019). 30X30: a blueprint for ocean protection (Amsterdam, Netherlands: Greenpeace International). Available at: https://www.greenpeaceoceanblueprint.org/pdfDocs/Greenpeace_30x30_Blueprint_Report_web.pdf.
Schaefer K., Fuller D., Hampton J., Caillot S., Leroy B., Itano D. (2015). Movements, dispersion, and mixing of bigeye tuna (Thunnus obesus) tagged and released in the equatorial central pacific ocean, with conventional and archival tags. Fish. Res. 161, 336–355. doi: 10.1016/j.fishres.2014.08.018
Scutt Phillips J., Escalle L., Pilling G., Gupta A. S., Van Sebille E. (2019). Regional connectivity and spatial densities of drifting fish aggregating devices, simulated from fishing events in the Western and central pacific ocean. Environ. Res. Commun. 1, 055001. doi: 10.1088/2515-7620/ab21e9
Senina I., Briand G., Lehodey P., Nicol S., Hampton J., Williams P. (2021). Reference model of bigeye tuna using SEAPODYM with catch, length and conventional tagging data (Pohnpei: Western and Central Pacific Fisheries Commission). WCPFC-SC17-2021/EB-IP-08.
Senina I., Lehodey P., Sibert J., Hampton J. (2020). Integrating tagging and fisheries data into a spatial population dynamics model to improve its predictive skills. Can. J. Fish. Aquat. Sci. 77, 376–593. doi: 10.1139/cjfas-2018-0470
Senina I., Sibert J., Lehodey P. (2008). Parameter estimation for basin-scale ecosystem-linked population models of large pelagic predators: application to skipjack tuna. Prog. Oceanogr. 78, 319–335. doi: 10.1016/j.pocean.2008.06.003
Sibert J. R., Hampton J. (2003). Mobility of tropical tunas and the implications for fisheries management. Mar. Pol. 27, 87–95. doi: 10.1016/S0308-597X(02)00057-X
Sibert J. R., Senina I., Lehodey P., Hampton J. (2012). Shifting from marine reserves to maritime zoning for conservation of pacific bigeye tuna (Thunnus obesus). Proc. Natl. Acad. Sci. U.S.A. 109, 18221–18225. doi: 10.1073/pnas.1209468109
Sumaila U. R., Lam V. W. Y., Miller D. D., Teh L., Watson R. A., Zeller D., et al. (2015). Winners and losers in a world where the high seas is closed to fishing. Sci. Rep. 5, 8481. doi: 10.1038/srep0841
Vincent M., Pilling G., Hampton J. (2019). Stock assessment of skipjack tuna in the western and central pacific ocean (Western and Central Pacific Fisheries Commission: WCPFC-SC15-2019/SA-WP-05-Rev2 (Pohnpei).
WCPFC (2020). Tuna fishery yearbook 2019 (Pohnpei: Western and Central Pacific Fisheries Commission). Available at: https://www.wcpfc.int/doc/wcpfc-tuna-fishery-yearbook-2019.
WCPFC (2022). Conservation and management measures (CMMs) and resolutions of the Western and central pacific fisheries commission (WCPFC) (Pohnpei: Western and Central Pacific Fisheries Commission). Available at: https://www.wcpfc.int/conservation-and-management-measures.
Keywords: spatial management, tuna fisheries, SEAPODYM, 30 by 30, MPA
Citation: Hampton J, Lehodey P, Senina I, Nicol S, Scutt Phillips J and Tiamere K (2023) Limited conservation efficacy of large-scale marine protected areas for Pacific skipjack and bigeye tunas. Front. Mar. Sci. 9:1060943. doi: 10.3389/fmars.2022.1060943
Received: 04 October 2022; Accepted: 21 December 2022;
Published: 10 January 2023.
Edited by:
Carlo Pipitone, CNR-IAS Institute of Anthropic Impacts and Sustainability in marine environment, ItalyReviewed by:
Dale Edward Squires, National Oceanic and Atmospheric Administration (NOAA), United StatesAlfonso Aguilar-Perera, Universidad Autónoma de Yucatán, Mexico
Copyright © 2023 Hampton, Lehodey, Senina, Nicol, Scutt Phillips and Tiamere. This is an open-access article distributed under the terms of the Creative Commons Attribution License (CC BY). The use, distribution or reproduction in other forums is permitted, provided the original author(s) and the copyright owner(s) are credited and that the original publication in this journal is cited, in accordance with accepted academic practice. No use, distribution or reproduction is permitted which does not comply with these terms.
*Correspondence: John Hampton, johnh@spc.int