Assessment of underwater navigation safety based on dynamic Bayesian network facing uncertain knowledge and various information
- 1College of Advanced Interdisciplinary Studies, National University of Defense Technology, Changsha, China
- 2Collaborative Innovation Center on Meteorological Disaster Forecast, Warning and Assessment, Nanjing University of Information Science and Engineering, Nanjing, China
As ocean environment is complicated and varied, underwater vehicles (UVs) are facing great challenges in safe and precise navigation. Therefore, it is important to evaluate the underwater ocean environment safety for the UV navigation. To deal with the uncertain knowledge and various information in the safety assessment, we present an evaluation model based on the dynamic Bayesian network (DBN) theory. Firstly, characteristic indicators are extract from marine environment systems and discretized with Cloud model. Then, the DBN is constructed through structure learning and parameter learning based on Dempster-Shafer (DS) evidence theory. Finally, the dynamic evaluation and risk zoning of the navigation safety is realized based on Bayesian probabilistic reasoning. The DBN-based assessment model fully considers the uncertainty of influence relationships between marine environment and UV navigation, and effectively fuses expert knowledge and quantitative data for assessment modeling. The experimental results show the proposed model has high reliability and good value of application.
1 Introduction
With the development and utilization of ocean by human beings, a large number of underwater vehicles (UVs) have been put into use continuously, such as oceanographic survey, scientific experiment and resource exploration. As the activity space of UVs, the complex marine environment is the most crucial factor that restricts their performance. Evaluating the impact of marine environment on the navigation safety is the premise and basis for the effective application of UVs. Therefore, it is of very practical value to establish and improve a scientific evaluation-decision system for UV navigation safety in the face of complex marine environment.
Domestic and foreign studies on the navigation safety assessment of UVs are mainly include two categories: One is the kinetics simulation based on the equations of motion. Xu et al. (2012) established the underwater hovering equation of the UV, and used the PID method to simulate its hovering in order to control the stability under water. Liu et al. (2006) started from the generation mechanism of internal wave and the motion characteristics of UVs, and deeply analyzed the force of internal wave on the UV navigation. Licéaga-Castro et al. (2008) added the sea wave as a disturbance force to the motion equations, and analyzed the course control of UVs in the case of wave disturbance. Because the simultaneous equations of UV motion are nonlinear, high order and multi-dimensional, it is difficult to obtain an analytical solution. Most of the researches on kinetics simulation focus on analyzing the influence of one single marine variable on the UV navigation. The combined effects of multiple environmental factors are not easy to analyze with the kinetics simulation.
The other is the comprehensive evaluation of navigation safety based on system science and management science. Wang et al. (2010) adopted the analytic hierarchy process (AHP) method to establish an assessment system for the UV navigation, and conducted a semi-quantitative assessment for the impact from marine environment with expert knowledge. Fu (2012) combined the member function transfer algorithm and the fuzzy comprehensive evaluation (FCE) method based on the over-standard weight, to evaluate the navigation safety of UVs. Liu and Song (2008) used the spatial analysis method based on the geographic information system (GIS) to fuse the marine environmental information that affects the UV, and carried out the risk zoning of maritime space. Xu and Yang (2015) introduced the intuitionistic fuzzy Vague set theory to evaluate the navigation safety, which fully expresses the ambiguity of the impact of marine environment on the UV navigation. Jia (2018) used the fuzzy logic reasoning model and Dempster-Shafer (DS) evidence theory to construct an assessment model, and evaluated the marine security situation of UV navigation through weighted fusion of marine environmental information. By establishing the indicator system and evaluation model, the comprehensive impact of various marine environmental factors on the UV navigation can be evaluated quantitatively. This paper focuses on the second research.
As we all know, the navigation safety assessment of UV is a system engineering. On the one hand, the marine environment is a complicated system containing many variables. Environmental factors are coupled and interact with each other, and the influencing mechanism between the UV navigation and marine environment is significantly nonlinear and uncertain. It is difficult to establish an accurate analytical model for navigation safety assessment. On the other hand, the data types of navigation assessment modeling are diverse, including both large datasets, small samples and qualitative information. There are sufficient quantitative data for marine environmental variables, but the correlation samples between the environment and UV navigation are very scarce, which are mostly qualitative descriptions. It can be seen that the uncertainty of knowledge and the diversification of modeling information have caused great difficulties in the navigation safety assessment of UVs.
However, the evaluation methods used in the above studies cannot deal with the problems well: AHP method achieves the evaluation modeling by establishing a hierarchical index system, but it cannot describe nonlinear relationships between environmental factors and the UV navigation. FCE method only considers the ambiguity of the influencing mechanism in one side, and ignores the uncertainty such as randomness. Both AHP and FCE are carried out based on experience and knowledge of experts in the modeling course, causing strong subjectivity (Li et al. 2021a). By contrast, the DS evidence theory has ability in dealing with the uncertainty of the navigation safety assessment through fusing uncertain and imprecise information, but it is difficult to express and reason about complex relationships among various environmental factors, especially non-linear relationships. In addition, the above evaluation methods are weak in processing multi-source heterogeneous data and cannot achieve effective fusion of quantitative data and qualitative knowledge. To sum up, for the safety assessment of UV navigation, it is urgent to develop new assessment models under the conditions of uncertain knowledge and diversiform information.
Bayesian network (BN), as the typical representative of uncertain artificial intelligence (AI) algorithms, is a powerful tool for modeling with complex systems. It has been effectively applied in many complicated problems such as natural disaster assessment, ship navigation assessment, and financial risk assessment (Zhang, 2003; Li et al. 2018a; Li and Hong, 2018b). Based on probability theory and graph theory, BN is a quantitative causal graph model, which can not only deal with the uncertainty of complicated problems through probability theory, but also express complex relationships with the help of topology structure. Most importantly, based on prior probability and conditional probability, BN can effectively achieve the fusion of qualitative knowledge and quantitative data, so it is suitable for processing diverse data types. Therefore, we will introduce the BN theory for the safety assessment modeling of UV navigation.
Through the above analysis, there are many problems including various influencing factors, nonlinear influencing relationships, and diverse modeling information in the navigation safety assessment, causing great uncertainty. Besides, it is worth noting that the marine environment is constantly changing, and the impact of environmental factors on the UV navigation is also dynamic. However, the existing studies have hardly carried out the dynamic assessment for navigation safety of UVs. In view of the above problems, we adopt the dynamic Bayesian network (DBN) to evaluate the UV navigation safety. Based on the new BN learning algorithm proposed by the author of this article (Li et al. 2021b), the dynamic assessment model for the UV navigation safety is constructed through indicator extraction, structure construction, parameter learning and probabilistic reasoning. The chapters are organized as follows: Section 2 introduces the basic theory of DBN, and presents the technical route of evaluation modeling based on DBN. Section 3 carries out the evaluation modeling of UV navigation safety, and Section 4 discusses and analyzes the evaluation results.
2 Evaluation theory and models
In this section, we first introduce the basic theory of DBN and its learning methods. Then we design the technical framework of the DBN-based assessment model and give a brief elaboration of the technical procedure.
2.1 Dynamic Bayesian network
Bayesian network (BN) is first proposed by Judea Pearl (1998) and includes the classical Bayesian network (CBN) and the dynamic Bayesian network (DBN), whose theoretical basics are graph theory and probability theory. DBN is an improvement of CBN, which integrates the time correlation into CBN to explain the temporal causality. Therefore, DBN is a dynamic reasoning model with an ability of probabilistic analysis and prediction of temporal information.
According to Bayesian theory, BN is a directed acyclic graph expressing the causal relationship among variables, which is composed of nodes, directed arcs, and conditional probability distribution tables (CPTs). The nodes represent the variables; the arcs represent the causal relationships (cause-to-effect); CPTs express the strength of the causality quantitatively. DBN is an extension of CBN in the time dimension, and could be explained by a bigram 〈B0, B→〉
● BO denotes the initial network, that is the CBN in each time slice. It contains the network structure and CPTs of nodes at the same time;
● B→denotes the transition network, which contains the structural arcs and the transition probability distribution of nodes in contiguous time slices.
Define a variable set X=(X1,X2,⋯,Xn) and a finite time segment (0,1,⋯,T), then the joint probability distribution of X0,…,XT is:
Where: denotes the node i in the time slice t; denotes the parent of . The probabilistic reasoning with different time slices and different node states is achieved by Eq.1.
The construction of DBN includes structure learning and parameter learning: the former requires to construct B0 and B→ ; the latter requires to determine the conditional probability and the transition probability P(Xt∥Xt−1). Based on the network structure and probability distribution, posterior probability of each nodes in different time slices can be obtained by reasoning, achieving probabilistic prediction of network nodes. Previous studies have summarized two common learning approaches for DBN: manual construction based on professional knowledge and automatic learning based on intelligent algorithms (Chickering et al. 2012). In this paper, we use the combination of subjective knowledge and objective data for DBN learning.
2.2 Modeling technology framework
It has been stated in Introduction that the navigation safety assessment of UVs is a systematic engineering with multi-factor influence, nonlinear correlation and dynamic change, which is full of high uncertainty and manifested in the following specific characteristics.
①Multiple factor: Temperature, salinity, density, ocean current, mesoscale eddy, internal wave, ocean front, spring layer, seafloor topography and other oceanic phenomena and oceanic systems all have a significant impact on the navigation safety of UVs. There are many indicators involved in the navigation evaluation modeling.
②Nonlinear effect: The interaction and coupling among environmental variables are complex, and the influence relationship between factors and the UV navigation are significantly nonlinear, which are difficult to express intuitively through linear functions.
③Diverse data types: The modeling information of UV navigation safety not only includes quantitative environment data, but also includes unstructured semantic information, such as expert experience knowledge and case samples. The diversity of assessment information sources leads to the diversity of data types.
④Incomplete information: Due to the lack of information collection methods during the navigation of UVs, it is extremely difficult to obtain modeling information, and the correlation information between environmental factors and UV navigation is extremely scarce, and the sparse data cannot meet the basic requirements of conventional statistical modeling.
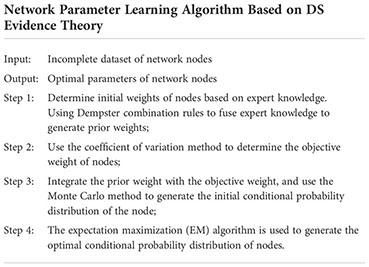
Aiming at the above difficulties, DBN is a powerful model for complex system modeling. The nonlinear relationship among multiple variables can be effectively handled through probabilistic network. However, it should be pointed out that the problem of incomplete information causes certain obstacles to network learning. Data-driven network learning algorithms are difficult to apply practice. To solve this problem, the author of this paper has proposed a novel network learning algorithm based on DS evidence theory (Li et al. 2021b). The algorithm steps are shown as follows:
DS evidence theory is an uncertain reasoning theory jointly established by Professor Dempster (1967) and Shafer (1976), which has been integrated with other intelligent approaches in recent years and applied to such fields as target identification, safety assessment and military command (Aven et al, 2014; Sridharan, 2015; Zhao et al. 2022). The basic concepts of DS evidence theory are as follows.
• Definition 1: Let Θ be a recognition frame, if the set function m: 2Θ→[0,1] satisfies m(Φ)=0 and , then m is the basic credibility distribution on the recognition frame Θ . If A⊂Θ and A≠Φ , then m(A) is the basic credibility of proposition A. If m(A)>0 , then A is called a focal element of evidence, and the set of all focal elements is called the core.
• Definition 2: Let m1, m2 be the two basic credibility distribution functions on the same recognition frame, and their focal elements are A1, A2, ⋯, Ap and B1, B2, ⋯, Bq , respectively. The combined result of m1, and m2 is denoted as m1⊕m2 , and the evidence combination rule is expressed as shown by Eq.2.
where: i=1, 2, ⋯, p ; j=1, 2, ⋯, q ; . is planning factor. When K=1 , the combination rule cannot be applied. For the combination of multiple evidences, this rule can be used to fuse them in sequence.
DS evidence theory defines the famous evidence combination rule and provides a powerful tool for the expression, reasoning and fusion of uncertain information. The above algorithm realizes the evaluation modeling based on BN under the condition of small sample, which will be used in the navigation assessment modeling.
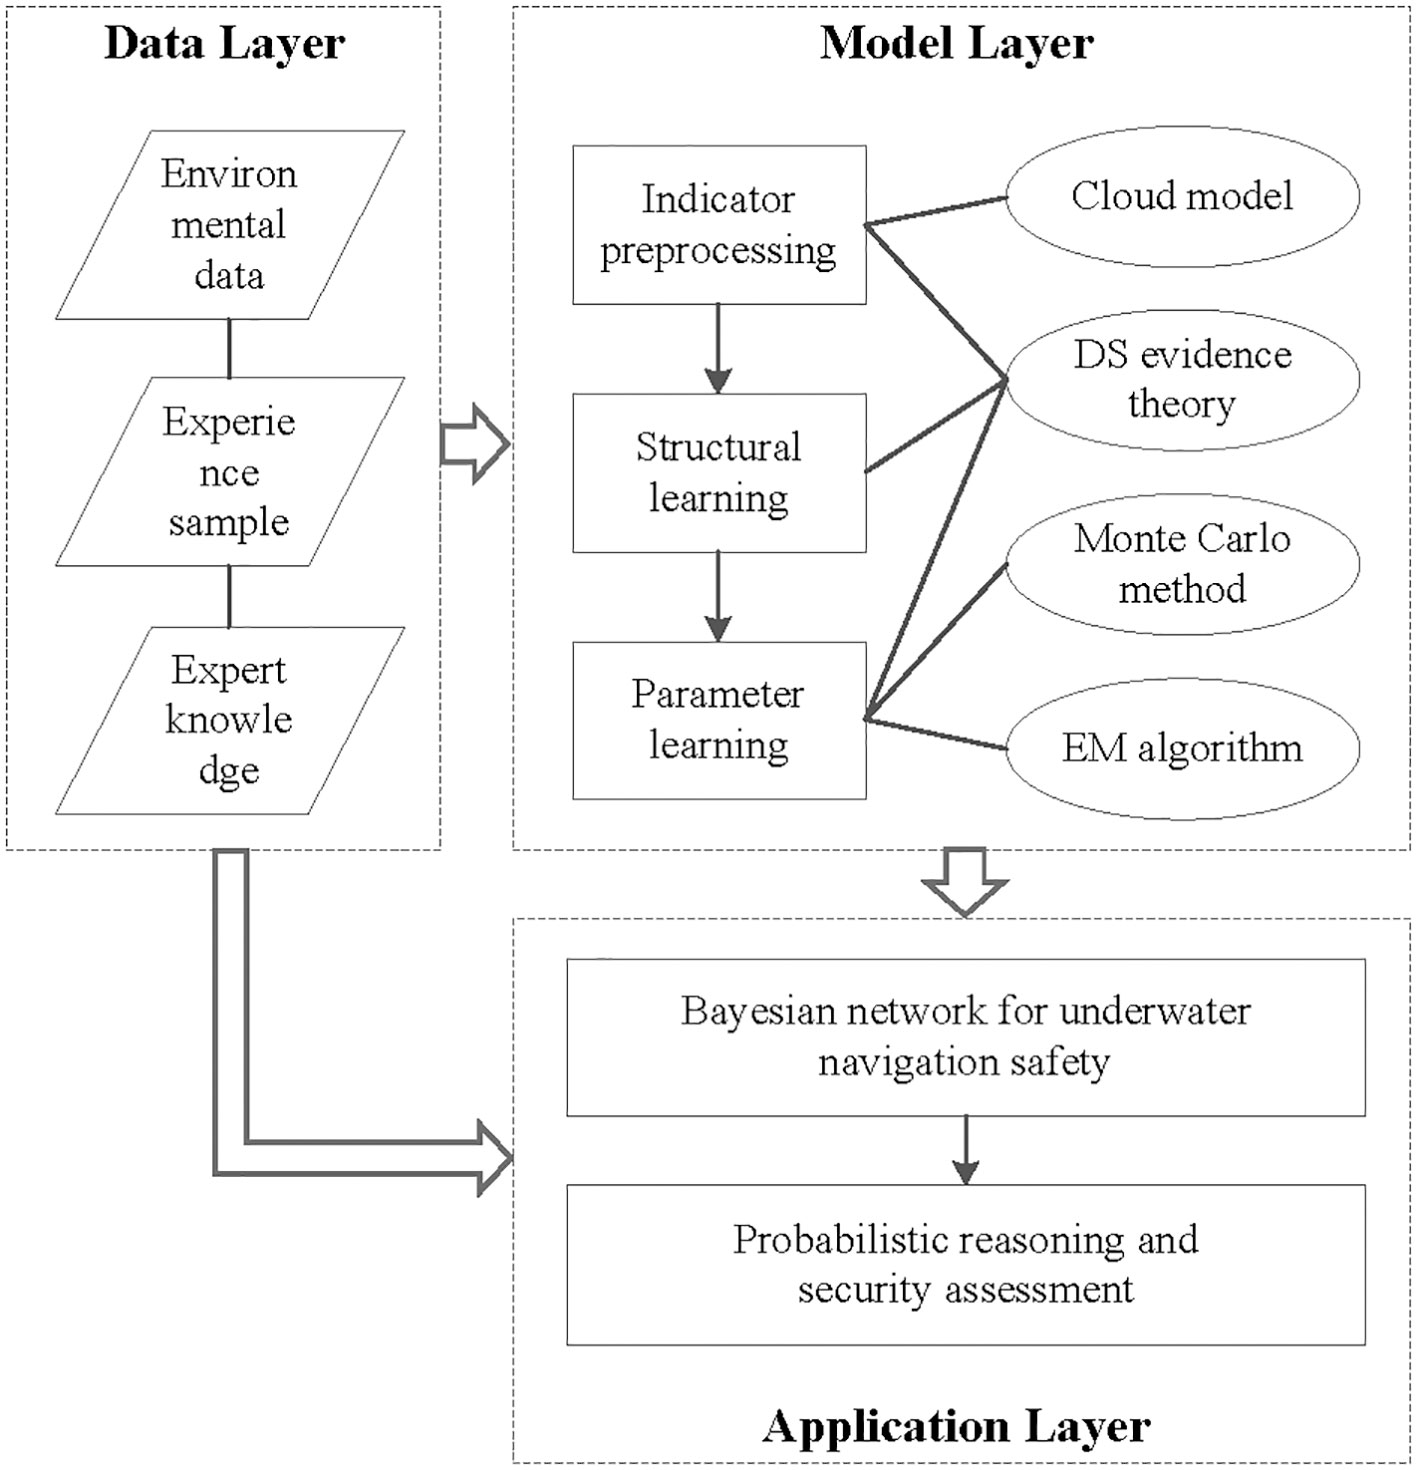
Through integrating objective data and expert knowledge, this paper will combine DS evidence theory and Cloud model to build a DBN-based assessment model for UV navigation safety. The modeling technology route is shown in the Figure1.
Firstly, collect the information of evaluation indicators, including marine variable data, description of UV navigation rules, and experience of experts; Secondly, quantify and discretize the indicator data to obtain regular modeling samples; Then, expert knowledge and index data are combined for network structure construction and parameter learning, thus the DBN for UV navigation safety is established; Finally, input the evaluation index information, and quantitative assessment and risk division of UV navigation are achieved through network probabilistic reasoning. In the next section, we will adopt the above technical route to evaluate the UV navigation safety in the South China Sea.
3 Navigation safety assessment modeling
In this section, our proposed assessment model is applied to evaluate the navigation safety. We first construct characteristic indicators and divide different levels. Then we combine indicator data and expert experience to build the network structure and learn node parameters. Finally, the DBN of UV navigation safety is established.
3.1 Assessment indicator and data sources
Studies have shown that ocean current, mesoscale eddy, internal wave, ocean front, spring layer, seafloor topography and other oceanic phenomena and oceanic systems have a significant impact on the navigation safety of UVs (Mo and Tian, 2012). However, the marine environmental system described by dynamic equations cannot be directly used for evaluation modeling, and characteristic indicators need to be extracted quantitatively. In this section, characteristic indicators are extracted and constructed by analyzing the influencing mechanism between UV navigation and marine environmental factors.
Evaluation indicators should meet the principles of totality, quantifiability, independence and comparability (Kolluru, 1996). For the current, the greater the flow rate, the less safe the UV navigation, so the flow rate is taken as the characteristic index. For the mesoscale eddy, the stronger the vortex and the higher the frequency of occurrence, the more unfavorable it is for the UV navigation. The strength of mesoscale eddy is usually measured by vortex kinetic energy and vortex amplitude. In addition, for regions with strong eddies, the RMS of sea surface height anomalies is also big. Therefore, occurrence frequency of eddy, eddy kinetic energy, eddy amplitude, and RMS of sea surface height (SSH) anomaly are selected as the characteristic indicators of mesoscale eddy. For the internal wave, the greater the amplitude, the more dangerous the navigation, so we take the amplitude as the characteristic index.
The larger the density gradient, the more unstable the UV navigation. For the spring layer, the vertical gradient of density is used as the indicator. For the ocean front, the horizontal gradient of density is used as the indicator. For geographical terrain, it is closely related to the parameters of UV itself. The influence of the distance from obstacles on the navigation safety is connected to the length of UV. When the distance from the obstacle is long, if the length of UV is relatively longer, the UV is not necessarily safe; if the distance from the obstacle is short, but the length of UV is shorter, the UV is maybe safe. So this indicator is expressed as “distance from obstacle / UV length”. For the water depth, if UV has a large seaworthy depth, but the actual water depth is limited, it is unsafe, so the indicator is expressed as “water depth − UV seaworthy depth”.
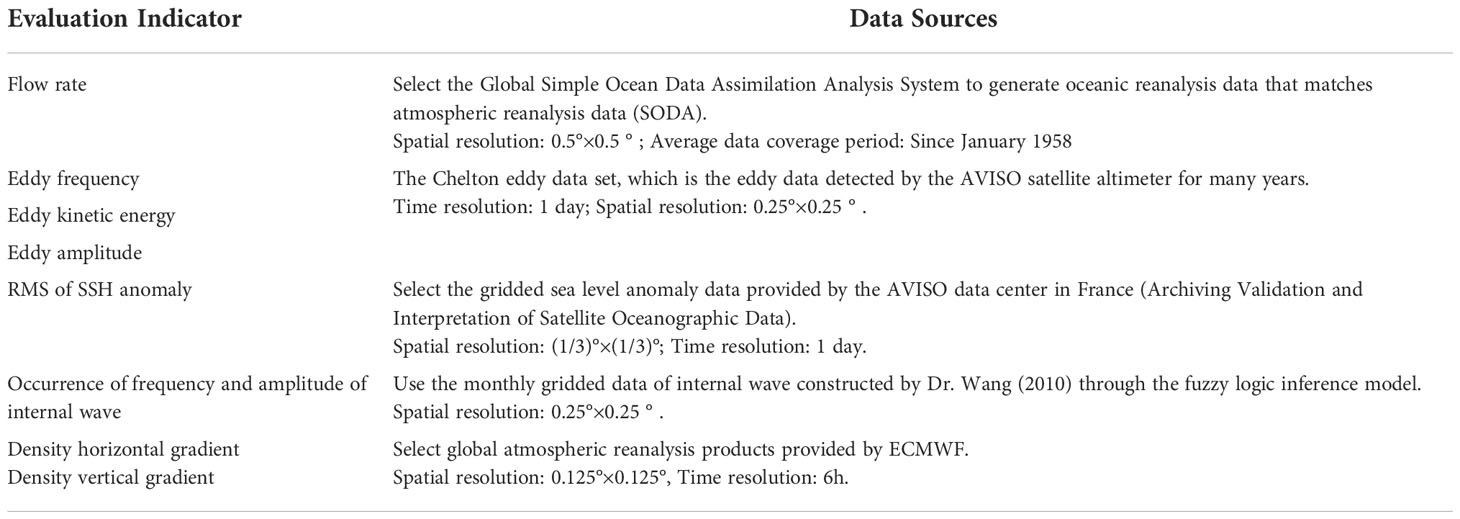
Finally, the evaluation indicator system of UV navigation safety is constructed as shown in Table 1, and the consistency analysis of each evaluation indicator is conducted, in order to clarify the relationship between the indicators and navigation safety. The data sources of environmental variables are shown in the Table 2.
3.2 Indicator discretization
Before evaluation modeling based on DBN, it is necessary to grade the evaluation indicators, that is, to discretize the indicator data. At present, the commonly used discretization methods include expert judgment method, natural breakpoint method, and interval division method (Zeng and Tao, 2013; Li et al, 2021). However, all the above methods achieve the rigid division for assessment indicators, and leave no regard for the uncertainty such as fuzziness and randomness. It is easy to misjudge the level to which the indicator belongs at the level division boundary.
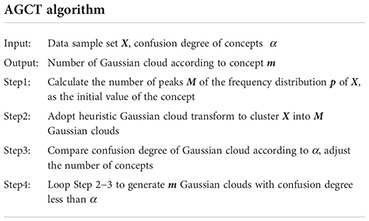
In view of the shortcomings of the above methods, we use the adaptive Gaussian cloud transformation (AGCT) algorithm (Liu, 2015) to divide levels of each evaluation indicator, and then determine the assessment level to which indicator samples belongs, and provide a data basis for network structure and parameter learning. The AGCT algorithm, based on the Cloud model, does not need to specify the number of concepts in advance. Considering the data characteristics of actual samples, it automatically forms multiple categories of concept clouds that conform to the laws of human cognition, thereby automatically dividing the data distribution into different concepts. The specific steps of the AGCT algorithm are presented as follows:
Each indicator has different spatial and temporal resolutions. To facilitate the training of DBN, visualization and comparative analysis of results, regular data processing is first conducted. Original data of each indicator in the experimental area [100°E-125°E,0-30°N] from 2001 to 2013 are read, and the bilinear interpolation method (Zhou and Jing, 2004) is used to interpolate the data to the regular latitude–longitude grid of 0.25° × 0.25° in order to unify the resolution.
Based on the regularized daily indicator data, the AGCT algorithm is used to adaptively divide each indicator into multiple levels, and then the cloud generator is designed based on the numerical characteristics of each cloud, which is used to convert continuous quantitative samples into discrete evaluation levels.
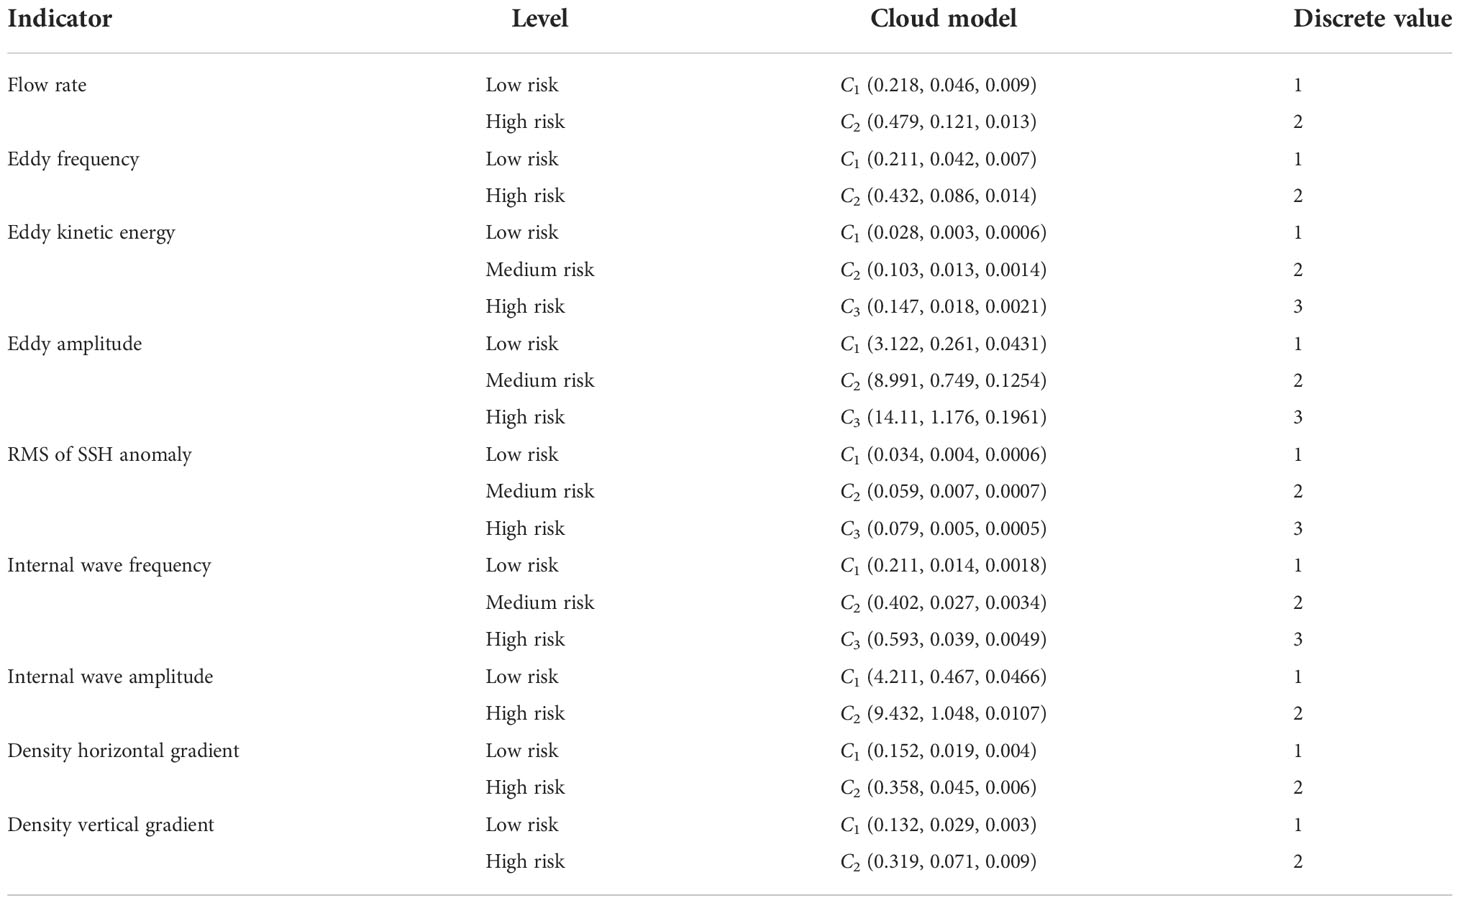
As shown in Figure 2, flow rate, occurrence frequency of mesoscale eddy, amplitude of internal wave, and density gradient are divided into two levels. Kinetic energy of mesoscale eddy, amplitude of mesoscale eddy, RMS of sea surface height anomaly, and occurrence frequency of internal wave are divided into three levels.
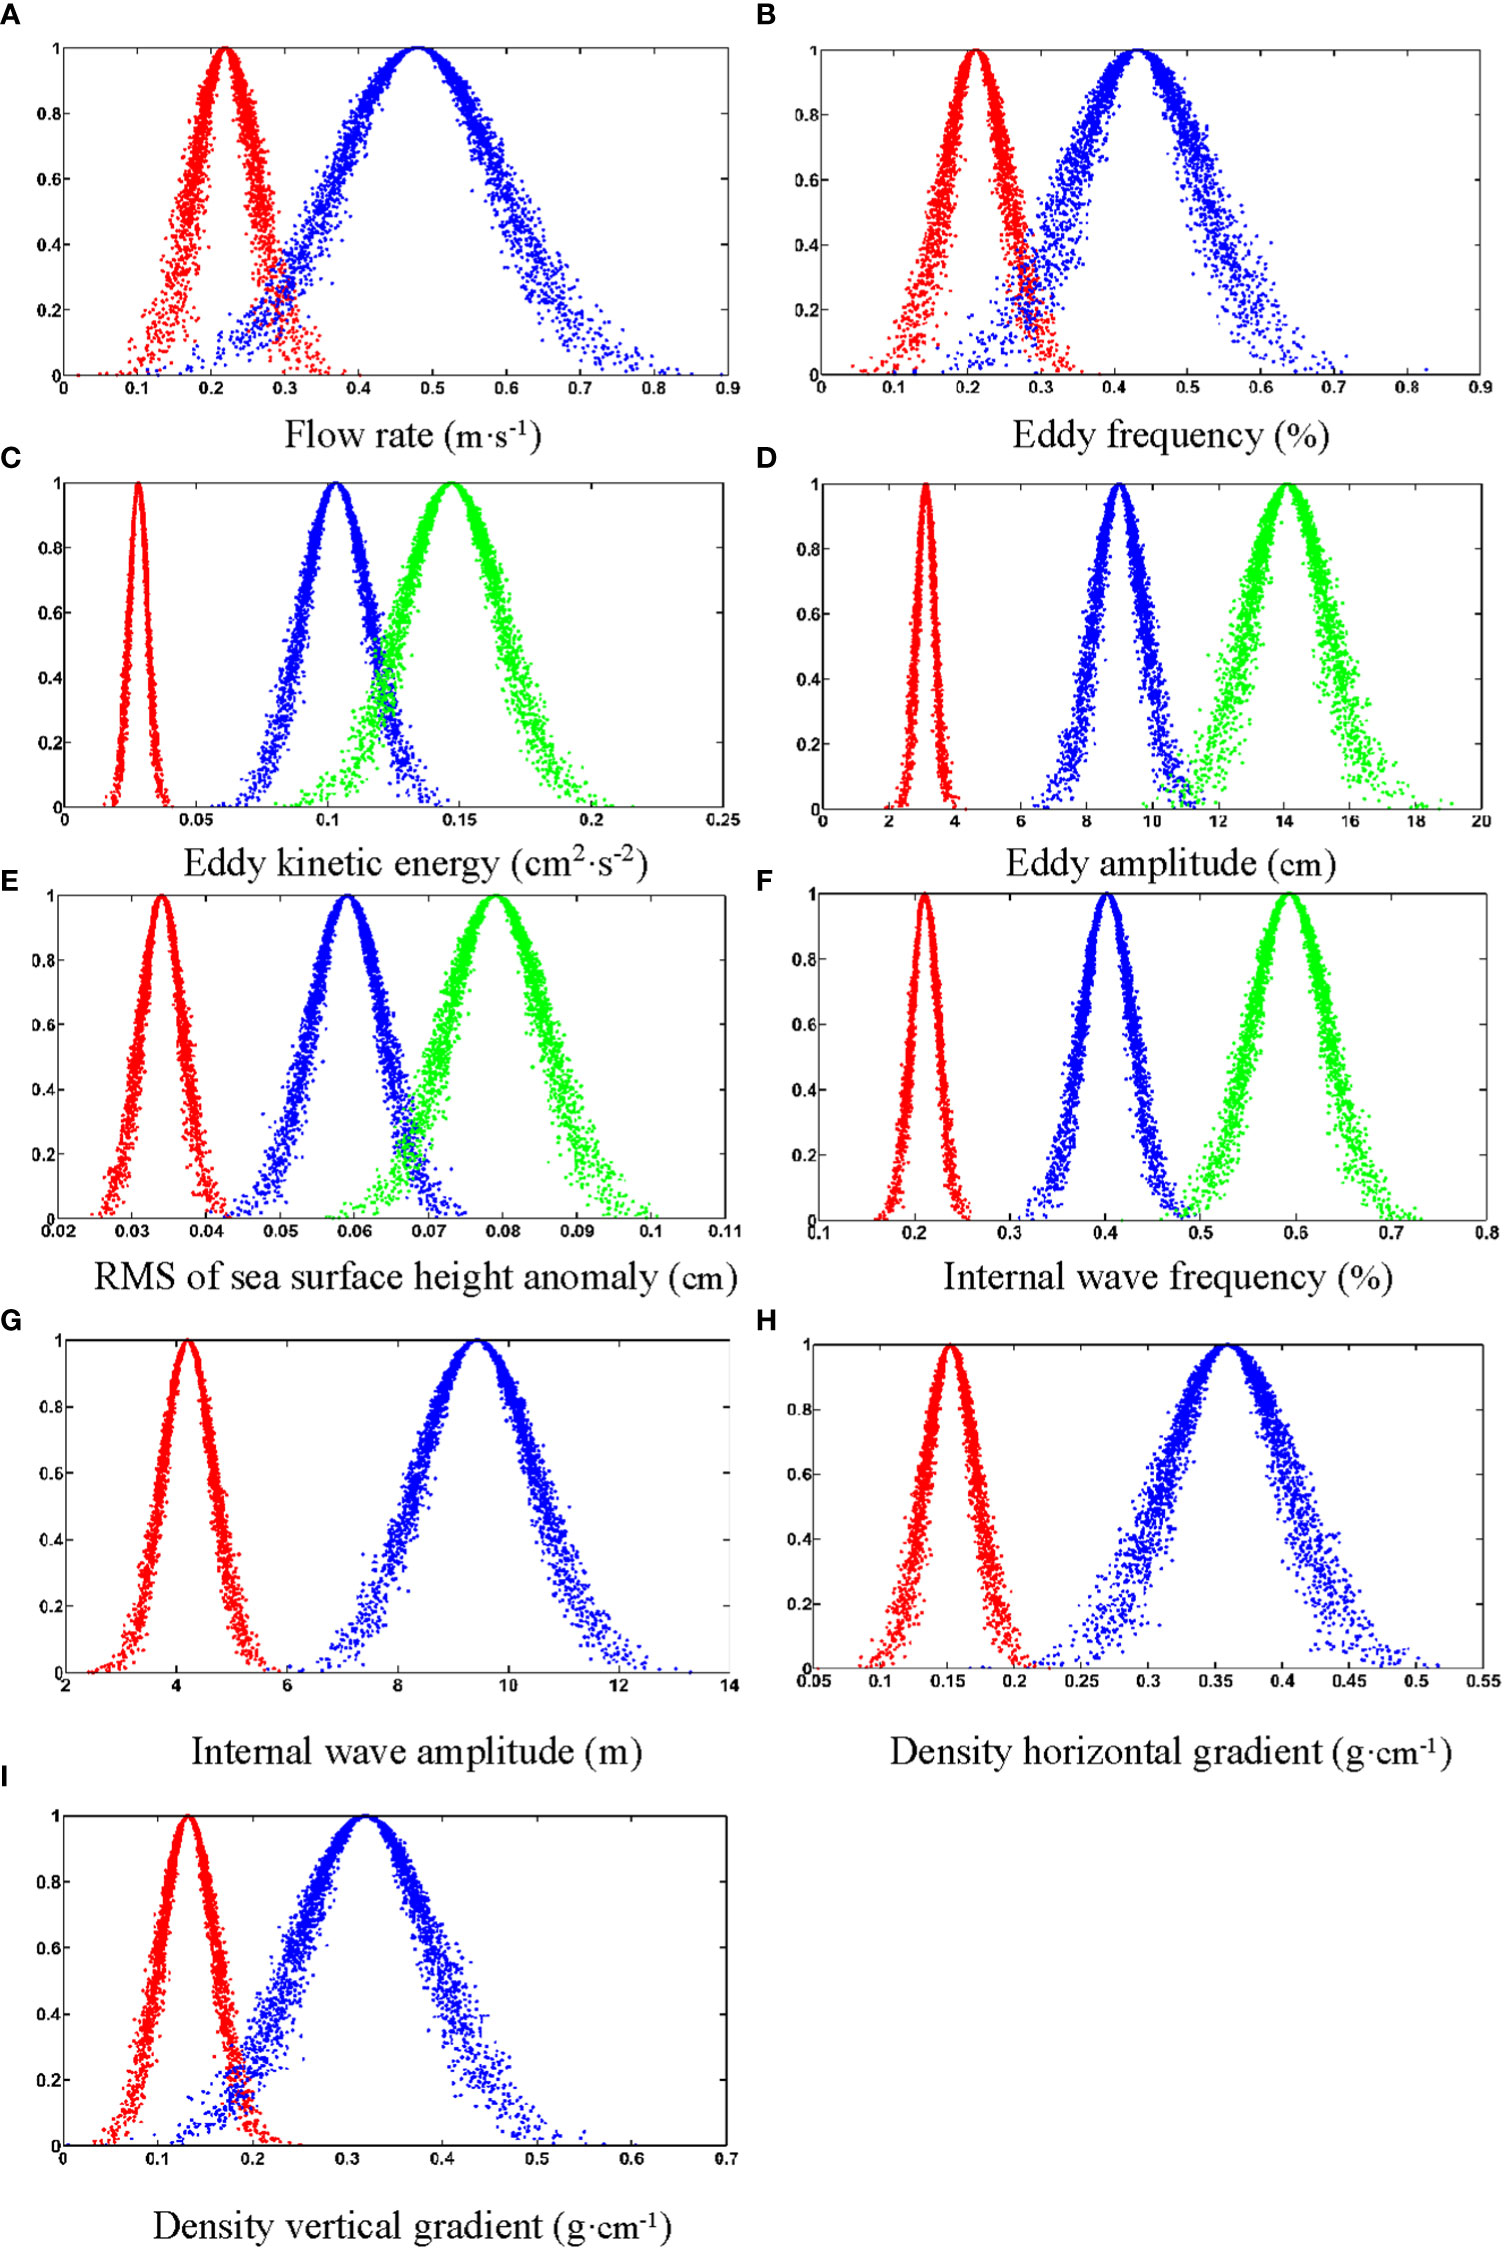
Figure 2 The cloud expression of indicator level. [Flow rate (A); Eddy frequency (B); Eddy kinetic energy (C); Eddy amplitude (D); RMS of SSHa (E); Internal wave frequency (F); Internal wave amplitude (G); Density horizontal gradient (H); Density vertical gradient (I)].
Table 3 shows the cloud-based expression of each indicator level. The means of expression based on the Cloud model comprehensively considers the ambiguity and randomness of the grade division, and effectively expresses the uncertainty at the edge of the level. Based on the above grade division, the indicator data can be converted into discrete grade samples for DBN structure and parameter learning.
3.3 Network learning
3.3.1 Structure learning
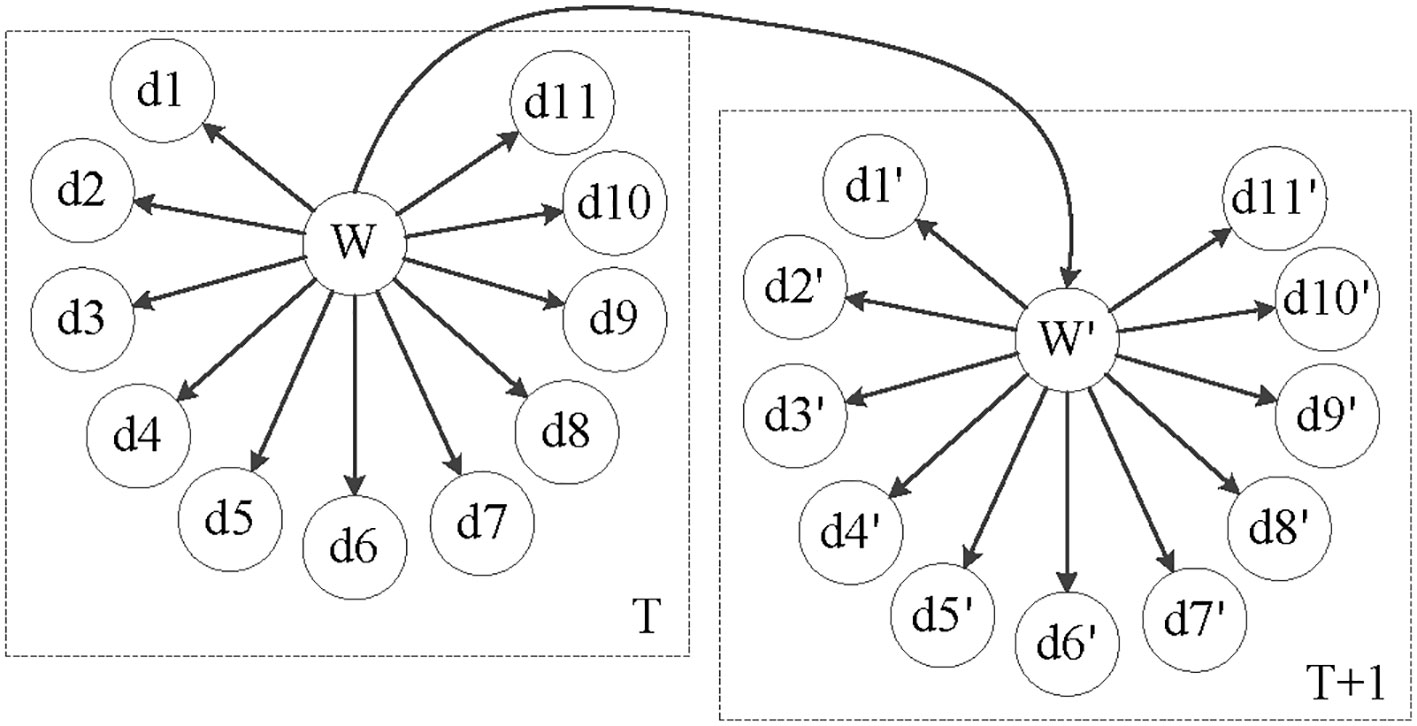
The construction of the network structure needs to determine the causal relationship between child nodes and parent nodes. We take evaluation indicators as network nodes. As for structure learning of DBN, both the initial network structure in the same time slice and the transition network structure between adjacent time slices need to be determined. For the initial network structure, the constructed indicator is taken as the child node of the network, that is, the input node; the UV navigation safety is taken as the parent node, that is, the output node. For the transfer network structure, we focus on the causal association and influence of the navigation safety between the adjacent time slices. With the help of professional expert knowledge, the DBN structure of UV navigation safety assessment is constructed, as shown in Figure 3. It should be noted that the time interval between adjacent time slices in the transfer network is 1 day.
3.3.2 Parameter learning
After the DBN network structure is established, the network parameters can be learned based on the discrete indicator samples and the network structure, that is, the influence relationships among network nodes are quantitatively mined and expressed in the form of conditional probability. Parameter learning requires the determination of observation conditional probability and transition conditional probability (Li et al. 2020). We adopt the learning algorithm based on DS evidence theory, supplemented by variation coefficient (VC) method, Monte Carlo (MC) method and EM algorithm, to learn the conditional probability distribution of nodes. The algorithm flow of parameter learning is shown in Figure 4.
Firstly, the indicator weight is determined by a combination of subjective and objective calculation methods, which has been proposed in our previous study (Li et al. 2021c). The VC method is an objective method for calculating weights, and its basic principle is to determine the weight according to the variability of data sets. When the information entropy reflected by the indicator data is smaller, it shows that the variation degree of the indicator is greater, and the effect of the indicator on the evaluation object is greater, that is, the bigger the weight. Based on the modeling samples, the VC method is used to calculate the objective weight. At the same time, three experts are invited to determine the weight of each indicator according to their experience and knowledge, and the DS evidence theory is used to integrate different expert knowledge to obtain the subjective weight according to DS combination rule. The average of the subjective and objective weight is used as the final weight of each indicator, as shown in Table 4.
Then, the optimal probability distribution of network nodes is learned by combining MC algorithm and EM algorithm. The basic idea of MC algorithm is that when the problem to be solved is the expectancy value of a random variable, the probability of the variable is estimated from the occurrence frequency by means of a random number simulation experiment. We conduct 300 random number experiments to generate the initial probability distribution of each network node, and then use the EM algorithm to perform iterative optimization to determine the optimal probability distribution.
Finally, the weights are integrated into the optimal probability distribution to obtain the weighted probability distribution. Table 5 shows the conditional probability distribution between the input node d1, d2, d3 and the output node W, and Table 6 shows the transition probability distribution P(Wt∥Wt−1) of the output node W. So far, it is completed to construct the DBN model for UV navigation safety assessment.
4 Analysis and discussion of assessment
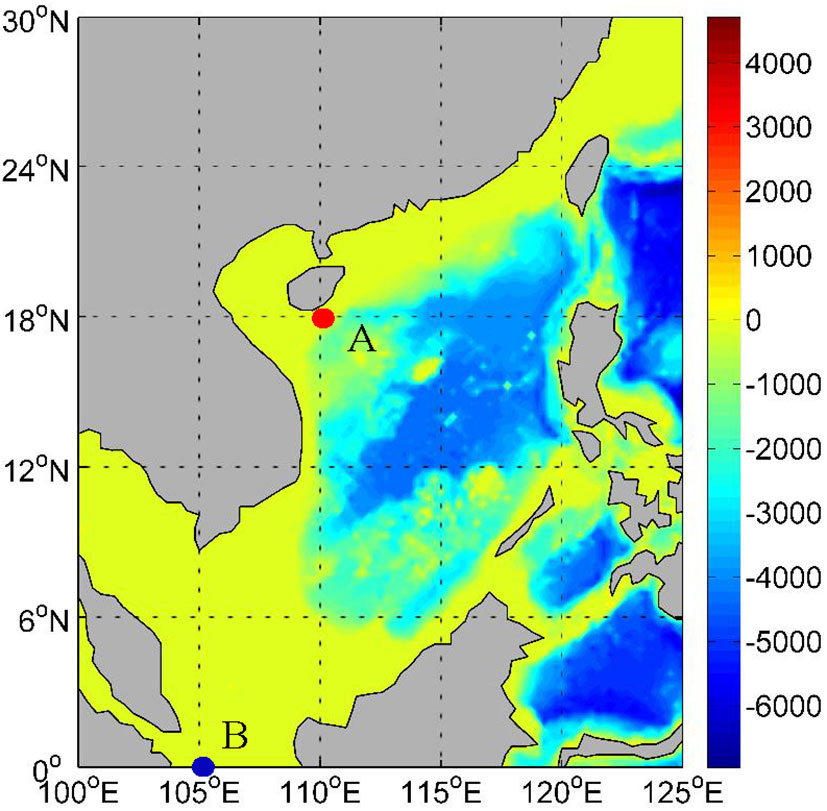
The DBN for the navigation safety has been constructed in Section 3. Input the prior information of the evaluation indicators, and the dynamic evaluation and risk zoning of UV navigation safety could be realized based on Bayesian probabilistic reasoning. In this section, an activity scenario of the UV is assumed, and the proposed navigation safety assessment model is used to conduct a daily probabilistic assessment of the navigation sea area, in order to test the feasibility and effectiveness of the DBN-based model. Now suppose an underwater vehicle: 120 meters long, 10 meters wide, 66 meters of turning radius, 7500 seconds of turning period, and 300 meters of maximum diving depth. This underwater vehicle will sail from position A [110°E, 18°N] to position B [105°E,0] to perform a task in the sea area shown in Figure 5, and the sailing time is from October 4 to 14, 2020.
Based on the cloud generator, the evaluation indicators from October 4 to 14 are discretized and input into the network as hard evidence. Then the joint tree reasoning mechanism is used for the network probabilistic reasoning. The assessment model can output the posterior probability distribution of the navigation safety for 11 consecutive days.
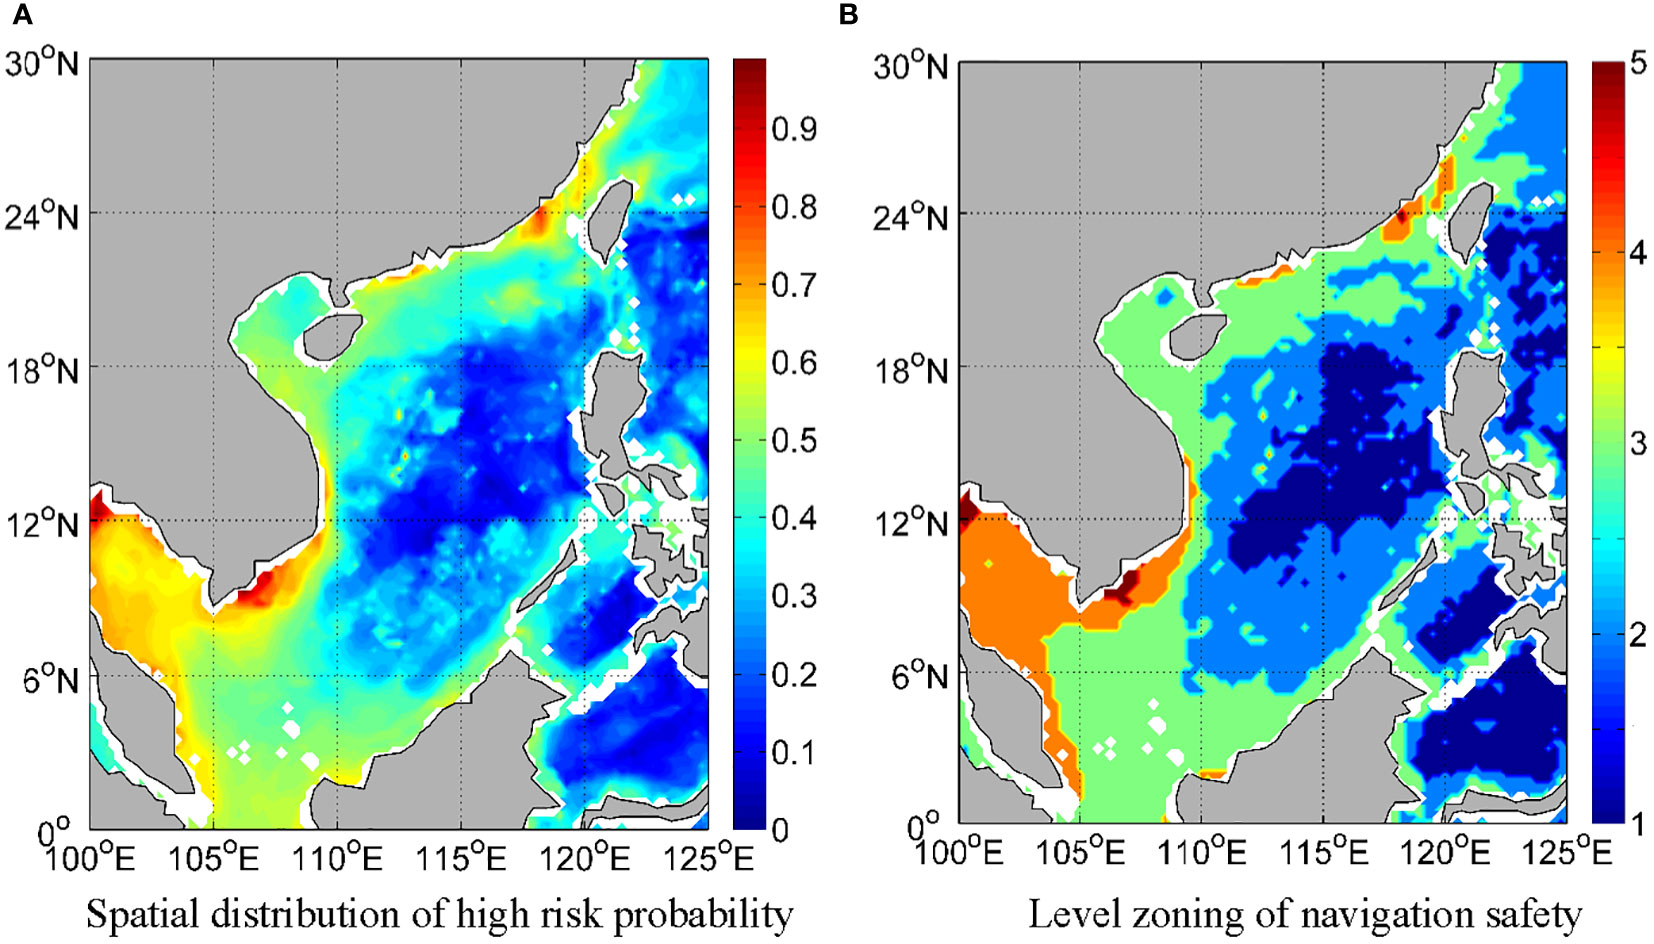
Figure 6 shows the probability distribution of high risk level and the corresponding zoning results. From the figures we can see that, in the South China Sea on October 4th, the near-shore navigation risk is higher than the off-lying sea; The navigation risk in the central of the South China Sea is lower (level 1 and 2),where the probability of high risk is less than 0.2; Taiwan Strait and its southwest side, the southeast coast of Vietnam, and the Gulf of Thailand have the highest level of navigation risk (level 4 and 5),where the probability of high risk is more than 0.75; There is a small high-risk area (level 3 and 4) in the northern part of the South China Sea and the west side of the Luzon Strait.
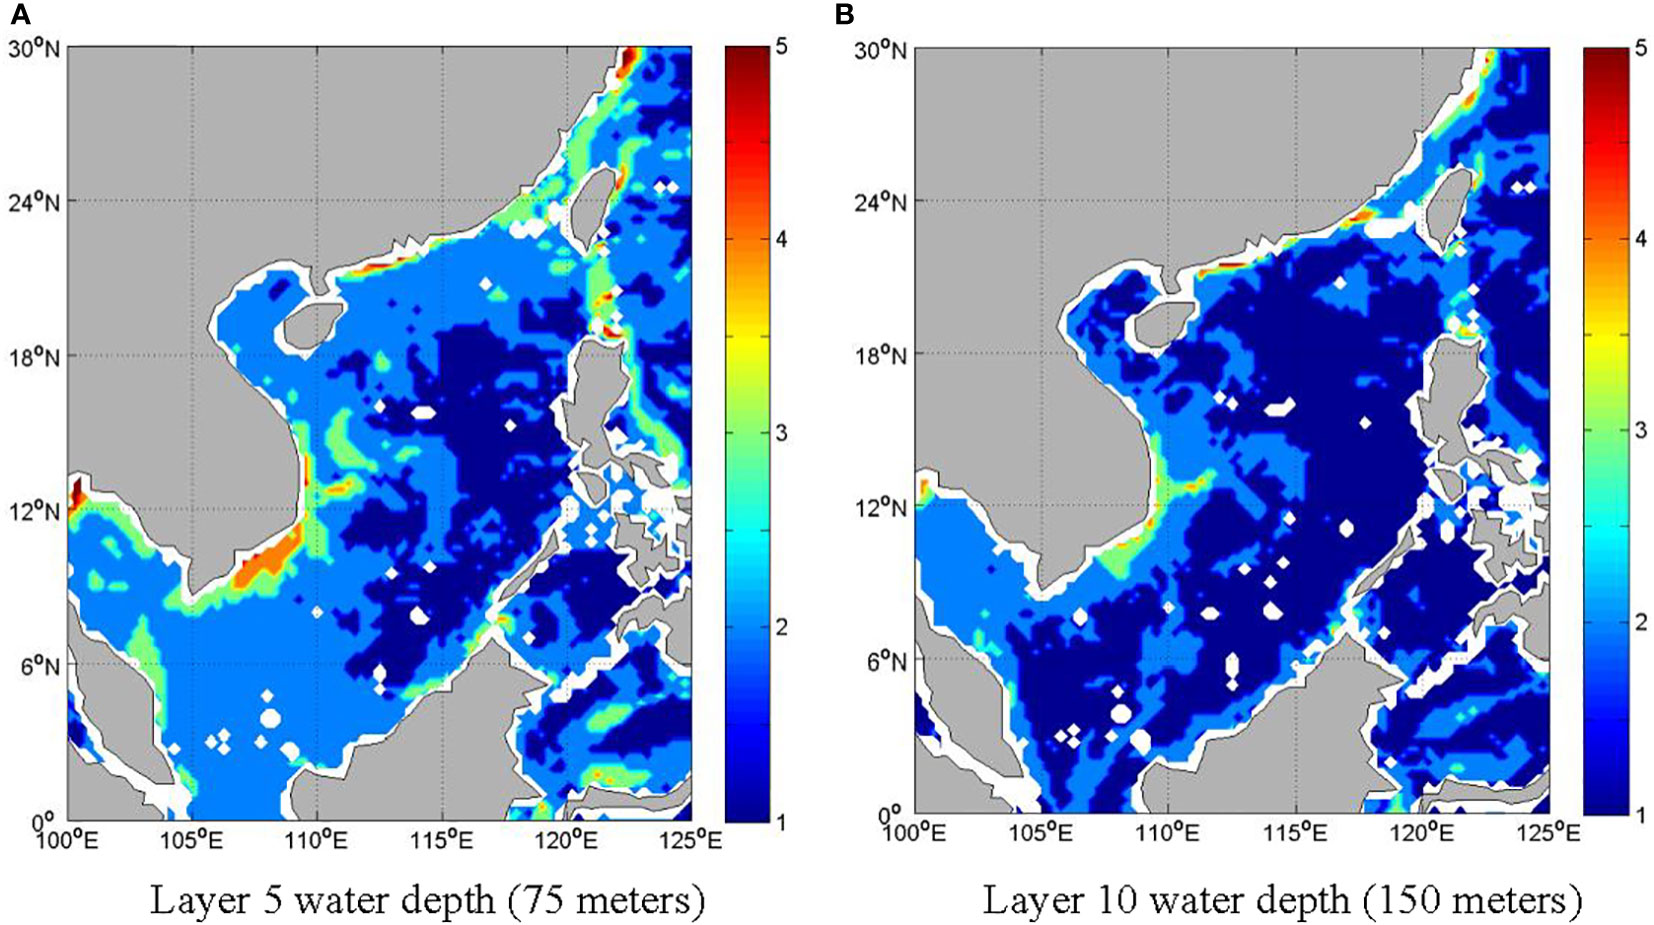
Figure 7 shows the probability distribution of high risk level and zoning results of high-risk navigation in the water depths of 75 meters and 100 meters on October 4th. It can be seen that at a water depth of 75 meters, the southeastern coast of Vietnam has the highest navigation risk (greater than level 4),where the probability of high risk is more than 0.8; Lu The Song Strait and Taiwan Strait also have relatively higher navigation risk (greater than level 3). At a water depth of 150 meters, the navigation risk in the entire South China Sea is low, where the probability of high risk is more than 0.2. There is only a small high-risk area (level 3) along the southeastern coast of Vietnam.
In order to test the validity of the proposed evaluation model, we compare the DBN-based assessment model with the classical FCE method, whose reliability has been well recognized. The FCE method is used to evaluate the UV navigation safety, and Figure 8 shows the evaluation results of a certain position [115°E, 18°N] in the experimental area from October 4 to 14. The risk degree obtained by the FCE method based on expert knowledge is [0.301, 0.299, 0.386, 0.495, 0.523, 0.804, 0.852, 0.816, 0.695, 0.423, 0.331], which is basically consistent with the high-risk probability change trend obtained by the DBN-based model. The comparative results verify the rationality and credibility of our proposed model. However, the FCE method can only get a deterministic evaluation result. By contrast, the DBN model can obtain the probability distribution of different risk levels at the same time, which fully expresses the uncertainty of navigation safety, and the evaluation results are more informative, which is conducive to decision-making and judgment.
Based on the safety assessment of UV navigation, we can conduct the assistant decision-making for its underwater activities. The DBN-based assessment model can dynamically assess the navigation safety according to the changes of the marine environmental factors. In our experiment, we will conduct the path planning of the UV based on the dynamic assessment results of navigation safety updated in real time. The A* algorithm (Ping et al. 2014) is used to optimally plan the route from position A to position B. Figure 9 shows the real-time planning results of the route on the 1st, 3rd, 5th, 7th, 9th and 11th days of the voyage. The navigation safety of the UV evaluated based on DBN will change with the marine environmental field, and the route planning will also be adjusted in real time. Therefore, our proposed assessment model is able to provide the guidance for UV navigation timely.
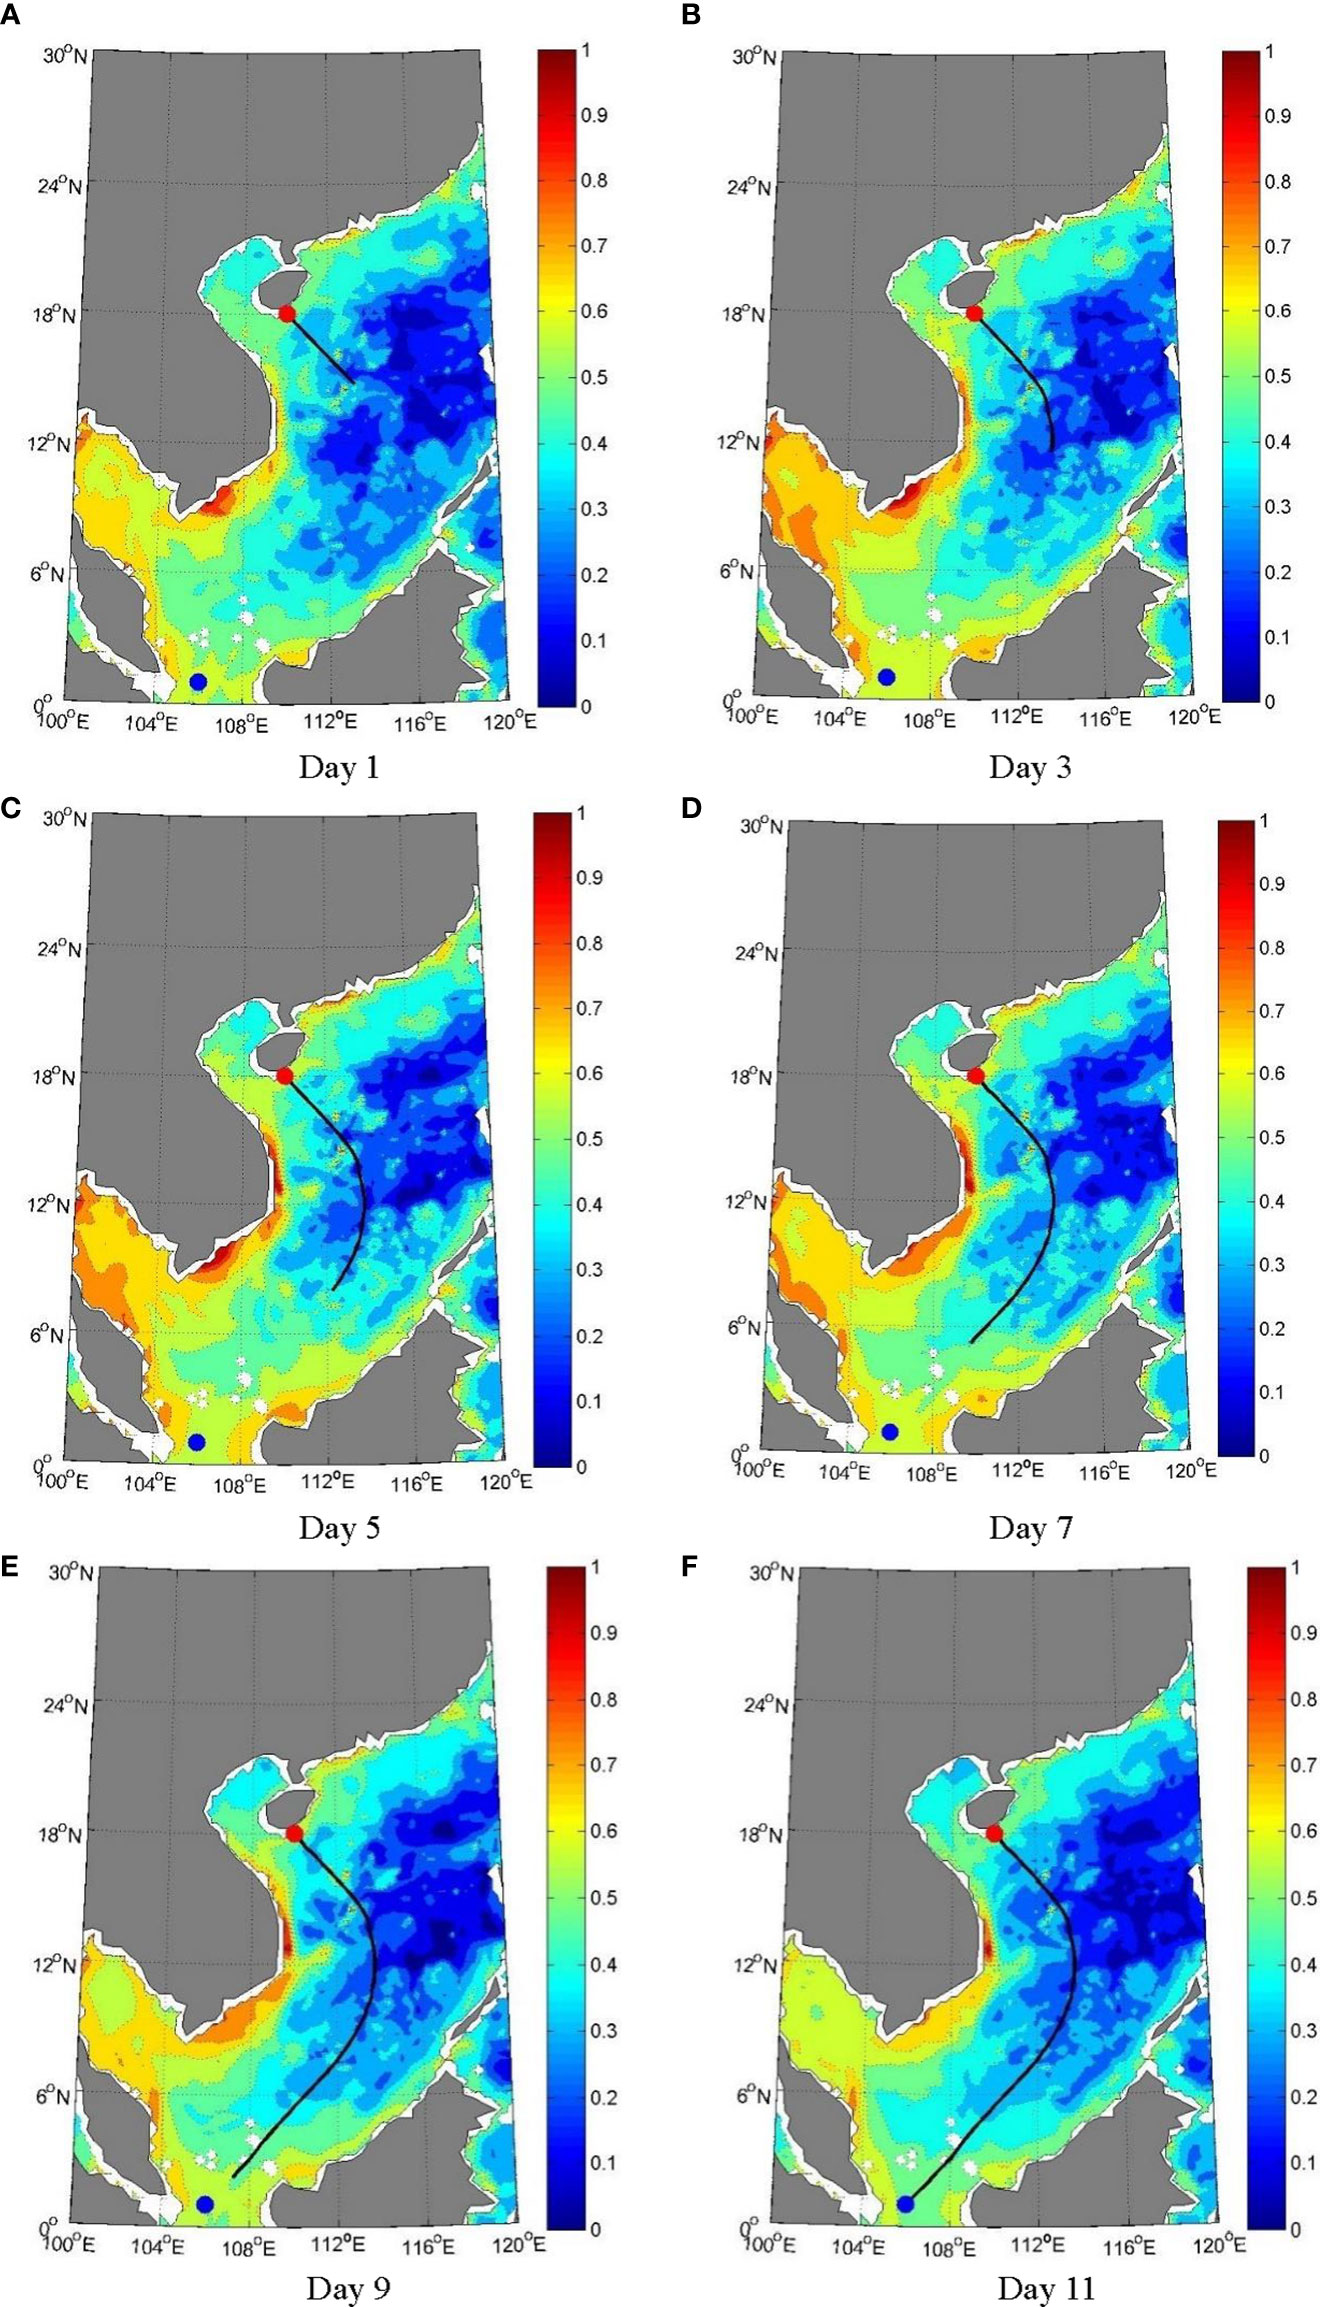
Figure 9 Real-time route planning results. [Day 1 (A); Day 3 (B); Day 5 (C); Day 7 (D); Day 9 (E); Day 11 (F)].
5 Conclusion
The navigation safety assessment of underwater vehicles is a systematic engineering with distinctive characteristics including multi-factor influence, nonlinear correlation and dynamic change. The uncertainty of knowledge and the diversification of information have caused great difficulties to the modeling of navigation safety assessment. In order to solve these problems, this paper introduces the DBN, combined with DS evidence theory and Cloud model, to build a novel assessment model for the UV navigation safety.
By introducing the DS evidence theory, the structure construction and parameter learning of DBN can be completed under the condition of incomplete information, and quantitative data and qualitative information are fused effectively based on DBN. The complex relationships among the evaluation indicators are visually expressed in the form of topology network, and the influencing mechanism between indicators is quantitatively described with conditional probability distribution. Then the quantitative evaluation of the navigation safety of UVs is achieved through network probabilistic reasoning.
Based on probability theory and graph theory, DBN is a quantitative causal graph model, which can not only deal with the uncertainty of complicated problems through probability theory, but also express complex relationships with the help of topology structure. Most importantly, based on prior probability and conditional probability, DBN can effectively achieve the fusion of qualitative knowledge and quantitative data, The proposed DBN-based evaluation model can conduct the three-dimensional, daily and dynamic evaluation of UV navigation safety under the condition of knowledge uncertainty and information diversification. The experimental results show that the proposed model has high reliability and good value of application.
But it should be noted that the network structure of DBN is relatively simple and the construction of causal influence relationships is subjective. We will use the intelligent algorithms for structure learning in following-up studies.
Data availability statement
The original contributions presented in the study are included in the article/supplementary material. Further inquiries can be directed to the corresponding author.
Author contributions
ML and RZ designed the experiments. ML and KL collected data and conducted the experiments. ML and XC analyzed the results. ML wrote the paper. All authors contributed to the article and approved the submitted version.
Funding
This work was supported by the National Natural Science Foundation of China (No. 41976188; No. 41775165; No. 51609254; No. 62073332).
Conflict of interest
The authors declare that the research was conducted in the absence of any commercial or financial relationships that could be construed as a potential conflict of interest.
Publisher’s note
All claims expressed in this article are solely those of the authors and do not necessarily represent those of their affiliated organizations, or those of the publisher, the editors and the reviewers. Any product that may be evaluated in this article, or claim that may be made by its manufacturer, is not guaranteed or endorsed by the publisher.
References
Aven T., Baraldi P., Flage R. (2014). Evidence theory for treating uncertainty (New York: John Wiley & Sons, Ltd).
Chickering D. M., Meek C., Heckerman D. (2012). Large-Sample learning of Bayesian networks is NP-hard. J. Mach. Learn. Res. 5 (9), 13–21. doi: 10.1007/s11222-019-09857-1
Dempster A. P. (1967). Upper and lower probabilities induced by a multivalued mapping. Ann. Math Stat. 38 (2), 325–339. doi: 10.1016/j.jmaa.2017.10.006
Fu X. Y. (2012). Research on marine battlefield environment assessment method for submarine navigation safety (Harbin: Harbin Engineering University).
Jia R. F. (2018). Application of DS evidence theory in marine environmental security situation assessment (Harbin: Harbin Engineering University).
Kolluru R. V. (1996). Risk assessment and management handbook: for environmental, health, and safety professionals. Eur. Phys. J. B 85 (6), 1–6. doi: 10.1016/S0957-5820(97)70646-3
Li M., Hong M. (2018b). Assessment and prediction of natural environment of naval battle field based on dynamic Bayesian network. Military Operations Res. Syst. Eng. 32 (1), 7. doi: 10.3969/j.issn.1672-8211.2018.01.007
Li M., Hong M., Zhang R. (2018a). Improved Bayesian network-based risk model and its application in disaster risk assessment. Int. J. Disaster Risk Sci. 9 (2), 237–248. doi: 10.1007/S13753-018-0171-Z
Licéaga-Castro E, Licé́aga-Castro J, Ugalde-Loo CE, Navarro-Ló́pez EM (2008). Efficient multivariable submarine depth-control system design. Ocean Eng. 35 (17), 1747–1758. doi: 10.1016/j.oceaneng.2008.08.018
Liu C. H., Chen B., Gao G. X. (2006). Analysis of the influence of ocean internal wave on submarine safety. Proc. 3rd Military Maritime Strategy Dev. Forum Xiamen 1(2), 670–673.
Liu S. M., Song J. (2008). Submarine navigation safety battlefield marine environment assessment. Command Control Simulation 17 (3), 16–29.
Liu Y C. H. (2015). An adaptive multi-granularity concept extraction method: Gaussian cloud transform. Comput. Eng. Appl. 51 (9), 1–8. doi: 10.3778/j.issn.1002-8331.1407-0314
Li M., Zhang R., Liu K. F. (2020). A new ensemble learning algorithm combined with causal analysis for Bayesian network structural learning. Symmetry 12 (12), 2054. doi: 10.3390/SYM12122054
Li M., Zhang R., Liu K. F. (2021a). A new disaster assessment model combining Bayesian network with information diffusion. J. Mar. Sci. Eng. 9, 640. doi: 10.3390/jmse9060640
Li M., Zhang R., Liu K. F. (2021b). Expert knowledge-driven Bayesian network modeling for marine disaster assessment under the small sample condition. Front. Mar. Sci. 9, 799141. doi: 10.3389/fmars.2022.799141
Li M., Zhang R., Liu K. F. (2021c). Risk assessment of marine environments along the south China Sea and north Indian ocean on the basis of a weighted Bayesian network. J. Ocean Univ. China 20 (3), 521–531. doi: 10.1007/s11802-021-4631-5
Pearl J. (1998). “From Bayesian networks to causal networks,” in Mathematical models for handling partial knowledge in artificial intelligence (New York: Springer US).
Ping L. I., Zhu J. Y., Peng F. (2014). Path planning based on visibility graph and a* algorithm. Comput. Eng. 4 (9), 34–46. doi: 10.1016/j.apor.2021.102887
Sridharan D. (2015). Score-level multibiometric fusion based on dempster-Shafer theory incorporating uncertainty factors. IEEE Trans. human-machine Syst. 11 (9), 211–225. doi: 10.1109/THMS.2014.2361437
Wang Y. L., Yuan B., Zhu S. H. Q. (2010). Influence of marine environment on submarine activity. Ship Sci. Technol. 32 (6), 42–56. doi: 10.3969/j.issn.1003-0239.2008.02.012
Xu Y. F., Hu K., Liu C. B. (2012). Modeling and simulation of disturbed movement of submarine in ocean front of seawater density. Ship Ocean Eng 7 (3), 97–110. doi: 10.3404/j.issn.1672-7649.2012.10.019
Xu B., Yang X. D. (2015). Marine environmental impact assessment of submarine navigation safety based on vague sets. Ship Sci. Technol. 40 (8), 53–67. doi: 10.3404/j.issn.1672-7649.2015.08.037
Zeng H. W., Tao L. (2013). The comprehensive performance evaluation of the high-tech development zone: Analysis based on the natural breakpoint method. Stat Inf. Forum 11 (2), 65–79. doi: 10.3390/w14142212
Zhang SH Z. H. (2003). Research on application of knowledge discovery decision based on Bayesian network (Dalian: Dalian University of Technology).
Zhao H., Mi J., Liang M. (2022). A multi-granularity information fusion method based on logistic regression model and dempster-Shafer evidence theory and its application. Int. J. Mach. Learn. Cybernetics 13 (10), 3131–3142. doi: 10.1007/s13042-022-01584-w
Keywords: underwater navigation, safety assessment, Bayesian network, uncertainty, incomplete information
Citation: Li M, Zhang R, Chen X and Liu K (2022) Assessment of underwater navigation safety based on dynamic Bayesian network facing uncertain knowledge and various information. Front. Mar. Sci. 9:1069841. doi: 10.3389/fmars.2022.1069841
Received: 14 October 2022; Accepted: 21 November 2022;
Published: 05 December 2022.
Edited by:
Wei-Bo Chen, National Science and Technology Center for Disaster Reduction(NCDR), TaiwanCopyright © 2022 Li, Zhang, Chen and Liu. This is an open-access article distributed under the terms of the Creative Commons Attribution License (CC BY). The use, distribution or reproduction in other forums is permitted, provided the original author(s) and the copyright owner(s) are credited and that the original publication in this journal is cited, in accordance with accepted academic practice. No use, distribution or reproduction is permitted which does not comply with these terms.
*Correspondence: Ren Zhang, ywlypaper@163.com
 Ming Li
 Ren Zhang2*