Influence of the interannual variability of the Kuroshio Extension on the Mediterranean trough in the cold season
 Yuxi Jiang
 Jianxiang Sun
 Huan Li
 Yanshuo Wang
- 1National Marine Data and Information Service, Tianjin, China
- 2Laboratory of Science and Technology on Marine Navigation and Control, Tianjin Navigation Instrument Research Institute, Tianjin, China
- 3Physical Oceanography Laboratory, Ocean University of China, Qingdao, China
The impacts of the Kuroshio Extension (KE) interannual fluctuation on the Mediterranean trough (MedT) and associated Euro-Mediterranean climate in wintertime are analyzed in this study. It appears that when the KE index is positive (corresponds to a stable KE state with sharp sea surface temperature front and subsided oceanic eddies), the MedT is observed to be stronger in the west of its climatological position, resulting in a colder condition to the west of the Black Sea and more precipitation in the East Mediterranean and Anatolia Plateau. The opposite atmospheric pattern holds when the KE index is negative (unstable KE state). The empirical orthogonal function analysis is performed on 500-hPa geopotential height to obtain the dominant modes of MedT. The results show the KE index is significantly correlated with the intensity and zonal displacement of MedT, with correlation coefficients of 0.57 and 0.40, respectively. The low-frequency Rossby wave activity and high-frequency eddies are revealed as the prominent contributors to this co-variability between the KE and MedT. The upward turbulent heat flux transport from the ocean to the atmosphere strengthened by the stable KE activates the Rossby waves propagating upward and westward to the MedT region, contributing to approximately 30% of the MedT deepening. Meanwhile, the KE-driven Rossby waves intensify the background baroclinicity to the north of the Mediterranean Sea and thus enhance the transient eddy activity, consequently leading to another 20% of the MedT amplification via the eddy–mean flow interaction. The findings highlight the impacts of the KE state on the meteorological conditions in the Euro-Mediterranean region, which can potentially optimize the forecast accuracies of the MedT and associated Euro-Mediterranean climate variability.
Introduction
The Mediterranean trough (MedT), as the semipermanent trough system in the middle and upper troposphere over eastern Europe and the Mediterranean region in boreal winter, is featured with a pronounced northeast–southwest-tilted axis and is closely linked to the ridge covering the west coast of Europe (Luo et al., 2015). The baroclinic disturbances from the British Isles develop into the equivalent barotropic signals, resulting in a downstream energy dispersion of quasi-stationary Rossby waves and thus sustaining the MedT (Kushnir and Wallace, 1989; Ziv et al., 2006). Many studies reported that the MedT has prominent impacts on the Euro-Mediterranean winter climate, including temperature, precipitation, and extreme weather processes. The MedT, together with the western Europe ridge, prompts a 500-hPa geopotential height dipole structure over the Euro-Mediterranean region, resulting in the reverse winter state between the south Levant (wet and cold) and western Europe (dry and warm) (Ziv et al., 2006). This dipole pattern, however, also modulates the west–east displacement and intensity of the MedT and associated climate. When the region to the west of the Mediterranean Sea is controlled by the negative anomaly of the dipole pattern, the MedT is displaced westward with stronger intensity compared to its climatological condition, thus promoting a colder western Europe and northwestern Africa, a warmer northeastern Africa and Middle East, and a wetter Balkan, Italian, and Anatolian peninsulas (Sen et al., 2019). The robust variations of MedT can lead to extreme rainfall events in Turkey (Lolis and Türkeş, 2016) and extreme warm spell cases in eastern Anatolia (Bozkurt et al., 2019). Given the significant role MedT played on Euro-Mediterranean climate variability, it is crucial to understand the physical processes influencing the MedT, as it can pose serious threats to scarce water resources, human livelihoods (Cook et al., 2016), and vulnerable eco-system (Islam et al., 2021) in this region.
The MedT and the associated Euro-Mediterranean climate in wintertime are largely controlled by the large-scale circulation and synoptic weather processes (Sen et al., 2019). The Hadley cell brings upper westerly winds to much of the region with descending motion, resulting in a surface high-pressure system in subtropical regions. The meridional displacement of Hadley cells generally determines the dry or wet conditions in the Mediterranean Basin by modifying the large-scale moisture flux (Şahin et al., 2015). The Siberian High is accepted as another primary climate system influencing the Euro-Mediterranean climate. The simultaneous westward-positioned MedT brings more cold and snowy weather to eastern Europe and Asia Minor when the Siberian High extends westward (Türkes, 2010). The subtropical cyclones, which generate from the North Atlantic and western Mediterranean regions, transport more moisture to the southern part of the Euro-Mediterranean region and therefore induce more rainfall and snow storms in this region (Luo et al., 2015; Yao et al., 2016).
The teleconnection patterns are also referred to as dominant factors that shape the MedT and related Euro-Mediterranean climate. El Niño Southern Oscillation (ENSO) plays a key role in the downstream rainfall, with more precipitation over the western Mediterranean in the preceded autumn and early winter, while the precipitation is observed to be less over the eastern Mediterranean (Mariotti et al., 2002; Shaman and Tzipperman, 2011). Ziv et al. (2006) pointed out that the weakened MedT is associated with the warm sea surface temperature (SST) anomaly of the Pacific Warm Pool. The southward-displaced North Atlantic Oscillation (NAO) of positive phase, on the one hand, prompts an anomalous Europe blocking dipole pattern tilting northeast-southwest, resulting in a deepened MedT and thus bringing cold air surges and snowfall to southeastern Europe and the Middle East (Luo et al., 2015). On the other hand, the positive NAO favors a wet and warm (dry and cold) condition over northern Europe (Mediterranean Basin) (Visbeck et al., 2001). The Arctic Oscillation (AO) is also found to be related to the climate in midlatitudes. The negative phase of AO is accompanied by decelerated westerlies and stronger meridional atmospheric circulation over the midlatitudes, which is conducive to the occurrence of atmospheric blocking events and stronger MedT (Cheung and Zhou, 2016; He et al., 2017). This situation strengthens the cold air advection from the polar region, thus leading to cold spells in Europe and the Middle East (Buehler et al., 2009; Demirtas, 2017).
The Kuroshio Extension (KE) is characterized by an interannual fluctuation between a stable dynamic state (in which the steady KE jet generates a strong SST front and inhibits oceanic eddies) and an unstable dynamic state (where the unsteady KE jet is accompanied by a weaker SST front and substantial oceanic eddies) (Qiu et al., 2014). Many studies have pointed out that this KE shift has crucial influences on the atmospheric state on various scales via different physical mechanisms. On the local scale, the KE variability can modulate the overlying atmospheric boundary layer and clouds within through varying the heat fluxes passing the sea–air interface (Ma J. et al., 2015; Wang and Liu, 2015; Jiang et al., 2019; Wang et al., 2019), while on the basin scale, the cyclogenesis of North Pacific storm track is intensified by the unstable KE via the moist baroclinic instability (Ma X. et al., 2015; Ma et al., 2017). The KE-induced storm-track modulation, further, is one of the key determinants in altering the large-scale circulation over the North Pacific and the Arctic through the eddy–mean flow interaction (O’Reilly and Czaja, 2015; Omrani et al., 2019), along with the Rossby wave activity and direct thermal forcing driven by the KE fluctuation (Révelard et al., 2016; Sun et al., 2016). Sun et al. (2022) demonstrated that the KE-caused atmospheric disturbance can spread throughout the North Hemisphere midlatitudes. The stable KE generates the SST anomalies and associated turbulent heat flux anomalies, exciting a Rossby wave train that propagates eastward and modulates the storm track over the midlatitudes in the North Hemisphere, resulting in a deeper East Asian trough (EAT) and stronger East Asian winter monsoon.
Therefore, the KE is one of the prominent phenomena in the ocean worldwide and a significant driver of the North Hemisphere climate; however, so far, few of the existing studies have explored whether the KE fluctuation can exert influences on the MedT and associated Euro-Mediterranean climate. In addition, Figure 6 of Sun et al. (2022) implies a possible relationship between the KE dynamic state and MedT, giving us the interest to dig deep into the linkage between them. Hence, the main objectives of the present study are to investigate the relationship between KE variability and MedT and explore the underlying physical mechanisms. Section 2 presents the data and methodology employed in this study. We analyze the results in Section 3 and summarize and discuss them in Section 4.
Data and methodology
Data
We used the daily-mean sea surface height anomaly (SSHA) with a 0.25° × 0.25° resolution provided by the Archiving, Validation, and Interpretation of Satellite Oceanographic (AVISO) (Ducet et al., 2000). The sensible and latent heat fluxes are from the Objectively Analyzed Air–Sea Fluxes (OAFlux) conducted by the Woods Hole Oceanographic Institution, available in daily mean on a 1° × 1° grid (Yu and Weller, 2007). To obtain the anomalous atmospheric circulation related to the KE fluctuation, the reanalysis states, including SST, air temperature, geopotential height, snow cover, precipitation, and horizontal winds from the fifth major global ReAnalysis data from the European Centre for Medium-Range Weather Forecasts (ERA5), are analyzed in this study. The ERA5 dataset has hourly intervals, with a horizontal resolution of 31 km and 137 levels in the vertical (https://www.ecmwf.int/en/newsletter/147/news/era5-reanalysis-production). The present study focuses on the wintertime spanning from 1 December to 28 February (DJF) of the following year. Here, the first winter of 1993 denotes December 1993 and January and February 1994, and a total of 27 winters from 1993 to 2019 are analyzed in this study. To eliminate disturbances from the climate trend, all the data are linearly detrended before proceeding with further analysis. Since the KE index has non-negligible autocorrelations, a Student’s t-test with an effective degree of freedom proposed by Bretherton et al. (1999) is used to evaluate the significance of variable anomalies.
Methodology
Following Qiu et al. (2014), the KE index (KEI), defined as the 1-year lowpass-filtered SSHA averaged in 31°–36°N, 140°–165°E, is employed to characterize the interannual KE dynamical state. Previous studies have extensively used this identification method to fully capture the KE variation feature (e.g., Sun et al., 2022; Usui and Ogawa, 2022).
The trough-tracking algorithm proposed by Sen et al. (2019) is applied to extract the MedT axis in a region of 23°–57°N and 0°–70°E where the MedT is mostly observed. First, we locate the minimum z500 at a specific latitude of 39.75°N between 0°E and 70°E. Then, the sequential minimum z500 to the south and north is detected in a zonal length of 12° with the minimum at the previous latitude as the center. If no minimum can be located or the detected point is out of the domain interested in a direction, the algorithm is determined in this direction. Finally, we connect all the points selected to obtain the MedT axis.
We conducted the empirical orthogonal function (EOF) technique in the MedT region (25°–55°N, 0°–65°E) to extract the dominant modes and principal components (PCs) of the 500-hPa geopotential height variability of the MedT. The EOF analysis has been widely used in obtaining the dominant modes of atmospheric fields of various monsoon systems, such as the East Asian winter monsoon (Chen et al., 2014; Shi, 2021), EAT (Wang et al., 2009; Leung and Zhou, 2015; Chen et al., 2018), and MedT (Sen et al., 2019).
As the upper troposphere is likely to be equivalent barotropic over the midlatitudes, the atmospheric anomalous processes are explained through the barotropic vorticity equation. The anomalous Rossby wave source (RWS) is diagnosed as follows (Sardeshmukh and Hoskins, 1988):
where Vχ is the divergent winds and ξ is the absolute vorticity. The overbars and primes denote the wind-mean states and perturbations from the mean states, respectively.
In the middle and upper troposphere, the wave activity flux (WAF) is employed to calculate the wave propagation of stationary eddies on the zonally varying basic flow (Takaya and Nakamura, 1997; Takaya and Nakamura, 2001). The phase-independent WAF, which parallels its local group velocity, is used to depict the Rossby wave activity associated with the KE fluctuation. The formula is as follows:
Here, (u,v) is the winter-mean horizontal wind over the period from 1993 to 2019, is the speed for climatological horizontal flow, ψ' is the geostrophic stream function perturbation, f is the Coriolis parameter, R is the gas constant, p is the air pressure, and is based on the temperature (T ) and the specific heat at constant pressure (Cp ). The subscripts x , y , and p indicate the partial derivatives along the zonal, meridional, and vertical directions, respectively.
The maximum Eady growth rate (EGR), proposed by Hoskins and Valdes (1990), is used to estimate the atmospheric baroclinicity and determine whether the atmospheric dynamical state is conducive to the weather system origination. We calculated the EGR at the 300-hPa level using the equation of
with f being the Coriolis parameter, N being the Brunt–Väisälä frequency, U being the horizontal wind speed, and z being the vertical height.
To effectively extract the synoptic-scale transient eddies, the meridional wind variance v'v' at the 300-hPa level subject to a 2.5–6-day bandpass 31-point filter (Sun and Zhang, 1992) is applied to represent the storm track.
To evaluate the geopotential height anomaly generated by low-frequency atmospheric waves and high-frequency eddies associated with the KE variation, we applied the equation given by Lau and Nath (2014) to calculate the Rossby wave-induced and transient eddy-induced geopotential height tendency at the 500-hPa level. The equation is shown as follows:
where Z is the monthly geopotential height, f is the Coriolis parameter, g is the gravitational acceleration setting to 9.80 m/s2, and V' and ζ‘ are the wind and relatively vorticity disturbances, respectively, subjected to an 8–90-day Butterworth bandpass filtering for Rossby wave and a 2.5–6-day bandpass filtering for synoptic eddies. The contributions of Rossby waves and transient eddies to the observed geopotential height tendency can be quantified by comparing their magnitudes and spatial patterns. This method has been extensively used in calculating the effects of Rossby waves and transient eddies on the geopotential height anomaly (Song et al., 2016; Sun et al., 2022).
Estimating the atmospheric responses
Over midlatitudes, the feedback response of the atmosphere to the extratropical forcing in the ocean and land is difficult to evaluate, because the atmospheric response, to a large extent, is overwhelmed by the tropical remote forcing (i.e., ENSO) and atmospheric internal variability. To extract the midlatitude oceanic feedback on the atmosphere, we follow the lag regression approach of Révelard et al. (2016), which separates the slow atmospheric response to the SST from the rapid atmospheric internal variability. Hence, any atmospheric variable x(t) consists of three components, as follows:
Here, αKEI(t−2) and βe(t−1) represent the quasi-equilibrium atmospheric responses to the KE 2 months earlier and ENSO 1 month earlier, respectively, with and β as the feedback parameters, KEI as the KE index described above, and e as the Niño 3.4 index (defined as the 5-month running mean SST over the region of 5°S–5°N, 170°–120°W). n(t) represents the atmospheric white noise. It generally takes 1–2 months for the extratropical SST-forced baroclinic signal to fully transform into the large-scale equivalent barotropic circulation and reach its maximum amplitude via the transient eddy–mean flow interactions (Liu et al., 2007; Ferreira and Frankignoul, 2008; Liu et al., 2008; Révelard et al., 2016). Indeed, the KE fingerprint on the large-scale atmospheric circulation has some persistence as the atmosphere lags the ocean by 1 to 6 months, but the strongest imprint emerges when the delay is set to be 2 months (not shown). In addition, we have assumed a 1-month delay for ENSO signals reaching the Mediterranean region, considering the maximum ENSO teleconnection patterns. For the above reasons, the atmosphere response times to the KE and ENSO are regarded as 2 and 1 months, respectively, in our paper, consistent with the lag time applied in Révelard et al. (2016) and Sun et al. (2022).
To access the feedback parameter α , first, we eliminate the ENSO signal, yielding the ENSO-filtered atmospheric variables and KEI , expressed as follows:
Here, A=x(t),e(t−1)/e(t−1),e(t−1) , and B=KEI(t), e(t+1)/e(t+1), e(t+1), with p,q representing the covariance of p and q . Then, given that the KE variability has no correlation with the atmospheric intrinsic variability, we substitute the and KEI in Equation (5) with Equations (6) and (7), leading to the following:
After multiplying on two sides of Equation (8), we take the ensemble average and obtain as follows:
The feedback parameter α for the atmospheric variable shows similar spatial patterns with the composite differences between the KE stable period (SP) and unstable period (USP) (Supplementary Figures), validating the effectiveness of the lag regression approach that this paper applied.
Results
The KE index
Since this paper focuses on the atmospheric feedback in winter (DJF) to the KE variability 2 months earlier, Figure 1 highlights the time series of KEI from October to December (OND) and the corresponding SSHA patterns for the two opposite KE states. As depicted in Figure 1A, the KEI exhibits a feature of bimodal interannual fluctuation, with a low-frequency shift between positive and negative phases. The OND SSHA pattern, with correspondence of KEI larger than 0.5, is characterized by a prominent positive SSHA anomaly to the south of the KE axis and a weaker negative SSHA to the north, suggesting a stronger and steadier KE jet, hereafter KE SP (OND in 2002, 2004, 2010–2014, 2016, and 2018–2019) (Figure 1B). The KE USP is selected when the OND KEI is less than −0.5 (OND in 1993–1997 and 2006–2008), which shows a basically opposite SSHA pattern with smaller amplitude compared to that in the KE SP (Figure 1C). The KE variation feature during 1993–2012 above is consistent with Qiu et al. (2014) and sustains a stable dynamical state from 2012 to 2019 (Usui and Ogawa, 2022).
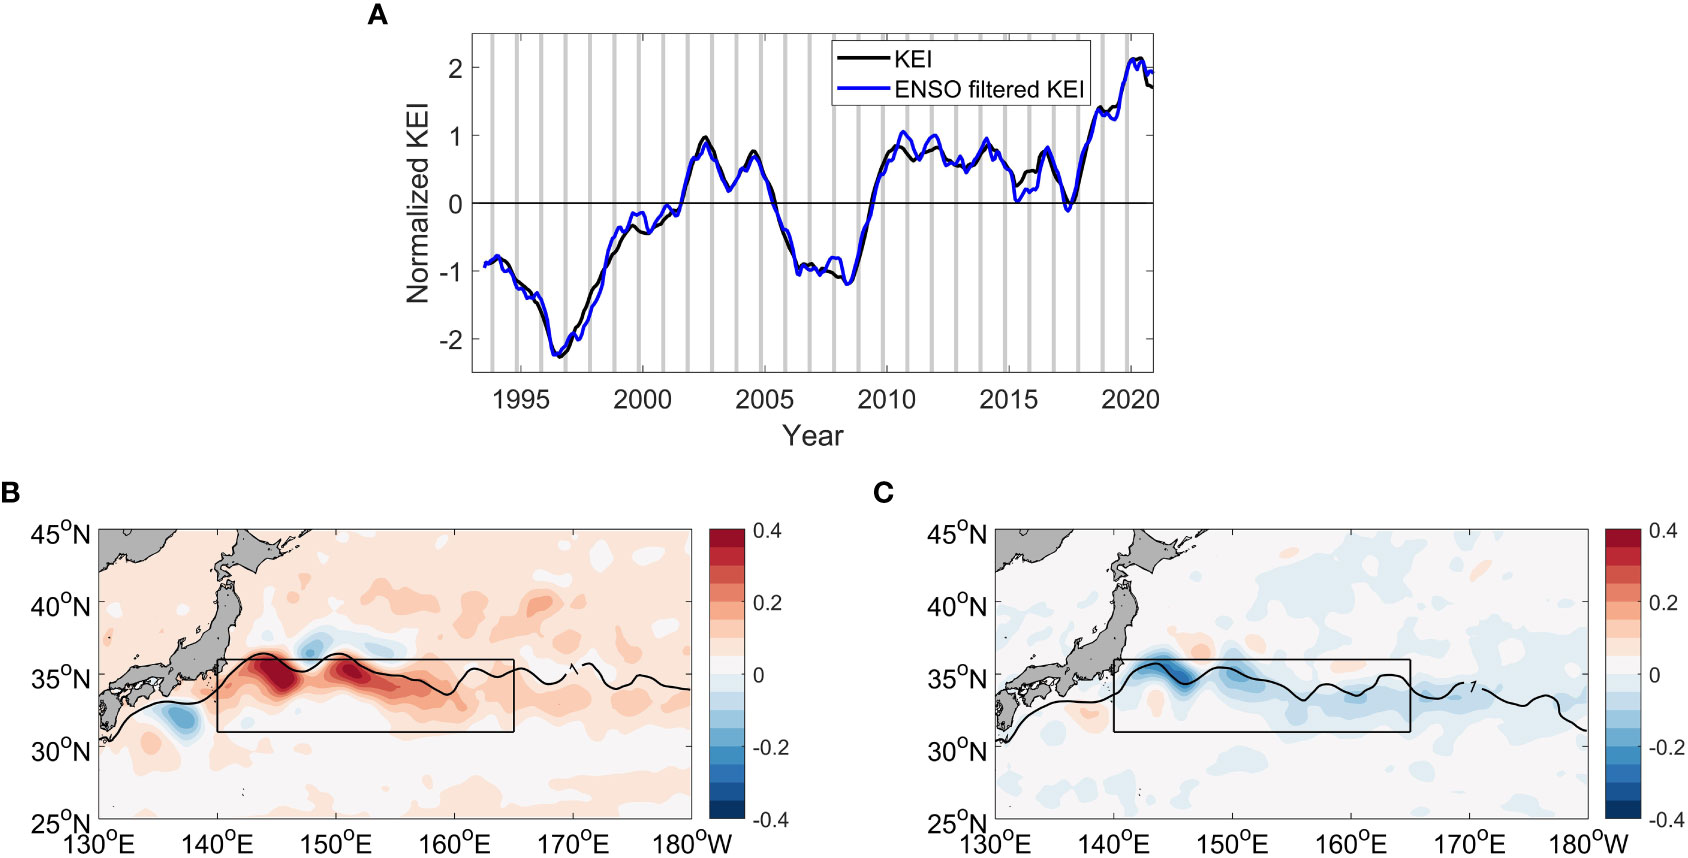
Figure 1 (A) The monthly normalized KEI time series before (black curve) and after (blue curve) ENSO filtering based on the AVISO SSHA observations. The gray bars mark out the KEI in OND. Composite SSHA (shading; unit, m) and corresponding KE axis (black curve) defined by the 1-m sea surface height for the (B) SP and (C) USP during the period of 1993–2019, with black rectangle indicating the region used to calculate the KEI. KEI, Kuroshio Extension index; ENSO, El Niño Southern Oscillation; AVISO, Archiving, Validation and Interpretation of Satellite Oceanographic; SSHA, sea surface height anomaly; SP, stable period; USP, unstable period.
The relation between KE fluctuation and MedT
Figure 2 shows the spatial distribution of year-to-year winter MedT axes and corresponding z500 along the trough lines for KE SP and USP. The MedT location is highly unstable zonally, shifting in the east–west direction substantially from year to year. When the KE is in its stable (unstable) state, the MedT axis is situated to the west (east) of its climatological location, with stronger (weaker) intensity along the trough line. On average, the longitude and z500 differences of MedT between the KE SP and USP are approximately −12° and −15 gpm, respectively, pointing to a close connection between KE and MedT dynamical states. To further investigate this relation, Figure 3 displays the KE-induced atmospheric anomalies derived from the lag regression approach. Indeed, the KE exerts significant impacts on the atmospheric circulation in the Euro-Mediterranean region. An anomalous cyclone center of −18 gpm, slightly located to the west of the MedT climatological position, is developed in the middle troposphere over the Euro-Mediterranean region (Figure 3B), along with accelerated (decelerated) westerly winds to its south (north) (Figure 3D). The atmospheric anomaly on the 250-hPa level bears similar distributions to that on the 500-hPa level (Figures 3A, C), which implies that the atmospheric response to the KE fluctuation is equivalent to barotropic. Therefore, the MedT tends to be stronger and locates farther west in the KE SP, and the opposite for the USP.
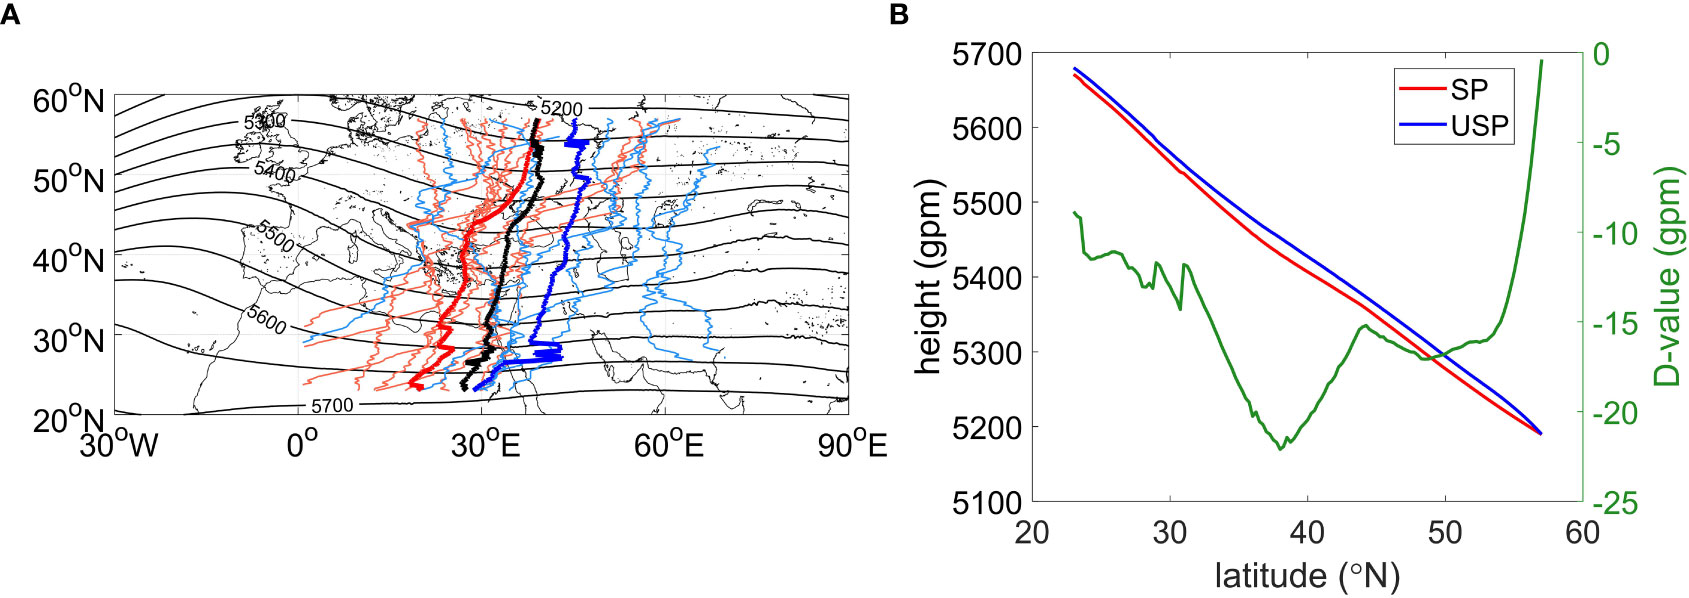
Figure 2 (A) The winter year-to-year MedT axis lines for KE SP (light red lines) and USP (light blue lines) traced from the ERA5 500-hPa geopotential height and superposed with the winter climatology of 500-hPa geopotential height (contours with an interval of 50 gpm). Thick red line and blue line show the composite MedT axis lines for KE SP and USP, respectively, and thick black line is the climatological mean MedT axis. (B) Composite 500-hPa geopotential height along the MedT axis lines for KE SP (red line, left y-axis) and USP (blue line, left y-axis) and its difference between the SP and USP (green line, right y-axis). MedT, Mediterranean trough; KE, Kuroshio Extension; SP, stable period; USP, unstable period.
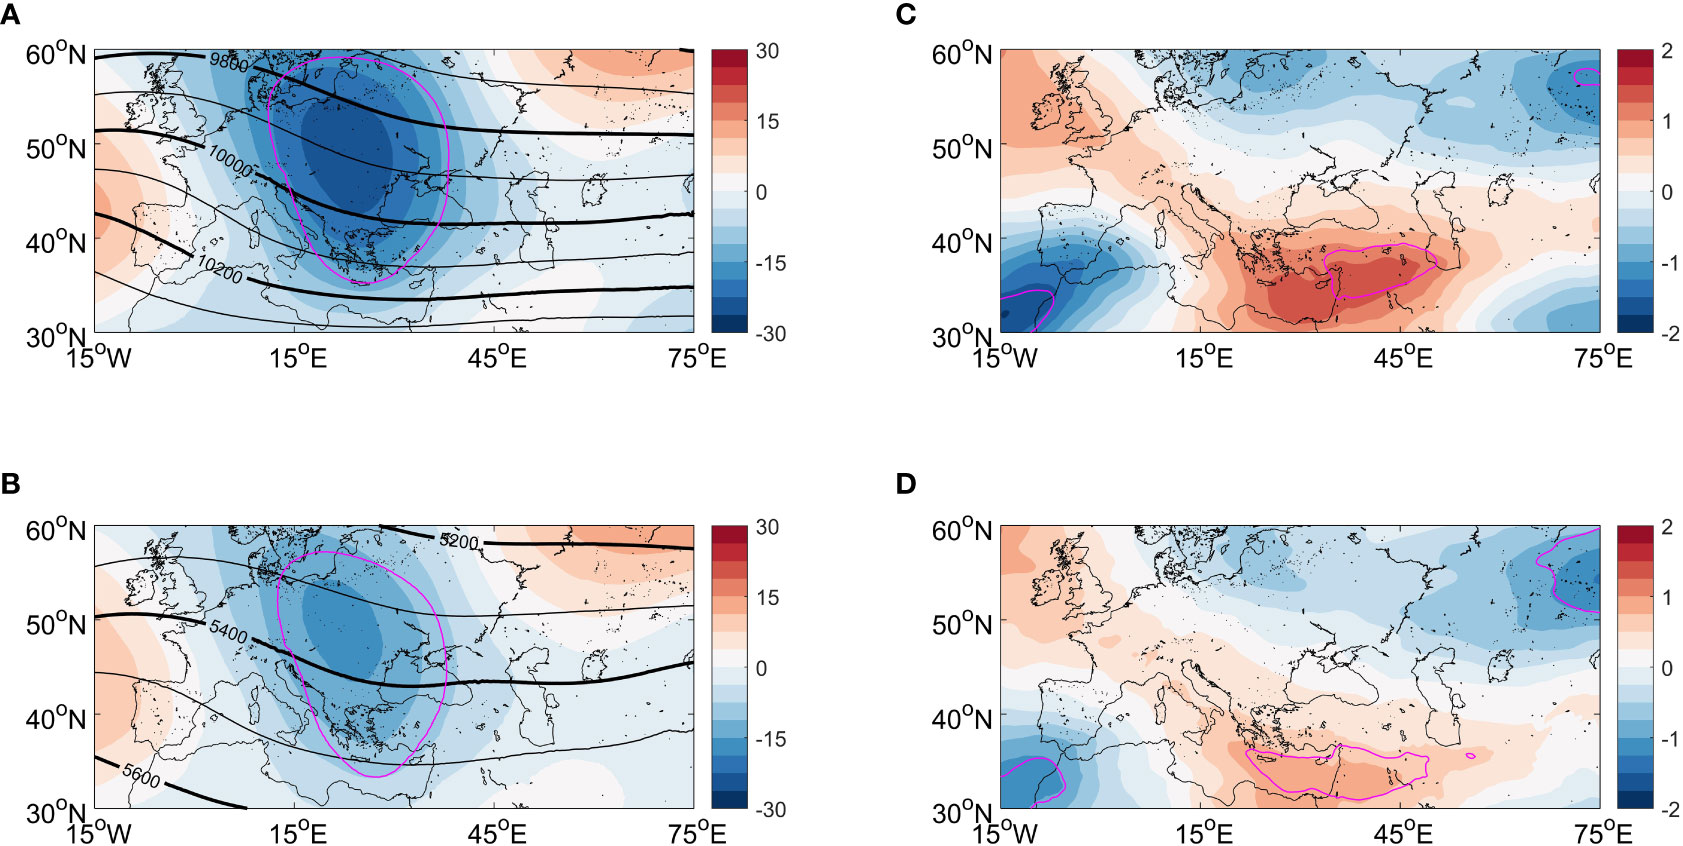
Figure 3 The lagged regressions of (A) z250 (shading; unit, gpm), (B) z500 (shading; unit, gpm), (C) u250 (shading; unit, m s−1), and (D) u500 (shading; unit, m s−1) in DJF onto the KEI 2 month earlier, superposed with the DJF-mean z250 and z500 in panels (A, B) respectively. Magenta contours represent where the atmospheric responses pass the 90% confidence level. KEI, Kuroshio Extension index.
By performing EOF analysis, the first three leading modes of MedT variability and their relations with KEI are given in Figure 4. Here, the area of 25°–55°N, 0°–65°E is chosen for EOF analysis, taking into account the region where the MedT is mostly detected and the location of 500-hPa geopotential height anomaly in Figure 3C. Our results are broadly consistent with Sen et al. (2019), except that the order of the first and second modes is contrary to their results, probably due to the different periods and regions we focused on. The first eigenvector of detrended and normalized z500 fields during 1993–2019, which contributes to 31.86% of the total variance, depicts that this mode corresponds to a pronounced anomaly extending northeastward from the eastern Mediterranean Sea to the Caucasus Mountains (Figure 4A). The correlation coefficient between the first PC time series (PC1) and MedT intensity index (the average z500 in the box of 30°–50°N and 20°–45°E) proposed by Sen et al. (2019) is 0.85 (p< 0.001), revealing that the leading EOF mode can well represent the MedT intensity variation. Figure 4B shows there exists a relatively weak co-variation between the PC1 and KEI. After applying a Savitzky–Golay filter to extract the lowpass MedT signal, the relation between the PC1 and KEI is strengthened, with the correlation coefficient increasing to 0.57 (p< 0.01), demonstrating that the KE fluctuation has some potential influences on the MedT intensity. The second PC (PC2) time series is found to be highly correlated with the MedT zonal displacement index (the z500 difference between 39°N, 10°E and 39°N, 50°E) developed by Sen et al. (2019), with a correlation coefficient of 0.86 (p< 0.001). Therefore, the second EOF mode, which accounts for 31.37% of the total variance, mainly explains the zonal displacement variability of MedT (Figure 4C), also having linkage with the lowpass KEI (r = 0.40, p< 0.1) (Figure 4D). The third EOF mode, which is responsible for 13.68% of the total variance, is hard to be identified as far as its physical implication, but it shows a similar spatial pattern with the oscillation between the eastern and western Mediterranean (Xoplaki et al., 2004) (Figure 4E). The correlation between the third PC (PC3) time series and KEI is weak and insignificant (r = 0.28, p > 0.1) (Figure 4F). In summary, there exists a significant relationship between the variability of the KE dynamical state and the intensity/zonal displacement of MedT, which raises a new question: how does the KE fluctuation affect the MedT intensity/zonal displacement?
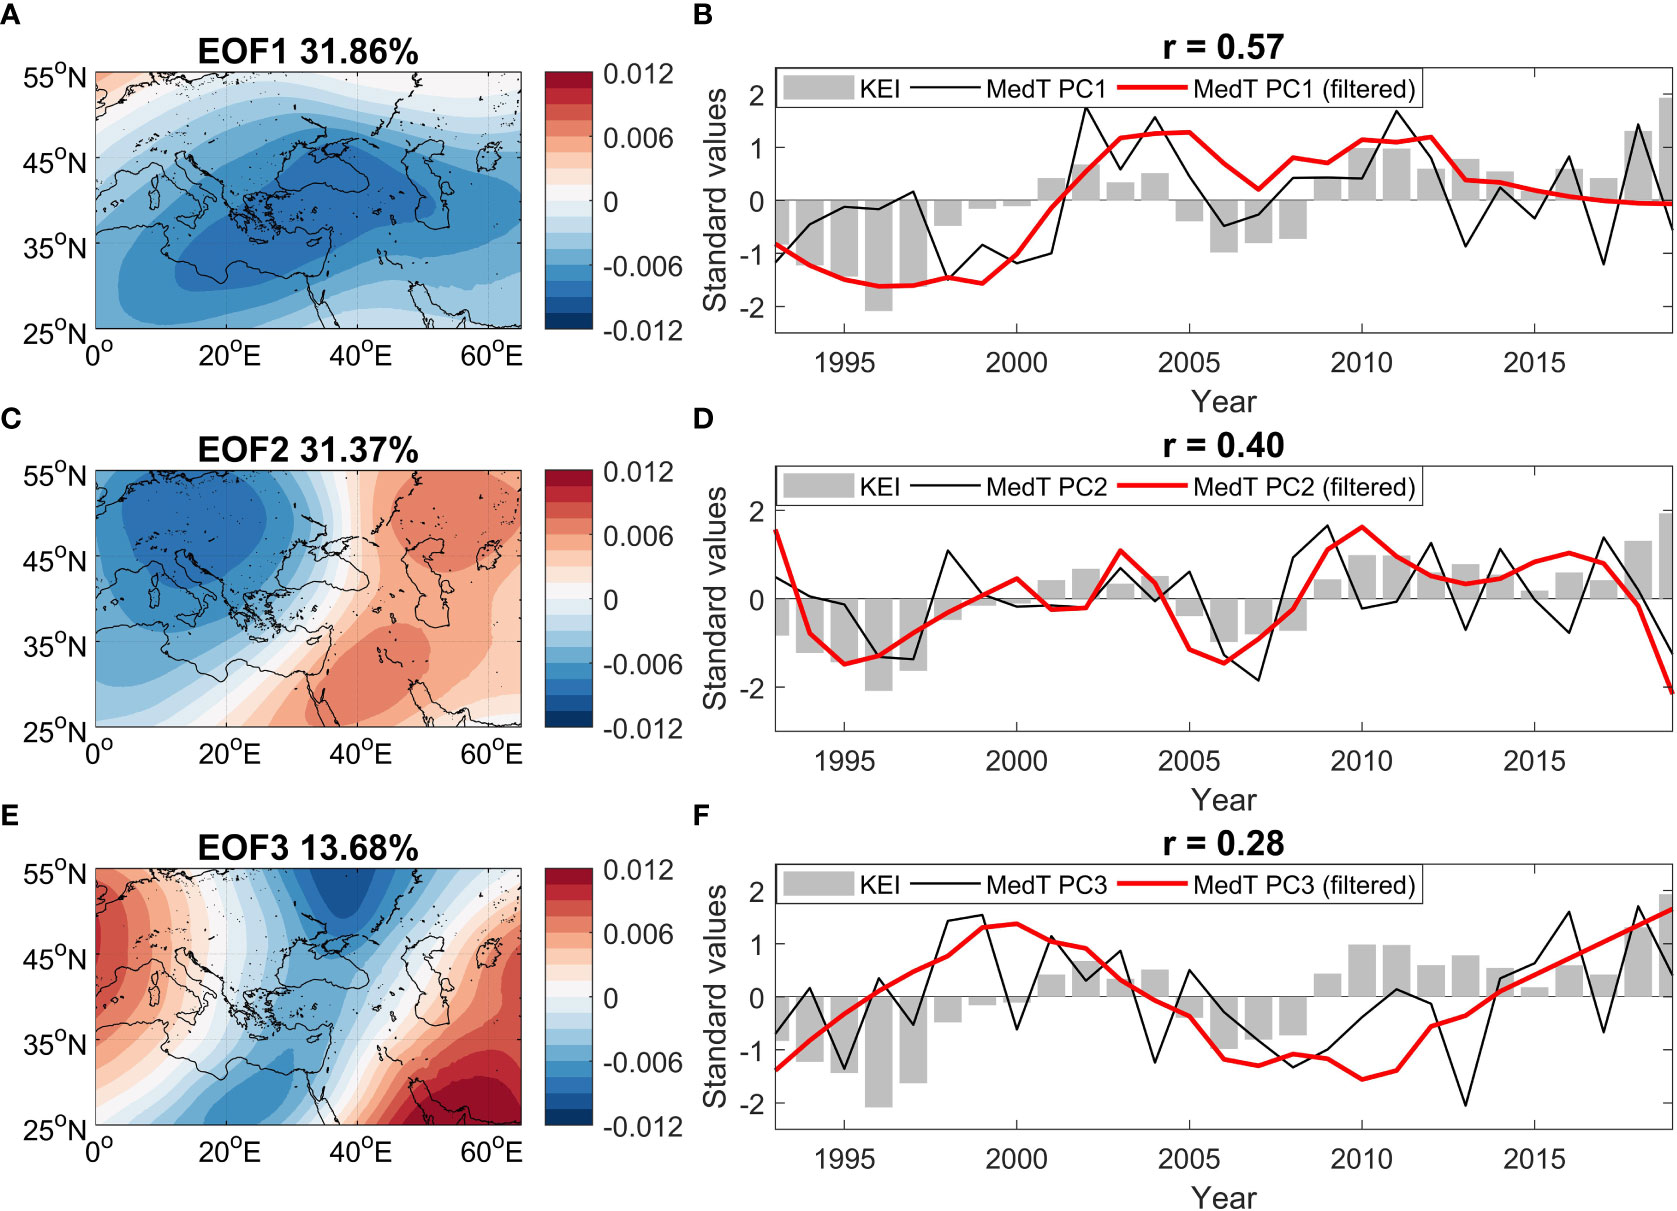
Figure 4 (A, C, E) The first three dominant EOFs at the 500-hPa geopotential height for the MedT region in winter and corresponding variance at the top of each figure. (B, D, F) Time series of normalized values for the KEI in OND (gray bar), PC in DJF (black line), and lowpass-filtered PC in DJF (red line), with the correlation coefficient between KEI and lowpass PC marked on the top of each figure. In order to obtain the MedT variation characteristic with the same frequency as the KE, a Savitzky–Golay filter with a wind length of 11 years and a degree 2 polynomial is employed to the PC time series for the leading three EOF modes to obtain the lowpass PCs. EOF, empirical orthogonal function; MedT, Mediterranean trough; KEI, Kuroshio Extension index; PC, principal component.
Possible mechanisms
Some studies suggested that the KE interannual variability triggers the mesoscale SST anomalies in the KE region, thus modulating the atmospheric large-scale circulation by generating the atmospheric Rossby wave activity, transient eddy–mean flow interaction, and thermal winds (Ma X. et al., 2015; O’Reilly and Czaja, 2015; Révelard et al., 2016; Lei et al., 2020; Sun et al., 2022). In our study, the Rossby wave and eddy–mean flow interaction are likely to be the possible underlying mechanisms. Therefore, the aforementioned two physical processes will be analyzed in the following subsections separately.
Figure 5 shows the estimated responses of SST and THF to the KE variability in the cold season. When the KE is stable, the SST decreases (increases) by 0.8°C (0.4°C) to the west (east) of 155°E in the KE region. The THF anomaly bears some resemblances to the SST anomaly, showing a corresponding decreased (increased) THF of −30 W m−2 (20 W m−2), which is equivalent to nearly 10% of the climatological THF in wintertime. Such a large THF anomaly is supposed to exert pronounced impacts on the atmosphere.
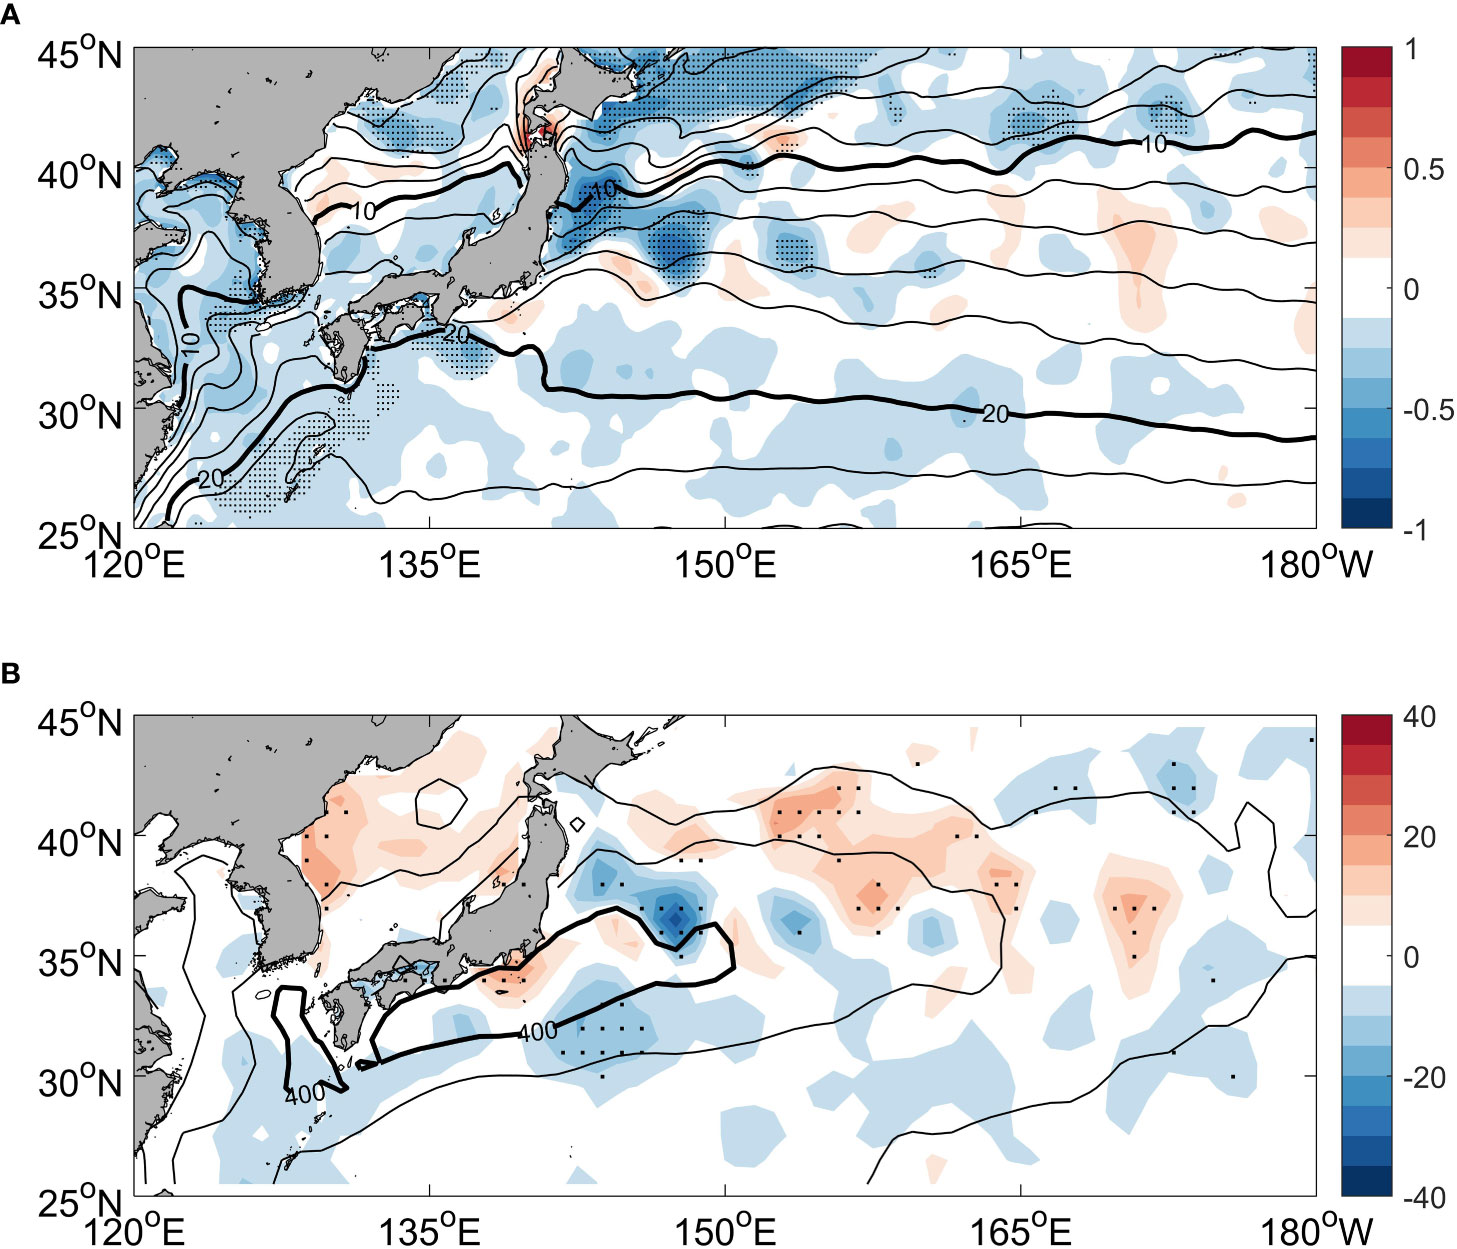
Figure 5 (A) The lagged regression of the SST anomaly (shading; unit, °C) in DJF onto the KEI 2 months earlier, overlapped with the winter background SST (contours with an interval of 2°C). The black thick contours highlight the SSTs at 10°C and 20°C. (B) The lagged regression of the THF anomaly (shading; unit, W m−2) in DJF onto the KEI 2 months earlier, superposed by the winter background THF (contours with an interval of 100 W m−2) in DJF with the black thick contours indicating the THF of 400 W m−2. A positive THF suggests that the THF transports from the ocean upward into the atmosphere. Stippling denotes where the anomalies are significant at the 90% confidence level. SST, sea surface temperature; KEI, Kuroshio Extension index.
Rossby wave activity
Previous studies pointed out that the positive SST anomaly with an amplitude of 0.6°C in the midlatitude North Atlantic can excite a wave train propagating across the North Atlantic and northern Eurasia and ultimately strengthens the downstream trough system over East Asia (Qiao and Feng, 2016; Feng et al., 2018). In our study, as plotted in Figure 6, the warm SST response and associated intensified THF in the central and eastern KE region generate an RWS extending from the sea surface up to the upper troposphere, while there is a pronounced Rossby wave sink over the MedT region. Figure 7 further suggests that the Rossby wave activity has close corresponding relation with the RWS. The KE, as an RWS, exerts the upward WAF propagating from the lower troposphere to the upper troposphere over the KE region (Figure 7B) and then drives a Rossby wave train spreading eastward to the Rossby wave sink in the Euro-Mediterranean region and decreases the geopotential height (Figure 7A). As a result, the Rossby wave activity decreases the 500-hPa geopotential height at a rate of −0.06 gpm day−1 over western Europe, which accounts for approximately 30% of the MedT deepening rate and favors a western-positioned MedT (Figure 8A).
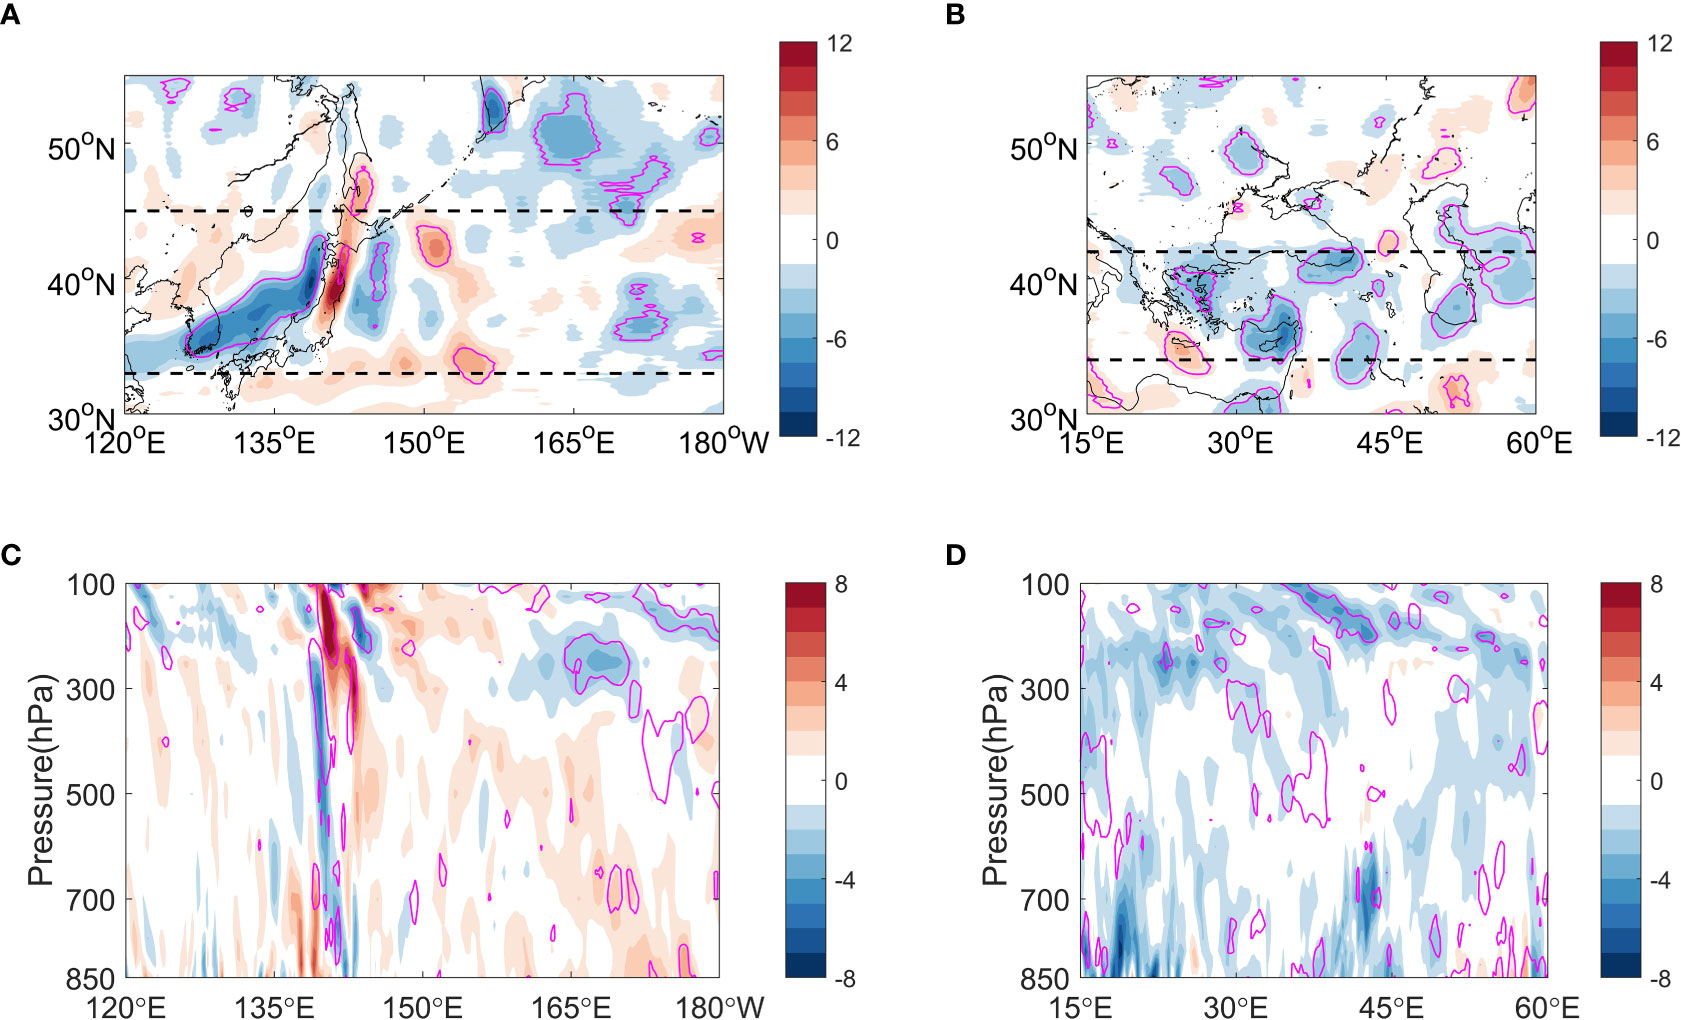
Figure 6 The lagged regressions of 300-hPa RWS (shading; unit, 10−11 s−2) over the (A) KE and (B) MedT regions in DJF onto the KEI 2 months earlier. The corresponding vertical profiles of RWS responses along the meridional average are plotted in panels (C, D) respectively, with dashed lines in panels (A, B) marking the regions used for calculating the meridional average. Magenta contours are significant at the 90% confidence level. RWS, Rossby wave source; KE, Kuroshio Extension; MedT, Mediterranean trough; KEI, Kuroshio Extension index.
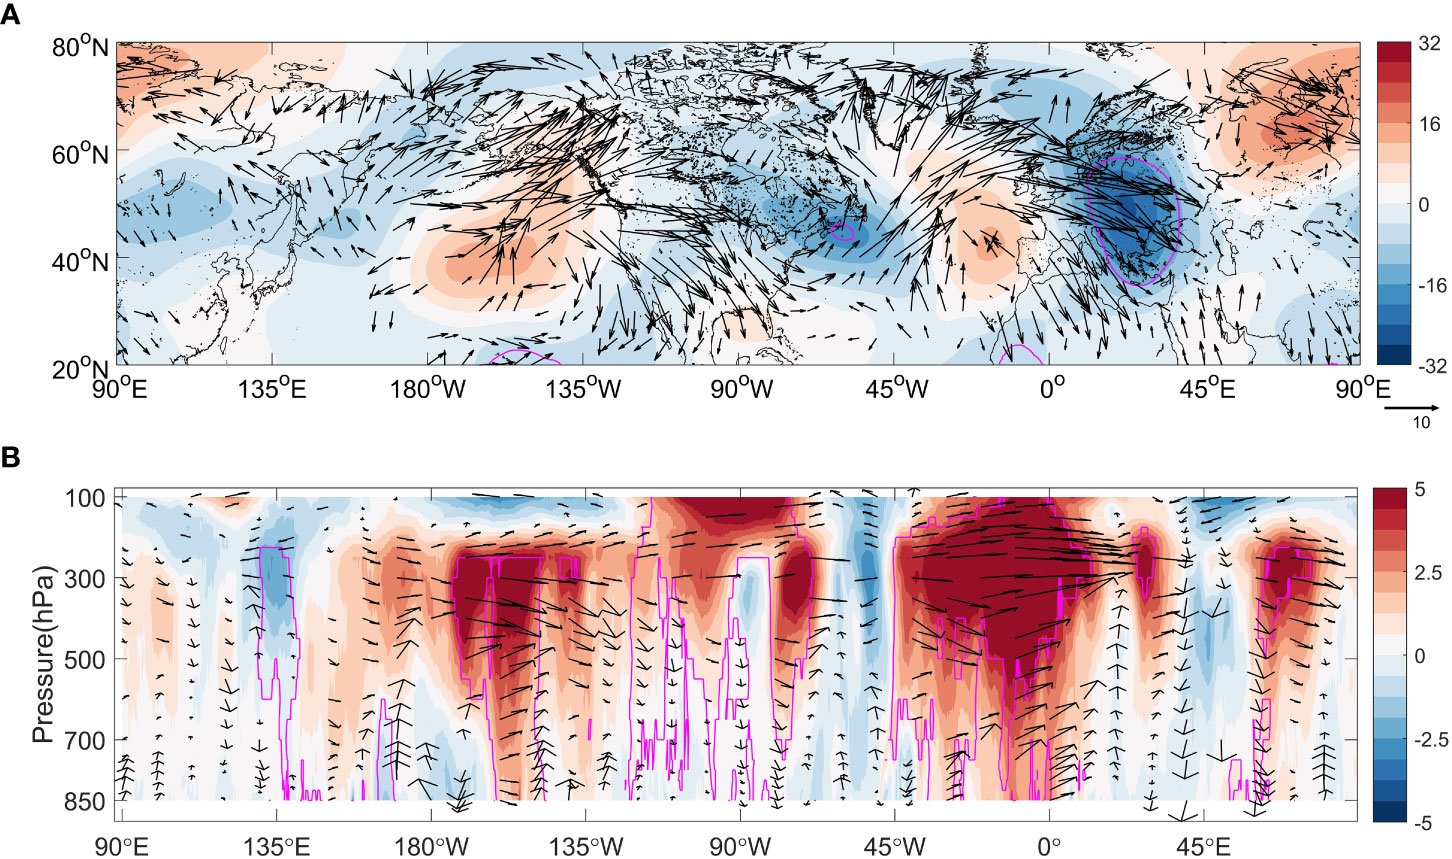
Figure 7 The lagged regressions of atmospheric anomaly in DJF onto the KEI 2 months earlier. (A) 300-hPa geopotential height (shading; unit, gpm) and WAF (vectors; unit, m2 s−2). (B) Zonal component of WAF (shading; unit, m2 s−2) and WAF (vectors; unit, m2 s−2 for horizontal component and −10−2 Pa m s−2 for vertical component) averaged between 40°N and 60°N. The vectors plotted in the figures are significant at the 90% confidence level, with magenta contours passing the 90% confidence level. KEI, Kuroshio Extension index; WAF, wave activity flux.
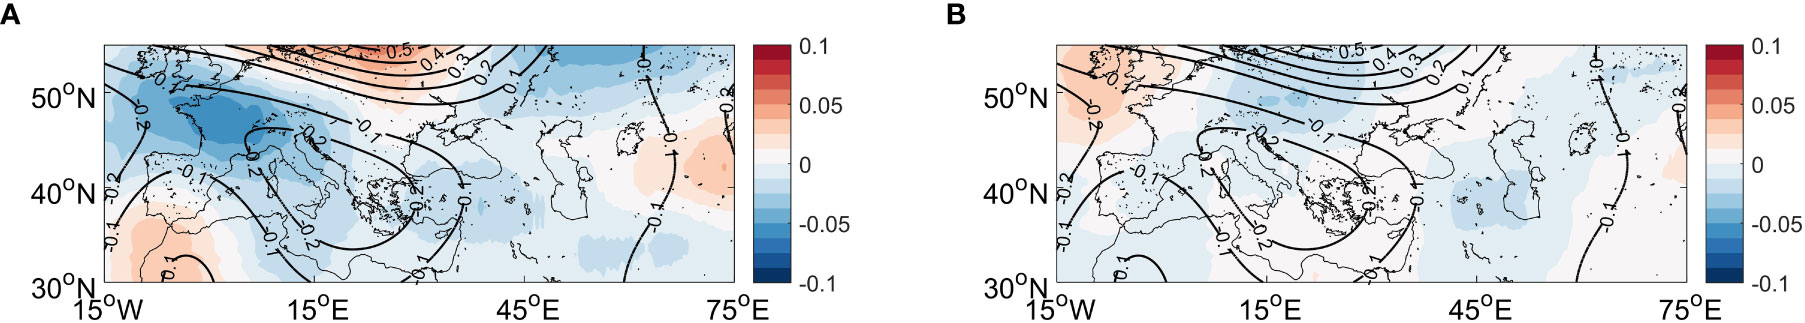
Figure 8 The lagged regressions of (A) Rossby wave-induced and (B) transient eddy-induced 500-hPa geopotential height tendency (shading; unit, gpm day−1) in DJF onto the KEI 2 months earlier, superposed by the estimated response of 500-hPa geopotential height tendency (contours; unit, gpm day−1). A 10° × 10° spatial smoothing is employed to data for distinct results. KEI, Kuroshio Extension index.
Transient eddies
The baroclinic wave activity (or storm-track activity) is found to have feedback forcing on the background zonal flow, through varying the eddy shape and orientation (Hoskins et al., 1983). In our study, forced by the Rossby wave activity, an anomalous cyclone is developed over the European continent (Figure 7A), accelerating the westerly winds over the region extending from the United Kingdom to the eastern Mediterranean Sea (Figures 3C, D) and thus strengthening the baroclinicity and corresponding transient eddy activity (Figure 9). Consequently, the feedback forcing of intensified storm track decreases the local geopotential height (Zhang et al., 2019) at a rate of −0.04 gpm day−1 to the west of the MedT climatological location, which can explain about 20% of the MedT deepening with a westward displacement (Figure 8B).
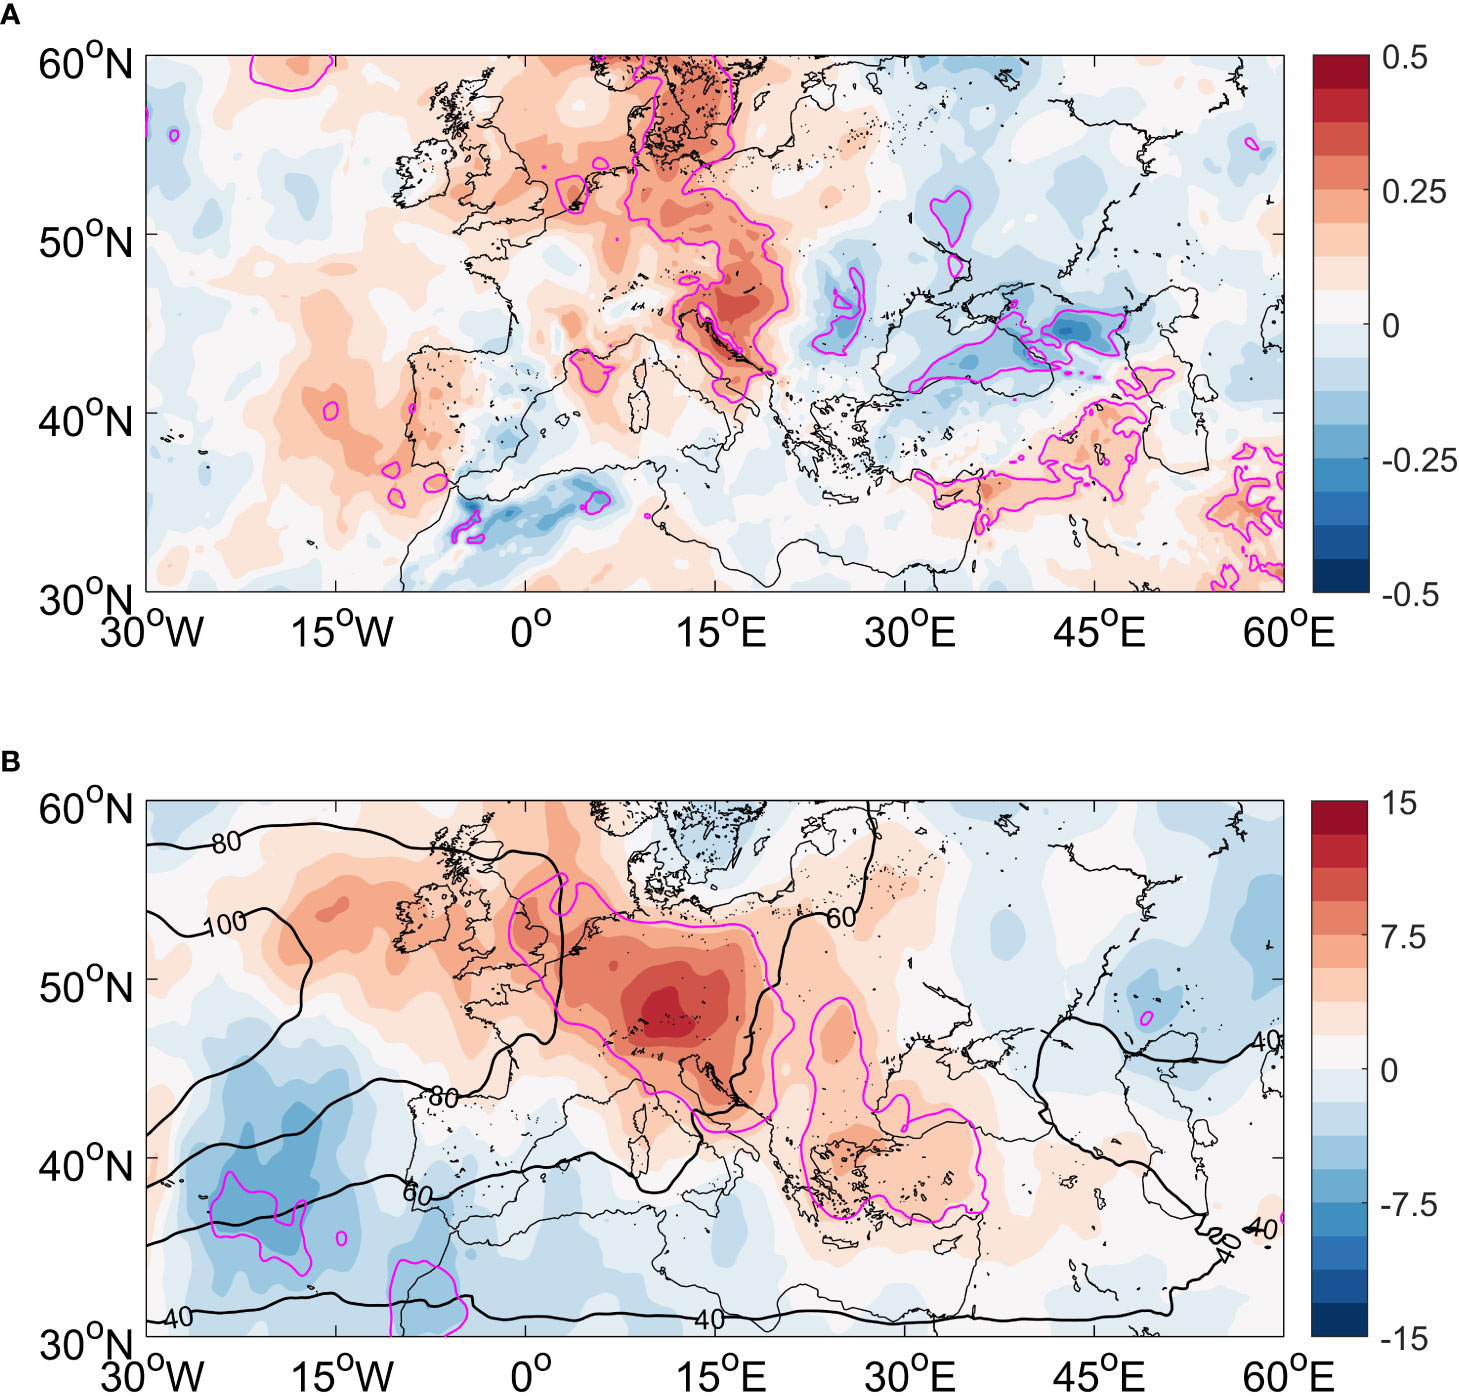
Figure 9 The lagged regressions of (A) EGR (shading; unit, 10−6 s−1) and (B) storm track (shading; unit, m2 s−2) at the 300-hPa level in DJF onto the KEI 2 months earlier, with magenta contours representing the regions where atmospheric anomalies pass the 90% confidence level. The black contours in panel (B) show the 300-hPa winter background storm track (contours at 20-m2 s−2 intervals). EGR, Eady growth rate; KEI, Kuroshio Extension index.
In summary, the combined forcings of low-frequency Rossby waves and high-frequency transient eddies lead to the decrease (increase) of geopotential height to the west of MedT in the KE SP (USP), which facilitates a stronger (weaker) and western-positioned (eastern-positioned) MedT compared to its climatological state.
The impacts of KE variability on the Euro-Mediterranean climate
The KE fluctuation exerts prominent influences on the surface parameters in the Euro-Mediterranean region, as depicted in Figure 10. In the winter with a stable KE, the 2-m air temperature shows a dipole-like pattern, with colder air temperature over the Euro-Mediterranean and North Africa and warmer air temperature over northeastern Europe and western Central Asia, consistent with the stronger and western-positioned MedT. The coldest temperature anomaly of −0.8°C is situated over the Balkan Peninsula and Romania, which is upstream of the MedT axis in the KE SP (Figure 10A). The change of snow cover displays basically the same pattern as air temperature, with snow accumulating (diminishing) to the west (east) of the climatological MedT position (Figure 10B). The convective precipitation in the northeastern Mediterranean Sea and large-scale precipitation in the Anatolian Peninsula are enhanced (Figures 10C, D), mainly due to the intensified water vapor transport driven by the accelerated westerlies from the Mediterranean Sea and stronger upward motion resulting from the deeper and western-positioned MedT (not shown). The aforementioned climate variability is highly correlated with the intensity and zonal displacement changes of MedT, implying a strong linkage between the KE fluctuation and the Euro-Mediterranean climate.
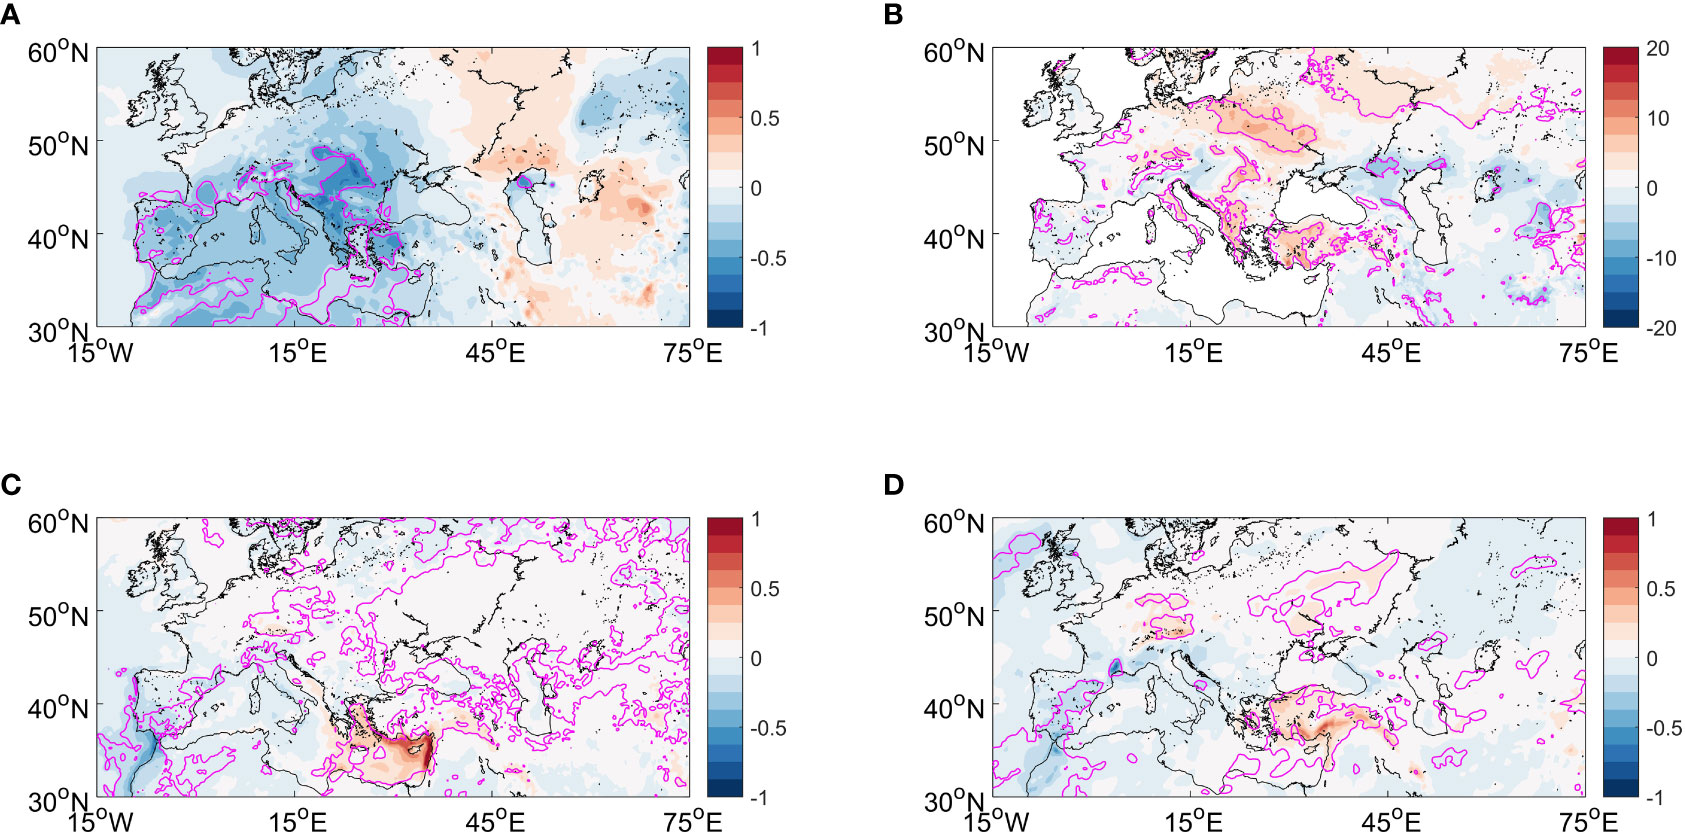
Figure 10 The lagged regressions of (A) 2-m air temperature (shading; unit, °C), (B) snow cover (shading; unit, %), (C) convective precipitation (shading; unit, mm), and (D) large-scale precipitation (shading; unit, mm) in DJF onto the KEI 2 months earlier, with magenta contours representing the regions where anomalies pass the 90% confidence level. KEI, Kuroshio Extension index.
Conclusions and discussion
This study investigates the potential effects of KE fluctuation on the MedT variability and associated Euro-Mediterranean climate variability in boreal winter by applying the lag regression approach. It is found that the KE, as one of the strongest sea–air interaction regions in the world, plays a curtailing role in influencing the Euro-Mediterranean winter climate through its impacts on the MedT. In the KE SP, an anomalous cyclone is observed to the west of the MedT climatological location in the middle and upper troposphere, resulting in a deeper and western-positioned MedT. The modulated MedT further leads to colder conditions with more snow cover over the region including the Euro-Mediterranean, North Africa, and Anatolia Peninsula by transferring the cold polar air from the north, while the warmer temperature reduces snow cover over western Central Asia and northeastern Middle East. The KE USP holds an opposite pattern.
The Rossby wave activity and eddy–mean flow interaction are found to be the key physical processes in KE influencing MedT. The stable KE triggers an SST warming and associated enhanced THF in the eastern part of the KE region, exciting the Rossby waves, which propagate upward to the middle and upper troposphere over the central North Pacific and then spread eastward along North America and the North Atlantic to the Euro-Mediterranean. This Rossby wave train leads to an anomalous cyclone with the center located over France, contributing to 30% magnitude of the MedT deepening and its westward shift. The anomalous cyclonic circulation, however, intensifies the baroclinicity by modulating the westerly winds and thus enhances the transient eddy activity over Europe, resulting in a western-positioned MedT and 20% magnitude of the MedT deepening through the feedback forcing of transient eddies on the mean flow. A schematic of how the KE state impacts the MedT and related Euro-Mediterranean climate in the cold season is shown in Figure 11.
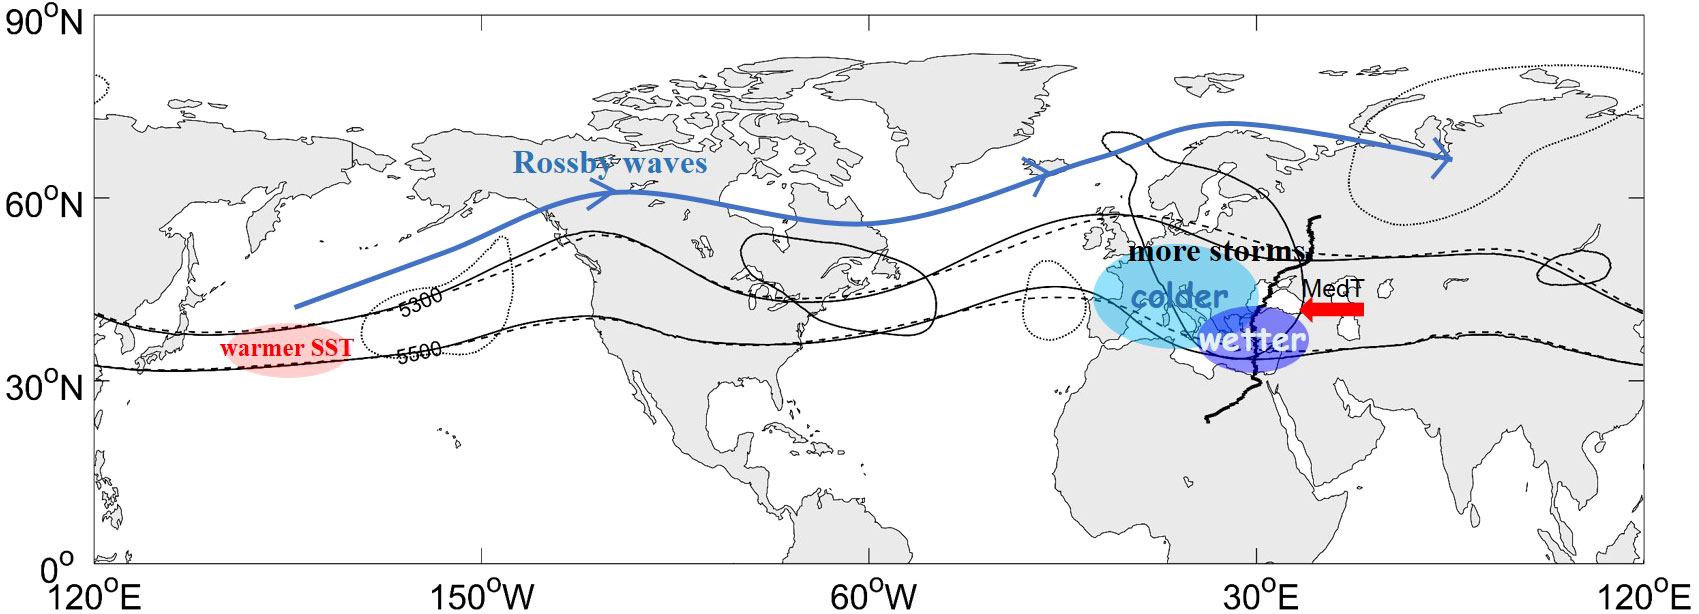
Figure 11 Schematic illustration of the dynamic relationship between the KE and MedT and associated winter climate. In the positive phase of KE, the warmer SST triggers a cyclone anomaly over Europe via the physical processes of Rossby waves and eddy–mean flow interaction. As a result, the MedT tends to be deeper and westward-positioned compared to its climatological state, bringing colder air advection to its western side and more precipitation to the northeastern Mediterranean Sea and Anatolia Peninsula. These tendencies reverse in the negative phase of KE. KE, Kuroshio Extension; MedT, Mediterranean trough; SST, sea surface temperature.
The field differences between the KE SP and USP are represented in the Supplementary Material, which produces broadly consistent patterns to those using the lag regression approach in the paper. However, we still notice some slight differences in the three sets of figures. First, there exist some distinctions in the spatial distribution of atmospheric circulation, with a northwestern-located geopotential height anomaly tilted along the northwest-southeast direction and a northeastern-positioned zonal wind anomaly in the case of the lag regression approach compared with the difference analysis (Figure 3; Supplementary Figure 1). Second, Figure 6 shows significant RWS over the KE eastern region and Rossby wave sink over the Euro-Mediterranean region nearly extending throughout the entire troposphere, while the RWS response discontinues in the mid-troposphere in Supplementary Figure 3. Third, the spatial consistency between the atmospheric baroclinicity and transient eddy activity in Figure 8 is more apparent than that in Supplementary Figure 5. The result comparisons indicate that the lag regression and difference approaches are all capable of capturing the atmospheric responses to the KE fluctuation, and the lag regression approach performs better in some fields considering the spatial consistency.
An anomalous warming event took place over eastern Anatolia in early March 2004, leading to unprecedented snowmelt runoff in the Euphrates and Tigris basin with heavy rainfall and thus resulting in a once-in-50-year extreme discharge (>2,000 m3 s−1) and flooding event (Bozkurt et al., 2019). Our results reveal that the KE might be one of the drivers of this extreme case of a warm spell, as the stable KE favors wetter conditions over eastern Anatolia. On the contrary, the well-known drought year of 2007 in the Mediterranean region (Şahin et al., 2015) corresponds to an unstable KE state, implying a possible linkage between them. Sen et al. (2019) and Bozkurt et al. (2019) proposed that, accompanied by a deepened EAT, the MedT is displaced in the west of its climatological location. Given the fact that the KE fluctuation is a key determinant of the EAT (Sun et al., 2022) and MedT from our results, the KE might be one of the drivers for the co-variability of these two trough systems on the opposite sides of the Eurasian continent. In addition, our results also imply some potential influences of the KE on the European blocking, which can cause cold air outbreaks in southeastern Europe and the Middle East and needs to be further investigated.
Data availability statement
The data presented in the study are deposited in the online repositories. The names of the repository/repositories and accession numbers can be found below: the AVISO SSHA data (https://data.marine.copernicus.eu/product/SEALEVEL_GLO_PHY_L4_MY_008_047/description), the surface heat flux data (ftp://ftp.whoi.edu/pub/science/oaflux/data_v3/), and the ERA5 dataset (https://www.ecmwf.int/en/forecasts/datasets/reanalysis-datasets/era5).
Author contributions
YJ and JS conceived the research, designed the methodology, and conducted the formal analysis. HL and LM are responsible for the conceptualization and project administration. YJ wrote the original draft of the paper with all the authors contributing to the review and approving the submission. All authors contributed to the article and approved the submitted version.
Funding
This research was funded by the National Natural Science Foundation of China (NFSC, 41976025).
Conflict of interest
The authors declare that the research was conducted in the absence of any commercial or financial relationships that could be construed as a potential conflict of interest.
Publisher’s note
All claims expressed in this article are solely those of the authors and do not necessarily represent those of their affiliated organizations, or those of the publisher, the editors and the reviewers. Any product that may be evaluated in this article, or claim that may be made by its manufacturer, is not guaranteed or endorsed by the publisher.
Supplementary material
The Supplementary Material for this article can be found online at: https://www.frontiersin.org/articles/10.3389/fmars.2022.1081452/full#supplementary-material
References
Bozkurt D., Ezber Y., Sen O. L. (2019). Role of the East Asian trough on the eastern Mediterranean temperature variability in early spring and the extreme case of 2004 warm spell. Climate Dyn. 53 (3), 2309–2326. doi: 10.1007/s00382-019-04847-5
Bretherton C. S., Widmann M., Dymnikov V. P., Wallace J. M., Bladé I. (1999). The effective number of spatial degrees of freedom of a time-varying field. J. Clim. 12 (7), 1990–2009. doi: 10.1175/1520-0442(1999)012<1990:TENOSD>2.0.CO;2
Buehler T., Raible C. C., Stocker T. F. (2009). The relationship of winter season north Atlantic blocking frequencies to extreme cold or dry spells in the ERA-40. Tellus 63A, 212–222. doi: 10.1111/j.1600-0870.2010.00492.x
Chen X., Liu X., Li X., Liu M., Yang M. (2018). Activity characteristics of the East Asian trough in CMIP5 models. Atmosphere 9 (2), 67. doi: 10.3390/atmos9020067
Chen Z., Wu R., Chen W. (2014). Distinguishing interannual variations of the northern and southern modes of the East Asian winter monsoon. J. Clim. 27, 835–851. doi: 10.1175/JCLI-D-13-00314.1
Cheung H. N., Zhou W. (2016). Simple metrics for representing East Asian winter monsoon variability: Ural blocking and western pacific teleconnection pattern. Adv. Atmos. Sci. 33, 695–705. doi: 10.1007/s00376-015-5204-6
Cook B. I., Anchukaitis K. J., Touchan R., Meko D. M., Cook E. R. (2016). Spatiotemporal drought variability in the Mediterranean over the last 900 years. J. Geophys. Res. Atmos. 121, 2060–2074. doi: 10.1002/2015JD023929
Demirtas M. (2017). The large-scale environment of the European 2012 high-impact cold wave: prolonged upstream and downstream atmospheric blocking. Weather 72 (10), 297–301. doi: 10.1002/wea.3020
Ducet N., Le Traon P. Y., Reverdin G. (2000). Global high-resolution mapping of ocean circulation from TOPEX/Poseidon and ERS-1 and-2. J. Geophys. Res. Oceans 105 (C8), 19477–19498. doi: 10.1029/2000JC900063
Feng G., Zou M., Qiao S., Zhi R., Gong Z. (2018). The changing relationship between the December north Atlantic oscillation and the following February East Asian trough before and after the late 1980s. Climate Dyn. 51, 4229–4242. doi: 10.1007/s00382-018-4165-8
Ferreira D., Frankignoul C. (2008). Transient atmospheric response to interactive SST anomalies. J. Clim. 21, 576–583. doi: 10.1175/2007JCLI1704.1
He S., Gao Y., Li F., Wang H., He Y. (2017). Impact of Arctic oscillation on the East Asian climate: a review. Earth Sci. Rev. 164, 48–62. doi: 10.1016/j.earscirev.2016.10.014
Hoskins B. J., James I. N., White G. H. (1983). The shape, propagation and mean-flow interaction of large-scale weather systems. J. Atmos. Sci. 40 (7), 1595–1612. doi: 10.1175/1520-0469(1983)040<1595:TSPAMF>2.0.CO;2
Hoskins B. J., Valdes P. J. (1990). On the existence of storm-tracks. J. Atmos. Sci. 47, 1854–1864. doi: 10.1175/1520-0469(1990)047<1854:OTEOST>2.0.CO;2
Islam M. J., Slater M. J., Thiele R., Kunzmann A. (2021). Influence of extreme ambient cold stress on growth, hematological, antioxidants, and immune responses in European seabass, dicentrarchus labrax acclimatized at different salinities. Ecol. Indic. 122, 107280. doi: 10.1016/j.ecolind.2020.107280
Jiang Y., Zhang S., Xie S. P., Chen Y., Liu H. (2019). Effects of a cold ocean eddy on local atmospheric boundary layer near the kuroshio extension: In situ observations and model experiments. J. Geophys. Res. Atmos. 124 (11), 5779–5790. doi: 10.1029/2018JD029382
Kushnir Y., Wallace J. M. (1989). Interaction of low-frequency and high-frequency transients in a forecast experiment with a general-circulation model. J. Atmos. Sci. 46 (10), 1411–1418. doi: 10.1175/1520-0469(1989)046<1411:IOLAHF>2.0.CO;2
Lau N. C., Nath M. J. (2014). Model simulation and projection of European heat waves in present-day and future climates. J. Clim. 27, 3713–3730. doi: 10.1175/JCLI-D-13-00284.1
Lei T., Li S., Luo F., Liu N. (2020). Two dominant factors governing the decadal cooling anomalies in winter in East China during the global hiatus period. Int. J. Climatol. 40, 750–768. doi: 10.1002/joc.6236
Leung M. Y. T., Zhou W. (2015). Variation of circulation and East Asian climate associated with anomalous strength and displacement of the East Asian trough. Climate Dyn. 45 (9), 2713–2732. doi: 10.1007/s00382-015-2504-6
Liu Z., Liu Y., Wu L., Jacob R. (2007). Seasonal and long-term atmospheric responses to reemerging north pacific ocean variability: A combined dynamical and statistical assessment. J. Clim. 20 (6), 955–980. doi: 10.1175/JCLI4041.1
Liu Z., Wen N., Liu Y. (2008). On the assessment of nonlocal climate feedback. part I: The generalized equilibrium feedback assessment. J. Clim. 21 (1), 134–148. doi: 10.1175/2007JCLI1826.1
Lolis C. J., Türkeş M. (2016). Atmospheric circulation characteristics favoring extreme precipitation in Turkey. Clim. Res. 71, 139–153. doi: 10.3354/cr01433
Luo D., Yao Y., Dai A., Feldstein S. B. (2015). The positive north Atlantic oscillation with downstream blocking and middle East snowstorms: the large-scale environment. J. Clim. 28, 6398–6418. doi: 10.1175/JCLI-D-15-0184.1
Ma X., Chang P., Saravanan R., Montuoro R., Hsieh J. S., Wu D., et al. (2015). Distant influence of kuroshio eddies on north pacific weather patterns? Sci. Rep. 5 (1), 1–7. doi: 10.1038/srep17785
Ma X., Chang P., Saravanan R., Montuoro R., Nakamura H., Wu D., et al. (2017). Importance of resolving kuroshio front and eddy influence in simulating the north pacific storm track. J. Clim. 30, 1861–1880. doi: 10.1175/JCLI-D-16-0154.1
Mariotti A., Zeng N., Lau K. M. (2002). Euro-Mediterranean Rainfall and ENSO–a seasonally varying relationship. Geophys. Res. Lett. 29 (12), 59-1–59-4. doi: 10.1029/2001GL014248
Ma J., Xu H., Dong C., Lin P., Liu Y. (2015). Atmospheric responses to oceanic eddies in the kuroshio extension region. Geophys. Res. Atmos. 120 (13), 6313–6330. doi: 10.1002/2014JD022930
Omrani N. E., Ogawa F., Nakamura H., Keenlyside N., Lubis S. W., Matthes K. (2019). Key role of the ocean Western boundary currents in shaping the northern hemisphere climate. Sci. Rep. 9 (1), 1–12. doi: 10.1038/s41598-019-39392-y
O’Reilly C. H., Czaja A. (2015). The response of the pacific storm track and atmospheric circulation to kuroshio extension variability. Quart. J. R. Meteor. Soc 141, 52–66. doi: 10.1002/qj.2334
Qiao S., Feng G. (2016). Impact of the December north Atlantic oscillation on the following February East Asian trough. J. Geophys. Res. Atmos. 121, 10–074. doi: 10.1002/2016JD025007
Qiu B., Chen S., Schneider N., Taguchi B. (2014). A coupled decadal prediction of the dynamic state of the kuroshio extension system. J. Clim. 27, 1751–1764. doi: 10.1175/JCLI-D-13-00318.1
Révelard A., Frankignoul C., Sennéchael N., Kwon Y. O., Qiu B. (2016). Influence of the decadal variability of the kuroshio extension on the atmospheric circulation in the cold season. J. Clim. 29, 2123–2144. doi: 10.1175/JCLI-D-15-0511.1
Şahin S., Türkeş M., Wang S. H., Hannah D., Eastwood W. (2015). Large Scale moisture flux characteristics of the Mediterranean basin and their relationships with drier and wetter climate conditions. Climate Dyn. 45, 3381–3401. doi: 10.1007/s00382-015-2545-x
Sardeshmukh P. D., Hoskins B. J. (1988). The generation of global rotational flow by steady idealized tropical divergence. J. Atmos. Sci. 45, 1228–1251. doi: 10.1175/1520-0469(1988)045<1228:TGOGRF>2.0.CO;2
Sen O. L., Ezber Y., Bozkurt D. (2019). Euro-Mediterranean Climate variability in boreal winter: a potential role of the East Asian trough. Climate Dyn. 52 (11), 7071–7084. doi: 10.1007/s00382-018-4573-9
Shaman J., Tzipperman E. (2011). An atmospheric teleconnection linking ENSO and southwestern European precipitation. J. Clim. 24, 124–139. doi: 10.1175/2010JCLI3590.1
Shi J. (2021). Reexamining the decadal variation in the ENSO-East Asian winter monsoon relationship. Geophys. Res. Lett. 48 (19), e2021GL094208. doi: 10.1029/2021GL094208
Song L., Wang L., Chen W., Zhang Y. (2016). Intraseasonal variation of the strength of the East Asian trough and its climatic impacts in boreal winter. J. Clim. 29, 2557–2577. doi: 10.1175/JCLI-D-14-00834.1
Sun J., Wu S., Ao J. (2016). Role of the north pacific sea surface temperature in the East Asian winter monsoon decadal variability. Climate Dyn. 46, 3793–3805. doi: 10.1007/s00382-015-2805-9
Sun Z., Zhang J. (1992). Statistical characteristics of 40-60 day oscillation in extratropical area. Proc. Long-Term Weather Forecast, 29–35.
Sun J., Zhang S., Jiang Y., Wang Y., Wu B., Wang H. (2022). Impacts of the interannual variability of the kuroshio extension on the East Asian trough in winter. Atmosphere 13 (7), 996. doi: 10.3390/atmos13070996
Takaya K., Nakamura H. (1997). A formulation of a wave-activity flux for stationary rossby waves on a zonally varying basic flow. Geophys. Res. Lett. 24, 2985–2988. doi: 10.1029/97GL03094
Takaya K., Nakamura H. (2001). A formulation of a phase-independent wave-activity flux for stationary and migratory quasigeostrophic eddies on a zonally varying basic flow. J. Atmos. Sci. 58, 608–627. doi: 10.1175/1520-0469(2001)058<0608:AFOAPI>2.0.CO;2
Usui N., Ogawa K. (2022). Sea Level variability along the Japanese coast forced by the kuroshio and its extension. J. Oceanogr., 78 (6), 515–527. doi: 10.1007/s10872-022-00657-2
Visbeck M. H., Hurrell J. W., Polvani L., Cullen H. M. (2001). The north Atlantic oscillation: past, present, and future. PNAS 98 (23), 12876–12877. doi: 10.1073/pnas.231391598
Wang L., Chen W., Zhou W., Huang R. H. (2009). Interannual variations of East Asian trough axis at 500 hPa and its association with the East Asian winter monsoon pathway. J. Clim. 22, 600–614. doi: 10.1175/2008JCLI2295.1
Wang Y. H., Liu W. T. (2015). Observational evidence of frontal-scale atmospheric responses to kuroshio extension variability. J. Clim. 28 (23), 9459–9472. doi: 10.1175/JCLI-D-14-00829.1
Wang Q., Zhang S. P., Xie S. P., Norris J. R., Sun J. X., Jiang Y. X. (2019). Observed variations of the atmospheric boundary layer and stratocumulus over a warm eddy in the kuroshio extension. Mon. Wea. Rev. 147 (5), 1581–1591. doi: 10.1175/MWR-D-18-0381.1
Xoplaki E., González-Rouco J. F., Luterbacher J., Wanner H. (2004). Wet season Mediterranean precipitation variability: influence of large-scale dynamics and trends. Climate Dyn. 23 (1), 63–78. doi: 10.1007/s00382-004-0422-0
Yao Y., Luo D., Dai A., Feldstein S. B. (2016). The positive north Atlantic oscillation with downstream blocking and middle East snowstorms: impacts of the north Atlantic jet. J. Clim. 29, 1853–1876. doi: 10.1175/JCLI-D-15-0350.1
Yu L., Weller R. A. (2007). Objectively analyzed air-sea heat fluxes for the global ice-free oceans (1981-2005). Bull. Amer. Meteor. Soc 88, 527–540. doi: 10.1175/BAMS-88-4-527
Zhang M., Perrie W., Long Z. (2019). Springtime north pacific oscillation and summer sea ice in the Beaufort sea. Climate Dyn. 53, 671–686. doi: 10.1007/s00382-019-04627-1
Keywords: Kuroshio Extension variability, Mediterranean trough, Euro-Mediterranean climate, Rossby waves, storm-track
Citation: Jiang Y, Sun J, Ma L, Li H and Wang Y (2022) Influence of the interannual variability of the Kuroshio Extension on the Mediterranean trough in the cold season. Front. Mar. Sci. 9:1081452. doi: 10.3389/fmars.2022.1081452
Received: 27 October 2022; Accepted: 30 November 2022;
Published: 16 December 2022.
Edited by:
Feng Nan, Institute of Oceanology (CAS), ChinaReviewed by:
Jingchao Long, Guangdong Ocean University, ChinaYun Liu, Texas A&M University College Station, United States
Copyright © 2022 Jiang, Sun, Ma, Li and Wang. This is an open-access article distributed under the terms of the Creative Commons Attribution License (CC BY). The use, distribution or reproduction in other forums is permitted, provided the original author(s) and the copyright owner(s) are credited and that the original publication in this journal is cited, in accordance with accepted academic practice. No use, distribution or reproduction is permitted which does not comply with these terms.
*Correspondence: Huan Li, usher02@126.com