A spatial and temporal assessment of microplastics in seafloor sediments: A case study for the UK
 Adil Bakir1*
  Denise Doran1 Briony Silburn1 Josie Russell1 Simeon Archer-Rand1 Jon Barry1 Thomas Maes2 Caroline Limpenny1 Claire Mason1 Jon Barber1
  E.E. Manuel Nicolaus1
- 1Centre for Environment, Fisheries and Aquaculture Science (Cefas), Lowestoft Laboratory, Lowestoft, United Kingdom
- 2GRID-Arendal, Arendal, Norway
Seafloor sediments have been defined as sinks for microplastics in the marine environment and could therefore represent suitable matrices for their long-term monitoring. On a regional aspect, the adoption of a common indicator for microplastics in seafloor sediments would allow regional monitoring and assessments through international frameworks such as OSPAR. This study presents the findings of a research and development project monitoring the occurrence and abundance of microplastics in UK seafloor sediments for the period 2013-2021, supporting the development of a national monitoring programme for microplastics in seafloor sediments for the UK (England and Wales). A fast-screening technique based on Nile Red staining of polymers coupled with µ-FTIR was applied and validated using µ-FTIR-FPA. Microplastic particles were detected in all 189 sediment samples from 15 stations selected around the UK for each investigated year (2013 - 2021). Microplastic concentrations (20 – 5000 µm) ranged from 133 – 6,933 particles kg-1 dry weight sediment for 2020-2021. Microplastics mainly consisted of fragments (73%), fibres (19%) and spheres (8%). Plastic fragments ranged from 46 to 3276 µm and plastic fibres from 300 to 1731 µm in length with a mean diameter of 16 µm. Single particle analysis using µ-FTIR indicated a prevalence of Rayon, PP, Rayon/Nylon/Polyester blends, Rubber, PS, PE, PA, PVC, Acrylic, EMAA and PET. Fragments were mainly white in colour (46%) followed by brown (38%), black (1%), blue (1%) and orange (1%). Fibres were mainly white in colour (57%) followed by black (14%), orange (14%) and red (14%). A trend assessment at the UK regional seas levels indicated little visual evidence of any trends in the abundance of microplastics over time in any of the regional seas – with the possible exception of the Northern North Sea with a reduction in abundance over time for the time-period 2013-2021.
Highlights
• Seafloor sediments represent suitable matrices for their long-term monitoring.
• UK (England and Wales) seafloor sediments collected from 2013 to 2021 were analysed for microplastics.
• A fast-screening approach using Nile Red (NR) coupled with μ-FTIR was applied.
• Main polymers detected included Rayon, PP, Rubber particles, PS, PE, PA, PVC, Acrylic, EMAA and PET.
• The NR outputs were validated using μ-FTIR-focal plane array (FPA).
1 Introduction
Plastics are valuable resources with numerous societal benefits. Worldwide plastics production reached about 367 million tonnes in 2021, a slight decrease of 0.3% compared to 2019 (PlasticsEurope, 2021). Despite the Covid-19 pandemic, global levels of production and demand for plastics remain stable, while Europe shows a decline due to the direct impact of the pandemic (PlasticsEurope, 2021). It has been estimated that between 4.8 and 12.7 million tons of plastics enter the marine environment annually from land with rivers as main pathways (Jambeck et al., 2015; Lebreton et al., 2017), causing plastics to form a large proportion of marine litter. Marine litter is defined as any solid material which has been deliberately discarded or unintentionally lost on beaches, on shores or at sea. The definition covers materials transported into the marine environment from land by rivers, draining or sewage systems or winds. It also includes any persistent, manufactured or processed solid material (OSPAR, 2021). A large part of this plastic litter consists of microplastics typically referring to ‘synthetic water-insoluble polymers of 5 mm or less in any dimension’ (ECHA, 2018).
Marine litter pollution is a growing problem and monitoring programmes are an important tool to evaluate both the trends and the efficiency of reduction measures. In March 2022, heads of state, ministers of environment and other representatives from UN member states endorsed a historic resolution to end plastic pollution and forge an international legally binding agreement by 2024. Now, more than ever, monitoring programmes and evidence are required to inform governments, institutions and organisations on decision making for this global, international, and comprehensive framework. The UN sustainable development agenda includes targets to significantly reduce marine pollution of all kinds, including marine litter. The Sustainable Development Goal (SDG) indicator 14.1.1 “index of coastal eutrophication and floating plastic debris density” is a global indicator of marine pollution. Indicators are used to evaluate the marine litter pollution, and there is a need for robust and homogeneous data sets with internationally established methods or standards. At the European level, the Marine Strategy Framework Directive (MSFD, 2008/56/EC) is the main driver for monitoring of the marine environment to ensure that “properties of marine litter do not cause harm to the coastal and marine environment” and member states are required to report amounts, composition, spatial distribution, and the source of macro and microlitter. The four European Regional Seas Conventions (OSPAR commission, HELCOM, Black Sea Commission and UNEP/MAP Barcelona convention) have set indicators under their current monitoring programmes to evaluate marine litter to support policies and achieve good environmental status. However, different sampling approaches for macro and microplastics have hampered data collection and comparison and there are still relatively few monitoring datasets and assessments available to show time series with multiannual data at a national or regional level. Coordinated monitoring programmes for microplastics have yet to be undertaken for the UK, although the development of a candidate indicator for microplastics in sediment is ongoing at OSPAR level and for the UK monitoring programme. Microplastics have been reported in sediments, water and biota globally including across the North-East Atlantic region (OSPAR area). Sources of microplastics are varied and often difficult to identify due to their dynamic transport in the terrestrial, freshwater and marine environment and are mainly classified as land and ocean-based sources (GESAMP, 2015). Land-based sources have been generally assumed to be the main contributors for the entry of plastic waste to the marine environment (Gilardi et al., 2020; Meijer et al., 2021). For the OSPAR catchments, tyre wear and (macro) litter were identified as the largest land-based sources of microplastics with estimated amounts of around 100,000 tons year-1 (OSPAR, 2017). Sea-based activities also contribute to the global burden of microplastics including fishing, aquaculture, shipping, ocean dumping and other marine activities. To date, estimates of the total contribution of sea-based sources to the OSPAR area is not possible due to the limited available quantification of marine litter inputs from the scientific, peer-reviewed and grey literature (Gilardi et al., 2020).
The absence of a globally accepted protocol for the detection and analysis of microplastics is also making comparison between datasets difficult. Microplastics are known to be widespread in the marine environment and have been found in every marine niche investigated, from coastal zones to the open ocean and the deep-sea (Taylor et al., 2016; Kane and Clare, 2019). Deep-sea sediments have also been suggested as a likely final sink for microplastics (Woodall et al., 2014; Harris et al., 2021a). While the abundance of microplastics in biota and surface waters only represent snapshots of the occurrence of microplastics in the environment, sediments on the seafloor could represent more stable matrices for the short to long term monitoring of microplastics in the marine environment. The use of harmonised, standardised protocols is a requisite to be able to produce robust and comparable data sets over time needed for national to regional assessments. A number of common indicators have already been adopted by the OSPAR commission to allow for consistent and comparable regional assessments of marine litter over time including beach litter, ingestion by the seabird species Fulmar, seabed litter and litter ingested by sea turtles. The OSPAR commission is currently developing a common indicator for microplastics for seafloor sediments including a series of recommendations for harmonised protocols for sample collection and microplastics extraction and quantification. The OSPAR Microplastic Expert Group (MPEG) has been set-up as a group of experts in the field of microplastic research. MPEG is currently composed of 19 members with participating contracting parties from the UK (England, Scotland, N. Ireland), Germany, Denmark, Portugal, Belgium, Spain, France, Sweden, Norway, and the Netherlands. The main goal of MPEG is to share expertise and to work towards a proposal for a candidate indicator on microlitter (including microplastics) in sediments. Further harmonisation, outside of the OSPAR maritime area, is also being carried out with regular updates from other working groups (HELCOM, AMAP, ICES WGML and EU-TGML) focusing on microplastics in environmental samples.
Nile Red (NR) was developed as a low cost and fast approach for the detection and quantification of microplastics in environmental samples (Maes et al., 2017a). Since its development, the application of NR in relation to microplastic research has increased substantially. Shruti et al. (2021) recently published a review on the application of NR for the analysis of microplastics in environmental samples including food products. While the need for standardised protocols for NR use was highlighted in the review, the authors concluded that NR tagging of microplastics was a promising approach for a low-cost and fast screening of microplastics from environmental samples, especially for laboratories lacking more advanced and often costly infrastructure (e.g., pyrolysis GC-MS or μ-FTIR, μ-Raman facilities). NR has also previously been used for the large-scale mapping of microplastics from sediment, indicating its suitability in a monitoring context (Wang et al., 2018; Bakir et al., 2020a; Preston-Whyte et al., 2021; Kukkola et al., 2022). NR has also been applied to the detection and quantification of microplastics in biota (Catarino et al., 2018; Bakir et al., 2020a; Bakir et al., 2020b; Coc et al., 2021; Nalbone et al., 2021) and water (Bakir et al., 2020a; Preston-Whyte et al., 2021).
The main aim of this study was to propose a standardised method based on fluorescence tagging using NR for the detection and quantification of microplastics in seafloor sediments. The main objectives were to i) to develop a rapid screening approach for the detection and quantification of microplastics in seafloor sediments, ii) to develop a spectroscopic based method for the accurate characterisation of microplastics from seafloor sediments, iii) to investigate whether sediment type has an impact on the number of microplastics present, iv) to investigate variations in microplastics concentration over time and v) to compare UK data with available globally reported data.
2 Materials and method
2.1 Sample collection
Sediment samples were collected as part of the Clean Seas Environment Monitoring programme (CSEMP) (Figure 1 and Table S1). Collected data were also presented according to UK regionals seas (Figure S16) and OSPAR regions II & III (Figure S11). Sediment samples were collected using a stainless steel 0.1 m2 Day Grab, rinsed before deployment with Pentane to reduce sample contamination between sites. Surficial sediment (top 2 – 3 cm) was collected using a solvent rinsed metal spoon and placed in a pre-rinsed glass jar with foil and cap. Samples were stored at -18°C until ready for analysis. Plastic items stability was assumed following the freezing process from direct observation and no impact on microplastics stability was reported under simulated freeze-thaw cycles by Koutnik et al. (2022).
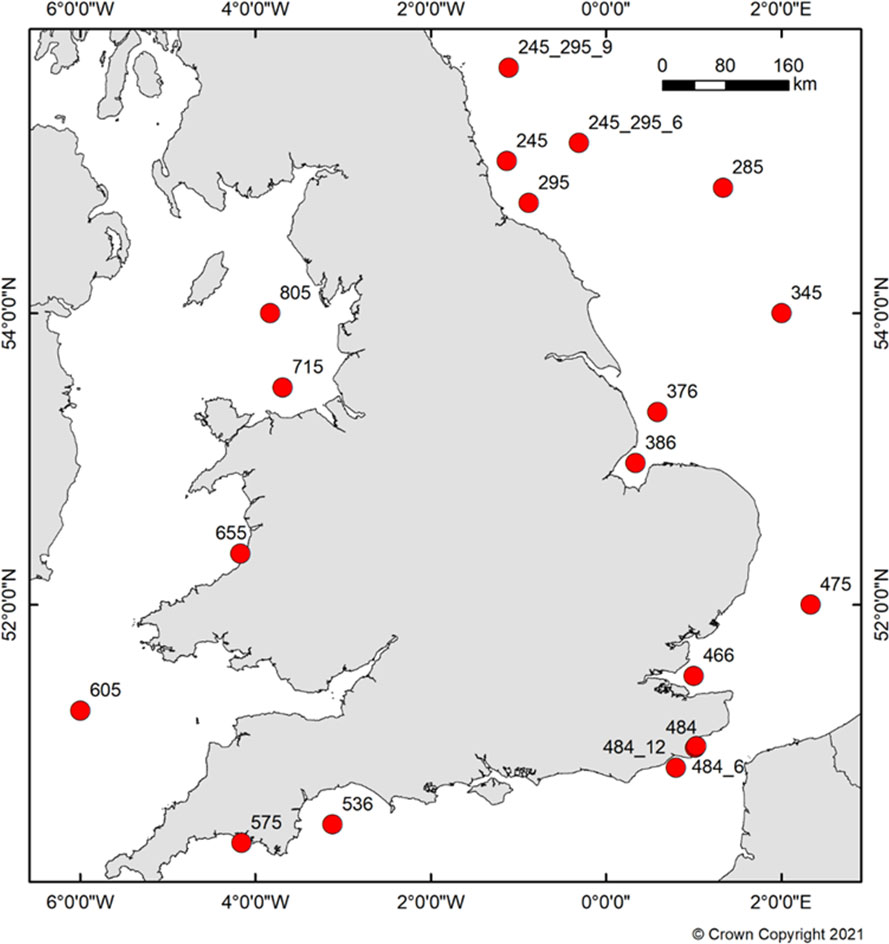
Figure 1 Clean Seas Environmental Monitoring Programme sediment stations.
2.2 Chemicals
The chemicals used in this study are listed in supplementary information (Table S2).
2.3 Contamination control procedures
Standard Operating Procedures (SOPs) for the collection of sediment samples were developed to ensure reproducibility of sampling. Dedicated field technicians were trained using SOPs to minimise field contamination during sampling for the time-period 2018-2021. Empty pre-rinsed reverse osmosis water (RO) glass jars were also used as field blanks and were open for the time required to transfer a sediment sample from the Day Grab to the clean, pre-rinsed RO glass collecting jars. For the time-period 2013-2017, archive sediment samples collected for the investigation of organic contaminants were used. The same sampling protocol was used for the collection of sediments for organic contaminants; however, glass jars were Pentane rinsed only and some particle contamination could have occurred during collecting jar preparation and sample handling.
Prior to use, all glassware was cleaned using a laboratory detergent and rinsed using RO water. Care was taken during the field sampling to minimise sample contamination by only opening jars for the minimum amount of time during sample transfer. All chemical solutions used in this study were previously filtered using a 47 mm diameter, 0.2 μm regenerated cellulose membrane filter. Sample handling was carried out inside a biological safety cabinet (BSC). Contamination monitoring within the laboratory was carried out by using blank filters processed in the same way as environmental samples for each batch of samples processed. For time efficiency, a procedural control was prepared with every batch of samples and subjected to the same preparation steps.
2.4 Sample processing
2.4.1 Density separation and microplastics recovery
Recoveries from the separation process of polymers from sediment was investigated by spiking clean sea sand (VWR, particle size 100 – 315 μm) with a range of polymers of different densities (i.e. 0.90 to 1.45 g cm-3), shapes (i.e. beads, spheres, fragments, fibres), and sizes (i.e. 150 μm for spheres to 3951 μm length fibres). Polymers were individually added to 5 g of clean sea sand and 35 mL of a pre-filtered 1.5 g mL-1 solution of zinc chloride was added. Quantities of spiked items varied according to the polymeric materials and was either 10, 20 or 50 items. All samples were prepared in duplicates. Samples were extracted and analysed as described in section 2.2.2. Suppliers for the different polymers can be found in Table S3.
2.4.2 Sample preparation
Collected sediment samples were thoroughly homogenised using a metal spatula in a BSC and small aliquots were transferred to previously RO water cleaned 100 mL glass jars and the lids were replaced with 15 cm Whatman 509 filter papers, held into place using small metal wires. Each sample was dried in a drying cabinet below 50°C for three days. Prior to weighing of the samples, each pot was homogenised using a rinsed cleaned metal spatula. 5 g of the sediment were weighed into three 50 mL polypropylene centrifuge tubes in a biological safety cabinet (BSC) with ventilation. Density separation was carried out by using a 1.5 g mL-1 solution of zinc chloride (ZnCl2). Approximately 35 mL of zinc chloride was added to each of the centrifuge tube and 37 mL was added to an empty tube as a control. The tubes were then well shaken to homogenise the samples. Each tube was centrifugated at 3900xG for 5 minutes. Each supernatant was transferred to a previously cleaned filtration unit and filtered using a 47 mm diameter 0.2 μm porosity Whatman cellulose nitrate membrane. The whole process was repeated two more times and the supernatants combined on the same filter. Residues of zinc chloride were rinsed with 100 mL of RO water and particles stuck onto the funnels were rinsed using RO water. Each filter was then carefully transferred to previously cleaned 100 mL glass beakers with a glass lid for the alkaline digest process. Two alkaline digestion methods were investigated in this study. A 10% KOH digestion solution was applied and compared to a 30% KOH : NaClO v:v solution (Strand and Tairova, 2016; Enders et al., 2017). 40 mL of the digest solution was added to each beaker, in a biology safety cabinet, containing the extraction funnel on top to rinse the last particles potentially attached to the sides of the extraction apparatus. The beakers and funnels were covered with a glass cover to avoid room contamination. The covered beakers containing samples were placed in a Flowgen Bioscience incubator and incubated for three days at 40°C while shaking at 120rpm. The cellulose nitrate membrane dissolved in approximately 10 minutes. Each digested sediment sample was transferred to a previously cleaned filtration unit and filtered using a 47 mm diameter 0.2 μm porosity Whatman RC filter membrane. All filtrations were carried out in the BSC to minimise ambient contamination. Excess KOH : NaClO was washed down using 100 mL RO water. Approximately 5 mL of NR dissolved in ethanol was poured onto the filter disc and incubated for 30 minutes. Following incubation, NR was filtered through, and excess dye was rinsed off with 100 mL RO water. Particles stuck to the sides of the funnels were carefully washed down using a glass Pasteur pipette and RO water.
2.5 Particle size analysis
Alongside samples for microplastic analysis, additional sediment was collected for particle sized analysis (PSA). This was subsampled from the Day grab using the same method as described in section 2.1. Samples were placed in a plastic bag within a plastic tub and stored at -18°C until analysis. All samples were analysed at the Cefas laboratory, Lowestoft, following the NMBAQC method (Mason, 2011). This involves taking a subsample for laser diffraction and then wet-splitting the remaining sediment over a 1mm sieve. The sediment >1mm is oven dried at 70°C and then dried sieved at half phi intervals. The <1mm sediment is left to settle for 24 hours, before the overlying water is syphoned off and the sediment is oven dried at 70°C to calculate total weight of the >1mm sediment. The subsample taken for laser diffraction is wet screened at 1mm and subsequently the <1mm is analysed using the Beckman Coulter LS 13 320 laser sizer to produce detailed size distributions of the <1mm at half phi intervals, down to 0.004 μm. The dry sieve and laser data are then combined to produce the final results for the full PSA distribution of the sediment. Accompanying statistical summaries were calculated using GRADISTAT (Blott and Pye, 2001).
2.6 Organic carbon and nitrogen analysis
Prior to processing for PSA, a subsample was taken from the sediment sample at each station for total particulate organic carbon and nitrogen (OCN) analysis. The subsample is taken from the whole sample and frozen, then freeze dried for a minimum of 7 days or until completely dry. The freeze-dried sediment is then screened over a 2mm sieve, the >2 mm sediment is discarded and the <2 mm sediment is ground to a fine powder using the Pulverisette 5 model IV planetary ball mill. All grinding equipment is cleaned with denaturated alcohol (IMS) before and between each sample to ensure there is no cross-contamination. Samples are then sent to the University of East Anglia for Organic Carbon and Nitrogen analysis. Inorganic carbon is removed using a sulphurous acid digest, samples are then freeze dried and ground. Ground samples are weighed into tin capsules for analysis. Total carbon samples are dried and ground. Samples are then weighed into tin capsules for analysis. Samples are analysed using an Exeter Analytical CE440 CHN combustion analyser. Quality assurance procedures include analysis of 3 repeats completed for 1 in 10 samples with RSD% <10%, certified reference materials (CRM) and in-house reference materials (IHRM) are run every 4 determinations. Limits of detection are for organic carbon (<0.01%) and nitrogen (<0.001%), and measurement limits are calculated as 10 times the detection limit.
2.7 Quantification of microplastics
Quantification of microplastics was achieved using an automatic counting tool of the fluorescent items onto filters described below. The final count of microplastics was also compared to a manual counting for validation from the acquired digital imaging.
A Python-based model was created for the fast recognition and counting of the fluorescent images onto filters from the digital images. The tool utilises the package scikit-image within the Python scripting language (van der Walt et al., 2014). The image is first divided into separate wave bands for analysis (red, green, and blue). Segmentation of the image into background and foreground (plastics) is undertaken using a threshold value derived by the tool or by the user. The tool calculates a threshold value based on the Otsu method histogram of the red and green fluorescence of the whole image. The Otsu method looks to separate the image into two classes by identifying a threshold which reduces intra-class variance by maximising inter-class variability (Otsu, 1979). This type of threshold is particularly suited for where the histogram is bimodal, such as with the microscope images.
The tool uses a decision tree to decide whether to use the derived threshold from either the red band or the green band of the image or whether to use one of the pre-determined user defined thresholds to segment the image (Figure S9). Once the image is separated into two classes (bright spots and background) the areas are merged to form objects from each class. Cleaning of the objects then takes place removing objects smaller than the user defined minimum area and filling in holes in objects below 10 pixels in size. For each of the plastic objects a series of statistics are calculated including: i) mean red value, ii) mean green value, iii) mean red value, iv) area (pixels) and v) eccentricity (scale between 0 and 1 on how round an object is). Outputs from the tool include an image of the plastics identified and a tale of statistics for each object identified as a plastic. The tool can run iteratively on a folder of images or multiple folders of images providing separate results tables for each folder. Units were expressed in number of particles kg-1 dry weight (d.w.) sediment. Additional parameters were reported such as type of particle (e.g., spheres, fragments, film, pellets, or foam), polymer type and sizes of the items analysed using μ-FTIR.
The mean number of fluorescent items onto the laboratory procedural controls (i.e. negative controls) were subtracted to the final count of fluorescent items onto filters for samples.
2.8 Polymer identification using micro-Fourier transform infrared spectroscopy
Suspected microlitter were identified for microplastic confirmation and polymer identification. A LUMOS II (Bruker, UK) using micro-ATR and transmission FT-IR with a liquid nitrogen-cooled MCT detector. For micro-ATR FT-IR, spectra (32 scans) were collected in reflectance mode in the range 4000-500 cm-1 at a resolution of 4 cm-1. For particles that couldn’t be analysed using micro-ATR FT-IR, transmission mode was used. For transmission mode, particles of interest were manually transferred to 25 mm Anodiscs filters (0.2 μm porosity, Whatman, VWR, UK). Spectra (32 scans) were collected in transmission mode in the range 4000-1250 cm-1 at a resolution of 4 cm-1. For all cases, polymer identification was verified based on the % match against provided polymer libraries (ATR-FTIR-Library complete, Vol.1-4; Bruker Optics ATR-Polymer Library; IR-Spectra of Polymers, Diamond -ATR, IR-Spectra of Polymers, Geranium-AT & IR-Spectra of Additives, Diamond-ATR). Only matches above 60% were selected for a positive microplastic validation and polymer identification (Leistenschneider et al., 2021).
2.9 Statistical analysis
Due to the discrete nature of the variable, a Poisson or Negative binomial distribution was initially considered. However, because of numerical convergence difficulties for the statistical models for Poisson and Negative Binomial, a different approach was adopted: the raw data were square root transformed and Normal errors were assumed. A Mann-Kendall (MK) analyses and linear regressions (LR) were applied to investigate any trends. The MK analysis was conducted using the R function mannkendall in the R-library emon (Barry et al., 2017). For the statistical analysis and to make plots clearer, square root transformations were applied to the microplastic counts kg-1 d.w. sediment. Because replications from the same station are not independent, means are taken of the transformed counts for each station. These mean values are used in the trend analyses.
To study variation among and between groups (i.e. sampling sites and sampling years), an ANOVA test was used to analyse the differences among group means, followed by Tukey HSD post hoc test as the multiple comparison procedure using IBM SPSS® Statistics (version 28.0.1.1) with α=0.05. Both ANOVA and Tukey’s test assume independence of samples, homogeneity of variance and normality of residuals (Zar, 1999). Analysis was conducted as ANOVA is considered robust to such departure from normality where large data sets are employed (Underwood et al., 1997).
2.10 Validation using micro-FTIR-Focal plane array detector chemical imaging system
A spectroscopic based method was also developed in parallel to the NR method using a LUMOS II FTIR microscope with focal plane array (FPA) detector (Bruker, UK) and is summarised in Appendix 6. As a summary, 10 g of dried sediment were weighed into three 50 mL polypropylene centrifuge tubes in a BSC with ventilation. Dried sediments were digested using the dropwise addition of filtered (0.2 μm) H2O2 (30%) until bubbling stops. Following the digestion step, the tubes were covered using a RO rinse filter membrane secured into place using a fine metal wire and subsequently placed in a drying cabinet < 50°C for 48 hours prior to density separation. Density separation was carried out by using a 1.5 g mL-1 solution of zinc chloride (ZnCl2). Approximately 35 mL of zinc chloride was added to each of the centrifuge tube and 37 mL was added to an empty tube as a control. The tubes were then well shaken to homogenise the samples. Each tube was centrifugated at 3900xg for 5 minutes. Each supernatant was transferred to a previously cleaned filtration unit and filtered using a 25 mm diameter 0.2 μm porosity Whatman Anodisc (VWR, UK). The whole process was repeated one more time and the supernatants combined on the same filter. Residues of zinc chloride were rinsed with 100 mL of RO water and particles stuck onto the funnels were rinsed using RO water. Each filter was then carefully transferred to previously cleaned glass petri dish and transported to a drying cabinet for 24 to 48 hours under 50°C prior to analysis using a LUMOS II μ-FTIR with FPA detector (Bruker, UK). The whole area (100%) of the 25 mm Anodiscs filters (0.2 μm porosity, Whatman, VWR, UK) was scanned. FTIR spectra were collected using FPA detector in transmission mode using a single scan in the range 4000-1300 cm-1 at a resolution of 8 cm-1 using a 4x4 binning (LOD of ~ 20 μm). Spectra were converted using a macro in Bruker OPUS (version 8.5) and particle identification was carried out using the siMPle software developed by Aalborg University (Denmark) and Alfred Wegener Institute (Germany) (https://simple-plastics.eu/). Results were expressed as number of microplastics, corresponding sizes (in μm). The software also allowed for the identification and counting of non-microplastic items including natural items (e.g., chitin) and fibres (e.g., cotton) decreasing the reporting of non-plastic items and related false positives as compared to the NR method.
3 Results
3.1 Sample preparation
Visual inspection of the filters confirmed the presence of chemical resistant materials onto filters. 10% KOH appeared to interfere with the fluorescence tagging method using NR and a 30% KOH : NaClO (v:v) was investigated instead. KOH : NaClO has been applied in several studies as a chemical digestion solution for sediment and biota with no impairment of the identification of the tested polymers by Raman micro-spectrometry (Strand and Tairova, 2016; Enders et al., 2017). Enders et al (2017) developed and tested an alkaline digestion protocol to preserve small plastic particles while removing organic tissue materials. They concluded that using a 30% KOH : NaClO (v:v) solution was effective for the digestion of fish stomachs. The combination of KOH : NaClO was also found to be more effective than KOH and NaClO alone. As a result, a 30% KOH : NaClO (v:v) was prepared and tested in the laboratory for sediment samples. KOH and NaClO combined was effective at suppressing most of the fluorescence of biological residues while leaving intact the fluorescent behaviour of polymers (Figure S2). As a result, a 30% KOH : NaClO (v:v) was selected as the alkaline digestion method for sediment samples.
3.2 Density separation and microplastics recovery
Recoveries of microplastics from spiked clean sediments ranged from 71 ± 10% (mean ± SD) for PP to 100 ± 0.01% for PA and PES (Figure S3).
3.3 Contamination control procedures
Contamination detected on laboratory negative controls averaged 3.31 items per filter (n=24), which was subsequently subtracted from the total particle count for the environmental samples. Fibres were mainly found in the negative controls and were identified as predominantly natural (i.e. cotton and Rayon fibres) indicating an effective contamination control procedure for other types of microplastics such as fragments. Particles identified in the field blanks were mainly cellulose-based fibres and natural polyamides. (Figure S10)
3.4 Monitoring of microlitter from seafloor sediments for the UK
3.4.1 Spatial variations
Abundance of microplastics for seafloor sediment from individual CSEMP stations for all years is shown in Figure 2. Higher concentrations of microplastics were consistently observed for stations 245 (Off Tyne), 345 (Off Humber/Wash), 655 (Cardigan Bay), 536 (Lyme Bay) and 575 (Off Tamar).
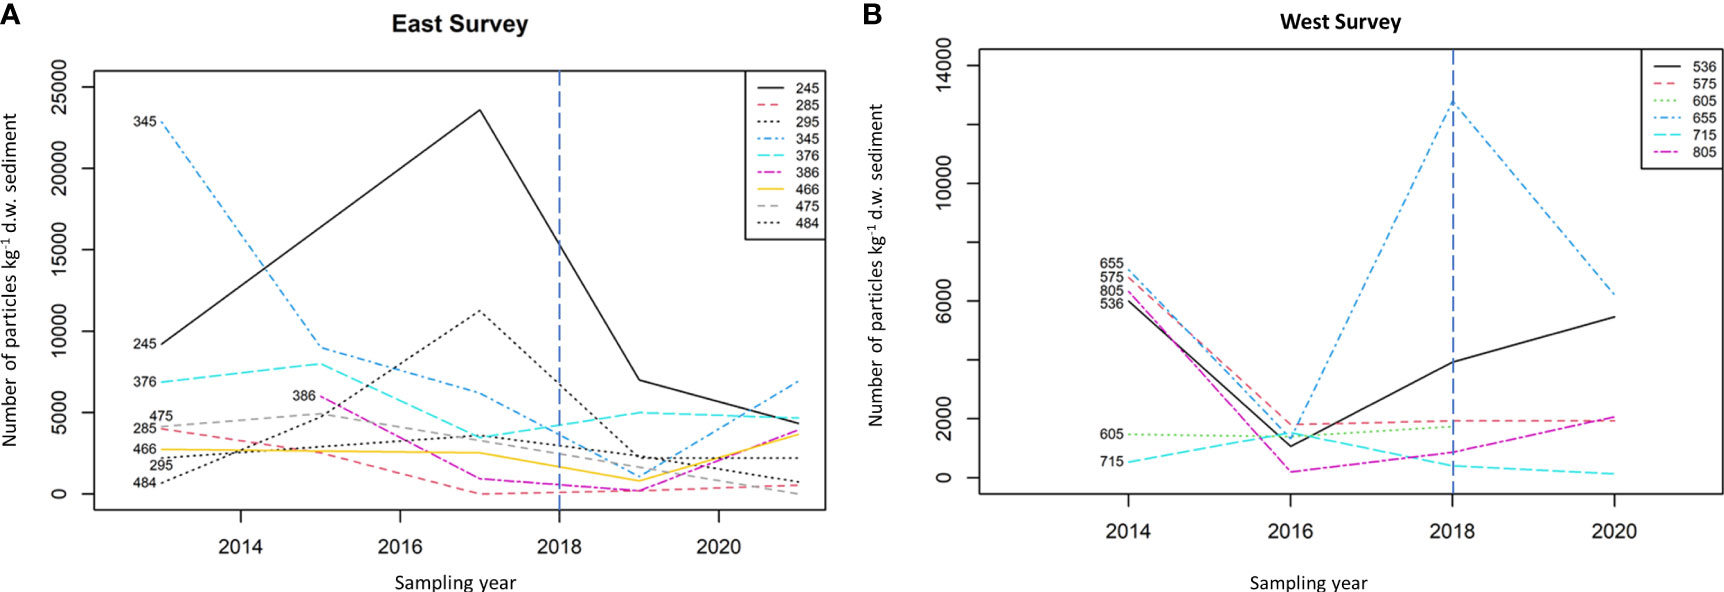
Figure 2 Mean number of particles kg-1 d.w. sediment per station for (A) the East and (B) the West surveys. The vertical blue line at 2018 indicates the change in sampling method from the use of archive samples to dedicated microplastic samples.
A total of 84 particles were analysed for particle characterisation including fluorescent and non-fluorescent items. Particles identified as microplastics consisted mainly of fragments (73%), followed by fibres (19%) and spheres (8%). Plastic fragments ranged from 46 to 3276 μm and plastic fibres from 300 to 1731 μm length with a mean diameter of 16 μm.
Single particle analysis using μ-FTIR indicated a prevalence of Rayon, PP, Rayon/Nylon/Polyester blends, Rubber, PS, PE, PA, PVC, Acrylic, EMAA and PET. Semi-synthetic fibres such as wool/cotton/acrylic/nylon were also detected (Figure 3). Fragments were mainly white in colour (46%) followed by brown (38%), black (1%), blue (1%) and orange (1%). Fibres were mainly white in colour (57%) followed by black (14%), orange (14%) and red (14%). Particles were mainly in the 100 - 299 and 300 - 999 μm size fraction (33% each) followed by 1000 - 5000 μm (19%) and 20 - 99 μm (15%) (Figure S14).
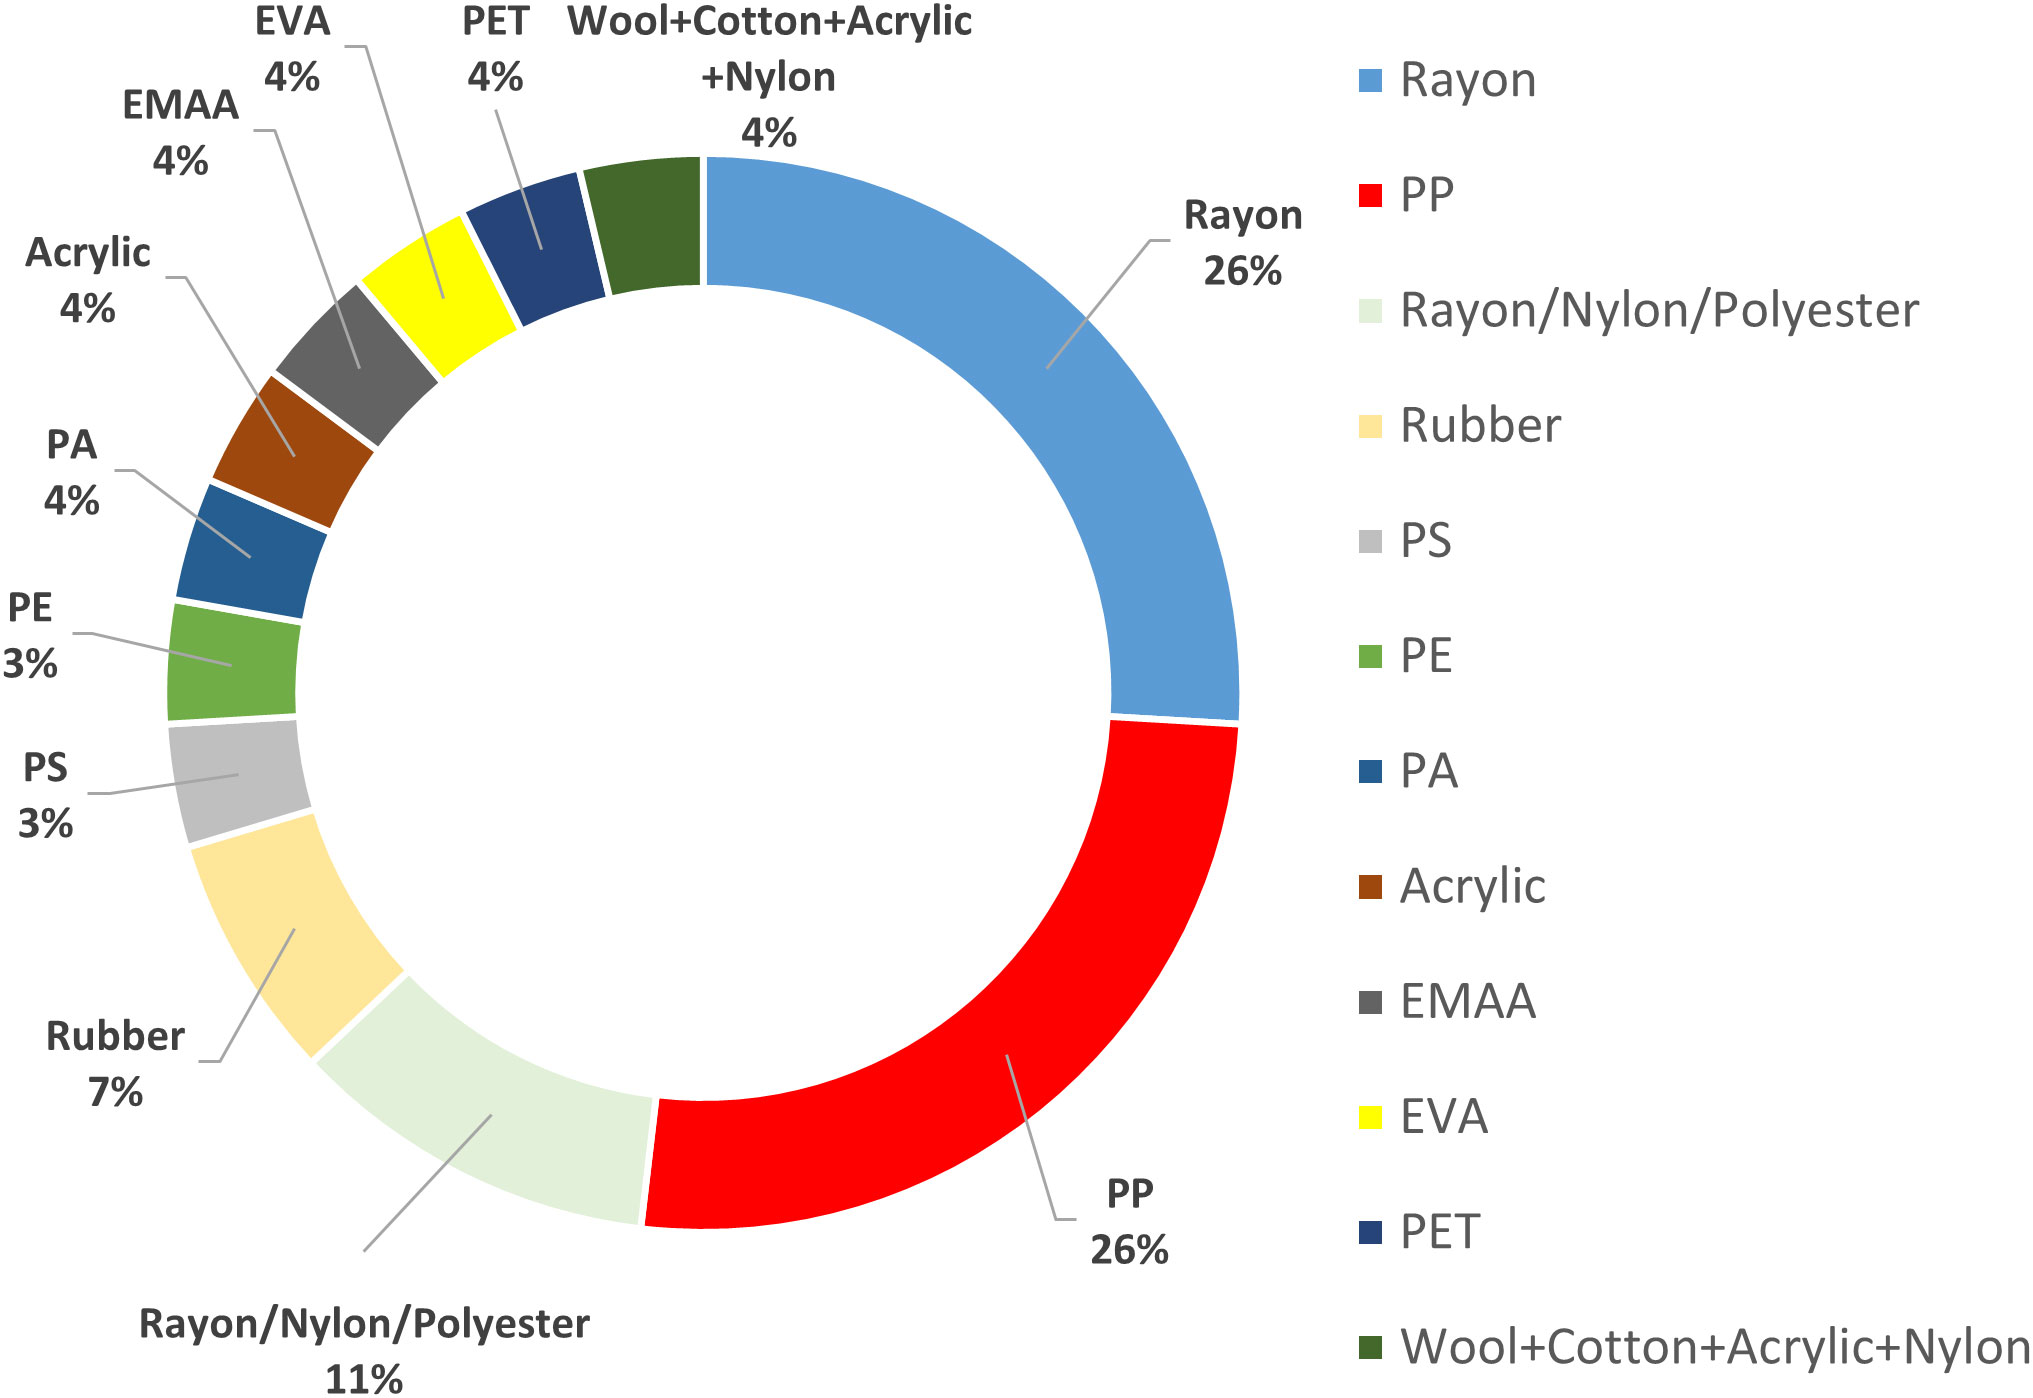
Figure 3 Particles identified using micro-FTIR classified per category (n=27).
3.4.2 Spatial and temporal variations
3.4.2.1 West vs East side
Investigation into the abundance of microplastics was carried out for the East and West side of the UK for the time-period 2013-2021 (Figure 4). Both LR (p=0.028) and MK (p=0.041) trend analyses on the East data suggest a negative trend. However, there was no such evidence for the West data (LR: p=0.64 and MK: p=0.89). For the time-period 2018-2021, no trends were observed for the East side (LR: p=0.63) and MK: p=0.79) and for the West side (LR: p=0.96 and MK p=0.71). Higher concentrations of microplastics were consistently observed for stations 245 (off Tyne), 345 (off Humber/Wash), 655 (Cardigan Bay), 536 (Lyme Bay) and 575 (off Tamar).
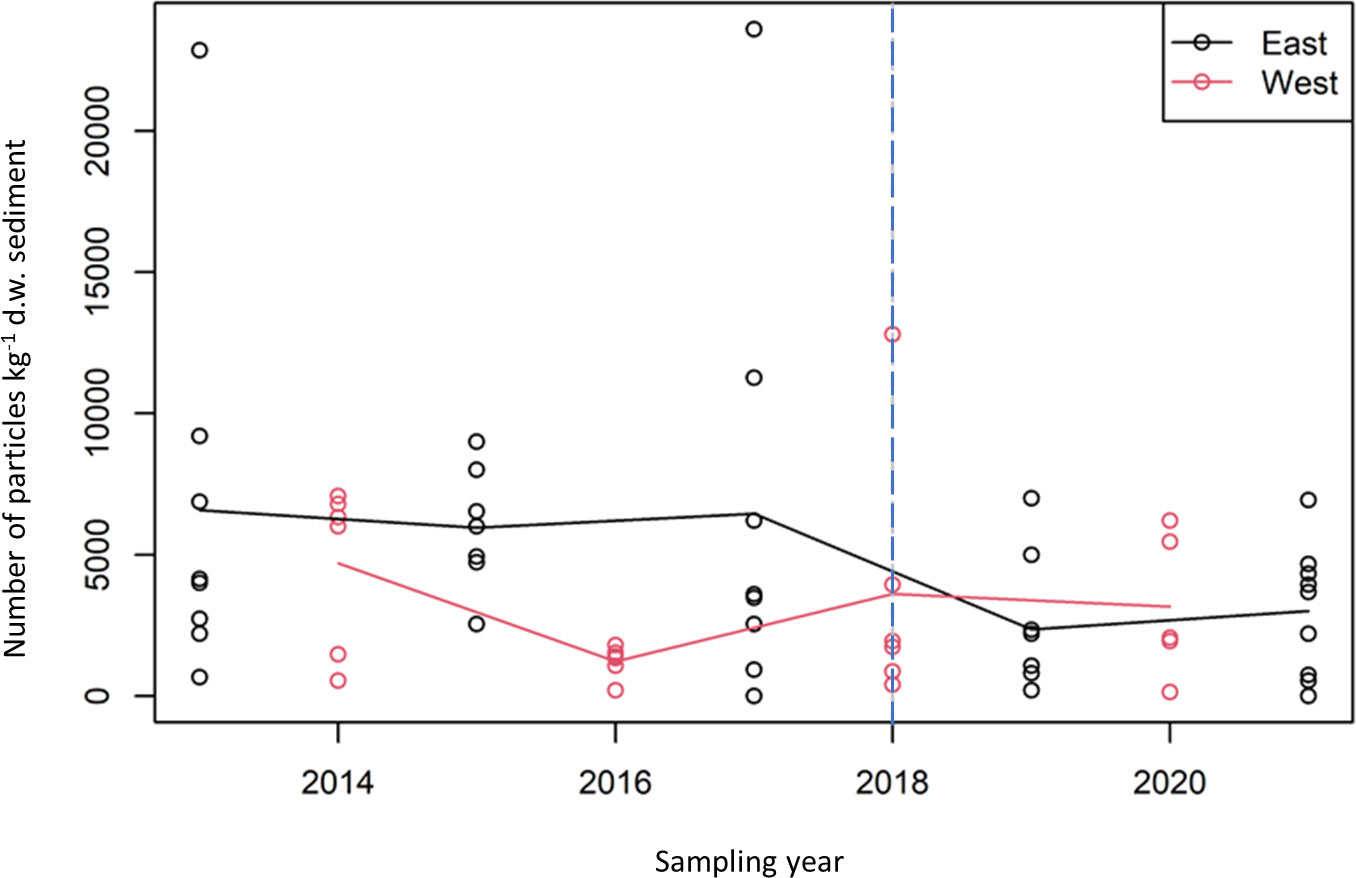
Figure 4 Mean particles kg-1 d.w. sediment plotted against year for East (black) and West (red) survey data. Also shown are lines linking the means of the square root counts for each of the two surveys. The vertical blue line at 2018 indicates the change in sampling method from the use of archive samples to dedicated microplastic samples.
3.4.2.2 UK regional seas
Investigation into the abundance of microplastics was carried out for UK regional seas (Figure 5). There is little visual evidence of any trends in the abundance of microplastics over time in any of the seas – apart from the Northern North Sea with a reduction in abundance over time.
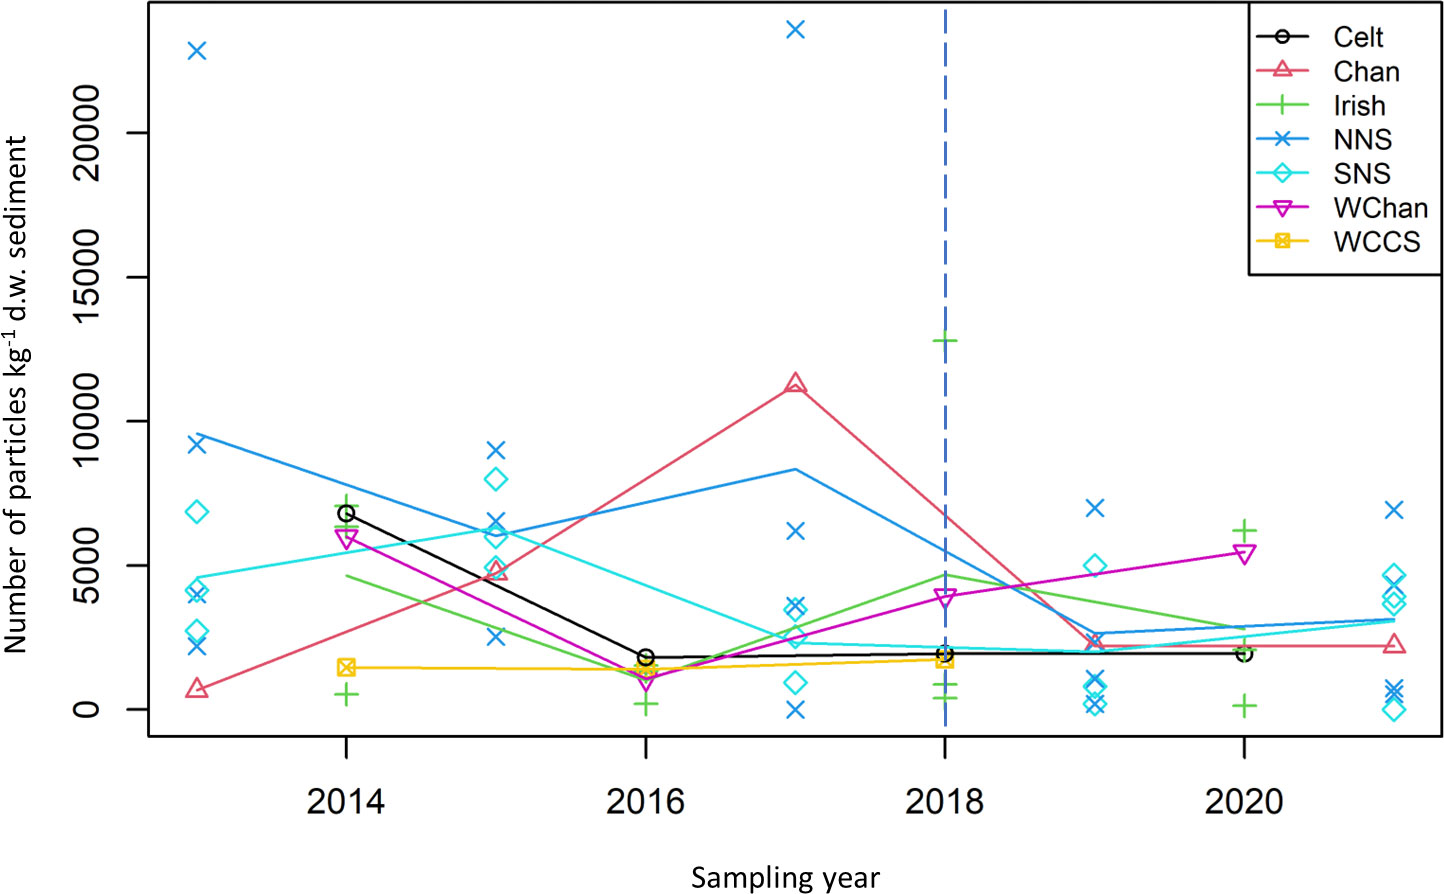
Figure 5 Mean number of particles kg-1 d.w. sediment plotted for UK regional seas for different years. (Celt, Celtic Seas; Chan, English Channel; Irish, Irish Sea; NNS, Northern North Sea; SNS, Southern North Sea; WChan, Western English Channel; WCCS, Western English Channel & Celtic Seas). Blue line indicates change in sampling method from the use of archive samples to dedicated microplastic samples.
3.4.2.3 Coastal vs offshore stations
The abundance of microplastics was higher for coastal (n=11) as compared to offshore (n=5) locations with an overall mean concentration of 4,380 and 3,825 particles kg-1 d.w. sediment respectively for all years investigated (Figure S12). The difference was however not statistically significant (p=0.109). Statistical outputs are shown in SI section.
3.4.2.4 OSPAR areas
Investigation into the abundance of microplastics was carried out for the OSPAR regions Greater North Sea (region II) and Celtic Seas (region III) (Figure 6). For the period 2013-2021, both LR (p=0.02) and MK (p=0.02) trend analyses on the Greater North Sea data suggested a negative trend. However, there was no such evidence for the Celtic Seas data (LR: p=0.84 and MK: p=0.79). For the period 2018-2021, no trends were observed for the Greater North Sea (LR: p=0.82 and MK p=0.85) and the Celtic Seas (LR: p=0.83 and MK p=1.00).
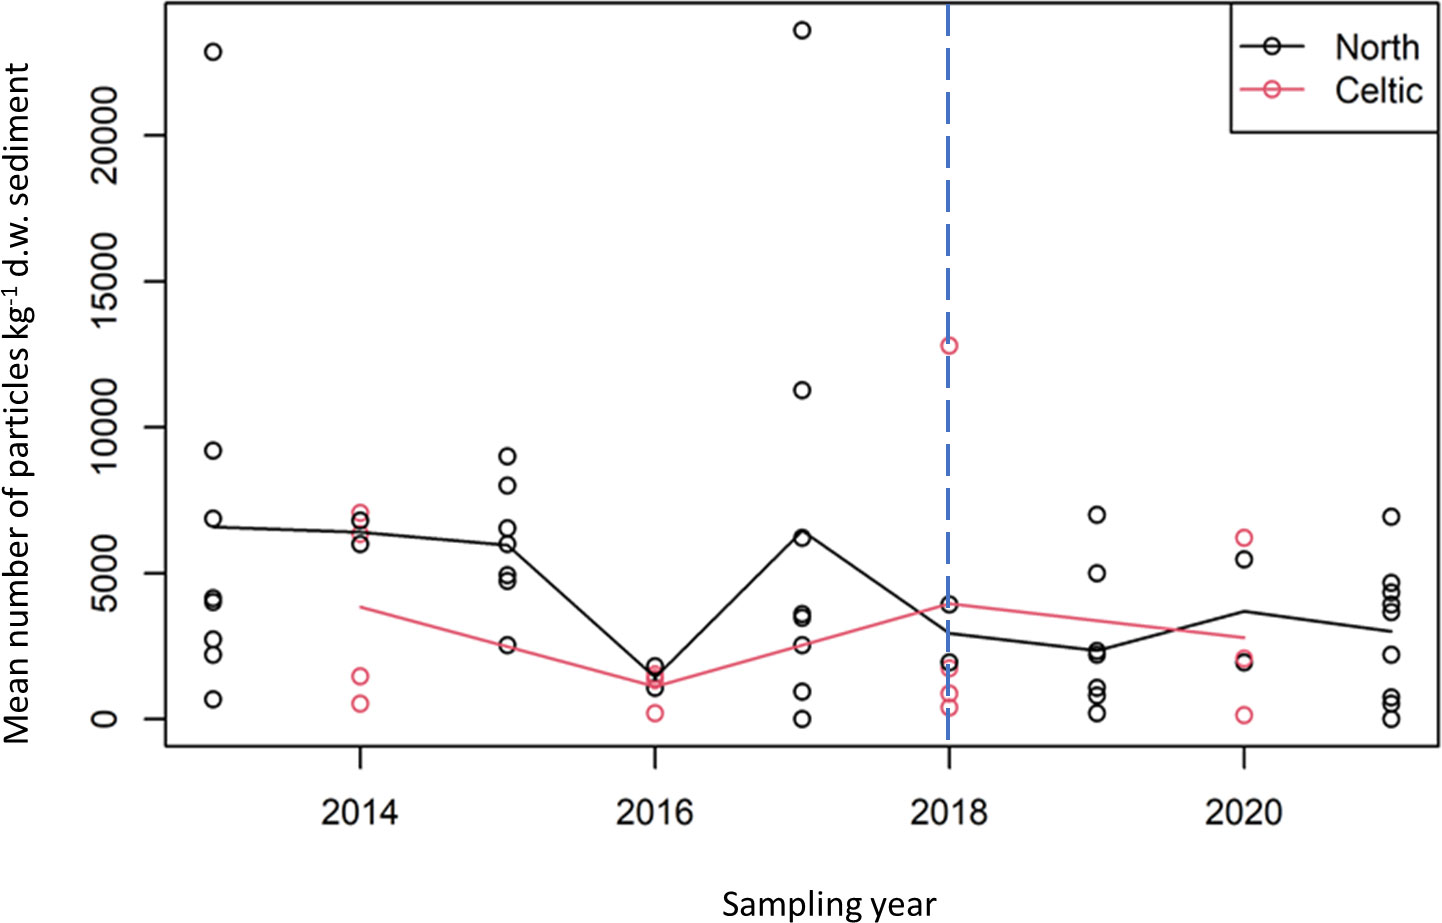
Figure 6 Mean number of particles kg-1 d.w. sediment plotted against year for the Greater North Sea (black) and Celtic Seas (red) survey data. Also shown are lines linking the means of the square root counts for each of the two surveys. Blue line indicates change in sampling method from the use of archive samples to dedicated microplastic samples.
3.4.2.5 Relationship between microplastics abundance and sediment particle size
The square root of the mean number of particles onto filters was plotted against the three substrate variables: %Gravel, %Sand and %Silt (Figure 7). Data indicated a positive relationship between the abundance of microplastics and the sediment in %silt/clay as confirmed by a MK trend analysis (p=0.001). For %sand, there was a statistically significant negative relationship (p=0.002).
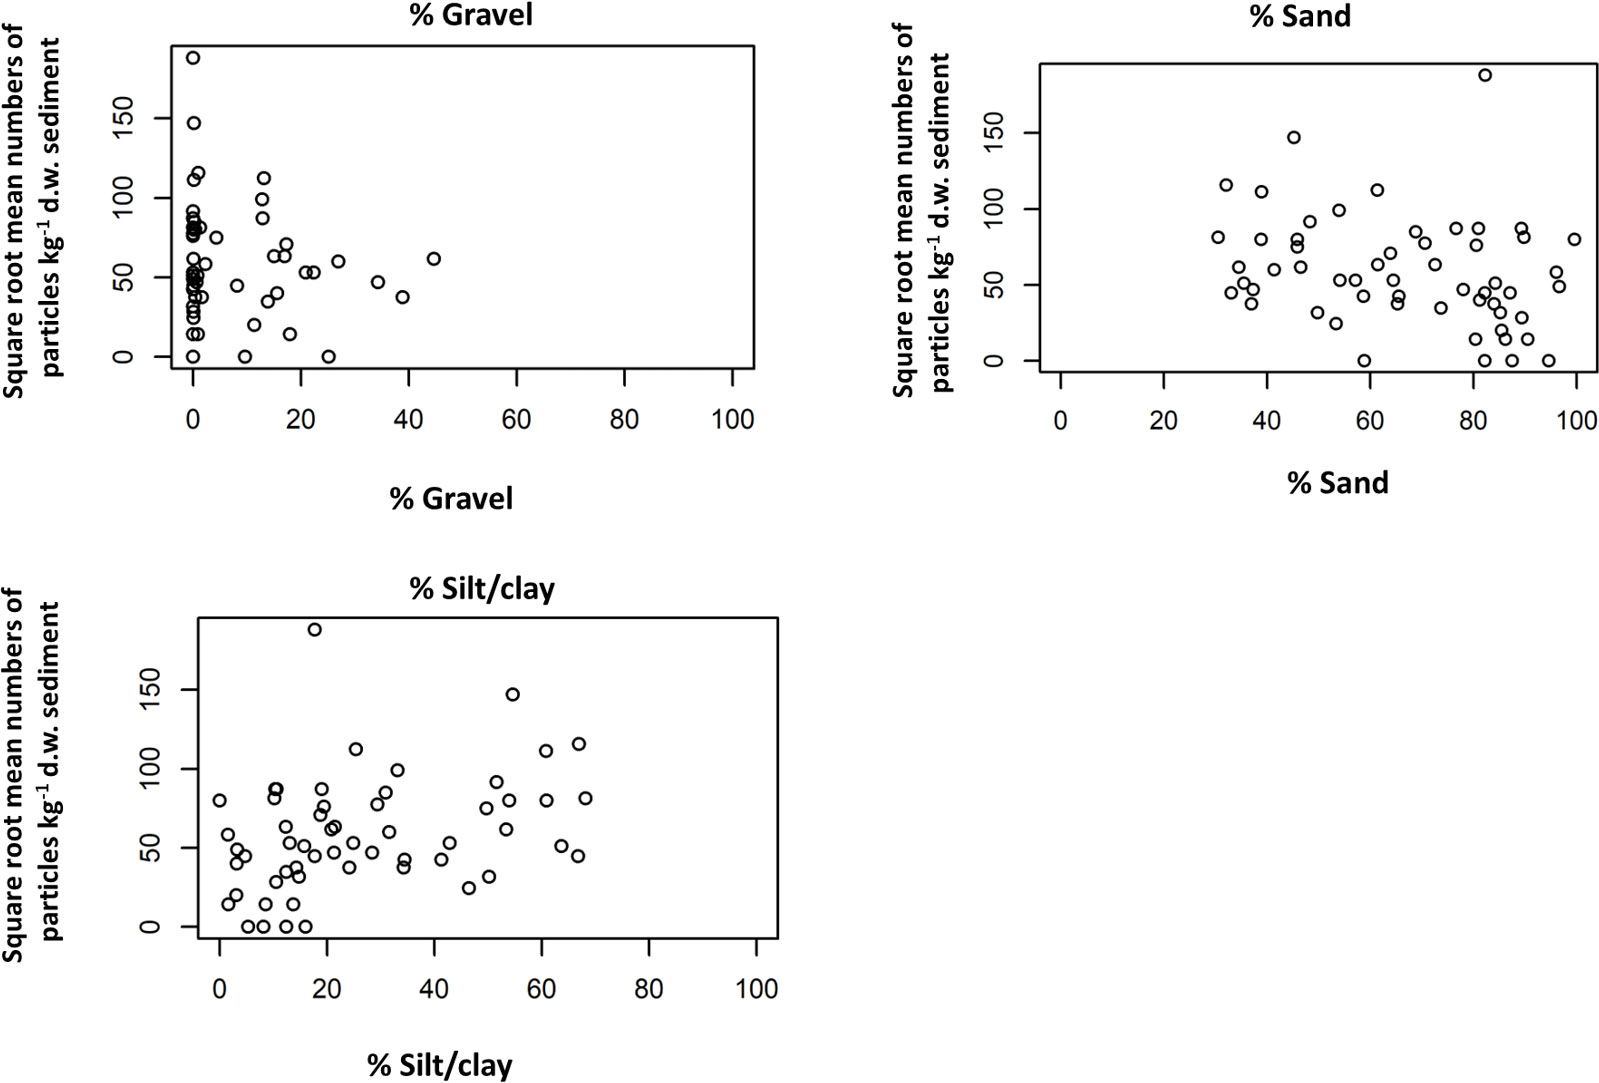
Figure 7 Plots of square root of the mean number of particles kg-1 d.w. sediment against PSA expressed as % Gravel, % sand and % Silt/clay.
3.4.2.6 Relationship between microplastics abundance and organic carbon and nitrogen
The square root of the station means plotted against the four carbon and nitrogen variables is shown in Figure 8. MK analyses suggested a positive relationship between microplastic concentrations and OC2 (p=0.001) and Nit2 (p=0.002). There was a statistically significant negative relationship between microplastic concentrations and Nit63 (p=0.021).
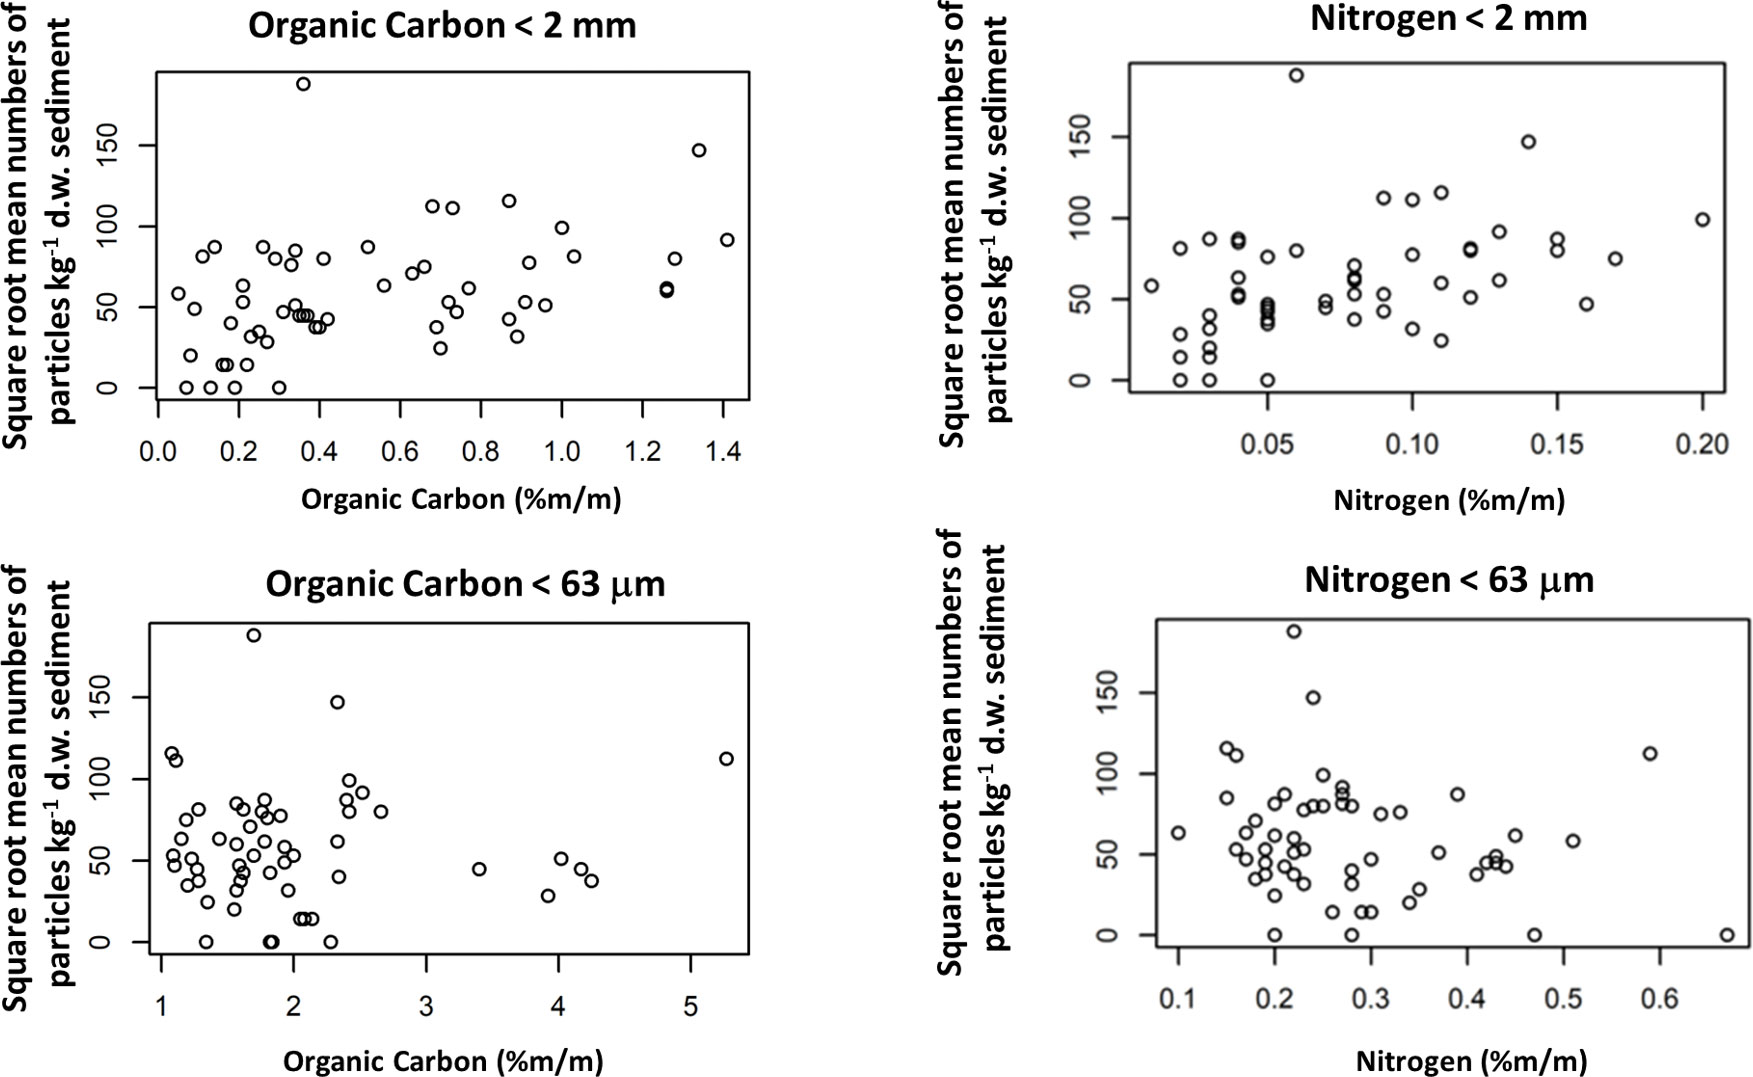
Figure 8 Plots of square root of the mean number of particles kg-1 d.w. sediment against Organic carbon and Nitrogen (%m/m) for < 63 μm and < 2 mm sediment size fractions.
4 Discussion
4.1 Monitoring of microlitter from seafloor sediments for the UK (excluding Scotland and Northern Ireland)
4.1.1 Spatial variations
The abundance of microplastics varied between locations. A higher abundance of microplastics was recorded for coastal locations as compared to offshore locations with mean concentrations of 4,380 and 3,823 particles kg-1 dw sediment respectively. The difference was however not significantly different (p=0.109). While a decrease in concentration gradient was not evident from this study, other studies have reported a decrease in plastic abundance as distance from shore increases (Graca et al., 2017; Bakir et al, 2020a).
The north-west European Shelf is affected by natural physical bed disturbance (Aldridge et al., 2015), but it is also one of the sea regions most impacted by human activities (Halpern et al., 2008). These impacts are dominated by fishing, and it has been estimated that over 99% of human impact on the seabed is from trawling (Foden et al., 2011). These processes will cause spatial and temporal variation in microplastic abundance and should be taken into account for future monitoring outputs (Napper et al., 2022).
4.1.2 UK data in a regional context
The abundance of microplastics collected from seafloor sediments varied according to sampling site and sampling year. For the two more recent years (2020 and 2021) the concentration of microplastics ranged from 0 to 6,933 particles kg-1 d.w. sediment with a mean value of 3,057 ± 2,299 particles kg-1 d.w. sediment. These microplastic concentrations were within the range of those previously reported for the North and Central North Sea as well as the English Channel with concentrations of 0 – 3,146 (Maes et al, 2017a), 100 – 3,600 (Leslie et al., 2017) and 180 – 31,000 particles kg-1 d.w. sediment (Norwegian Environment Agency, 2018).
A recent study by Kukkola et al. (2022) reported a mean concentration of microplastics (down to 10 μm) in sediment cores, collected in 2017. The authors reported concentrations as high as 1,050 particles kg-1 d.w. sediment at the North-West of Jones Bank (Celtic Sea), 2,700 particles kg-1 d.w. sediment at the Canyons (Celtic Sea) and 1,190 particles kg-1 d.w. sediment at Dogger Bank (North Seas). Comparable results were obtained in this study for similar years for the Celtic Sea with concentrations of 1,800 ± 1,778 (mean ± SD) and 1,933 ± 757 (mean ± SD) particles kg-1 d.w. sediment for 2016 and 2018 respectively indicating a good agreement and reproducibility between two separate studies applying the same method.
4.1.3 Identification of ‘hotspots’ of microlitter contamination and likely sources
Consistently significantly (p<0.05) higher concentrations of microplastics were observed over time for stations 245 (Off Tyne), 345 (Humber/Wash), 376 (Off Tyne), 655 (Cardigan Bay), 536 (Lyme Bay), 575 (Off Tamar) and 715 (Liverpool Bay) which can be considered as hotspots of contamination in this study.
Main identified hotspots were located near to rivers and harbours. Harbour sediments are known to act as sinks for anthropogenic contaminants (Knott et al., 2009) including microplastics (Preston-Whyte et al., 2021). While the concentrations of plastic marine litter, including microplastics, are expected to be high in ports, harbours, and navigation channels due to their links to the main sources of plastic pollution (anthropogenic activities, wastewater treatment plants, accidental spillages and littering etc.), it is not clear whether the disposal grounds and surrounding environment are significantly less contaminated. Several identified hotspots of contamination for microplastics were located near to dredge disposal sites (e.g., stations 575, 715) and could explain the high concentrations reported for those locations. Maintenance dredging is utilised in ports and harbours worldwide and little is known about the occurrence and fate of microplastics in dredge materials due to the scarcity of the scientific evidence from the available literature (Mason et al., 2020). Different sediment types (e.g., gravel, sand, or silt/clay) will have different degrees of retention - plastic particles with silt/clay matrices acting as “traps” for these items.
Rivers are known to be the main pathway for the entry of microplastics to the marine environment from land sources (Rochman, 2018). Studies on the abundance of microplastics in freshwater watercourses and estuaries are however limited (Wagner and Lambert, 2018). Settlement of microplastics in freshwaters is influenced by many factors including river morphology, rainfall events, hydrological conditions and vegetation cover (Yan et al., 2021). Recent studies have explored how riverine input of sediments, and wave and tidal energy regimes influence the geomorphology of the coastlines globally, and thus the dispersal and fate of plastic pollution (Harris, 2020; Harris et al., 2021b). Understanding transport of microplastics in riverine systems is therefore essential to assessing impacts and to guide policy actions (Whitehead et al., 2021). Modelling the transport of sediment and associated microplastic from rivers to the marine environment should therefore be a priority for future work (Whitehead et al., 2021).
The abundance of microplastics (20 – 5000 μm) for the Thames (station 466) was also high over time with concentrations ranging from 467 ± 808 to 3,067 ± 757 particles kg-1 d.w. sediment for 2019 and 2021 respectively (Figure 2). Large microplastics (1 to 4 mm) were previously reported in sediments of the tributaries of the Thames with concentrations ranging from 185 to 332 particles kg-1 d.w. sediment (Horton et al., 2017). The higher values reported in our study were probably due to the differences in the smaller particle size reported (down to ~ 20 μm).
There is a lower abundance of microplastics reported for the Thames overall as compared to other rivers (e.g. station 245 - off Tyne and station 345 – off Humber/Wash) which could be explained by the higher proportion of sand (~70%) in the Thames compared with other stations (~10% sand and generally much higher proportion of silt/clay than the Thames).
4.1.4 Validation of method and limitations
The NR screening method for microplastics was applied for a fast and cost-effective assessment of the occurrence of microplastics in seafloor sediment and has recently been used for the large-scale mapping of microplastics (Wang et al., 2018). The presence of false positives has been previously identified as a source of error when applying the NR screening method (Maes et al., 2017b). The introduction of a chemical digestion step did limit the fluorescence of biological and natural items. However, some weak fluorescence remained for some biological materials. Additional visual observation of the fluorescent particles as well as the use of the automated counting tool limited the occurrence of false positives. However, as all false positive samples could not be avoided in all cases, concentrations generated from this study were considered as indicative and comparative, rather than absolute.
4.1.5 Microlitter in the OSPAR maritime area
For the period 2018-2021, for which best practices for sample collection and contamination control were implemented, no temporal trends were observed for the Greater North Sea (region II) and the Celtic Seas (region III), indicating no variations in the abundance of microplastics over that period. In comparison to water and biota samples, seafloor sediment appears therefore to be a relatively stable matrix in the short term. For the time-period 2013-2021, no trend was observed for the Celtic Seas while a negative trend was observed for the Greater North Sea. It is worth noting that for the time-period 2013-2017, archive samples were used for microplastic analysis and could have been subjected to ambient particle contamination during previous sample collection and sample handling impacting the confidence in such negative trend for the area during that time-period. A significant reduction in the abundance of microplastics for the Greater North Sea would require further exploratory investigation including understanding the impact of removal parameters such as such as burial, uptake by biota and resuspension into the water column via several mechanisms including wind-driven waves, tidal streams, upwelling events and bioturbation as well as fishing activities such as trawling (Näkki et al., 2019).
To date, only a few studies have focused on the occurrence of microplastics in seafloor sediments for the OSPAR maritime area with most studies focusing on beach and subtidal compartments. Despite the variation in applied extraction and analytical techniques, there is a clear agreement that microplastics are present in all sediments across the OSPAR area (available data for regions I-V) acting as potential sinks (Leslie et al., 2017; Maes et al., 2017b; Lorenz et al., 2019). Microplastic levels were reported for deep-sea sediments from the Arctic of 42 to 6,595 particles kg-1 d.w. sediment (Bergmann et al., 2017) which was substantially higher than the maximum concentration of microplastics reported in seafloor sediment for the North Sea (3,146 and 3,600 particles kg-1 d.w. sediment reported by Maes et al. (2017b) and Leslie et al. (2017), respectively). North Sea sediments were also considerably more contaminated than surface waters (Lorenz et al., 2019). Reported polymer types appeared to be consistent across regions with a prevalence of PE, PP, PS, PVC, and polyester. Main reported type of microplastics were fibres, followed by fragments.
Fragments were the most common microplastic items found in UK seafloor sediments (73%), followed by fibres (19%) and spheres (8%). Previous studies in the North Sea reported fibres and spheres but not fragments (Leslie et al., 2017 and Maes et al., 2017a). Common polymers identified in this study (PP, PS, PE, PA, PVC, PET, and Acrylic) were consistent with other studies in similar areas (Table 1). Rayon was a very common microfibre in seafloor sediment samples (21%) and has been frequently reported in deep-sea sediments (Comnea-Stancu et al., 2017). Micro-rubbers were also detected in our samples that were most probably attributed to tyre particles. Parker-Jurd et al. (2020) demonstrated the importance of land-based sources of tyre particles to the marine environment, detecting these microplastics in treated wastewater effluent, in storm water drains adjacent to roads and deposited from urban dusts near roadsides (Parker-Jurd et al., 2020). Land-based sources have been generally assumed to be the main contributors for the entry of plastic waste to the marine environment (Gilardi et al., 2020; Meijer et al., 2021). Tyre wear and (macro) litter were identified as the largest land-based sources of microplastics in the OSPAR regions, with estimated amounts of around 100,000 tons year-1 entering the marine environment (OSPAR, 2017).
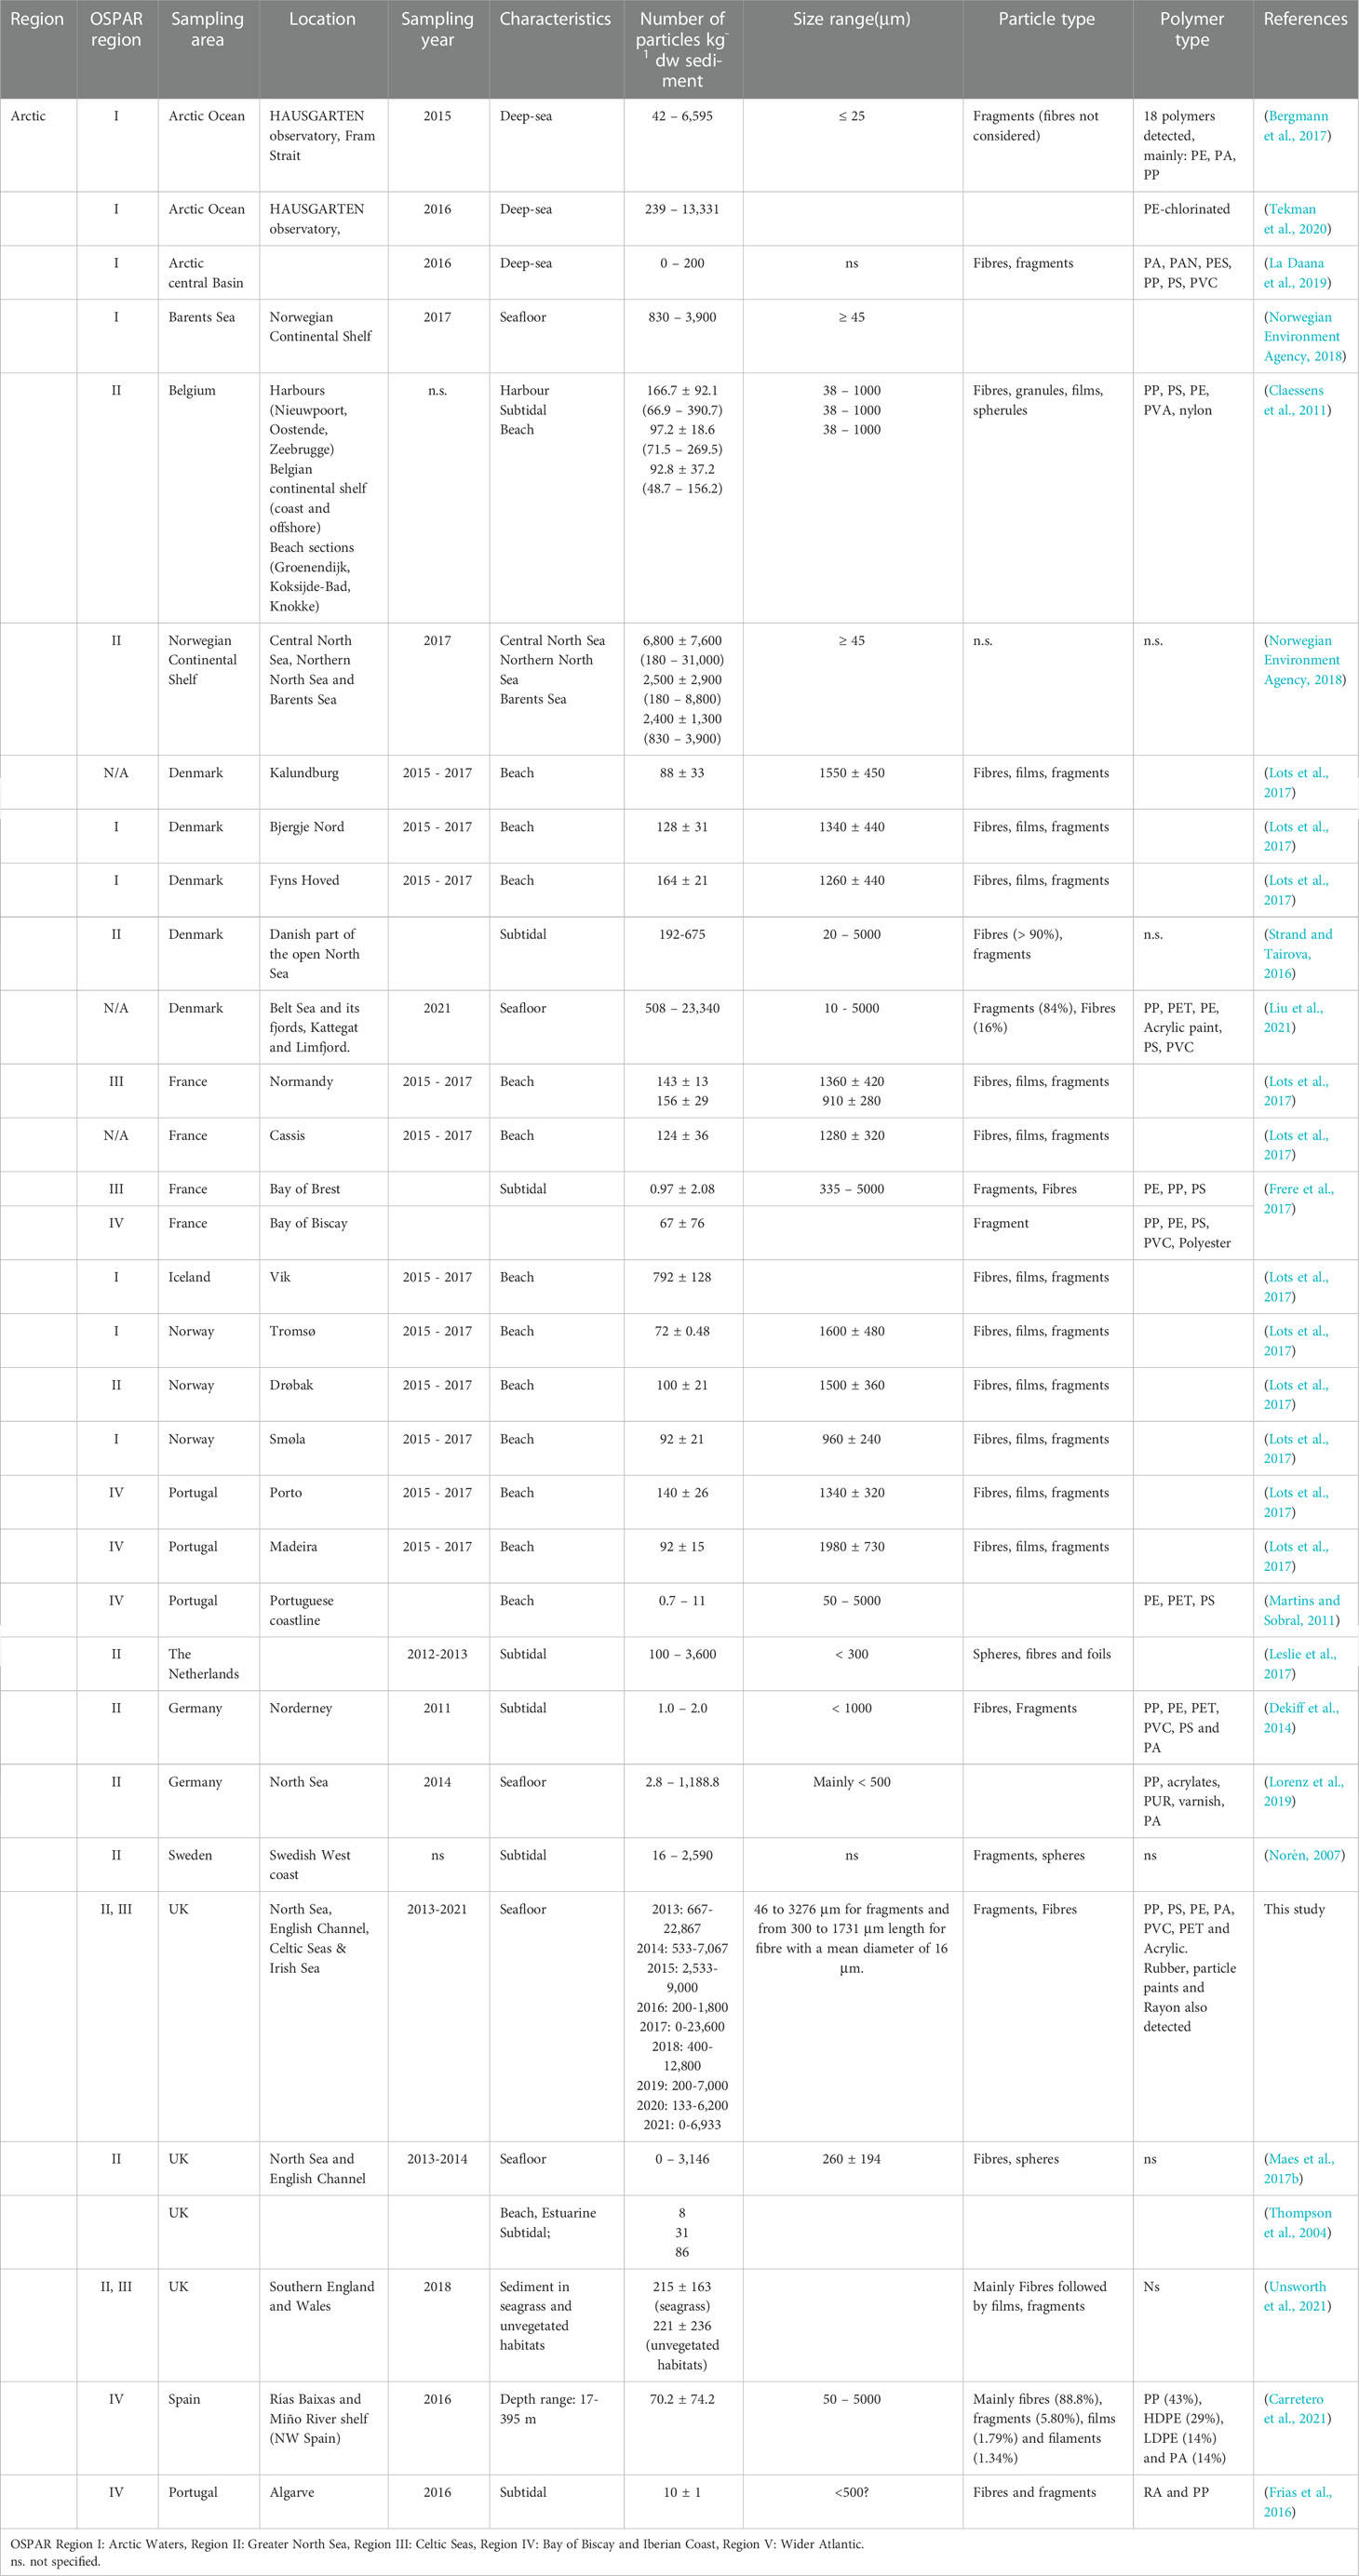
Table 1 Number of particles kg-1 dry weight (d.w.) sediment reported in the literature by OSPAR region (mean ± SD, range in brackets).
5 Validation using focal plane array detector-based micro-Fourier-transform infrared imaging
FPA detector-based micro-Fourier-transform infrared imaging has been proposed as an effective tool for the accurate assessment of microplastics in environmental samples (Löder et al., 2015; Löder and Gerdts, 2015; Mintenig et al., 2017; Primpke et al., 2017). While most laboratories are already equipped with micro-FTIR facilities, the cost of FPAs is often a limiting factor for many laboratories restricting their use in routine monitoring programmes. At an OSPAR level, proposing the use of an FPA detector-based micro-Fourier-transform infrared imaging for the monitoring of microplastics in seafloor sediments is not a cost-effectively viable option. As a result, this technique is proposed as a complementary technique for the validation of data generated using the cheaper NR technique. While the data produced using both methods were generally in agreement (Figure 9), FPA analysis allowed the identification of polymers not identified using the NR technique such as EVA. FPA also allowed the identification of items too small for manual transfer from stained filters to Anodiscs for micro-FTIR analysis with identification of particles down to ~ 20 μm. Furthermore, both micro-FTIR-FPA and NR were applied for a pilot study for the monitoring of microplastics in Dutch marine sediments and were found to be comparable (Figure S15) (Bakir, 2022).
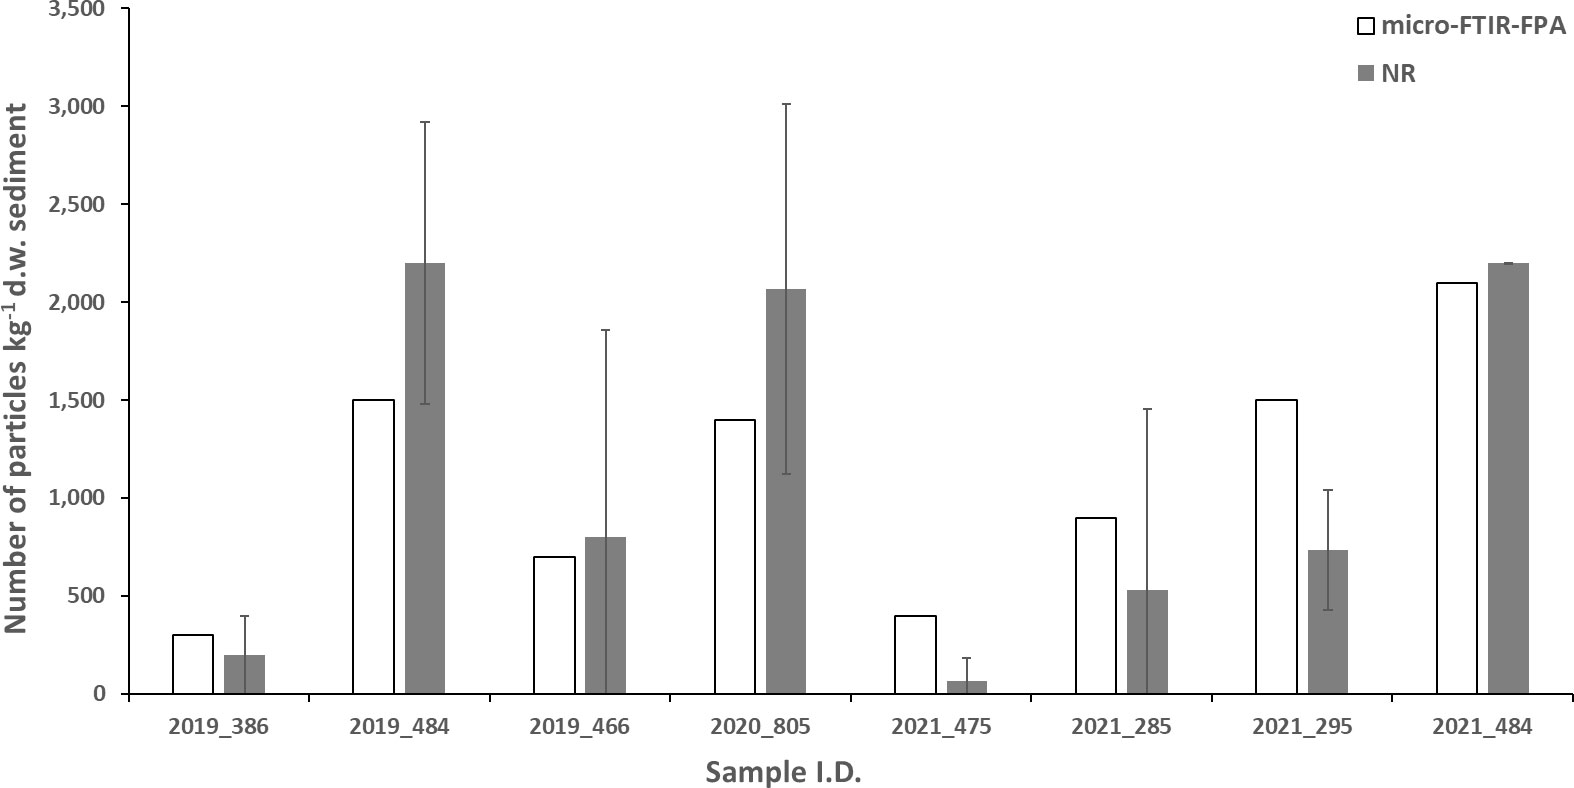
Figure 9 Microplastics analysis from micro-FTIR-FPA and comparison to NR output for some selected sampling sites (n=8).
Liu et al. (2021) also used FTIR-FPA for the analysis of microplastics for Danish seafloor sediments collected in 2021. They reported concentrations in the range of 508 to 23,340 particles kg-1 d.w. sediment for a particle size range of 10 – 5,000 μm which is substantially higher than the range of 0 – 6,933 particles kg-1 d.w. sediment reported in our study for 2021.
6 Relationship between abundance of microplastics and other parameters
6.1 Microplastics and sediment grain size
A positive relationship was observed between the abundance of microplastics and the silt/clay content of sediments (MK: p=0.001) (Figure 7). Maes et al. (2017a) also reported a higher abundance of microplastics from seafloor sediment from the Southern North Sea for sediments with a lower grain size Maes et al, 2017b
It has been suggested that the transport of microplastics in rivers may behave similar to the transport of sediments with fine sediments and microplastics being carried in suspension (Galgani et al., 2000; Browne et al., 2010; Costa et al., 2011; Ballent et al., 2012; Bakir et al., 2014). Particle position in the water column and sinking and deposition velocities onto sediments is mainly influenced by the environment’s turbulence level. With a decreasing level of turbulence along a depth-gradient from coastal environments, seafloor environments are likely sinks for the very fine sediments (< 63 μm) and thus microplastics correlating with that particle fraction size such as fibres, low density polymers and microplastics < 500 μm (Enders et al., 2019). Enders et al., 2019 also suggested that higher density polymers exhibited a sedimentation closer to source, limiting their long-distance transport in the marine environment. However, such a hypothesis is difficult to validate as additional factors such as particle shape, density, conglomeration with suspended particulate matter, interactions with biota (e.g., ingestion and excretion), biofouling and physical resuspension will affect deposition mechanisms and affect short to long-range transport of microplastics.
6.2 Microplastics and OCN
Results from this study demonstrated the integration of microplastics in sediment aggregates along with other pieces of organic matter, especially for sediments with high silt/clay content (section 6.1). Microplastics are also known to influence soil organic carbon fraction distribution as well as contributing to sediment carbon storage (Rillig, 2018; Yu et al., 2021). As a result, microplastics in sediment can be detected as carbon using methods used to quantify sediment organic carbon (Kim et al., 2021) and may also affect sediment parameters such as bulk density which is important to estimate carbon concentration to stocks (e.g. in kg C ha-1) (Rillig, 2018).
Positive relationships were observed between the abundance of microplastics and the organic carbon (OC) (LR: p=0.003 and MK: p=0.002) and nitrogen (< 2 mm) (LR: p=0.003 and MK: p=0.002) in the present study (Figure 8). Maes et al. (2017a) also reported a positive relationship between the abundance of microplastics in seafloor sediment collected from the Southern North Sea and total organic carbon (TOC) in sediment (Maes et al, 2017b). It is however unclear whether the observed positive relationship with organic carbon is due to the presence of microplastics or due to the high silt/clay % in sediment. Further work is recommended to understand the relative contribution of microplastic-carbon in sediment.
7 Conclusions
A rapid screening approach using fluorescence tagging using NR coupled with digital imaging and using a semi-automated data processing was further developed and validated for microplastics from environmental samples. This method was in alignment with previous recommendations that the Nile Red method is a promising approach for the large-scale mapping of microplastics in a monitoring context.
The novel method was applied to sediment samples and was compared to a spectroscopic based technique referred to as micro-FTIR FPA analysis. A summary of the pros and cons of each technique is given in Table 2.
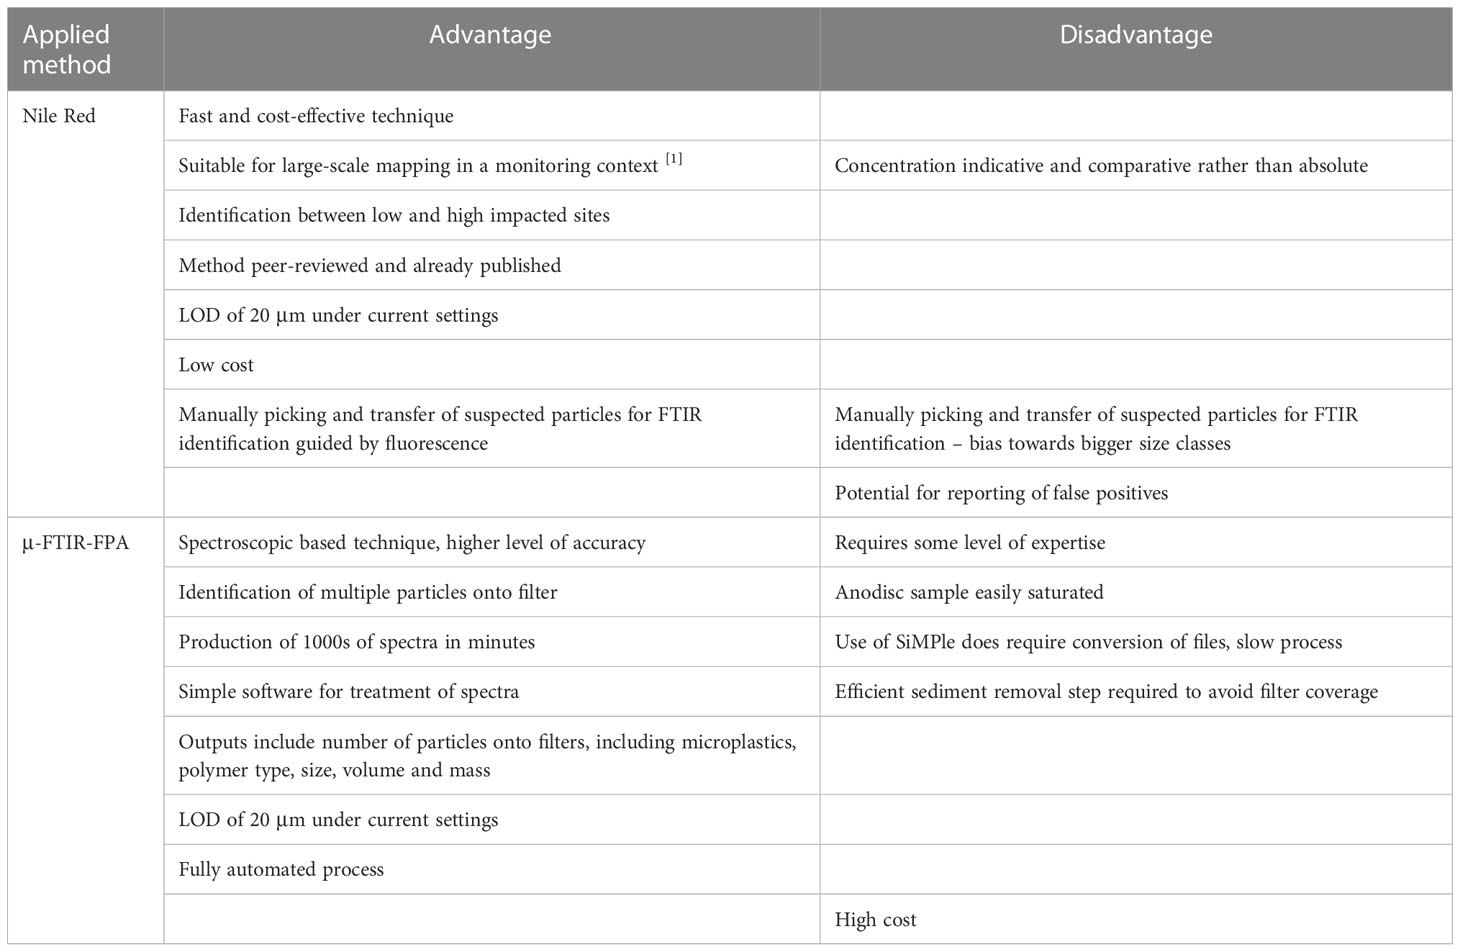
Table 2 Advantages and disadvantages of the use of the NR and μ-FTIR-FPA methods for the monitoring of microplastics in sediment samples.
Microplastics were detected in all the 189 sediment samples from the stations selected around the UK for the time period 2013-2021. To the best of our knowledge, this represents the longest data series for seafloor sediments currently available globally. The results from this study supported the argument that seafloor sediments represent suitable matrices for the monitoring of microlitter (including microplastics) for the UK (England and Wales). The adoption of seafloor sediments as a common indicator for microlitter for the OSPAR area would allow for future assessments at a regional level and to allow for regional action plans rather than isolated national remediation measures. Regional assessments will also allow the identification of knowledge gaps in monitoring data. Addressing those knowledge gaps would allow the creation of “exposure risk maps” for the area with the mapping of accumulation zones for microplastics and more sensitive areas (e.g. marine protected areas, fishing zones). Exposure risk maps would be the first step in developing robust and reliable risk assessment frameworks based on environmental relevant conditions such as concentrations, size and type of plastics items in the natural environment.
Data availability statement
The raw data supporting the conclusions of this article will be made available by the authors, without undue reservation.
Author contributions
AB and TM contributed to conception and design of the study. BS collected the samples. AB and DD processed and analysed the samples. CL carried out the PSA/OC and N analysis. SAR developed the automatic counting tool. JBarry performed the statistical analysis. AB wrote the first draft of the manuscript and JR, TM, CL, CM, JBarber and EEMN reviewed and edited the manuscript. All authors contributed approved the submitted version.
Funding
This study was mainly funded by the Department for Environment Food & Rural Affairs (Defra) in the UK (sampling for CSEMP through a Grant-In_Aid to Cefas and analysis through Defra R&D project code ME4165) with the support of the NERC Current and Future Effects of Microplastics on Marine Ecosystems (MINIMISE) project, reference NE/S003967/1.
Acknowledgments
The authors would like to thank Dr Stefan Bolam (Cefas) for kindly agreeing to internally review earlier versions of the manuscript.
Conflict of interest
The authors declare that the research was conducted in the absence of any commercial or financial relationships that could be construed as a potential conflict of interest.
Publisher’s note
All claims expressed in this article are solely those of the authors and do not necessarily represent those of their affiliated organizations, or those of the publisher, the editors and the reviewers. Any product that may be evaluated in this article, or claim that may be made by its manufacturer, is not guaranteed or endorsed by the publisher.
Supplementary material
The Supplementary Material for this article can be found online at: https://www.frontiersin.org/articles/10.3389/fmars.2022.1093815/full#supplementary-material
References
Aldridge J. N., Parker E. R., Bricheno L. M., Green S. L., van der Molen J. (2015). Assessment of the physical disturbance of the northern European continental shelf seabed by waves and currents. Cont. Shelf Res. 108, 121–140. doi: 10.1016/j.csr.2015.03.004
Bakir A. (2022). Monitoring of microplastics in Dutch marine sediments: a pilot study. pp. 39. https://puc.overheid.nl/rijkswaterstaat/doc/PUC_707712_31/1/
Bakir A., Desender M., Wilkinson T., Van Hoytema N., Amos R., Airahui S., et al. (2020a). Occurrence and abundance of meso and microplastics in sediment, surface waters, and marine biota from the south pacific region. Mar. pollut. Bull. 160, 111572. doi: 10.1016/j.marpolbul.2020.111572
Bakir A., Rowland S. J., Thompson R. C. (2014). Transport of persistent organic pollutants by microplastics in estuarine conditions. Estuar. Coast. Shelf Sci. 140, pp. 14–21. doi: 10.1016/j.ecss.2014.01.004
Bakir A., van der Lingen C. D., Preston-Whyte F., Bali A., Geja Y., Barry J., et al. (2020b). Microplastics in commercially important small pelagic fish species from south Africa. Front. Mar. Sci. 7, 910. doi: 10.3389/fmars.2020.574663
Ballent A., Purser A., de Jesus Mendes P., Pando S., Thomsen L. (2012). Physical transport properties of marine microplastic pollution. Biogeosciences Discuss 9 (12), pp. 18755–18798. doi: 10.5194/bgd-9-18755-2012
Barry J., Maxwell D., Jennings S., Walker D., Murray J. (2017). Emon: An r-package to support the design of marine ecological and environmental studies, surveys and monitoring programmes. Methods Ecol. Evol. 8, 1342–1346. doi: 10.1111/2041-210X.12748
Bergmann M., Wirzberger V., Krumpen T., Lorenz C., Primpke S., Tekman M. B., et al. (2017). High quantities of microplastic in Arctic deep-Sea sediments from the HAUSGARTEN observatory. Environ. Sci. Technol. 51, 11000–11010. doi: 10.1021/acs.est.7b03331
Blott S. J., Pye K. (2001). GRADISTAT: a grain size distribution and statistics package for the analysis of unconsolidated sediments. Earth Surf. Process. Landforms 26, 1237–1248. doi: 10.1002/esp.261
Browne M. A., Galloway T. S., Thompson R. C. (2010). Spatial patterns of plastic debris along estuarine shorelines. Environ. Sci. Technol. 44, 3404–3409. doi: 10.1021/es903784e
Carretero O., Gago J., Viñas L. (2021). From the coast to the shelf: Microplastics in rías baixas and miño river shelf sediments (NW Spain). Mar. pollut. Bull. 162, 111814. doi: 10.1016/j.marpolbul.2020.111814
Catarino A. I., Macchia V., Sanderson W. G., Thompson R. C., Henry T. B. (2018). Low levels of microplastics (MP) in wild mussels indicate that MP ingestion by humans is minimal compared to exposure via household fibres fallout during a meal. Environ. pollut. 237, 675–684. doi: 10.1016/j.envpol.2018.02.069
Claessens M., De Meester S., Van Landuyt L., De Clerck K., Janssen C. R. (2011). Occurrence and distribution of microplastics in marine sediments along the Belgian coast. Mar. pollut. Bull. 62, 2199–2204. doi: 10.1016/j.marpolbul.2011.06.030
Coc C., Rogers A., Barrientos E., Sanchez H. (2021). Micro and macroplastics analysis in the digestive tract of a Sea cucumber (Holothuriidae, holothuria floridana) of the placencia lagoon, Belize. Caribb. J. Sci. 51, 166–174. doi: 10.18475/cjos.v51i2.a2
Comnea-Stancu I. R., Wieland K., Ramer G., Schwaighofer A., Lendl B. (2017). On the identification of rayon/viscose as a major fraction of microplastics in the marine environment: discrimination between natural and manmade cellulosic fibers using Fourier transform infrared spectroscopy. Appl. Spectrosc. 71, 939–950. doi: 10.1177/0003702816660725
Costa M. F., Silva-Cavalcanti J. S., Barbosa C. C., Portugal J. L., Barletta M. (2011). Plastics buried in the inter-tidal plain of a tropical estuarine ecosystem. J. Coast. Res., 339–343.
Dekiff J. H., Remy D., Klasmeier J., Fries E. (2014). Occurrence and spatial distribution of microplastics in sediments from norderney. Environ. pollut. 186, 248–256. doi: 10.1016/j.envpol.2013.11.019
ECHA (2018). Note on substance identification and the potential scope of a restriction on uses of ‘microplastics.’. pp 13. https://echa.europa.eu/documents/10162/13641/note_on_substance_identification_potential_scope_en.pdf/6f26697e-70b5-9ebe-6b59-2e11085de791
Enders K., Käppler A., Biniasch O., Feldens P., Stollberg N., Lange X., et al. (2019). Tracing microplastics in aquatic environments based on sediment analogies. Sci. Rep. 9, 1–15. doi: 10.1038/s41598-019-50508-2
Enders K., Lenz R., Beer S., Stedmon C. A. (2017). Extraction of microplastic from biota: Recommended acidic digestion destroys common plastic polymers. ICES J. Mar. Sci. 74, 326–331. doi: 10.1093/icesjms/fsw173
Foden J., Rogers S. I., Jones A. P. (2011). Human pressures on UK seabed habitats: a cumulative impact assessme. Mar. Ecol. Prog. Ser. 428, 33–47. doi: 10.3354/meps09064
Frere L., Paul-Pont I., Rinnert E., Petton S., Jaffré J., Bihannic I., et al. (2017). Influence of environmental and anthropogenic factors on the composition, concentration and spatial distribution of microplastics: a case study of the bay of Brest (Brittany, France). Environ. pollut. 225, 211–222. doi: 10.1016/j.envpol.2017.03.023
Frias J., Gago J., Otero V., Sobral P. (2016). Microplastics in coastal sediments from southern Portuguese shelf waters. Mar. Environ. Res. 114, 24–30. doi: 10.1016/j.marenvres.2015.12.006
Galgani F., Leaute J. P., Moguedet P., Souplet A., Verin Y., Carpentier A., et al. (2000). Litter on the sea floor along European coasts. Mar. pollut. Bull. 40, 516–527. doi: 10.1016/S0025-326X(99)00234-9
GESAMP Joint Group of Experts on the Scientific Aspects of Marine Environmental Protection (2015). Sources, fate and effects of microplastics in the marine environment: a global assessment. Rep. Stud. GESAMP 90, 96. doi: 10.13140/RG.2.1.3803.7925
Gilardi K. V. K., Antonelis K., Galgani F., Grilly E., He P., Linden O., et al. (2020). Sea-Based sources of marine litter–a review of current knowledge and assessment of data gaps. Second Interim Rep. GESAMP Work. Gr. 43 (4), pp.110.
Graca B., Szewc K., Zakrzewska D., Dołęga A., Szczerbowska-Boruchowska M. (2017). Sources and fate of microplastics in marine and beach sediments of the southern Baltic Sea–a preliminary study. Environ. Sci. pollut. Res. 24, 7650–7661. doi: 10.1007/s11356-017-8419-5
Halpern B. S., Walbridge S., Selkoe K. A., Kappel C. V., Micheli F., d’Agrosa C., et al. (2008). A global map of human impact on marine ecosystems. Sci. (80) 319, 948–952. doi: 10.1126/science.1149345
Harris P. T. (2020). The fate of microplastic in marine sedimentary environments: A review and synthesis. Mar. pollut. Bull. 158, 111398. doi: 10.1016/j.marpolbul.2020.111398
Harris P. T., Tamelander J., Lyons Y., Neo M. L., Maes T. (2021a). Taking a mass-balance approach to assess marine plastics in the south China Sea. Mar. pollut. Bull. 171, 112708. doi: 10.1016/j.marpolbul.2021.112708
Harris P. T., Westerveld L., Nyberg B., Maes T., Macmillan-Lawler M., Appelquist L. R. (2021b). Exposure of coastal environments to river-sourced plastic pollution. Sci. Total Environ. 769, 145222. doi: 10.1016/j.scitotenv.2021.145222
Horton A. A., Svendsen C., Williams R. J., Spurgeon D. J., Lahive E. (2017). Large Microplastic particles in sediments of tributaries of the river Thames, UK–abundance, sources and methods for effective quantification. Mar. pollut. Bull. 114, 218–226. doi: 10.1016/j.marpolbul.2016.09.004
Jambeck J. R., Geyer R., Wilcox C., Siegler T. R., Perryman M., Andrady A., et al. (2015). Plastic waste inputs from land into the ocean. Science 80-.). 347, 768–771. doi: 10.1126/science.1260352
Kane I. A., Clare M. A. (2019). Dispersion, accumulation, and the ultimate fate of microplastics in deep-marine environments: a review and future directions. Front. Earth Sci. 7, 1–27. doi: 10.3389/feart.2019.00080
Kim S. W., Jeong S.-W., An Y.-J. (2021). Microplastics disrupt accurate soil organic carbon measurement based on chemical oxidation method. Chemosphere 276, 130178. doi: 10.1016/j.chemosphere.2021.130178
Knott N. A., Aulbury J. P., Brown T. H., Johnston E. L. (2009). Contemporary ecological threats from historical pollution sources: impacts of large-scale resuspension of contaminated sediments on sessile invertebrate recruitment. J. Appl. Ecol. 46, 770–781. doi: 10.1111/j.1365-2664.2009.01679.x
Koutnik V. S., Leonard J., Brar J., Cao S., Glasman J. B., Cowger W., et al. (2022). Transport of microplastics in stormwater treatment systems under freeze-thaw cycles: Critical role of plastic density. Water Res. 222, 118950. doi: 10.1016/j.watres.2022.118950
Kukkola A. T., Senior G., Maes T., Silburn B., Bakir A., Kröger S., et al. (2022). A large-scale study of microplastic abundance in sediment cores from the UK continental shelf and slope. Mar. pollut. Bull. 178, 113554. doi: 10.1016/j.marpolbul.2022.113554
La Daana K. K., Johansson C., Frias J., Gardfeldt K., Thompson R. C., O’Connor I. (2019). Deep sea sediments of the Arctic central basin: A potential sink for microplastics. Deep Sea Res. Part I Oceanogr. Res. Pap. 145, 137–142. doi: 10.1016/j.dsr.2019.03.003
Lebreton L. C. M., van der Zwet J., Damsteeg J.-W., Slat B., Andrady A., Reisser J. (2017). River plastic emissions to the world’s oceans. Nat. Commun. 8, 15611. doi: 10.1038/ncomms15611
Leistenschneider C., Burkhardt-Holm P., Mani T., Primpke S., Taubner H., Gerdts G. (2021). Microplastics in the weddell Sea (Antarctica): A forensic approach for discrimination between environmental and vessel-induced microplastics. Environ. Sci. Technol. 55, 15900–15911. doi: 10.1021/acs.est.1c05207
Leslie H. A., Brandsma S. H., van Velzen M. J. M., Vethaak A. D. (2017). Microplastics en route: Field measurements in the Dutch river delta and Amsterdam canals, wastewater treatment plants, north Sea sediments and biota. Environ. Int. 101, 133–142. doi: 10.1016/j.envint.2017.01.018
Liu F., Lorenz C., Vollertsen J. (2021). Marine strategy – Analysis of microplastic particles in sediments. Aalbog University for the Danish Environmental Agency: Ministry of Environment and Food of Denmark. pp. 64.
Löder M. G. J., Kuczera M., Mintenig S., Lorenz C., Gerdts G. (2015). Focal plane array detector-based micro-fourier-transform infrared imaging for the analysis of microplastics in environmental samples. Environ. Chem. 12, 563–581. doi: 10.1071/EN14205
Lorenz C., Roscher L., Meyer M. S., Hildebrandt L., Prume J., Löder M. G. J., et al. (2019). Spatial distribution of microplastics in sediments and surface waters of the southern north Sea. Environ. pollut. 252, 1719–1729. doi: 10.1016/j.envpol.2019.06.093
Lots F. A. E., Behrens P., Vijver M. G., Horton A. A., Bosker T. (2017). A large-scale investigation of microplastic contamination: Abundance and characteristics of microplastics in European beach sediment. Mar. pollut. Bull. 123, 219–226. doi: 10.1016/j.marpolbul.2017.08.057
Maes T., Jessop R., Wellner N., Haupt K., Mayes A. G. (2017a). A rapid-screening approach to detect and quantify microplastics based on fluorescent tagging with Nile red. Sci. Rep. 7, 44501. doi: 10.1038/srep44501
Maes T., van der Meulen M. D., Devriese L. I., Leslie H. A., Huvet A., Frère L., et al. (2017b). Microplastics baseline surveys at the water surface and in sediments of the north-East Atlantic. Front. Mar. Sci. 4, 135. doi: 10.3389/fmars.2017.00135
Martins J., Sobral P. (2011). Plastic marine debris on the Portuguese coastline: a matter of size? Mar. pollut. Bull. 62, 2649–2653. doi: 10.1016/j.marpolbul.2011.09.028
Mason C. (2011). NMBAQC’s best practice guidance. particle size analysis (PSA) for supporting biological analysis. National Marine Biological AQC Coordinating Committee
Mason C., Lonsdale J., Vivian C., Griffith A., Warford L., Hynes C., et al. (2020). Review of action levels used for assessing dredging and disposal marine licence. doi: 10.3390/geosciences12010003
Meijer L. J. J., van Emmerik T., van der Ent R., Schmidt C., Lebreton L. (2021). More than 1000 rivers account for 80% of global riverine plastic emissions into the ocean. Sci. Adv. 7, eaaz5803. doi: 10.1126/sciadv.aaz5803
Mintenig S. M., Int-Veen I., Löder M. G. J., Primpke S., Gerdts G. (2017). Identification of microplastic in effluents of waste water treatment plants using focal plane array-based micro-fourier-transform infrared imaging. Water Res. 108, 365–372. 10.1016/j.watres.2016.11.015
Näkki P., Setälä O., Lehtiniemi M. (2019). Seafloor sediments as microplastic sinks in the northern Baltic Sea–negligible upward transport of buried microplastics by bioturbation. Environ. pollut. 249, 74–81. doi: 10.1016/j.envpol.2019.02.099
Nalbone L., Panebianco A., Giarratana F., Russell M. (2021). Nile Red staining for detecting microplastics in biota: Preliminary evidence. Mar. pollut. Bull. 172, 112888. doi: 10.1016/j.marpolbul.2021.112888
Napper I. E., Wright L. S., Barrett A. C., Parker-Jurd F. N. F., Thompson R. C. (2022). Potential microplastic release from the maritime industry: Abrasion of rope. Sci. Total Environ. 804, 150155. doi: 10.1016/j.scitotenv.2021.150155
Norwegian Environment Agency (2018) Microplastics in sediments on the Norwegian continental shelf. Available at: https://doi.org/2018-0050,Rev.01.
OSPAR (2017). Assessment document of land-based inputs of microplastics in the marine environment. (London, UK: OSPAR Commission)
OSPAR (2021) . marine litter. Available at: https://www.ospar.org/work-areas/eiha/marine-litter (Accessed 7.21.21).
Otsu N. (1979). A threshold selection method from graylevel histograms. IEEE Trans. Syst. Man. Cybern. 9, 62–66. doi: 10.1109/TSMC.1979.4310076
Parker-Jurd F., Napper I. E., Abbott G. D., Hann S., Wright S. L., Thompson R. C. (2020). Investigating the sources and pathways of synthetic fibre and vehicle tyre wear contamination into the marine environment. Report prepared for DEFRA (project code ME5435). pp. 71
PlasticsEurope (2021) . EU plastics production and demand first estimates for 2020. Available at: https://www.plasticseurope.org/en/newsroom/news/eu-plastics-production-and-demand-first-estimates-2020.
Preston-Whyte F., Silburn B., Meakins B., Bakir A., Pillay K., Worship M., et al. (2021). Meso-and microplastics monitoring in harbour environments: A case study for the port of Durban, south Africa. Mar. pollut. Bull. 163, 111948. doi: 10.1016/j.marpolbul.2020.111948
Primpke S., Lorenz C., Rascher-Friesenhausen R., Gerdts G. (2017). An automated approach for microplastics analysis using focal plane array (FPA) FTIR microscopy and image analysis. Anal. Methods 9, 1499–1511. doi: 10.1039/C6AY02476A
Rillig M. C. (2018). Microplastic disguising as soil carbon storage. Environmental Science & Technology 52, 6079–6080. doi: 10.1021/acs.est.8b02338
Rochman C. M. (2018). Microplastics research-from sink to source. Science 80-.). 360, 28–29. doi: 10.1126/science.aar7734
Shruti V. C., Pérez-Guevara F., Roy P. D., Kutralam-Muniasamy G. (2021). Analyzing microplastics with Nile red: Emerging trends, challenges, and prospects. J. Hazard. Mater 423 Part B, 127171. doi: 10.1016/j.jhazmat.2021.127171
Strand J., Tairova Z. (2016). Microplastic particles in north Sea sediments 2015. DCE - Danish Cent. Environ. Energy, 20pp.
Taylor M. L., Gwinnett C., Robinson L. F., Woodall L. C. (2016). Plastic microfibre ingestion by deep-sea organisms. Sci. Rep. 6, 1–9. doi: 10.1038/srep33997
Tekman M. B., Wekerle C., Lorenz C., Primpke S., Hasemann C., Gerdts G., et al. (2020). Tying up loose ends of microplastic pollution in the Arctic: distribution from the sea surface through the water column to deep-sea sediments at the HAUSGARTEN observatory. Environ. Sci. Technol. 54, 4079–4090. doi: 10.1021/acs.est.9b06981
Thompson R. C., Olson Y., Mitchell R. P., Davis A., Rowland S. J., John A. W. G., et al. (2004). Lost at Sea: Where is all the plastic? Sci. (80-.). 304, 838. doi: 10.1126/science.1094559
Underwood A. J., Underwood A. L., Underwood A. J., Wnderwood A. J. (1997). Experiments in ecology: their logical design and interpretation using analysis of variance (Cambridge, UK: Cambridge University Press).
Unsworth R. K. F., Higgs A., Walter B., Cullen-Unsworth L. C., Inman I., Jones B. L. (2021). “Canopy accumulation: Are seagrass meadows a sink of microplastics?,” in Oceans Switzerland: MDPI, Basel, 162–178.
Van der Walt S., Schönberger J.L., Nunez-Iglesias J., Boulogne F., Warner J.D., Yager N., et al (2014). scikit-image: image processing in Python. PeerJ 2, e453.
Wagner M., Lambert S. (2018). Freshwater microplastics, handbook of environmental chemistry. (Switzerland AG: Springer Cham). doi: 10.1007/978-3-319-61615-5
Wang Z., Su B., Xu X., Di D., Huang H., Mei K., et al. (2018). Preferential accumulation of small (< 300 μm) microplastics in the sediments of a coastal plain river network in eastern China. Water Res. 144, 393–401. doi: 10.1016/j.watres.2018.07.050
Whitehead P. G., Bussi G., Hughes J. M. R., Castro-Castellon A. T., Norling M. D., Jeffers E. S., et al. (2021). Modelling microplastics in the river Thames: sources, sinks and policy implications. Water 13, 861. doi: 10.3390/w13060861
Woodall L. C., Sanchez-Vidal A., Canals M., Paterson G. L. J., Coppock R., Sleight V., et al. (2014). The deep sea is a major sink for microplastic debris. R. Soc Open Sci. 1 (4), 140317. doi: 10.1098/rsos.140317
Yan M., Wang L., Dai Y., Sun H., Liu C. (2021). Behavior of microplastics in inland waters: Aggregation, settlement, and transport. Bull. Environ. Contam. Toxicol. 107 (4), 1–10. doi: 10.1007/s00128-020-03087-2
Yu H., Zhang Z., Zhang Y., Song Q., Fan P., Xi B., et al. (2021). Effects of microplastics on soil organic carbon and greenhouse gas emissions in the context of straw incorporation: A comparison with different types of soil. Environ. pollut. 288, 117733. doi: 10.1016/j.envpol.2021.117733
Keywords: microlitter, sediments, sink, plastic particles, OSPAR, UK
Citation: Bakir A, Doran D, Silburn B, Russell J, Archer-Rand S, Barry J, Maes T, Limpenny C, Mason C, Barber J and Nicolaus EEM (2023) A spatial and temporal assessment of microplastics in seafloor sediments: A case study for the UK. Front. Mar. Sci. 9:1093815. doi: 10.3389/fmars.2022.1093815
Received: 09 November 2022; Accepted: 12 December 2022;
Published: 12 January 2023.
Edited by:
Alex Ford, University of Portsmouth, United KingdomReviewed by:
Fay Couceiro, University of Portsmouth, United KingdomAnish Kumar Warrier, Manipal Academy of Higher Education, India
Copyright © 2023 Bakir, Doran, Silburn, Russell, Archer-Rand, Barry, Maes, Limpenny, Mason, Barber and Nicolaus. This is an open-access article distributed under the terms of the Creative Commons Attribution License (CC BY). The use, distribution or reproduction in other forums is permitted, provided the original author(s) and the copyright owner(s) are credited and that the original publication in this journal is cited, in accordance with accepted academic practice. No use, distribution or reproduction is permitted which does not comply with these terms.
*Correspondence: Adil Bakir, adil.bakir@cefas.gov.uk