Hydrological and Biogeochemical Patterns in the Sicily Channel: New Insights From the Last Decade (2010-2020)
 Francesco Placenti1
  Marco Torri2*
  Federica Pessini3
  Bernardo Patti4 Vincenzo Tancredi1
  Angela Cuttitta2 Luigi Giaramita1
  Giorgio Tranchida1
  Roberto Sorgente3
- 1National Research Council of Italy, Institute for the Study of Anthropic Impacts and Sustainability in the Marine Environment, (CNR-IAS), Campobello di Mazara, Italy
- 2National Research Council of Italy, Institute for Studies on the Mediterranean (CNR-ISMed), Palermo, Italy
- 3National Research Council of Italy, Institute for the Study of Anthropic Impacts and Sustainability in the Marine Environment (CNR-IAS), Oristano, Italy
- 4National Research Council of Italy, Institute for the Study of Anthropic Impacts and Sustainability in the Marine Environment (CNR-IAS), Palermo, Italy
The hydrological and biogeochemical time series from 2010 to 2020 have highlighted specific relationships and trends in oceanographic processes and nutrient patterns in the Sicily Channel. Specifically, temperature and salinity time series in the intermediate waters showed a sharp annual increase of about 0.06°C and 0.09 within the period 2010-2020, at rates that are about 50% higher than what observed within the previous decade. Similar trends were also present in deep waters, although with lower variations of both temperature and salinity. The time series in the intermediate water, also highlighted the presence of quasi cyclic fluctuations that can be associated with the alternation of the circulation modes (cyclonic and anticyclonic) of the Northern Ionian Gyre. Moreover, an opposite trend emerged by comparing the nutrients and salinity time series in intermediate waters, while similar patterns has been evidenced between nutrients and chlorophyll-a concentration. This latter finding is not consistently present in the Mediterranean area, suggesting the need of further studies on a wider scale.
Introduction
The Mediterranean Sea (MS) consists of two basins, the Western Mediterranean (WMS) and the Eastern Mediterranean (EMS), connected by the Sicily Channel (SC), and is characterized by a limited water exchange with the Atlantic Ocean. In the MS the net evaporation exceeds the precipitation, driving an anti-estuarine circulation through the Strait of Gibraltar, which has important implications on the physical and biogeochemical properties of the MS. The thermohaline circulation of the MS is described as an open basin-wide cell, which involves the gradual salinification of the fresher surface Atlantic water (AW) while propagating eastward (Gačić et al., 2013), and its transformation into intermediate water (IW), called Levantine Intermediate Water (LIW) or Cretan Intermediate Water (CIW), depending on the specific formation area (Levantine or Cretan Sea, CS). IW spreads westward and its core is identifiable in the whole MS by a subsurface salinity maximum (Smax, Schroeder et al., 2017). It flows into the Ionian Sea (IS), with a significant flow northward to the Adriatic Sea (AdS), and constitutes an important preconditioning agent for the formation of both the Adriatic deep water (AdDW) and Mediterranean deep waters (eastern, EMDW and western, WMDW) (e.g. Roether et al., 1996; Gačić et al., 2013). Some authors have highlighted the presence of two main modes of circulation (cyclonic and anticyclonic) of the North Ionian Gyre (NIG), interpreted in terms of internal processes (e.g. Borzelli et al., 2009; Gačić et al., 2010; Gačić et al., 2011; Gačić et al., 2014; Theocharis et al., 2014), which, alternating on a multiannual scale, operate a different redistribution of heat and salt in the central and Levantine area of the MS. Furthermore, the quasi decadal reversal of the NIG influences the strength of the Mid-Ionian Jet (MIJ; Robinson et al., 2001) and generates cascading repercussions on the physical and chemical characteristics of the water masses in the EMS, as well as in the SC and in the WMS (Menna et al., 2019). A process to explain such reversal is a feedback mechanism, named Adriatic-Ionian Bimodal Oscillation System _BIOS_ (Civitarese et al., 2010; Gačić et al., 2010), driven by the difference in salinity between the saltier and warmer waters originating from EMS (LIW and Levantine Surface Water, _LSW_), and the less saline AW entering from the SC (Gačić et al., 2011; Gačić et al., 2014). Briefly, an anticyclonic phase (1993–1997 and 2006–2010) inhibits the AW advection (weakening the MIJ) to the southern Levantine basin and favours the production of salty and warm LIW/CIW. Conversely, a cyclonic phase (1998–2005) favoring the AW advection (strengthening the MIJ) to the southern Levantine Basin, leads to a stronger dilution in the EMS (Schroeder et al., 2017 and internal references). In particular, the anticyclonic mode represents a preconditioning mechanism for the dense-water formation processes in the Aegean Sea and eventually for Eastern Mediterranean Transient (EMT) like events (Demirov and Pinardi, 2002; Gačić et al., 2011). During these events it has been showed that, under favourable conditions, the dense water formation area can switch from the AdS to the CS, with a consequent change of the Eastern Mediterranean Deep Waters (EMDW) properties and a repercussion on the entire thermohaline cell (e.g. Gačić et al., 2013). The effects related to EMT and BIOS also show that the MS is not in a steady-state and that in the last decades it has been affected by a continuous increase in temperature and salinity (e.g. Lacombe et al., 1985; Rixen et al., 2005; Millot, 2007; Borghini et al., 2014; Schroeder et al., 2017), probably due to the effects associated with global warming. Salinity and temperature positive trends, especially in the IW, also show a specific interannual variability (e.g. Gasparini et al., 2005; Gačić et al., 2013; Bonanno et al., 2014; Schroeder et al., 2017), whose effects migrate from one to another basin and can be observed mainly in the SC with a time delay respect to the formation period of about 8 years, based on the data of the transient tracer (Roether et al., 1998), or 10-13 years on the basis of the salinity anomalies (Gačić et al., 2013). In this context, the SC can be considered as a key point for the comprehension of the phenomena underlying the thermohaline circulation at basin scale, as well as of the effects of this variability on the biogeochemical characteristics of the water masses that pass through it.
Biogeochemically, the MS is an oligotrophic basin despite being almost entirely surrounded by land with high nutrient loadings (e.g. Béthoux et al., 1998; Krom et al., 2004) derived from a large coastal population. The main source of dissolved organic phosphorus (P) and nitrogen (N) entering the WMS and EMS, primarily via the Straits of Gibraltar and Sicily, are mineralized to phosphate (PO4) and nitrate (NO3) and subsequently exported out of the basin by the prevailing anti-estuarine circulation (e.g. Powley et al., 2017). The very low productivity of the MS is therefore linked both to the anti-estuarine circulation (Krom et al., 2010) and to the chemical speciation of the dissolved P and N. They in fact reflects a switch from less bioavailable chemical forms of P and N entering the MS to more bioavailable forms leaving the MS (Powley et al., 2017). The anti-estuarine circulation also contributes to the higher primary productivity of the WMS respect to the EMS, as it acts on the lateral transport of dissolved inorganic nutrients in the deeper water, from the EMS to the WMS. It follows that deep waters (DW) of the WMS are characterized by higher NO3 and PO4 concentrations than those of the EMS (e.g. Ribera D'Alcalà et al., 2003) and carried up through upwelling phenomena in the photic zone. Another peculiarity of the MS is the higher molar NO3:PO4 DW ratios (21:1 on average in the WMS to 29:1 within the EMS, Ribera D'Alcalà et al., 2003) respect to the global ocean (N:P=16:1, Redfield et al., 1963). The debate on the anomaly of this peculiarity is still open, although recent analysis suggest that for the EMS, the high N:P ratio of the external inputs, together with very limited denitrification (Krom et al., 2010; Huertas et al., 2012; Van Cappellen et al., 2014), explains the very high NO3:PO4 DW ratio (Powley et al., 2017).
The aim of this study is to examine the interannual variability of thermohaline and biogeochemical properties of the water masses flowing through the SC in summer during the period since 2010 to 2020. We analyzed the potential mechanism controlling the long-term variability of the water masses properties and evaluated the impact on nutrient concentrations and on the productivity of the marine ecosystem.
Dataset and Methods
Oceanographic data have been acquired over 10 oceanographic surveys (named Bansic) carried out in the SC during the summer period from 2010 to 2020 (except for year 2019) aboard the Urania, Minerva Uno and Dallaporta vessels (Figure 1 and Table 1). For this study, in-situ sampling design was focused on an inshore-offshore transect approximately perpendicular to the Sicilian coast, composed by 10 stations spaced about 12 NM, comparable to the Ross by deformation radius (Sorgente et al., 2011).
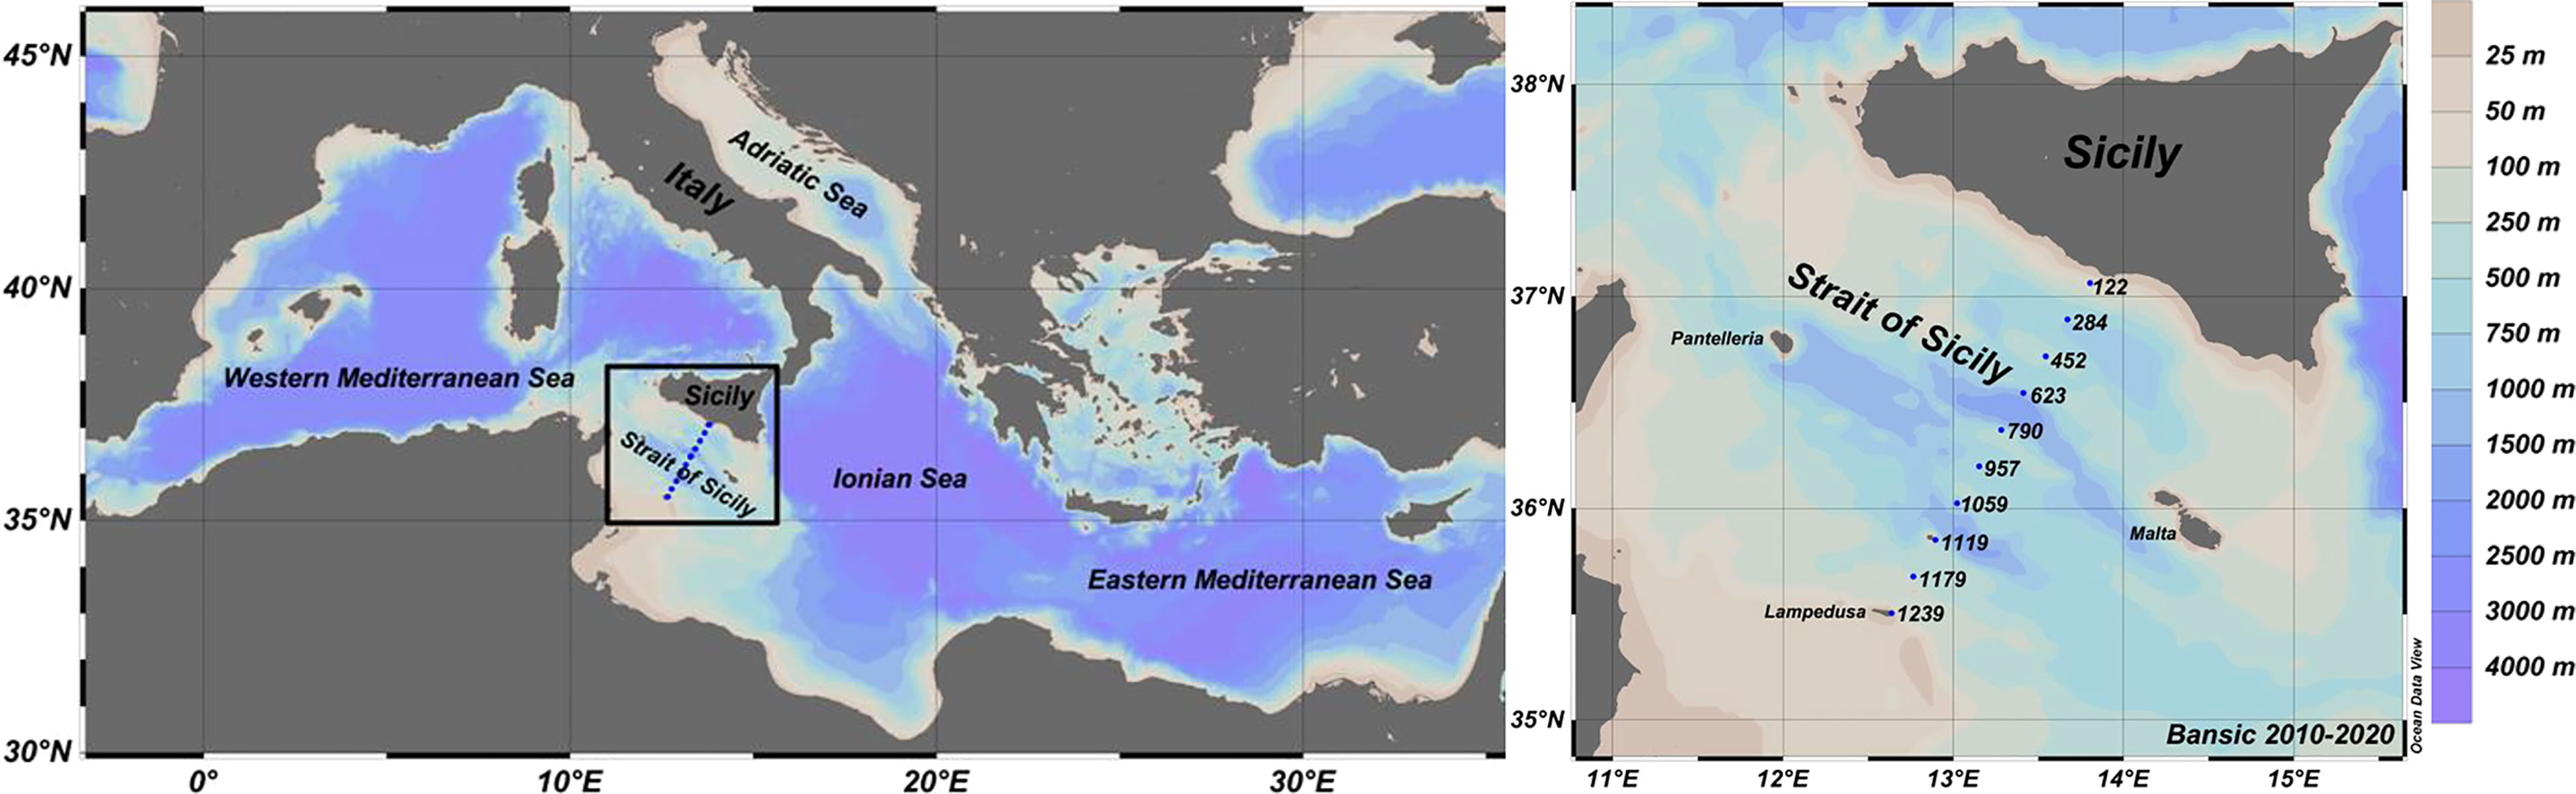
Figure 1 Mediterranean Sea map (left panel); CTD and Nutrients stations in the Sicily Channel (right panel).
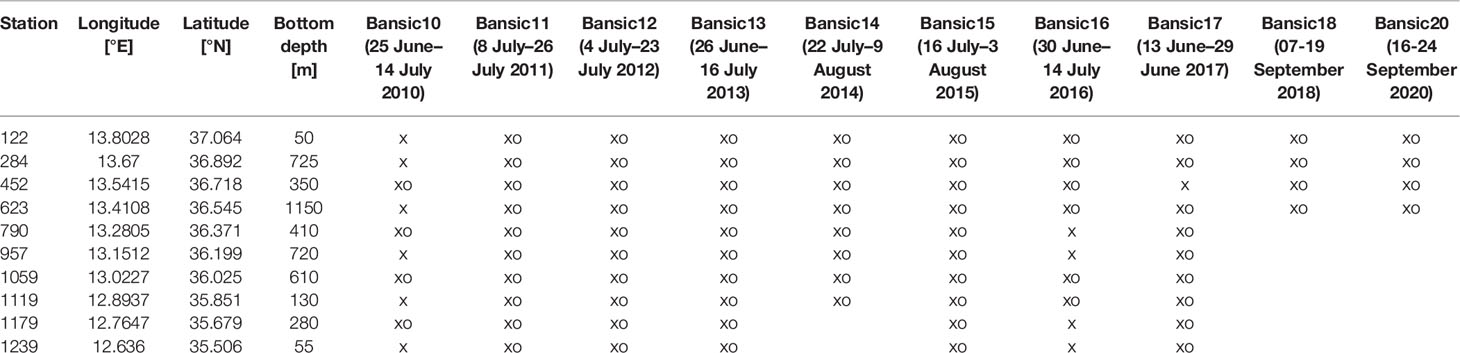
Table 1 Oceanographic surveys carried out in the sicily channel and relative sampling activities (x_CTD and o_nutrient analysis) carried out in the 2010-2020 period.
Hydrological Data
The long-term variability in the hydrological characteristics of the SC has been analyzed on the basis of vertical profiles of potential temperature (θ°C), salinity (S) and dissolved oxygen (DO mg/l) obtained from the surface to the bottom by means of a Conductivity Temperature Depth (CTD-rosette system; Tab. 1). It consists of a SBE 911 plus probe and a General Oceanic’s rosette, equipped with 24 Niskin bottles. Moreover, the Chlorophyll-a concentration (Chl-a µg/l), measured from the fluorescence probe, has been examined to characterize the productivity of the upper water column. The probes were calibrated before each oceanographic survey. The collected downcast data were quality-checked and processed in agreement with the Mediterranean and ocean database instructions (Brankart, 1994), using the Seasoft-Win32 software. The overall accuracies are within 0.001°C for temperature, 0.001 sm−1 for conductivity, and 0.015% of full scale for pressure.
Temperature and Salinity Time Series
The interpretation of the θ, S, σ, DO profiles and of the θ_S diagram carried out in each station and in all the years has allowed us to recognize the various main water masses present in the study area, i.e. the SW (0-100 m depth, essentially consisting of AW), of the sub-superficial IW (200-500 m depth, mostly consisting of LIW) and locally also the upper part of the DW (>500 m depth) (Figure 2A; Table 1; Supplementary 1). Specifically, the AW and LIW were identified through the minimum and maximum of salinity that characterizes their core, respectively.
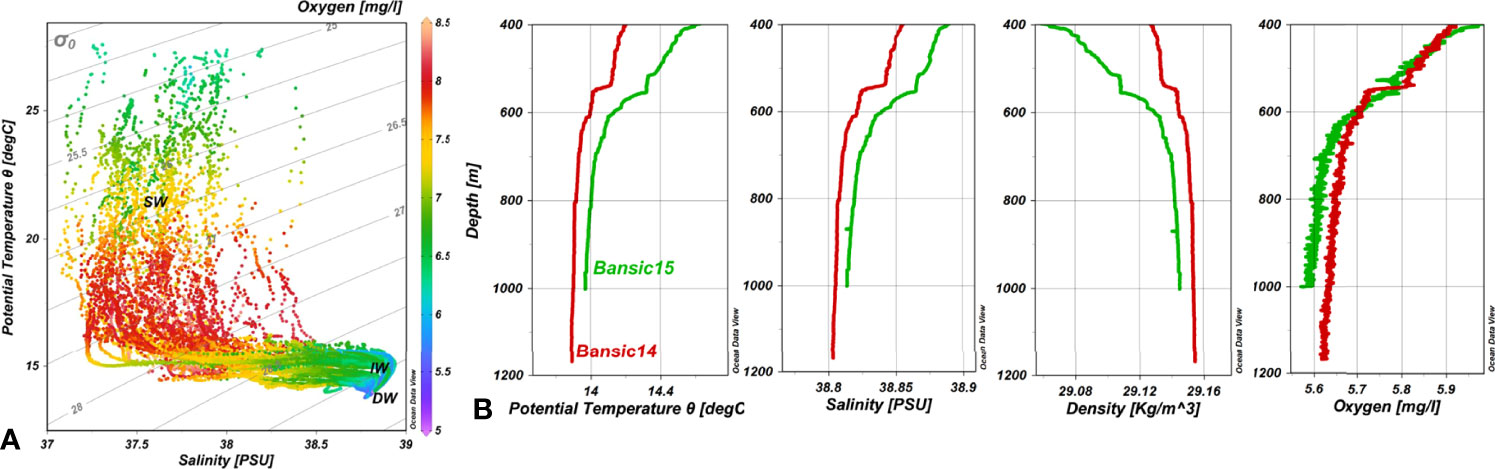
Figure 2 (A) θ-S diagram and DO of all monitored stations. (B) zoom of the DW and related θ, S, σ and DO vertical profiles at the station 623 detected during Bansic 2014 (red line) and 2015 (green line) surveys.
For the computation of the θ and S time series of the AW core we used, for each station and for each year, the average value of θ and S included in the layer between the minimum of salinity and 10m below it (Bonanno et al., 2014), while for the IW core we used the average value of θ and S in the layer between the maximum salinity and 100m below it (Gasparini et al., 2005). Finally, for the DW we used, for each station and for each year, the average value of θ and S included in the layer between 500m-bottom, identified by the presence of a strong vertical gradient of θ, S and DO, clearly visible during the bansic14 and bansic15 surveys (Figure 2B). In this context, we worked on a clear signal of water masses characteristics, minimizing as much as possible the effects related to the mixing of the various water masses.
Nutrient Data
Marine water samples were collected from the surface to the bottom by means of Niskin bottles (Table 1). In particular, a variable number of fixed depths has been considered (surface–25m–50m–75m–100m–150m-200m–300m–400m–500m–600m–700m–800m–900m–1000m–bottom). All materials used for water sampling were earlier conditioned with 10% HCl and rinsed 3 times with ultrapure water. Unfiltered samples were stored at –20°C. In the laboratory, the concentration of nitrate, silicate and phosphate (µmol/l) was measured by means of a Sial Autoanalyzer ‘‘QUAATRO’’ following classical methods (Grasshoff et al., 1999), adapted to an automated system. The limit of detection for the procedure was, 0.02, 0.01 and 0.006 µmol/l for nitrates, silicates and phosphates, respectively.
Nutrient Time Series
Inorganic nutrients time series were reconstructed on the basis of the physical characterization of the water masses, through which three main layers (i.e. surface waters, SW; intermediate waters, IW; deep waters, DW) were identified with the relative depth ranges: 0-100; 200-500; 500-bottom (Figures 2, 5). Specifically, each layer was associated with a load of inorganic nutrients (nitrates and silicates) calculated as the average concentration (µmol/l) detected in all the water samples contained within each layer and for each year (Supplementary 2).
Satellite Data
The satellite data were used in order to provide a description of the physical features occurring in the surface layers during the sampling periods. Therefore, mesoscale structures, such as currents, fronts and gyres, were observed by means of Absolute Dynamic Topography (ADT) (L4 gap-free monthly data; spatial resolution: 0.125x0.125 degree) and ADT-derived geostrophic velocity fields, produced by Copernicus Marine Environment Monitoring Service (CMEMS, http://marine.copernicus.eu/). Annual mean maps of ADT and geostrophic currents have been analysed in order to provide a description of the main surface circulation patterns occurred during the considered time series in the Central Mediterranean Sea. Furthermore, vorticity has been computed starting from the geostrophic velocities derived from satellite data for each grid point within the box [37.5°-39° N] and [17.5°-20°E], following the procedure described by Shabrang et al. (2016), more recently also applied by Notarstefano et al. (2019) and Mihanovic et al. (2021).
Statistical Analysis
The correlation between temperature and salinity patterns observed in the SC (i.e. positive/negative trends) and the circulation mode of the NIG (i.e. cyclonic/anticyclonic phase) was investigated through a cross-correlation analysis, considering a time lag ranging between 0 and 15 years and applying Cramer’s V as a measure of association between the two nominal variables.
Results
Temporal Trends of Hydrological Characteristics
Oceanographic surveys were carried out in different periods of the summer season (June-September, see Table 1). The average θ and S in the SW layer varied between 16.7°C and 19.3°C and between 37.4 and 37.6, respectively (Figure 3). This layer is characterized by a strong interannual and spatial variability (in terms of standard deviation), especially in 2012, and does not present a clear trend.
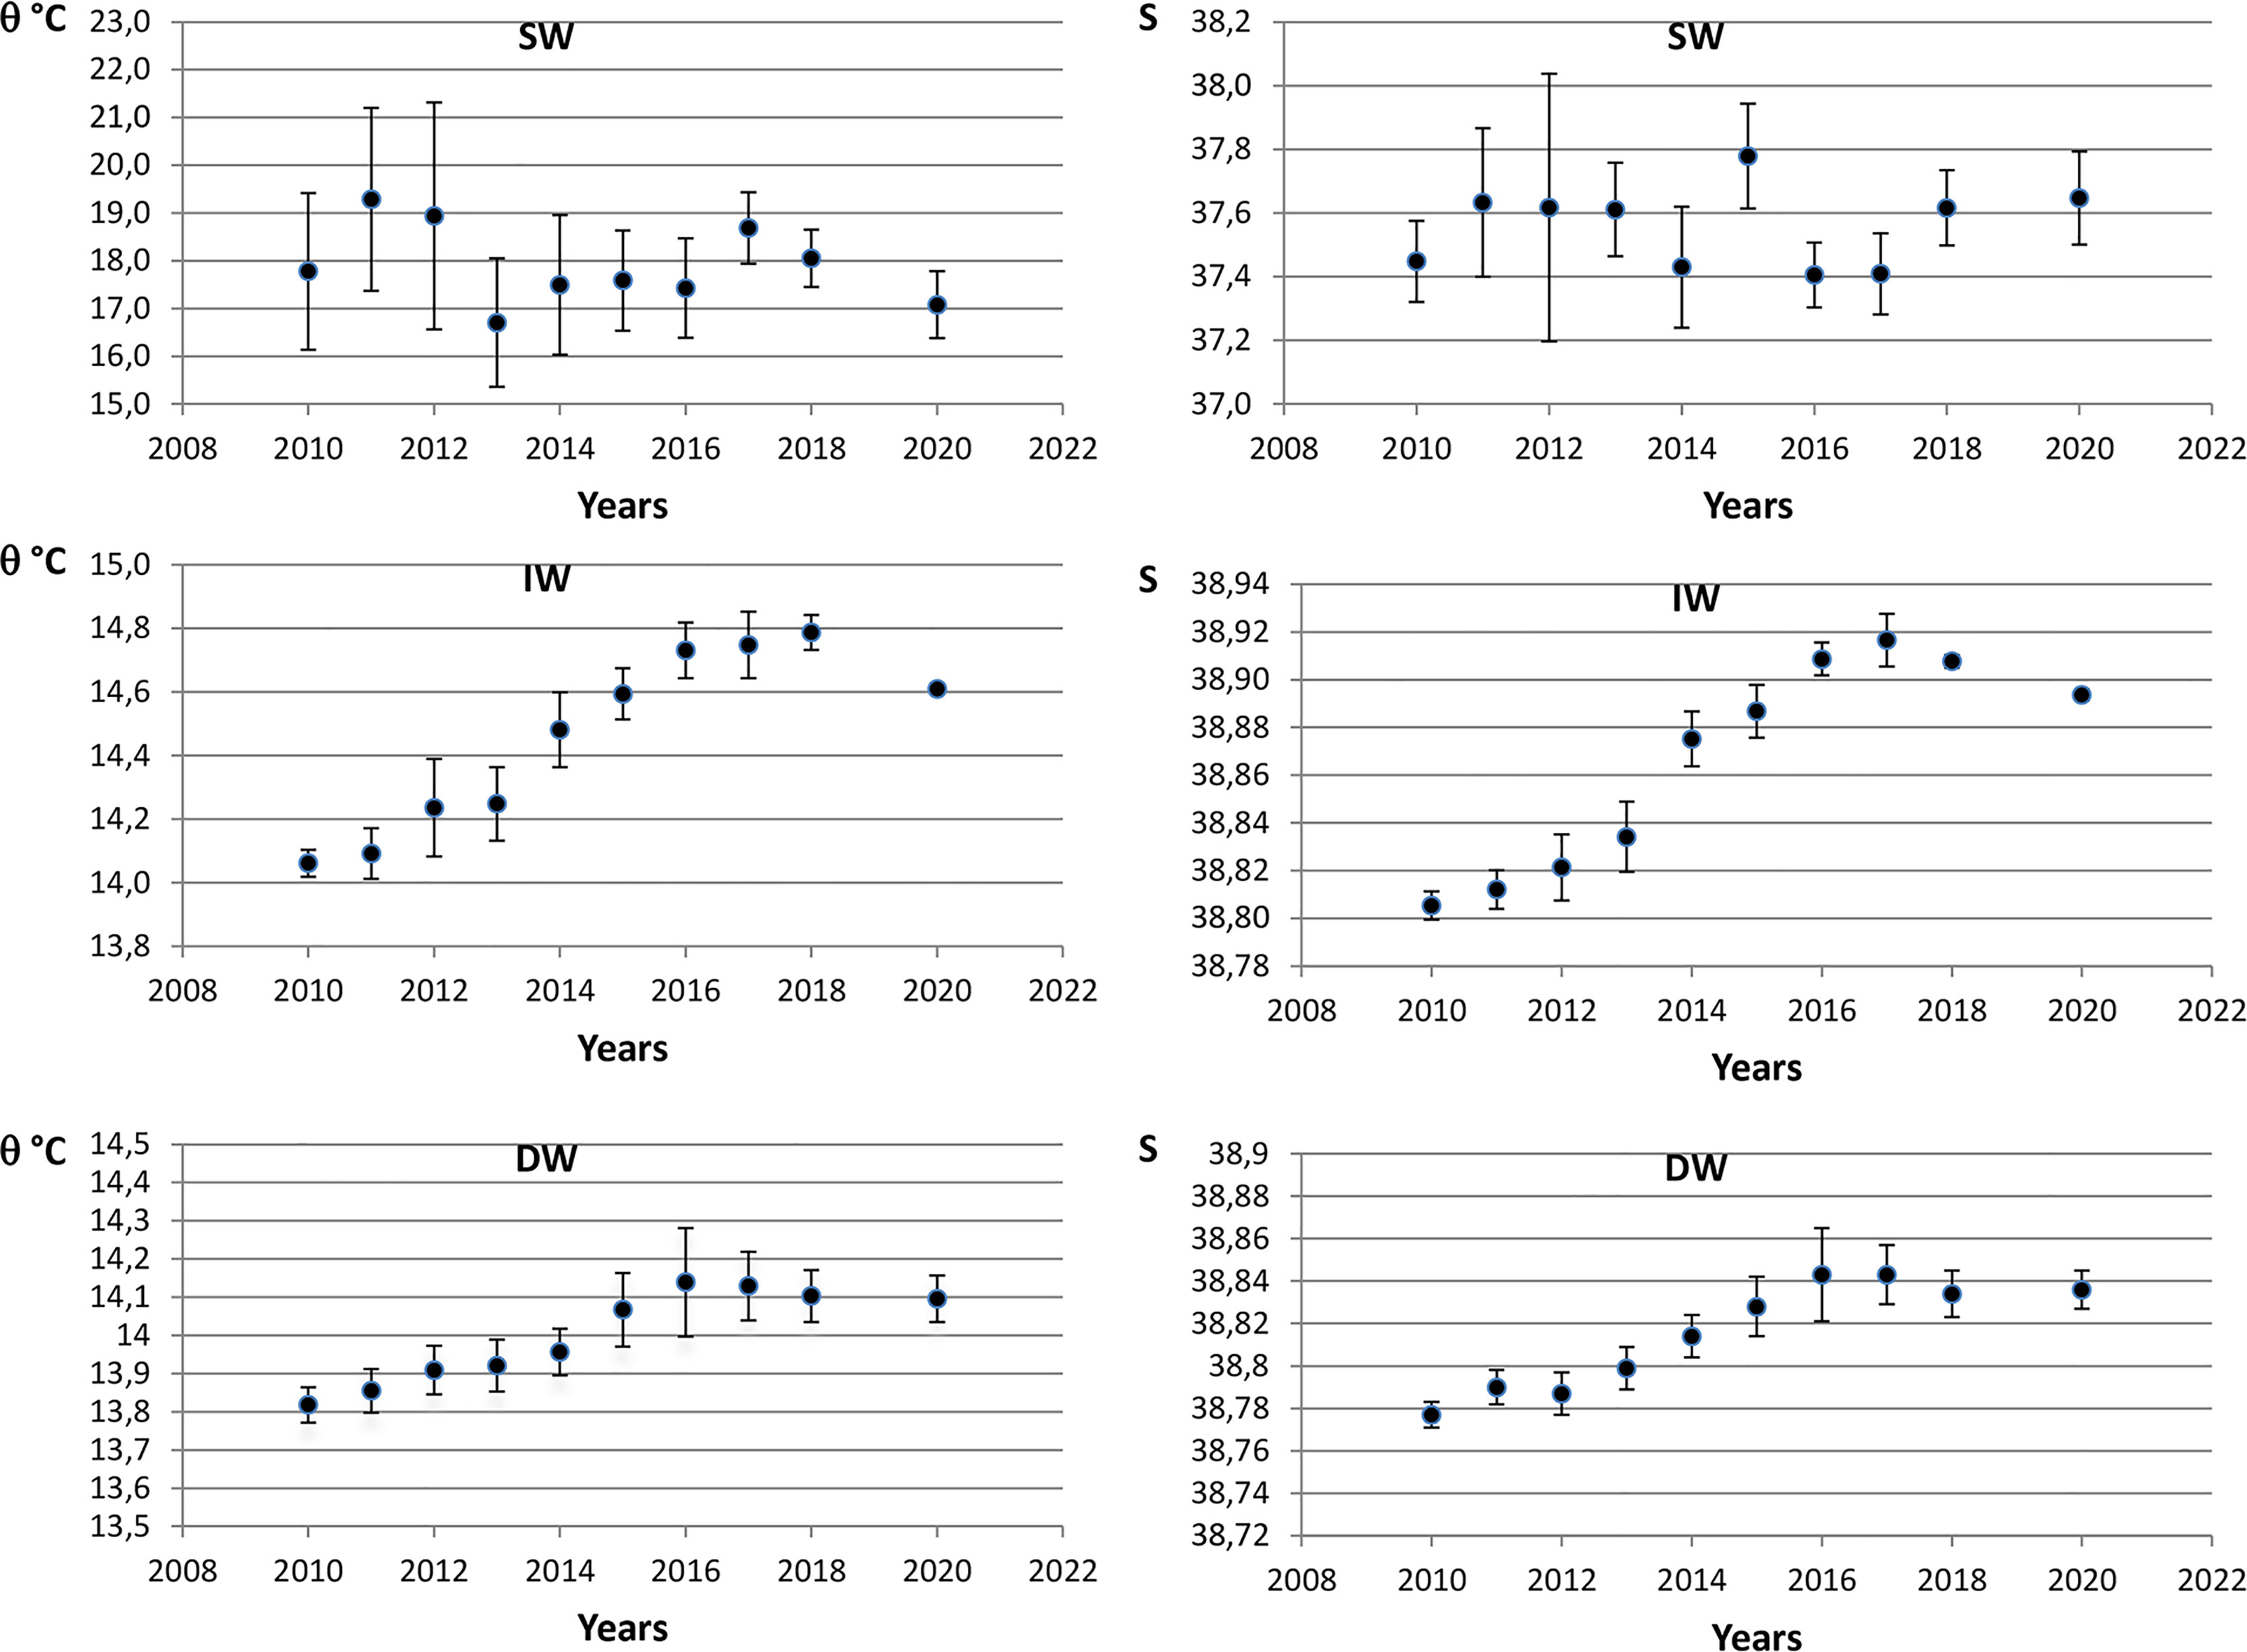
Figure 3 Analysis of potential temperature (left panels) and salinity (right panels) time series computed by averaging over a water column of 10m below the Smin for the SW and 100m below Smax for the IW, which represent the core of the AW and LIW, respectively. For the DW was used the layer 500m-bottom. Bars indicate the standard deviation.
The IW layer is characterized by a lower spatial variability and a clear positive trend in terms of θ and S from 2010 to 2017 (dθ/dt ~0.09°C yr-1 and dS/dt ~0.016 yr-1), while a weak decrease is registered between 2018 and 2020 (dθ/dt ~-0.04°C yr-1 and dS/dt ~-0.007 yr-1). Our estimations are comparable with Schroeder et al. (2017), who reported a dθ/dt ~0.064°C yr-1 and dS/dt ~0.014 yr-1 in 2011-2016.
Finally, the θ and S time series recorded in the upper DW was characterized by a positive trend and by a lower variability, in which θ varied between 2010 and 2020 with an dθ/dt of 0.027°C yr-1(Figure 3) while S varied between with an dS/dt of 0.005 yr-1. The θ and S time series can be represented by two patterns, a positive one occurring from 2010 to 2016, with an dθ/dt of 0.05°C yr-1 and an dS/dt of 0.01 yr-1, followed by a slightly negative trend where the θ dropped to 14.096°C with an dθ/dt of -0.01°C yr-1 while the S dropped to 38.835 with an dS/dt of -0.002 yr-1 (Figure 3).
Inorganic Nutrient Distribution Patterns
The nitrates, silicates and phosphates distribution patterns vs depth showed very low concentration values in SW (often below the instrumental detection limit for phosphate) most probably linked to their depletion by the phytoplankton for its photosynthetic activity (Figure 4; Table 1; Supplementary 2). In the last decade the deep chlorophyll maximum (DCM) developed in the depth range 50-120 m (with peaks of maximum concentration around 70-80 m of depth), with the exception of July 2013, in which high fluorescence values (0.76 µg/l) were measured at 39 m of depth (Figure 4). Under the SW and the DCM, nutricline, silicocline and phosphocline developed with different slopes and depth and mirrored the decrease in dissolved oxygen. Higher oxygen concentrations were recorded close the Sicilian coast, at about 50 m depth within the nutrient depleted layer (Figure 4). The maximum concentrations of nitrates, silicates and phosphates of 7.66 µmol/l (St. 790 at 400m depth), 9.55 µmol/l (St. 284 at 700m depth) and 0.35 µmol/l (St. 790 at 400m depth) were detected during the 2011-2012-2017 surveys, respectively (Figure 4), while the average concentration of nutrients, for each water mass, are reported in Supplementary 2. The vertical profiles of nitrates to phosphates, in the years, show low values in the SW respect to IW and DW, with the regression line characterized by R2>0.8 (Figure 4). The box plot of the N:P ratio, highlighted low values in the SW that increase to values >40 in the IW (with average value of 32), while in the DW the average value is 30 (Figure 4). These values are in agreement with the data reported for the SC by various authors (e.g. Ribera D'Alcalà et al., 2003; Schroeder et al., 2010; Placenti et al., 2013).
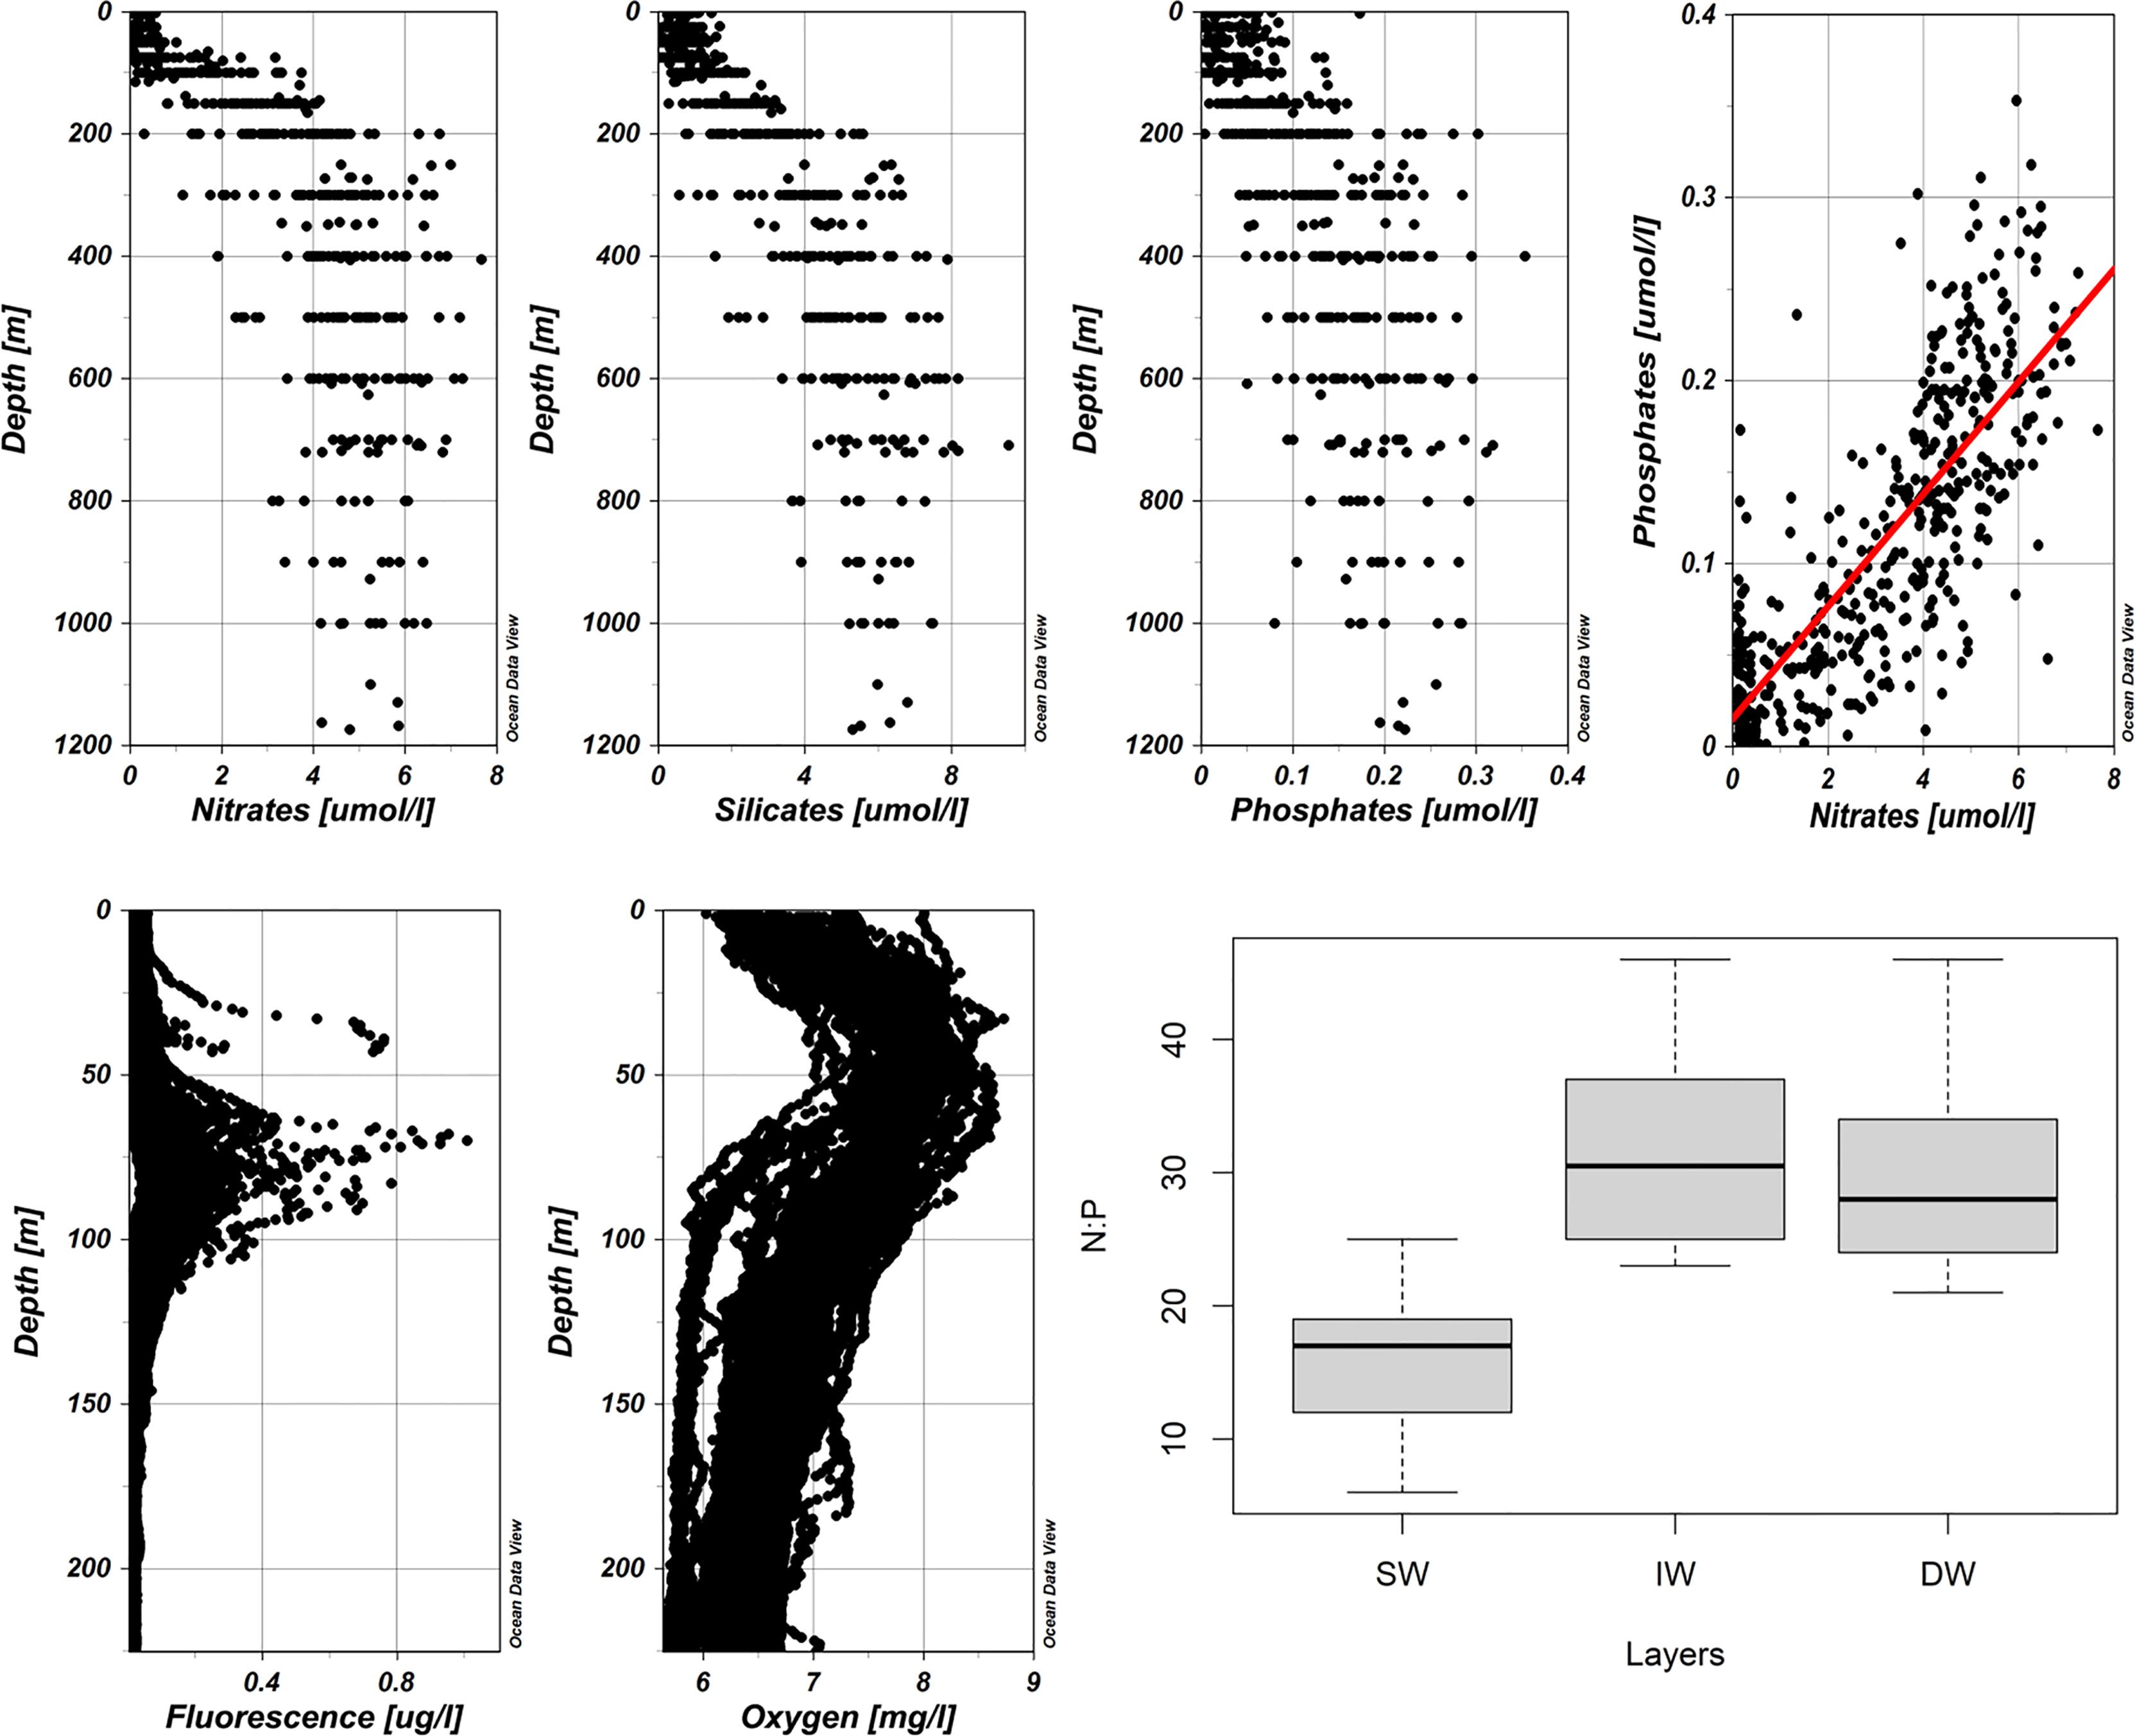
Figure 4 In top panels are reported the vertical profiles of nitrates, silicates, phosphates, nitrates-phosphates diagram (in red, the regression line with the R2>0.8). In bottom panels are reported the vertical profiles of fluorescence and dissolved oxygen of all stations, followed by the N:P ratio box plots in SW, IW and DW.
Temporal Trend of Biogeochemical Characteristics
The nitrate-silicates time series related to the SW highlighted a lower concentration values and variability over time compared to IW and DW (Figure 5). Nitrates showed a slightly negative trend in 2011-2016 and then it turned to be positive until 2020 (Figure 5). The silicates pattern was characterized by a more evident negative trend (2011-2016), in which the average concentration decreased from 0.93 to 0.38 µmol/l (-0.091 µmol/l yr-1), and then increased to 0.88 µmol/l in 2020 (Figure 5). In the IW the nitrates and silicates highlighted similar concentration distribution patterns. Two trends can be distinguished, one negative (2011-2015) and one positive (2015-2018; Figure 5). In the first trend the average concentration of nitrates and silicates decreased by -0.61 and -0.54 µmol/l yr-1, respectively. In the second trend, the average concentration of both nutrients increased by 0.47 µmol/l yr-1 (Figure 5). Average concentrations of nutrients dropped slightly in 2020, probably reflecting the start of a new cycle.
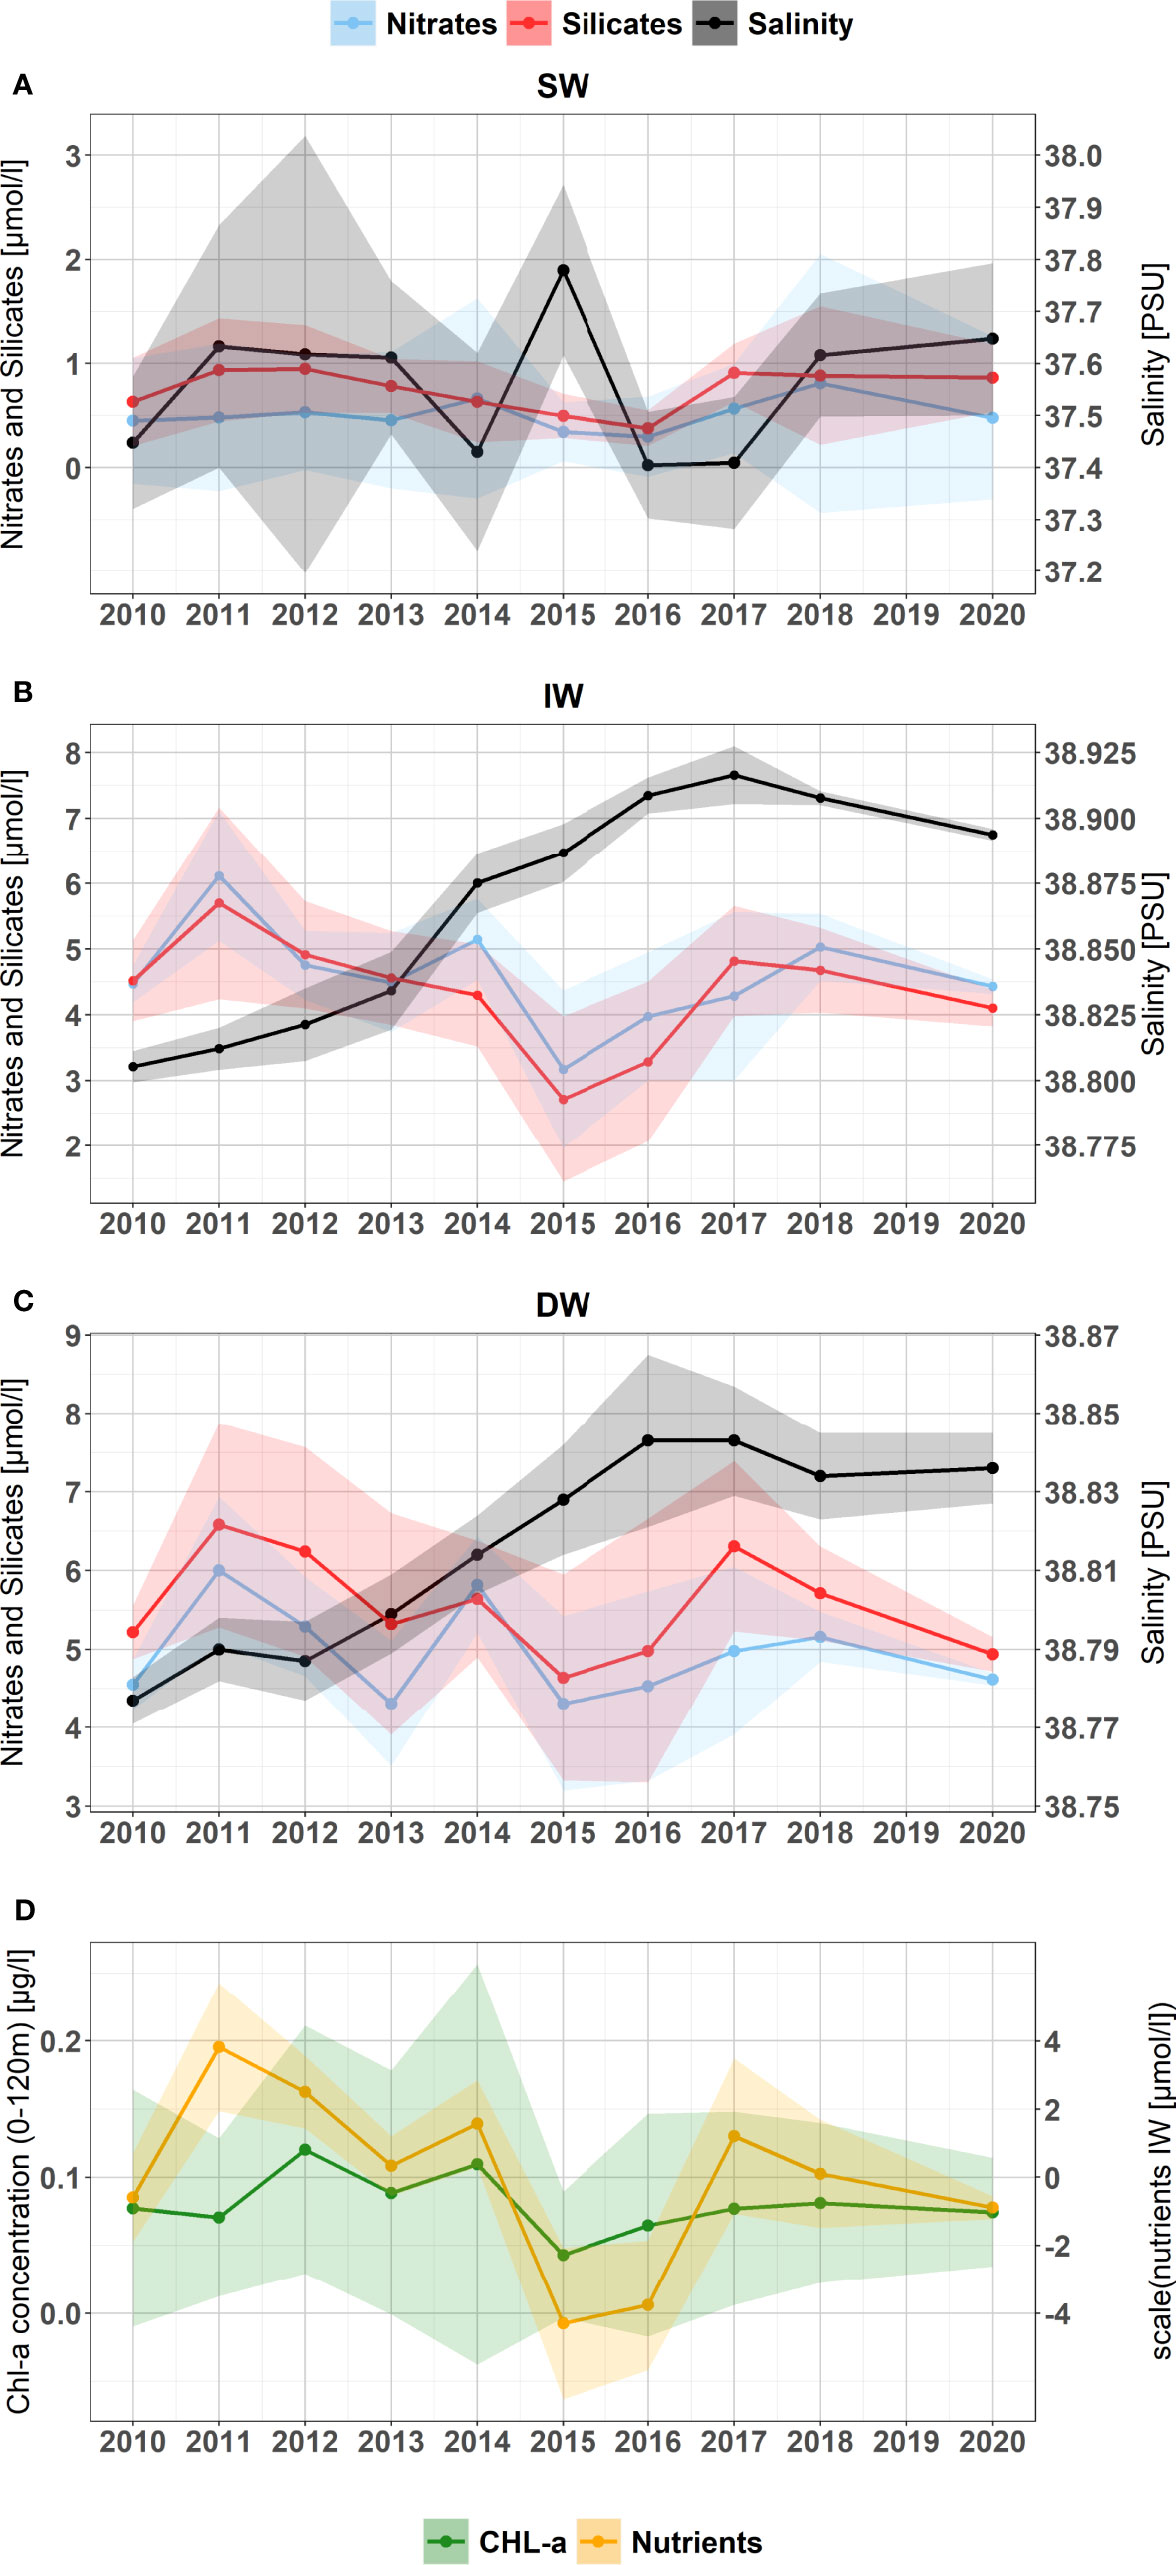
Figure 5 The nitrates (blue line) and silicates (red line) time series was computed from the sum of the nitrates and silicates average concentrations within each layer (A) SW_0-100m, (B) IW_200-500m and (C) DW_500-bottom, for each year, in all sampling stations. In addition is reported the salinity time series (black line) described in Figure 3. (D) The Chl-a (green line) time series 2010-2020 was computed from the Chl-a average concentrations within each layer 0-120m depth. The related colored areas represent the standard deviations.
The DW was characterized by distribution patterns of average concentrations of nitrates and silicates similar to the IW, in which it was possible to outline two general trends: the first negative (2011-2015) and the second slightly positive (2015-2017/2018) (Figure 5). Finally, the average concentrations of both nutrients dropped slightly from 2017-2018 to 2020 (Figure 5).
Although with higher variability, similar patterns emerged considering the chlorophyll-a concentration occurring in the surface layer (0-120m) (Figure 5). In particular, a significant positive Pearson correlation coefficient (r) has been computed between the sum of the scaled nutrients concentration (nitrates, silicates, phosphates) in the IW and the chlorophyll-a concentration in the upper layer (r= 0.67; p<0.05).
Discussion and Conclusion
While the surface temperature is able to provide the almost instantaneous signature of interactions with the atmosphere, which is by its nature subjected to great variability, the analysis of the variability of the heat and salt content in the deeper water masses provided a climate index more suitable for monitoring any changes over long periods. For this reason, we have integrated the intermediate and deep layer dataset with the previous ones carried out by Bonanno et al., 2014 and Ben Ismail et al., 2014 (Figure 6). Regarding the IW layer, time series presented in this study are in agreement with comparable time series collected in the SC by Gasparini et al., 2005; Gačić et al., 2013; Ben Ismail et al., 2014; Bonanno et al., 2014 and Schroeder et al., 2017. Specifically, it is thus possible to highlight a general increasing trend and the presence of “cyclic patterns” in temperature and salinity, that could be associated with the alternation of different circulation modes (cyclonic and anticyclonic) of the NIG in addition to IW formation processes. In particular, we infer an average annual increase of dT/dt ~0.047°C yr-1 and dS/dt ~0.01 yr-1 from the 1998-2007 (Figure 6), comparable to those estimated by Gasparini et al. (2005) and Schroeder et al. (2017). Such a trend of T and S could be related to the anticyclonic phase of the NIG estimated from 1988 to 1997 (mean ADT available from 1993 to 1997, Figures 7A, E), according to Bonanno et al., 2014. The anticyclonic circulation inhibits the AW advection to the southern Levantine basin, favouring the production of saltier and warmer IW, whose effects were observed in the SC with a variable time lag that deserves further studies and insights. The period 1998-2007 is followed by an abrupt reversal trend up to 2010, characterized by a dT/dt of -0.12°C yr-1 and dS/dt of -0.01 yr-1 (Figure 6). These trends, in agreement with Gačić et al., 2013; Ben Ismail et al., 2014; Bonanno et al., 2014; Schroeder et al., 2017, could be linked to the previous cyclonic phase of the NIG (1998-2005, Figures 7B, E). It favoured the strengthening of the MIJ and thus the AW advection to the southern Levantine basin, leading to an increasing of the water masses dilution in the EMS, according to Schroeder et al., 2017. Approximately, a new salty/warm phase occurs from 2011 until 2017 (Figure 6), probably associated to the previous anticyclonic phase of the NIG (2006-2010, Figure 7C). Compared to the first average annual increase in θ and S, attributable to the anticyclonic phase 1993-1997, this increasing trend shows considerably higher rates of dθ/dt and dS/dt, despite being related to a shorter and less defined anticyclonic circulation. Indeed, some authors identified the 1993-1997 phase as “fully anticyclonic” due to the absence or weak activity of the MIJ. Differently, during the subsequent anticyclonic phase (2006-2010), the MIJ occurs with an intense, non-negligible, zonal activity from the SC to the Levantine basin, prompting authors to distinguish this period as an “anticyclonic-zonal” phase (Bessières et al., 2013). Therefore, our considerably higher rates of increase in θ and S can be only partially associated with the anticyclonic-zonal phase of the NIG, from which a lower rate of increase would be expected. A further possible explanation could be linked to the increasing of the drying process (E-P), affecting the surface waters from which LIW and CIW originate, in agreement with Schroeder et al. (2017).
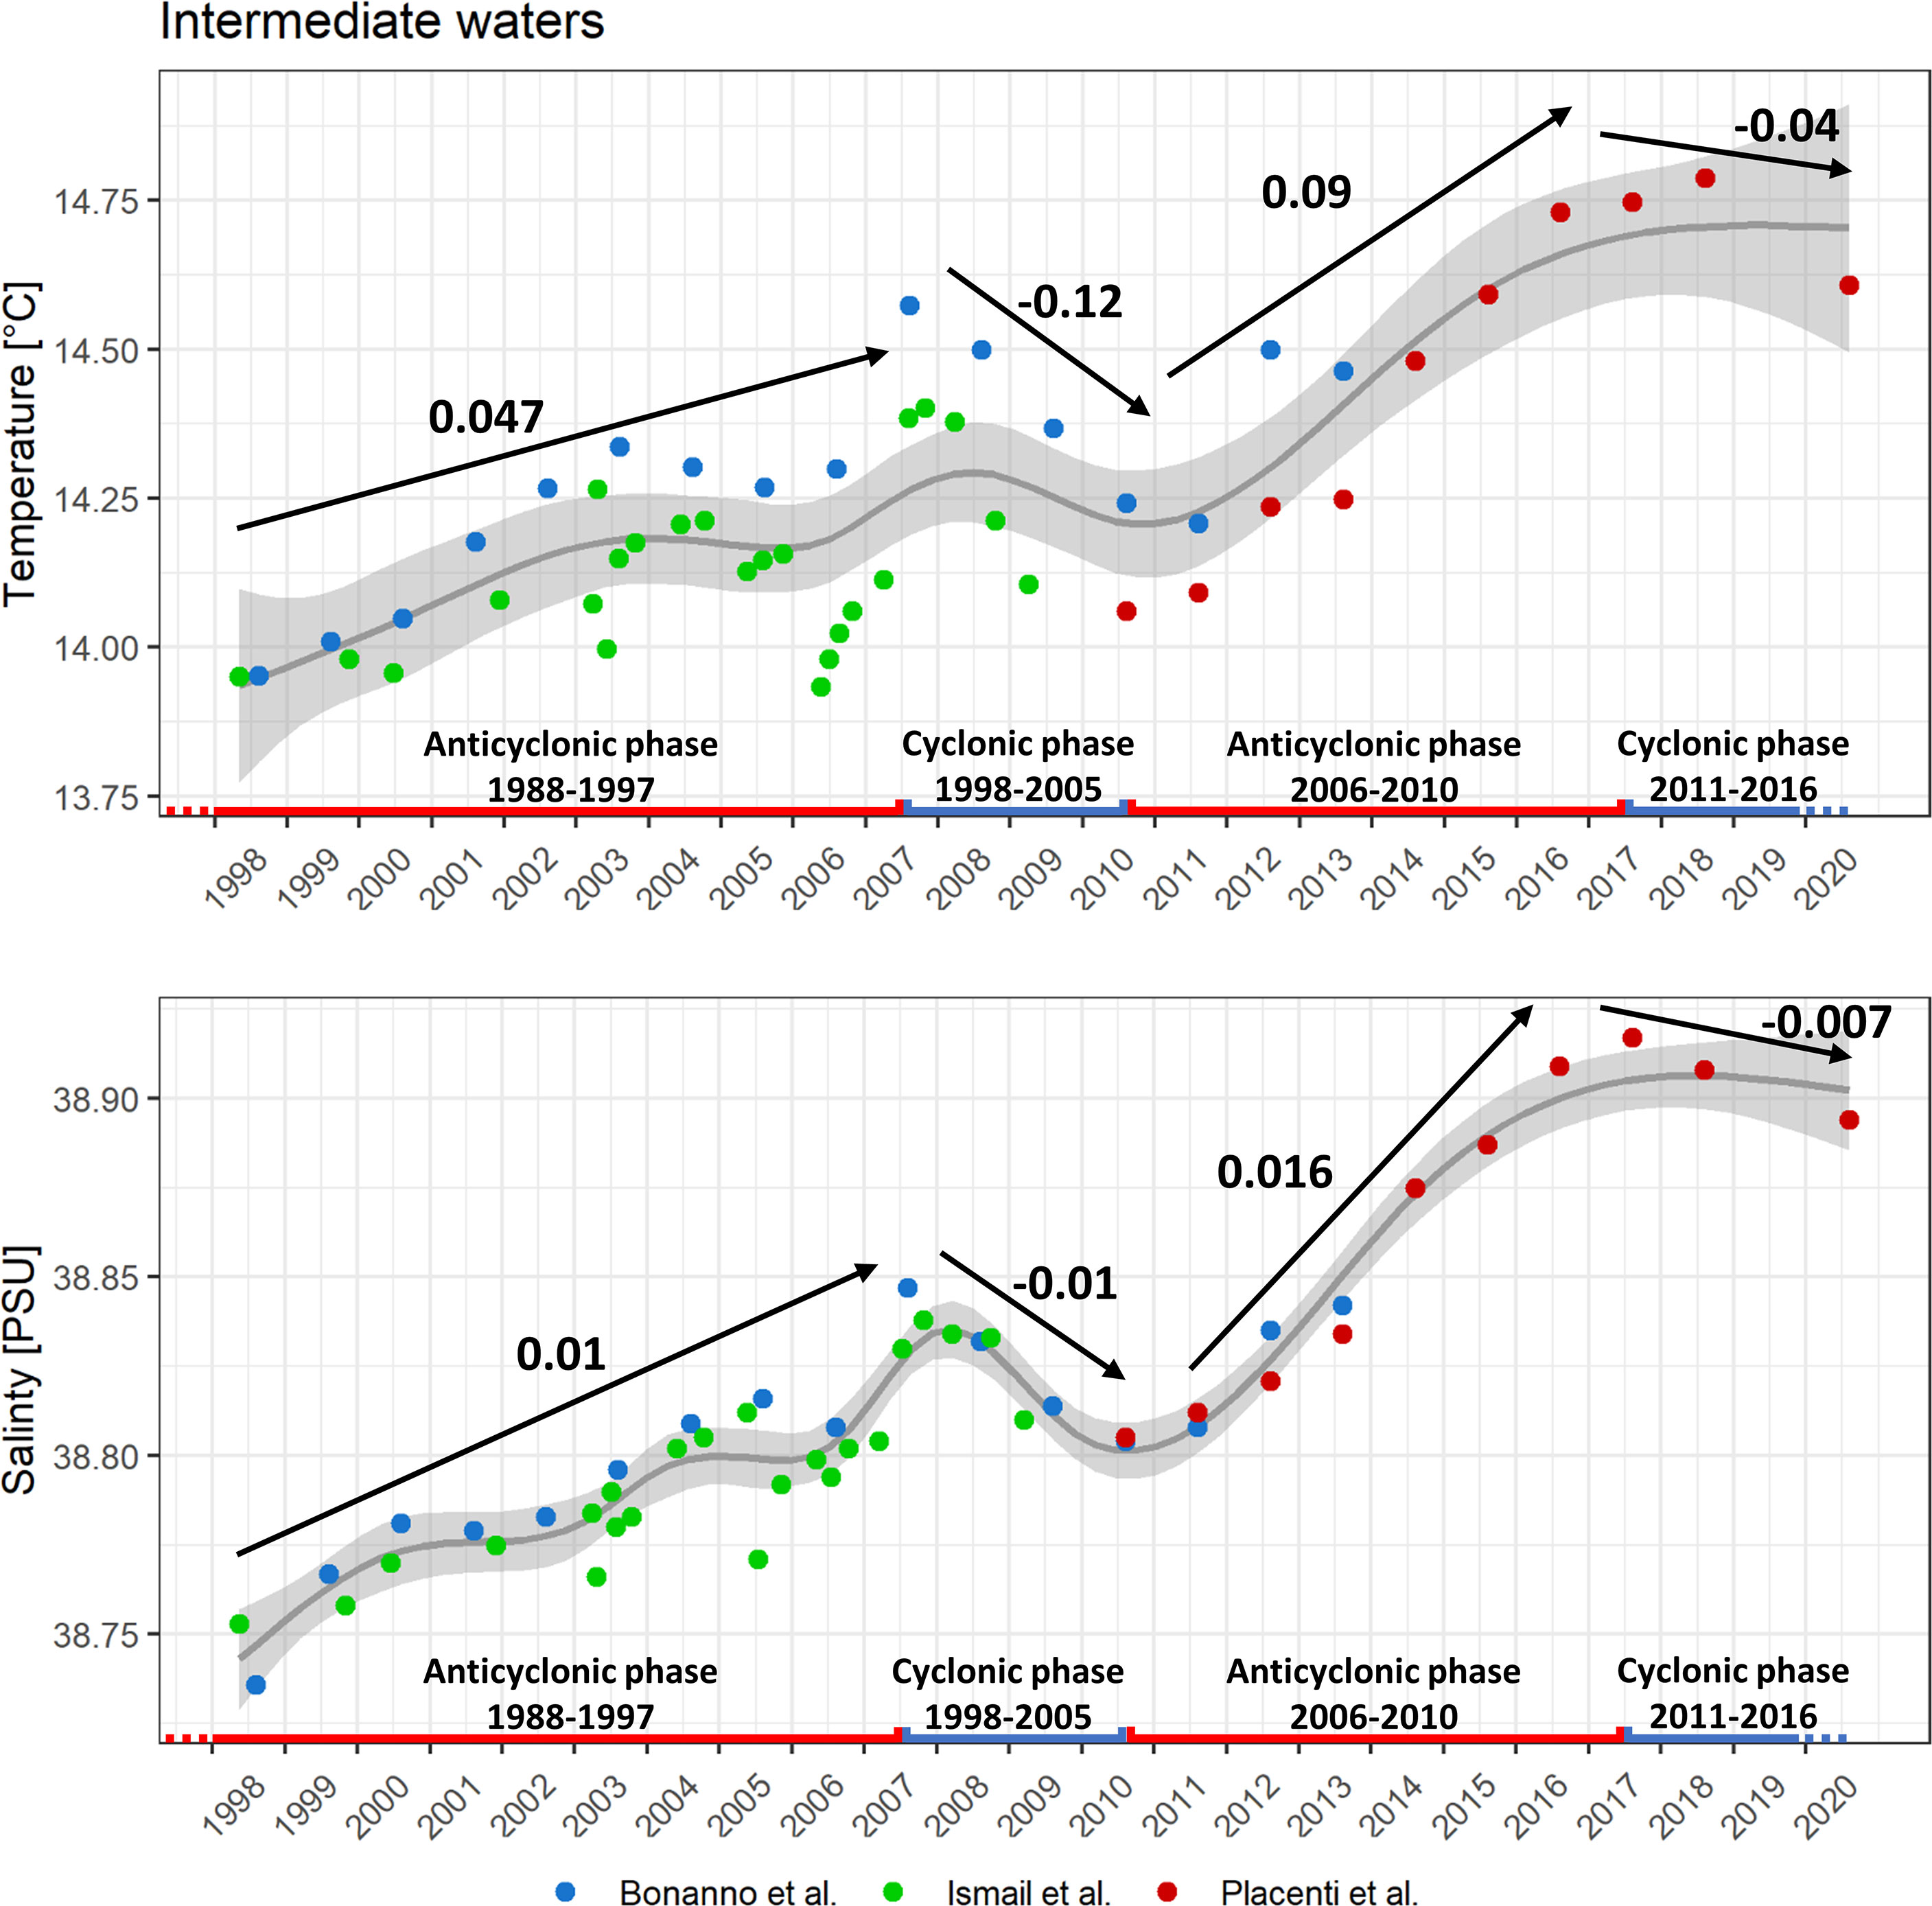
Figure 6 Temperature (top panel) and salinity (bottom panel) time series of the LIW, extrapolated by Ben Ismail et. (201)4 and Bonanno et al. (2014), are indicated as green and blue dots, respectively. Potential temperature and salinity time series from this study are indicated as red dots. A cubic regression spline computed through a GAM model and the relative confidence interval has been added in gray with the aim at evidencing temporal trends. Black arrows indicate the average annual increments of hydrological parameters computed for 1998-2009 by Bonanno et al. (2014) and for 2010-2020 from data collected in this study. The position of the dots on the time axis takes into account the sampling month.
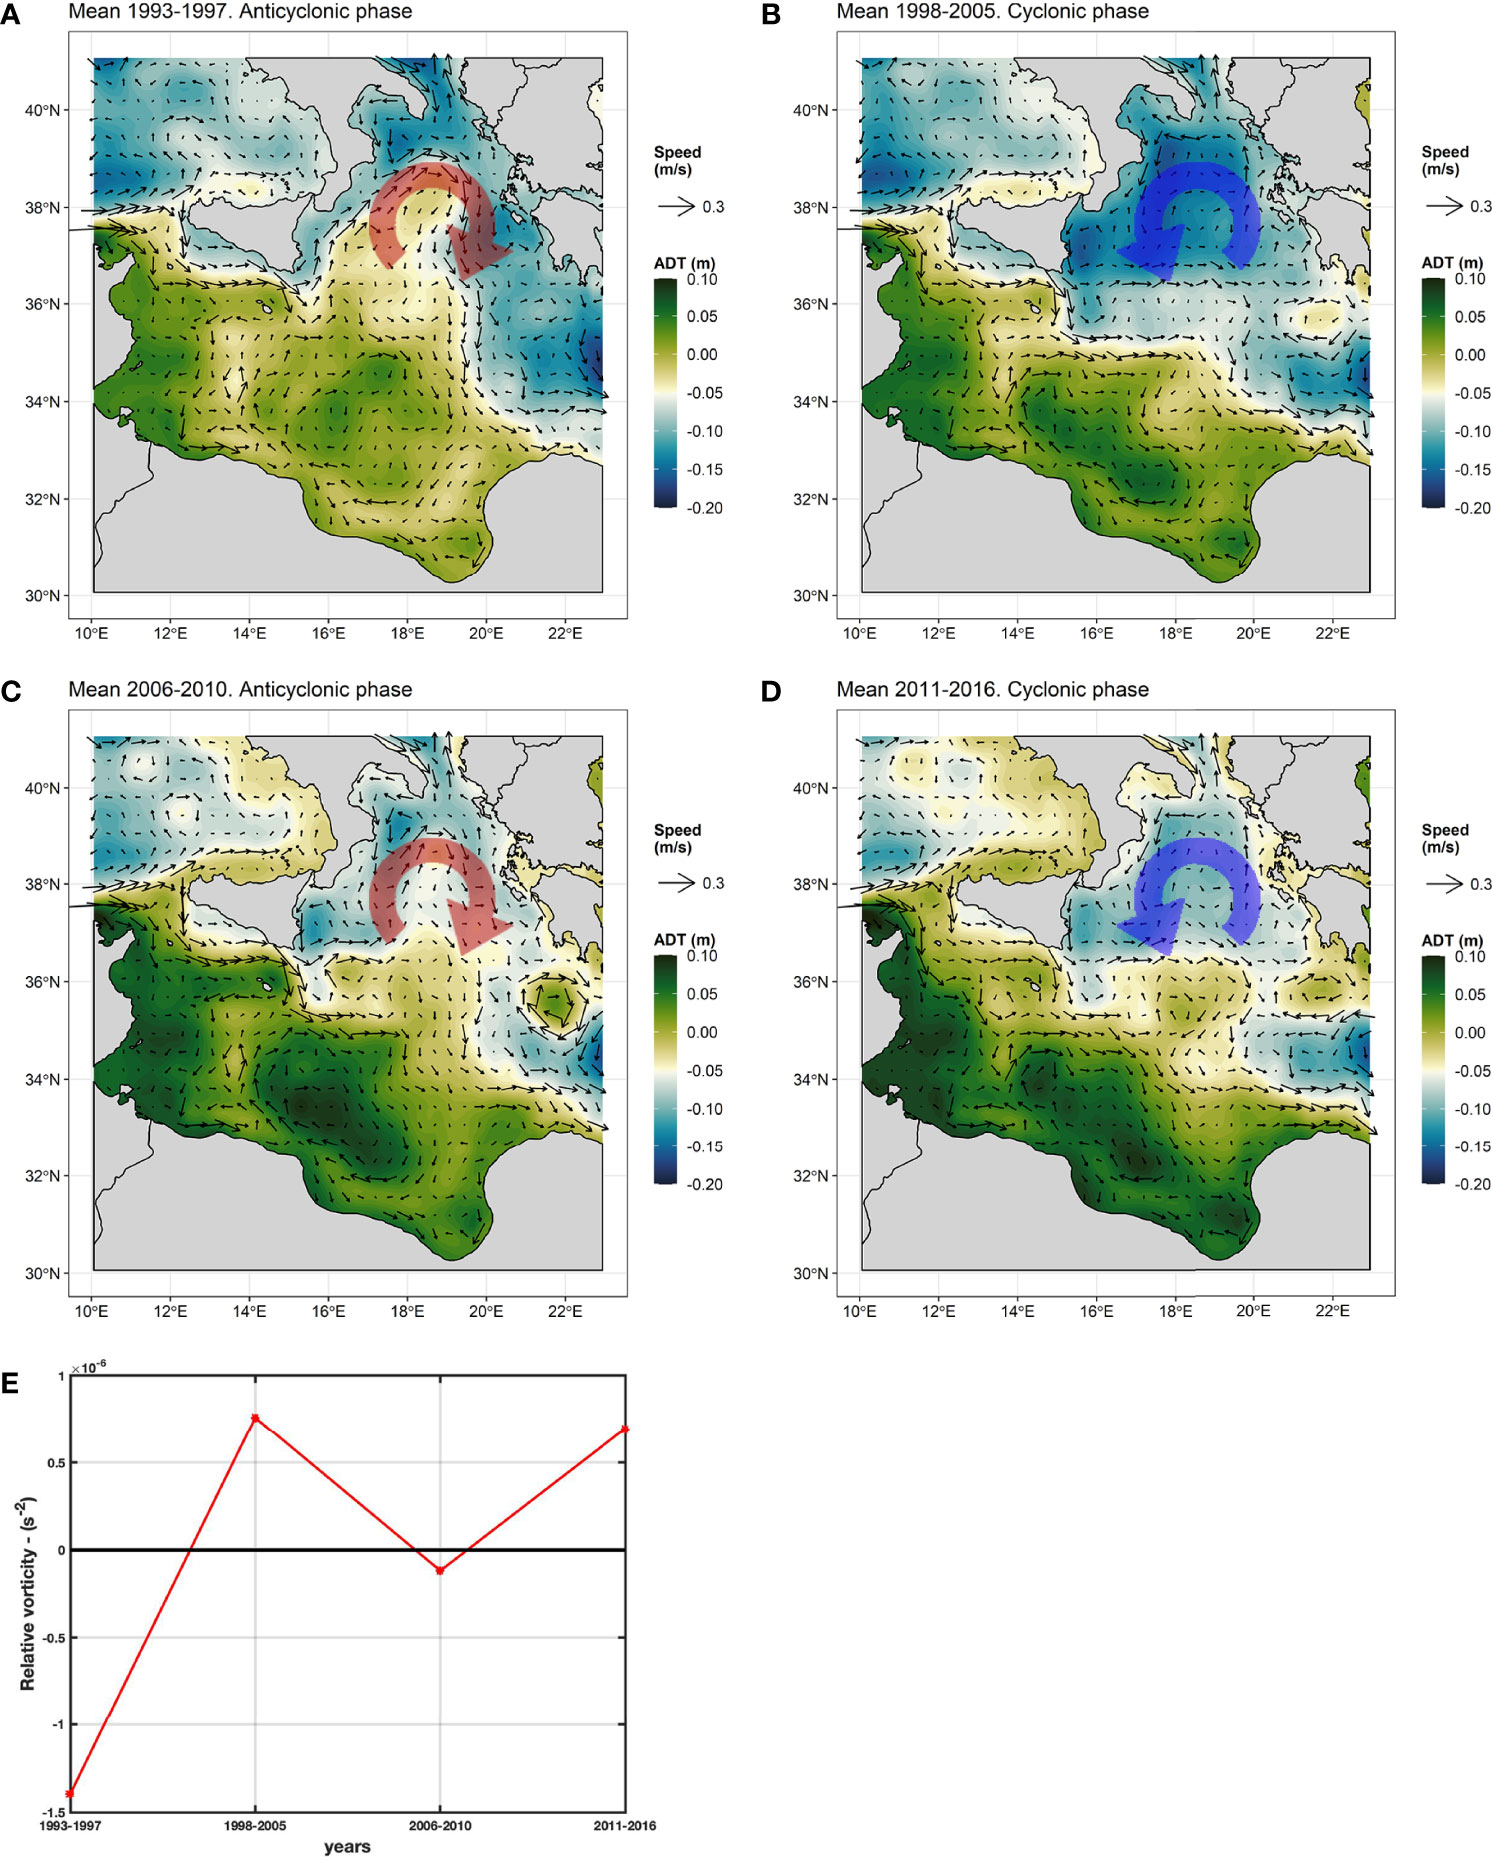
Figure 7 Means map of ADT (absolute dynamic topography; colours bar) and mean geostrophic velocity field (arrows) and relative speed (m/s), in the Central Mediterranean Sea, estimated for the periods (A) 1993–1997, (B) 1998–2005, (C) 2006–2010 and (D) 2011–2016. Red and blue arrows evidence the anticyclonic and cyclonic circulation mode of the North Ionian Gyre (NIG) respectively. In the panel (E) the computation of the averaged relative vorticity for the four periods confirms negative values (anticyclonic circulation) from 1993 to 1997 and from 2006 to 2010, and positive values (cyclonic circulation) in the periods 1998-2005 and 2011-2016.
The last period of the time series (2018-2020, Figure 6) showed a new decreasing trend significantly lower than the previous one (i.e. 2008-2010). This last reversal trend followed the cyclonic phase occurred in 2011-2016 (Figures 7D, E). The comparison of the ADT averages observed during the two cyclonic phases (Figures 7B, D) allowed to evidence a significant difference in term of intensity and areal extension of the NIG. In the first phase the NIG extends down to 35°N while in the second phase is confined at northern latitudes, higher than 36.5°N, probably due to the presence of an anticyclonic structure in the centre of the IS (Cardin et al., 2015; Placenti et al., 2018). This structure has weakened the AW flux toward Levantine Basin (Cardin et al., 2015), limiting the influence of colder and fresher AW toward the area where the formation of the IW take place. This interpretation is supported by recent studies that found a premature inversion of the NIG from cyclonic to anticyclonic, related to the extremely strong winter 2012 in the Adriatic (Gačić et al., 2014) leading to a strong weakening of the AW flux toward Levantine Basin between mid-2012 and the first months of 2013 (Menna et al., 2019). This phenomenon probably produced, between 2012 and 2013, warmer and saltier IW in the EMS which could have modulated the decreasing rate of θ and S in the SC.
The correlation between the NIG circulation mode and the temperature and salinity trends observed in the SC was investigated through a cross-correlation analysis that show a significant correlation for time lag of 6 (Cramer’s V = 0.456, p <0.05) and 7 years (Cramer’s V = 0.497, p <0.05), highlighting an association between cyclonic phase-negative trends and between anticyclonic phase-positive trends. However, we recognized a temporal variability between the reversal of the circulation mode and the trend inversion that suggest the presence of unadressed additional mechanisms that tune the onset of the signals and encourage the need of further studies.
Moreover, the time series of θ and S of the DW in 2010-2020 has been investigated and showed similar trends to the IW, but characterized by lower increments (Figure 3). However, it is important to note that most of the data collected in this study regarding the DW are referred to the upper part of this water mass, due to the limited depths that characterize the SC. Regarding this water mass, integrating the θ and S data discussed in Bonanno et al. (2014) and Ben Ismail et al. (2014) with our time series, it is possible to detect a general increase in the last twenty years of about 0.4°C of θ and 0.1 of S, respectively (Figure 8). However, the time series showed two strong break points in 2006 and 2009 characterized by an abrupt decrease of θ and S that were also discussed by Ben Ismail et al. (2014) regarding the 2006, and by Bonanno et al. (2014) regarding both years. In addition, these authors found a simultaneous increase of density (σ) in the DW, associating these findings to the presence of tEMDW in the SC. It is confirmed by our data also in 2010 (not shown), while in the following years (2011-2017) a new warm and salty phase seems to affect the deeper waters of the SC (Figures 6 and 8). We also hypothesize that these trends concerning the deeper layers are a direct response to the climate change, in particular in terms of net evaporation over to the eastern basin, i.e. where the deeper water is formed (Schroeder et al., 2017).
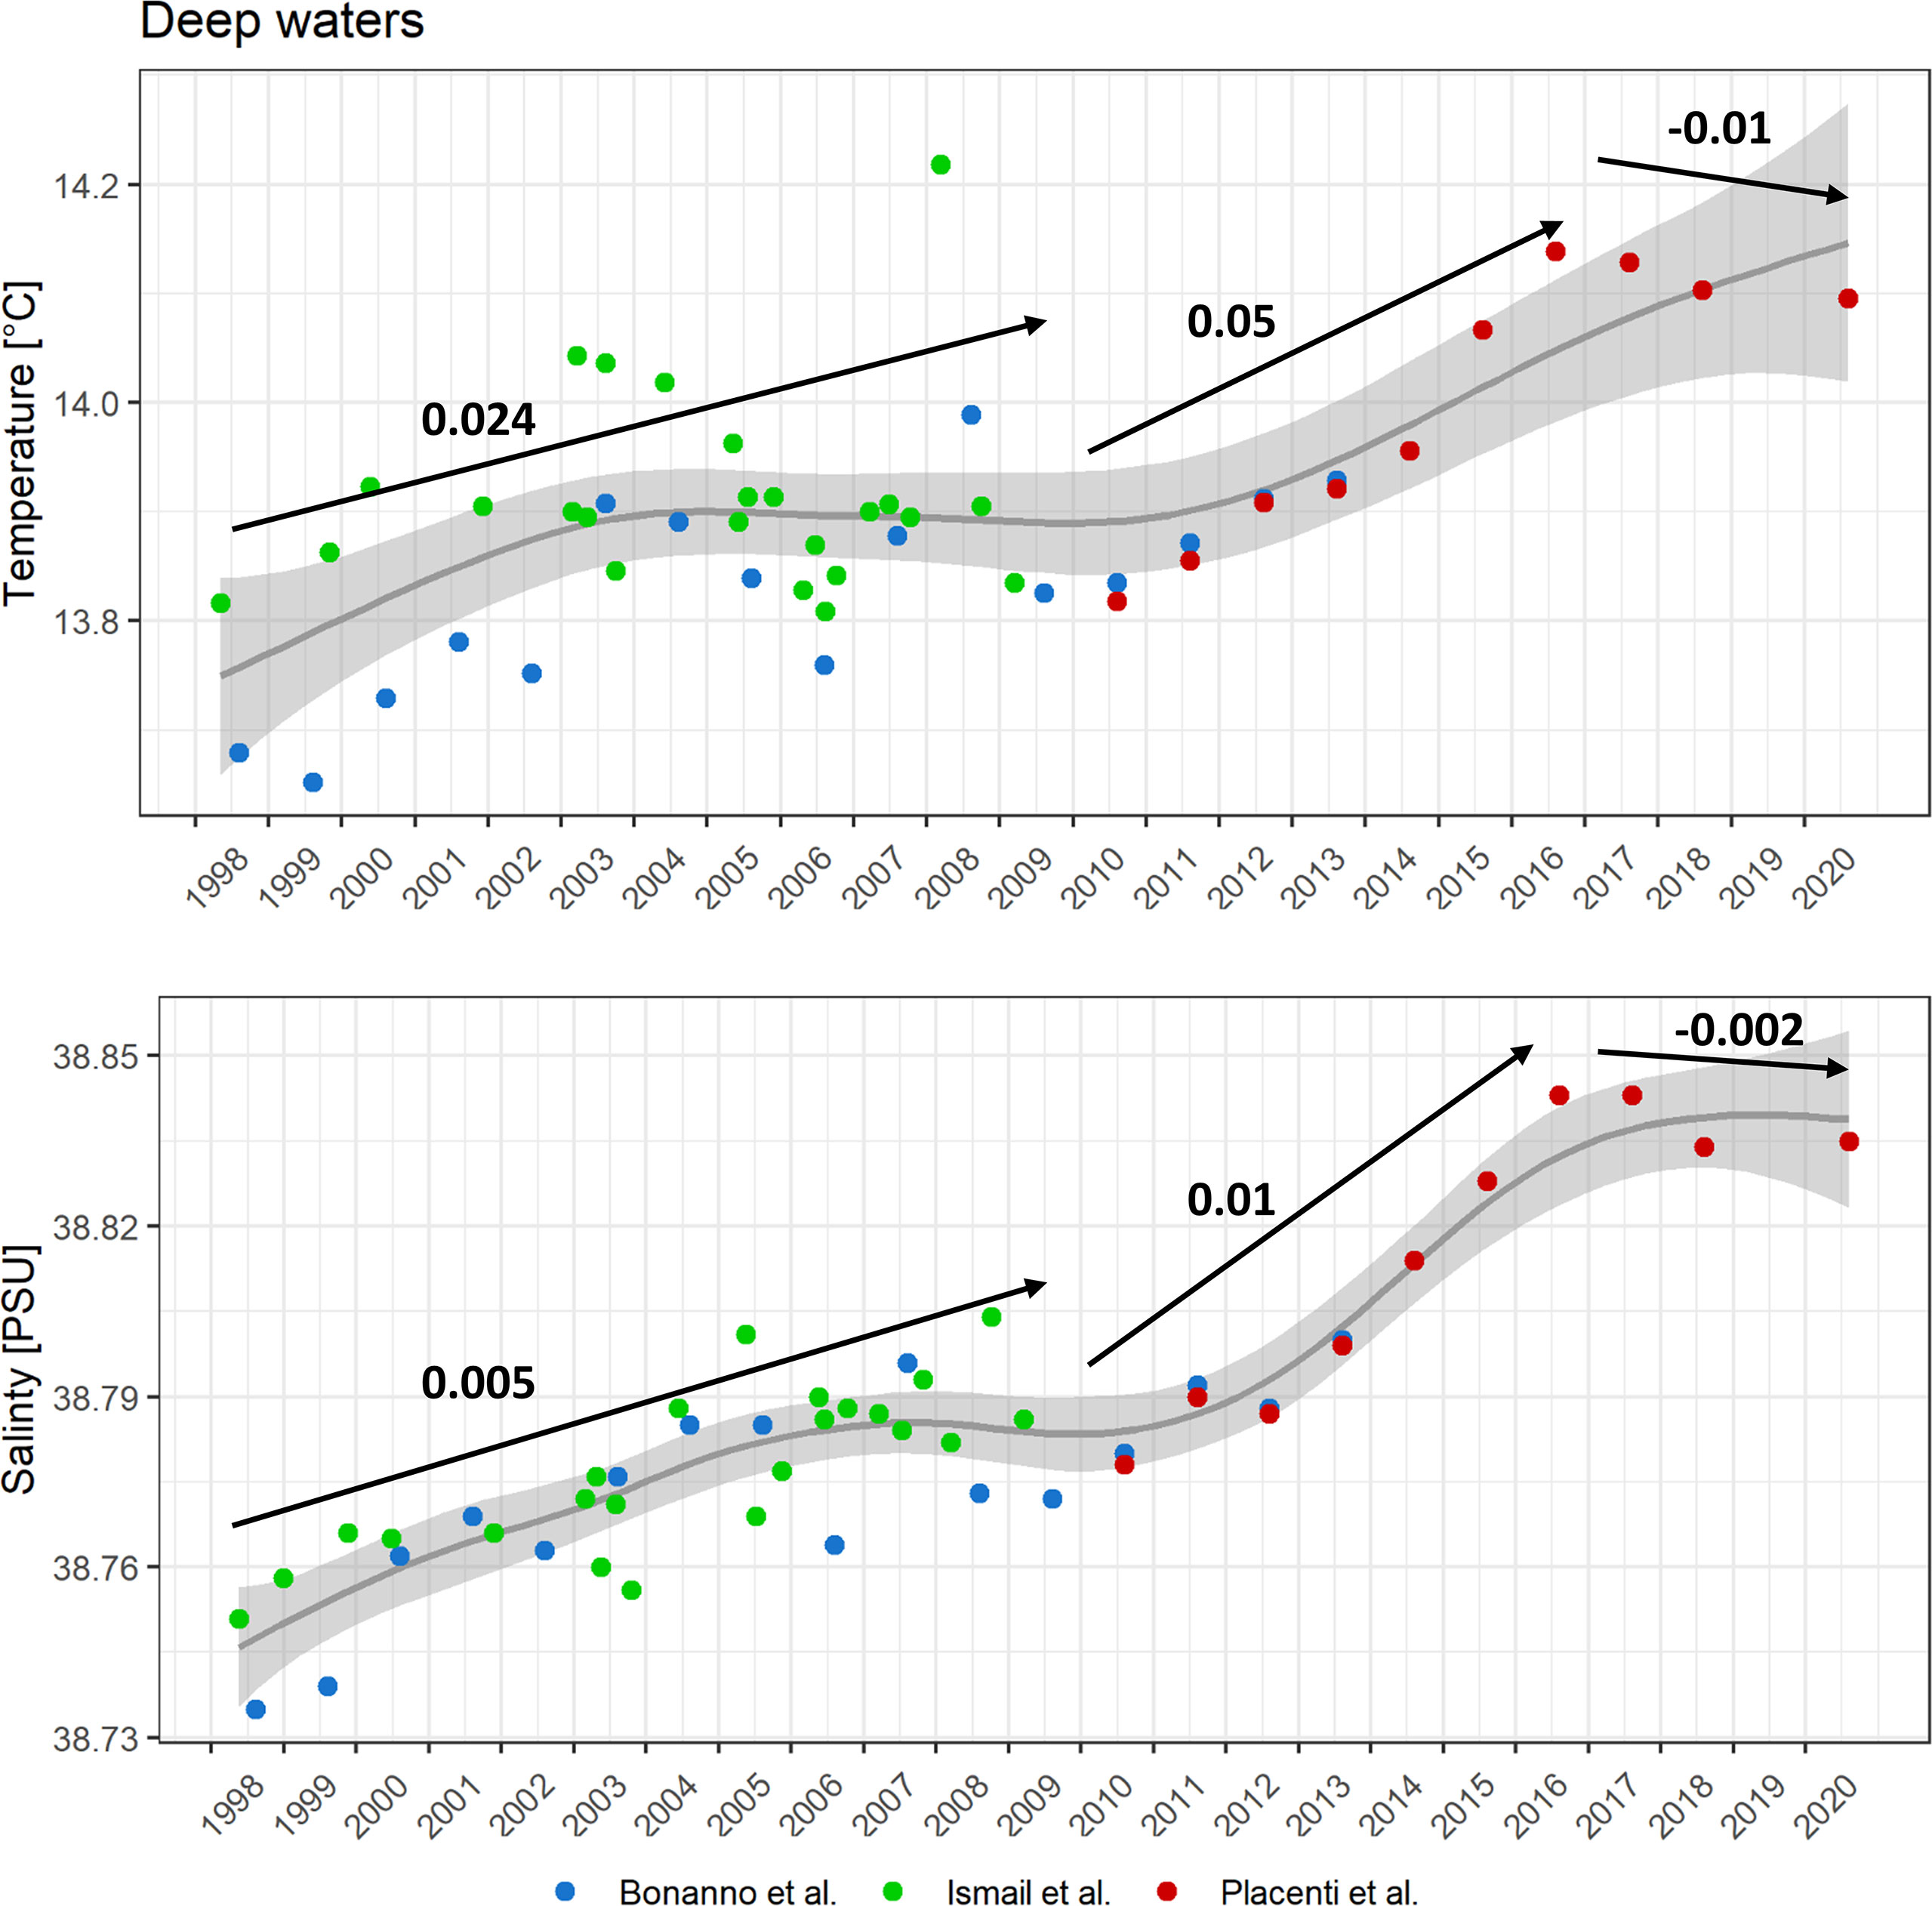
Figure 8 Potential temperature (top panel) and salinity (bottom panel) time series of the DW, extrapolated by Ben Ismail et. (2014), Bonanno et al. (2014) and this study are indicated as green, blue and red dots, respectively. A cubic regression spline computed through a GAM model and the relative confidence interval has been added in gray with the aim at evidencing temporal trends. Black arrows indicate the average annual increments of hydrological parameters computed for 1998-2009 by Bonanno et al. (2014) and for 2010-2020 from data collected in this study. The position of the dots on the time axis takes depend on the sampling month.
The coupling of the nitrates and silicates time series (2010-2020) with the salinity in the deeper waters of the SC showed anti-phase trends (Figure 5). These trends have been observed in IW both in the EMS (Ozer et al., 2017) and in the AdS (Borzelli et al., 2009; Civitarese et al., 2010). In agreement with Ozer et al. (2017), we think that a possible explanation could be related to the surface circulation dynamic of the NIG.
Specifically, during the anticyclonic phase (2006-2010, Figure 7C) the influx of AW, considered the main external source of P and N to the Mediterranean system (Powley et al., 2017), towards the Levantine Basin was limited, producing saltier and poorer nutrient IW. Conversely, the slight decrease in salinity and increase in nutrients observed between 2017 and 2020 (Figure 5) could be linked to the previous cyclonic phase of the NIG (2011-2016, Figure 7D).
In addition, the interannual fluctuations affecting the nutrient concentration has been compared to the variability of the Chl-a concentration, which is considered a good proxy of the phytoplankton biomass and provides useful indications on the productivity of the upper layer of the water column (e.g. Falkowski et al., 2004). Interestingly, our findings show similar trends among these time series, especially taking into account the nitrates and silicates concentration of the deeper layers. Indeed, starting from 2010, these time series were characterized by variable fluctuations and reached a simultaneous minimum peak in 2015, then followed by an increasing trend until the 2020. These observations suggest that vertical oceanographic structures, such as upwelling processes identified along the Sicilian coast (Lermusiaux and Robinson, 2001; Bignami et al., 2008; Patti et al., 2010; Torri et al., 2018), could play a significant role in the diffusion of nutrients from the lower layers, making them available for the photosynthetic activity with a cascading effect on the marine organisms that in the Central Mediterranean Sea found a suitable habitat for feeding and reproduction (e.g. Bonomo et al., 2018; Patti et al., 2020; Russo et al., 2021). Indeed, it could also be noted that the SC is a place of strong diffusion and dissipation that may favor such vertical transport (Ferron et al., 2017; Vladoiu et al., 2018). However, discordant findings regarding this relationship emerged between our study areas and the Levantine basin, in which an opposite trend has been evidenced between the nutrient concentration of the IW and the Chl-a concentration (Ozer et al., 2017), suggesting the need of further studies on a wider scale. In this context, the long-time series in the Strait of Gibraltar and Sicily, which represent key points of the entire Mediterranean thermohaline circulation, are of fundamental importance for climate studies. It is necessary to continue maintaining long-term observational points to improve our understanding of the physical mechanisms that drive climate variability and to discriminate the effects related to natural variability and the anthropogenic effect. Similarly, in these key areas, the acquisition of nutrients high-quality data on a multiannual scale are essential for understanding the relationships between oceanographic, biogeochemical and biological processes.
Data Availability Statement
The raw data supporting the conclusions of this article will be made available by the authors, without undue reservation.
Author Contributions
FPI wrote the manuscript and analyzed the dataset. MT wrote the manuscript and prepared the figures. VT, LG participated to the fieldwork and laboratory analyses. BP, AC and GT coordinated the field work and supervised the writing of the text. RS and FPe helped with some specific aspects of the manuscript and to review the manuscript. All authors contributed to the article and approved the submitted version.
Funding
The study was supported by the research projects SSD-PESCA, coordinated by the Ministry of the Education, University and Research (MIUR) and founded by the Ministry of Economic Development (MISE), and the Flagship Project RITMARE - The Italian Research for the Sea, coordinated by the Italian National Research Council and funded by MIUR.
Conflict of Interest
The authors declare that the research was conducted in the absence of any commercial or financial relationships that could be construed as a potential conflict of interest.
Publisher’s Note
All claims expressed in this article are solely those of the authors and do not necessarily represent those of their affiliated organizations, or those of the publisher, the editors and the reviewers. Any product that may be evaluated in this article, or claim that may be made by its manufacturer, is not guaranteed or endorsed by the publisher.
Acknowledgments
Masters of the Urania, Minerva Uno, Dallaporta and all their crew are thanked for their work in support to the sampling activities during the oceanographic cruises. We are grateful to Girolama Biondo, Giovanni Giacalone, Ignazio Fontana, Carmelo Buscaino and Carlo Patti for their valuable technical support and the sampling collection during the oceanographic surveys.
Supplementary Material
The Supplementary Material for this article can be found online at: https://www.frontiersin.org/articles/10.3389/fmars.2022.733540/full#supplementary-material
References
Ben Ismail S., Schroeder K., Sammari C., Gasparini G. P., Borghini M., Aleya L. (2014). Interannual Variability of Water Mass Properties in the Tunisia-Sicily Channel. J. Mar. Syst. 135, 14–28. doi: 10.1016/j.jmarsys.2013.06.010
Bessières L., Rio M. H., Dufau C., Boone C., Pujol M. I. (2013). Ocean State Indicators From MyOcean Altimeter Products. Ocean Sci. 9, 545–560. doi: 10.5194/os-9-545-2013
Béthoux J. P., Morin P., Chaumery C., Connan O., Gentili B., Ruiz-Pino D. (1998). Nutrients in the Mediterranean Sea, Mass Balance and Statistical Analysis of Concentrations With Respect to Environmental Change. Mar. Chem. 63 (1–2), 155–169. doi: 10.1016/S0304-4203(98)00059-0
Bignami F., Böhm E., D'Acunzo E., D'Archino R., Salusti E. (2008). On the Dynamics of Surface Cold Filaments in the Mediterranean Sea. J. Mar. Syst. 74 (1-2), 429–442. doi: 10.1016/j.jmarsys.2008.03.002
Bonanno A., Placenti F., Basilone G., Mifsud R., Genovese S., Patti B., et al. (2014). Variability of Water Mass Properties in the Strait of Sicily in Summer Period of 1998–2013. Ocean Sci. 10, 759–770. doi: 10.5194/os-10-759-2014
Bonomo S., Placenti F., Zgozi S., Torri M., Quinci E. M., Cuttitta A., et al. (2018). Relationship Between Coccolithophores and the Physical and Chemical Oceanography of Eastern Libyan Coastal Waters. Hydrobiologia 821 (1), 215–234. doi: 10.1007/s10750-017-3227-y
Borghini M., Bryden H., Schroeder K., Sparnocchia S., Vetrano A. (2014). The Mediterranean is Becoming Saltier. Ocean Sci. 10, 693–700. doi: 10.5194/os-10-693-2014
Borzelli G. L. E., Gačić M., Cardin V., Civitarese G. (2009). Eastern Mediterranean Transient and Reversal of the Ionian Sea Circulation. Geophys. Res. Lett. 36, L15108. doi: 10.1029/2009GL039261
Brankart J. M. (1994). The MODB Local Quality Control, Technical Report Vol. p. 5 (Liege: University of Liege), 1994.
Cardin V., Civitarese G., Hainbucher D., Bensi M., Rubino A. (2015). Thermohaline Properties in the Eastern Mediterranean in the Last Three Decades: Is the Basin Returning to the Pre-EMT Situation? Ocean Sci. 11, 53–66. doi: 10.5194/os-11-53-2015
Civitarese G., Gačić M., Borzelli E., Lipizer M. (2010). On the Impact of the Bimodal Oscillating System (BiOS) on the Biogeochemistry and Biology of the Adriatic and Ionian Seas (Eastern Mediterranean). Biogeosciences 7, 3987–3997. doi: 10.5194/bg-7-3987-2010
Demirov E., Pinardi N. (2002). Simulation of the Mediterranean Sea Circulation From 1979 to 1993: Part I. The Interannual Variability. J. Mar. Syst. 33–34, 23–50. doi: 10.1016/S0924-7963(02)00051-9
Falkowski P. G., Koblfzek M., Gorbunov M., Kolber Z. (2004). "Development and Application of Variable Chlorophyll Fluorescence Techniques in Marine Ecosystems," in Chlorophyll a fluorescence (Dordrecht: Springer), 757–778.
Ferron B., Bouruet Aubertot P., Cuypers Y., Schroeder K., Borghini M. (2017). How Important are Diapycnal Mixing and Geothermal Heating for the Deep Circulation of the Western Mediterranean? Geophysical. Res. Lett. 44 (15), 7845–7854. doi: 10.1002/2017GL074169
Gačić M., Borzelli G. L. E., Civitarese G., Cardin V., Yari S. (2010). Can Internal Processes Sustain Reversals of the Ocean Upper Circulation? The Ionian Sea Example. Geophys. Res. Lett. 37, L09608. doi: 10.1029/2010GL043216
Gačić M., Civitarese G., Borzelli G. L. E., Kovacevic V., Poulain P.-M., Theocharis A., et al. (2011). On the Relationship Between the Decadal Oscillations of the Northern Ionian Sea and the Salinity Distributions in the Eastern Mediterranean. J. Geophys. Res. 116, C12002. doi: 10.1029/2011JC007280
Gačić M., Civitarese G., Kovacevic V., Ursella L., Bensi M., Menna M., et al. (2014). Extreme Winter 2012 in the Adriatic: An Example of Climatic Effect on the BiOS Rhythm. Ocean Sci. 10, 513–522. doi: 10.5194/os-10-513-2014
Gačić M., Schroeder K., Civitarese G., Cosoli S., Vetrano A., Borzelli G. L. E. (2013). Salinity in the Sicily Channel Corroborates the Role of the Adriatic-Ionian Bimodal Oscillating System (BiOS) in Shaping the Decadal Variability of the Mediterranean Overturning Circulation. Ocean Sci. 9, 83–90. doi: 10.5194/os-9-83-2013
Gasparini G. P., Ortona A., Budillon G., Astraldi M., Sansone E. (2005). The Effect of the Eastern Mediterranean Transient on the Hydrographic Characteristics in the Strait of Sicily and in the Tyrrhenian Sea. Deep-Sea Res. I. Oceanogr. Res. Pap. 52 (6), 915–935. doi: 10.1016/j.dsr.2005.01.001
Grasshoff K., Kremling K., Ehrhardt M. (1999). Methods of Seawater Analysis (Weinheim: Wiley-Vch Verlag).
Huertas I. E., Rios A. F., Garcia-Lafuente J., Navarro G., Makaoui A., Sanchez-Roman A., et al. (2012). Atlantic Forcing of the Mediterranean Oligotrophy. Glob. Biogeochem. Cycles 26, GB2022. doi: 10.1029/2011GB004167
Krom M. D., Emeis K. C., Van Cappellen P. (2010). Why is the Eastern Mediterranean Phosphorus Limited? Prog. Oceanogr. 85 (3–4), 236–244. doi: 10.1016/j.pocean.2010.03.003
Krom M. D., Herut B., Mantoura R. F. C. (2004). Nutrient Budget for the Eastern Mediterranean: Implications for Phosphorus Limitation. Limnol. Oceanogr. 49, 1582–1592. doi: 10.4319/lo.2004.49.5.1582
Lacombe H., Tchernia P., Gamberoni L. (1985). Variable Bottom Water in the Western Mediterranean Basin. Prog. Oceanogr. 14, 319–338. doi: 10.1016/0079-6611(85)90015-1
Lermusiaux P. F. J., Robinson A. R. (2001). Features of Dominant Mesoscale Variability, Circulation Patterns and Dynamics in the Strait of Sicily. Deep Sea Res. Part I.: Oceanogr. Res. Pap. 48 (9), 1953–1997. doi: 10.1016/S0967-0637(00)00114-X
Menna M., Reyes Suarez N. C., Civitarese G., Gačić M., Rubino A., Poulain P.-M. (2019). Decadal Variations of Circulation in the Central Mediterranean and its Interactions With Mesoscale Gyres. Deep Sea Res. Part II Top. Stud. Oceanogr. Vol. 164, 14–24. doi: 10.1016/j.dsr2.2019.02.004
Mihanović H., Vilibić I., Šepić J., Matić F., Ljubešić Z., Mauri E., et al. (2021). Observation, Preconditioning and Recurrence of Exceptionally High Salinities in the Adriatic Sea. Front. Mar. Sci. 8, 834. doi: 10.3389/fmars.2021.672210
Millot C. (2007). Interannual Salinification of the Mediterranean Inflow. Geophys. Res. Lett. 34(21):L21609. doi: 10.1029/2007GL031179
Notarstefano G., Menna M., Legeais J.-F., von Schuckmann K., Le Traon P. Y., Smith N., et al. (2019). Reversal of the Northern Ionian Circulation in 2017. Section 4.5Copernicus Marine Service Ocean State Report, Issue 3. J. Oper. Oceanogr. 12 (sup1), S1–S123. doi: 10.1080/1755876X.2019.1633075
Ozer T., Gertman I., Kress N., Silverman J., Herut B. (2017). Interannual Thermohalin–2014) and Nutrien–2014) Dynamics in the Levantine Surface and Intermediate Water Masses, SE Mediterranean Sea. Glob. Planet. Change 151, 60–67. doi: 10.1016/j.gloplacha.2016.04.001
Patti B., Guisande C., Bonanno A., Basilone G., Cuttitta A., Mazzola S. (2010). Role of Physical Forcings and Nutrient Availability on the Control of Satellite-Based Chlorophyll a Concentration in the Coastal Upwelling Area of the Sicilian Channel. Sci. Mar. 74, 577–588.
Patti B., Torri M., Cuttitta A. (2020). General Surface Circulation Controls the Interannual Fluctuations of Anchovy Stock Biomass in the Central Mediterranean Sea. Sci. Rep. 10 (1), 1–14. doi: 10.1038/s41598-020-58028-0
Placenti F., Azzaro M., Artale V., La Ferla R., Caruso G., Santinelli C., et al. (2018). Biogeochemical Patterns and Microbial Processes in the Eastern Mediterranean Deep Water of Ionian Sea. Hydrobiologia 815 (1), 97–112. doi: 10.1007/s10750-018-3554-7
Placenti F., Schroeder K., Bonanno A., Zgozi S., Sprovieri M., Borghini M., et al. (2013). Water Masses and Nutrient Distribution in the Gulf of Syrte and Between Sicily and Libya. J. Mar. Sys. 121–122, 36–46. doi: 10.1016/j.jmarsys.2013.03.012
Powley H. R., Krom M. D., Van Cappellen P. (2017). Understanding the Unique Biogeochemistry of the Mediterranean Sea: Insights From a Coupled Phosphorus and Nitrogen Model Global Biogeochem. Cycles 31, 1010–1031. doi: 10.1002/2017GB005648
Redfield A. C., Ketchum B. H., Richards F. A. (1963). “The Influence of Organisms on the Composition of Sea Water,” in The Sea, Vol. 2. Ed. Hill M. N. (New York: Interscience), 224–228.
Ribera D'Alcalà M., Civitarese G., Conversano F., Lavezza R. (2003). Nutrient Ratios and Fluxes Hint at Overlooked Processes in the Mediterranean Sea. J. Geophys. Res. 108 (C9), 8106. doi: 10.1029/2002JC0016500
Rixen M., Beckers J.-M., Levitus S., Antonov J., Boyer T., Maillard C., et al. (2005). The Western Mediterranean Deep Water: A Proxy for Climate Change. Geophys. Res. Lett. 32, L12608. doi: 10.1029/2005GL022702,2005
Robinson A. R., Leslie W. G., Theocharis A., Lascaratos A. (2001). “Mediterranean Sea Circulation,” in Encyclopedia of Ocean Sciences (London: Academic Press), 1689–1706.
Roether W., Klein B., Beitzel V., Manca B. B. (1998). Property Distributions and Transient Tracer Ages in Levantine Intermediate Water in the Eastern Mediterranean. J. Mar. Syst. 18, 71–87. doi: 10.1016/S0924-7963(98)00006-2
Roether W., Manca B. B., Klein B., Bregant D., Georgopoulos D., Beitzel V., et al. (1996). Recent Changes in Eastern Mediterranean Deepwaters. Science 271 (5247), 333–335. doi: 10.1126/science
Russo S., Torri M., Patti B., Reglero P., Álvarez-Berastegui D., Cuttitta A., et al. (2021). Unveiling the Relationship Between Sea Surface Hydrographic Patterns and Tuna Larval Distribution in the Central Mediterranean Sea. Front. Mar. Sci. 8, 708775. doi: 10.3389/FMARS.2021.708775
Schroeder K., Chiggiato J., Josey S. A., Borghini M., Aracri S., Sparnocchia S. (2017). Rapid Response to Climate Change in a Marginal Sea. Sci. Rep. 7, 4065. doi: 10.1038/s41598-017-04455-5
Schroeder K., Gasparini G. P., Borghini M., Cerrati G., Delfanti R. (2010). Biogeochemical Tracers and Fluxes in the Western Mediterranean Sea, Spring 2005. J. Mar. Syst. 80, 8–24. doi: 10.1016/j.jmarsys.2009.08.002
Shabrang L., Menna M., Pizzi C., Lavigne H., Civitarese G., Gačić M. (2016). Long-Term Variability of the Southern Adriatic Circulation in Relation to North Atlantic Oscillation. Ocean Sci. 12 (1), 233–241. doi: 10.5194/os-12-233-2016
Sorgente R., Olita A., Oddo P., Fazioli L., Ribotti A. (2011). Numerical Simulation and Decomposition of Kinetic Energy in the Central Mediterranean: Insight on Mesoscale Circulation and Energy Conversion. Ocean Sci. 7, 503–519. doi: 10.5194/os-7-503-2011
Theocharis A., Krokos G., Velaoras D., Korres G. (2014). “An Internal Mechanism Driving the Alternation of the Eastern Mediterranean Dense/Deep Water Sources,” in The Mediterranean Sea: Temporal Variability and Spatial Patterns vol. 202. Ed. Borzelli G. L. E., (Washington, D.C.: American Geophysical Union / Wiley), 113–137.
Torri M., Corrado R., Falcini F., Cuttitta A., Palatella L., Lacorata G., et al. (2018). Planktonic Stages of Small Pelagic Fishes (Sardinella Aurita and Engraulis Encrasicolus) in the Central Mediterranean Sea: The Key Role of Physical Forcings and Implications for Fisheries Management. Prog. Oceanog. 162, 25–39. doi: 10.1016/j.pocean.2018.02.009
Van Cappellen P., Powley H. R., Emeis K.-C., Krom M. D. (2014). A Biogeochemical Model for Phosphorus and Nitrogen Cycling in the Eastern Mediterranean Sea (EMS). Part 1. Model Development, Initial Conditions and Sensitivity Analyses. J. Mar. Syst. 139, 460–471. doi: 10.1016/j.jmarsys.2014.08.016
Keywords: hydrological patterns, interannual variability, biogeochemical patterns, Sicily Channel, Mediterranean Sea
Citation: Placenti F, Torri M, Pessini F, Patti B, Tancredi V, Cuttitta A, Giaramita L, Tranchida G and Sorgente R (2022) Hydrological and Biogeochemical Patterns in the Sicily Channel: New Insights From the Last Decade (2010-2020). Front. Mar. Sci. 9:733540. doi: 10.3389/fmars.2022.733540
Received: 30 June 2021; Accepted: 22 April 2022;
Published: 20 May 2022.
Edited by:
Jose Luis Iriarte, Austral University of Chile, ChileReviewed by:
Milena Menna, Istituto Nazionale di Oceanografia e di Geofisica Sperimentale, ItalyYannis Cuypers, Sorbonne Universités, France
Copyright © 2022 Placenti, Torri, Pessini, Patti, Tancredi, Cuttitta, Giaramita, Tranchida and Sorgente. This is an open-access article distributed under the terms of the Creative Commons Attribution License (CC BY). The use, distribution or reproduction in other forums is permitted, provided the original author(s) and the copyright owner(s) are credited and that the original publication in this journal is cited, in accordance with accepted academic practice. No use, distribution or reproduction is permitted which does not comply with these terms.
*Correspondence: Marco Torri, marco.torri@ismed.cnr.it