Long-Term Trends in Estuarine Carbonate Chemistry in the Northwestern Gulf of Mexico
 Melissa R. McCutcheon
 Xinping Hu
- Harte Research Institute for Gulf of Mexico Studies, Texas A&M University – Corpus Christi, Corpus Christi, TX, United States
A four-decade dataset that spans seven estuaries along a latitudinal gradient in the northwestern Gulf of Mexico and includes measurements of pH and total alkalinity was used to calculate partial pressure of CO2 (pCO2), dissolved inorganic carbon (DIC), saturation state of aragonite (ΩAr), and a buffer factor (βDIC, which measures the response of proton concentration or pH to DIC concentration change) and examine long-term trends and spatial patterns in these parameters. With the notable exception of the northernmost and southernmost estuaries (and selected stations near freshwater input), these estuaries have generally experienced long-term increases in pCO2 and decreases in DIC, ΩAr, and βDIC, with the magnitude of change generally increasing from north to south. At all stations with increasing pCO2, the rate of increase exceeded the rate of increase in atmospheric pCO2, indicating that these estuaries have become a greater source of CO2 to the atmosphere over the last few decades. The decreases in ΩAr have yet to cause ΩAr to near undersaturation, but even the observed decreases may have the potential to decrease calcification rates in important estuarine calcifiers like oysters. The decreases in βDIC directly indicate that these estuaries have experienced continually greater change in pH in the context of ocean acidification.
Introduction
Unlike the acidification of the open oceans that is driven almost solely by the ocean’s uptake of atmospheric CO2, the changing carbonate chemistry of coastal and estuarine environments is modulated by several regional to local factors that are superimposed on global trends. The high temporal and spatial heterogeneity in estuarine carbonate chemistry is driven by the complex interactions between watershed dynamics, riverine input of nutrients and organic matter, changing net ecosystem metabolism, changes to upwelling, mixing between and within reservoirs, and reservoir residence time (Frankignoulle et al., 1994; Cai et al., 2003; Feely et al., 2010; Hofmann et al., 2011; Lejart et al., 2011; Mongin and Baird, 2014; Wallace et al., 2014; Challener et al., 2016).
Of all contributing biogeochemical processes, net ecosystem metabolism (NEM) is often the major driver of the carbonate system in estuaries (Wallace et al., 2014), with the exception of the river-dominated upper reaches of some estuaries where riverine CO2 inputs become dominant (Joesoef et al., 2015; Van Dam et al., 2018). The majority of the world’s estuaries are net heterotrophic because of terrestrial organic matter loading, and as a result they generally have elevated partial pressure of CO2 (pCO2) and act as a source of CO2 to the atmosphere (Cai et al., 1999; Raymond et al., 2000; Frankignoulle and Borges, 2001; Bauer et al., 2013). Subsequently, estuaries can substantially contribute to global carbon cycles, with studies estimating that the magnitude of estuarine air-water CO2 flux is nearly the same as that of continental shelves, even though the latter occupy ∼24 times more surface area (Cai, 2011; Bauer et al., 2013).
Several regional studies have demonstrated long-term trends, both increasing and decreasing, in carbonate system parameters [primarily pH and total alkalinity (TA)] in estuarine and coastal environments (Waldbusser et al., 2011; Hu et al., 2015; Müller et al., 2016; Carstensen et al., 2018; Robbins and Lisle, 2018; Carstensen and Duarte, 2019; Najjar et al., 2019; Scanes et al., 2020). Due to complex estuarine carbonate system controls that may change over time, apparent carbonate system trends may not be sustained across multiple decades or may even reverse (Provoost et al., 2010). It was previously demonstrated that the bays in the northwestern Gulf of Mexico (nwGOM - our study area) have experienced long-term declines in both pH and TA, which was hypothesized to be caused by long-term decreases in freshwater inflow of high-alkalinity rivers and accompanying decreases in TA delivery to the bays (Hu et al., 2015).
While the identification of pH and TA trends in the nwGOM estuaries was an important first step in understanding the systems and defining management strategies, several other carbonate system parameters may be more informative about the effect of acidification on an estuary and its biological communities. In this study, long-term trends in pCO2 are first explored, which is the most important factor to understand air-sea flux implications. Long-term trends in total dissolved inorganic carbon (DIC) are next explored, an important parameter for the carbon budget. Trends in saturation state of aragonite (ΩAr) are next explored, which is likely the most important factor to understand biological implications, particularly the potential difficulty for calcifiers (e.g., oysters) to build and maintain their calcium carbonate shells (de Putron et al., 2011; Waldbusser et al., 2015). Finally, long-term trends are explored in βDIC ((∂ln[H+]/∂DIC)–1), a buffer factor that represents the amount of change in proton concentration or pH that occurs with a given addition of DIC (Egleston et al., 2010). Differences over geographic space in long-term trends, potential drivers of trends, and implications of trends are discussed.
Materials and Methods
Study Sites
The studied region includes seven estuaries that border the Texas coast in the nwGOM—spanning north to south they are Sabine-Neches Estuary (SNE), Trinity-San Jacinto Estuary (TSJ), Lavaca-Colorado Estuary (LCE), Guadalupe Estuary (GE), Mission-Aransas Estuary (MAE), Nueces Estuary (NE), and Laguna Madre Estuary (LM) (Figure 1). This region hosts 595 km of coastline that lies between 26° and 30°N in a subtropical climate. The nwGOM estuaries are relatively shallow (rarely exceeding 3 m deep), and they are classified as lagoons due to their connectivity and the barrier island system that separates them from the Gulf of Mexico and limits water exchange (Russell and Montagna, 2007; Montagna et al., 2011b). Along with other lagoonal bays that span the majority of the Gulf of Mexico coast, these estuaries make up part of the largest lagoonal system in the world (Dürr et al., 2011).
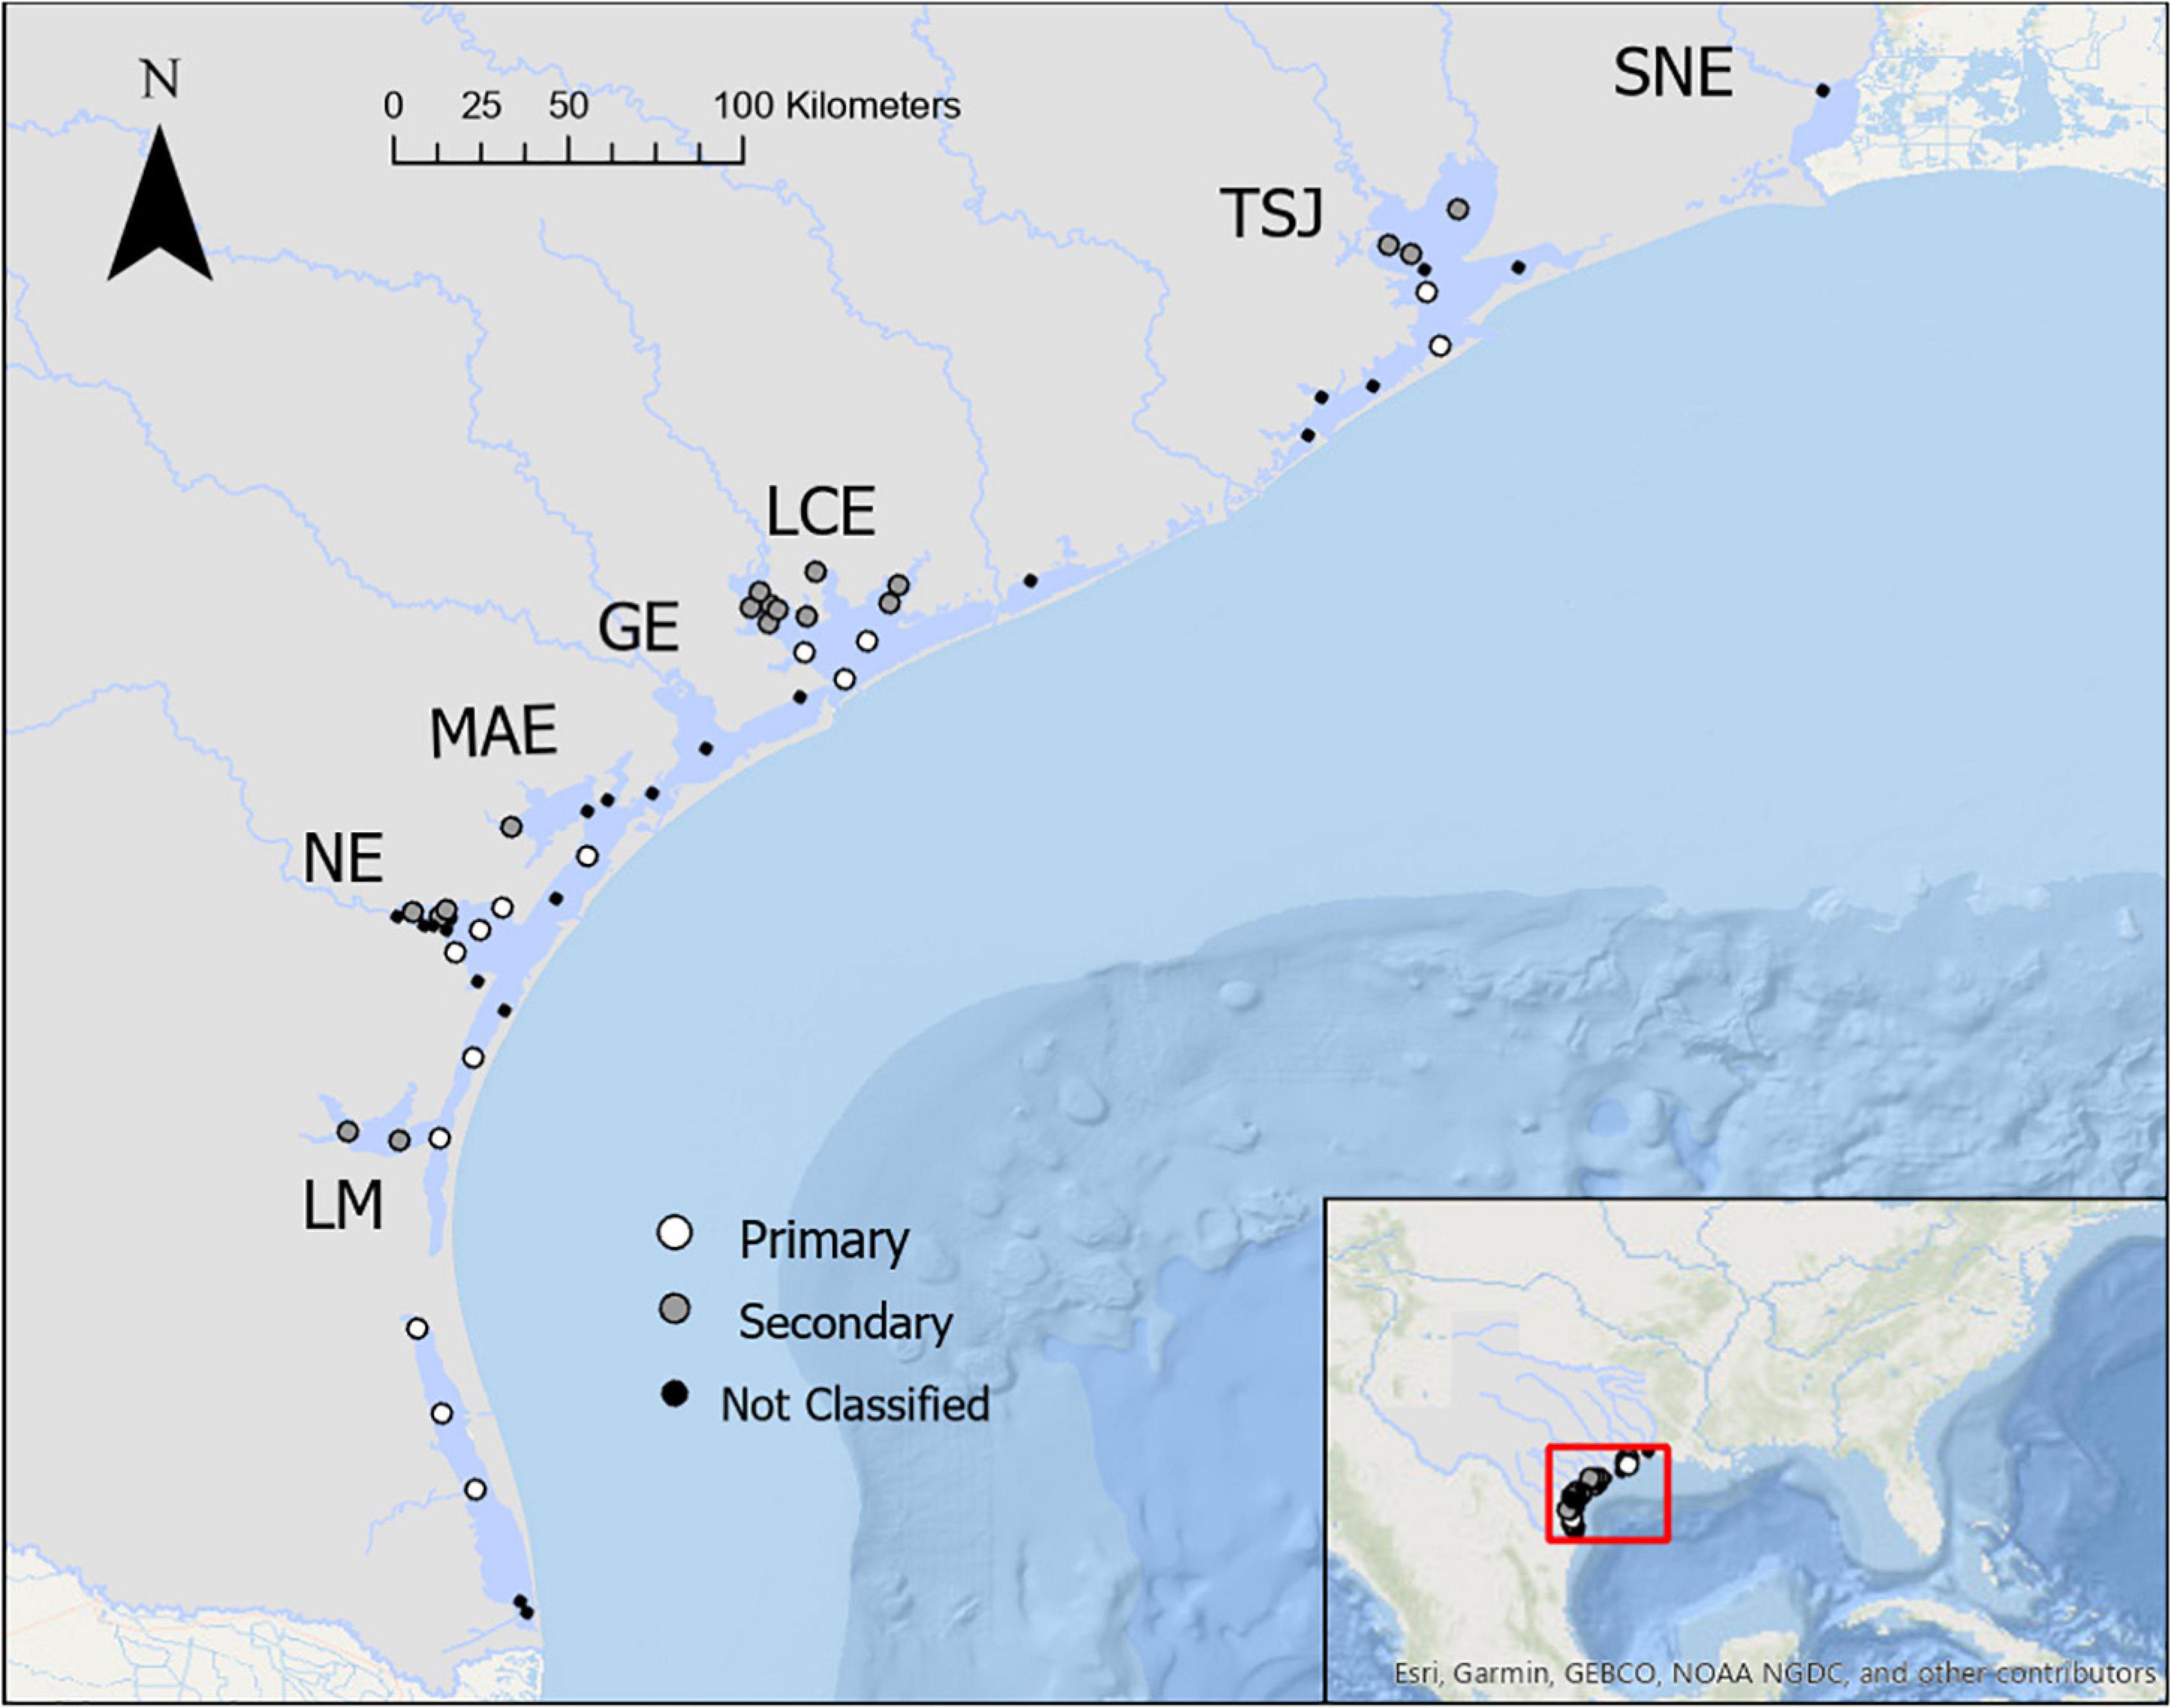
Figure 1. A map of study locations. Texas Commission on Environmental Quality Surface Water Quality Monitoring stations that were used in the analysis (greater than 20 years of sampling for temperature, salinity, pH, and total alkalinity) are shown in each of the seven estuaries along the Texas coast. Station numbers can be found in Supplementary Figure 1.
The area closest to the Louisiana border experiences twice the rate of precipitation as the area closest to the Mexico border. Together with an evaporation gradient, this yields a freshwater balance (sum of all freshwater input via rivers, runoff, and direct precipitation minus evaporation) that is two orders of magnitude higher in the northernmost estuary, i.e., SNE, than in the southernmost estuary, i.e., LM (Montagna et al., 2011a). The differing freshwater balance as well as differences in land use and land cover between estuaries yields differing chemical properties, making these seven estuaries chemically unique despite their physical similarities.
Data Sources and Statistical Treatment
Historical water quality data were obtained from the Texas Commission on Environmental Quality’s (TCEQ’s) Surface Water Quality Monitoring (SWQM) program. TCEQ has collected and compiled water quality data on a quarterly basis across the nwGOM estuaries since 1969, though years of monitoring have varied between stations. We used only those stations with 20 + years of data (including one station in SNE, 10 in TSJ, 13 in LCE, two in GE, five in MAE, 13 in NE, and 10 in LM) and only those stations with 60 + simultaneous measurements for temperature, salinity (or working salinity as defined below), pH, and TA for our analyses. Filtering to remove missing data necessary for carbonate system analyses resulted in removal of all data from 1969 to 1973, the earliest data used in this study were from 1974.
Measurement of TA by TCEQ involved titration to a pH of 4.5 and was monitored using a pH electrode with calibrated acid (H2SO4 or HCl) in accordance with EPA Protocol 310.1. This type of interlaboratory methodology would be expected to have a precision of around 5% (Hu et al., 2015). TA is reported by TCEQ in mg-CaCO3 L–1, but it was converted to μmol kg–1 by multiplying by a factor of 20 and dividing by sample density (derived from salinity and room temperature at 22°C) for this analysis. Measurement of pH by TCEQ involved pH sensors that were calibrated daily using a two-point calibration approach with National Institute of Standards and Technology pH 7.00 and 10.00 buffers, and the values were corrected to reflect in situ temperature. Analytical precision was not reported by TCEQ for the pH measurements, although protocol did require measurements to be rounded to the tenth decimal place, so an uncertainty of up to 0.1 can be assumed. Mclaughlin et al. (2017) reported that potentiometric pH sensors in coastal monitoring have error of ± 0.2 pH units, but this is within deployed SeaBird instruments that may have additional sources of error (e.g., much deeper depth). Direct salinity measurements were obtained by TCEQ using a calibrated Hydrolab or YSI sondes using KCl solution of known specific conductance. For those observations where salinity data were missing but specific conductance data were available, a working salinity value was calculated using the linear relationship between specific conductance and salinity (R2 = 0.98, as calculated from those records with both salinity and specific conductance data). Working salinity values that were calculated to be ≤ 0 (3% of the 2,747 calculated values) were removed from the analysis.
We used an intensive outlier removal approach that aimed to remove occurrences of falsely reported data due to any human or instrument error coming from the multiple laboratories that analyze TCEQ SWQM samples. A two-step approach for outlier removal based on both bracketed time and salinity intervals was conducted for pH and TA measurements, as was done by Hu et al. (2015). Seven time brackets were established (5-year intervals) and nine salinity brackets were established (with a range of 5 salinity units for salinity < 35 and 35–49.99 and 50 + to encompass the relatively limited observations at hypersalinity). Those observations of each parameter that were deemed outliers within either a time bracket or a salinity bracket were removed. Outliers were defined as measurements that were three times the interquartile range (IQR) above quartile three (Q3) or three times the IQR below Q1 within bracketed subsets of the data. This approach assumes that some outliers are representative of the system and therefore removes fewer data than the standard outlier calculation. Temperature outliers were removed from seasonal subsets of the data using the same outlier designation (eight observations removed). There were no salinity observations that were deemed outliers.
Calculation of Carbonate System Parameters
TCEQ’s measured in situ temperature, salinity (or specific conductance that can be converted to working salinity), pH (converted from NBS scale to total scale, see Millero, 2001), and TA were used as inputs to the seacarb package in R for calculations of other carbonate system parameters, propagated error associated with carbonate system parameters, and the βDIC buffer factor (R Core Team, 2020; Gattuso et al., 2021). For speciation calculations, the carbonic acid dissociation constants K1 and K2 were from Millero (2010), the HF dissociation constant was from Perez and Fraga (1987), the HSO4– dissociation constant was from Dickson et al. (1990), and boron concentration was from Uppström (1974). Nutrient contributions (phosphate, silica, and ammonium) to TA were not included in speciation calculations, as they were not consistently measured and are assumed to be negligible to TA given the generally low concentrations. Propagated error was calculated using the Gaussian method 1st order, 2nd moment analysis using analytical precision as the standard deviation associated with each of the measured variables (temp = 0.1°C, Sal = 0.1, pH = 0.1, TA = 115 μmol kg–1).
The calculated ΩAr was corrected to account for non-zero calcium concentrations ([Ca2+]) in the river end members. Separate corrections were performed for each estuary to reflect different river chemistries. For those estuaries that TCEQ had sufficient [Ca2+] data—TSJ, LCE, NE, and LM (59, 26, 58, and 9 aligning [Ca2+] and salinity observations, respectively)—a linear regression between TCEQ measured [Ca2+] and salinity within each estuary was used to estimate [Ca2+] for every date/station observation. A correction to ΩAr was then conducted based on the difference between theoretical [Ca2+] (with freshwater endmember having zero [Ca2+]) and the actual (i.e., estimated) [Ca2+], similar to the ΩAr correction in McCutcheon et al. (2019). GE, MAE, and SNE all had insufficient [Ca2+] data from TCEQ, so ΩAr corrections differed. For GE and MAE, similar estuary-wide [Ca2+]/Sal regressions were used for correction, using [Ca2+] and salinity data from our own lab from 2013 to 2015 and 2014 to 2020, respectively (Hu, unpublished data). For SNE, [Ca2+] was estimated for the river endmember by obtaining TA data from TCEQ from the Sabine and Neches rivers (spanning 1974–2013) and dividing TA by two as an estimate of riverine [Ca2+] (assuming TA was a result of weathering). The linear relationship between the river endmember (Sal = 0, [Ca2+] = 0.28 mmol kg–1) and the ocean endmember (Sal = 35, [Ca2+] = 10.28 mmol kg–1) was then used to estimate [Ca2+], and the data were corrected accordingly. It is worth noting that this ΩAr correction method may introduce some level of error (based on fluctuations in endmember Ca2+ and Ca2+consumption dynamics within each estuary), but the corrected value should be more appropriate than direct seacarb calculations. It has also been demonstrated in NE that Ca2+/S relationship can remain linear even when evaporation leads to hypersalinity (McCutcheon et al., 2019).
The buffer factor βDIC was calculated using the seacarb package Egleston et al. (2010) and the appropriately corrected equation from Álvarez et al. (2014). This buffer factor is particularly relevant since it directly indicates the change in pH that occurs with a given addition of DIC. Given that the common drivers of acidification (e.g., enhanced mineralization and intrusion of atmospheric CO2) increase DIC, this buffer factor indicates pH response to the acidification mechanism.
Regression Analyses for Long-Term Trends
Theil-Sen (TS) regression analysis with the Siegel modification (Siegel, 1982) was chosen to generate a series of linear relationships between carbonate system parameters and time (decimal year) at each station; because of its non-parametric approach and robustness to outliers, TS regression is well-suited to explore trends in multi-laboratory agency data (Siegel, 1982; Kaushal et al., 2013; Stets et al., 2014). All analyses were conducted in R, version 4.0.3, and the mblm package was used for regressions (Komsta, 2019; R Core Team, 2020). Rates of increase or decrease in parameters were reported only for those TS regressions that were significant based on alpha = 0.05. Trends are reported at individual stations rather than aggregating into bay units (as was done for investigations of pH and TA trends by Hu et al., 2015) to fully picture spatial heterogeneity. Long-term trends in pH and TA are reported in addition to calculated parameters, as stations were not aggregated into bay entities as was done in Hu et al. (2015) and an additional 5 years of data (2010–2015) were available since the earlier analysis. In addition to pH, we also calculated and reported temporal trends in [H+] (Supplementary Table 1); as would be expected, these trends all displayed the inverse sign and had similar levels of significance compared to the respective pH trend (there were only three stations where significance was not found for both trends if found for one, and these stations had marginal significance, i.e., p > 0.01). Based on these regression results and based on the similar average values in pH in the region, we opted to discuss only pH (not [H+]), as the pH trends accurately reflected the temporal changes in estuarine acidity (Fassbender et al., 2021).
To confirm that the long-term trends in calculated parameters that were detected by TS regression were valid despite the relatively large propagated error associated with the calculated variables, simulation analyses were conducted to recalculate the slopes of TS regressions over 1,000 simulations at each station for pCO2, DIC, and ΩAr. For each simulation, resampled values for each data point were randomly selected within a normal curve using the calculated propagated error for each calculated parameter as the standard deviation for the curve. A 95% confidence interval of the 1,000 new estimates of the TS regression slope was then calculated; if the confidence interval included a value of zero, then the simulation suggested that there was not a long-term trend in the given parameter. In cases where the simulations showed a significant long-term trend, the mean of all simulated slopes would be the estimate of the long-term trend (see Discussion for the advantages of this approach).
Investigating Spatial Variability
Given the expectation of long-term trends in parameters (and the significant interaction between covariate decimal year and estuaries in analyses of covariance, ANCOVAs), differences between estuaries were investigated using a subset of “current” data. The “current” data consisted of data from (2010 to 2015) for all estuaries except for SNE. Since sampling concluded in 2008 in SNE and sampling frequency was low, data from 1998 to 2008 was used for SNE. Mean differences in carbonate system parameters between estuaries (using current data) were investigated with a single one-way analysis of variance (ANOVA).
In estuaries with sufficient sampling (TSJ, LCE, MAE, NE, LM) stations were categorized as either primary bay stations, i.e., stations in the bay that has direct connection to the GOM, or secondary bay stations, i.e., stations in bays that are separated from the GOM by the primary bays, for spatial comparisons within estuaries (Figure 1). Given that TSJ did not have any sampling in the primary bay areas from 2010 to 2015, the “current” subset was modified to 2000–2005 for only TSJ for primary/secondary comparisons. Differences in parameters between primary and secondary bays were not the same within all estuaries (based on significant interactions in two-way ANOVAs); thus, mean differences between primary and secondary bays were investigated within each estuary using t-tests.
Results
Long-Term Trends in Carbonate System Parameters
We examined 54 total stations: one station in SNE, 10 in TSJ, 13 in LCE, two in GE, five in, MAE, 13 in NE, and 10 in LM. Salinity showed slight decrease in northern estuaries and mostly increased toward the south (Figure 2A and Supplementary Table 1). Decreasing pH trends dominated in the region (particularly in the mid-coast, NE to TSJ), with rates ranging from −0.0002 to −0.0225 yr–1 (Figure 2B and Supplementary Table 1). Long-term increases in pH (ranging from 0.0017 to 0.0063 yr–1) were also observed in one (SNE), one (TSJ), two (NE), and one (LM) stations, respectively (Figures 2B, 4A and Supplementary Table 1). Similarly, decreasing TA dominated in the region (particularly in the mid-coast, NE to LCE), with rates ranging from −1.4 to −30.3 μmol kg–1 yr–1. Long-term increases in TA (ranging from 1.9 to 16.7 μmol kg–1 yr–1) were also observed at one (TSJ), two (NE), and one (LM) stations, respectively (Figures 2C, 4B and Supplementary Table 1).
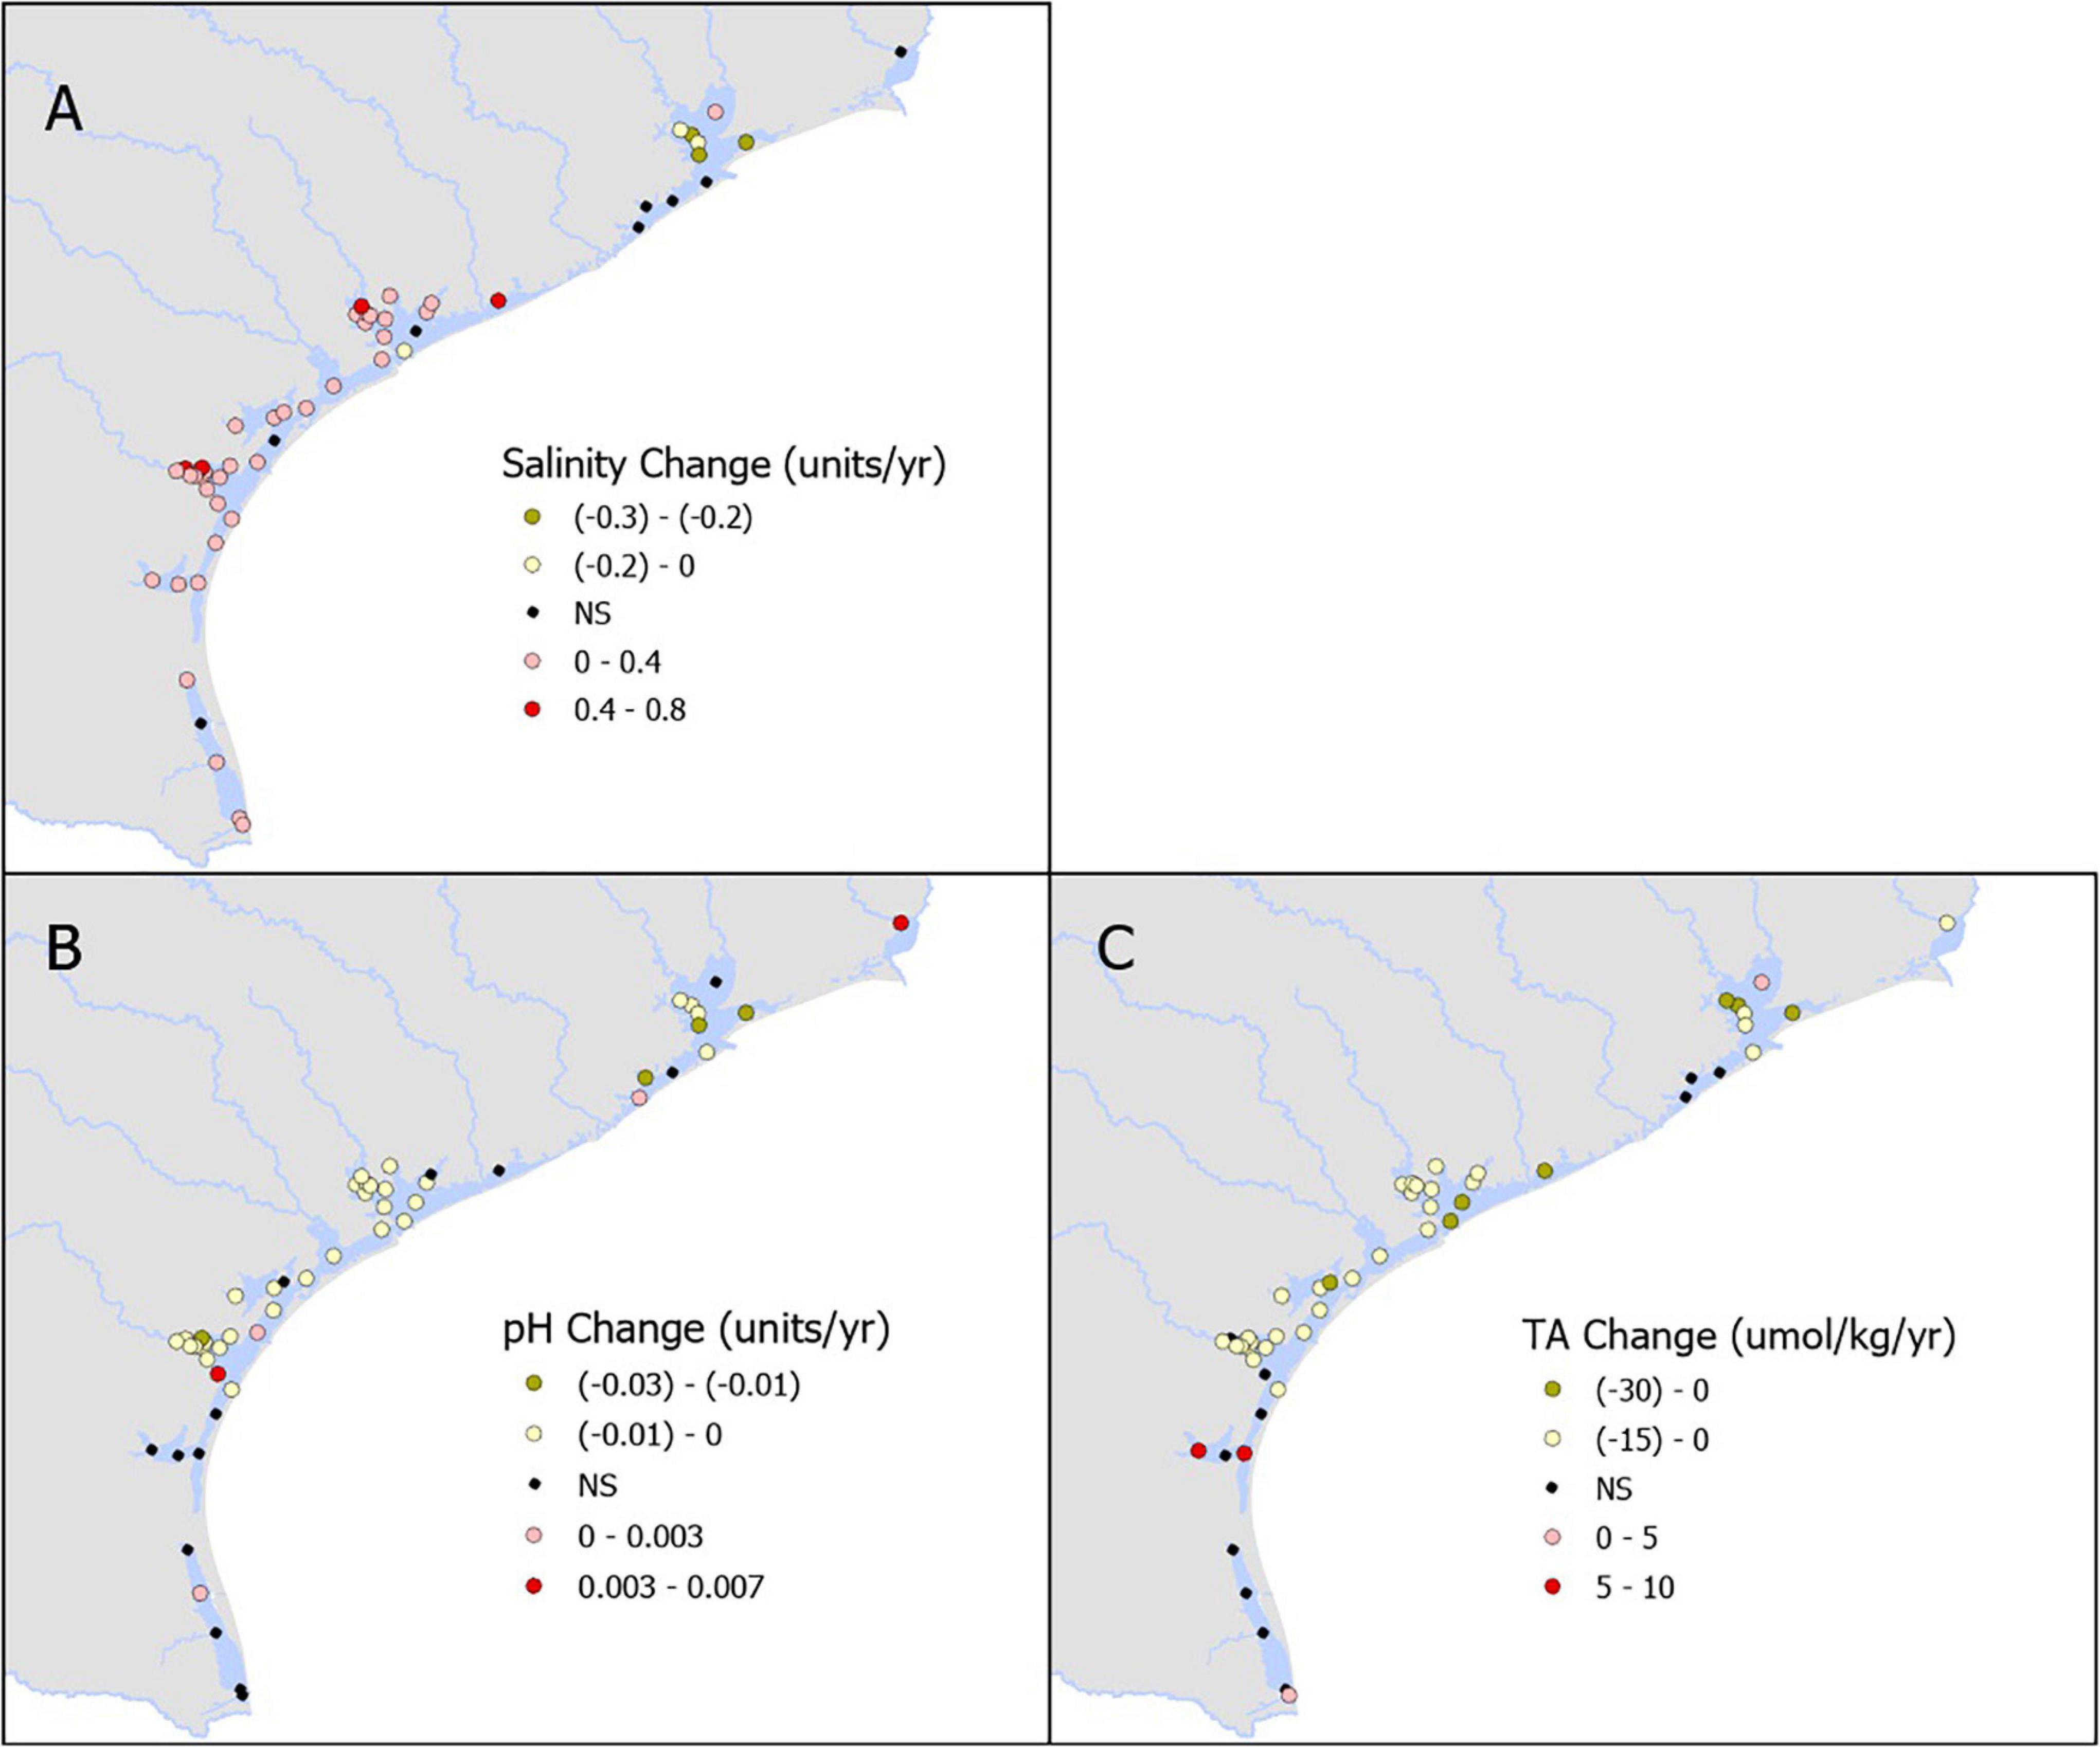
Figure 2. Annual rate of change in the measured parameters- salinity (A), pH (B), and total alkalinity (C).

Figure 3. Annual rate of change in calculated carbonate system parameters—pCO2 (A), dissolved inorganic carbon (B), ΩAr (C), and βDIC (D). Black squares surrounding individual stations in (A–C) indicate locations where long-term trends detected by TS regression were not validated (significant trend of the same sign) by the simulation analyses.
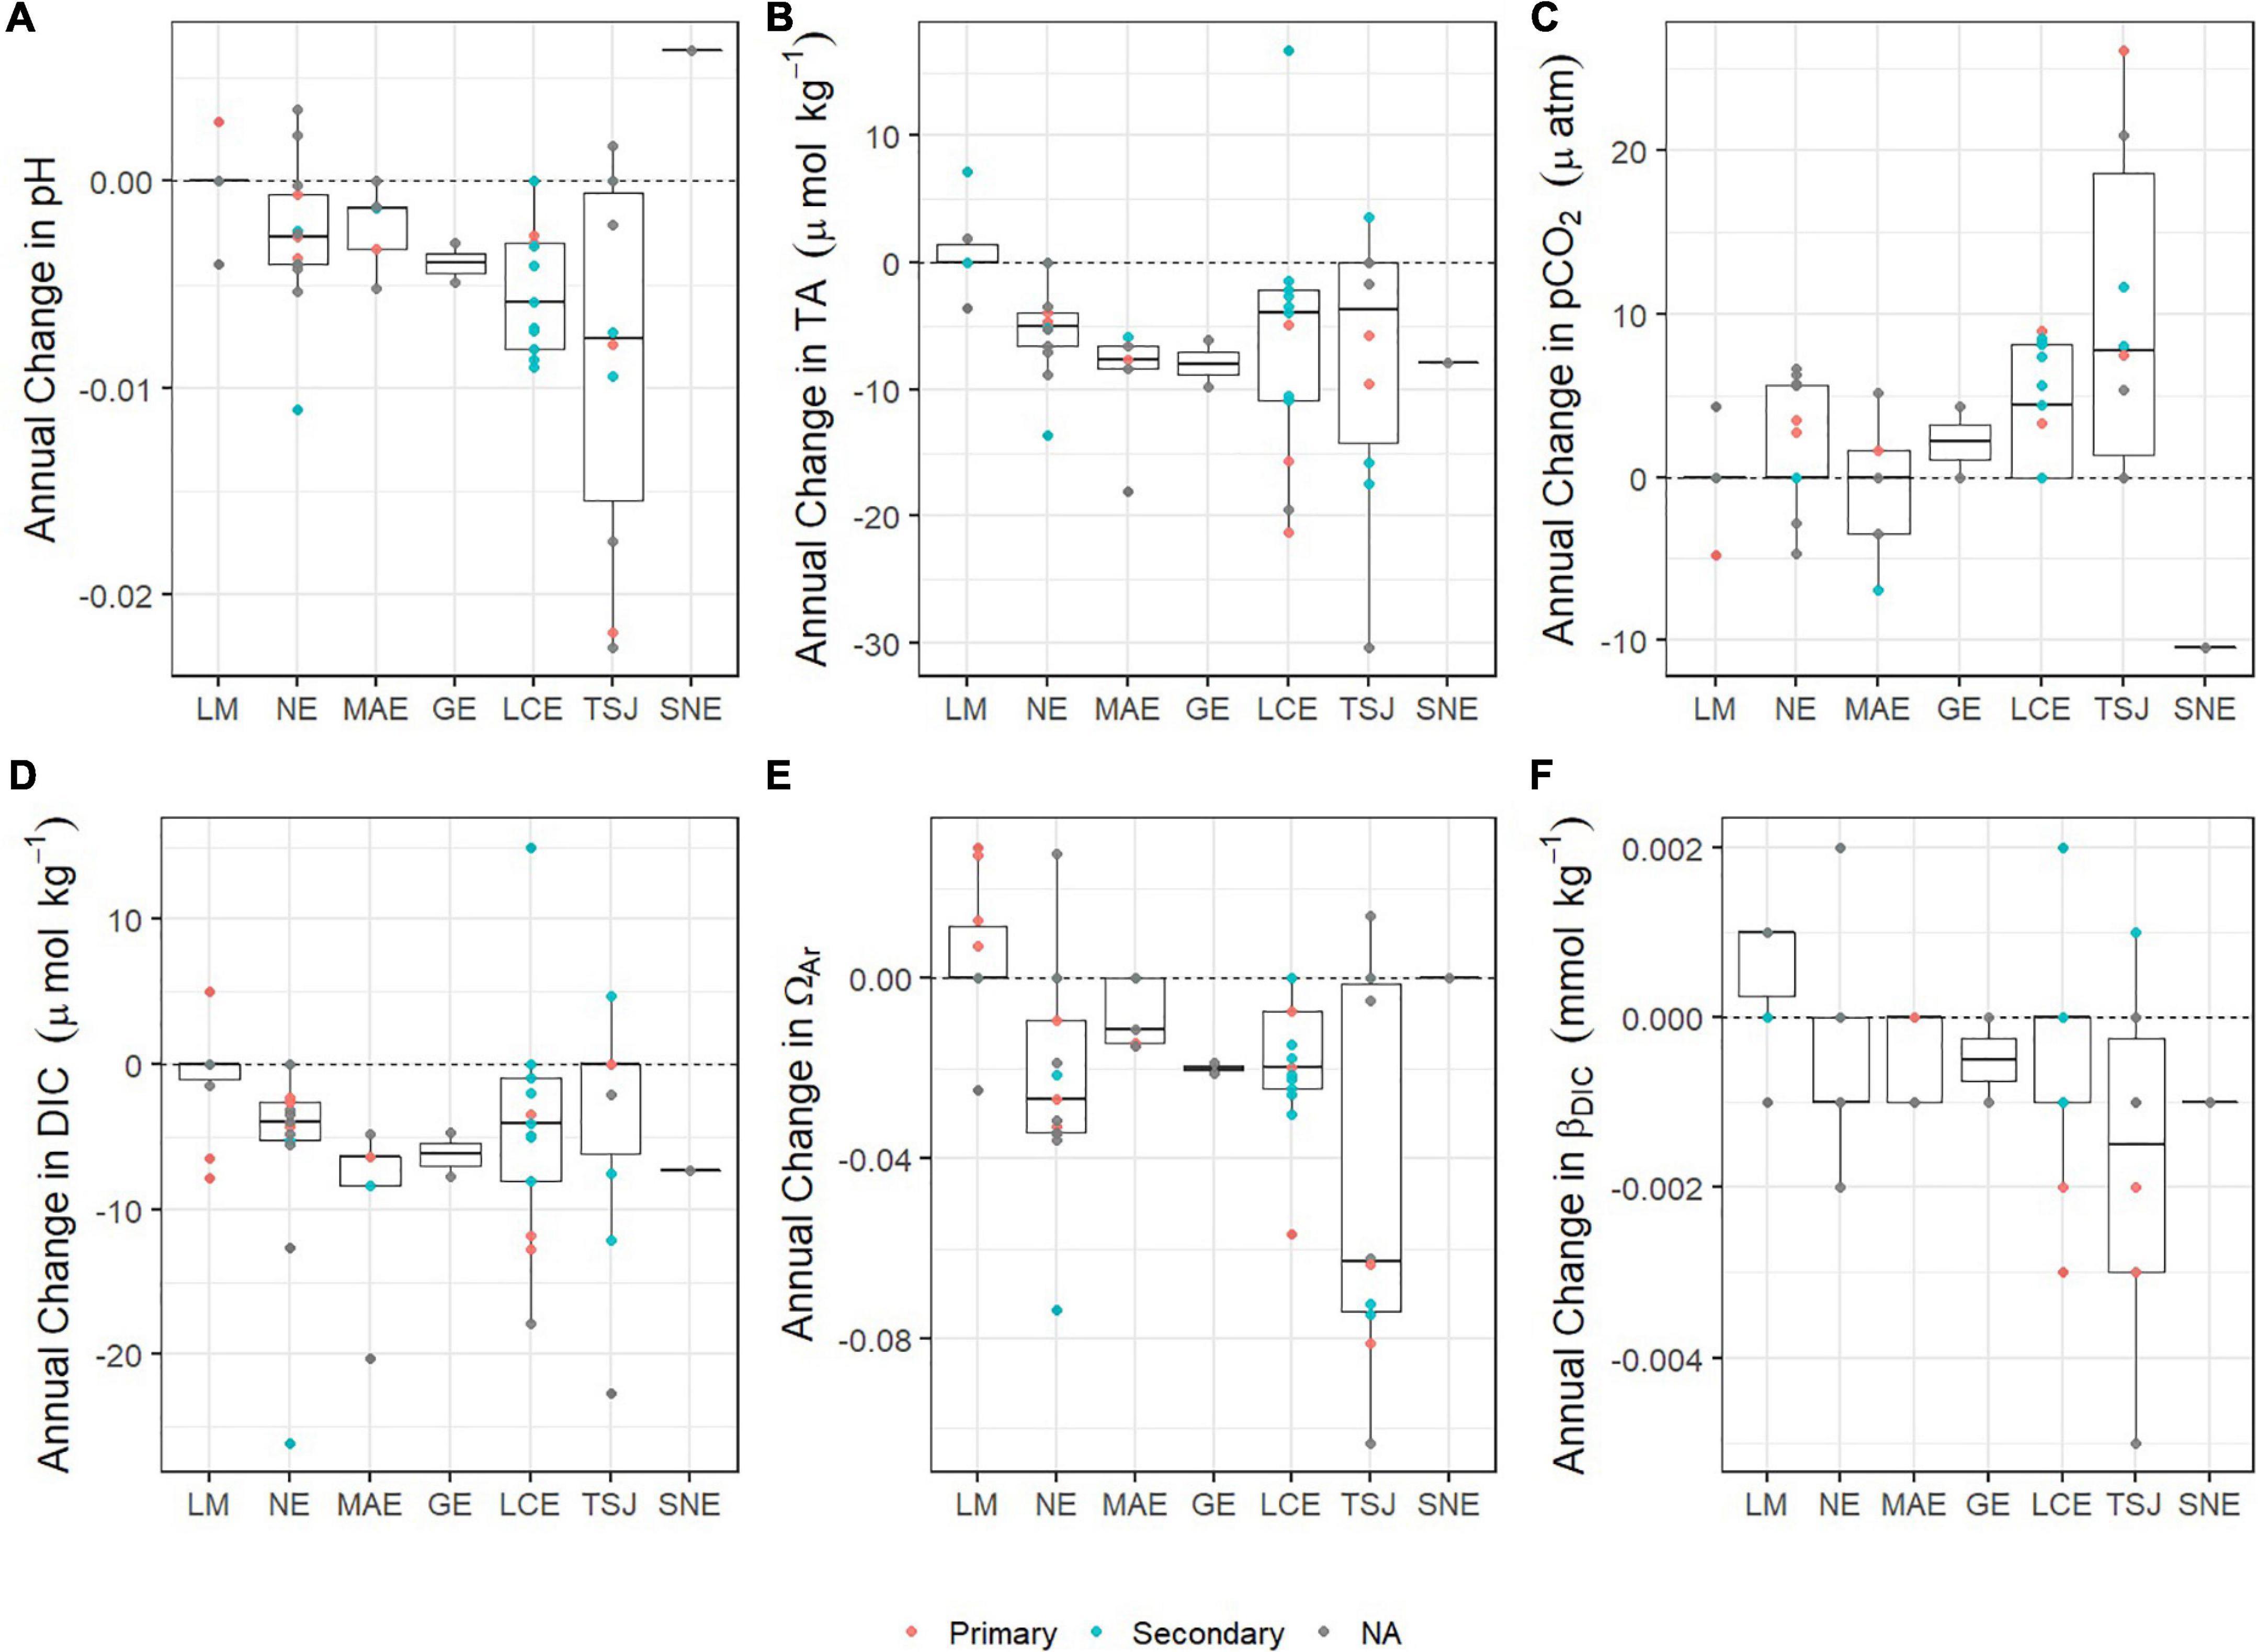
Figure 4. Boxplots of the annual rate of change of carbonate system parameters [(A) pH, (B) TA, (C) pCO2, (D) DIC, (E) ΩAr, and (F) βDIC] at stations within each estuary. Estuaries are listed from south (LM) to north (SNE). Point data showing the rate of change at each station are colored to represent the station classification as within a primary bay (orange), secondary bay (blue). Data with not primary/secondary classification is shown in gray.
Temporal trends in pCO2 were primarily dominated by long-term increases (particularly in NE, LCE, and TSJ), with nearly half of all stations (25 of 54) demonstrating long-term increases in pCO2 at rates ranging from 2 to 26 μatm yr–1; Figures 3A, 4C. Long-term decreases in pCO2 were also observed (ranging from −2 to −10 μatm yr–1; Supplementary Table 1), including one (SNE), two (MAE), two (NE), and one (LM) stations, respectively (Figure 3A). Temporal trends in DIC were primarily dominated by long-term decreases (particularly in the mid-coast, NE to LCE), with two thirds of all stations (36 of 54) demonstrating long-term decreases in DIC at rates ranging from −0.9 to −26.1 μmol kg–1 yr–1. Long-term increases in DIC were also observed (ranging from 4.7 to 15.0 μmol kg–1 yr–1; Figures 3B, 4D and Supplementary Table 1), including one (TSJ), one (LCE), and one (LM) station, respectively.
Temporal trends in ΩAr were primarily dominated by long-term decreases (particularly in the mid-coast, NE to TSJ), with nearly two thirds (33 of 54) of all stations experiencing decreases in ΩAr at rates ranging −0.0050 to −0.1032 yr–1 (Figures 3C, 4E and Supplementary Table 1). Long-term increases in ΩAr were also observed (ranging from 0.0073 to 0.0292 yr–1), with increases particularly prominent in LM. Long-term trends in βDIC were primarily dominated by long-term decreases (particularly in NE, LCE, and TSJ), with more than half (25 of 54) of all stations experiencing decreasing βDIC at rates ranging from −0.0010 to −0.0050 mmol kg–1 yr–1 (Figures 3D, 4F and Supplementary Table 1). Similar to ΩAr, long-term increases in βDIC were prominent in LM; increases were found in seven LM stations as well as one station in each of TSJ, LCE, MAE, and NE, with increases ranging from 0.0010 to 0.0020 mmol kg–1 yr–1.
Spatial Variability in Carbonate System Parameters
Carbonate chemistry in the region varied substantially between estuaries (Figures 5, 6 and Supplementary Tables 1, 2). SNE, the northernmost estuary, had a significantly different mean for every parameter, including the lowest salinity, pH, TA, DIC, ΩAr, and βDIC, and the highest pCO2 (Figure 5 and Supplementary Figure 2). Conversely, LM, the southernmost estuary, had the highest salinity, TA, DIC, ΩAr, and βDIC, though only TA and βDIC were significantly greater than all other estuaries (Figures 5, 6 and Supplementary Figure 2). TSJ also showed relatively unique carbonate chemistry, with relatively low TA, pCO2, and DIC compared to the rest of the region (Figure 5).
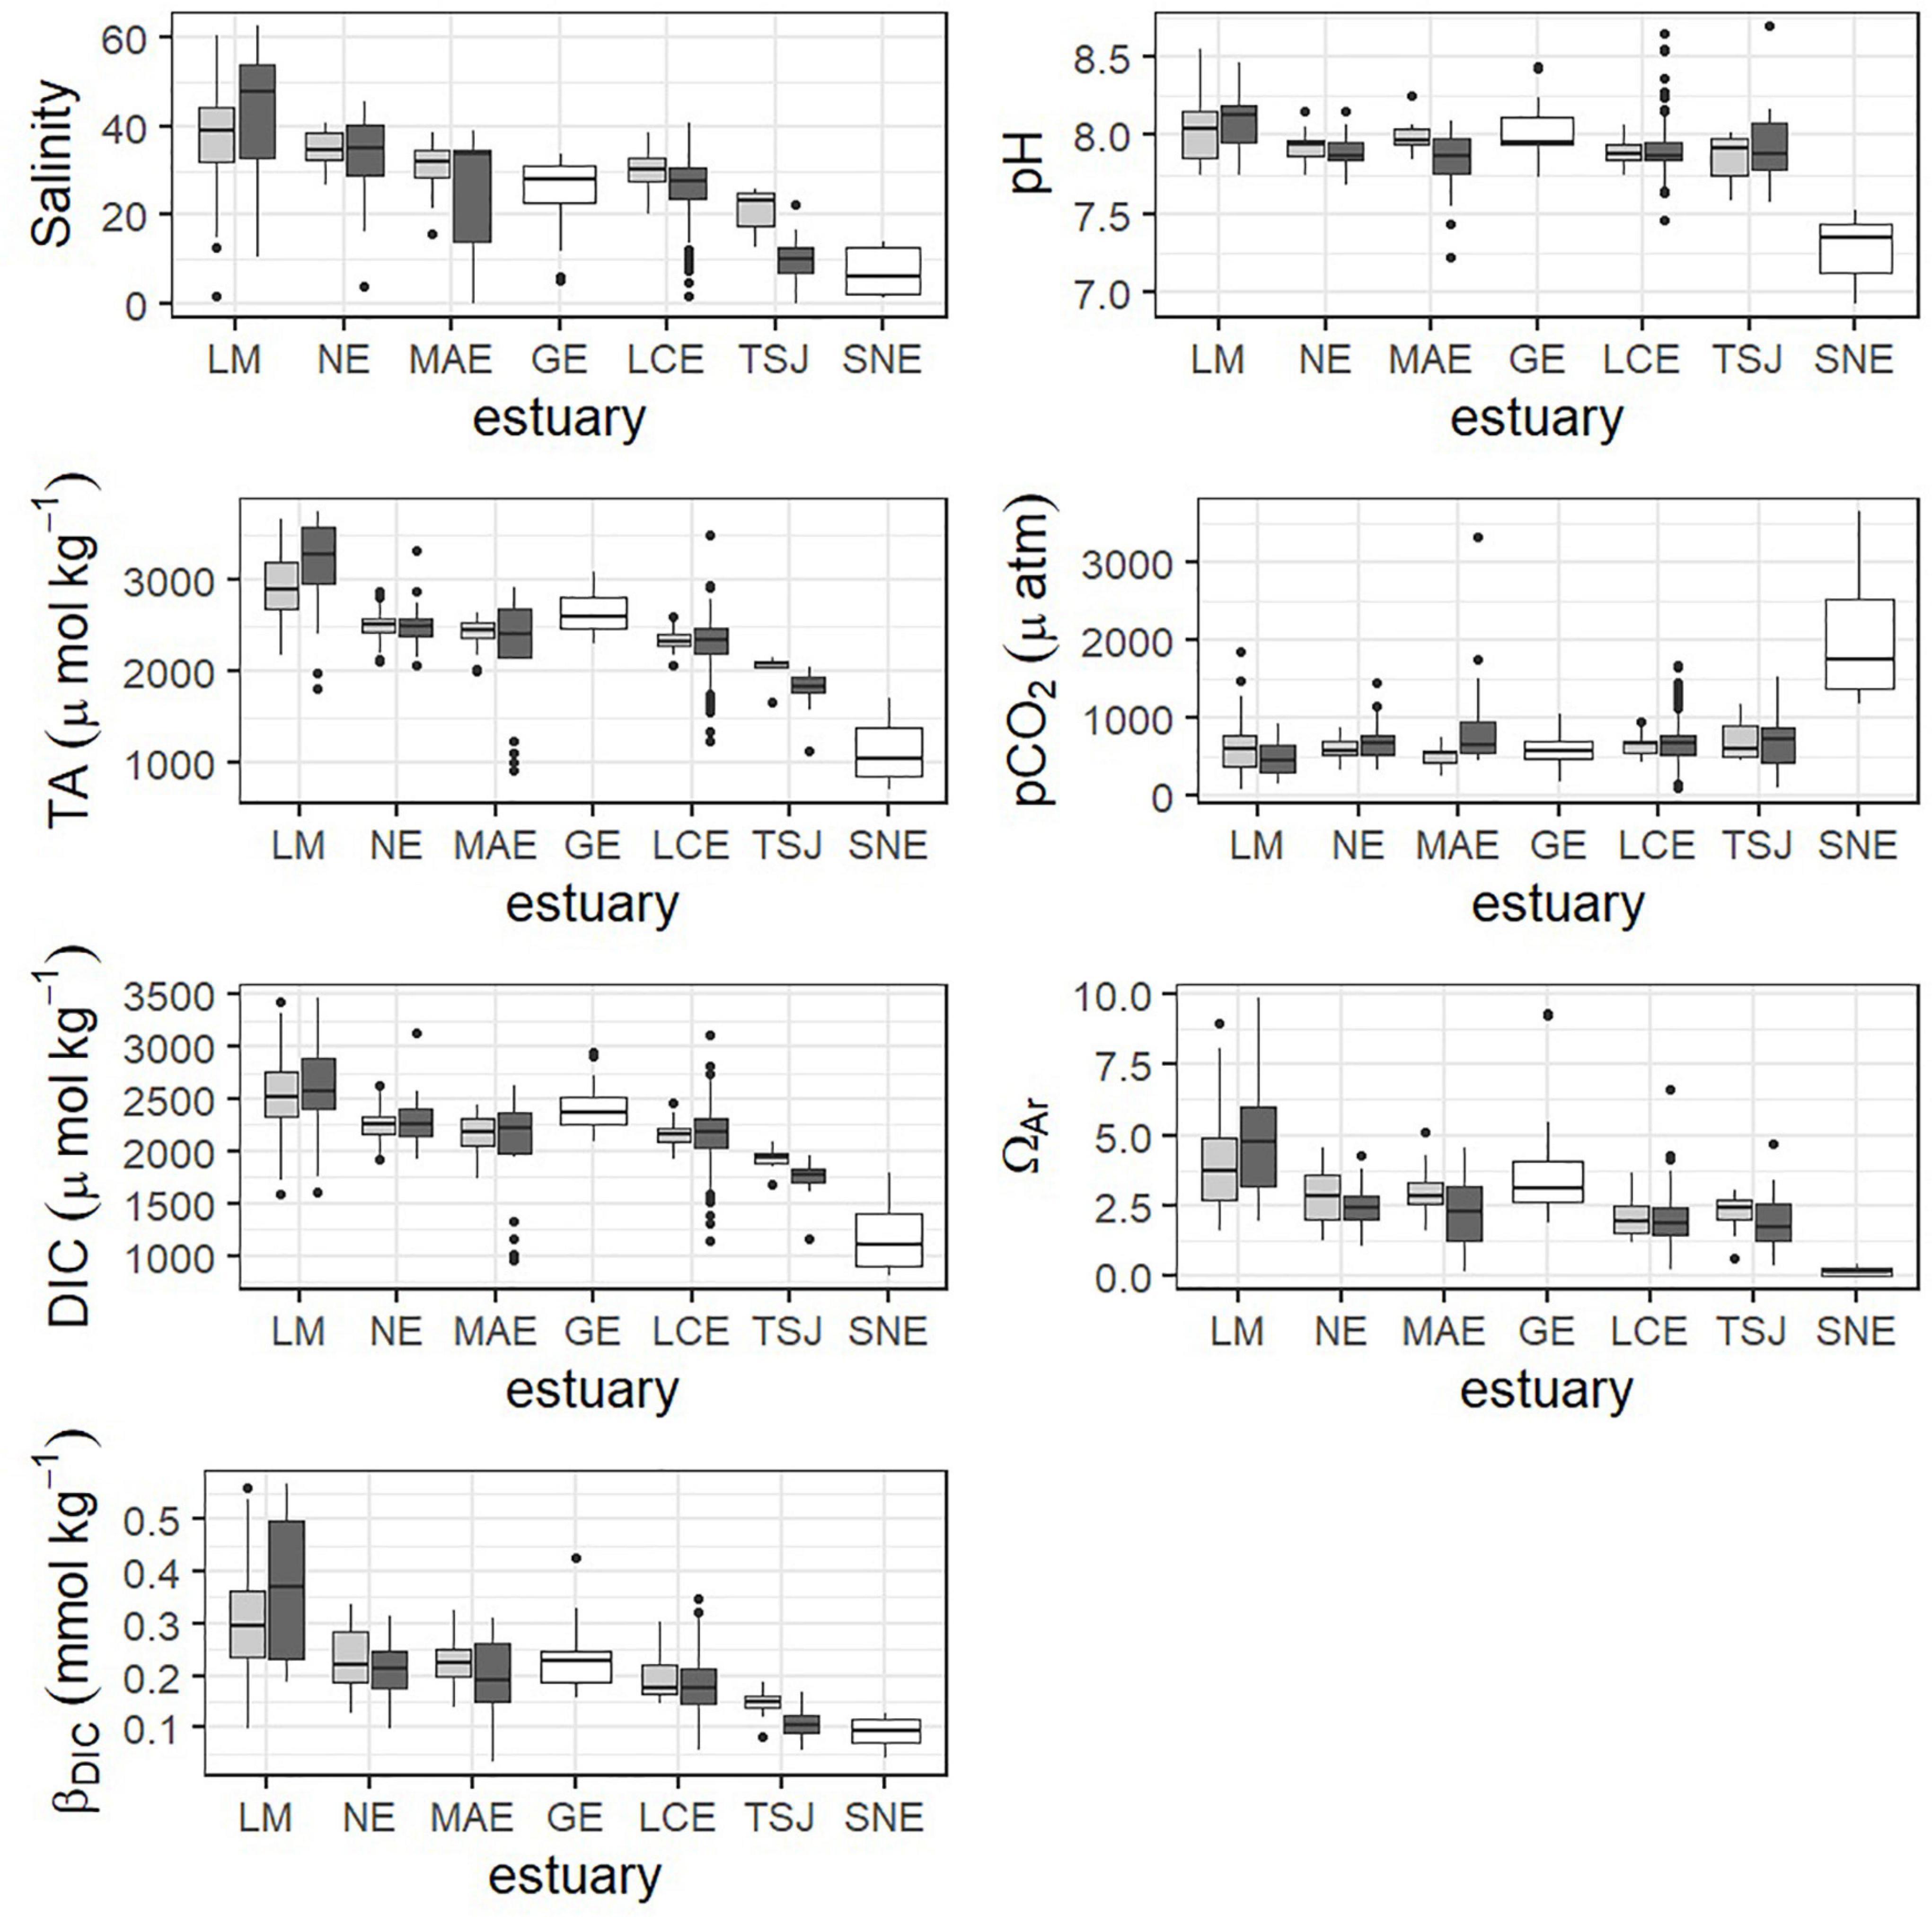
Figure 5. Boxplots showing the distribution of parameters within primary (light gray) and secondary (dark gray) bays within estuaries using the most recent 6 years of data. Estuaries that could not be split into primary and secondary are shown in white.
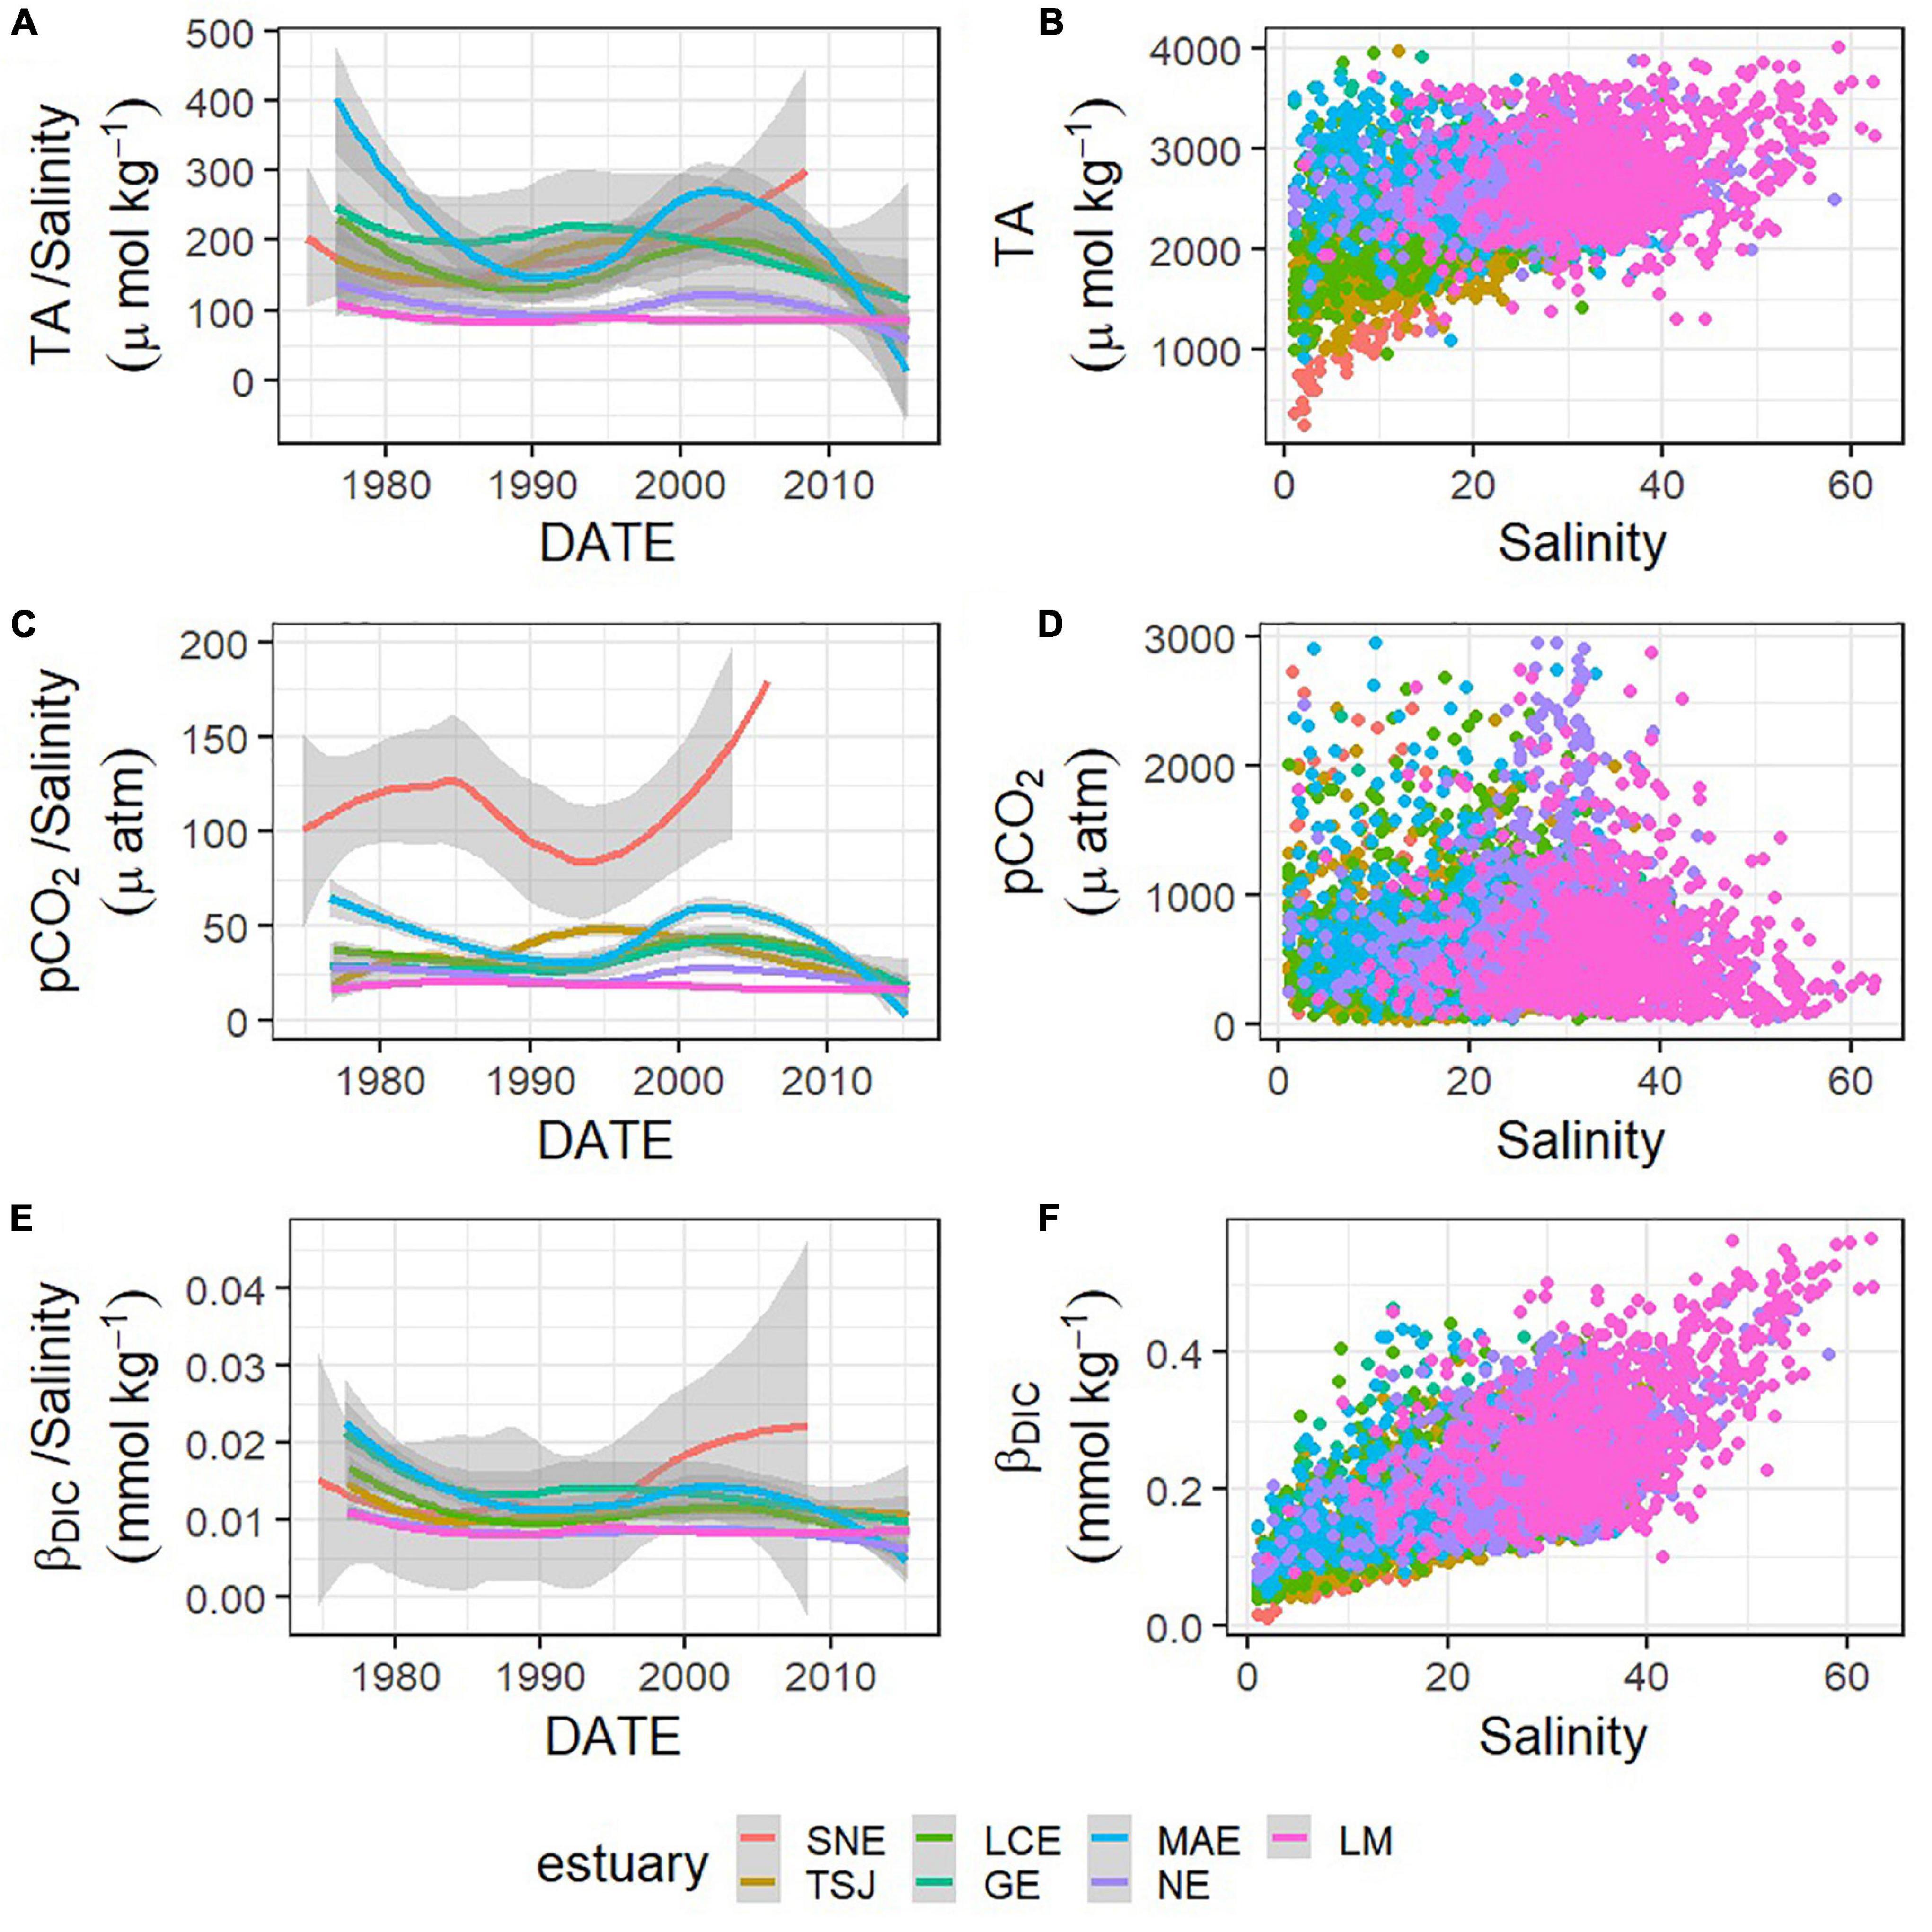
Figure 6. Relationships between carbonate system parameters—TA (A,B), pCO2 (C,D), and βDIC (E,F)—and salinity, and changes in those relationships (change in the ratio between the carbonate system parameter and salinity) represented by loess models over time in each estuary (A,C,E).
Some of the estuaries showed differences in carbonate chemistry parameters between primary and secondary bay stations (Figure 5). LM was generally the exception to the rule for primary/secondary bay differences across all parameters (Figure 5). With the exception of LM, salinity was lower on average in the secondary bays, although this difference was only significant in LCE (p = 0.0017). pH was lower on average in the secondary bays (only significant in MAE, p = 0.0065). pCO2 was higher on average in the secondary bay, although this was only significant in MAE (p = 0.0205) and NE (p = 0.0146). ΩAr and βDIC were lower on average in secondary bays, though ΩAr was only significantly different in MAE (p = 0.0183) and βDIC in MAE (p = 0.0478) and TSJ (p = 0.0168). DIC and TA did not vary greatly between primary and secondary bays, although differences were seen in TSJ.
Discussion
Propagated Error in Calculated Carbonate System Parameters and Validation of Long-Term Trends
While TCEQ SWQM data are not of the same precision that would be expected in an analytical lab that is specialized in carbonate chemistry studies, the protocols have remained the same over time. Therefore, these data should be adequate for time series analysis, and a number of other studies in the literature have also made this assumption while using government-funded long-term water quality monitoring data (Raymond and Cole, 2003; Raymond et al., 2008; Waldbusser et al., 2011; Stets et al., 2014, 2017; Hu et al., 2015; Barrera and Robbins, 2017; Carstensen et al., 2018; Robbins and Lisle, 2018; Van Dam and Wang, 2019) or even citizen science data (Snyder et al., 2019) for interpreting carbonate chemistry trends.
Propagated error associated with calculated pCO2, DIC, and ΩAr would be expected to be relatively high given the coarse analytical precision of the TCEQ data used in this analysis. Assuming analytical precision of pH as ± 0.1, TA as ± 115 μmol kg–1 (±5% of mean TA, 2,300 μmol kg–1), salinity as ± 0.1, and temperature as ± 0.1°C, the mean propagated error associated with calculated pCO2 values was 184.9 ± 159.1 μatm, the mean propagated error associated with DIC values was 118.7 ± 5.4 μmol kg–1, and the mean propagated error associated with ΩAr was 0.497 ± 0.264.
The simulation method used for validation of long-term trends confirmed the presence and signs of long-term trends in pCO2, DIC, and ΩAr that were found from TS regression with only a few exceptions. The simulations were able to validate the existence and sign of 23 (of 25) of the increasing pCO2 trends and four (of six) of the decreasing trends. The mean difference between significant slopes calculated by the single TS regression vs. the simulation was −0.2 ± 1.0 μatm yr–1 (or 3.1 ± 19.3% of the TS slope estimates). The simulations were able to validate the existence and sign of 32 (of 36) of the increasing DIC trends and all three of the decreasing trends. The mean difference between significant slopes calculated by the single TS regression vs. the simulation was −0.3 ± 1.1 μmol kg–1 yr–1 (or 4.8 ± 15.1% of the TS slope estimates). The simulations were able to validate the existence and sign of 29 (of 33) of the increasing trends in ΩAr and three (of six) of the decreasing trends in ΩAr. There was also one station in TSJ (13315) that did not have a significant trend based on the TS method but did have a significant, positive trend based on the simulation. The mean difference between significant slopes calculated by the single TS regression vs. the simulation was −0.0005 ± 0.0051 yr–1 (or 5.8 ± 21.7% of the TS slope estimates).
While there are some discrepancies between the two methods (single TS regression estimates and 95% confidence intervals of TS regressions of simulated data with incorporated propagated error), the overall picture of the presence and directions of long-term trends in carbonate system parameters within each of the estuaries remains unaltered (Figure 3 and Supplementary Figure 2). This is the first time to our knowledge that the use of calculated carbonate system parameters in the estimation of long-term trends has been validated based on their associated propagated error. It is a promising finding for the utility of government-funded and citizen science-sponsored data, and it provides support for the continued sponsorship of such programs for understanding changes in coastal carbonate chemistry.
It is worth noting that DIC and pH are among the better combinations of parameters for carbonate system calculations (Hunt et al., 2011; Patsavas et al., 2015). Since the TCEQ data did not include measures of DIC, TA and pH were used for speciation calculations; this simple use of TA has been shown to lead to overestimation of pCO2 (Hunt et al., 2011) since organic alkalinity is not accounted for. Organic alkalinity has been assumed to be negligible in other studies when only TA and pH were available for speciation calculations (Prasad et al., 2013; Carstensen et al., 2018). Present day organic alkalinity in the region (MAE and NE, calculated by the difference in measured TA and TA calculated with DIC and pH) usually does not exceed 50 μmol kg–1, or less than 2% of TA (Yao and Hu, 2017; McCutcheon et al., 2019). It is assumed that there are not long-term trends in organic alkalinity. However, analysis based on the agency collected data suggest that total organic carbon concentrations in many nwGOM estuaries likely exhibit long-term decline (Montagna and Palmer, 2012; CTBS, 2017). It is reasonable to assume that organic alkalinity level would show a positive correlation with total organic carbon, hence the pCO2 trends calculated based on the assumption of no organic alkalinity trend would represent the lower estimates of “true” values.
Spatial Heterogeneity in Carbonate System Parameters and Long-Term Trends
Around the world, several estuaries have now been shown to have long-term trends in pH and TA (Table 1). with a meta-analysis revealing equal likelihood of increasing or decreasing pH trends (Carstensen and Duarte, 2019). Baumann and Smith (2018) investigated pH trends across 16 U.S. Nation Estuary Research Reserve System sites. While interannual pH change rates are not provided, they reported that seven of the 16 sites have decreasing pH, four have increasing pH, and the magnitude of change is ∼10 times that of the open ocean (∼−0.0017 yr–1, González-Dávila et al., 2007; Byrne et al., 2010). The magnitude of annual change in pH and TA that we have reported is mostly in line with trends that have been reported in other estuaries (Table 1). Only one other study that we are aware of has reported long-term trends in calculated carbonate system parameters; in Danish Fjords, Carstensen et al. (2018) reported mostly long-term increases in pCO2 and DIC (Table 1). While such increasing DIC would generally be expected in oceanic environments with increasing pCO2 (both resulting from CO2 uptake), the widespread decreasing trends that were found here likely directly result from the long-term decreases in TA in the nwGOM region. Carstensen et al. (2018) did not report values of annual change in Ω (although they did note increasing Ω and decreasing Ω surrounding a regime shift in one estuary). The large spatial variation in carbonate chemistry within estuaries is often due to control exerted by NEM. Heterogeneity in NEM becomes apparent at distances of less than 2 km in the nwGOM estuaries (Russell and Montagna, 2007). More freshwater-influenced regions of estuaries are generally more net heterotrophic than the rest of the estuary due to allochthonous carbon input (Caffrey, 2004) and river water itself is generally supersaturated with CO2 (Butman and Raymond, 2011; Joesoef et al., 2015); thus, the elevated pCO2 and depressed pH, ΩAr, and βDIC found in the secondary bays relative to the primary bays (Figure 5) are spatial relationships that could be noted along the freshwater gradient within many estuaries.
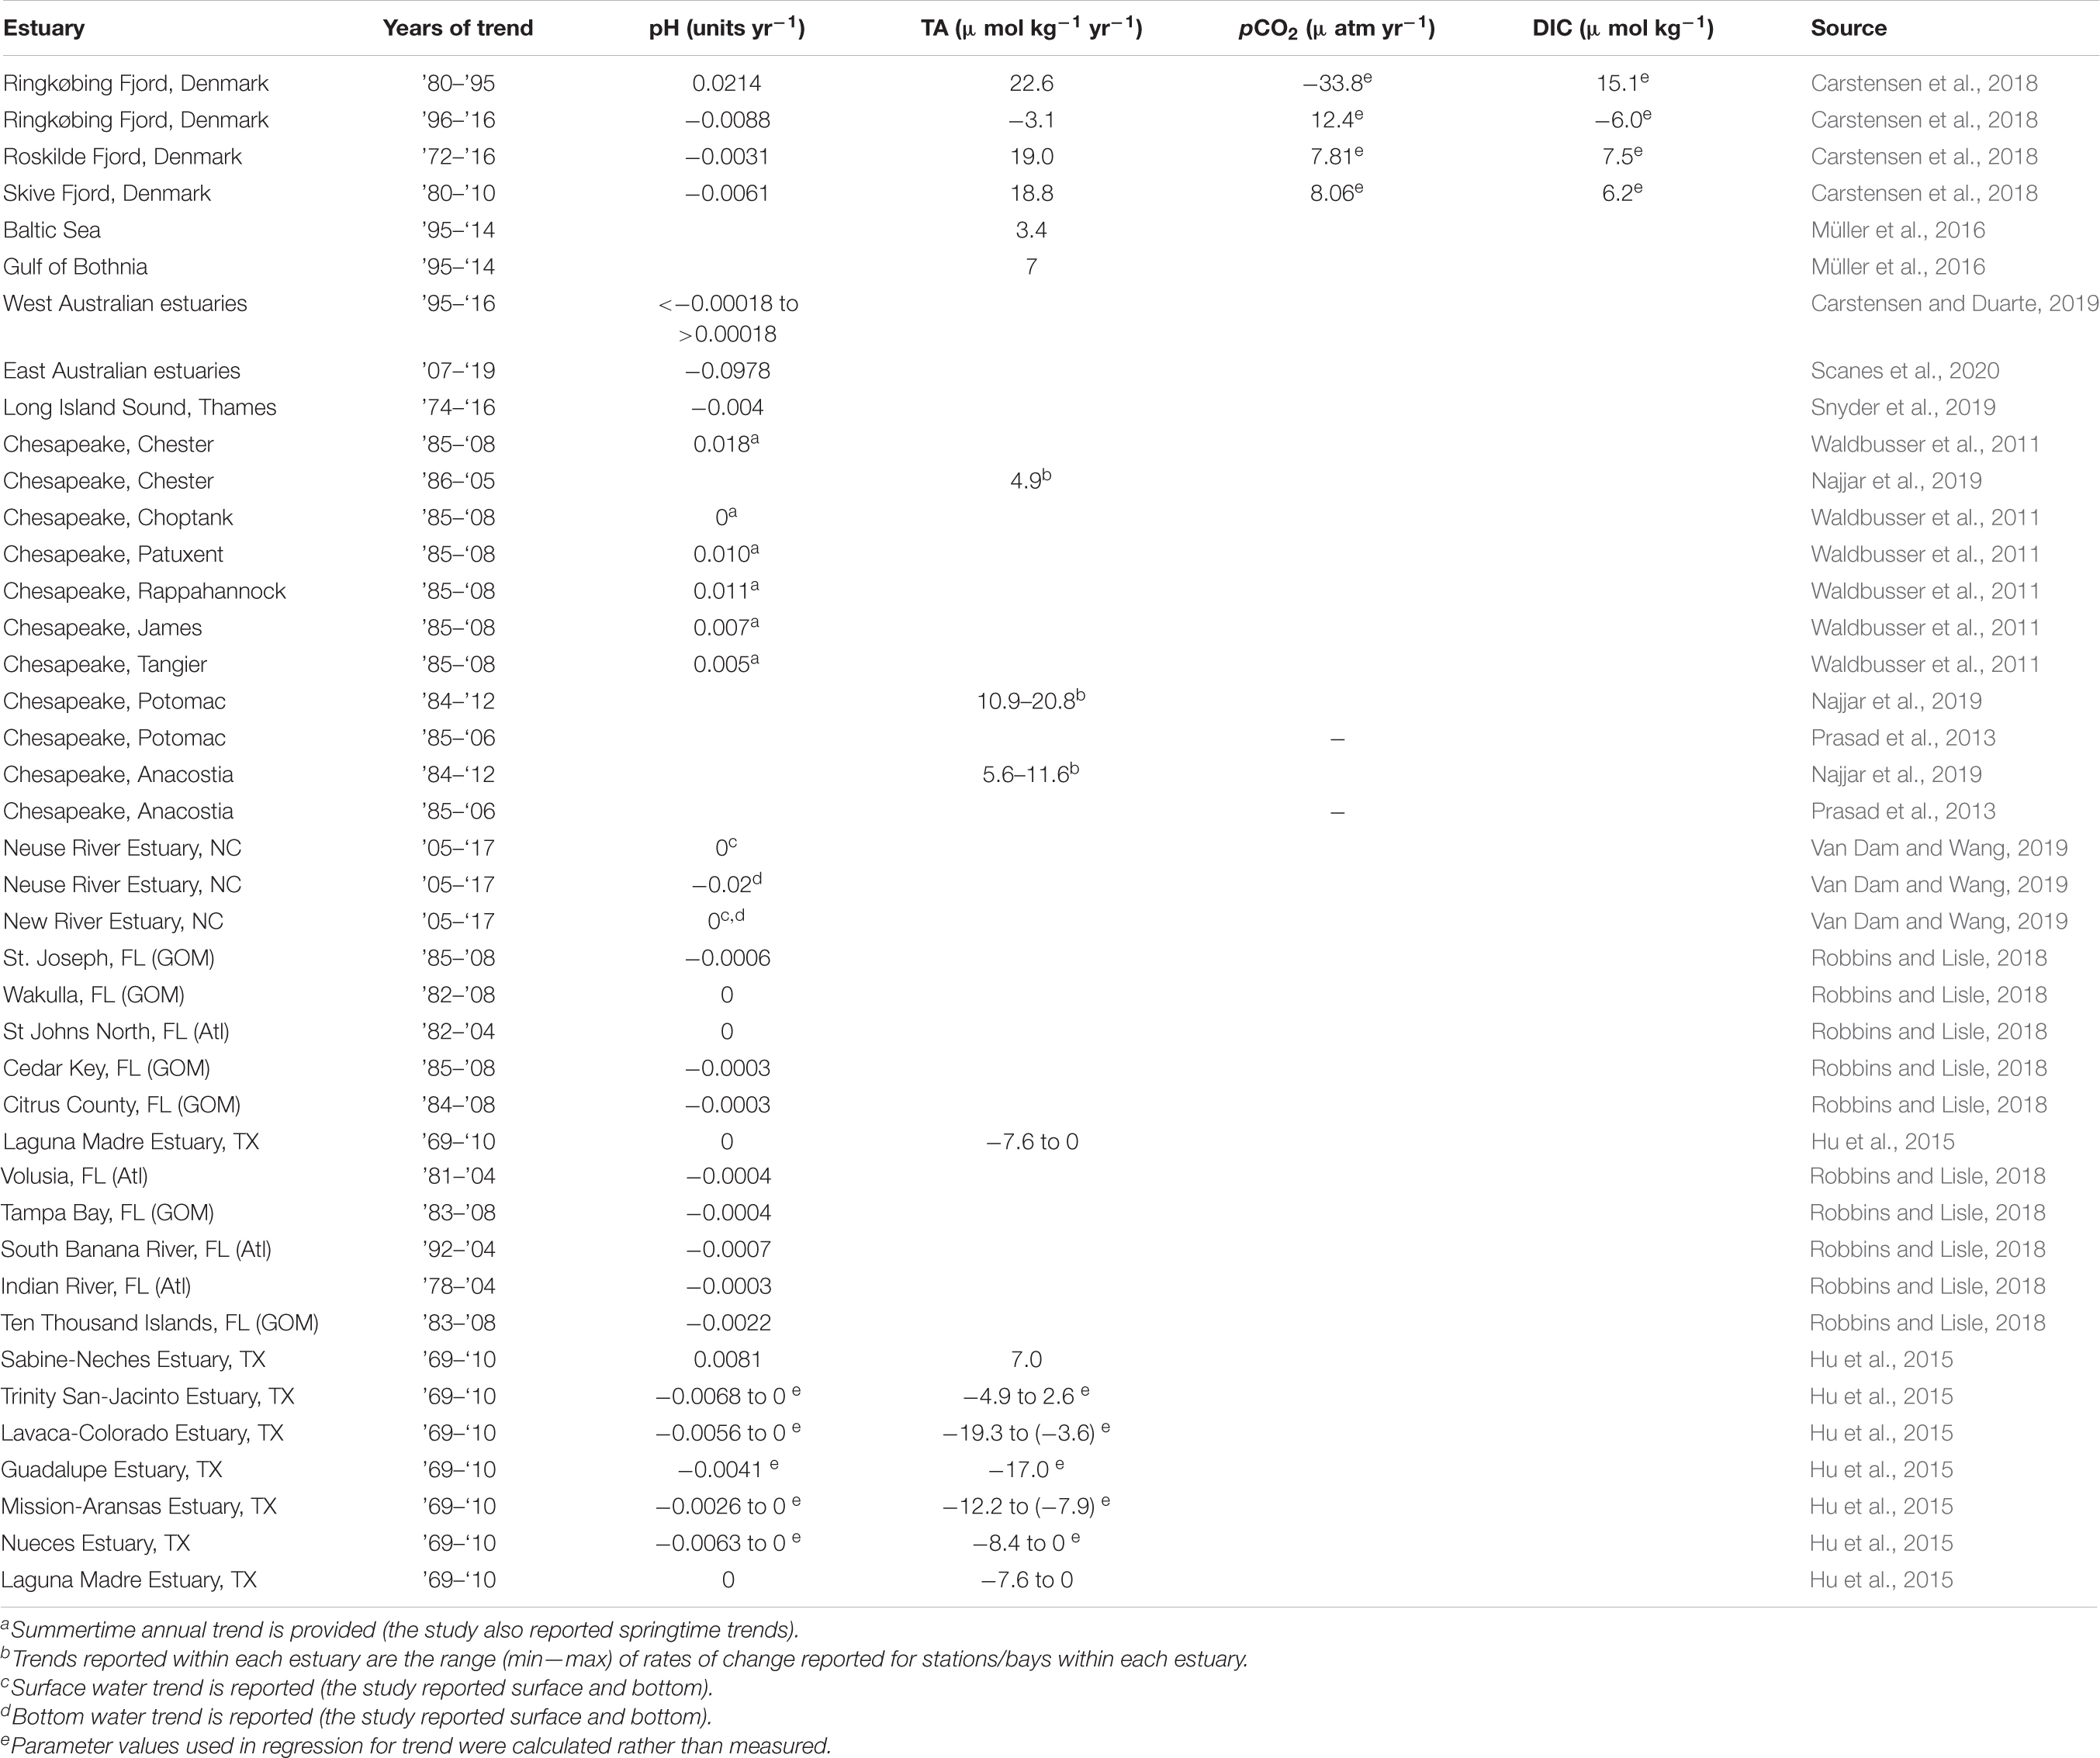
Table 1. Long-term trends in carbonate chemistry parameters that have been previously reported in estuaries around the world.
Like many other coastal areas (e.g., Scanes et al., 2020; Da et al., 2021), the nwGOM estuaries have experienced gradual but significant warming over the past decades, with the overall warming rate of 0.0428°C yr–1 (Montagna et al., 2011b). This change alone would lead to 1–2 μatm yr–1 increase in pCO2 and ∼0.0004–0.0006 yr–1 decrease in pH, based on the average water chemistry parameters and an average temperature of 25°C in Supplementary Table 2. It appears that warming alone would explain a small fraction of the observed trends, as carbonate equilibrium would shift toward higher pCO2 and lower pH (Table 1). However, warming can also lead to enhanced aquatic respiration (e.g., Hopkinson and Smith, 2005; Ni et al., 2019), which can further increase pCO2 and tilt the NEM balance toward heterotrophy. There is evidence of this shift in NEM in a portion of NE (Corpus Christi Bay, based on a 1982–2002 dataset), where the decrease in surface dissolved oxygen (DO) concentration exceeds that which can be explained by thermally induced oxygen solubility decrease (Applebaum et al., 2005). Similarly, Galveston Bay also exhibits declining DO in its subbays (Gonzalez, 2011) as this highly urbanized estuary undergoes eutrophication (Bugica et al., 2020).
For the few sites that showed decreasing pCO2 over time, the SNE, NE, and LM sites all had increases in pH and decreasing TA (or DIC for the LM site), while the two MAE sites with decreasing pCO2 trends both had decreasing TA and either decreasing or no trend in pH (Supplementary Table 1). A change in hydrological conditions might explain these trends, as reduction of alkaline freshwater leads to TA decrease and presumably freshwater has higher pCO2 than the ocean water (Hu et al., 2015). Meanwhile, reduced freshwater input could hamper the delivery of organic matter, hence the pCO2 trends at these stations indeed reflected the lower estimates because of the assumption of non-variant organic alkalinity in the speciation calculations. Our ongoing study at MAE may shed light on this issue in the future with better quality carbonate chemistry characterization.
Implications of Long-Term Trends
Trends in pCO2 have implications for air-water CO2 flux (Landschützer et al., 2013). Given that air-water CO2 flux is a function of the gradient between atmospheric and surface water pCO2, long-term trends in pCO2 of surface water that differ from long-term trends of atmospheric CO2 indicate changes in the water’s magnitude of a carbon sink (absorbs atmospheric CO2) or carbon source (outgasses CO2 to the atmosphere) (Landschützer et al., 2013). For comparison to pCO2 trends in estuaries, the average annual change in atmospheric pCO2 between 1974 and 2015 was 1.72 μatm yr––1.1 Given that the majority of the stations throughout the nwGOM estuaries have experienced increasing pCO2 exceeding the atmospheric rate (Figures 6C,D, and Supplementary Table 1), and given that estuaries tended to have pCO2 higher than that of the atmosphere (Supplementary Table 1), we can safely conclude that the nwGOM estuaries have increased in their level of CO2 outgassing over the observed decades.
Rates of increase in pCO2 were generally higher across all nwGOM estuaries than surface ocean pCO2 trends (1.88 μatm yr–1; Doney, 2010). This elevated pCO2 increase relative to the global ocean has also been observed across the entire nwGOM coastal ocean (3.20 μatm yr–1; Kealoha et al., 2020). Individual estuarine stations that had increasing pCO2 in this study nearly always exceeded the rate found for the nwGOM coastal ocean, which would indicate that advection of estuarine waters into the coastal GOM may increase coastal pCO2 trends. However, given the lack of significant long-term trends across all estuarine stations, it is possible that better estuarine sampling coverage would reveal a spatially weighted mean similar to or less than the adjacent coastal ocean.
CO2 flux estimates from recent years in the nwGOM estuaries have been shown to vary between estuaries, with MAE and NE acting as mild CO2 sources (6.9 ± 6.5 and 2.7 ± 8.1°C m–2 d–1, respectively) and GE and LCE acting as moderate CO2 sources (35.9 ± 24.2 and 25.6 ± 28.8°C m–2 d–1, respectively) on an annual basis (Yao et al., 2020). Wet/dry cycles play a substantial role in the interannual variability of CO2 fluxes in the region (Yao et al., 2020). As pCO2 trends have varied between increasing and decreasing in NE and MAE, the flux in there may not have changed drastically over the past decades. However, pCO2 is clearly increasing in LCE, indicating that it likely had lower CO2 fluxes decades ago. Yao et al. (2020) did not consider the two northernmost (SNE and TSJ) nor the southernmost (LM) estuaries. Due to SNE and LM experiencing the extremes of substantial precipitation and evaporation gradients, their carbonate system characteristics differed greatly from the other estuaries in the nwGOM (Figure 5), as did the long-term trends that they have experienced (Figure 4 and Supplementary Table 1). It is important to understand long-term trends such as these when fluxes are applied to regional or global carbon budgets.
Trends in ΩAr have implications for biological calcification as well as calcium carbonate preservation and burial (Fabry et al., 2008; Waldbusser et al., 2015). The nwGOM estuaries is inhabited by Eastern Oysters, ecologically and economically important species that require suitable carbonate chemistry to build and maintain their shells (Buzan et al., 2009; Pollack et al., 2011; Beseres Pollack et al., 2013). With the exception of SNE, nwGOM estuaries have generally remained supersaturated with respect to aragonite (Supplementary Table 2), but even slight decreases in ΩAr while still maintaining supersaturation have been shown to negatively affect calcifying organisms (Gattuso, 1998). Trends in ΩAr in the nwGOM estuaries were generally decreasing, except for LM (Figure 4). Given that ΩAr still remains well above saturation (except for SNE), carbonate chemistry is likely a secondary stressor to changes in salinity in the region. Oyster populations have always been more abundant in the lower-salinity estuaries of the Texas coast (Montagna et al., 2007), but salinity has been increasing along much of the Texas coast over past decades (Bugica et al., 2020), potentially threatening oysters with increased predation, increased disease, decreased settlement, and salinity tolerance that is further compromised by increasing water temperature (VanderKooy, 2012). Despite the more pressing threat, this declining trend in ΩAr may have already reduced biological calcification rates over past decades, and if the trend continues it may threaten the shell budget and subsequently threaten sustained oyster populations into the future (Powell and Klinck, 2007. It is also worth noting that the estuary that has experienced the greatest rate of decrease in ΩAr (TSJ, Figure 4E) is also the estuary with the heaviest reliance on commercial oyster harvests.
Trends in buffer factors have implications for fluctuations in other carbonate system parameters, and βDIC is particularly indicative of changes in pH. As noted by Hu et al. (2015), those stations with decreasing pH had a much higher rate of decrease than that in the open ocean, which is around 0.0017 yr–1 (González-Dávila et al., 2007; Byrne et al., 2010; Supplementary Table 1). The long-term decreases that have been observed in βDIC in the nwGOM estuaries over the past several decades indicate that the pH response of these systems has become increasingly sensitive to DIC additions. Therefore, short-term processes like the stratification and development of hypoxia that can occur in the region (Applebaum et al., 2005; McCutcheon et al., 2019) or long-term processes like decreasing freshwater inflow or increasing atmospheric CO2 all have the potential to cause greater fluctuations and disruption to the pH now than the same processes would have decades ago. This long-term decrease in buffer capacity and increase in potential for change has been described in ocean environments previously (Shaw et al., 2013), but it has never explicitly been noted in estuarine environments. Despite this decrease in βDIC, βDIC is generally high in nwGOM estuaries, often exceeding the values in nwGOM open water, ∼0.26–0.29 mmol kg–1 (Figures 6E,F) when buffer capacity is generally lower in estuarine waters.
Conclusion
This study used the TCEQ SWQM’s data record to examine long-term trends and spatial relationships in the carbonate system in the estuaries of the nwGOM. This dataset provides much more spatially and temporally extensive data than any current datasets collected by academic laboratories, and unlike many other regional monitoring programs, TCEQ has routinely monitored both pH and TA, making this one of the longest running estuarine datasets in the world that allows the calculation of the complete carbonate system. Carbonate system parameters—pCO2, DIC, ΩAr, and βDIC—were calculated for each observation at the 54 stations where monitoring occurred for 20 + years. The mean carbonate system parameters varied between estuaries, with salinity, pH, TA, DIC, ΩAr, and βDIC generally increasing from north to south. Smaller differences in means could also be observed within estuaries between primary and secondary bays.
Long-term trends in calculated parameters were investigated at each station using Theil-Sen regression. The northernmost and southernmost estuaries in the region often varied greatly from the other estuaries in their long-term trends. The central five estuaries (except for select stations near direct river input) have generally experienced long-term increases in pCO2 and decreases in DIC, ΩAr, and βDIC over past decades, and the magnitude of change generally increased from north to south. At all stations with increasing pCO2, the rate of increase was greater than in the atmosphere, indicating that the estuaries have become an increasing source of CO2 to the atmosphere. These increasing trends may be partially attributed to warming that have altered estuarine NEM, and a few stations with decreasing trend may be caused by reduction in the alkaline river water input. The decrease in ΩAr, while not yet nearing undersaturation, already has the potential to negatively affect calcifying organisms. The decreasing βDIC indicates that the estuaries have been experiencing greater decrease in pH relative to a given addition of DIC over time. Given that propagated error associated with calculated carbonate system parameters can be relatively large, propagated error was calculated and incorporated into simulations to validate the long-term trends. Simulation analyses generally found the same sign and magnitude of long-term trends, with only a few stations as exceptions.
Data Availability Statement
Publicly available datasets were analyzed in this study. This data can be found here: https://www80.tceq.texas.gov/SwqmisPublic/index.htm.
Author Contributions
MM was responsible for the formal analysis, investigation, and the writing of the original draft. XH was responsible for conceptualization, validation, review and editing of writing, and funding acquisition. Both authors contributed to the article and approved the submitted version.
Funding
This study was supported by the National Science Foundation (OCE#1654232).
Conflict of Interest
The authors declare that the research was conducted in the absence of any commercial or financial relationships that could be construed as a potential conflict of interest.
Publisher’s Note
All claims expressed in this article are solely those of the authors and do not necessarily represent those of their affiliated organizations, or those of the publisher, the editors and the reviewers. Any product that may be evaluated in this article, or claim that may be made by its manufacturer, is not guaranteed or endorsed by the publisher.
Acknowledgments
We are grateful to the Texas Commission on Environmental Quality for maintaining the large-scale effort of their Surface Water Quality Monitoring program for several decades and making those data publicly available. We thank to Jason Selwyn for consultation on the long-term trend simulation analysis and to Blair Sterba-Boatwright for consultation on the outlier removal technique.
Supplementary Material
The Supplementary Material for this article can be found online at: https://www.frontiersin.org/articles/10.3389/fmars.2022.793065/full#supplementary-material
Footnotes
References
Álvarez, M., Sanleón-Bartolomé, H., Tanhua, T., Mintrop, L., Luchetta, A., Cantoni, C., et al. (2014). The CO2 system in the Mediterranean Sea: a basin wide perspective. Ocean Sci. 10, 69–92.
Applebaum, S., Montagna, P. A., and Ritter, C. (2005). Status and trends of dissolved oxygen in corpus christi bay, Texas, U.S.A. Environ. Monit. Assess. 107, 297–311. doi: 10.1007/s10661-005-3111-5
Barrera, K. E., and Robbins, L. L. (2017). Historical patterns of acidification and increasing CO2 flux associated with Florida springs. Limnol. Oceanogr. 62, 2404–2417. doi: 10.1002/lno.10573
Bauer, J. E., Cai, W.-J., Raymond, P. A., Bianchi, T. S., Hopkinson, C. S., and Regnier, P. A. G. (2013). The changing carbon cycle of the coastal ocean. Nature 504, 61–70. doi: 10.1038/nature12857
Baumann, H., and Smith, E. M. (2018). Quantifying metabolically driven ph and oxygen fluctuations in us nearshore habitats at diel to interannual time scales. Estuar. Coast. 41, 1102–1117. doi: 10.1007/s12237-017-0321-3
Beseres Pollack, J., Yoskowitz, D., Kim, H. C., and Montagna, P. A. (2013). Role and value of nitrogen regulation provided by oysters (Crassostrea virginica) in the mission-aransas estuary. Texas, USA. PLoS One 8:e0065314. doi: 10.1371/journal.pone.0065314
Bugica, K., Sterba-Boatwright, B., and Wetz, M. S. (2020). Water quality trends in Texas estuaries. Mar. Pollut. Bull. 152:110903. doi: 10.1016/j.marpolbul.2020.110903
Butman, D., and Raymond, P. A. (2011). Significant efflux of carbon dioxide from streams and rivers in the United States. Nat. Geosci. 4, 839–842. doi: 10.1038/ngeo1294
Buzan, D., Lee, W., Culbertson, J., Kuhn, N., and Robinson, L. (2009). Positive relationship between freshwater inflow and oyster abundance in Galveston Bay, Texas. Estuar. Coast. 32, 206–212. doi: 10.1007/s12237-008-9078-z
Byrne, R. H., Mecking, S., Feely, R. A., and Liu, X. (2010). Direct observations of basin-wide acidification of the North Pacific Ocean. Geophys. Res. Lett. 37, 1–5. doi: 10.1029/2009GL040999
Caffrey, J. M. (2004). Factors controlling net ecosystem metabolism in U.S. estuaries. Estuaries 27, 90–101. doi: 10.1007/BF02803563
Cai, W.-J. (2011). Estuarine and coastal ocean carbon paradox: CO2 sinks or sites of terrestrial carbon incineration? Ann. Rev. Mar. Sci. 3, 123–145. doi: 10.1146/annurev-marine-120709-142723
Cai, W.-J., Pomeroy, L. R., Moran, M. A., and Wang, Y. (1999). Oxygen and carbon dioxide mass balance for the estuarine-intertidal marsh complex of five rivers in the southeastern U.S. Limnol. Oceanogr. 44, 639–649. doi: 10.4319/lo.1999.44.3.0639
Cai, W. J., Wang, Y., Krest, J., and Moore, W. S. (2003). The geochemistry of dissolved inorganic carbon in a surficial groundwater aquifer in North Inlet, South Carolina, and the Carbon fluxes to the coastal ocean. Geochim. Cosmochim. Acta 67, 631–637. doi: 10.1016/S0016-7037(02)01167-5
Carstensen, J., Chierici, M., Gustafsson, B. G., and Gustafsson, E. (2018). Long-term and seasonal trends in estuarine and coastal carbonate systems. Global Biogeochem. Cycles 32, 1271–1288. doi: 10.1002/2017GB005699
Carstensen, J., and Duarte, C. M. (2019). Drivers of pH variability in coastal ecosystems. Environ. Sci. Technol. 53, 4020–4029. doi: 10.1021/acs.est.8b03655
Challener, R. C., Robbins, L. L., and Mcclintock, J. B. (2016). Variability of the carbonate chemistry in a shallow, seagrass-dominated ecosystem: implications for ocean acidification experiments. Mar. Freshw. Res. 67, 163–172. doi: 10.1071/MF14219
CTBS (2017). Galveston Bay Status and Trends Final Repor. Galveston, TX: Texas A&M University, Galveston.
Da, F., Friedrichs, M. A. M., St-Laurent, P., Shadwick, E. H., Najjar, R. G., and Hinson, K. E. (2021). Mechanisms driving decadal changes in the carbonate system of a coastal plain estuary. J. Geophys. Res. Ocean. 126, 1–23. doi: 10.1029/2021JC017239
de Putron, S. J., McCorkle, D. C., Cohen, A. L., and Dillon, A. B. (2011). The impact of seawater saturation state and bicarbonate ion concentration on calcification by new recruits of two Atlantic corals. Coral Reefs 30, 321–328. doi: 10.1007/s00338-010-0697-z
Dickson, A. G., Wesolowski, D. J., Palmer, D. A., and Mesmer, R. E. (1990). Dissociation constant of bisulfate ion in aqueous sodium chloride solutions to 250.degree.C. J. Phys. Chem. 94, 7978–7985. doi: 10.1021/j100383a042
Doney, S. C. (2010). The growing human footprint on the planet. Science 388, 1512–1516. doi: 10.1016/S0140-6736(16)32143-2
Dürr, H. H., Laruelle, G. G., van Kempen, C. M., Slomp, C. P., Meybeck, M., and Middelkoop, H. (2011). Worldwide typology of nearshore coastal systems: defining the estuarine filter of river inputs to the oceans. Estuar. Coast. 34, 441–458. doi: 10.1007/s12237-011-9381-y
Egleston, E. S., Sabine, C. L., and Morel, F. M. M. (2010). Revelle revisited: buffer factors that quantify the response of ocean chemistry to changes in DIC and alkalinity. Glob. Biogeochem. Cycles 24:GB1002. doi: 10.1029/2008GB003407
Fabry, V. J., Seibel, B. A., Feely, R. A., and Orr, J. C. (2008). Impacts of ocean acidification on marine fauna and ecosystem processes. ICES J. Mar. Sci. 65, 414–432.
Fassbender, A. J., Orr, J. C., and Dickson, A. G. (2021). Technical note: interpreting pH changes. Biogeosciences 18, 1407–1415. doi: 10.5194/bg-18-1407-2021
Feely, R. A., Alin, S. R., Newton, J., Sabine, C. L., Warner, M., Devol, A., et al. (2010). The combined effects of ocean acidification, mixing, and respiration on pH and carbonate saturation in an urbanized estuary. Estuar. Coast. Shelf Sci. 88, 442–449. doi: 10.1016/j.ecss.2010.05.004
Frankignoulle, M., and Borges, A. V. (2001). Direct and Indirect pCO2 measurements in a wide range of pCO 2 and salinity values (The Scheldt Estuary). Aquat. Geochem. 7, 267–273.
Frankignoulle, M., Canon, C., and Gattuso, J.-P. (1994). Marine calcification as a source of carbon dioxide: positive feedback of increasing atmospheric CO2. Limnol. Oceanogr. 39, 458–462. doi: 10.4319/lo.1994.39.2.0458
Gattuso, J. (1998). Effect of calcium carbonate saturation of seawater on coral calcification. Glob. Planet. Change 18, 37–46. doi: 10.1016/S0921-8181(98)00035-6
Gattuso, J.-P., Epitalon, J.-M., Lavigne, H., and Orr, J. (2021). seacarb: Seawater Carbonate Chemistry. R Package Version 3.3.0. doi: 10.5281/zenodo
Gonzalez, L. A. (2011). “Chapter 6. water and sediment quality,” in The State of the Bay: A Characterization of the Galveston Bay Ecosystem. Texas Commission on Environmental Quality, Galveston Bay Estuary Program, eds L. J. Lester and L. A. Gonzalez (Houston, TX), 45.
González-Dávila, M., Santana-Casiano, J. M., and González-Dávila, E. F. (2007). Interannual variability of the upper ocean carbon cycle in the northeast Atlantic Ocean. Geophys. Res. Lett. 34, 1–7. doi: 10.1029/2006GL028145
Hofmann, G. E., Smith, J. E., Johnson, K. S., Send, U., Levin, L. A., Micheli, F., et al. (2011). High-frequency dynamics of ocean pH: a multi-ecosystem comparison. PLoS One 6:e28983. doi: 10.1371/journal.pone.0028983
Hopkinson, C. S., and Smith, E. M. (2005). “Estuarine respiration: an overview of benthic, pelagic, and whole system respiration,” in Respiration in Aquatic Ecosystems, eds P. A. del Giorgio and P. J. I. Williams (Oxford: OUP Oxford), 122–146. doi: 10.1093/acprof:oso/9780198527084.003.0008
Hu, X., Beseres Pollack, J., McCutcheon, M. R., Montagna, P. A., and Ouyang, Z. (2015). Long-term alkalinity decrease and acidification of estuaries in Northwestern Gulf of Mexico. Environ. Sci. Technol. 49, 3401–3409. doi: 10.1021/es505945p
Hunt, C. W., Salisbury, J. E., and Vandemark, D. (2011). Contribution of non-carbonate anions to total alkalinity and overestimation of pCO2 in New England and New Brunswick rivers. Biogeosciences 8, 3069–3076. doi: 10.5194/bg-8-3069-2011
Joesoef, A., Huang, W. J., Gao, Y., and Cai, W. J. (2015). Air-water fluxes and sources of carbon dioxide in the Delaware Estuary: spatial and seasonal variability. Biogeosciences 12, 6085–6101. doi: 10.5194/bg-12-6085-2015
Kaushal, S. S., Likens, G. E., Utz, R. M., Pace, M. L., Grese, M., and Yepsen, M. (2013). Increased river alkalinization in the eastern U.S. Environ. Sci. Technol. 47, 10302–10311. doi: 10.1021/es401046s
Kealoha, A. K., Shamberger, K. E. F., DiMarco, S. F., Thyng, K. M., Hetland, R. D., Manzello, D. P., et al. (2020). Surface water CO2 variability in the Gulf of Mexico (1996–2017). Sci. Rep. 10, 1–13. doi: 10.1038/s41598-020-68924-0
Komsta, L. (2019). mblm: Median-Based Linear Models. Version 0.12.1. Available online at: https://CRAN.R-project.org/package=mblm (accessed January 26, 2019).
Landschützer, P., Gruber, N., Bakker, D. C. E., Schuster, U., Nakaoka, S., Payne, M. R., et al. (2013). A neural network-based estimate of the seasonal to inter-annual variability of the Atlantic Ocean carbon sink. Biogeosciences 10, 7793–7815. doi: 10.5194/bg-10-7793-2013
Lejart, M., Clavier, J., Chauvaud, L., and Hily, C. (2011). Respiration and calcification of crassostrea gigas: contribution of an intertidal invasive species to coastal ecosystem CO2 fluxes. Estuar. Coast. 35, 622–632. doi: 10.1007/s12237-011-9462-y
McCutcheon, M. R., Staryk, C. J., and Hu, X. (2019). Characteristics of the carbonate system in a semiarid estuary that experiences summertime hypoxia. Estuar. Coast. 42, 1509–1523. doi: 10.1007/s12237-019-00588-0
Mclaughlin, K., Nezlin, N. P., Weisberg, S. B., Dickson, A. G., Booth, J. A., Cash, C. L., et al. (2017). An evaluation of potentiometric pH sensors in coastal monitoring applications. Limnol. Oceanogr. Methods 15, 679–689. doi: 10.1002/lom3.10191
Millero, F. J. (2001). Physical Cehmistry of Natural Waters. Wiley-Interscience Series in Geochemistry. New York, NY: Wiloey-Interscience.
Mongin, M., and Baird, M. (2014). The interacting effects of photosynthesis, calcification and water circulation on carbon chemistry variability on a coral reef flat: a modelling study. Ecol. Modell. 284, 19–34.
Montagna, P. A., Brenner, J., Gibeaut, J., and Morehead, S. (2011b). “Chapter 4: coastal impacts,” in The Impact of Global Warming on Texas, eds J. C. Jurgen Schmandt and G. R. North (Austin, TX: University of Texas Press), 96–123. doi: 10.1007/s13157-019-01254-8
Montagna, P. A., Ward, G., and Vaughan, B. (2011a). “The importance of freshwater inflows to Texas estuaries,” in Water Policy in Texas: Responding to the Rise of Scarcity, ed. R. C. Griffin (Washington, DC: RFF Press), 107–127.
Montagna, P. A., and Palmer, T. A. (2012). Water and Sediment Quality Status and Trends in the Coastal Bend Area - Phase 2: Data Analysis. Corpus Christi, TX: CBBEP-78, 520
Montagna, P. A., Gibeaut, J. C., and Tunnel, J. W. J. (2007). “South texas climate 2100: coastal impacts,” in The Changing Climate of South Texas, 1900–2100: Problems and Prospects, Impacts and Implications, eds J. Norwine and K. John (Kingsville, TX: Texas A&M University-Kingsville), 55–77.
Müller, J. D., Schneider, B., and Rehder, G. (2016). Long-term alkalinity trends in the Baltic Sea and their implications for CO2-induced acidification. Limnol. Oceanogr. 61, 1984–2002. doi: 10.1002/lno.10349
Najjar, R. G., Herrmann, M., Cintrón, S. M., Valle, D., Friedman, J. R., Friedrichs, M. A. M., et al. (2019). Alkalinity in tidal tributaries of the chesapeake bay journal of geophysical research: oceans. J. Geophys. Res. Ocean 125:e2019JC015597. doi: 10.1029/2019JC015597
Ni, W., Li, M., Ross, A. C., and Najjar, R. G. (2019). Large projected decline in dissolved oxygen in a eutrophic estuary due to climate change. J. Geophys. Res. Ocean. 124, 8271–8289. doi: 10.1029/2019JC015274
Patsavas, M. C., Byrne, R. H., Wanninkhof, R., and Feely, R. A. (2015). Internal consistency of marine carbonate system measurements and assessments of aragonite saturation state: insights from two U.S. coastal cruises. Mar. Chem. 176, 9–20. doi: 10.1016/j.marchem.2015.06.022
Perez, F. F., and Fraga, F. (1987). Association constant of fluoride and hydrogen ions in seawater. Mar. Chem. 21, 161–168. doi: 10.1016/0304-4203(87)90036-3
Pollack, J. B., Kim, H. C., Morgan, E. K., and Montagna, P. A. (2011). Role of flood disturbance in natural oyster (Crassostrea virginica) population maintenance in an Estuary In South Texas. USA. Estuar. Coast. 34, 187–197. doi: 10.1007/s12237-010-9338-6
Powell, E. N., and Klinck, J. M. (2007). Is oyster shell a sustainable estuarine resource? J. Shellfish Res. 26, 181–194. doi: 10.2983/0730-8000(2007)26[181:iosase]2.0.co;2
Prasad, M. B. K., Kaushal, S. S., and Murtugudde, R. (2013). Long-term pCO2 dynamics in rivers in the chesapeake bay watershed. Appl. Geochem. 31, 209–215. doi: 10.1016/j.apgeochem.2013.01.006
Provoost, P., Van Heuven, S., Soetaert, K., Laane, R. W. P. M., and Middelburg, J. J. (2010). Seasonal and long-term changes in pH in the Dutch coastal zone. Biogeosciences 7, 3869–3878. doi: 10.5194/bg-7-3869-2010
R Core Team (2020). R: A Language and Environment for Statistical Computing. Vienna: R Foundation for Statistical Computing.
Raymond, P. A., Bauer, J. E., and Cole, J. J. (2000). Atmospheric CO2 evasion, dissolved inorganic carbon production, and net heterotrophy in the York River estuary. Limnol. Oceanogr. 45, 1707–1717. doi: 10.4319/lo.2000.45.8.1707
Raymond, P. A., and Cole, J. J. (2003). Increase in the export of alkalinity from North America’s largest river. Science 301, 88–91. doi: 10.1126/science.1083788
Raymond, P. A., Oh, N.-H., Turner, R. E., and Broussard, W. (2008). Anthropogenically enhanced fluxes of water and carbon from the Mississippi River. Nature 451, 449–452. doi: 10.1038/nature06505
Robbins, L. L., and Lisle, J. T. (2018). Regional acidification trends in florida shellfish estuaries: a 20+ year look at pH, oxygen, temperature, and salinity. Estuar. Coast. 41, 1268–1281. doi: 10.1007/s12237-017-0353-8
Russell, M. J., and Montagna, P. A. (2007). Spatial and temporal variability and drivers of net ecosystem metabolism in western Gulf of Mexico estuaries. Estuar. Coast. 30, 137–153. doi: 10.1007/bf02782974
Scanes, E., Scanes, P. R., and Ross, P. M. (2020). Climate change rapidly warms and acidifies Australian estuaries. Nat. Commun. 11, 1–11. doi: 10.1038/s41467-020-15550-z
Shaw, E. C., McNeil, B. I., Tilbrook, B., Matear, R., and Bates, M. L. (2013). Anthropogenic changes to seawater buffer capacity combined with natural reef metabolism induce extreme future coral reef CO2 conditions. Glob. Chang. Biol. 19, 1632–1641. doi: 10.1111/gcb.12154
Siegel, A. F. (1982). Robust regression using repeated medians. Biometrika 69, 242–244. doi: 10.1093/biomet/69.1.242
Snyder, J. T., Whitney, M. M., Dam, H. G., Jacobs, M. W., and Baumann, H. (2019). Citizen science observations reveal rapid, multi-decadal ecosystem changes in eastern Long Island Sound. Mar. Environ. Res. 146, 80–88. doi: 10.1016/j.marenvres.2019.03.007
Stets, E. G., Butman, D., McDonald, C. P., Stackpoole, S. M., DeGrandpre, M. D., and Striegl, R. G. (2017). Carbonate buffering and metabolic controls on carbon dioxide in rivers. Global Biogeochem. Cycles 31, 663–677. doi: 10.1002/2016GB005578
Stets, E. G., Kelly, V. J., and Crawford, C. G. (2014). Long-term trends in alkalinity in large rivers of the conterminous US in relation to acidification, agriculture, and hydrologic modification. Sci. Total Environ. 488–489, 280–289. doi: 10.1016/j.scitotenv.2014.04.054
Uppström, L. R. (1974). The boron/chlorinity ratio of deep-sea water from the Pacific Ocean. Deep. Res. Oceanogr. Abstr. 21, 161–162. doi: 10.1016/0011-7471(74)90074-6
Van Dam, B. R., and Wang, H. (2019). Decadal-scale acidification trends in adjacent North Carolina estuaries: competing role of anthropogenic CO2 and riverine alkalinity loads. Front. Mar. Sci. 6:136. doi: 10.3389/fmars.2019.00136
Van Dam, B. R., Crosswell, J. R., Anderson, I. C., and Paerl, H. W. (2018). Watershed-scale drivers of air-water CO2 exchanges in two lagoonal North Carolina (USA) estuaries. J. Geophys. Res: Biogeosci. 123, 271–287. doi: 10.1002/2017JG004243
VanderKooy, S. (ed.) (2012). The Oyster Fishery of the Gulf of Mexico, United States: A Regional Management Plan – 2012 Revision. Mississippi: Ocean Springs. Publication No. 202, Gulf States Marine Fisheries Commission.
Waldbusser, G. G., Hales, B., Langdon, C. J., Haley, B. A., Schrader, P., Brunner, E. L., et al. (2015). Saturation-state sensitivity of marine bivalve larvae to ocean acidification. Nat. Clim. Chang. 5, 273–280. doi: 10.1038/nclimate2479
Waldbusser, G. G., Voigt, E. P., Bergschneider, H., Green, M. A., and Newell, R. I. E. (2011). Biocalcification in the eastern oyster (Crassostrea virginica) in relation to long-term trends in chesapeake bay pH. Estuar. Coast. 34, 221–231. doi: 10.1007/s12237-010-9307-0
Wallace, R. B., Baumann, H., Grear, J. S., Aller, R. C., and Gobler, C. J. (2014). Coastal ocean acidification: the other eutrophication problem. Estuar. Coast. Shelf Sci. 148, 1–13. doi: 10.1016/j.ecss.2014.05.027
Yao, H., and Hu, X. (2017). Responses of carbonate system and CO2 flux to extended drought and intense flooding in a semiarid subtropical estuary. Limnol. Oceanogr. 62, S112–S130. doi: 10.1002/lno.10646
Keywords: long-term trend, carbonate chemistry, pCO2, buffer capacity, estuary
Citation: McCutcheon MR and Hu X (2022) Long-Term Trends in Estuarine Carbonate Chemistry in the Northwestern Gulf of Mexico. Front. Mar. Sci. 9:793065. doi: 10.3389/fmars.2022.793065
Received: 11 October 2021; Accepted: 09 February 2022;
Published: 03 March 2022.
Edited by:
Maria Ll. Calleja, Max Planck Institute for Chemistry, GermanyReviewed by:
Mathilde Hagens, Wageningen University and Research, NetherlandsWiley Evans, Hakai Institute, Canada
Copyright © 2022 McCutcheon and Hu. This is an open-access article distributed under the terms of the Creative Commons Attribution License (CC BY). The use, distribution or reproduction in other forums is permitted, provided the original author(s) and the copyright owner(s) are credited and that the original publication in this journal is cited, in accordance with accepted academic practice. No use, distribution or reproduction is permitted which does not comply with these terms.
*Correspondence: Melissa R. McCutcheon, melissa.rae.mccutcheon@gmail.com
†Present address: Melissa R. McCutcheon, State of Texas, Austin, TX, United States