Response: Commentary: Stock Status Assessments for 12 Exploited Fishery Species in the Tsushima Warm Current Region, Southwest Japan and East China, Using the CMSY and BSM Methods
 Yuanchao Wang
 Cui Liang
 Weiwei Xian
 Maria Lourdes Palomares
- 1Key Laboratory of Marine Ecology and Environmental Sciences, Institute of Oceanology, Chinese Academy of Sciences, Qingdao, China
- 2University of Chinese Academy of Sciences, Beijing, China
- 3Laboratory for Marine Ecology and Environmental Science, Qingdao National Laboratory for Marine Science and Technology, Qingdao, China
- 4Center for Ocean Mega-Science, Chinese Academy of Sciences, Qingdao, China
- 5Sea Around Us, Institute for the Oceans and Fisheries, University of British Columbia, Vancouver, BC, Canada
by Miyagawa, M., Ichinokawa, M., Yoda, M., Kurota, H., Ohshimo, S., and Nishida, H. (2021). Front. Mar. Sci. 8:703039. doi: 10.3389/fmars.2021.703039
Introduction
Miyagawa et al. (2021) (hereafter “Mi2021”) published a commentary on our original research paper, “Stock Status Assessments for 12 Exploited Fishery Species in the Tsushima Warm Current Region, Southwest Japan and East China, Using the CMSY and BSM Methods (Wang et al., 2020).” However, we feel that most of their comments are unsupported and deserve a reply.
Based on the basic parameters of our research, Mi2021 fits the full time series of abundance data to CMSY and BSM functions, and gets their conclusions indiscriminately. Such attempt without fitting process and ignoring the model applicability and assumptions is risky and irrational. We warn that the Figure 1 in Mi2021 is hasty and misleading, and ignoring the confidence intervals of the time series estimations of related parameters is not rigorous. The results of Mi2021 should belong to the initial stage or first run of model fitting, and there is a certain distance from the key run.
Note that CMSY and BSM methods are Bayesian sampling algorithms for stocks with limited data resources and have their probability density distributions. In this case of limited data, it is wise to take the confidence interval into account when we discuss the quality of model operations, and the order of magnitude of the estimated parameter seems to be more conservative than the average value. Accurately mapping CMSY and BSM among fishery resource assessment methods is very important for understanding and using their simulation uncertainty and reliability. Evaluating the quality of CMSY and BSM results only based on the mean value of a simulation parameter obviously overestimates the convergence ability in the case of limited data.
The stock biomass is assumed to have a (generally high) fraction of carrying capacity at the initial stage of biomass time series, that is at the early stage of resource exploitation. As resource exploitation develops, stock biomass is reduced and is increased by recruitment. However, when exploitation reaches peak development, beyond a tipping point where biomass reduction outweighs stock recruitment, the biomass trajectory steadily follows a downward trend (Palomares et al., 2018). (Wang et al., 2020) mentioned that “the CMSY and BSM method is not appropriate for stocks that are affected by environmental factors that might lead to a regime shift that have the tendency to change a stock's population structure and thus, the evolution of its biomass”. Zhai et al. (2020) indicated that “As the 2-parameter CMSY model cannot readily accommodate massive changes in biomass due to environmental fluctuations, Pacific sardine treated as if it was overfished in 1950–1975” and “However, we did not report on its ‘MSY' or other statistics, which would be unrealistic” in their study. We thus reiterate here that the CMSY and BSM models need to take such conditions into consideration.
Selection of Abundance Data: The Longer the Better?
A prerequisite for selecting a long time series as input data is that the more data, the more information it contains. However, using all historical data may reduce the ability to capture the current stock status under an alternative ecosystem state (Stewart and Martell, 2015). When measurement error is small and the ecosystem undergoes a low-frequency and large-scale dynamic process, such a selection would introduce a larger error (Zhang et al., 2021). However, it is challenging to determine the optimal length of time series for fishery resource assessment. Meanwhile, choosing a shorter time series may loss some historical information and could introduce subjectivity (Zhang et al., 2021).
The main advantage of the BSM method is the use of uncompleted abundance data that constrains the CMSY analysis according to conditions that reflect the population's status at a given period of time (Froese et al., 2016; Wang et al., 2020). The choice of the part of the time series to include in the analysis depends not only on the availability and reliability of the abundance data, but also on the applicability of the CMSY/BSM model to the data. In Wang et al. (2020), such selection has focus and optimize the stock assessments of recent years. For S. melanostictus (Sardinops melanostictus; see Figure 1), where the biomass time series does not fully follow the declining biomass trend assumption of the CMSY/BSM model, including the pre-peak part of the time series may introduce uncertainties that cannot be explained. The abundance data time series selected is the part with similar downward trend with the biomass trajectory in Relative biomass B/k to Years figures estimated by CMSY (Figure 1 and Supplementary Figure 1).
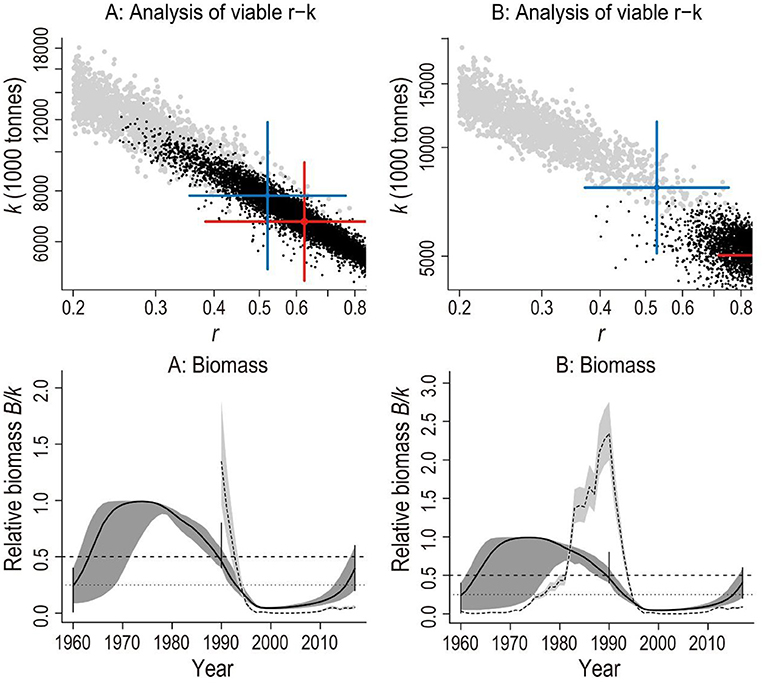
Figure 1. Results of the CMSY and BSM analyses for S. melanostictus (Sardinops melanostictus) in the Tsushima Warm Current region. “(A,B) Analysis of viable r-k”: feasible r–k pairs found by CMSY (gray points) and BSM methods (black points). The optimal r–k pair estimated by CMSY and its approximate 95% confidence interval (CI) are represented by a blue cross, and the optimal r–k pair estimated by BSM and its approximate CI are represented by a red cross. In this example, the estimates of the two methods are similar and close in “(A) Analysis of viable r–k” based on Wang et al. (2020) than that in “(B) Analysis of viable r–k” based on Mi2021, which suggests that the results of Wang et al. (2020) are more reliable; “(A,B) Biomass”: the available abundance data in dashed line, scaled to the BSM estimate of Bmsy = 0.5 k, and the biomass trajectory estimated by CMSY in solid line, along with their 2.5th and 97.5th percentiles. The dashed horizontal line indicates Bmsy = 0.5 k, while the dotted horizontal line indicates half Bmsy as the limit below which recruitment may be impaired. Vertical solid lines indicate the prior biomass ranges. The poor fitting of the model in “(B) Biomass” from Mi2021 introduces high uncertainties in the biomass simulation from 1960 to 1980.
As Mi2021 did not indicate which optimal r-k pairs were used in their analyses, and did not mention the resulting fit of the model they used (Supplementary Figure 2), it is difficult to compare their results with those that we obtained. Additionally, we worry that Mi2021's remarks about the use of full time series irrespective of the model assumptions, the modeling emphasis, and the degree of model fitting, may underestimate the power of BSM assessments in data limited conditions or when incomplete abundance data are applied.
Model Accuracy: The Model Is the Model; We Make It Warm
Because the CMSY and BSM models integrate relevant informative and constraining priors, the accuracy of its application (notably to data-poor conditions) and simulation is improved. Froese et al. (2016) evaluated the performance of this model with real and simulated datasets, concluding that the model generated estimates with 95% confidence limits including the “true” parameter values.
Froese et al.'s (2016) method can be expected to work well in data-sparse situations when: (1) catch data are reliable; (2) variations in catches generally reflect the variations of the underlying biomass; and (3) reliable estimates of priors from independent sources are available. When both catch and CPUE time series data are available, estimates from these two data sets can be corroborated (BSM), and combining them can lead to narrower confidence intervals. The analysis conducted in Wang et al. (2020) met all of these conditions.
As mentioned above, Wang et al. (2020) has focus and optimize the stock assessments of recent years, and the choice of time series is the result of a trade-off between different sources of errors. If inappropriate datasets are used (that is, do not follow the conditions enumerated above), biased estimates of r and k are generated, leading to biased estimates of B/BMSY. That's why species that fluctuate strongly in response to climatic events, such as Sardinops sagax, are not suitable for CMSY/BSM assessment (Zhai et al., 2020). Note also that sensitivity analyses conducted by Liang et al. (2020) performed by individually changing the priors ranges revealed that Bend/k was the most sensitive prior among the three required inputs (r, Bstart/k, and Bend/k). However, there is no evidence to assume a systematic bias, which refutes Mi2021's statement that “B/Bmsy estimates produced using CMSY tend to be negatively biased and have an accuracy of 40–50%.”
Is It Really a Data-Limited Situation?
Fisheries Agency of Japan and Japan Fisheries Research and Education Agency (http://abchan.fra.go.jp/, abbreviated as FAJ) releases annual assessment reports for main commercial stocks, based on various data sets, such as catch, fishing effort, length frequency, and catch-at-age data. In Wang et al. (2020), we abstracted only catch and biomass data of 12 exploited stocks in the Tsushima Warm Current Region, Southwest Japan and East China from the official reports, and assessed them with the data-limited models CMSY/BSM. With these two methods, we provided estimates of the intrinsic population growth rate (r), carrying capacity (k), MSY, relative biomass, and stock status for the stocks in question. Note also that the heuristics of the catch constrained by biological resilience data and knowledge of the fishery and the resulting confidence intervals of the CMSY analyses add to the knowledge on the stock. These are “real data” (if the catch data are reliably obtained) that can inform fishery managers about obvious trends that are by themselves meaningful, although they may not have the same accuracy as results of BSM or other data-rich methods. Mi2021 obviously underestimated not only the reliability of the CMSY model, but also the explanatory power of the catch time series.
FAJ releases relevant and timely fishery resource data. However, we note that the distributions of these stocks are not juristically limited, that is, geographical distributions of stocks may cross regional and national borders. Stock definitions and thus their assessments need to be coherent with their ecological habits, which does not necessarily conform to the stock definitions used by FAJ. Thus, data released by the Fisheries Agency of Japan may not be comprehensively integrated into a cohesive database for stock assessment, and maybe subject to open access limitations. Thus, we propose that countries depending on these resources would need to collaborate in order to provide authoritative management options for regional stocks (Wang et al., 2020).
Conclusion
Mi2021 inaccurately evaluated our use of the CMSY/BSM model and our data choices, and lacked rigorousness and logic in its criticism of our research. We would have welcomed constructive and collaborative commentaries that could have led to joint research in improving these analyses that would be relevant to national and regional institutions working in the region. We also would like to express our appreciation of the FAJ's (and its relative branches) efforts in collecting and sharing of fisheries data, which facilitated our assessments. We agree with the necessity of reviewing previous studies in order to reduce the bias as discussed in Mi2021.
Author Contributions
YW wrote the first draft of the manuscript. CL, WX, and MP edited the first draft to provide the final draft of the manuscript. All authors contributed to the article and approved the submitted version.
Funding
We acknowledge the funding by grants for the National Natural Science Foundation of China (31872568, 41976094) and Natural Science Foundation of China-Shandong Joint Fund for Marine Ecology and Environmental Sciences (U1606404).
Conflict of Interest
The authors declare that the research was conducted in the absence of any commercial or financial relationships that could be construed as a potential conflict of interest.
Publisher's Note
All claims expressed in this article are solely those of the authors and do not necessarily represent those of their affiliated organizations, or those of the publisher, the editors and the reviewers. Any product that may be evaluated in this article, or claim that may be made by its manufacturer, is not guaranteed or endorsed by the publisher.
Supplementary Material
The Supplementary Material for this article can be found online at: https://www.frontiersin.org/articles/10.3389/fmars.2022.797309/full#supplementary-material
References
Froese, R., Demirel, N., Coro, G., Kleisner, K. M., and Winker, H. (2016). Estimating fisheries reference points from catch and resilience. Fish Fish. 18, 506–526. doi: 10.1111/faf.12190
Liang, C., Xian, W., and Pauly, D. (2020). Assessments of 15 exploited fish stocks in chinese, south korean and japanese waters using the CMSY and BSM methods. Front. Mar. Sci. 7, 623. doi: 10.3389/fmars.2020.0062
Miyagawa, M., Ichinokawa, M., Yoda, M., Kurota, H., Ohshimo, S., and Nishida, H. (2021). Commentary: stock status assessments for 12 exploited fishery species in the Tsushima warm current region, Southwest Japan and East China, Using the CMSY and BSM Methods. Front. Mar. Sci. 8, 703039. doi: 10.3389/fmars.2021.703039
Palomares, M. L. D., Froese, R., Derrick, B., Nöel, S.-L., Tsui, G., Woroniak, J., et al. (2018). “A preliminary global assessment of the status of exploited marine fish and invertebrate populations,” in A Report Prepared by the Sea Around US for OCEANA, (Vancouver, BC: The University of British Columbia), 64.
Stewart, I. J., and Martell, S. J. D. (2015). Reconciling stock assessment paradigms to better inform fisheries management. ICES J. Mar. Sci. 72, 2187–2196. doi: 10.1093/icesjms/fsv061
Wang, Y. C., Liang, C., Wang, Y. B., Xian, W. W., and Palomares, M. L. (2020). Stock status assessments for 12 exploited fishery species in the Tsushima warm current region, Southwest Japan and East China, using the CMSY and BSM methods. Front. Mar. Sci. 7:640. doi: 10.3389/fmars.2020.00640
Zhai, L., Liang, C., and Pauly, D. (2020). Assessments of 16 exploited fish stocks in chinese waters using the CMSY and BSM methods. Front. Mar. Sci. 7, 483993. doi: 10.3389/fmars.2020.483993
Keywords: CMSY, BSM, fishery status, reference points, stock assessments
Citation: Wang Y, Liang C, Xian W and Palomares ML (2022) Response: Commentary: Stock Status Assessments for 12 Exploited Fishery Species in the Tsushima Warm Current Region, Southwest Japan and East China, Using the CMSY and BSM Methods. Front. Mar. Sci. 9:797309. doi: 10.3389/fmars.2022.797309
Received: 18 October 2021; Accepted: 24 January 2022;
Published: 18 February 2022.
Edited by:
Brett W. Molony, Oceans and Atmosphere (CSIRO), AustraliaReviewed by:
Ting-Chun Kuo, National Taiwan Ocean University, TaiwanCopyright © 2022 Wang, Liang, Xian and Palomares. This is an open-access article distributed under the terms of the Creative Commons Attribution License (CC BY). The use, distribution or reproduction in other forums is permitted, provided the original author(s) and the copyright owner(s) are credited and that the original publication in this journal is cited, in accordance with accepted academic practice. No use, distribution or reproduction is permitted which does not comply with these terms.
*Correspondence: Cui Liang, liangc@qdio.ac.cn; Weiwei Xian, wwxian@qdio.ac.cn