Oyster Reef Surfaces in the Central Wadden Sea: Intra-Reef Classification and Comprehensive Statistical Description
 Jan Hitzegrad1*
  Leon Brohmann2
  Kai Pfennings3
  Tom K. Hoffmann4
  Anne K. Eilrich3,4
  Maike Paul5 Mario Welzel1
  Torsten Schlurmann5,6
  Jochen Aberle1
  Achim Wehrmann3
  Nils Goseberg1,6
- 1Leichtweiß-Institute for Hydraulic Engineering and Water Resources, Technische Universität Braunschweig, Braunschweig, Germany
- 2Institute of Structural Design, Technische Universität Braunschweig, Braunschweig, Germany
- 3Marine Research Department, Senckenberg am Meer, Wilhelmshaven, Germany
- 4Institute of Biology and Environmental Sciences, Carl von Ossietzky Universität Oldenburg, Oldenburg, Germany
- 5Ludwig Franzius Institute of Hydraulic, Estuarine and Coastal Engineering, Leibniz University Hannover, Hannover, Germany
- 6Coastal Research Center, Joint Research Facility of Leibniz University Hannover and Technische Universität Braunschweig, Hannover, Germany
The Pacific oyster (Magallana gigas) is an invasive species in the Wadden Sea transforming parts of it permanently. M. gigas, as an ecosystem engineer, builds reef structures that are characterized by highly complex and variable surfaces consisting of densely packed, sharp-edged individuals connected with cement-like bonds. To investigate the interactions between reef structure, shape and formation and wave as well as tidal currents, an understanding of the surface roughness is essential. This work reports on observations of oyster reefs for which seven new structural classes (Central Reef, Transitional Zone, Cluster I, Cluster II, Patch I, Patch II, and Garland) are proposed. For each class, high resolution Digital Elevation Models (DEMs) have been elaborated based on Structure-from-Motion (SfM) photogrammetry and analyzed using spatial statistics. By determining probability density functions (PDFs), vertical porosity distributions, abundances, orientations and second-order structure functions (SSFs), topographical parameters that influence the hydraulic bed roughness have been determined. The results suggest, that by applying the structural classification and their distinct topographical roughness parameters, the oyster reef surfaces can be described appropriately accounting for their complexity. The roughness accounts to a total roughness height kt = 103 ± 15 mm and root-mean-square roughness height krms = 23 ± 5 mm. These values were found similar across all structural classes, yet the shape of the PDFs reveal differences. With decreasing abundance, the distributions become more positively skewed and are characterized by more extreme outliers. This is reflected in the higher statistical moments, as the skewness ranges between Sk = 0.4–2.1 and the kurtosis between Ku = 2.2–11.5. The analysis of the orientations and the SSFs confirms anisotropic behavior across all structural classes. Further, the SSFs reveal the oyster shells as significant roughness elements with exception of Cluster I and II, where the clusters are identified as significant roughness elements. The provided set of topographical roughness parameters enhances the knowledge of oyster reef surfaces and gives insights into the interactions between biogenic structure and surrounding hydrodynamics. The new intra-reef classification allows for more accurate determination of the overall roughness as well as the population dynamics of the habitat forming oyster. Combined with hydraulic measurements, the results can be used to estimate the hydraulic bed roughness induced by the oyster reef surfaces.
Introduction
The non-indigenous Pacific oyster Magallana gigas (Thunberg, 1793 formerly referred to as Crassostrea gigas) has become an established species in European waters (Diederich, 2005; Reise et al., 2017; Ewers-Saucedo et al., 2020). Permanent establishment of oyster populations in the western and central Wadden Sea began in the late 1990s after unintended introduction with seed mussels from the Oosterschelde in the Dutch Wadden Sea and subsequent dispersal by larvae drift eastward (Wehrmann et al., 2000; Brandt et al., 2008). In the northern Wadden Sea, populations developed separately from a local aquaculture hotspot near the island of Sylt (Reise, 1998). Oyster larvae require hard substrates to settle, which they find in intertidal blue mussel beds (Mytilus edulis), shell layers or artificial structures (Reise, 1998; Wehrmann et al., 2000; Wrange et al., 2010). With sufficient hard substrate available, populations of the invasive Pacific oyster have spread exponentially which led to an irreversible system shift in the Wadden Sea ecology (Wehrmann, 2006; Nehls et al., 2011; Folmer et al., 2014, 2017; Reise et al., 2017). In its function as an ecosystem engineering species, the invasive Pacific oyster has replaced formerly native mussel beds as the pristine and predominant biogenic habitat by the formation of rigid oyster reefs (Brandt et al., 2008; Markert et al., 2013; Bungenstock et al., 2021). The oyster reefs, now permanently present in the Wadden Sea region, entail alterations in the biological composition as well as local hydro- and morphodynamics. The assessment of these effects and their relevance at larger scales requires a close examination of the ultra-rough surface formed by the reefs regarding its interaction with tides and waves, implications for the entire ecosystem central Wadden Sea, and the quantification of roughness effects and reef topographies (Markert et al., 2010; Borsje et al., 2011; van der Zee et al., 2012; Walles et al., 2015b; Folmer et al., 2017).
In contrast to Mytilus-beds, which form low-relief biogenic structures with an internal flexible meshwork, M. gigas form rigid reef-like structures (Smaal et al., 2005). While blue mussels are attached to each other by the flexible and degradable byssus threads, juvenile oysters are permanently cemented with their left valve to their substratum immediately after metamorphosis of the larvae (Burkett et al., 2010; Tibabuzo Perdomo et al., 2018). When individuals die, the shells remain connected and form a hard substrate for the next generation, as M. gigas larvae prefer to settle on conspecifics (Quayle, 1988; Arakawa, 1990; Diederich, 2005). The shells of mature M. gigas typically reach lengths of 80–200 mm and widths of about 50–100 mm (Figure 1). The shells are coarse concentric sculpted with about six bold raised ribs and a glossy crenulate, saw-toothed shell margin contributing to the reef topographies complex nature (García-March et al., 2007; Nehring, 2011; Gosling, 2015; Hayward and Ryland, 2017). Growth, shell shape and orientation are highly variable and dependent on, e.g., substrate and food availability, temperature as well as abundance (Miossec et al., 2009; Nehring, 2011; Gosling, 2015; Hayward and Ryland, 2017). Oyster reef surfaces are characterized by directional features that are governed by their specific shell shape, and sharp, edgy growth line that influence surrounding hydrodynamics (García-March et al., 2007) and vice versa (Nagle, 1967; Grinnell, 1974). Due to the rigid framework, oyster reefs are more resistant to mechanical stresses induced by waves, tidal currents or even partially ice drift compared to mussel beds (Taylor and Bushek, 2008; Bungenstock et al., 2021). Over several generations, solid structures amalgamate with the surrounding sediment and continue to grow vertically while also expanding horizontally (Folmer et al., 2017; Bungenstock et al., 2021). In the process, oyster reefs evolve through different growth stages (Markert, 2020). After initial settlement on a hard substrate, clumps of several oysters are formed that enlarge by repetitive settlement. Over time, clumps coalesce to cluster and finally large-scale connected surfaces. Hence, once established, oyster reefs are known to persist permanently (Harzhauser et al., 2015; Djuricic et al., 2016). The internal structure and topography of M. gigas reefs range from areas with high abundances and vertically grown, densely packed individuals over clustered settlements with lower abundances to areas of bare sediment and biodeposits (Nagle, 1967; Grinnell, 1974; Bungenstock et al., 2021). However, vertical growth is limited by the aerial exposure time at low tides as upper threshold. Rodriguez et al. (2014) and Ridge et al. (2017) found a threshold of a growth ceiling of 50–60% of the time during a tidal cycle. Several studies suggest classifications of oyster reefs in two or three reef types [e.g., high-relief or low-relief (Schulte et al., 2009; Lipcius et al., 2015); high reef density or low reef density (Mann et al., 2009; Wagner et al., 2012); high or low complexity (Grabowski, 2004; Grabowski and Powers, 2004; Markert, 2020)]. However, a closer examination of an intra-reef structure classification is currently unavailable despite its natural spatial heterogeneity, and this has thus largely motivated the present work.
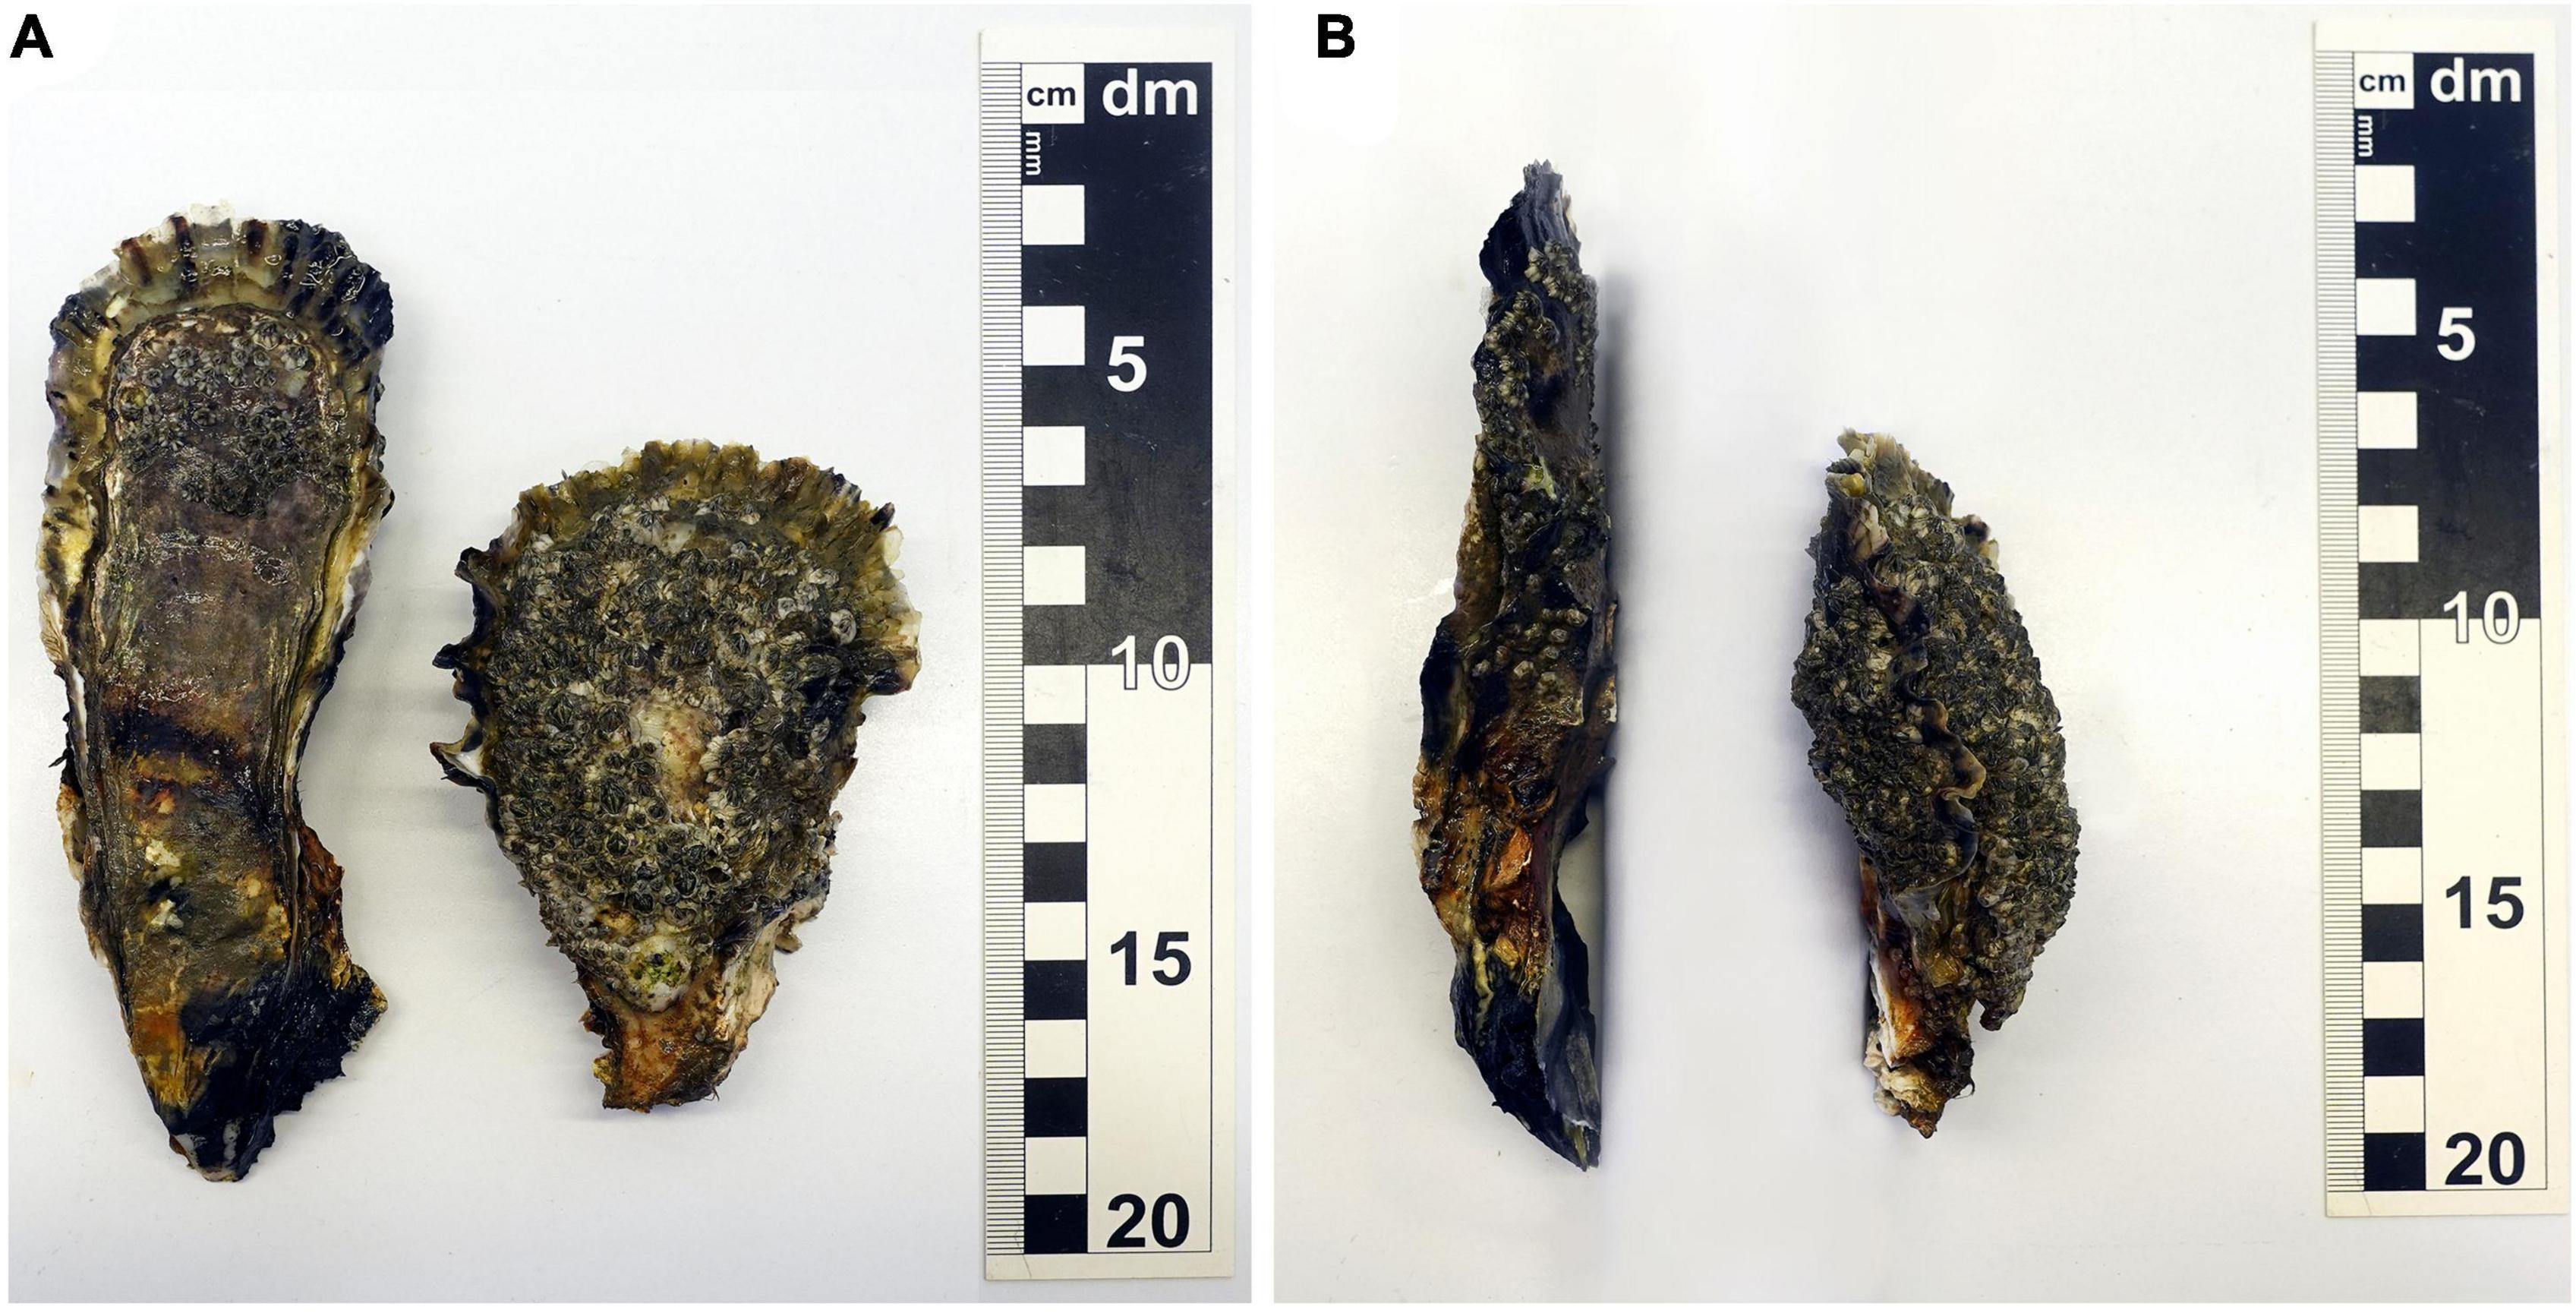
Figure 1. Detailed view of two Magallana gigas individuals illustrating the variability of the oyster shell morphology of mature individuals. (A) View along the long axis of the oyster shells. (B) View along the short axis of the oyster shells.
Oysters are ecosystem engineers as they influence the intertidal flats beyond their biogenic habitat (Jones et al., 1994, 1997; Gutiérrez et al., 2003). It has been recognized that oyster reefs can serve as living breakwater as they attenuate wave energy effectively (Bouma et al., 2014; Manis et al., 2015; Chowdhury et al., 2019) and stabilize sediments through trapping and sheltering (Meyer et al., 1997; Piazza et al., 2005; Walles et al., 2015a) similar to wide-graded scour protection where sand deposition has been observed both in currents and waves (Schendel et al., 2016, 2018a,b). Oyster reefs even bear the potential to reduce vulnerability of coastal communities to natural hazards as flooding, eroding shorelines and sea-level rise (Piazza et al., 2005; Hossain et al., 2013; Walles et al., 2015b; Chowdhury et al., 2019).
While little research has focused on the bed roughness of M. gigas reefs in European waters, the hydrodynamic roughness of reefs formed by Crassostrea virginica, especially on the East Coast of the United States, have been subject to several studies. Whitman and Reidenbach (2012), Reidenbach et al. (2013), Styles (2015), and Kitsikoudis et al. (2020) measured flow dissipation over natural and restored C. virginica reefs. All studies derive site-specific hydrodynamic roughness parameters, namely the drag coefficient CD or roughness length z0 from flow measurements. However, these descriptors depend highly on site-specific characteristics of the oyster reefs and are thus difficult to apply to other locations or oyster species. Previous studies have used a mean number of roughness elements, their average height and width as site-specific topographic descriptors (Manis et al., 2015; Kitsikoudis et al., 2020) and illustrate a direct influence of the density and size of individual shells on wave attenuation. Morris et al. (2021) compared the effectiveness of several C. virginica reefs as breakwaters as part of a nature-based coastal protection strategy in a field study on the East Coast of the United States. While the authors conclude that the reef crest elevation is the most important parameter for wave attenuation, they also highlight the dependency of the reef crest to an optimal inundation duration, and thus, to the water level. Furthermore, they conclude that additional reef characteristics (e.g., width or oyster coverage) should be considered in future studies. The aforementioned studies illustrate the requirement of a detailed understanding of the surface topography to possibly transfer results to other locations and to better assess the effects of wave and current energy dissipation. However, detailed descriptions of the oyster reef topographies at the scale of individual oysters remain sparse. Besides the surface descriptions mentioned before, Margiotta et al. (2016) and Colden et al. (2017) report rugosities as measures of surfaces roughness. In their applied method, a fine link chain is laid over the surface conforming to the crevices. In a subsequent step, the length of the chain is divided by the linear length over the reef top, yielding a metric with which surface complexity can be estimated.
In the fields of hydraulic engineering and fluvial hydraulics, the analysis of bed topographies utilizing high-resolution digital elevation models (DEMs) and spatial statistics has become more and more popular in the past decades, as this approach offers an opportunity to link surface characteristics with hydraulic roughness (Powell, 2014). Apart from some exceptions (Krämer and Winter, 2016; Welzel et al., 2019, 2020) this approach has been used less in the field of coastal or ocean engineering. Conventionally, bed roughness due to small-scale roughness elements on plane beds, such as sand-grains or gravel, has been linked to a characteristic surface descriptor (e.g., grain size d50 or d84) or to the equivalent sand roughness, i.e., the roughness used in the work of Nikuradse (1933). However, by utilizing a single descriptor many parameters such as particle size distribution, particle shape, orientations, arrangements and bed forms, etc., are neglected (Nikora et al., 1998). The emergence of high-resolution DEMs based on 3D laser scanning and structure-from-motion (SfM) photogrammetry nowadays allow for detailed analysis of complex bed topographies. This means that it is now feasible to switch from conventional singular parameters to information-richer parameter sets to describe key topographical properties (Musker, 1980; Clifford et al., 1992; Nikora et al., 1998; Smart et al., 2004; Aberle and Nikora, 2006; Flack and Schultz, 2010, 2014; Chung et al., 2021). DEMs can be evaluated using several statistical methods, e.g., probability density functions (Nikora et al., 1998; Smart et al., 2004; Aberle and Nikora, 2006; Coleman et al., 2011; Bertin and Friedrich, 2014), porosity distribution (Aberle, 2007; Navaratnam et al., 2018), or structure functions (Nikora and Walsh, 2004; Aberle and Nikora, 2006; Bertin and Friedrich, 2014; Qin et al., 2019). However, linking topographical properties to hydraulic roughness effects remains an ongoing topic of research (Chung et al., 2021). A comprehensive analysis of oyster-settled surfaces in the shallow marine environment using high-resolution DEMs has not yet been conducted to date. It is worth mentioning that DEMs of natural and constructed C. virginica reefs were analyzed by Rodriguez et al. (2014) and Ridge et al. (2015) to investigate vertical, areal, and hence volumetric reef growth, over time as well as impact factors such as aerial exposure time and sea-level rise. Parameters describing the roughness of the reef, e.g., topographical roughness lengths, have not been identified in these studies. It is hypothesized that, in case of oyster reefs, the shape, the orientation and protrusion of the individual oysters as well as abundance and formation of cluster are important topographical parameters that should be considered in a more accurate surface characteristics description.
Based on recent literature, several unresolved topics remain with respect to the characterization of roughness and topographies of oyster reefs. Only few studies address the description of oyster reef surfaces, but fall short to elaborate surface properties in detail. When topographic roughness parameters are reported, some factors that are assumed to affect the hydraulic roughness are not considered. Complex topographies and variability due to abundances, orientations or clustering have not been studied thoroughly. The complexity of oyster reefs caused by the variability of surface properties within reefs have not been addressed. No classification of internal structures of oyster reefs (M. gigas), neither worldwide nor for European waters exist. Based on the previously identified lack of knowledge, the specific objectives of this paper include the following:
• Gaining insights into the spatial topography of M. gigas reefs using high-resolution DEMs.
• To examine if and how SfM photogrammetry can be employed to derive detailed high-resolution topographical data under the adverse conditions during field studies in the eulittoral of the central Wadden Sea.
• To provide a detailed statistical surface description of M. gigas reef topographies at the scale of species-related oyster roughness.
• To propose a general intra-reef structural classification of oyster reefs, based on visual field observations and detailed statistical analyses of the bed topography.
• The introduction and application of a methodology which allows the transfer of hydrodynamic parameters across locations without considerable uncertainty, which can later be applied to other reef locations.
Materials and Methods
Study Site
The present study focuses on the oyster reef Kaiserbalje (Mean Coordinates: 53.6470116°N, 008.2664760°E; Figure 2). It is located in the “Hohe Weg Watt” in the Lower Saxon Wadden Sea National Park north of the peninsula Butjadingen, Germany. The Kaiserbalje is situated on the intertidal flat at the vertex between the Jade and Weser estuaries. The reef is composed of a large continuous surface extending 600 m in WE and 300 m in NS direction with fringing boundaries as well as a second smaller surface at a distance of 500 m south of the main reef with extends of 50 by 50 m. The sediment cover within the central part of the reef is predominantly muddy, while the smaller part is predominantly sandy. The mean tidal range is 3.3 m (Bundesamt für Seeschifffahrt und Hydrographie [BSH], 2020) and the mean aerial exposure time is 3.5 h. At the time of the field study in October 2020, the oyster reef covered an area of 42,000 m2 and was characterized by elevations ranging from −1.14 to −0.066 m above sea level (ASL). Markert (2020) categorizes the reef as a complex reef with a high oyster density. The biomass of the entire reef is estimated as total wet weight of M. gigas TWWM.gigas = 1,400 t and of M. edulis TWWM.edulis = 150 t (unpublished data). The local transformation from a mussel bed to an oyster reef is well documented (Wehrmann, 2006; Markert, 2020). First Pacific oysters on the former mussel bed Kaiserbalje with shell length >25 mm were found in 2004 with mean abundances of less than 10 individuals per m2 reef area (area covered by bivalves plus internal sediment areas) whereas no oysters have been found there in 2003. During the following years, the abundances first increased exponentially (2005: ∼120 inds./m2; 2007: ∼215 inds./m2; 2008: ∼240 inds./m2; own data) before reaching a “plateau-like” status where values slightly fluctuate on a high level. This development in population dynamics was in general accordance with the overall development in the central Wadden Sea after the invasion passed through the region in an eastward direction. With the beginning of this study, mean abundances of oyster were ∼360 inds./m2 representing a biomass of 21.7 kg/m2 live wet weight (LWW) whereas the blue mussels, now part of the associated benthic fauna, show abundances of ∼620 inds./m2 and 5.1 kg/m2 LWW (recalculated for comparison to the reef area, i.e., area covered by oysters and internal sediment patches).
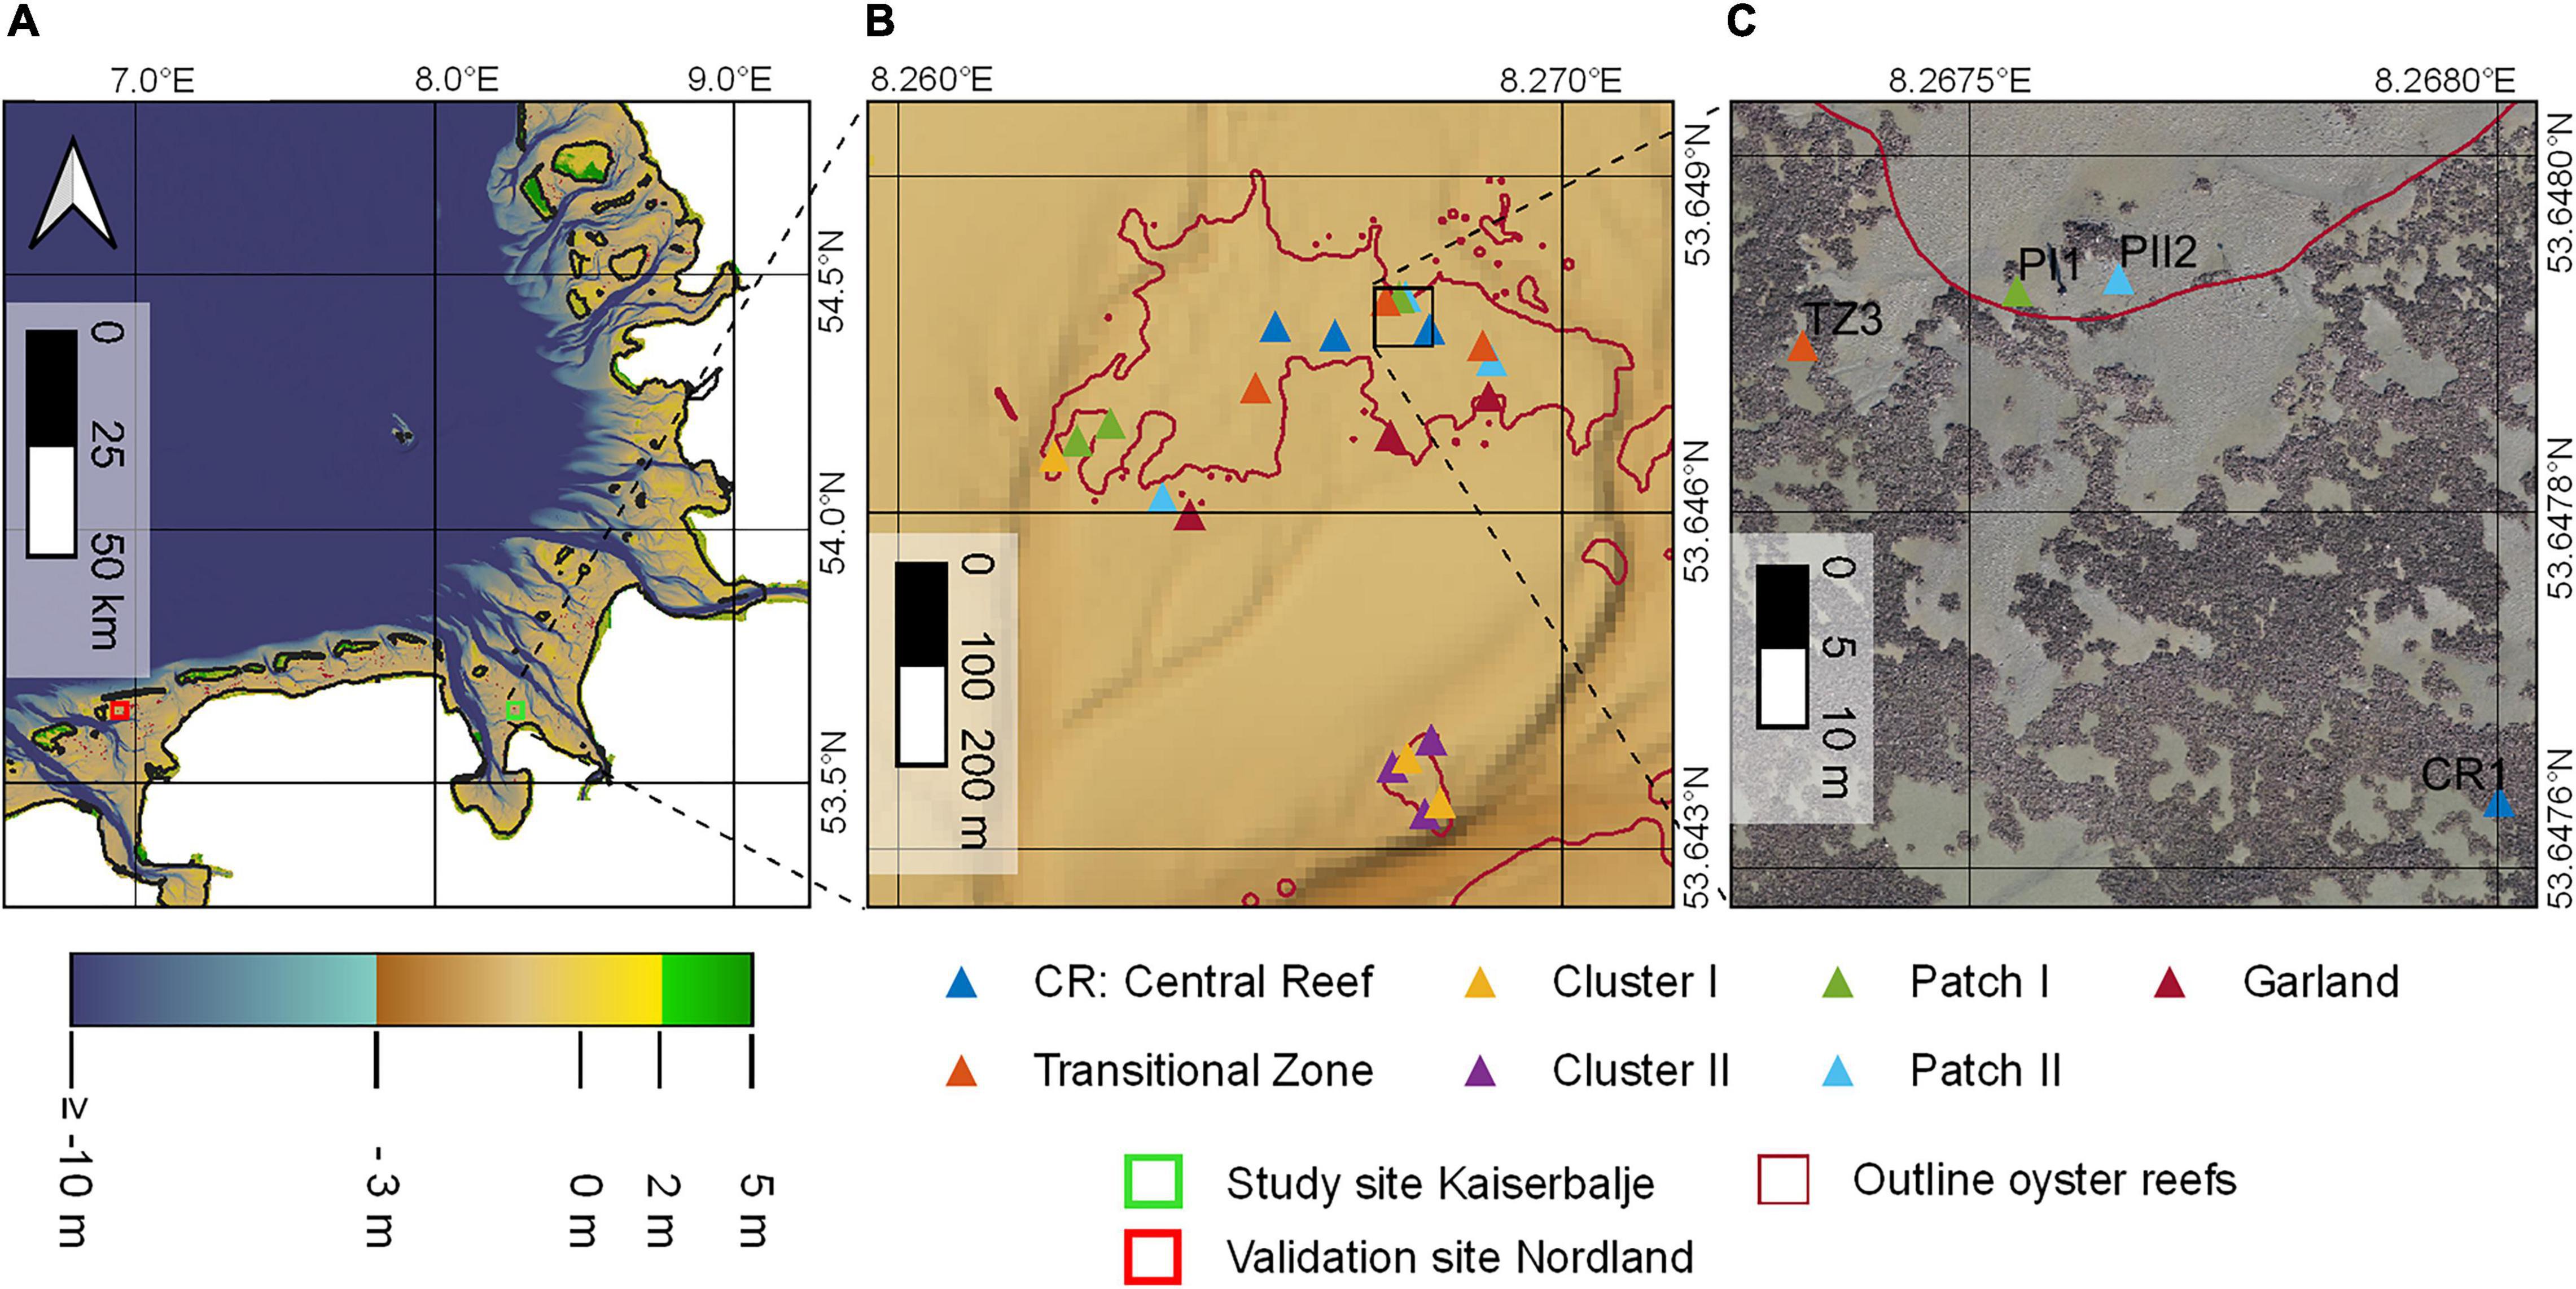
Figure 2. (A) A map showing the bathymetry of the Wadden Sea in the German Bight (Sievers et al., 2020), the study site Kaiserbalje (green square) and the validation site (red square). (B) A map showing the study site oyster reef Kaiserbalje. The reef outlines are marked in magenta (Nationalparkverwaltung Niedersächsisches Wattenmeer, 2021). The triangles illustrate sampling locations with varying colors for each structural class, respectively. (C) An orthomosaic recorded in spring 2020 showing a section of the study site as an example for the complex surface structures.
Proposed Structural Classification
This work proposes a structural classification within and in the surrounding of oyster reefs; the remainder of this work will test its applicability. Based on initial visual on-site observations, seven structural classes are proposed: Central Reef, Transitional Zone, Cluster I, Cluster II, Patch I, Patch II, and Garland. These classes are characterized by varying properties such as shape, oyster coverage and orientation as well as sediment gaps between individual oysters and sediment coverage (Figure 3 and Table 1). Moreover, the structural classes can be subdivided into surfaces with homogenous oyster coverage (Central Reef, Transitional Zone), surfaces with dense agglomerations of oysters (Cluster I and Cluster II) as well as isolated and enclosed shapes (Patch I, Patch II, and Garland).
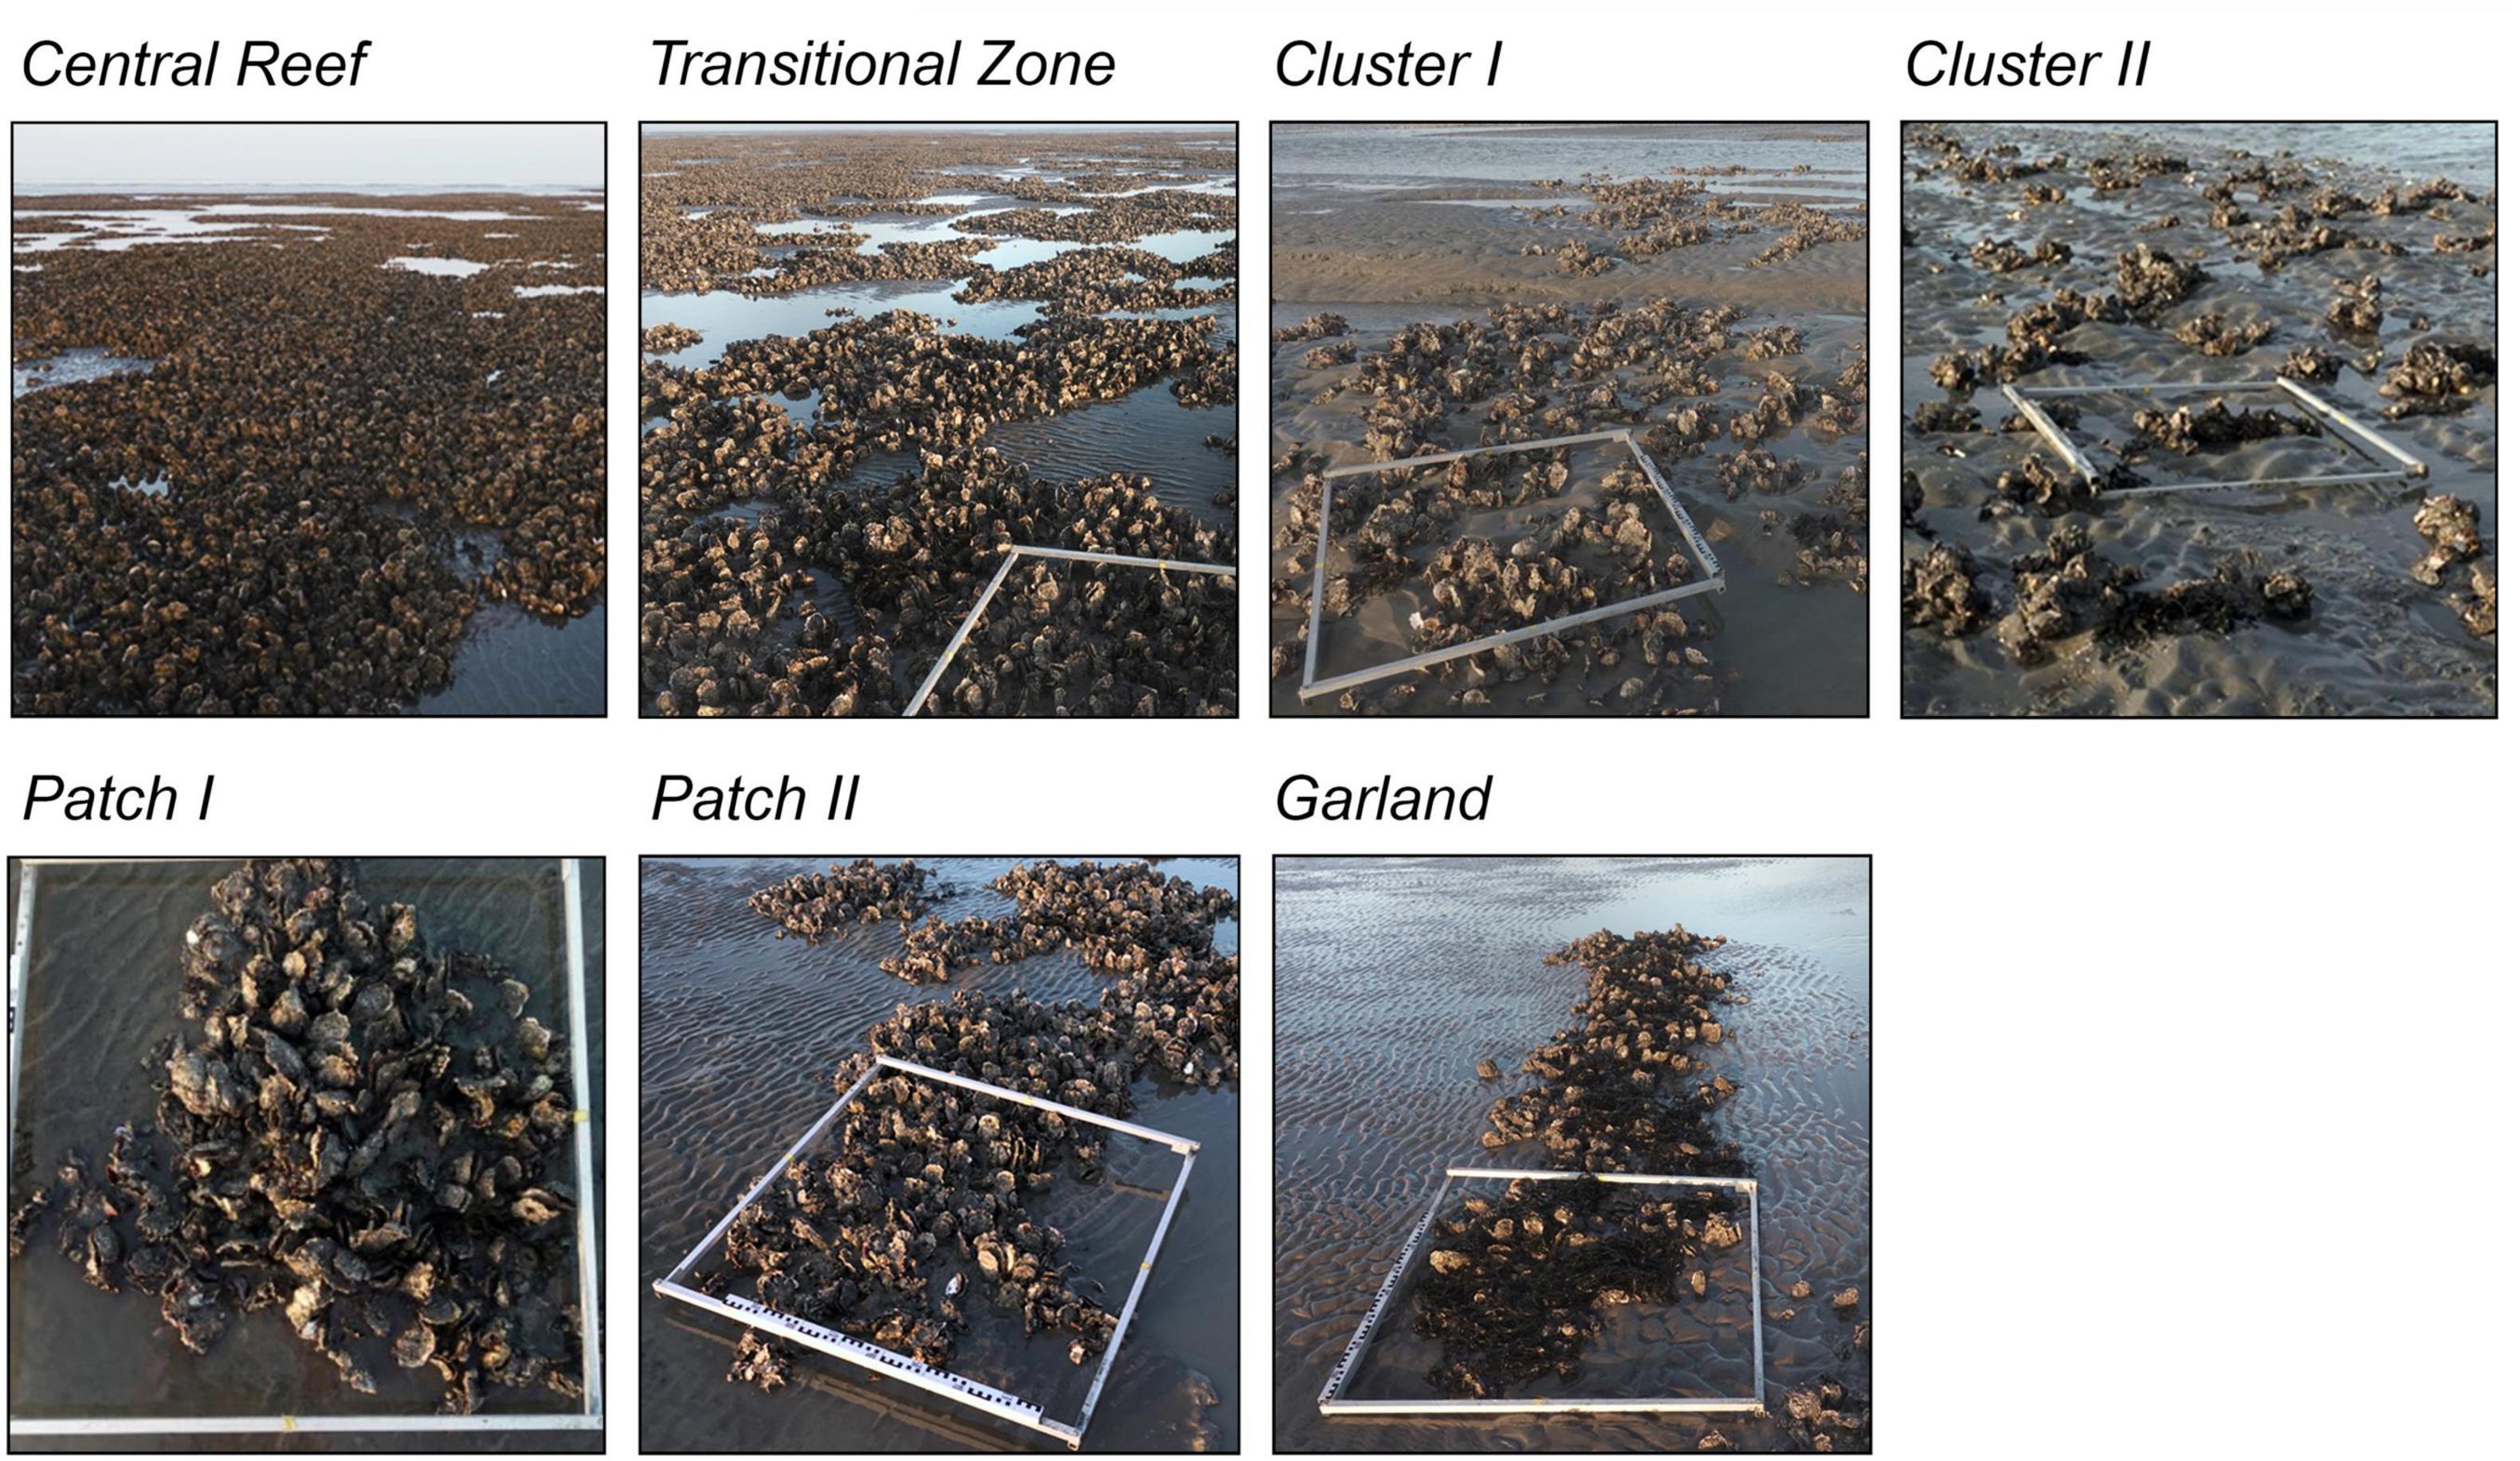
Figure 3. Examples of the proposed structural classes found during the initial observation phase at the study site: Central Reef, Transitional Zone, Cluster I, Cluster II, Patch I, Patch II, and Garland. The gray frame illustrates 1 m2.
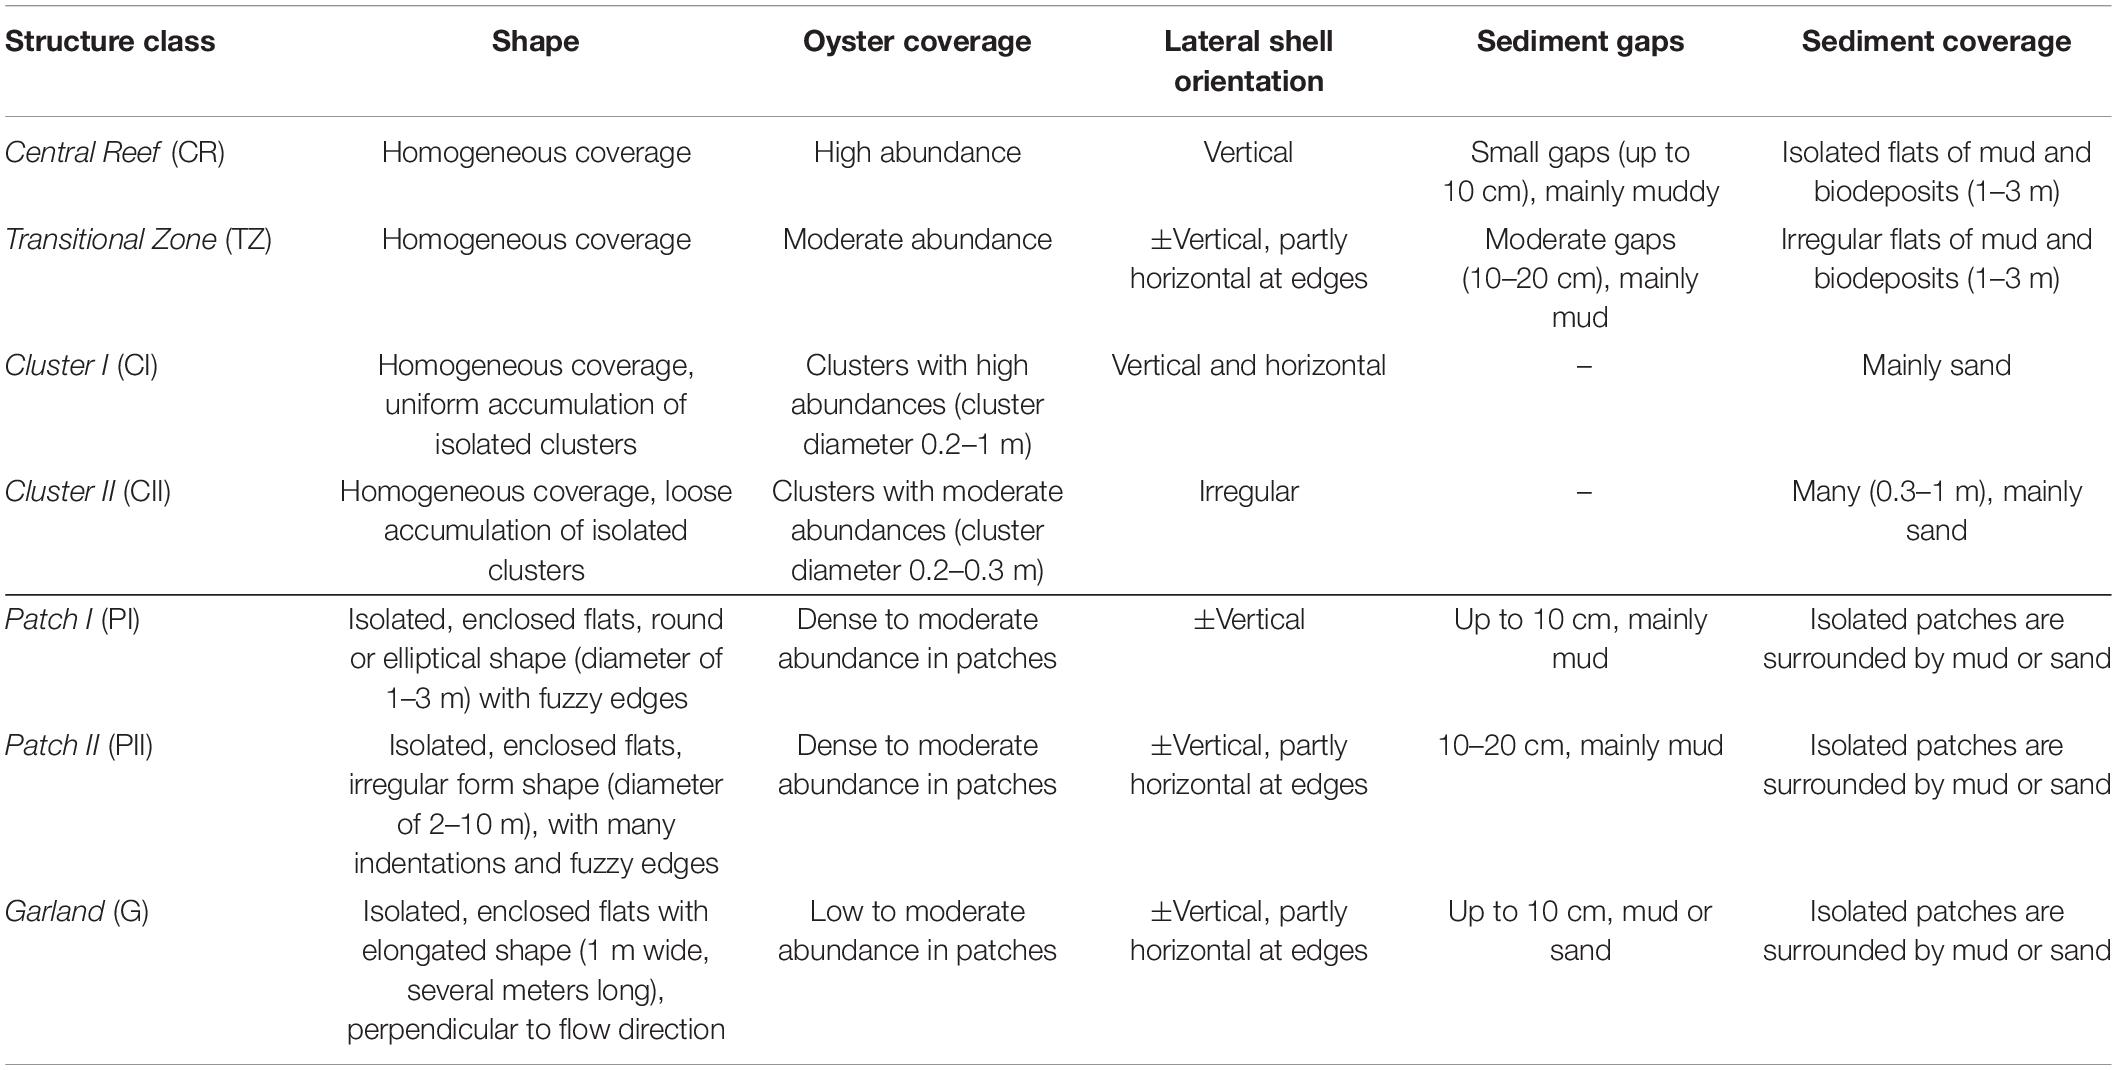
Table 1. Descriptive parameters of the proposed structural classifications.
Data Collection and Processing
A total of 21 topographical samples were collected at distinct locations within the study site (Figure 2). For each proposed structural class, three samples were arbitrarily identified and visual determination on a map prior to the field campaigns ensured that the sample locations were evenly distributed over the entire reef. The samples are named after an abbreviation of their respective proposed structural class and a number (cf. Table 1).
Structure-from-motion photogrammetry, a non-destructive method, was used to generate DEMs as in numerous field studies before (Westoby et al., 2012; Leon et al., 2015; Micheletti et al., 2015; James et al., 2017; Morgan et al., 2017; Cullen et al., 2018; Verma and Bourke, 2019). The method allows for a rapid and accurate generation of DEMs of complex surfaces (see Figure 4). A rapid measurement was necessary for this study, as the areal exposure time of the oyster reef only allowed for a short timespan to collect the photographs and further data (3–4 h). Following the identification of a suitable sample, a surface of roughly 1.5 m2 was photographed by a CANON EOS 750D camera using two lenses with focal lengths of 18 mm (Canon EF-S 18–135 mm f/3.5–5.6 IS STM) and 50 mm (Sigma Art 50 mm 1:1.4 DG HSM), respectively. The photographs were recorded as RAW-files with 24 megapixel (6000 × 4000 pixel). For each sample, approx. 200 photographs were taken of which approx. 100 were taken at a distance of around 1 m in a circular arrangement to assure high overlaps between the frames (>90%) and another 100 pictures were taken at a close-range (<0.5 m) to increase details of undercuts and tips of the shells (Figure 4B); similar to Cullen et al. (2018) and Verma and Bourke (2019). L- and I-shaped reference bars consisting of marine plywood boards with fixed distances in x, y, and z directions were equipped with visual targets (ground control points) and checkerboards to facilitate the image processing by the software Agisoft Metashape Professional (v. 1.7.3). Three reference bars were utilized suggested to impede systematic errors as, e.g., doming deformation (James and Robson, 2014). GPS measurements were taken at the reference points on the reference bars to relate the generated DEMs in a global coordinate system. A Stonex-9000-dGPS was used with a horizontal accuracy of 0.008 m and a vertical accuracy of 0.015 m.
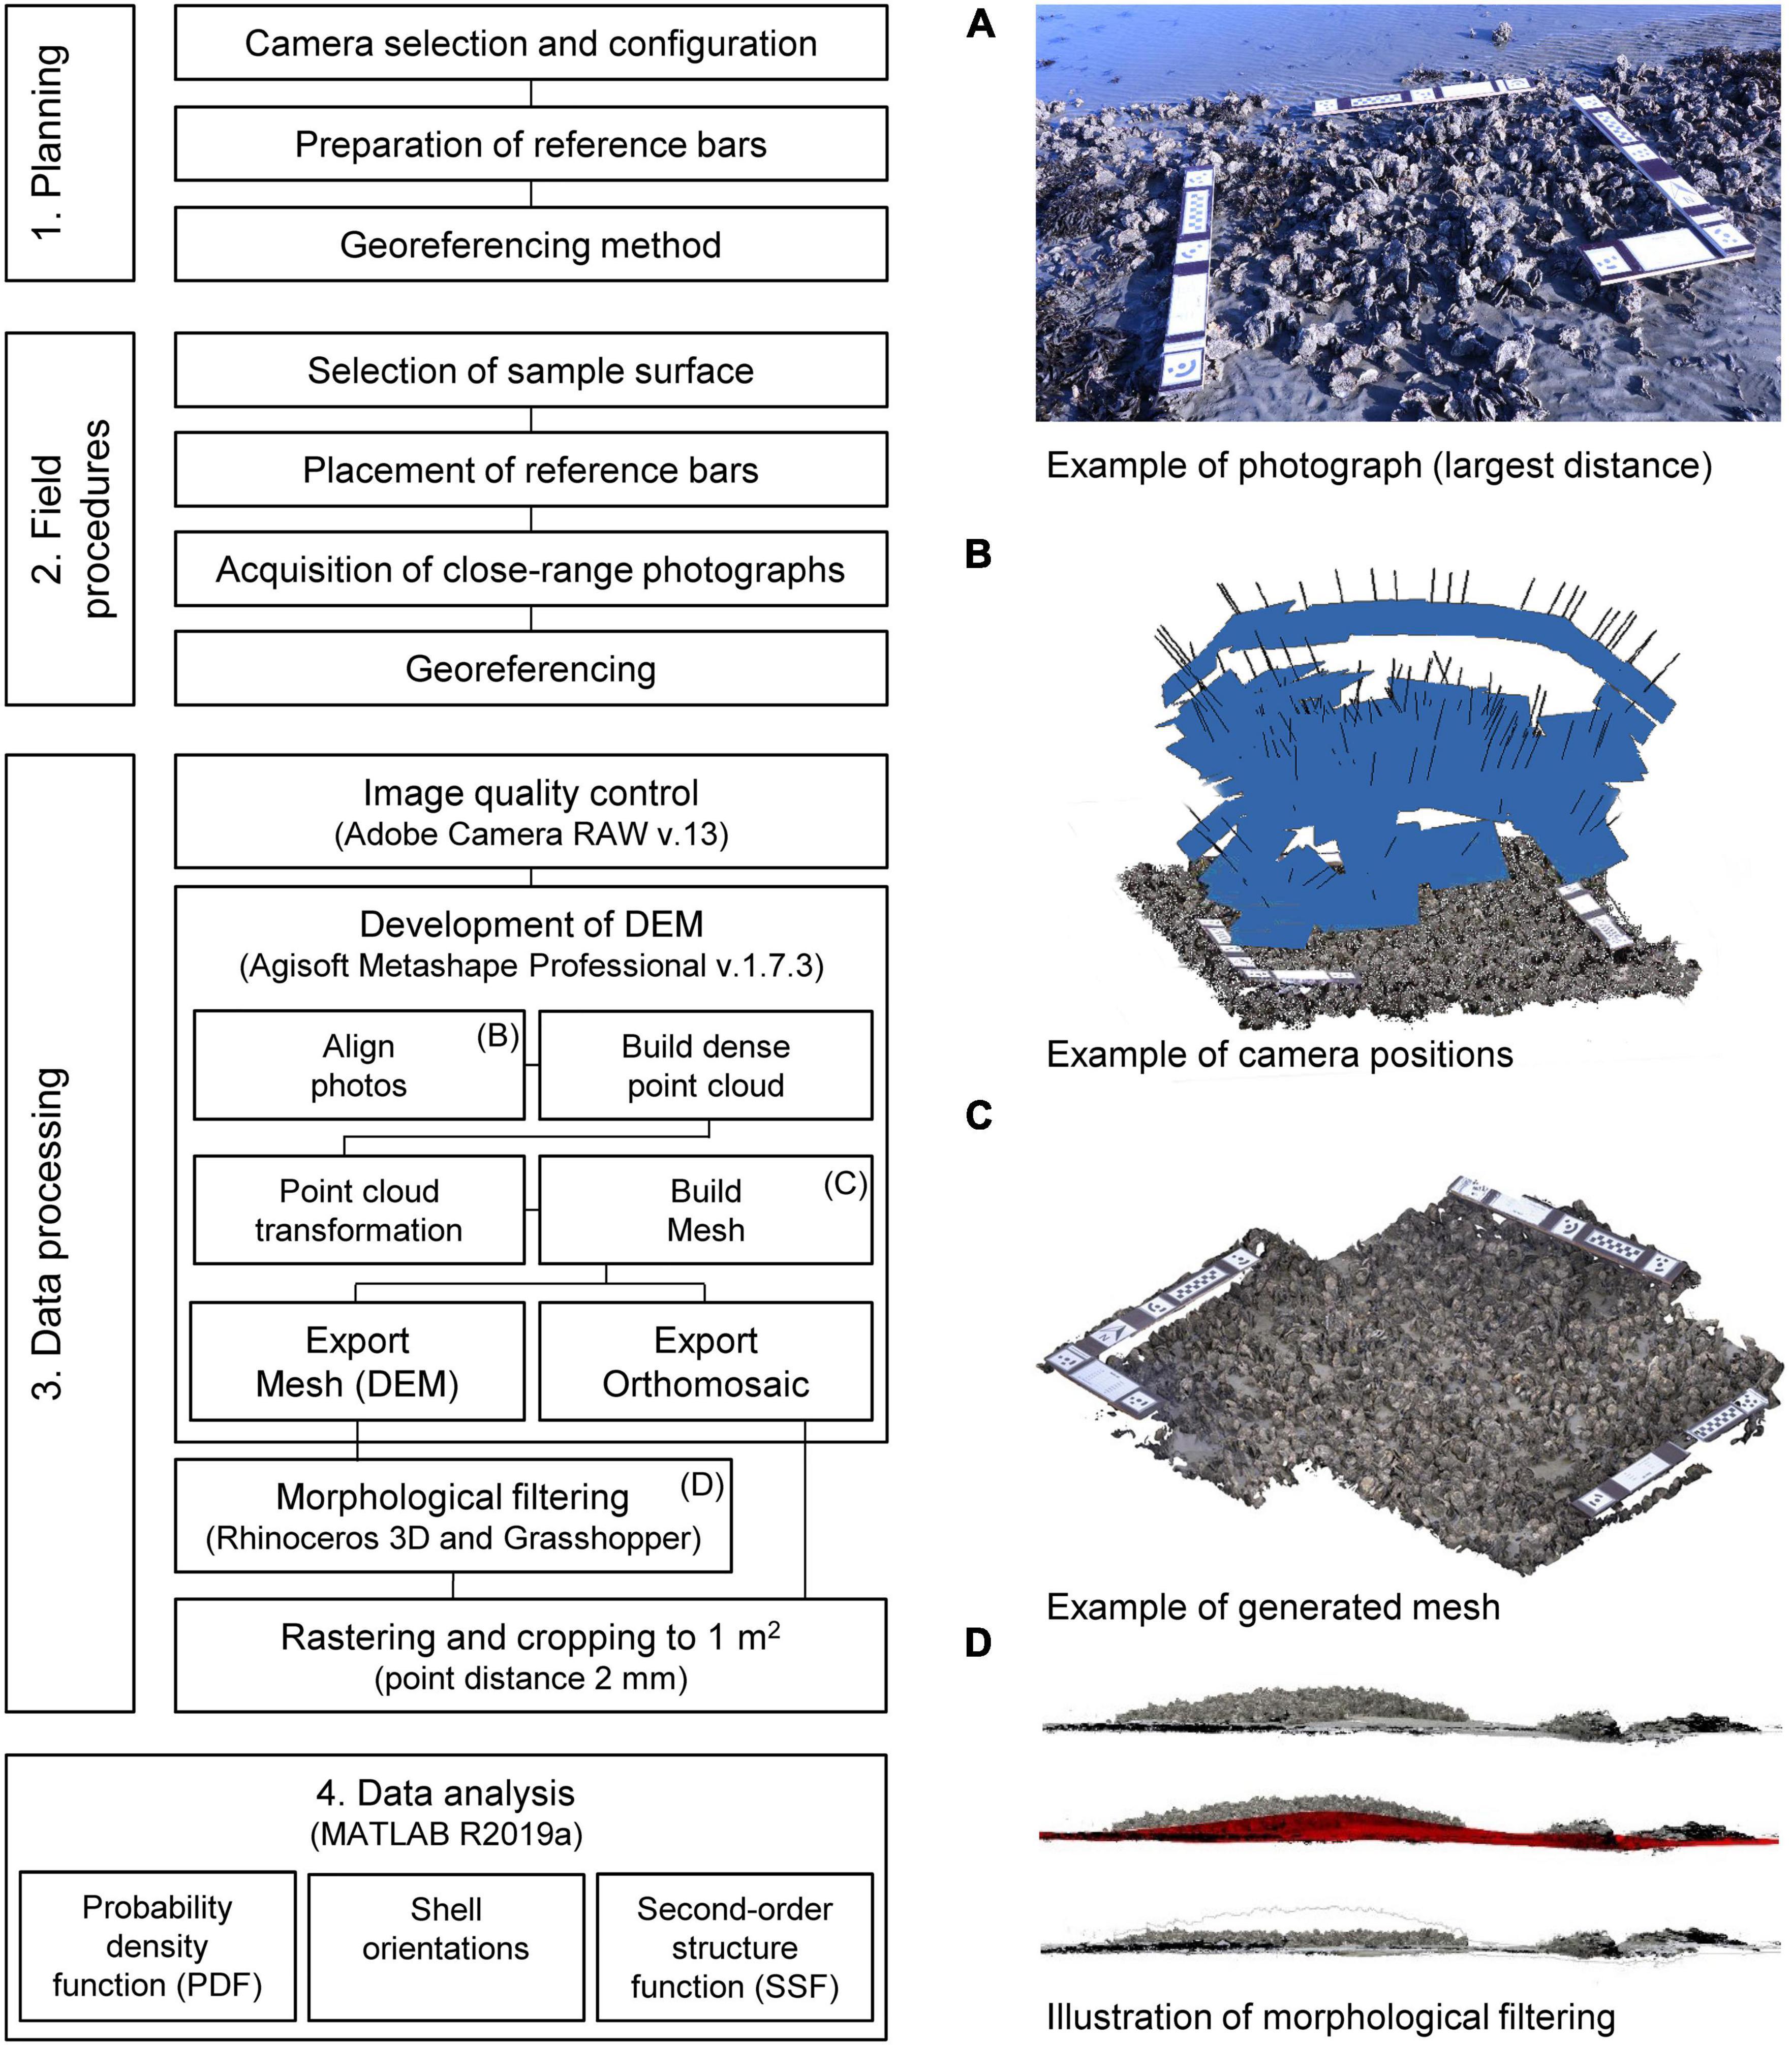
Figure 4. A schematic diagram of the workflow for the development of digital elevation models (DEMs) and subsequent analysis. (A) Example of a photograph used for the SfM photogrammetry (largest distance). (B) Illustration of the camera positions in Agisoft Metashape. The blue patch and black lines illustrate the position of the camera and their orientations. (C) Example of a generated mesh including the reference bars before cropping. (D) Illustration of the morphological filtering. The NURBS surface is illustrated in red.
The images were processed as follows: (1) Image quality was controlled to eliminate blurred and out-of-focus photographs. Colorcasts were removed using Adobe Camera RAW (v.13). (2) Meshes (DEMs) and orthomosaics were generated from the photographs using Agisoft Metashape Professional (v. 1.7.3) [see Leon et al. (2015) or James et al. (2017) for details]. Highest settings were applied during alignment of photos, building of dense clouds, meshing as well as export. The resulting dense point clouds had on average 100 million data points with an average total error of ±1.6 mm within the meshes. (3) A morphological filter was applied to isolate the species-related roughness from the superordinate morphology. Separation of surfaces in different orders of magnitude, also referred to as separation in waviness, roughness and micro-roughness profiles, is a common method in roughness determination (Raja et al., 2002; Le Goïc et al., 2015) and has been applied in geographical sciences (Liu et al., 2018). Hence, a morphological filter was developed in Rhinoceros 3D (v.6) and Grasshopper, a visual programming language environment within the CAD program Rhinoceros 3D. A non-uniform rational B-spline (NURBS) surface was formed after the topography of the DEM and approximated by a set of manually distributed (digital) reference points on the visible sediment surface. The number of reference points was dependent on the proportion of sediment-covered parts of the DEM. The NURBS surface was then subtracted from the mesh (Figure 4D). Differences in surfaces level elevation between Δz = 8–120 mm over the total area were eliminated. (4) Finally, rasterized point grids with point spacing of 2 mm and cropped to a surface area of 1 m2 were exported for the analysis in MATLAB R2019a.
Figure 5 shows the DEMs of the 21 samples using their mean elevation as reference height z = 0 mm. The visualizations of the Central Reef, Transitional Zone, and Patch II samples show homogeneous distributions of surface level elevations for the entire section. For the Cluster I and Cluster II samples, concentrated agglomerations of the surface level elevations can be observed as expected (cf. Table 1). While the samples PI2, G1, and G3 show homogeneous distributions of the surface level elevations, the samples PI1, PI3, and G2 show inhomogeneities. In these cases, the surface area of the isolated patches is smaller than 1 m2. For the statistical analysis, a section of the surface with a homogeneous distribution of the surface level elevations is necessary. The analyzed surfaces are, hence, reduced until the edges of the patches and the surrounding bare sediment are eliminated and a homogenous surface remains (the eliminated area is illustrated in gray boxes in Figure 5).
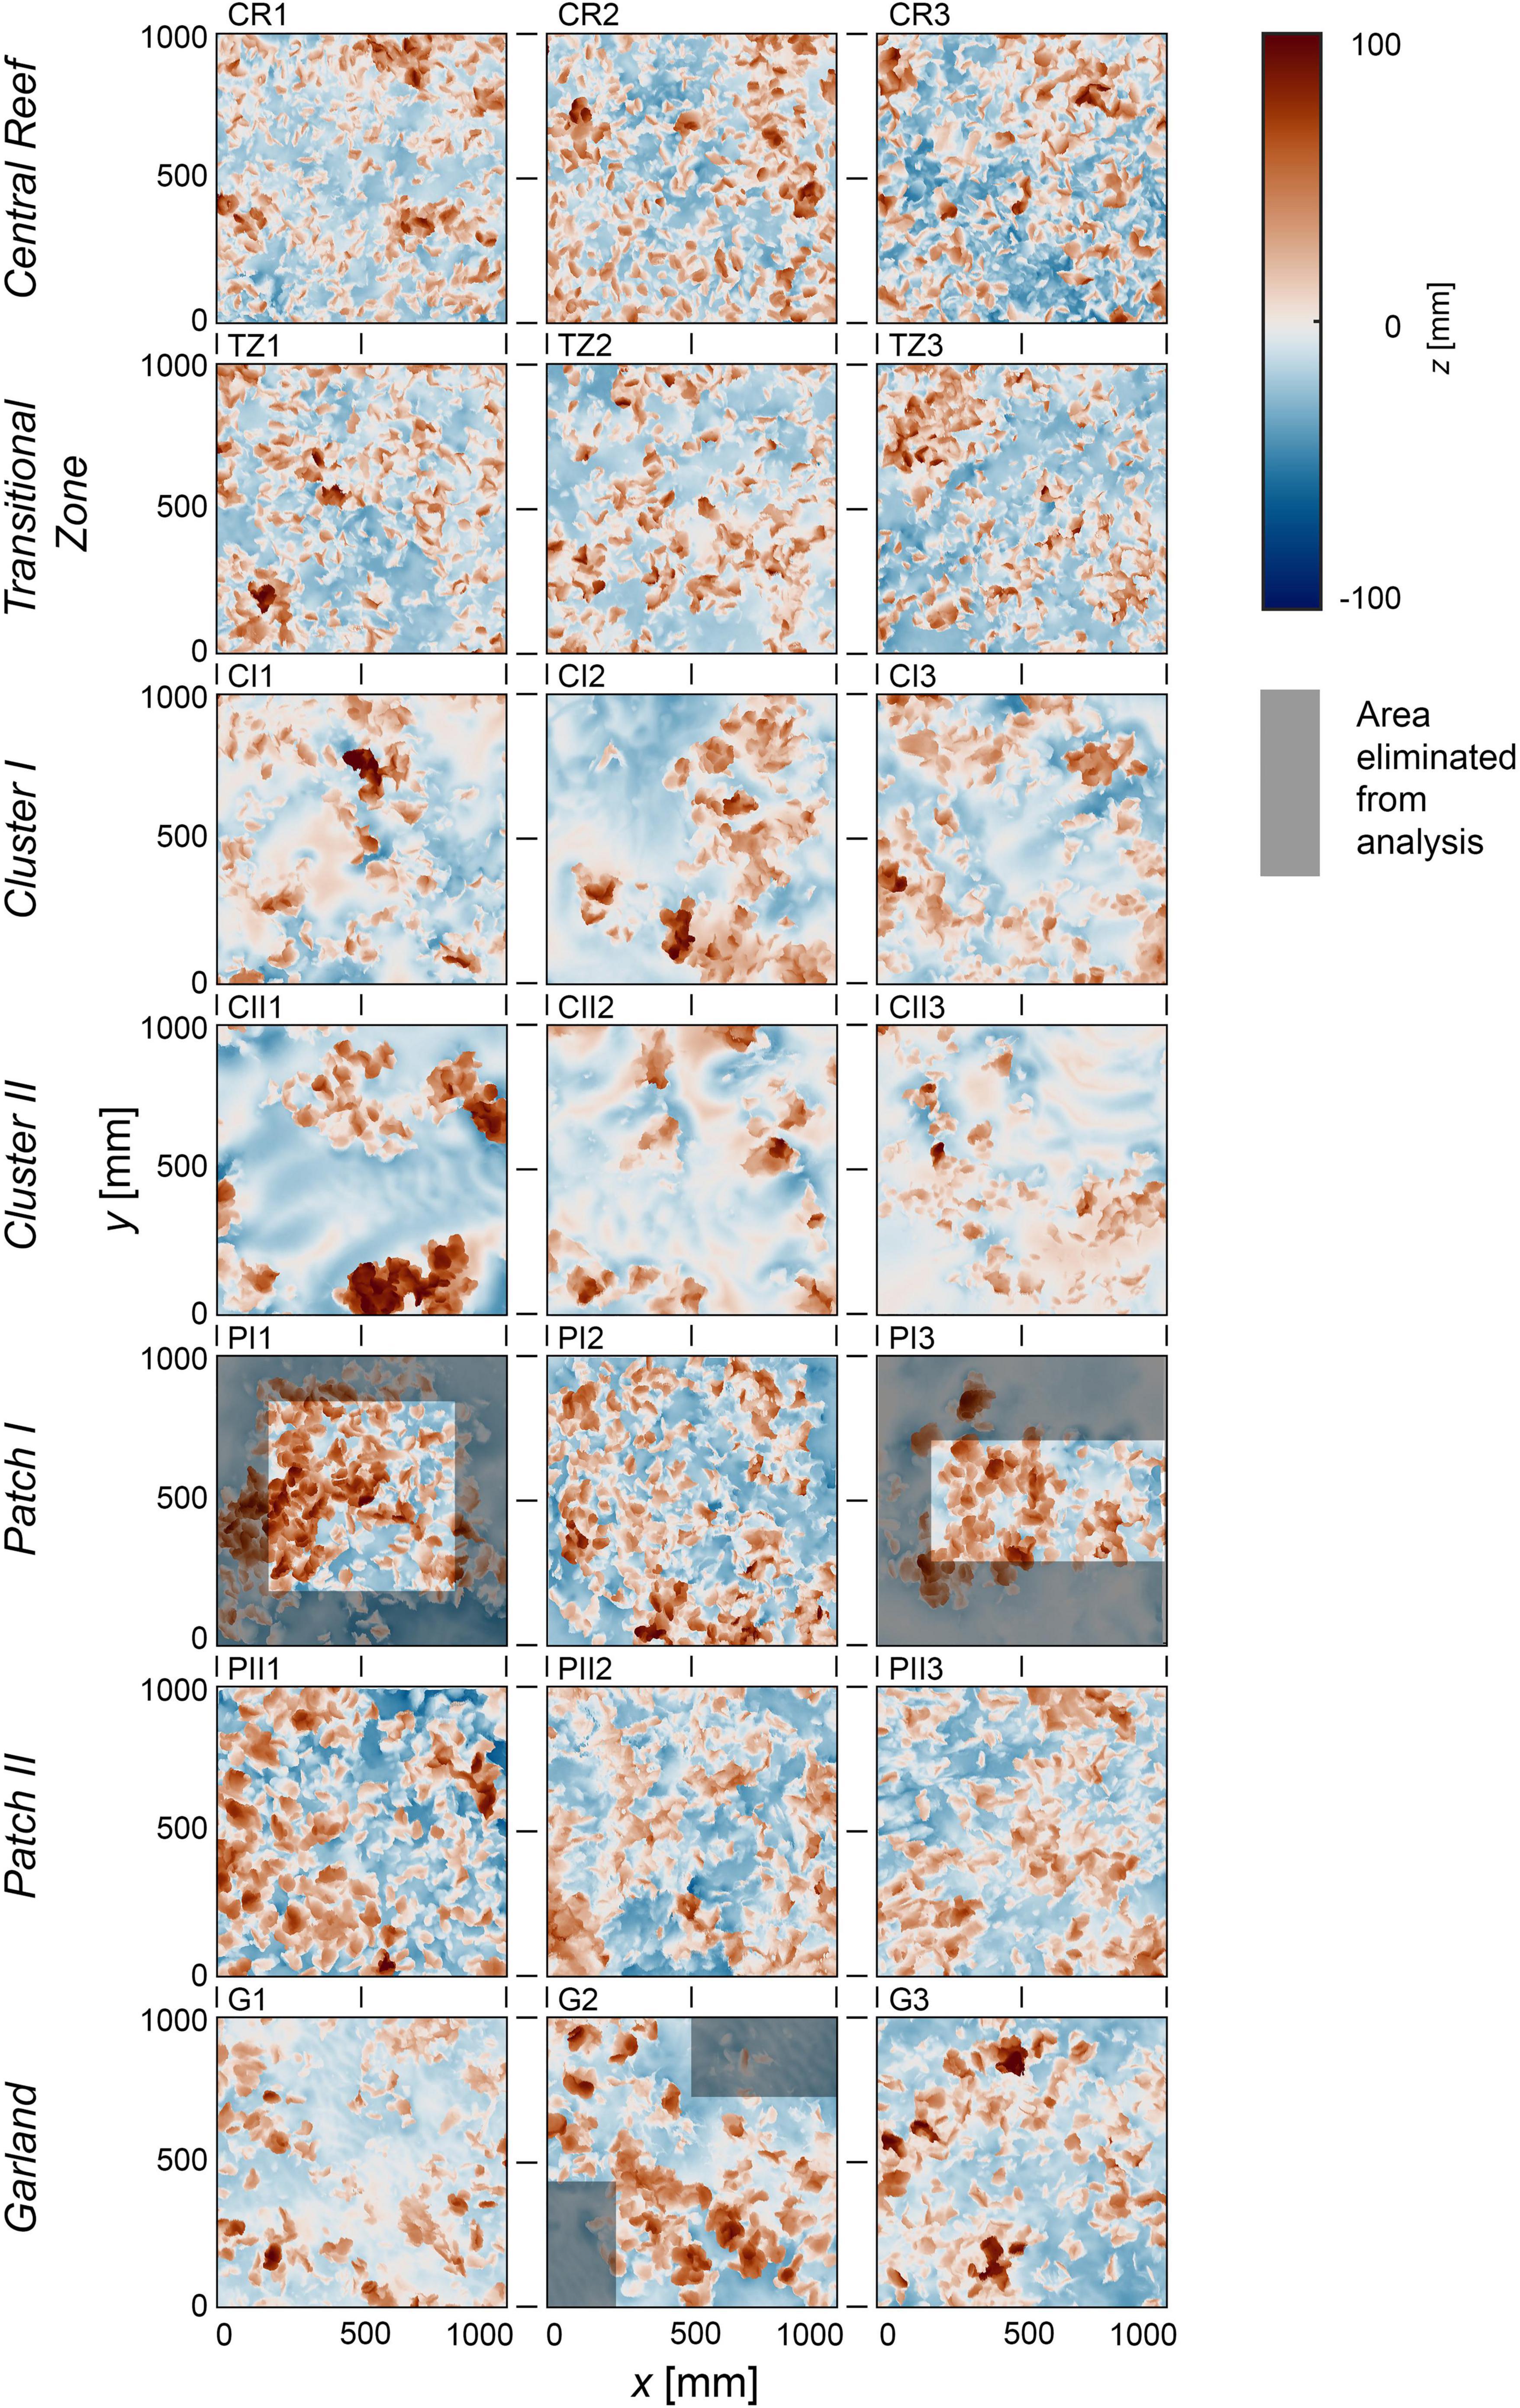
Figure 5. Visualizations of the digital elevation models (DEMs) of the 21 samples in top view, sorted by proposed structural classes. The x-, y-, and z-axis are in mm. The color scale (Crameri, 2018) indicates surface level elevations in z centered around the zero mean. The point of origin (x, y) = (0 mm, 0 mm) has been defined as the southwest corner of the section. All samples are oriented with north on top. Area in gray boxes illustrate the areas that have been eliminated to assure homogeneous distribution of z in the analyzed section.
Data Analysis
The data analysis used in this work aims to provide parameters describing the topography of oyster reef surfaces that pose significant influences on the hydraulic bed roughness. These parameters include the statistical moments derived from the probability density functions (PDFs) of the surface level elevations, the vertical porosity distribution as well as abundance, orientation and clustering.
Probability Density Functions
Probability density functions were determined from the DEMs of the sample surfaces similar to, e.g., Coleman et al. (2011) and Bertin and Friedrich (2014) (cf. Figure 4). Smoothed histograms using bins of 1 mm width were applied, which cover the vertical range of the surface level elevations. In addition, statistical parameters were determined that describe the geometrical bed roughness. The total roughness height kt, describing the distance between the roughness peak to the trough, was defined as the 99%-percentile minus the 1%-percentile (P99%-P1%) to eliminate outliers, as suggested by Aberle et al. (2008). The root-mean-square roughness height, which is the standard deviation σ around a zero mean, is a second measure of the geometrical roughness height (Chung et al., 2021). The third central moment, the skewness Sk is a measure for the asymmetry in the surface elevation distribution (Bendat and Piersol, 2010). Surfaces with protruding elements are positively skewed, also referred to as right-skewed, while pitted surfaces are negatively- or left-skewed (Jelly and Busse, 2018). The fourth central moment, the kurtosis Ku, describes the extremity of outliers in the tails of the distribution (Westfall, 2014). Further, integration of a PDF yields the cumulative distribution function (CDF) which reveals the vertical porosity distribution Φ (Aberle, 2007; Navaratnam et al., 2018). The bulk porosity Φbulk is the total fraction of voids over the total volume described by the lengths of the sections in x and y as well as the height between the lowest and highest surfaces elevation in z.
Abundance and Orientation
The abundance, as defined in this work, describes the number of oyster individuals per m2 protruding from the sediment cover. It was determined visually by identifying the individual oyster shells from the orthomosaics (Figure 6). No differentiation was made between live and dead oysters, but only individuals with both valves present were counted. Further, widths w (the short axis of the individual shells) and dorso-ventral orientations ϕ of the individual oysters were recorded. The dorso-ventral orientation is the rotation around the long axis (length) of oyster shells (García-March et al., 2007).
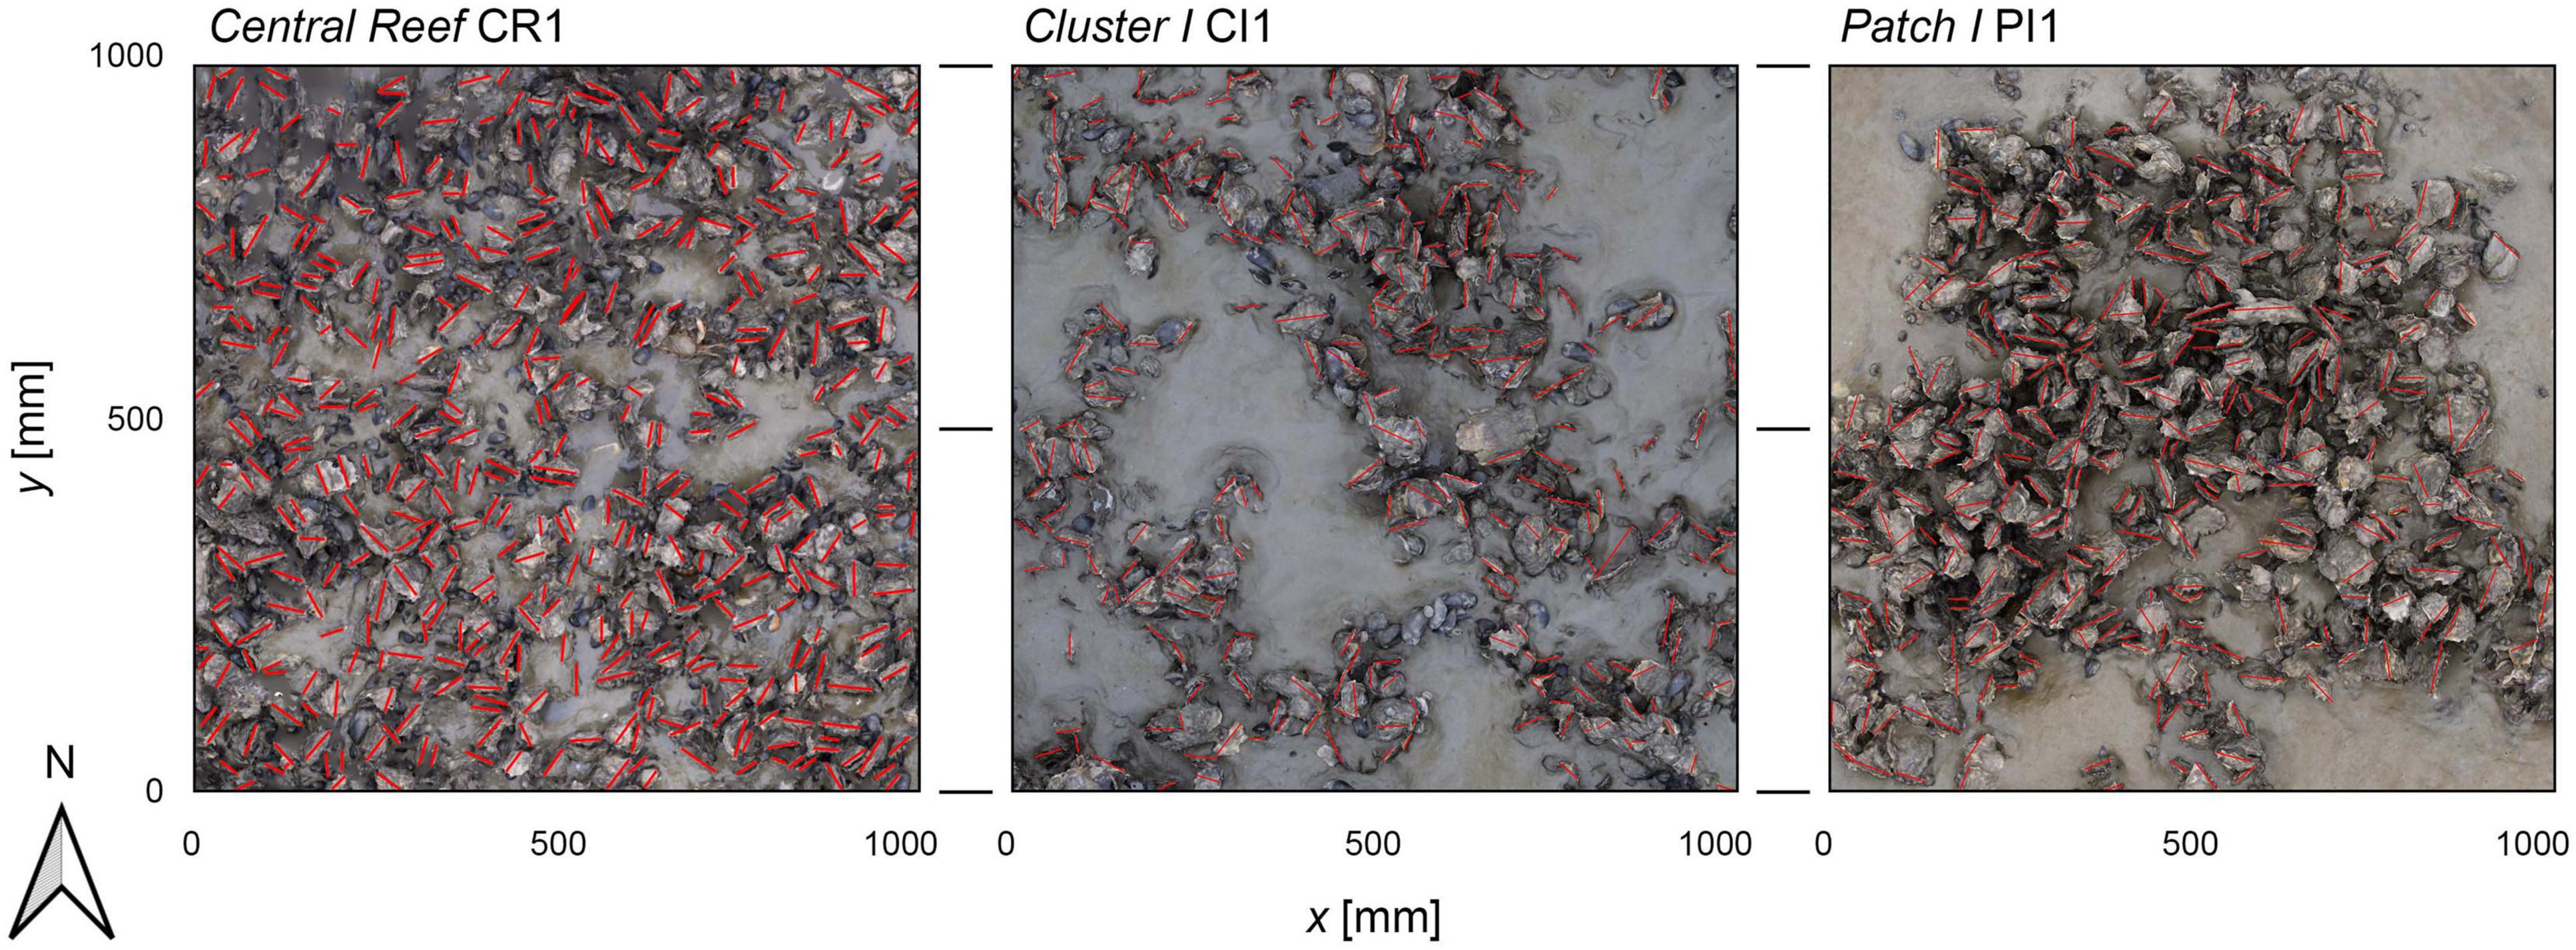
Figure 6. Three examples of the orthomosaics used to derive the abundance and the dorso-ventral orientation. The x- and y-axis are in mm. Red lines mark the short axis of the identified individual oyster shells. The panels show the samples of Central Reef CR1, Cluster I CI1, and Patch I PI1. Each photo covers 1 m2 with the upper side facing north.
Second-Order Structure Functions
Two dimensional second-order structure functions (2D-SSF) represent a tool to identify spatial correlation lengths and correlation patterns of surfaces (Nikora et al., 1998; Nikora and Walsh, 2004; Aberle and Nikora, 2006; Aberle et al., 2010; Bertin and Friedrich, 2014; Qin et al., 2019; Wang et al., 2020). In this work, 2D-SSFs were used to identify characteristic spatial scales related to roughness elements and their anisotropic behavior. A 2D-SSF is defined as:
where lx = nΔx and ly = mΔy are the spatial lags; Δx and Δy are the sampling intervals; N and M are the number of observed elevation points; and z is the surface level elevations at the coordinate in x and y, respectively.
Results
In the following, the analysis of the reef topographies shown in Figure 5 is presented. First, topographical parameters derived from the statistical analysis are considered. Next, the results of the analysis on directionality and clustering are shown. In both steps, the proposed structural classification is tested against the suitability of the proposed classes. The proposed structural classification is then reassessed and its validity beyond the study site is verified.
Topographical Parameters
The topographical parameters, including the location within the oyster reef, the surface level elevations and their distributions, reveal differences between the respective structural classes.
The samples of Central Reef and Transitional Zone are located toward the center, while Garland, Patches, and Cluster are found at the margins of the reef (cf. Figure 2 and Table 2). Further, the samples of Central Reef are located at highest elevations (−0.13 to −0.08 m ASL), followed by Transitional Zone, Garland, Patches, and Cluster I and II samples (−0.93 to −1.14 m ASL) as the lowest.
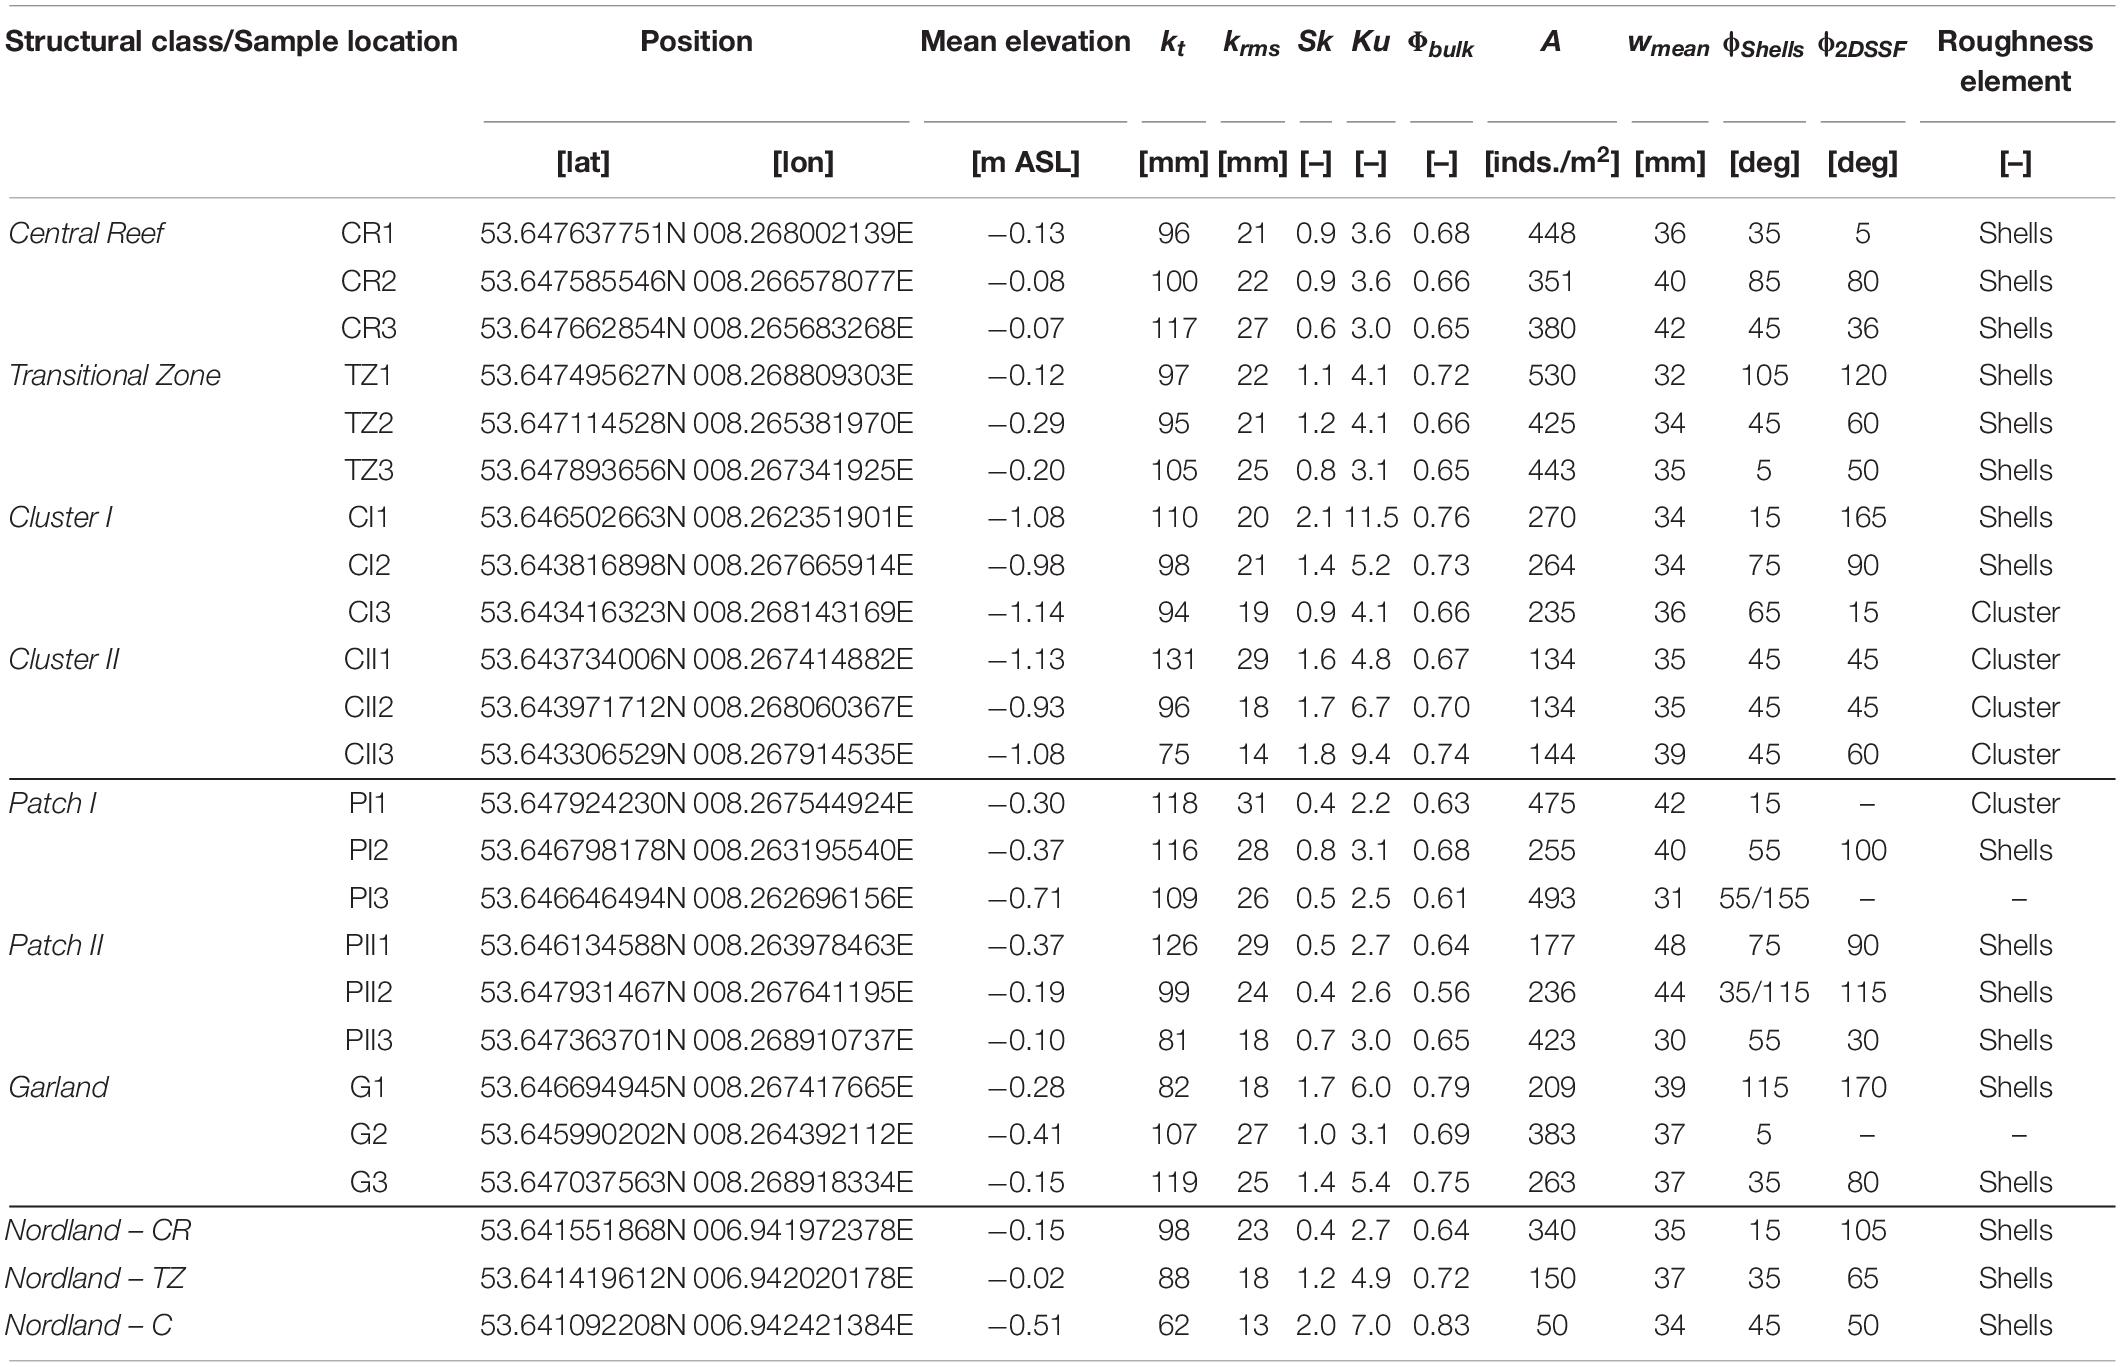
Table 2. Summary of the results of the statistical analysis, where kt is the total roughness height, krms is the root-mean-square roughness height, Sk is the skewness, Ku is the kurtosis, Φbulk is the bulk porosity, A is the abundance, wmean is the mean width of the oyster shells, ϕShells is the major direction of the oyster shells and ϕ2DSSF is the orientation of the mean axis of the area of high correlation resulting from the second-order structure functions.
All distributions are bell shaped but not normally distributed (tested by Kolmogorov–Smirnov-test; see Figure 7). The PDFs of the samples of each structural class exhibit small deviations between each other with the exception of Garland. Between the structural classes, clear differences can be observed apart from Patch I and Patch II, which show similar distributions. For the Central Reef, Patch I, and Patch II samples, the PDFs reach similar peak values at around 0.02. The peak values of the remaining structural classes increase from Transitional Zone, Cluster I, Garland to Cluster II samples up to 0.05. All distributions are right-skewed varying between Sk = 0.4–2.1 (Table 2) and reach their peak slightly below the zero mean as can be expected for surfaces with protruding roughness elements (Chung et al., 2021). The kurtosis-values scatter from around 3.0 (equal to normal distribution) to 11.5 reflecting strong variations in the shape of the tails of the distributions. The total roughness height kt and the root-mean-square roughness height krms yield similar values across all samples and small deviations. The samples of Garland show largest deviations in the distribution, especially regarding the peak values. Comparing the DEMs of the Garland samples in Figure 5 illustrates that the density of high surface level elevations of G1 is lower than that of the remaining samples, which explains the deviating form of the PDF.
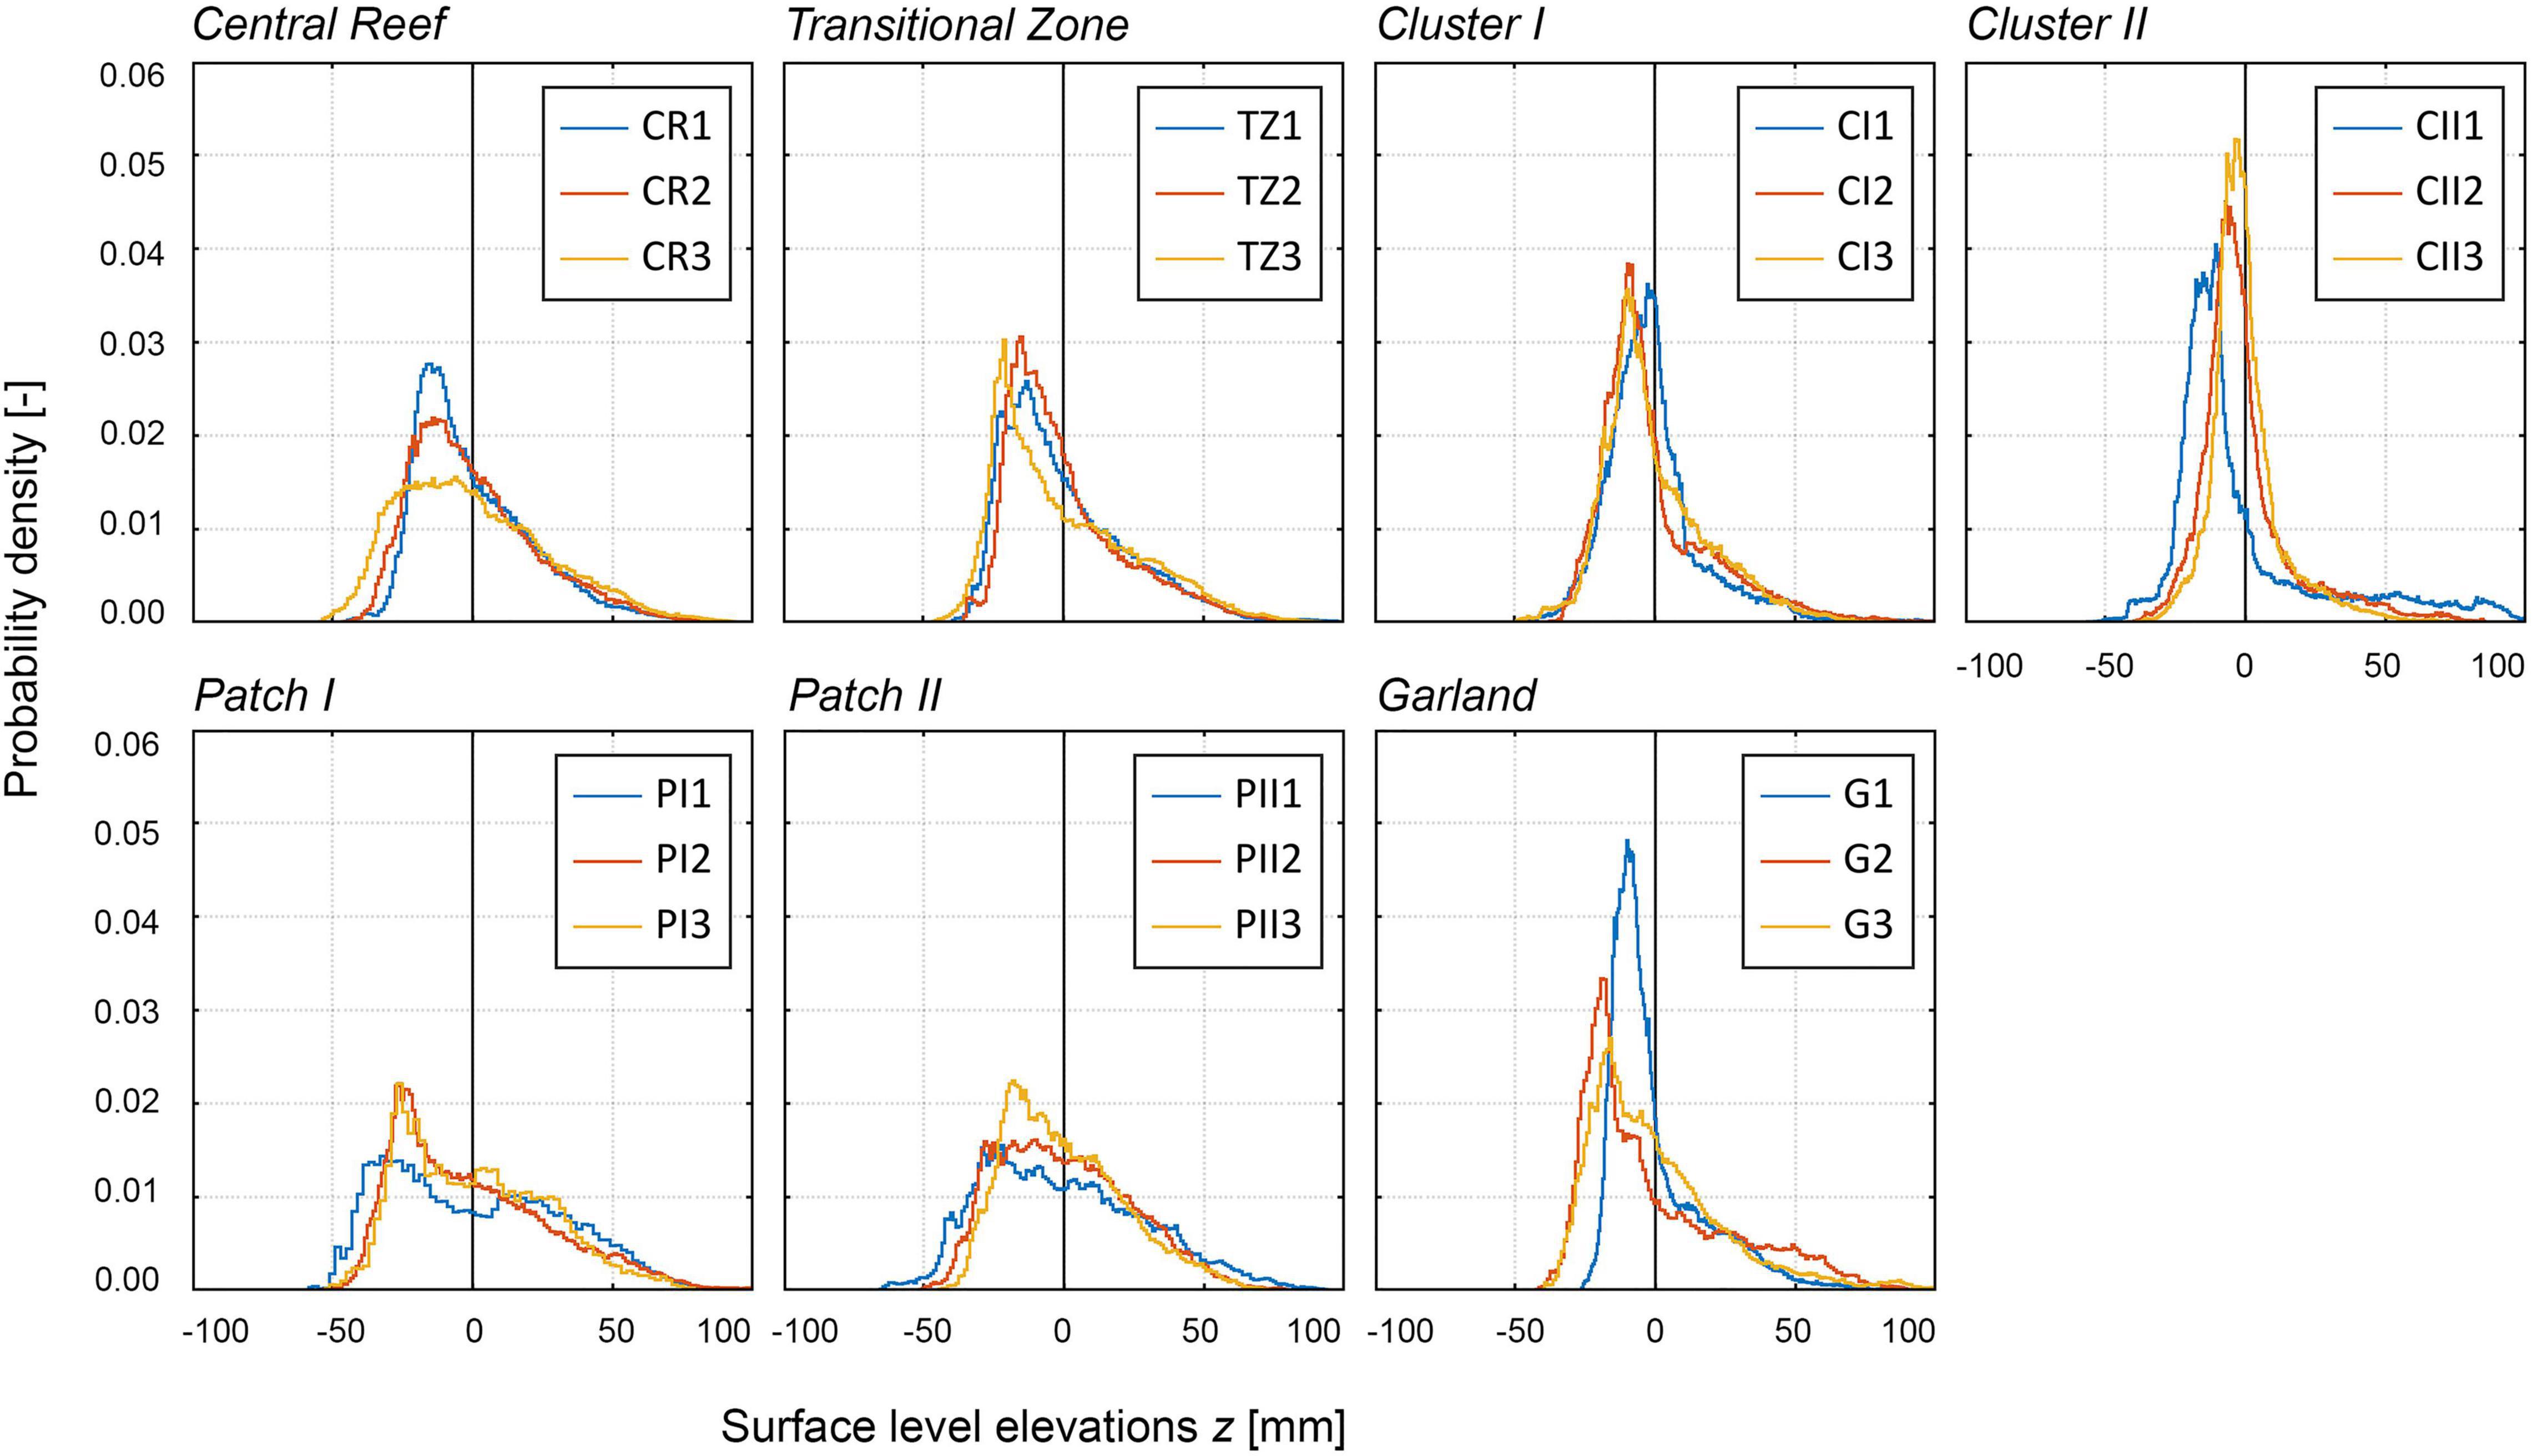
Figure 7. Histograms based on surface level elevation z [mm] illustrating the probability density functions (PDFs) [-] of all samples distinguished by their structural classes. Top row: homogenous structural classes; Bottom row: enclosed structural classes. The PDFs are centered around the zero mean. The colors indicate the individual samples as presented in Figure 5, e.g., blue: CR1, orange: CR2, yellow: CR3, etc.
Table 3 breaks the data down to average values per proposed structural class, further elucidating the class preposition set. Considering only the roughness height parameters kt or krms, no clear trends can be observed for most structural classes. Only the higher variability of kt for Cluster II stands out. The higher statistical moments as well as the bulk porosity, reveal differences across all structural classes. Both Sk and Ku values increase beginning from class Patch I and Patch II, with lowest values, over Central Reef, Transitional Zone, Cluster I, Garland to Cluster II, with highest values. The average statistical parameters of the samples of (1) Central Reef and Transitional Zone, (2) Cluster I and Cluster II as well as (3) Patch I and Patch II reveal strong similarities between the respective classes. The average values of Transitional Zone are slightly larger than those of Central Reef. Between Cluster I and Cluster II as well as Patch I and Patch II no clear differences can be determined. All other samples have larger Ku reflected in the increasing extremity of the positive tail of the distributions. For the Cluster I and II samples, with large Sk and Ku values, also the deviations within samples are significantly higher than for the remaining classes. The average values of the Garland samples lie between Transitional Zone and Cluster I. However, strong deviations between samples can be observed for the statistical moments. The trends observed in Table 3 reflect the shapes of the PDFs in Figure 7.
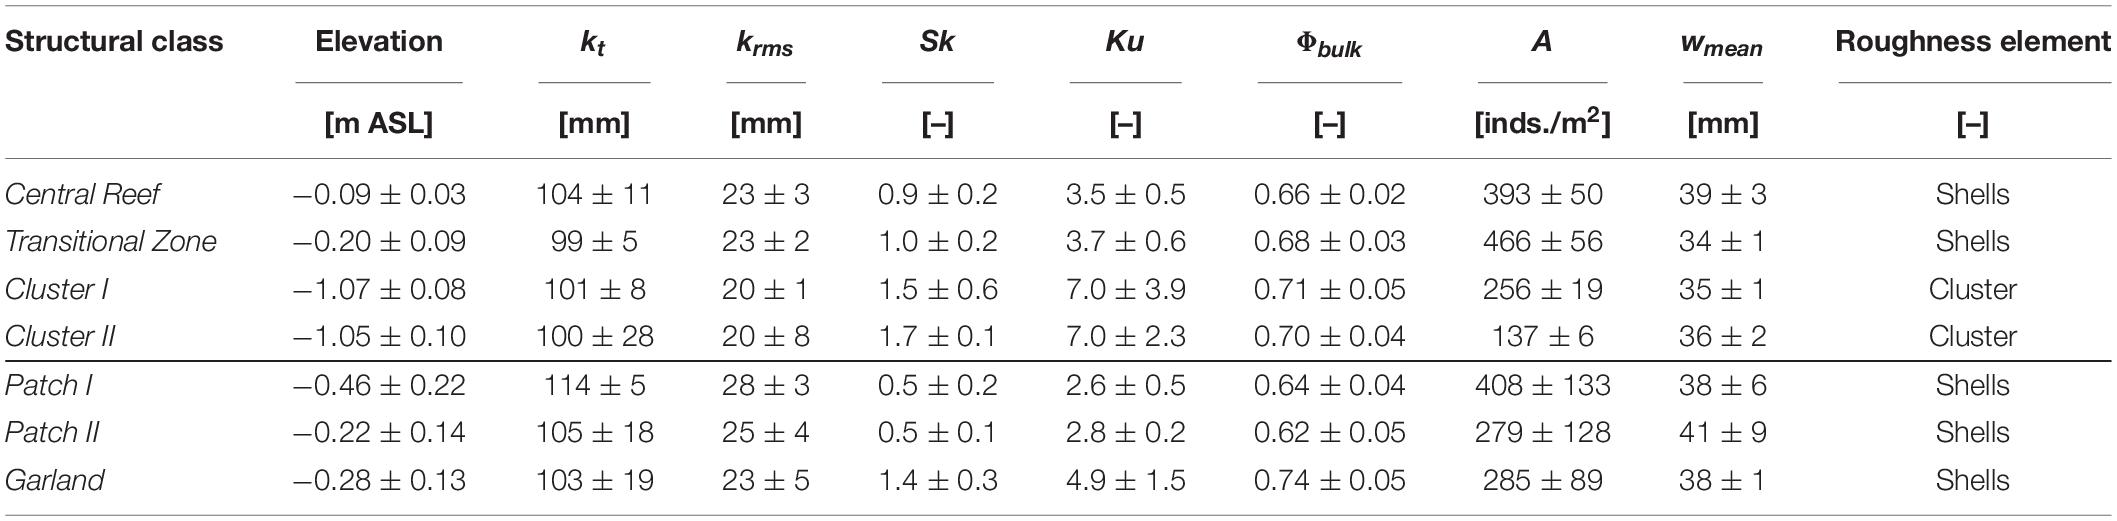
Table 3. Average statistical parameters per proposed structural class, where kt is the total roughness height, krms is the root-mean-square roughness height, Sk is the skewness, Ku is the kurtosis, Φbulk is the bulk porosity, A is the abundance, wmean is the mean width of the oyster shells.
The differences in the shape of the PDFs and the corresponding statistical parameters can be explained by the compositions of the reef topographies. All surfaces are composed of two components, sediment and oyster shells. As the superordinate morphology has been eliminated in the pre-processing (cp. subsection “Data Collection and Processing”), the sediment components have low variations in elevation. The remaining height variations in the sediment surface are mainly due to small-scale current ripples, deposits or scours around individual shells. The oyster shells protrude from the sediment surface resulting in higher elevations and, hence, more pronounced positive tails of the PDFs (Figure 7). It is therefore possible to attribute the right-skewness of the distributions to the oyster shells. The oyster shells are more or less uniformly distributed in samples with high abundances such as Patches I and II, Central Reef and Transitional Zone, and individual shells tend not to peek out from the homogeneous topography. The resulting PDFs are therefore moderately right-skewed and exhibit little pronounced positive tails, hence, smaller Sk and Ku (Figure 7 left side). With decreasing abundance for the samples of Cluster I and II as well as Garland, larger proportions of the surface are sediment-covered. The corresponding PDFs become more right-skewed and are characterized by more pronounced positive tails (Figure 7 right side), hence, higher kurtosis, due to fewer oyster individuals. In addition, the oyster coverage becomes more instable as oysters lump together in clusters. This causes larger deviations within the three samples, and hence, larger scatter in the values of the statistical moments. Beginning from the samples TZ2 and TZ3 of Transitional Zone, the positive tail shows a sudden change in the gradient, hereafter referred to as dip, around the zero mean or at slightly positive values of z (z = 0–10 mm; compare Figure 7). This shape indicates the height at which the sediment coverage in the sample frame ends and the oyster shell coverage begins. For the samples of Garland, Cluster I and Cluster II, this dip becomes more and more pronounced simultaneous with a decreasing abundance. For the samples of Patch I and II and Central Reef, nearly the entire surface is covered with oyster shells and the proportion of sediment is too low for the dip to be recognizable.
The normalized vertical distributions of the porosity further illustrate differences between structural classes (Figure 8). For the structural classes with homogenous oyster coverage (Figure 8, top row), an increase in the gradient can be observed from Central Reef over Transitional Zone, Cluster I to Cluster II. The increasing gradient is in line with the increase in bulk porosities Φbulk, respectively (Table 2). For the Cluster I and II samples, a plateau around z/Zmax = 0.25 becomes visible for the porosity range Φ = ∼0.25–0.75. The Patch I and II samples exhibit similar moderate courses as Central Reef, while the Garland samples displays a plateau like the Cluster I and II samples around z/Zmax = 0.15 for the porosity range Φ = ∼0.05–0.50. The Central Reef samples nearly collapse on a single line, while all other samples exhibit deviations within the respective structural class. Largest deviations can be found for the Garland and Cluster II samples. It is striking that deviations within the Patch I and Garland samples are mostly noticeable at Φ > 0.5. At low porosity values, the samples show similar relationships between porosity and z/Zmax.
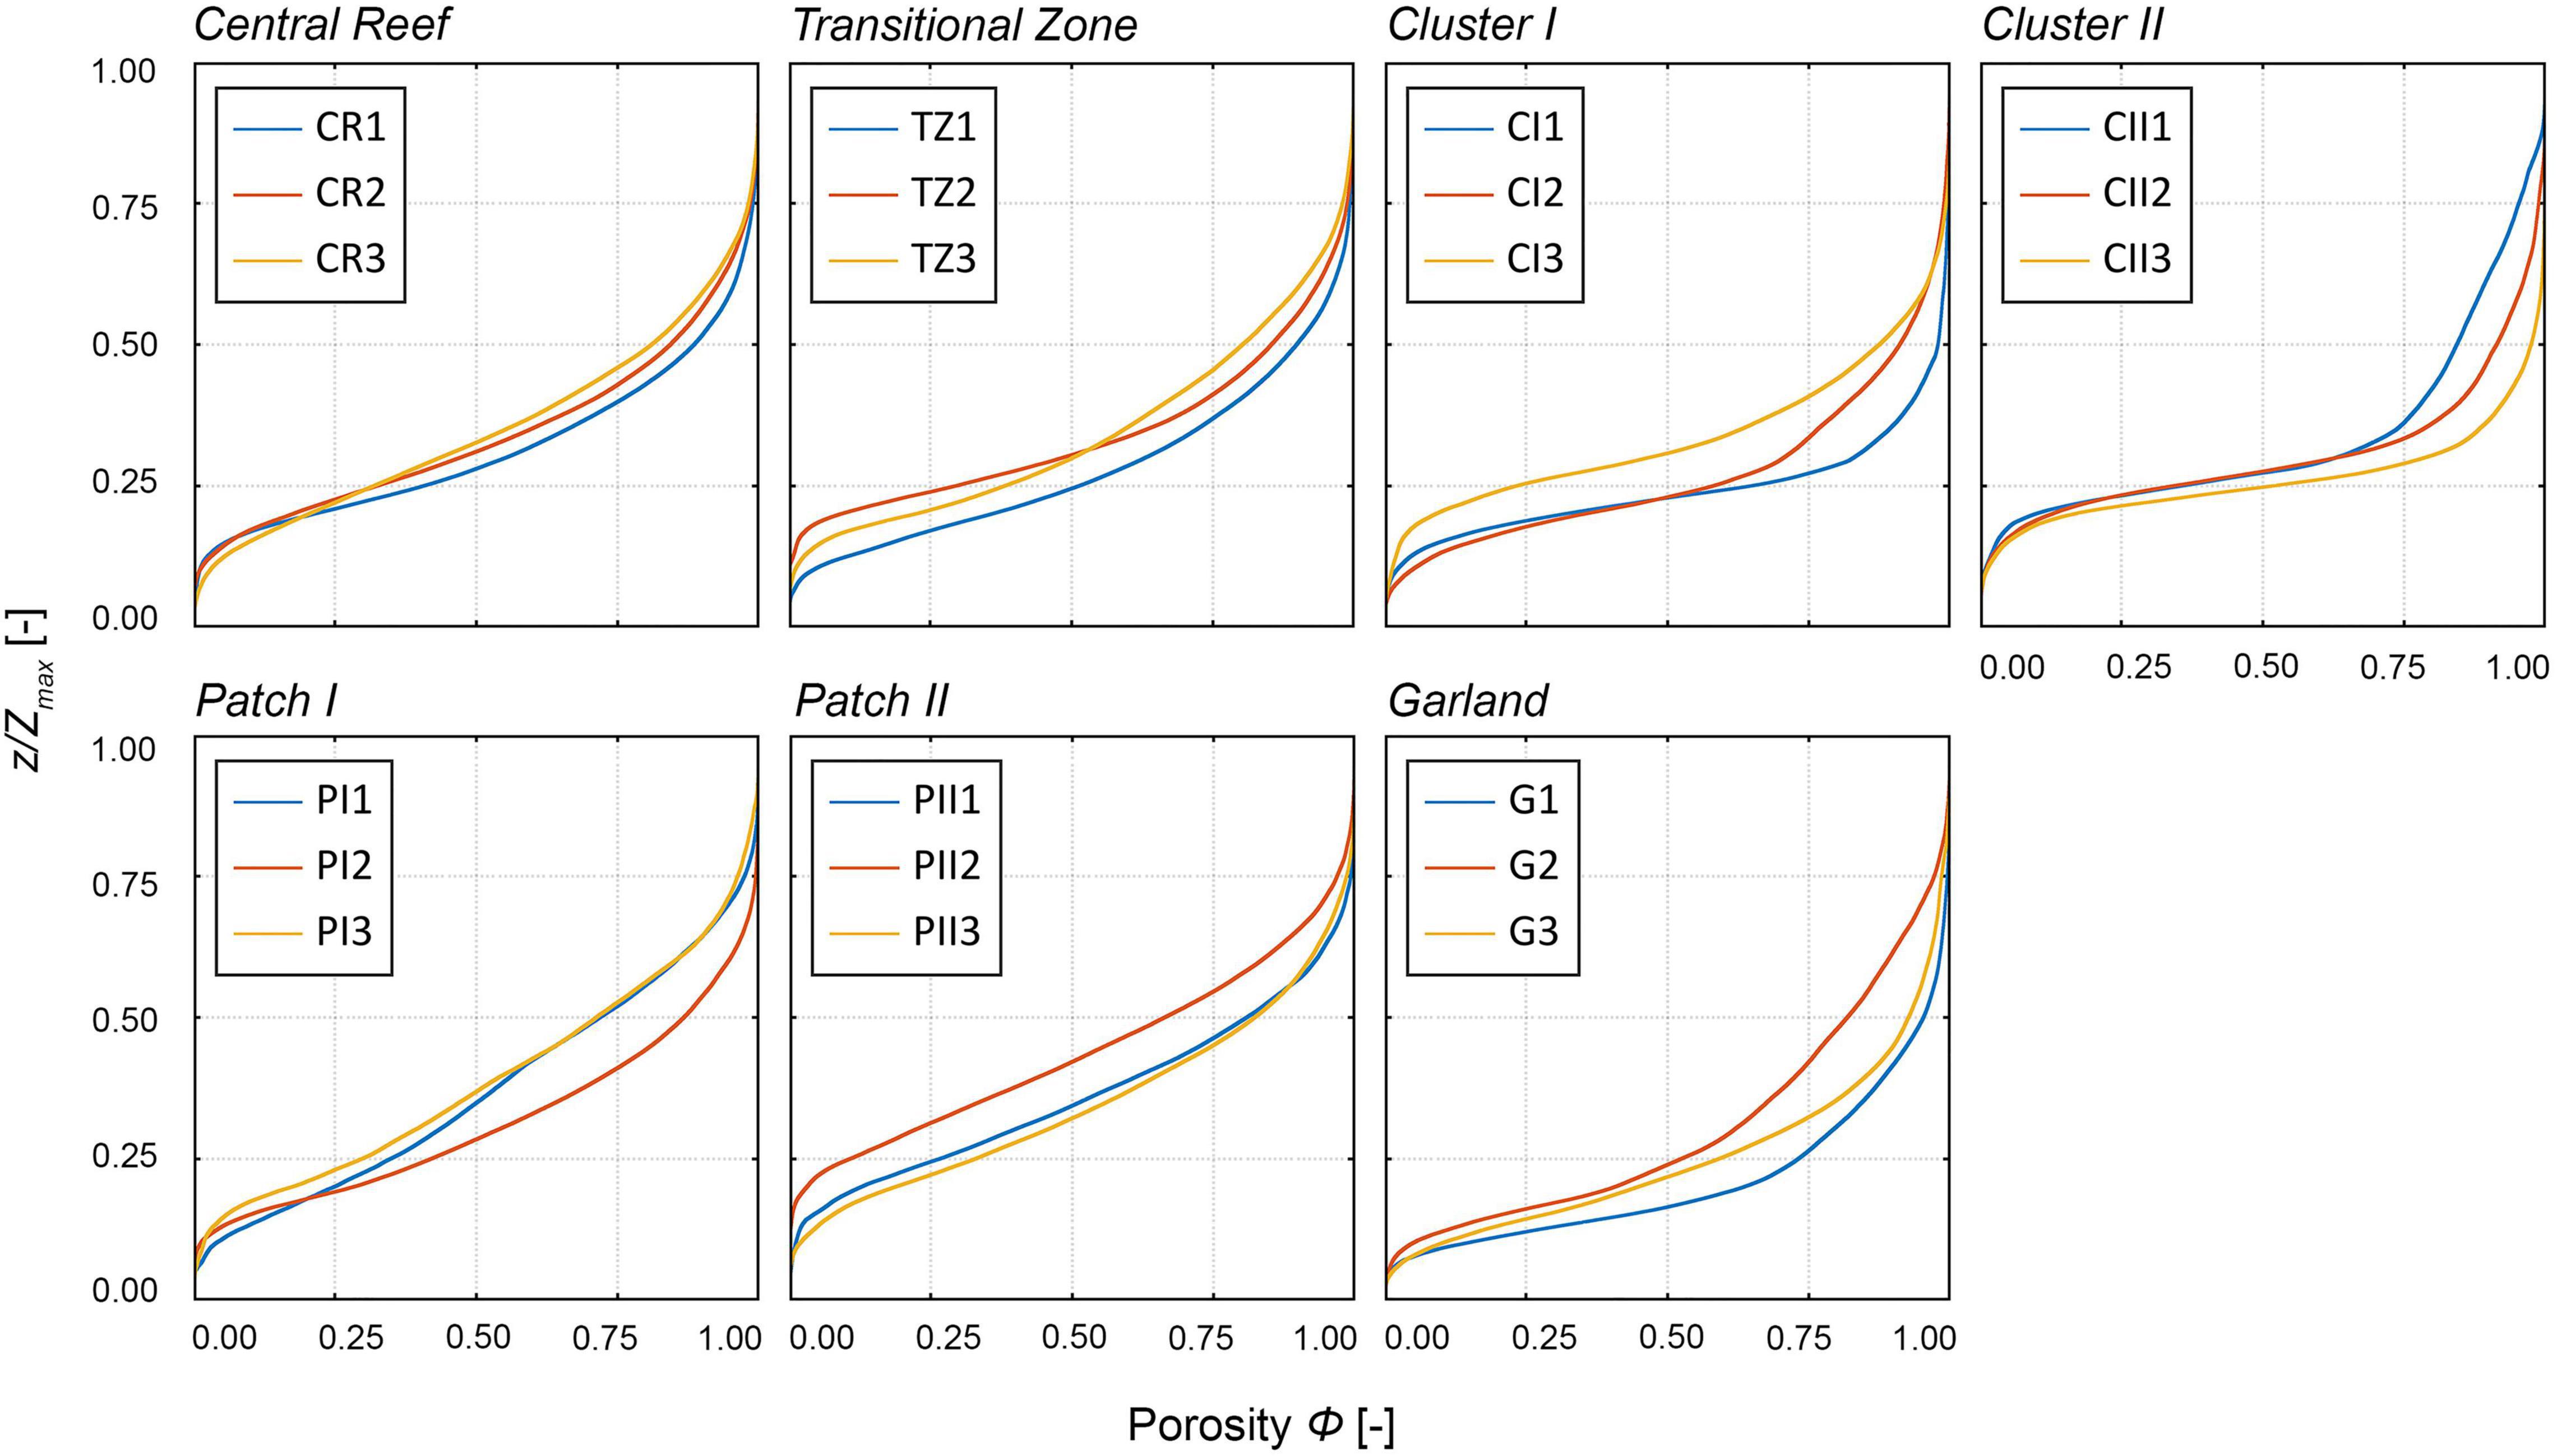
Figure 8. Normalized vertical distribution of the porosity Φ [-] of all samples distinguished by their structural classes over the dimensionless height z/Zmax [-]. z is the surface level and Zmax is the total height of surface level elevations. Top row: homogenous structural classes; Bottom row: enclosed structural classes. The colors indicate the individual samples as presented in Figure 5, e.g., blue: CR1, orange: CR2, yellow: CR3, etc.
The plateau visible in the vertical porosity distribution illustrates the boundary between sediment coverage and oyster shell coverage similar to the dip in the PDFs. For all samples, variations in the sediment coverage occur in the bottom 15–25% of the surface level elevations. At higher z/Zmax, the porosity depends on the density of the oyster shells. For the structural classes with low abundance, as Cluster I, Cluster II, and Garland, porosity increases rapidly as few oyster shells protrude from the sediment. With increasing abundance, the slope of the porosity distribution becomes more moderate, as more oyster shells evenly distributed are present in the total volume. For the structural classes with low abundances, especially Cluster I, Cluster II, and Garland, deviations within samples increase at high porosities (Φ > 0.5), which is in line with the deviations of the statistical moments within the structural classes (Table 3).
Orientation and Clustering
The analysis of the dorso-ventral orientations of the individual oyster shells (Figure 9) reveals anisotropic behavior. Although all rose diagrams in Figure 9 are characterized by scatter, a major direction ϕShells can be determined. The latter is defined as the orientation of the bin (or two adjacent bins) with the highest frequency of oyster shell orientations (dashed lines in Figure 9 and Table 2). In two cases PI3 and PII2, two major orientations can be identified. The extent to which the bin of the major orientation is pronounced varies between samples. However, little differences can be identified between the structural classes. Still, a clear anisotropic characteristic of the dorso-ventral orientations across all structural classes can be confirmed. The major orientations of Central Reef, Transitional Zone as well as Cluster I and Cluster II samples are oriented from northeast to southwest with varying degrees, with exception of TZ1. For samples of Garland, Patch I, and Patch II, no common geographical orientation can be assigned.
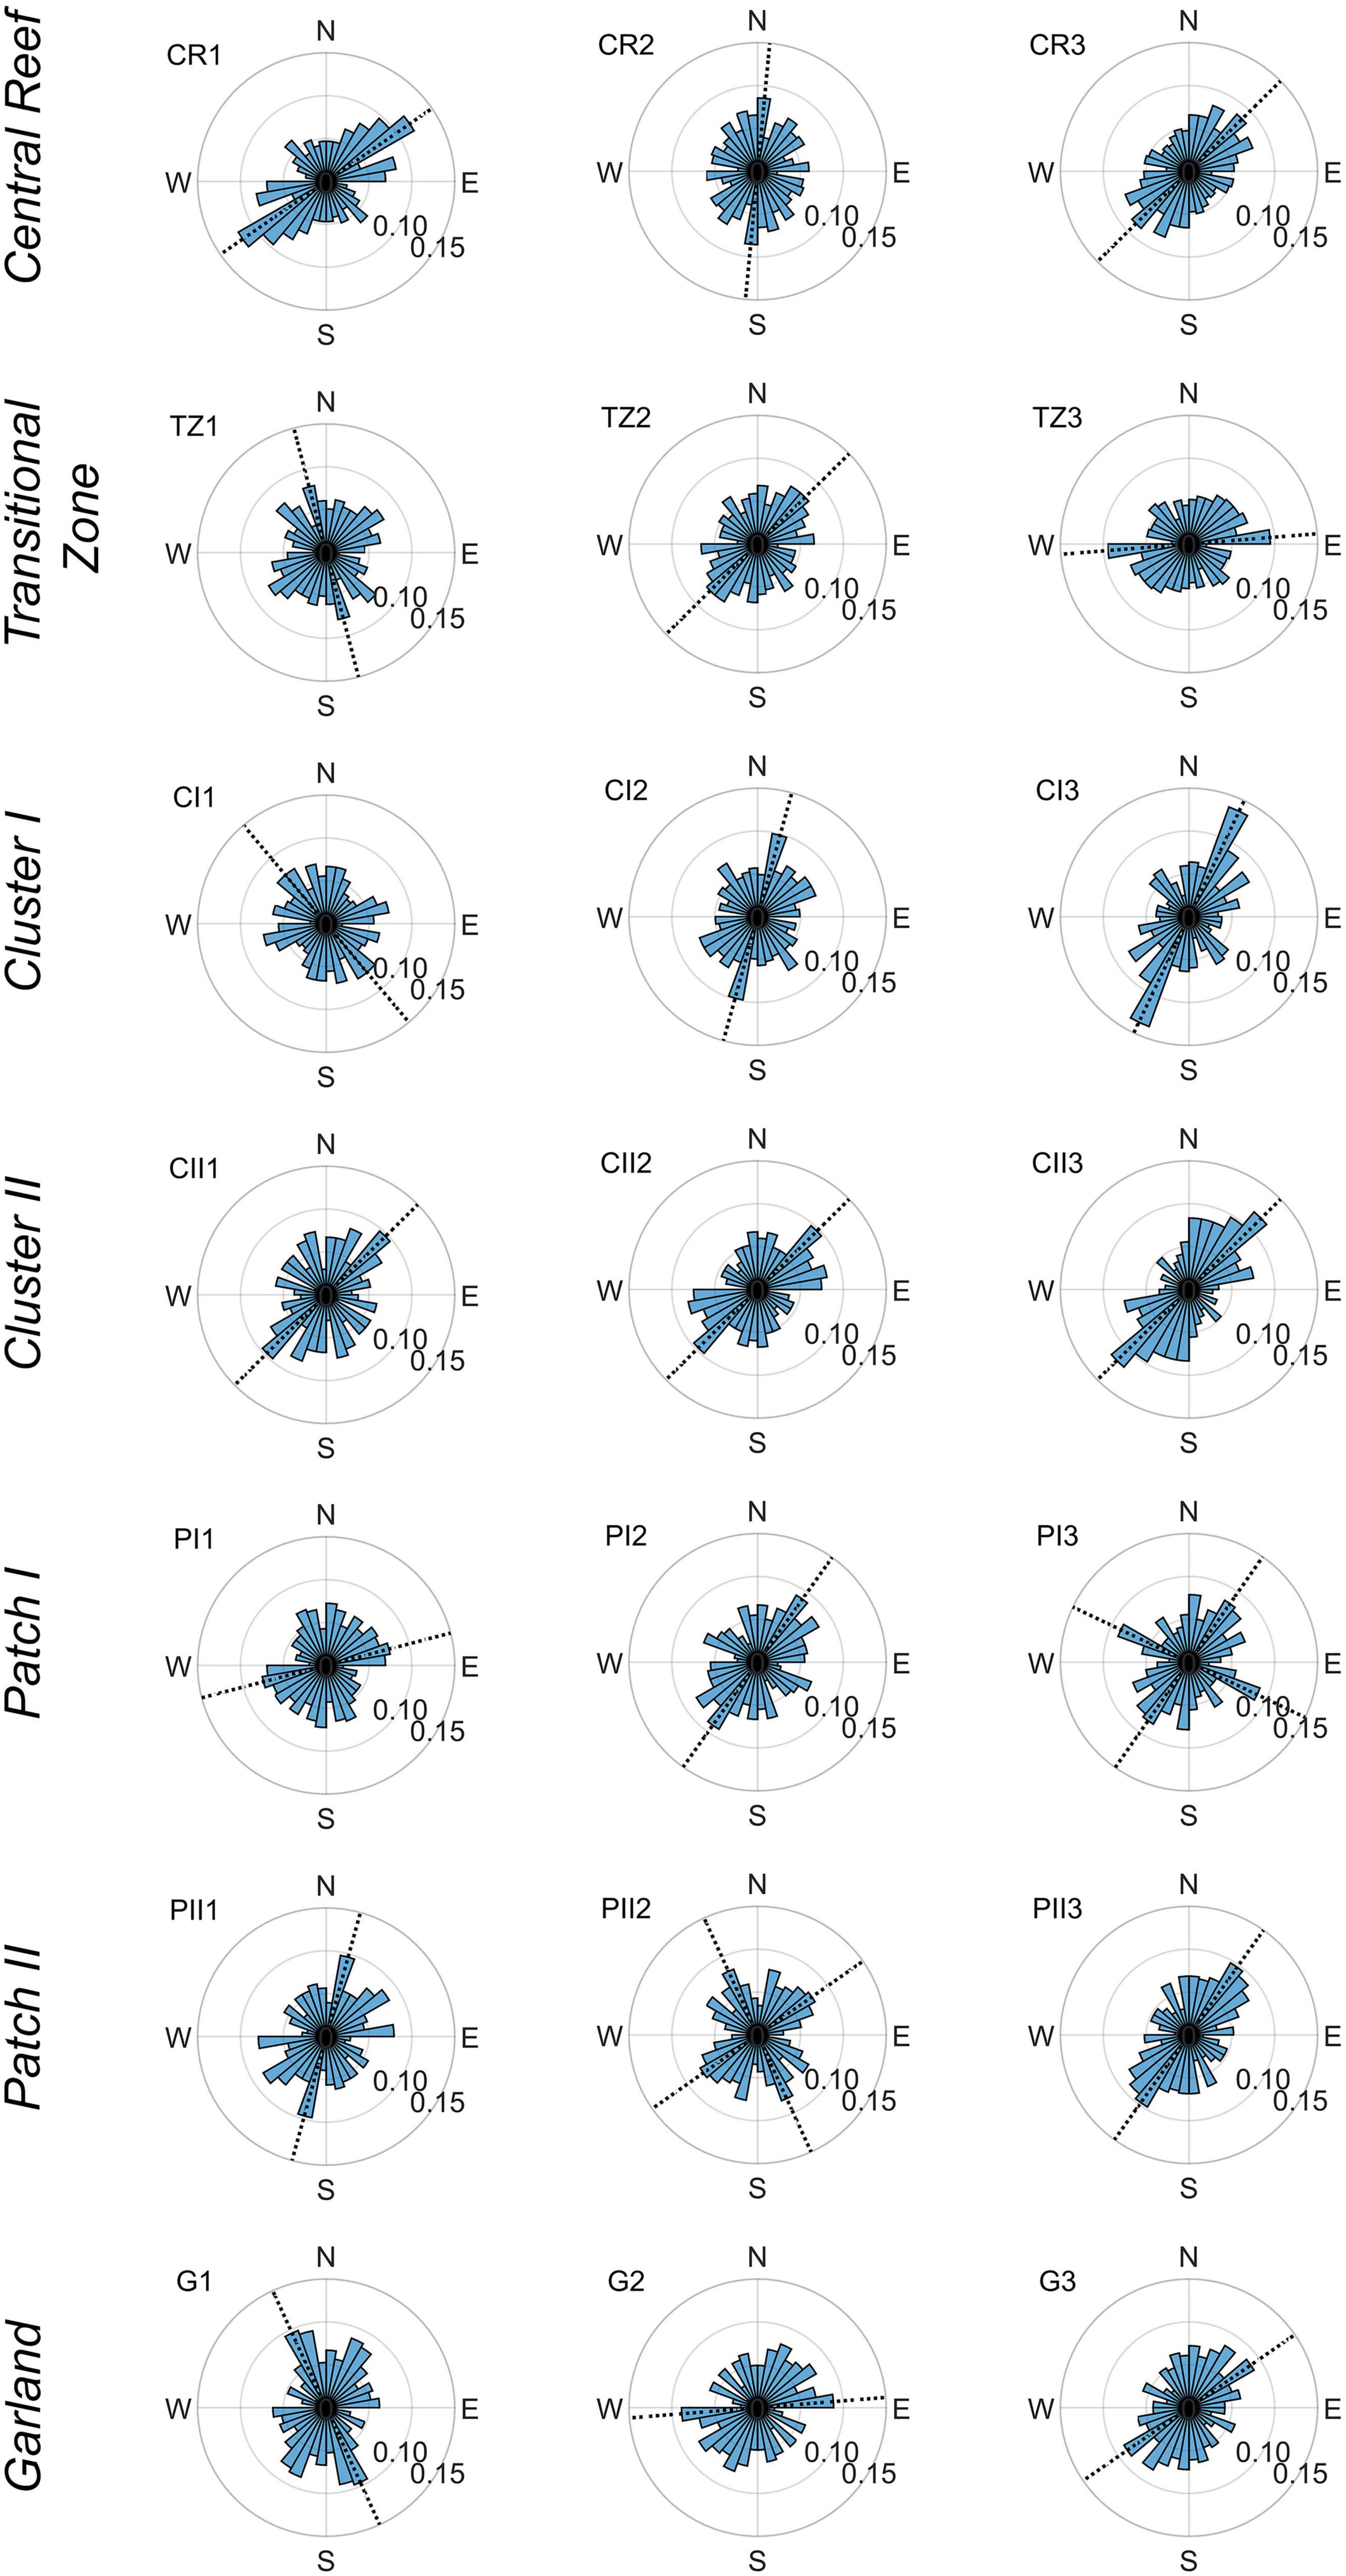
Figure 9. Rose diagrams illustrating the dorso-ventral orientations of oyster shells and their respective frequency of the 21 samples sorted by proposed structural classes. The length of the bins represents the number of oysters oriented in that direction normalized by the total number of oyster shells in the sample. Each bin covers a range of 10°. The samples are mirrored along the north-south axis for illustration purposes. Dashed lines show the major orientation ϕShells [°].
The normalized 2D-SSFs (Figure 10) reveal both individual oyster shells and oyster clusters as significant roughness elements and emphasize the anisotropy of the sample surfaces. The shown 2D-SSFs were normalized by the respective variance 2σz2 and evaluated for maximum spatial lags lx and ly of ±200 mm. High spatial correlations can be observed at small spatial lags characterizing individual oyster shells, while the spatial correlation decreases with increasing spatial lags. The samples CI1, CI3, and G2 were excluded from the analysis, as the reduced surface areas (cp. subsection “Data Collection and Processing”) would only allow investigation for small spatial lags. Next, a threshold level was defined differentiating between high and low correlation to investigate roughness length scales based on the shown correlation functions (Aberle and Nikora, 2006; Aberle et al., 2010). For this purpose, possible characteristic roughness length scales were assumed that correspond either to the mean widths wmean of the oyster shells or to the diameter of agglomerated clusters. In order to relate the 2D-SSFs to the width of the oysters, the blue circles plotted in Figure 10 represent areas Ashells whose radii are equal to wmean. As Central Reef is characterized by a homogeneous oyster distribution and both PDFs and porosity distributions reveal uniform trends, no clustering is expected. It is therefore supposed that the shells are the relevant roughness length scale in these samples. Hence, Ashells of the Central Reef samples are used to approximate a threshold level. DG2(lx,ly)/2σz2 ≤ 0.7 proved to be in line with Ashells for all three samples (red lines in Figure 10), which is then applied to all samples.
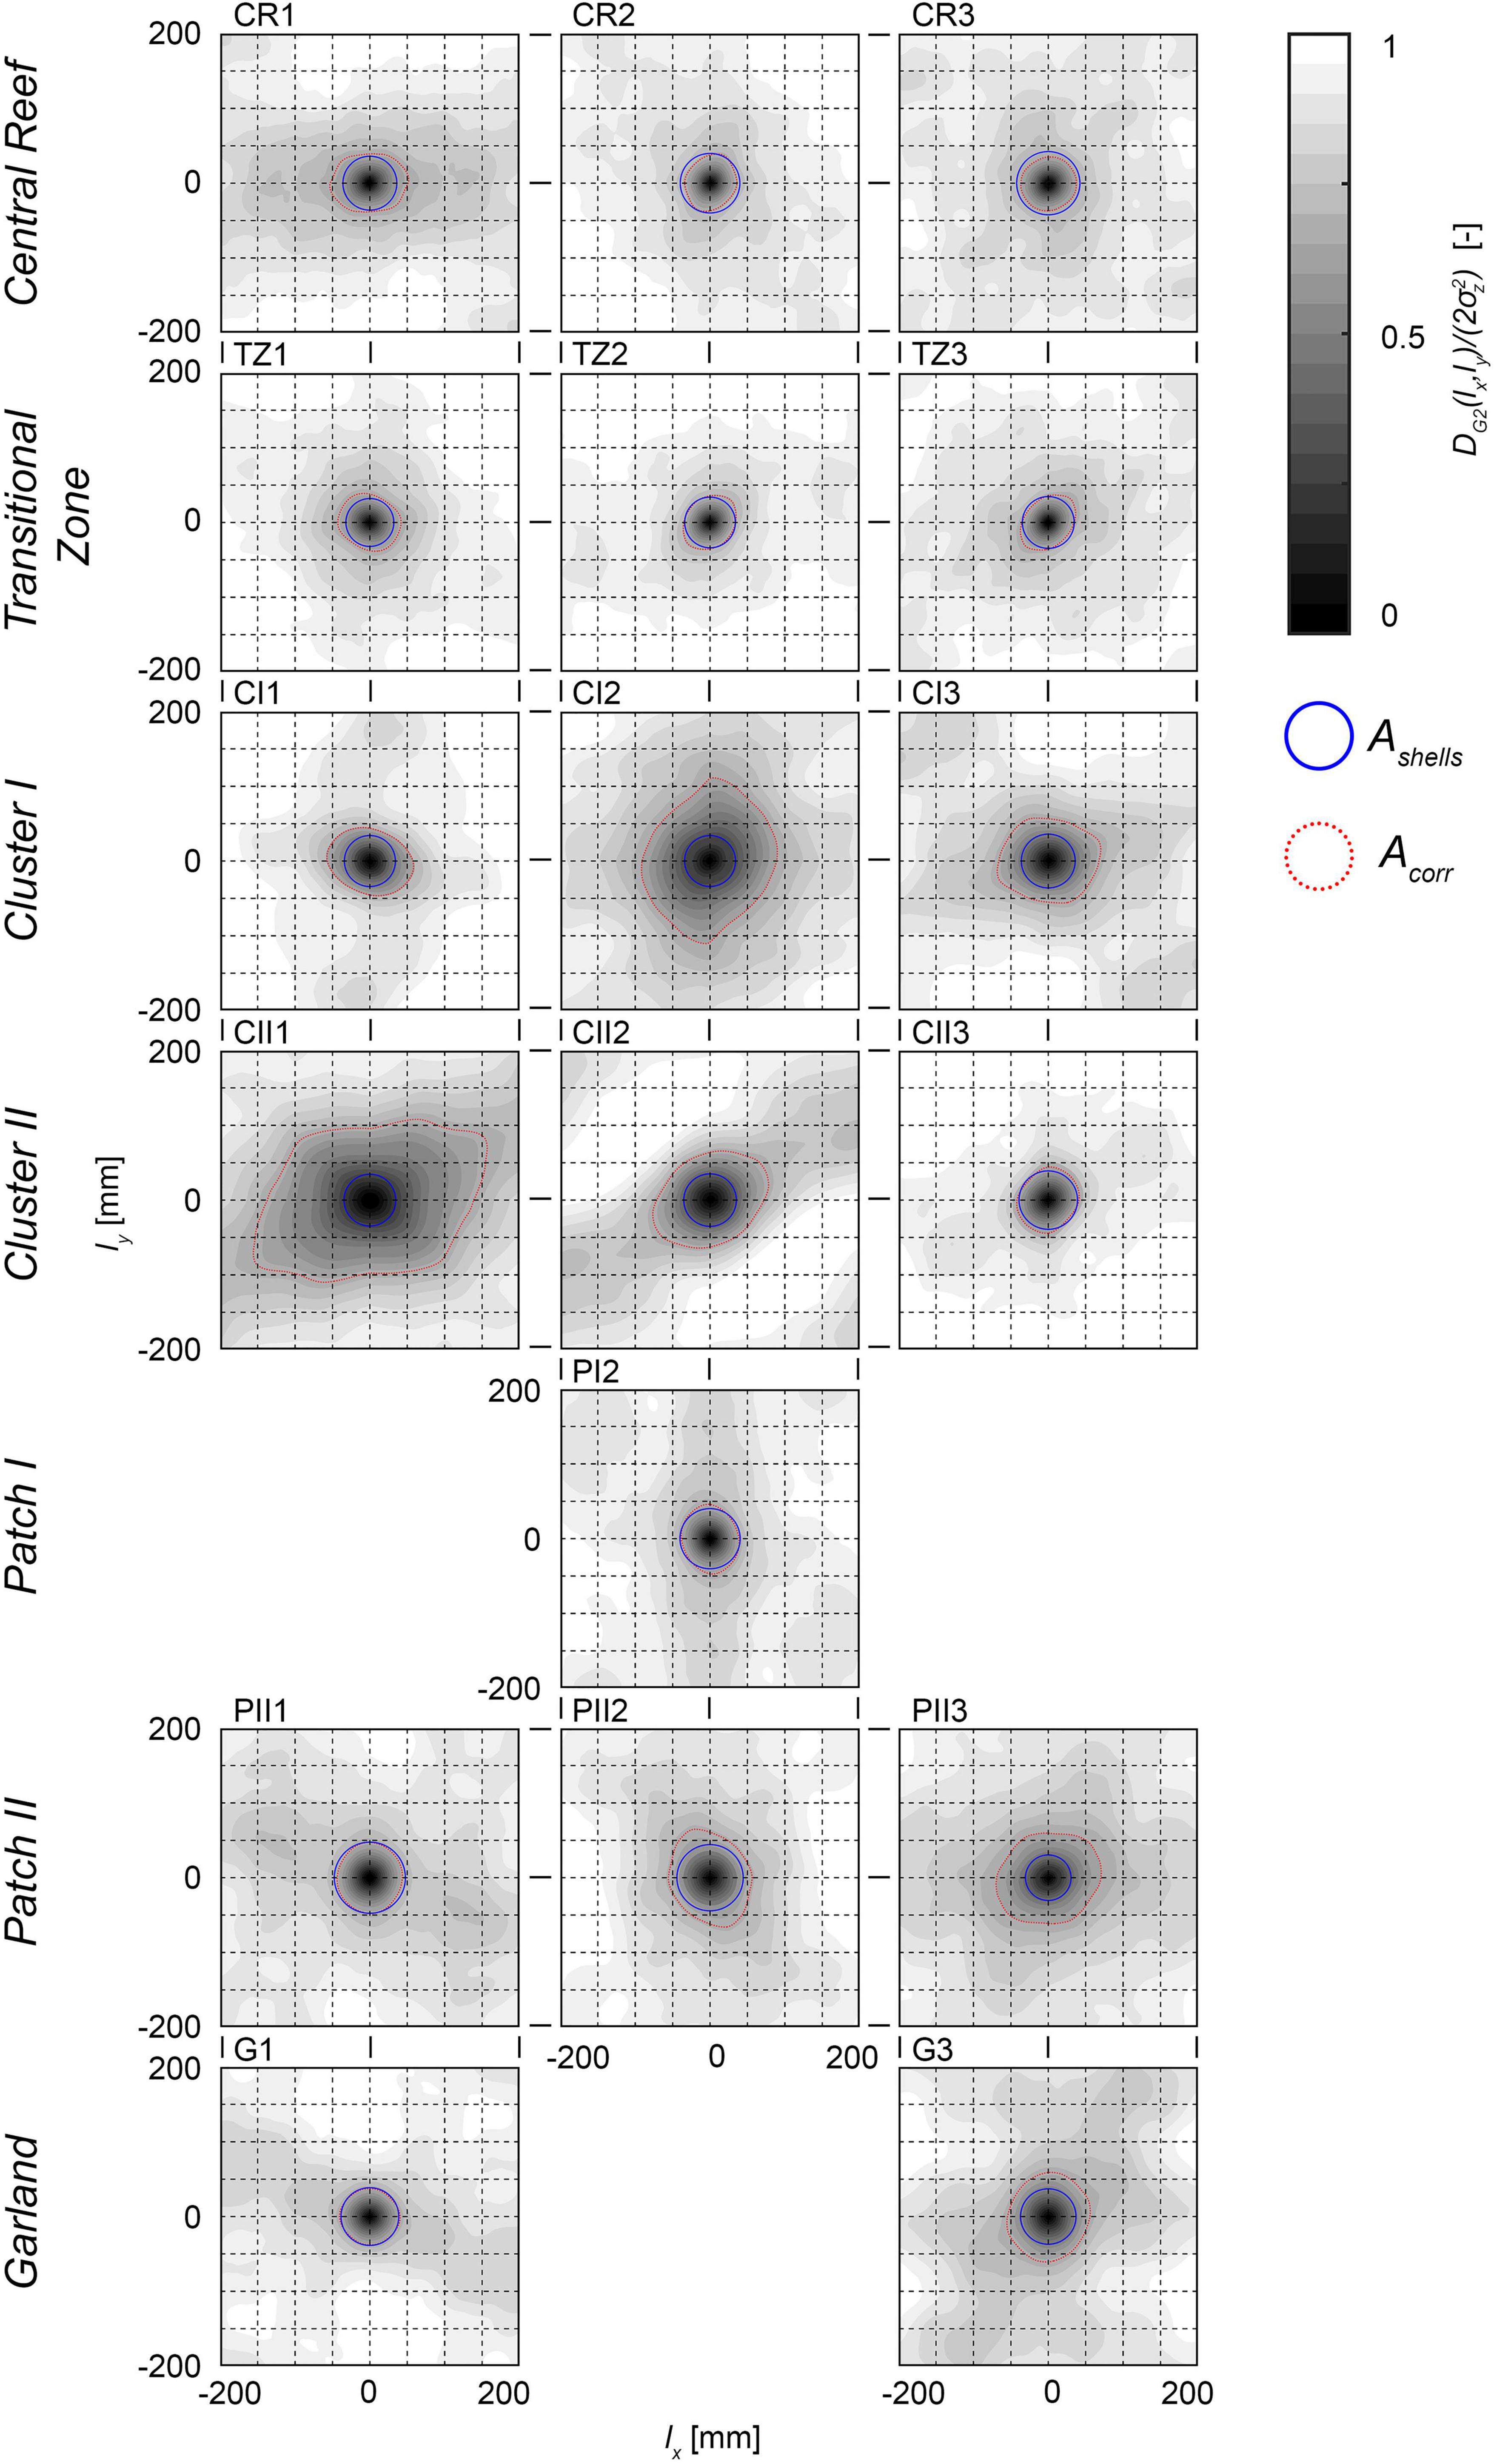
Figure 10. Visualizations of the 2D second-order structure functions (2D-SSFs) for each sample surface normalized by the respective variances DG2(lx,ly)/2σz2. The x- and y-axis show the spatial lags lx and ly [mm]. The gray scale reflects the normalized 2D-SSF values [-], where dark areas indicate high levels of correlation approaching DG2(lx,ly)/2σz2 = 0. Blue circles represent the area Ashells whose radii are equal to the mean width wmean of the oyster shells; Red dashed lines illustrate the area of significant correlations Acorr which is DG2(lx,ly)/2σz2 ≤ 0.7. The sub-figures are sorted by proposed structural classes. PI1, PI3, and G2 are not evaluated.
The areas encircled by the threshold level have circular or elliptical shapes visualizing the area of significant correlation Acorr. The size and orientation of Acorr reveal roughness length scales and anisotropic behavior (compare Table 2). For the Transitional Zone samples, Acorr has similar extensions as Ashells indicating that the shells are the significant roughness length scale in accordance with Central Reef. Hence, oyster shells are confirmed as significant roughness elements. For the Cluster I and II samples, Acorr is two to four times larger as Ashells. Hence, the shells do not represent the significant length scale, but the individual cluster, as larger agglomerations, can be confirmed as roughness elements for the classes Cluster I and II. The sample CII3 is an exception as Acorr has similar extends as Ashells indicating that the oyster shells are the significant roughness elements. The size of Acorr within the samples of a structural class as well as the size of the individual cluster within every sample section are highly variable (compare Figure 5). Hence, no definite cluster size can be determined. For the Patch I and II as well as Garland samples, Acorr is slightly larger than Ashells but still in the same order of magnitude. The shells can be confirmed as significant roughness element for these structural classes. For all samples, Acorr has elliptical shapes with corresponding orientations ϕ2DSSF of the mean axis. Comparing the orientations ϕ2DSSF with the mean orientation of the oyster shells ϕShells reveals deviations of ±45°. However, similar geographical orientations are present further confirming the anisotropy of individuals’ orientation across structural classes.
Structural Classification
In sub-section “Proposed Structural Classification,” a proposed structural classification, using seven classes, was proposed, based on visual impressions and derived criteria during field visits. Through the statistical analysis of DEMs, differences between the structural classes have been elaborated. The higher statistical moments as well as the vertical porosity distribution reveal differences between them. The statistical parameters of the individual samples of Central Reef and Transitional Zone are overlapping. However, the averaged statistical parameters (Table 3) reveal distinctions between the two classes. Further, the higher frequency of sediment flats for Transitional Zone compared to Central Reef (cf. Table 1) justify to keep the distinct classes. Between Cluster I and II, no clear distinctions could be identified in the statistical analysis. However, the abundance as well as the vertical porosity distribution reveal differences. The statistical analysis of Patch I and II also reveals similar results. However, the differences in shape justifies keeping the respective structural classes even though the topographical roughness within the samples is the same. The Garland samples are distinctly different from the Patch classes despite the common enclosed shape. Further, within the samples strong deviations exist in the statistical analysis. The Garland partially resembles the Transitional Zone (G2) and partially Cluster I with clustering tendencies (G1 and G3). However, the enclosed shapes and its directionality define it as a structural class. The analysis of the 2D-SSFs demonstrates different roughness elements. While for the Patch I, Patch II, Central Reef, Transitional Zone, and Garland class the individual oyster shells are the most significant roughness element, for the Cluster I and II classes the clusters are the predominant roughness elements. Further, anisotropic directionality of all structure classes has been found; and it is hypothesized that this has important implications for associated hydraulic processes, sediment transport and distribution of larvae. Hence, the proposed structural classification is confirmed based on the statistical analysis in this work.
Validation
To ensure validity beyond the study site Kaiserbalje, three samples were recorded at the oyster reef Nordland (Mean Coordinates: 53.6424960° N, 008.9411970° E) located south of the island Juist, Germany. Three samples were collected, one each for Central Reef, Transitional Zone, and Cluster II. The PDFs (Figure 11) and the corresponding statistical parameters (Table 2) reveal high agreement with the respective structural class for the Central Reef and the Transitional Zone sample. The Cluster II sample has a narrower shape and higher peak value of 0.09. Further, the total roughness height kt, is smaller and the abundance of 50 inds./m2 is approx. half of the Cluster II samples from Kaiserbalje. It is assumed that the structure is relatively young and oysters have not yet fully matured. This would explain why the total roughness kt and the abundance are lower than of the Cluster II samples. However, the Nordland Cluster II sample does not reveal contrary trends to the proposed structural classification. Therefore, is it assumed that the structural classification is valid at least in a regional context of the central Wadden Sea, extending beyond the oyster reef Kaiserbalje. As nutrition availability and temperature ranges may affect oyster ecology, no conclusion as to a larger generality of the findings can be offered yet.
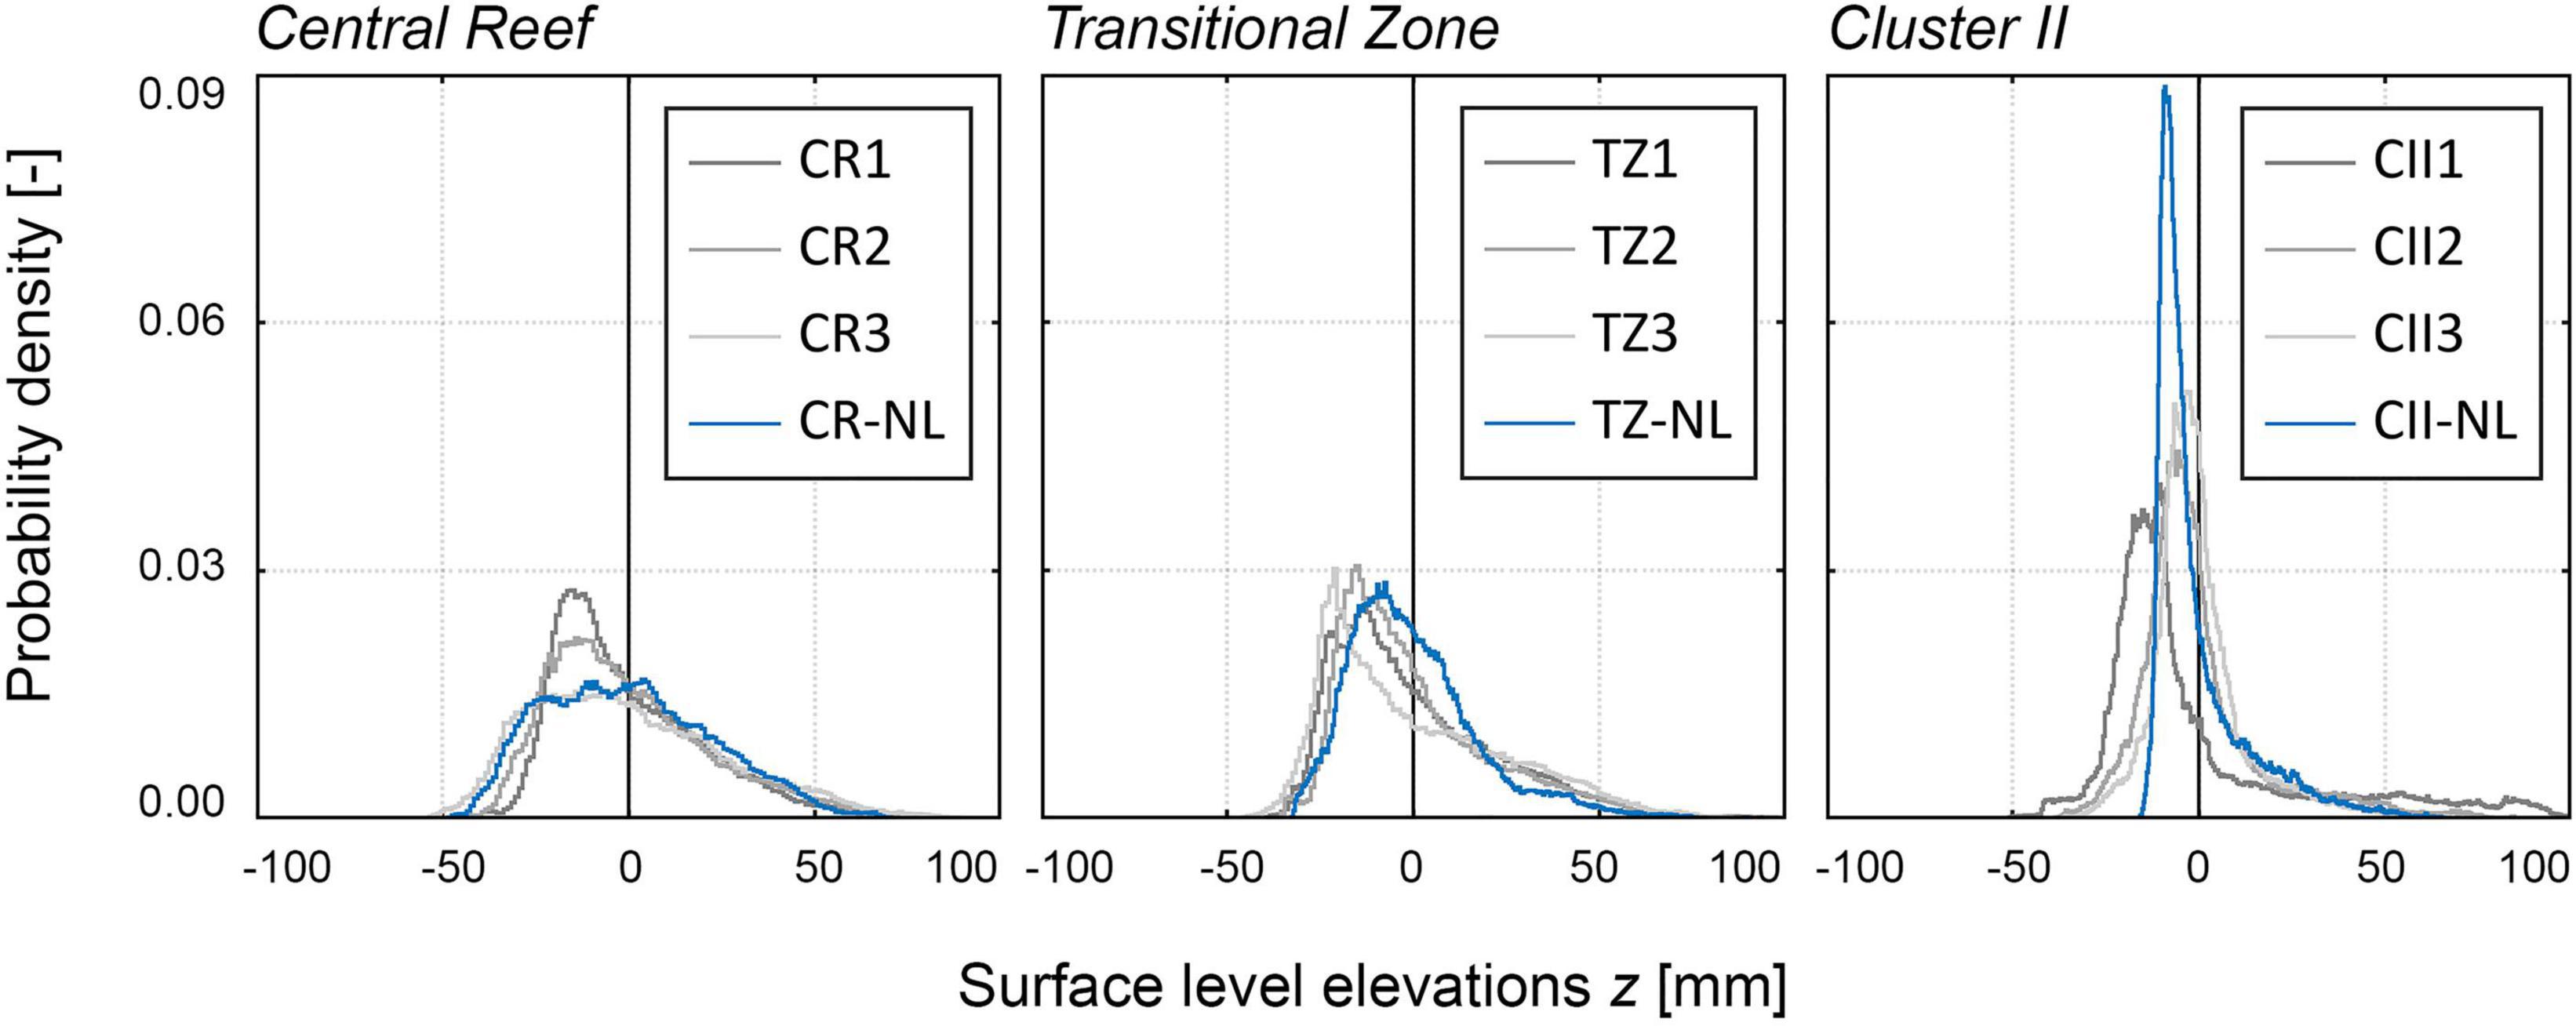
Figure 11. Histograms based on surface level elevation z [mm] illustrating the PDFs [-] of the samples of Central Reef, Transitional Zone, and Cluster II including the validation samples recorded at the oyster Nordland. The PDFs are centered around the zero mean. The gray colors indicate the individual samples of Kaiserbalje as presented in Figure 5 and the blue color indicates the sample of Nordland, e.g., dark gray: CR1, medium gray: CR2, light gray: CR3, blue: CR-NL, etc.
Discussion
Separation of Oyster Roughness and Oyster as Habitat Defining Species
The aim of this work was to investigate the species-related geometrical roughness scale without considering the individual effects of the bed form caused by the overarching morphology. Hence, in the data processing, the species-related roughness scale was isolated, which allowed to statistically analyze the surfaces with the shown methods without influences of the superordinate morphology. However, when considering the entire reef, the morphology is characterized by strong three-dimensional reliefs (Folmer et al., 2017; Markert, 2020) that strongly influence the local hydrodynamic conditions (Frey et al., 1987; Moulin et al., 2007). Hence, bed roughness effects caused by the oysters are superimposed with the effect that bedform-induced roughness has on wave and current transformation processes. An isolated consideration and analysis of the effects enables a later superposition. Future studies will have to investigate the mutual effect of species- and bedform-induced roughness on the hydrodynamics.
Due to the resolution of the DEM with a grid size of 2 mm, micro-topographical changes were filtered from the analyzed data. Hence, one limitation of this study are the micro-morphological variations of the individual oysters especially of the saw-toothed shell margins sculpting the individuals (Figure 1). Influences of the micro-roughness scale on the hydraulic roughness development could be addressed in future research. Micro-computed tomography (Micro-CT) investigations of singular shells could be applied to resolve surfaces up to several μm (Chatzinikolaou et al., 2021; Keklikoglou et al., 2021). Despite this limitation, it is assumed that the provided topographical parameters represent the key factors that influence the hydraulic roughness.
The presence of M. edulis is not considered explicitly in the analysis despite high abundance and importance in studies focusing on population dynamics (Wehrmann, 2006; Markert et al., 2010; Reise et al., 2017; Markert, 2020). However, in regards to the bed roughness, M. edulis are only of subordinate importance due to the smaller size of mature individuals (∼40 mm) compared to M. gigas and the tendency of M. edulis to occupy the interspace between oyster shells (Buschbaum et al., 2016). Therefore, it is reasonable to focus on oyster individuals as predominant habitat-defining species in particular. However, as M. edulis and other species are also present in the sample surfaces, they are part of the analyzed surface elevation data and represented in the statistical parameters.
Structural Classification
In contrast to other classifications of oyster reefs that differentiate reef types, the presented work suggests an intra-reef classification. As a study site, the oyster reef Kaiserbalje was selected, which has been categorized by Markert (2020) as a complex reef with a high oyster density. Due to the natural heterogeneity of oyster reefs, it is assumed that the complex reef covers all significant surface types possible. The structural classes are similar to the temporal growth stages in the creation of oyster reefs reported by this author. The differences in position and elevation further confirm the similarity between structural classes and growth stages. Transitional Zone and Central Reef are located toward the center of the reef with elevations corresponding to the aerial exposure times during a tidal cycle of 50–60%, which is the vertical growth threshold reported by Rodriguez et al. (2014) and Ridge et al. (2017). Further, Cluster, Patches, and Garlands are located at the margins of the reef at lower elevations, where the oyster coverage keeps expanding horizontally and vertically. Hence, the temporal sequence of growth stages reported by Markert (2020) also describes a spatial classification in the structural classes confirmed in this study.
Application of the structural classification and the respective parameters to drone or satellite images could considerably increase the accuracy in the description of oyster reefs. In previous investigations, oyster reefs have been viewed as surfaces with homogeneous distributions (Smaal et al., 2009) since no intra-reef classifications had been recorded. However, the results of this study illustrate that averaged parameters are insufficient to describe the highly complex and heterogenic surfaces of oyster reefs. By applying the intra-reef classification, areal proportions of the classes in the total reef surface and their impact on the overall roughness could be evaluated and monitored over several years. When linked to representative biological parameters such as abundance, total wet weight and length-frequencies distributions, the classification allows for a more accurate estimation of the population dynamics on the scale of oyster reefs or the whole Wadden Sea.
Roughness Parameters
The topographical parameters for oyster reef surfaces reported in this work, including statistical moments, porosity distributions, abundances and measures of directionality, provide a detailed description that did not exist before. Further, the reported parameters were chosen as they have been identified to exert an influence on the surrounding hydrodynamics in environmental hydraulics (Nikora et al., 1998; Aberle and Nikora, 2006; Coleman et al., 2011; Flack and Schultz, 2014; Navaratnam et al., 2018) and mechanical engineering (Flack and Schultz, 2010; Chung et al., 2021). Hence, a comprehensive set of topographical parameters has been provided adding to the call for understanding of roughness effects of this relatively new biogenic habitat on the intertidal flats of the central Wadden Sea (Markert et al., 2010; Borsje et al., 2011; Walles et al., 2015b; Folmer et al., 2017) and worldwide (Morris et al., 2021).
The topographical parameters can partially be linked to results of former studies on the roughness of oyster reefs. Manis et al. (2015) provide topographical information of oyster reefs in form of roughness elements that can be linked to the hydraulic roughness. The number of roughness elements (460 elements/m2) for a C. virginica reef after 1 year of deployment compares to the abundance of Central Reef (393 ± 50 inds./m2), Transitional Zone (466 ± 56 inds./m2) or Patch I (408 ± 133 inds./m2) on Kaiserbalje. The heights of the individual roughness elements of 150 ± 16 mm are larger than the total roughness heights kt = 104 ± 11 mm of Central Reef by a factor of 1.5. However, kt is not equal to the length of the shells but relates to the parts of the shells protruding from the sediment or reef structure, which could explain the differences. Further, the different oyster species C. virginica with other shell sizes could also contribute to the differences. Parameters describing the shape and extend of the surfaces as well as orientations or clustering of the individual oysters to assign a structural class are not provided by Manis et al. (2015). Despite these limitations, the described parameters are in the same order of magnitude compared to this study, which is why it is likely that similar wave attenuation effects can be expected for surfaces of the structural classes Central Reef, Transitional Zone, and Patch I. Kitsikoudis et al. (2020) similarly report numbers of roughness elements in C. virginica reefs with 121 ± 25 elements/m2, which correspond to abundances of Cluster II (137 ± 5 inds./m2). However, Cluster II is characterized by clusters as significant roughness elements with open sediment spaces in between, which is not reported for the C. virginica reef samples. As no clustering is reported by Kitsikoudis et al. (2020) it cannot be assumed that similar frictional resistance effects will occur. For the structural classes with homogeneous distribution of the oyster shells Central Reef and Transitional Zone, the abundance is three to four times higher. Hence, similarities regarding the impacts on the surrounding hydrodynamics with these structural classes are also not justifiable. Further, the reported average length of 82 ± 25 mm for the C. virginica reefs are smaller than the total roughness heights in this work. It is hence assumed that while similarities exist, additional structural classes for C. virginica reefs are possible. Margiotta et al. (2016) and Colden et al. (2017) used the rugosity to identify habitat composition and population trajectories for which a singular parameter serves the purpose. However, the one-dimensional, singular parameter neglects many three-dimensional effects that have been identified in this work to affect the hydraulic roughness. Further, the accuracy of the chain method is limited to the precision of the chain and cannot be recreated digitally. Hence, the results are not comparable to the topographical parameters reported in this study.
Knowledge of the topographical parameters alone does not allow for predictions of the impacts on the surrounding flow. Even though it is known that the aforementioned topographical parameters pose an influence, thus far no method to determine the hydraulic roughness directly from topographical parameters exists (Chung et al., 2021). To define the impacts of the surface on the hydrodynamics, systematic and comprehensive laboratory investigations are necessary. The reported topographical parameters can be used to develop simplified and scaled surrogate models that depict many important parameters influencing the hydraulic roughness. With these surrogate models, a wide range of hydrodynamic parameters can be evaluated in a controlled laboratory environment. Hence, results of field studies (Whitman and Reidenbach, 2012; Reidenbach et al., 2013; Styles, 2015; Kitsikoudis et al., 2020), which are limited to the range of hydrodynamic conditions during the period of the field study, can be enhanced by a wider range of possible combinations. Like this, topographical parameters can be linked to the bed roughness to derive parameters such as the hydraulic roughness length z0 (Lefebvre et al., 2010) or the wave friction factor fw (Mirfenderesk and Young, 2003; Thompson et al., 2012; Yao et al., 2020).
Link to Population Dynamics
The statistical parameters reported in this study can partially be related to parameters of biological sampling used for population dynamics despite different methods of determination (Wehrmann, 2006; Brandt et al., 2008; Markert et al., 2010; Reise et al., 2017; Markert, 2020). The abundances in this study are lower than typical abundances of studies describing population dynamics, e.g., Reise et al. (2017) or Markert (2020) reaching up to 1500 inds./m2 when live and dead individuals are considered (including all shells). This discrepancy is due to different methods of determination and different research objectives. While in the aforementioned studies all individuals up to a sediment depth of 10–15 cm are considered to identify changes in the population dynamics (e.g., biomass, length frequency distribution), in this study only individuals that protrude from the sediment cover are considered as they are relevant roughness elements. Further, small individuals (<25 mm) are not considered as their influence on the overall roughness is negligible. In addition to the visual determination from the orthomosaics (compare subsection “Abundance and Orientation”), abundances were determined by the same sampling method as in the aforementioned studies. A comparison of both methods reveals that the abundances from visual determination is lower by a factor of 2.8 ± 0.9, which can serve as a correction factor for study comparison. The total roughness height kt and the form of the PDFs can be linked to shell length. However, as oyster individuals are typically partially embedded in the sediment, the distributions of surface level elevations do not represent shell length but the length of the protruding part of the oyster shells (compare subsection “Roughness Parameters”). Hence, kt is smaller than maximum shell length.
Interactions Between Oyster Reef and Hydrodynamics
The analysis of the directionality reveals anisotropy of individuals’ orientation for all structural classes. This observation is in line with previous investigations on shell alignment in oyster reefs (Grinnell, 1974; Frey et al., 1987; Harzhauser et al., 2015) and mussel beds (Nagle, 1967; Sanderson and Donovan, 1974; García-March et al., 2007), which further link orientations to tidal flows and wave action. Typically, the dorso-ventral axis’ are oriented orthogonal to the mean flow direction or parallel to the wave crest orientation (Nagle, 1967; Grinnell, 1974). However, to correlate hydrodynamics and directionality of the oyster reef either in situ measurements or high-resolution numerical simulations of sea state conditions would be required that were not available at the time of this study. As hydrodynamics are strongly influenced by the reef morphology and less dependent on the large-scale hydrodynamic processes (Frey et al., 1987; Moulin et al., 2007), currently available numerical simulations [e.g., results documented through EasyGSH (Hagen et al., 2020) with grid size of 500 m] do not resolve the local morphology and response in hydrodynamics well enough. Still, the anisotropic orientations of oyster shells and cluster suggest impacts of the hydrodynamic forces on oyster directionality.
Several numerical studies of oyster reefs on macro- and meso-scale have focused mostly on larval dispersal patterns distribution (e.g., Kjelland et al., 2015; Arnold et al., 2017; Dye et al., 2021) while the influence of the rough surfaces on the surrounding hydrodynamics have not been subject of investigation. Here, the structural classification provided and the respective topographical roughness parameters can be used as input parameters for future investigations addressing the impact on the hydrodynamic and sediment transport similar to investigations by van Leeuwen et al. (2010) on mussel beds or by Ashall et al. (2016) on salt marshes.
The Cluster I and II samples are most exposed to hydrodynamic forces due to their positions at the margin of the reef and feature lower abundances than the other, more sheltered structural classes. This observation is in line with findings of a field study by Vozzo et al. (2021), who reported a negative correlation between abundances and surface area of oyster reefs with increasing wave exposure near Sydney, Australia. However, the creation process reported by Markert (2020) shows that the oyster clusters are able to form and coalesce into patches despite the hydrodynamic forces at the margins of the reef. A comparison of oyster reef outlines over several years with associated hydrodynamic parameters could lead to a threshold of bed shear stress that oyster reefs can withstand and expand upon.
Conclusion
The main objective of the present work was to record and document topographical roughness parameters of Magallana gigas oyster reef surfaces in the central Wadden Sea. A set of parameters that are known to influence the hydraulic bed roughness have been provided including roughness heights, statistical moments of the surface level elevations, abundance as well as measures of the directionality and clustering. Hereby, a proposed structural classification in seven classes has been tested and verified beyond the study site. It has been shown that the classes are characterized by distinct roughness properties and locations within the reef surface. Hence, by considering the classification, the complexity of the reef surface can be accounted for. The set of roughness parameters enhance the knowledge of oyster reef surfaces that influence the surrounding hydrodynamics and vice versa. Further, a methodology has been elaborated that utilizes structure-from-motion photogrammetry to derive detailed high-resolution digital elevation models under the adverse conditions in the central Wadden Sea. It can be applied to other reefs and allows comparison of hydrodynamic roughness effects across locations. The findings, hence, may pave the way for accurate determination of wave and tidal current attenuation as well as population dynamics with implications for the sediment transport and effects on larvae distributions.
Data Availability Statement
The raw data supporting the conclusions of this article will be made available by the authors, without undue reservation.
Author Contributions
JH, LB, KP, TS, MP, AW, and NG contributed to the conceptualization. JH, LB, KP, JA, AW, and NG developed the methodology. JH, KP, TH, and AE carried out the investigation in the field studies. JH, LB, AE, and JA developed the software and conducted the formal analysis. JH and LB validated and curated the data. JH wrote the first draft of the manuscript and prepared visualizations. MW, AW, and NG provided supervision. NG, AW, TS, and MP organized funding acquisition. NG was responsible for the project administration. All authors contributed to manuscript revision, read and approved the submitted version.
Funding
This project “BIVA-WATT” on which this work is based was funded by the Federal Ministry of Education and Research of Germany (BMBF) under the funding code 03KIS127.
Conflict of Interest
The authors declare that the research was conducted in the absence of any commercial or financial relationships that could be construed as a potential conflict of interest.
Publisher’s Note
All claims expressed in this article are solely those of the authors and do not necessarily represent those of their affiliated organizations, or those of the publisher, the editors and the reviewers. Any product that may be evaluated in this article, or claim that may be made by its manufacturer, is not guaranteed or endorsed by the publisher.
Acknowledgments
We would like to thank the captain and the crew of the FK Senckenberg for providing the logistics needed during the field studies. Further, we want to thank Torsten Janßen (Senckenberg am Meer) for his organizational work in the background and assistance during field work. The Lower Saxon Wadden Sea National Park Authority (Wilhelmshaven) is thanked for permits and cooperation.
References
Aberle, J. (2007). Measurements of armour layer roughness geometry function and porosity. Acta Geophys. 55, 23–32. doi: 10.2478/s11600-006-0036-5
Aberle, J., and Nikora, V. (2006). Statistical properties of armored gravel bed surfaces. Water Resour. Res. 42:W11414. doi: 10.1029/2005WR004674
Aberle, J., Koll, K., and Dittrich, A. (2008). Form induced stresses over rough gravel-beds. Acta Geophys. 56, 584–600. doi: 10.2478/s11600-008-0018-x
Aberle, J., Nikora, V., Henning, M., Ettmer, B., and Hentschel, B. (2010). Statistical characterization of bed roughness due to bed forms: a field study in the Elbe River at Aken, Germany. Water Resour. Res. 46:W03521. doi: 10.1029/2008WR007406
Arakawa, K. Y. (1990). Natural spat collecting in the Pacific oyster Crassostrea gigas (Thunberg). Mar. Behav. Physiol. 17, 95–128. doi: 10.1080/10236249009378760
Arnold, W. S., Meyers, S. D., Geiger, S. P., Luther, M. E., Narváez, D., Frischer, M. E., et al. (2017). Applying a coupled biophysical model to predict larval dispersal and source/sink relationships in a depleted metapopulation of the eastern oyster Crassostrea virginica. J. Shellfish Res. 36, 101–118. doi: 10.2983/036.036.0112
Ashall, L. M., Mulligan, R. P., van Proosdij, D., and Poirier, E. (2016). Application and validation of a three-dimensional hydrodynamic model of a macrotidal salt marsh. Coast. Eng. 114, 35–46. doi: 10.1016/j.coastaleng.2016.04.005
Bendat, J. S., and Piersol, A. G. (2010). Random Data: Analysis and Measurement Procedures, Fourth Edn. Hoboken: Wiley.
Bertin, S., and Friedrich, H. (2014). Measurement of gravel-bed topography: evaluation study applying statistical roughness analysis. J. Hydraul. Eng. 140, 269–279. doi: 10.1061/(ASCE)HY.1943-7900.0000823
Borsje, B. W., van Wesenbeeck, B. K., Dekker, F., Paalvast, P., Bouma, T. J., van Katwijk, M. M., et al. (2011). How ecological engineering can serve in coastal protection. Ecol. Eng. 37, 113–122. doi: 10.1016/j.ecoleng.2010.11.027
Bouma, T. J., van Belzen, J., Balke, T., Zhu, Z., Airoldi, L., Blight, A. J., et al. (2014). Identifying knowledge gaps hampering application of intertidal habitats in coastal protection: opportunities & steps to take. Coast. Eng. 7, 147–157. doi: 10.1016/j.coastaleng.2013.11.014
Brandt, G., Wehrmann, A., and Wirtz, K. W. (2008). Rapid invasion of Crassostrea gigas into the German Wadden Sea dominated by larval supply. J. Sea Res. 59, 279–296. doi: 10.1016/j.seares.2008.03.004
Bundesamt für Seeschifffahrt und Hydrographie [BSH] (2020). Gezeitenkalender – Hoch- und Niedrigwasserzeiten für die Deutsche Bucht und deren Flussgebiete. Hamburg: Bundesamt für Seeschifffahrt und Hydrographie.
Bungenstock, F., Hertweck, G., Hochstein, M. L., and Wehrmann, A. (2021). Distribution pattern and controls of biosedimentary facies in backbarrier tidal flats of the central Wadden Sea (North Sea). ZDGG J. Appl. Reg. Geol. 172, 409–428. doi: 10.1127/zdgg/2021/0248
Burkett, J. R., Hight, L. M., Kenny, P., and Wilker, J. J. (2010). Oysters produce an organic-inorganic adhesive for intertidal reef construction. J. Am. Chem. Soc. 132, 12531–12533. doi: 10.1021/ja104996y
Buschbaum, C., Cornelius, A., and Goedknegt, M. A. (2016). Deeply hidden inside introduced biogenic structures – Pacific oyster reefs reduce detrimental barnacle overgrowth on native blue mussels. J. Sea Res. 117, 20–26. doi: 10.1016/j.seares.2016.09.002
Chatzinikolaou, E., Keklikoglou, K., and Grigoriou, P. (2021). Morphological properties of gastropod shells in a warmer and more acidic future ocean using 3D micro-computed tomography. Front. Mar. Sci. 8:645660. doi: 10.3389/fmars.2021.645660
Chowdhury, M. S. N., Walles, B., Sharifuzzaman, S. M., Shahadat Hossain, M., Ysebaert, T., and Smaal, A. C. (2019). Oyster breakwater reefs promote adjacent mudflat stability and salt marsh growth in a monsoon dominated subtropical coast. Sci. Rep. 9:8549. doi: 10.1038/s41598-019-44925-6
Chung, D., Hutchins, N., Schultz, M. P., and Flack, K. A. (2021). Predicting the drag of rough surfaces. Annu. Rev. Fluid Mech. 53, 439–471. doi: 10.1146/annurev-fluid-062520-115127
Clifford, N. J., Robert, A., and Richards, K. S. (1992). Estimation of flow resistance in gravel-bedded rivers: a physical explanation of the multiplier of roughness length. Earth Surf. Process. Landforms 17, 111–126. doi: 10.1002/esp.3290170202
Colden, A. M., Latour, R. J., and Lipcius, R. N. (2017). Reef height drives threshold dynamics of restored oyster reefs. Mar. Ecol. Prog. Ser. 582, 1–13. doi: 10.3354/meps12362
Coleman, S. E., Nikora, V. I., and Aberle, J. (2011). Interpretation of alluvial beds through bed-elevation distribution moments. Water Resour. Res. 47:W11505. doi: 10.1029/2011WR010672
Crameri, F. (2018). Geodynamic diagnostics, scientific visualisation and StagLab 3.0. Geosci. Model Dev. 11, 2541–2562. doi: 10.5194/gmd-11-2541-2018
Cullen, N. D., Verma, A. K., and Bourke, M. C. (2018). A comparison of structure from motion photogrammetry and the traversing micro-erosion meter for measuring erosion on shore platforms. Earth Surf. Dynam. 6, 1023–1039. doi: 10.5194/esurf-6-1023-2018
Diederich, S. (2005). Invasion of Pacific oysters (Crassostrea gigas) in the Wadden Sea: Competitive Advantage Over Native Mussels. Ph.D. Dissertation. Kiel: University Kiel.
Djuricic, A., Dorninger, P., Nothegger, C., Harzhauser, M., Székely, B., Rasztovits, S., et al. (2016). High-resolution 3D surface modeling of a fossil oyster reef. Geosphere 12, 1457–1477. doi: 10.1130/GES01282.1
Dye, B., Jose, F., Richard, J., Mortensen, J. B., and Milbrandt, E. C. (2021). An agent-based model accurately predicts larval dispersal and identifies restoration and monitoring priorities for eastern oyster (Crassostrea virginica) in a Southwest Florida estuary. Restor. Ecol. 30:e13487. doi: 10.1111/rec.13487
Ewers-Saucedo, C., Heuer, N., Moesges, Z., Ovenbeck, K., Schröter, N., and Brandis, D. (2020). First record of the Pacific oyster Magallana gigas (Thunberg, 1793) in the Baltic Sea proper. Mar. Biodivers. Rec. 13, 1–5. doi: 10.1186/s41200-020-00193-2
Flack, K. A., and Schultz, M. P. (2010). Review of hydraulic roughness scales in the fully rough regime. J. Fluids Eng 132:041203. doi: 10.1115/1.4001492
Flack, K. A., and Schultz, M. P. (2014). Roughness effects on wall-bounded turbulent flows. Phys. Fluids 26:101305. doi: 10.1063/1.4896280
Folmer, E. O., Drent, J., Troost, K., Büttger, H., Dankers, N., Jansen, J., et al. (2014). Large-scale spatial dynamics of intertidal mussel (Mytilus edulis L.) bed coverage in the German and Dutch Wadden Sea. Ecosystems 17, 550–566. doi: 10.1007/s10021-013-9742-4
Folmer, E., Büttger, H., Herlyn, M., Markert, A., Millat, G., Troost, K., et al. (2017). “Beds of blue mussels and Pacific oysters,” in Wadden Sea Quality Status Report 2017, eds S. Kloepper et al. (Wilhelmshaven: Common Wadden Sea Secretary).
Frey, R. W., Basan, P. B., and Smith, J. M. (1987). Rheotaxis and distribution of oysters and mussels, Georgia tidal creeks and salt marshes, U.S.A. Palaeogeogr. Palaeoclimatol. Palaeoecol. 61, 1–16. doi: 10.1016/0031-0182(87)90038-1
García-March, J. R., Pérez-Rojas, L., and García-Carrascosa, A. M. (2007). Influence of hydrodynamic forces on population structure of Pinna nobilis L., 1758 (Mollusca: Bivalvia): the critical combination of drag force, water depth, shell size and orientation. J. Exp. Mar. Biol. Ecol. 342, 202–212. doi: 10.1016/j.jembe.2006.09.007
Grabowski, J. H. (2004). Habitat complexity disrupts predator-prey interactions but not the trophic cascade on oyster reefs. Ecology 85, 995–1004. doi: 10.1890/03-0067
Grabowski, J. H., and Powers, S. P. (2004). Habitat complexity mitigates trophic transfer on oyster reefs. Mar. Ecol. Prog. Ser. 277, 291–295. doi: 10.3354/meps277291
Grinnell, R. S. (1974). Vertical orientation of shells on some florida oyster reefs. J. Sediment. Res. 44, 116–122. doi: 10.1306/74D72996-2B21-11D7-8648000102C1865D
Gutiérrez, J. L., Jones, C. G., Strayer, D. L., and Iribarne, O. O. (2003). Mollusks as ecosystem engineers: the role of shell production in aquatic habitats. Oikos 101, 79–90. doi: 10.1034/j.1600-0706.2003.12322.x
Hagen, R., Plüß, A., Freund, J., Ihde, R., Kösters, F., Schrage, N., et al. (2020). Data From: EasyGSH-DB: Themengebiet - Hydrodynamik. Karlsruhe: Bundesanstalt für Wasserbau. doi: 10.48437/02.2020.K2.7000.0003
Harzhauser, M., Djuricic, A., Mandic, O., Zuschin, M., Dorninger, P., Nothegger, C., et al. (2015). Disentangling the history of complex multi-phased shell beds based on the analysis of 3D point cloud data. Palaeogeogr. Palaeoclimatol. Palaeoecol. 437, 165–180. doi: 10.1016/j.palaeo.2015.07.038
Hayward, P. J., and Ryland, J S (eds.) (2017). Handbook of the Marine Fauna of North-West Europe, Second Edn. Oxford: Oxford University Press.
Hossain, M. S., Rothuis, A., Chowdhury, S. R., Smaal, A. C., Ysebaert, T., Sharifuzzaman, S. M., et al. (2013). Oyster aquaculture for coastal defense with food production in Bangladesh. Aquacult. Asia 18, 15–24.
James, M. R., and Robson, S. (2014). Mitigating systematic error in topographic models derived from UAV and ground-based image networks. Earth Surf. Process. Landforms 39, 1413–1420. doi: 10.1002/esp.3609
James, M. R., Robson, S., d’Oleire-Oltmanns, S., and Niethammer, U. (2017). Optimising UAV topographic surveys processed with structure-from-motion: ground control quality, quantity and bundle adjustment. Geomorphology 280, 51–66. doi: 10.1016/j.geomorph.2016.11.021
Jelly, T. O., and Busse, A. (2018). Reynolds and dispersive shear stress contributions above highly skewed roughness. J. Fluid Mech. 852, 710–724. doi: 10.1017/jfm.2018.541
Jones, C. G., Lawton, J. H., and Shachak, M. (1994). Organisms as ecosystem engineers. Oikos 69, 373–386. doi: 10.2307/3545850
Jones, C. G., Lawton, J. H., and Shachak, M. (1997). Positive and negative effects of organisms as physical ecosystem engineers. Ecology 78, 1946–1957. doi: 10.2307/2265935
Keklikoglou, K., Arvanitidis, C., Chatzigeorgiou, G., Chatzinikolaou, E., Karagiannidis, E., Koletsa, T., et al. (2021). Micro-CT for biological and biomedical studies: a comparison of imaging techniques. J. Imaging 7:172. doi: 10.3390/jimaging7090172
Kitsikoudis, V., Kibler, K. M., and Walters, L. J. (2020). In-situ measurements of turbulent flow over intertidal natural and degraded oyster reefs in an estuarine lagoon. Ecol. Eng. 143:105688. doi: 10.1016/j.ecoleng.2019.105688
Kjelland, M. E., Piercy, C. D., Lackey, T., and Swannack, T. M. (2015). An integrated modeling approach for elucidating the effects of different management strategies on Chesapeake Bay oyster metapopulation dynamics. Ecol. Model. 308, 45–62. doi: 10.1016/j.ecolmodel.2015.03.012
Krämer, K., and Winter, C. (2016). Predicted ripple dimensions in relation to the precision of in situ measurements in the southern North Sea. Ocean Sci. 12, 1221–1235. doi: 10.5194/os-12-1221-2016
Le Goïc, G., Bigerelle, M., Samper, S., Favrelière, H., and Pillet, M. (2015). Multiscale roughness analysis of engineering surfaces: a comparison of methods for the investigation of functional correlations. Mech. Syst. Signal Process. 66-67, 437–457. doi: 10.1016/j.ymssp.2015.05.029
Lefebvre, A., Thompson, C., and Amos, C. L. (2010). Influence of Zostera marina canopies on unidirectional flow, hydraulic roughness and sediment movement. Cont. Shelf Res. 30, 1783–1794. doi: 10.1016/j.csr.2010.08.006
Leon, J. X., Roelfsema, C. M., Saunders, M. I., and Phinn, S. R. (2015). Measuring coral reef terrain roughness using ‘Structure-from-Motion’ close-range photogrammetry. Geomorphology 242, 21–28. doi: 10.1016/j.geomorph.2015.01.030
Lipcius, R. N., Burke, R. P., McCulloch, D. N., Schreiber, S. J., Schulte, D. M., Seitz, R. D., et al. (2015). Overcoming restoration paradigms: value of the historical record and metapopulation dynamics in native oyster restoration. Front. Mar. Sci. 2:65. doi: 10.3389/fmars.2015.00065
Liu, G., Wang, J., Dong, P., Chen, Y., and Liu, Z. (2018). Estimating individual tree height and diameter at breast height (DBH) from terrestrial laser scanning (TLS) data at plot level. Forests 9:398. doi: 10.3390/f9070398
Manis, J. E., Garvis, S. K., Jachec, S. M., and Walters, L. J. (2015). Wave attenuation experiments over living shorelines over time: a wave tank study to assess recreational boating pressures. J. Coast. Conserv. 19, 1–11. doi: 10.1007/s11852-014-0349-5
Mann, R., Southworth, M., Harding, J. M., and Wesson, J. A. (2009). Population studies of the native Eastern oyster, Crassostrea virginica, (Gmelin, 1791) in the James River, Virginia, USA. J. Shellfish Res. 28, 193–220. doi: 10.2983/035.028.0203
Margiotta, A. M., Shervette, V. R., Hadley, N. H., Plante, C. J., and Wilber, D. H. (2016). Species-specific responses of resident crabs to vertical habitat complexity on intertidal oyster reefs. J. Exp. Mar. Biol. Ecol. 477, 7–13. doi: 10.1016/j.jembe.2016.01.007
Markert, A. (2020). How dense is dense? Toward a harmonized approach to characterizing reefs of non-native Pacific oysters – with consideration of native mussels. NB 57, 7–52. doi: 10.3897/neobiota.57.49196
Markert, A., Esser, W., Frank, D., Wehrmann, A., and Exo, K.-M. (2013). Habitat change by the formation of alien Crassostrea-reefs in the Wadden Sea and its role as feeding sites for waterbirds. Estuar. Coast. Shelf Sci. 131, 41–51. doi: 10.1016/j.ecss.2013.08.003
Markert, A., Wehrmann, A., and Kröncke, I. (2010). Recently established Crassostrea-reefs versus native Mytilus-beds: differences in ecosystem engineering affects the macrofaunal communities (Wadden Sea of Lower Saxony, southern German Bight). Biol. Invasions 12, 15–32. doi: 10.1007/s10530-009-9425-4
Meyer, D. L., Townsend, E. C., and Thayer, G. W. (1997). Stabilization and Erosion Control Value of Oyster Cultch for Intertidal Marsh. Restor. Ecol. 5, 93–99. doi: 10.1046/j.1526-100X.1997.09710.x
Micheletti, N., Chandler, J. H., and Lane, S. N. (2015). Investigating the geomorphological potential of freely available and accessible structure-from-motion photogrammetry using a smartphone. Earth Surf. Process. Landforms 40, 473–486. doi: 10.1002/esp.3648
Miossec, L., Le Dueff, R.-M., and Goulletquer, P. (2009). Alien species alert: Crassostrea gigas (Pacific oyster). ICES Cooperative Res. 299:42.
Mirfenderesk, H., and Young, I. R. (2003). Direct measurements of the bottom friction factor beneath surface gravity waves. Appl. Ocean Res. 25, 269–287. doi: 10.1016/j.apor.2004.02.002
Morgan, J. A., Brogan, D. J., and Nelson, P. A. (2017). Application of Structure-from-Motion photogrammetry in laboratory flumes. Geomorphology 276, 125–143. doi: 10.1016/j.geomorph.2016.10.021
Morris, R. L., La Peyre, M. K., Webb, B. M., Marshall, D. A., Bilkovic, D. M., Cebrian, J., et al. (2021). Large-scale variation in wave attenuation of oyster reef living shorelines and the influence of inundation duration. Ecol. Appl. 31:e02382. doi: 10.1002/eap.2382
Moulin, F. Y., Guizien, K., Thouzeau, G., Chapalain, G., Mülleners, K., and Bourg, C. (2007). Impact of an invasive species, Crepidula fornicata, on the hydrodynamics and transport properties of the benthic boundary layer. Aquat. Living Resour. 20, 15–31. doi: 10.1051/alr:2007012
Musker, A. J. (1980). Universal roughness functions for naturally-occurring surfaces. Trans. Can. Soc. Mech. Eng. 6, 1–6. doi: 10.1139/tcsme-1980-0001
Nagle, J. S. (1967). Wave and current orientation of shells. J. Sediment. Res. 37, 1124–1138. doi: 10.1306/74D71848-2B21-11D7-8648000102C1865D
Nationalparkverwaltung Niedersächsisches Wattenmeer. (2021). Shape File of Mussel Beds 2020. Wilhelmshaven: Nationalparkverwaltung Niedersächsisches Wattenmeer.
Navaratnam, C. U., Aberle, J., Qin, J., and Henry, P.-Y. (2018). Influence of gravel-bed porosity and grain orientation on bulk flow resistance. Water 10:561. doi: 10.3390/w10050561
Nehls, G., Büttger, H., and Ruth, M. (2011). Miesmuschelmonitoring und Miesmuschelmanagement im Nationalpark Schleswig-Holsteinisches Wattenmeer. Husum: BioConsult SH.
Nehring, S. (2011). NOBANIS - Invasive Alien Species Fact Sheet - Crassostrea gigas. From: Online Database of the European Network on Invasive Alien Species - NOBANIS. Bonn: NOBANIS.
Nikora, V. I., Goring, D. G., and Biggs, B. J. F. (1998). On gravel-bed roughness characterization. Water Resour. Res. 34, 517–527. doi: 10.1029/97WR02886
Nikora, V., and Walsh, J. (2004). Water-worked gravel surfaces: high-order structure functions at the particle scale. Water Resour. Res. 40:W12601. doi: 10.1029/2004WR003346
Piazza, B. P., Banks, P. D., and La Peyre, M. K. (2005). The potential for created oyster shell reefs as a sustainable shoreline protection strategy in Louisiana. Restor. Ecol. 13, 499–506. doi: 10.1111/j.1526-100X.2005.00062.x
Powell, D. M. (2014). Flow resistance in gravel-bed rivers: progress in research. Earth Sci. Rev. 136, 301–338. doi: 10.1016/j.earscirev.2014.06.001
Qin, J., Aberle, J., Henry, P.-Y., Wu, T., and Zhong, D. (2019). Statistical significance of spatial correlation patterns in armoured gravel beds. J. Hydraul. Res. 57, 90–106. doi: 10.1080/00221686.2018.1459894
Quayle, D. B. (1988). Pacific oyster culture in British Columbia. Can. Bull. Fish. Aqua. Sci. 218:241.
Raja, J., Muralikrishnan, B., and Fu, S. (2002). Recent advances in separation of roughness, waviness and form. Precision Eng. 26, 222–235. doi: 10.1016/S0141-6359(02)00103-4
Reidenbach, M. A., Berg, P., Hume, A., Hansen, J. C. R., and Whitman, E. R. (2013). Hydrodynamics of intertidal oyster reefs: the influence of boundary layer flow processes on sediment and oxygen exchange. Limnol. Oceanogr. 3, 225–239. doi: 10.1215/21573689-2395266
Reise, K. (1998). Pacific Oysters Invade Mussel Beds in the European Wadden Sea. Senckenberg. Marit. 28, 167–175. doi: 10.1007/bf03043147
Reise, K., Buschbaum, C., Büttger, H., Rick, J., and Wegner, K. M. (2017). Invasion trajectory of Pacific oysters in the northern Wadden Sea. Mar. Biol. 164:68. doi: 10.1007/s00227-017-3104-2
Ridge, J. T., Rodriguez, A. B., and Fodrie, F. J. (2017). Evidence of exceptional oyster-reef resilience to fluctuations in sea level. Ecol. Evol. 7, 10409–10420. doi: 10.1002/ece3.3473
Ridge, J. T., Rodriguez, A. B., Joel Fodrie, F., Lindquist, N. L., Brodeur, M. C., Coleman, S. E., et al. (2015). Maximizing oyster-reef growth supports green infrastructure with accelerating sea-level rise. Sci. Rep. 5:14785. doi: 10.1038/srep14785
Rodriguez, A. B., Fodrie, F. J., Ridge, J. T., Lindquist, N. L., Theuerkauf, E. J., Coleman, S. E., et al. (2014). Oyster reefs can outpace sea-level rise. Nat. Clim. Change 4, 493–497. doi: 10.1038/NCLIMATE2216
Sanderson, D. J., and Donovan, R. N. (1974). The vertical packing of shells and stones on some recent beaches. J. Sediment. Res. 44, 680–688. doi: 10.1306/74D72ACC-2B21-11D7-8648000102C1865D
Schendel, A., Goseberg, N., and Schlurmann, T. (2016). Erosion Stability of Wide-Graded Quarry-stone material under unidirectional current. J. Waterway Port Coast. Ocean Eng. 142: 04015023. doi: 10.1061/(ASCE)WW.1943-5460.0000321
Schendel, A., Goseberg, N., and Schlurmann, T. (2018a). Influence of reversing currents on the erosion stability and bed degradation of widely graded grain material. Int. J. Sediment. Res. 33, 68–83. doi: 10.1016/j.ijsrc.2017.07.002
Schendel, A., Hildebrandt, A., Goseberg, N., and Schlurmann, T. (2018b). Processes and evolution of scour around a monopile induced by tidal currents. Coast. Eng. 139, 65–84. doi: 10.1016/j.coastaleng.2018.05.004
Schulte, D. M., Burke, R. P., and Lipcius, R. N. (2009). Unprecedented Restoration of a Native Oyster Metapopulation. Science 325, 1124–1128. doi: 10.1126/science.1176516
Sievers, J., Rubel, M., and Milbradt, P. (2020). Data from: EasyGSH-DB: Themengebiet - Geomorphologie. Karlsruhe: Bundesanstalt für Wasserbau. doi: 10.48437/02.2020.K2.7000.0001
Smaal, A. C., Kater, B. J., and Wijsman, J. (2009). Introduction, establishment and expansion of the Pacific oyster Crassostrea gigas in the Oosterschelde (SW Netherlands). Helgol. Mar. Res. 63, 75–83. doi: 10.1007/s10152-008-0138-3
Smaal, A. C., Stralen, M., and Craeymeersch, J. (2005). “Does the introduction of the Pacific oyster Crassostrea gigas lead to species shifts in the Wadden Sea?,” in The Comparative Roles of Suspension-Feeders in Ecosystems. NATO Science Series IV: Earth and Environmental Series, Vol. 47, eds R. F. Dame and S. Olenin (Dordrecht: Springer), 277–289. doi: 10.1007/1-4020-3030-4_16
Smart, G., Aberle, J., Duncan, M., and Walsh, J. (2004). Measurement and analysis of alluvial bed roughness / Mesure et analyse de la rugosité de lit d’alluvion. J. Hydraul. Res. 42, 227–237. doi: 10.1080/00221686.2004.9641191
Styles, R. (2015). Flow and Turbulence over an Oyster Reef. J. Coast. Res. 31, 978–985. doi: 10.2112/JCOASTRES-D-14-00115.1
Taylor, J., and Bushek, D. (2008). Intertidal oyster reefs can persist and function in a temperate North American Atlantic estuary. Mar. Ecol. Prog. Ser. 361, 301–306. doi: 10.3354/meps07429
Thompson, C., Williams, J. J., Metje, N., Coates, L. E., and Pacheco, A. (2012). Turbulence based measurements of wave friction factors under irregular waves on a gravel bed. Coast. Eng. 63, 39–47. doi: 10.1016/j.coastaleng.2011.12.011
Tibabuzo Perdomo, A. M., Alberts, E. M., Taylor, S. D., Sherman, D. M., Huang, C.-P., and Wilker, J. J. (2018). Changes in cementation of reef building oysters transitioning from larvae to adults. ACS Appl. Mater. Interf. 10, 14248–14253. doi: 10.1021/acsami.8b01305
van der Zee, E. M., van der Heide, T., Donadi, S., Eklöf, J. S., Eriksson, B. K., Olff, H., et al. (2012). Spatially extended habitat modification by intertidal reef-building bivalves has implications for consumer-resource interactions. Ecosystems 15, 664–673. doi: 10.1007/s10021-012-9538-y
van Leeuwen, B., Augustijn, D., van Wesenbeeck, B. K., Hulscher, S., and de Vries, M. B. (2010). Modeling the influence of a young mussel bed on fine sediment dynamics on an intertidal flat in the Wadden Sea. Ecol. Eng. 36, 145–153. doi: 10.1016/j.ecoleng.2009.01.002
Verma, A. K., and Bourke, M. C. (2019). A method based on structure-from-motion photogrammetry to generate sub-millimetre-resolution digital elevation models for investigating rock breakdown features. Earth Surf. Dynam. 7, 45–66. doi: 10.5194/esurf-7-45-2019
Vozzo, M. L., Cumbo, V. R., Crosswell, J. R., and Bishop, M. J. (2021). Wave energy alters biodiversity by shaping intraspecific traits of a habitat-forming species. Oikos 130, 52–65. doi: 10.1111/oik.07590
Wagner, E., Dumbauld, B. R., Hacker, S. D., Trimble, A. C., Wisehart, L. M., and Ruesink, J. L. (2012). Density-dependent effects of an introduced oyster, Crassostrea gigas, on a native intertidal seagrass, Zostera marina. Mar. Ecol. Prog. Ser. 468, 149–160. doi: 10.3354/meps09952
Walles, B., Salvador de Paiva, J., van Prooijen, B. C., Ysebaert, T., and Smaal, A. C. (2015b). The ecosystem engineer Crassostrea gigas affects tidal flat morphology beyond the boundary of their reef structures. Estuaries Coast. 38, 941–950. doi: 10.1007/s12237-014-9860-z
Walles, B., Mann, R., Ysebaert, T., Troost, K., Herman, P. M., and Smaal, A. C. (2015a). Demography of the ecosystem engineer Crassostrea gigas, related to vertical reef accretion and reef persistence. Estuar. Coast. Shelf Sci. 154, 224–233. doi: 10.1016/j.ecss.2015.01.006
Wang, Q., Pan, Y., Yang, K., and Nie, R. (2020). Structural properties of the static armor during formation and reestablishment in gravel-bed rivers. Water 12:1845. doi: 10.3390/w12071845
Wehrmann, A. (2006). Gefährdungspotenzial der eulitoralen Miesmuschelbänke im Niedersächsischen Wattenmeer durch die Bioinvasion der Pazifischen Auster Crassostrea gigas. Wilhelmshaven: Forschungsinstitut Senckenberg.
Wehrmann, A., Herlyn, M., Bungenstock, F., Hertweck, G., and Millat, G. (2000). The distribution gap is closed — First record of naturally settled pacific oysters Crassostrea gigas in the East Frisian Wadden Sea, North Sea. Senckenberg. Marit. 30, 153–160. doi: 10.1007/bf03042964
Welzel, M., Schendel, A., Goseberg, N., Hildebrandt, A., and Schlurmann, T. (2020). Influence of structural elements on the spatial sediment displacement around a jacket-type offshore foundation. Water 12:1651. doi: 10.3390/w12061651
Welzel, M., Schendel, A., Schlurmann, T., and Hildebrandt, A. (2019). Volume-based assessment of erosion patterns around a hydrodynamic transparent offshore structure. Energies 12:3089. doi: 10.3390/en12163089
Westfall, P. H. (2014). Kurtosis as Peakedness, 1905 - 2014. R.I.P. Am. Stat. 68, 191–195. doi: 10.1080/00031305.2014.917055
Westoby, M. J., Brasington, J., Glasser, N. F., Hambrey, M. J., and Reynolds, J. M. (2012). ‘Structure-from-Motion’ photogrammetry: a low-cost, effective tool for geoscience applications. Geomorphology 179, 300–314. doi: 10.1016/j.geomorph.2012.08.021
Whitman, E. R., and Reidenbach, M. A. (2012). Benthic flow environments affect recruitment of Crassostrea virginica larvae to an intertidal oyster reef. Mar. Ecol. Prog. Ser. 463, 177–191. doi: 10.3354/meps09882
Wrange, A.-L., Valero, J., Harkestad, L. S., Strand, Ø, Lindegarth, S., Christensen, H. T., et al. (2010). Massive settlements of the Pacific oyster, Crassostrea gigas, in Scandinavia. Biol. Invasions 12, 1145–1152. doi: 10.1007/s10530-009-9535-z
Keywords: oyster reef, Magallana gigas, bed roughness, invasive species, ecosystem engineer, field study, wave attenuation, current attenuation
Citation: Hitzegrad J, Brohmann L, Pfennings K, Hoffmann TK, Eilrich AK, Paul M, Welzel M, Schlurmann T, Aberle J, Wehrmann A and Goseberg N (2022) Oyster Reef Surfaces in the Central Wadden Sea: Intra-Reef Classification and Comprehensive Statistical Description. Front. Mar. Sci. 9:808018. doi: 10.3389/fmars.2022.808018
Received: 02 November 2021; Accepted: 27 January 2022;
Published: 09 March 2022.
Edited by:
Zeng Zhou, Hohai University, ChinaReviewed by:
Christian Buschbaum, Alfred Wegener Institute, Helmholtz Centre for Polar and Marine Research (AWI), GermanyAndrew M. Fischer, University of Tasmania, Australia
Copyright © 2022 Hitzegrad, Brohmann, Pfennings, Hoffmann, Eilrich, Paul, Welzel, Schlurmann, Aberle, Wehrmann and Goseberg. This is an open-access article distributed under the terms of the Creative Commons Attribution License (CC BY). The use, distribution or reproduction in other forums is permitted, provided the original author(s) and the copyright owner(s) are credited and that the original publication in this journal is cited, in accordance with accepted academic practice. No use, distribution or reproduction is permitted which does not comply with these terms.
*Correspondence: Jan Hitzegrad, j.hitzegrad@tu-braunschweig.de