Wild-caught fish populations targeted by MSC-certified fisheries have higher relative abundance than non-MSC populations
 Michael C. Melnychuk1,2*
  Alessio Veneziano1
  Samantha Lees1
  Jennifer Rasal1
  Lauren M. Koerner1
  Peter Hair1
  David Costalago1 Daniel Hively2
  Ernesto Jardim1
  Catherine Longo1
- 1Marine Stewardship Council, London, United Kingdom
- 2School of Aquatic and Fishery Sciences, University of Washington, Seattle, WA, United States
Requirements for a fishery to achieve Marine Stewardship Council (MSC) certification include demonstrating that targeted populations (‘MSC stocks’) are fished at sustainable levels. The credibility of this claim can be evaluated by comparing estimated abundance of MSC stocks to benchmarks based on sustainability criteria. Additionally, to evaluate whether MSC certification provides a meaningful distinction, the sustainability status of MSC stocks can be compared with that of populations without a linked certificate (‘non-MSC stocks’). It is expected that MSC stocks are more likely to be maintained at levels of high abundance relative to sustainability benchmarks compared to non-MSC stocks. Similarly, it is expected that MSC stocks are less likely to become overfished, and if they do become overfished, that fisheries are incentivised to aid in their rebuilding to avoid suspension of certification. We compare published biomass estimates relative to biological reference points between MSC stocks and non-MSC stocks of wild-caught marine fish and invertebrate species around the world. These are observational data, and though we control for the propensity of certification, certification is not independent of relative biomass and therefore we describe associations rather than causal influences. Individual stocks from both groups were highly variable in relative biomass trends over the past two decades, with substantial overlap in the distributions of MSC and non-MSC stocks. In recent years (2014-2018), MSC stocks had, on average, greater biomass relative to biomass at maximum sustainable yield (BMSY) than non-MSC stocks. MSC stocks were also less frequently overfished compared to non-MSC stocks, with estimated biomass below a limit reference point (Blim) for 9% of MSC stocks and for 26-33% of non-MSC stocks. Eight MSC stocks currently or previously certified and defined as overfished in 2017 or 2018 had previously entered the program based on scientific advice available at the time indicating they were fished within sustainable limits. Subsequently, when revised stock assessments estimated the biomass to be lower than previously thought, fisheries for those stocks were suspended from certification. Together, these results suggest that eco-certification is associated with a credible claim on sustainable stock status and provides a useful distinction from other seafood. Further, our results show how the rare exceptions to this pattern may arise from retrospective changes in scientific advice.
Introduction
Eco-certification and eco-labelling programs are market-driven incentive mechanisms to achieve positive societal and environmental outcomes (ISEAL, 2014; Komives et al., 2018). In the case of seafood products, the Marine Stewardship Council (MSC) is a leading global organisation with an established set of processes and requirements (hereafter, ‘the Standard’) against which fisheries can apply to be audited to demonstrate adherence (MSC, 2018). The theory of change underlying programs like the MSC assumes that producers will make any changes necessary to align with the sustainability requirements of the eco-certification standard in order to achieve a distinctive recognition that secures new market opportunities or price premiums, improves their reputation (Roheim et al., 2018; Arton et al., 2020), and strengthens their license to operate (Robinson et al., 2021). These changes often entail active involvement of fishers and other stakeholders in lobbying for management change (Foley and McCay, 2014; Gutiérrez and Morgan, 2015) and in fostering compliance (Longo et al., 2021) to accelerate entry into the program. Once certified, fisheries must demonstrate continued compliance to the Standard in order to remain certified. The Standard covers a range of requirements, among which is that populations (or ‘stocks’) targeted by MSC-certified fisheries must be fished within biologically sustainable limits (MSC, 2018).
The power of eco-labelling programs to deliver change relies on trust from consumers and stakeholders that the ecolabel is a credible indicator that the product meets the sustainability characteristics claimed (Roheim et al., 2018). The credibility of the claim around sustainable stock status for MSC-certified fisheries can be evaluated with independent data to confirm they meet requirements set in the Standard (ISEAL, 2014). But to provide added market value, it is not enough to be credible. In addition, a label needs to reflect attributes that are important to consumers and that are not necessarily found in unlabelled products. Consumers and supply chains value the ability to differentiate certified products because of a greater expectation of sustainable fishing practices compared to non-certified seafood. Previous critiques have been raised about the MSC program’s credibility and relevance (e.g., Christian et al., 2013; Opitz et al., 2016; le Manach et al., 2020); here we address these concepts as they apply to the abundance of fish populations evaluated under MSC certificates.
Given the requirement of sustainable fishing to achieve and maintain MSC certification, one might expect that stocks targeted by MSC-certified fisheries (hereafter, ‘MSC stocks’) should be at abundance levels and under fishing pressures that are likely to ensure long-term sustainability of fishing activities. Similarly, on average one might expect the sustainability status of these stocks to be preferable compared to stocks targeted by fleets lacking certification (hereafter, ‘non-MSC stocks’). In fisheries, criteria for identifying ‘sustainable’ status are well established (e.g., Hilborn and Walters, 1992; Mace, 1994; Restrepo et al., 1998; Worm et al., 2009; Rice, 2014). Estimated abundance over time (typically expressed as biomass, B, or the total weight of a segment of a population) is benchmarked against a biological reference point, BBRP; their ratio B/BBRP is referred to as ‘relative biomass’. Some biomass reference points represent limits (Blim) that are meant to be avoided; these thresholds are defined differently among management agencies (Hilborn, 2020), and include the level below which a fish stock is considered to be overfished (Methot et al., 2014) or the level below which recruitment is impaired (MSC, 2018; ICES, 2021a). If biomass falls below Blim, a range of management actions may be triggered including the implementation of a rebuilding plan or a moratorium on all targeted fishing. Other biomass reference points reflect management targets for maintaining productive populations that can be fished sustainably. These targets are often related to maximum sustainable yield (MSY) or proxies for MSY (Mace, 1994; FAO, 1995); the equilibrium biomass expected to result from catching MSY annually is denoted as BMSY. Population abundance commonly fluctuates over time as a result of both fishing and environmental conditions, and fishing pressure can be adjusted annually so that abundance fluctuates around BMSY or other targets and usually avoids depletion below Blim.
Previous studies have compared relative biomass between MSC stocks non-MSC stocks (Froese and Proelss, 2012; Gutiérrez et al., 2012; MSC, 2016; Opitz et al., 2016; MSC, 2017). However, these were based on data from an earlier period of the MSC program, which has since expanded annually to cover a greater number and diversity of fisheries around the world (Figure 1). As of March 2021, there were 1325 active ‘Units of certification’ [UoC, which are unique combinations of target stock, fishing method/gear and fishing practice including vessel(s)] in 55 countries, representing 14% of the world’s wild marine catch certified to the Standard (MSC, 2021). In addition, another 158 UoCs (and 3% of catch) were under suspension. Over the last decade, the number of stocks with quantitative assessments estimating relative biomass that have been assembled into a publicly-available database (Ricard et al., 2012; RAMLDB, 2021) has also greatly increased (Figure 1). The RAMLDB contains contributed data from scientists around the world, and is not assembled by MSC or any affiliated entity. This provides an independent dataset to validate whether MSC stocks indeed meet the requirements set out in the Standard, i.e., the credibility of the MSC claim. At the same time, it may be used to validate whether these stocks depart from the average status of non-MSC stocks in the same regions (and therefore subject to similar management regimes), i.e., the relevance of the MSC claim.

Figure 1 Growth of Marine Stewardship Council (MSC) program and RAM Legacy Stock Assessment Database (RAMLDB) over two decades. RAMLDB counts (reds; on left axis) show the end-of-year number of stocks with available catch data and number of stocks with B/BMSY time series available. MSC series (blues) show (on right axis) the end-of-year number of UoCs (which are the units evaluated separately under a certificate, identified by the target stock combined with the fishing method/gear and fishing practice, including vessel(s), pursuing that stock) and (on left axis) number of stocks in analyses here that are linked to ≥1 UoCs.
In this study, we explore stock status data associated with MSC certification. We compare relative biomass estimates between MSC stocks and non-MSC stocks. First, to evaluate a current snapshot of population abundance in relation to overfished thresholds, we quantify the frequency of biomass falling below limit reference points and compare this frequency between MSC and non-MSC stocks in year 2018 (this year was selected to balance a trade-off of recency and availability of biomass estimates across geographic regions, as more recent assessments for stocks in some regions were limited.). Second, to establish if MSC stocks better adhere to the management target than non-MSC stocks, we compare relative biomass trajectories between MSC stocks and non-MSC stocks for the period 2000-2018, representing the history of the MSC program. A subsequent comparison, designed to gain a recent snapshot of such dynamic fluctuations, involves comparing relative biomass between MSC stocks and non-MSC stocks in 2018. Finally, we investigate some of the causes and consequences of the rare occurrences when biomass of MSC stocks fell below the overfished threshold. These analyses rely on observational data. We attempt to control for the self-selection of fisheries into the ‘MSC stock’ group by accounting for the propensity of stocks to be linked to certified fisheries, but given the potential for influential factors in common, we do not aim to demonstrate a casual effect of MSC certification on stock status. Nevertheless, comparing stock status measures between MSC stocks and non-MSC stocks may reveal differences between them in sustainability criteria that form the basis for the claim of distinction associated with the MSC ecolabel.
Materials and methods
Principles of the MSC Fisheries Standard
The three Principles of the Standard (MSC, 2018) require that fishing operations:
(1) must be conducted in a manner that does not lead to over-fishing or depletion of the exploited populations and, for those populations that are depleted, the fishery must be conducted in a manner that demonstrably leads to their recovery;
(2) should allow for the maintenance of the structure, productivity, function and diversity of the ecosystem (including habitat and associated dependent and ecologically related species) on which the fishery depends; and
(3) is subject to an effective management system that respects local, national and international laws and standards and incorporates institutional and operational frameworks that require use of the resource to be responsible and sustainable.
These principles were designed to operationalise the guidelines laid out in the United Nations Food and Agriculture Organisation’s (FAO) Code of Conduct for Responsible Fisheries (FAO, 1995), and were informed by what are considered established best practices based on expert advice and broad stakeholder consultations. These principles are continuously updated through a Fisheries Standard Review process which involves public consultation, in compliance with FAO Guidelines on Ecolabeling (FAO, 2009) and the assurance code of the International Social and Environmental Accreditation and Labelling Alliance (ISEAL, 2014).
This study mainly focuses on one specific aspect of Principle 1—the biomass of individual target stocks with respect to benchmark reference points set by management agencies on the basis of sustainable harvesting criteria. This focus aligns with requirements under Principle 3 because effective management systems are usually required to maintain or restore stocks to sustainable levels, but this study does not explicitly address those management systems, nor other criteria such as dispute resolution mechanisms, stakeholder involvement in decision-making, or wider ecosystem-level considerations (MSC, 2018).
Classifying MSC and non-MSC stocks
The unit of observation in this study is the biological ‘stock’, a marine fish or invertebrate population as defined in a stock assessment involving a population model. A stock usually consists of individuals of a single species over a defined area of distribution but may occasionally involve a group of closely-related species. Stocks are not themselves certified by MSC, but a fishery targeting one or more stocks may apply to be certified by a third party against the Standard. The term ‘fishery’ here is used to refer to a self-identified group of harvesters associated with a MSC certificate, often belonging to defined producer associations and, where applicable, a specific list of vessels. This definition differs from that used in other contexts, where ‘fishery’ can refer more broadly to the whole fleet fishing a certain species in a particular region, with vessels varying by year or season, and may even include the first buyers or processors involved. A UoC is essentially the intersection of a stock and a fishery; a single stock may be linked to multiple MSC fisheries and a single MSC fishery may target multiple stocks.
Though all UoCs with a valid MSC certificate are considered sustainable, there may be improvements required once certified. If a UoC of a fishery meets the MSC minimum sustainability requirements but not yet ‘best practice’ requirements for a particular ‘Performance Indicator’ within the Standard, it receives conditional certification, whereby it must take action to meet best practice within a specified time or its certification will be suspended. If a ‘condition’ is assigned, the fishery’s progress will be regularly evaluated at yearly surveillance audits conducted by independent conformity assessment bodies. If the requirement is not subsequently met, or if for any other reason the UoC of the fishery is deemed to have fallen out of compliance with the MSC requirements for certification, it becomes ‘suspended’ until the issue is rectified. During suspension, a fishery is no longer able to apply the MSC ecolabel to the products of the UoC(s). If the requirements of the Standard are again met by the fishery, the suspension ends and the fishery is again eligible to potentially have its target stock(s) displaying the ecolabel. Reasons for conditions being assigned or suspensions starting may involve any of the indicators under the Standard. In this study, we consider conditions and suspensions under Principles 1 and 3. Occasionally fisheries withdraw from the MSC program while under suspension, to avoid a suspension, or for unrelated reasons. Even though they are not eligible to carry the ecolabel, we treat stocks linked to suspended or withdrawn fisheries as ‘MSC stocks’ to avoid survivorship biases when comparing against non-MSC stocks. Conditions of certification related to P1 or P3 are common, but suspensions related to P1 or P3 and withdrawals from the program are relatively rare (Supplementary Table 1).
To be considered a ‘MSC stock’, the biological stock under consideration had to be targeted by at least one fishery with active MSC certification, suspended certification, or previous certification before withdrawing from the program. Here, ‘targeted’ refers to the stock being listed as a UoC of the fishery rather than to a classification of targeting behaviour. We do not account for the proportion of a stock’s catch that is caught by one or more MSC fisheries, but instead assume that any catch by MSC fisheries is sufficient to designate it as a ‘MSC stock’. These stocks are audited under Principle 1 of the Standard, and those with active certification are eligible to carry the MSC ecolabel on seafood products. In contrast, ‘non-MSC stocks’ are targeted by fisheries with no previous history with the MSC and are not eligible to carry the ecolabel. Information used in this study regarding a stock’s MSC certification history included: (i) the year of MSC certification, or first year of certification if multiple fisheries were linked to the stock; (ii) the presence of MSC conditions on Principles 1 or 3; (iii) whether any MSC fisheries linked to the stock were under suspension related to Principles 1 or 3; and (iv) whether any fisheries linked to the stock withdrew from the MSC program.
Biomass data sources
Stock biomass data were primarily drawn from the RAM Legacy Stock Assessment Database version 4.495 ‘mdl’ (RAMLDB, 2021), a compilation of stock assessment outputs from around the world. Stock assessments are typically conducted by national or regional government agencies or advisory bodies commissioned by these agencies and are usually publicly available. In addition to estimated time series of stock biomass, biological reference points for biomass are also commonly estimated in stock assessments. Commonly-used target reference points include MSY-based reference points (BMSY), proxies for BMSY, or other types of reference points specified as targets for fisheries management (Bmgt). In contrast, limit reference points (Blim) are meant to be avoided. Some management agencies may treat BMSY as a limit which provides a more precautionary buffer, though it is more commonly treated as a target (Hilborn, 2020). If stock biomass drops below Blim, it is typically considered to be overfished or at risk of impaired recruitment, although specific thresholds used to represent Blim or to denote ‘overfished’ vary among regions and management agencies (Mace, 1994; Lassen et al., 2014; Methot et al., 2014; Rice, 2014; Hilborn, 2020). For stocks that have both BMSY and Bmgt values available, our main analysis preferentially uses BMSY values as the target for consistency with the Standard. Sensitivity analysis 1, described below, instead preferentially uses Bmgt values. For stocks that have only one value available for BMSY or Bmgt, that is assumed as the target.
In some cases, BMSY or other management targets are not estimated or presented in the original stock assessments. To increase the available sample size of stocks, our analysis relied on the ‘model-fits’ version of RAMLDB, in which missing reference points are estimated post-hoc with the use of surplus production models fit to catch and biomass time series from assessments. This procedure has been described extensively elsewhere (Worm et al., 2009; Hilborn et al., 2020; Melnychuk et al., 2020; Melnychuk et al., 2021). Quality-control checks and cross-validations ensure that estimated values of BMSY are reasonable compared to those estimated within the assessment process. Conducting this post-hoc estimation procedure provides reference points for more stocks than would be available if instead only those with estimates directly from stock assessments were used (Figure 1); in our analysis, this results in approximately 7% more stocks. Sensitivity analysis 2, described below, does not use these post-hoc reference point estimates, instead using the ‘asmt’ (assessment-only) version of RAMLDB. Neither the ‘asmt’ nor ‘mdl’ versions of RAMLDB contain estimates of uncertainty in either biomass time series or biomass reference points. We treat the outputs of stock assessments as input data known without error, and we acknowledge the criticisms of this common practice (e.g., Brooks and Deroba, 2015; Thorson et al., 2015).
Stocks in RAMLDB were matched to MSC fisheries (specifically, to the corresponding UoC of a fishery), including MSC fisheries with suspended certification or those that have withdrawn. The matching was based on species name (common and scientific names, including synonyms), the stock’s geographic area, and the areas in which the fisheries targeting the stock operate. Matching of geographic areas was visually aided by accessing the RAM Legacy Stock Boundary Database1 (Free et al., 2019). For information related to the fishery (or fisheries) targeting a stock and its areas of operation, we used MSC databases and fishery assessment documents available on the MSC ‘Track a fishery’ website2. RAMLDB stocks with a MSC fishery linkage are considered ‘MSC stocks’; approximately half the MSC stocks were linked to a single certified fishery while the other half were linked to two or more certified fisheries (Supplementary Table 2). All other RAMLDB stocks were considered ‘non-MSC stocks’ (Supplementary Table 3).
After matching, information regarding a stock’s MSC certification history was assigned to MSC stocks, including any condition or suspension related to Principles 1 or 3 in any years up to and including 2018. The year 2018 was also the last year of time series included in most analyses here (to balance recency with data availability, as stated earlier). To overcome the absence of recent data (through 2018) for some of the stocks in RAMLDB, we complemented the dataset with biomass time series and corresponding reference point values from external sources. First, the ICES Advice 2020 stock assessment outputs3 (International Council for the Exploration of the Sea; ICES, 2021b) were added for assessments that were not already incorporated into RAMLDB. Second, to broaden geographic representation, data for 12 stocks (from USA, South Africa, and high seas Regional Fisheries Management Organisations) with outdated assessments in RAMLDB were manually supplemented by more recent data from their latest available stock assessments. To avoid selection biases, no additional stocks were considered beyond those in RAMLDB, even if available stock assessments from other sources were identified.
The MSC Standard allows for ecosystem considerations in the certification of select species identified as ‘key low trophic level’ (‘key LTL’4) because of their functional role within food webs (MSC, 2018). If stocks are designated as key LTL during assessment, then more conservative target and limit reference points are required. Only three MSC stocks included in this study were assessed as key LTL (Supplementary Table 2). We did not modify any RAMLDB-derived reference points for these stocks to ensure equal treatment of MSC stocks and non-MSC stocks.
Conversion of biological reference points
Reference points BMSY and Blim are not available for all stocks in RAMLDB, as they are not always provided in stock assessments. Various proxies are often used to represent BMSY, or specified targets Bmgt, so most stocks in RAMLDB have an estimate of BMSY or a proxy available. If a value of BMSY was not available but a value of Bmgt was available, we filled in the missing value of BMSY with Bmgt given that these both typically represent management targets. Further, as noted above, if values of BMSY and Bmgt from assessments were both missing, these were supplemented by estimates from post-hoc surplus production model fits. In contrast, availability of Blim estimates is more limited. To fill in missing estimates of BMSY when only Blim was available, or (more commonly) to fill in missing estimates of Blim when only BMSY was available, we converted one from the other as:
This conversion allows for increased sample size but should be considered an approximation of the actual relationship between BMSY and Blim. Restrepo et al. (1998) described the association between a minimum stock size threshold and BMSY as they pertain to usage in a MSY-based harvest control rule, and this assumed relationship of BMSY being twice Blim has been used previously (Rayns, 2007; Agnew et al., 2013). However, this is not an exact relationship; in cases where BMSY and Blim are both estimated in a given stock assessment, the actual relationship between them varies around the assumed factor of 0.5 (ranging from near 0.1 to >1 for some stocks, but generally centred near 0.5). Further, fisheries management agencies around the world use different conventions for the specific types of reference points (e.g. B35%, B40%, 0.2B0) that are used to represent targets and limits, which adds to the variability in any quantified relationship between the values of these targets and limits. Despite the variability in conventions used, this conversion or related conversions (International Council for the Exploration of the Sea; ICES, 2021a) are often considered to be reasonable approximations for the relationship between BMSY (or other targets) and Blim. Below, we address the sensitivity of our results to the conversions in Equation 1. Sensitivity analysis 3 considers alternative values to the assumed conversion factor of 0.5 (or 2), ranging from 0.2 to 0.8. Sensitivity analysis 4 omits conducting these conversions altogether.
In the case of stocks from Northeast Atlantic waters assessed by the International Council for the Exploration of the Sea (ICES), a common reference point used in assessments is ‘MSY Btrigger’. This is defined as the 5th percentile of the equilibrium biomass distribution if fishing at FMSY (ICES, 2021a), which can be interpreted as the threshold above which a stock can be considered to be ‘fluctuating around BMSY’5. Use of the 5th percentile implies that this reference point type is below various proxies for BMSY typically estimated in other regions, which would be nearer to the 50th percentile. For ICES-assessed stocks, values of BMSY used in analyses were therefore based instead on conversions from Blim estimates using Equation 1a.
Data filtering
Three different focal periods for biomass analyses were considered for three separate portions of our analysis that compare MSC stocks with non-MSC stocks (Table 1). For consistency within each of these portions, only stocks with data available across the full range of years for the focal period were included. This requirement for available biomass data through 2018 constrained sample size (because across stocks, the last year of available data typically tapers off as some assessments are not regularly updated), but as noted above, it also provides a more recent time period for comparison than if an earlier cut-off year was used instead. The first and third portions of the analysis involved a 5-year period for visual summaries, ending in 2018, and a single year (2018) for statistical analyses (Table 1). For all portions, only stocks linked to fisheries that had been first certified by 2020 were included as MSC stocks. Note that MSC certification in years 2019 or 2020 could follow the last year of biomass data (2018). This allowed for including stocks linked to fisheries that entered assessment for MSC certification in advance of the actual date they became certified.
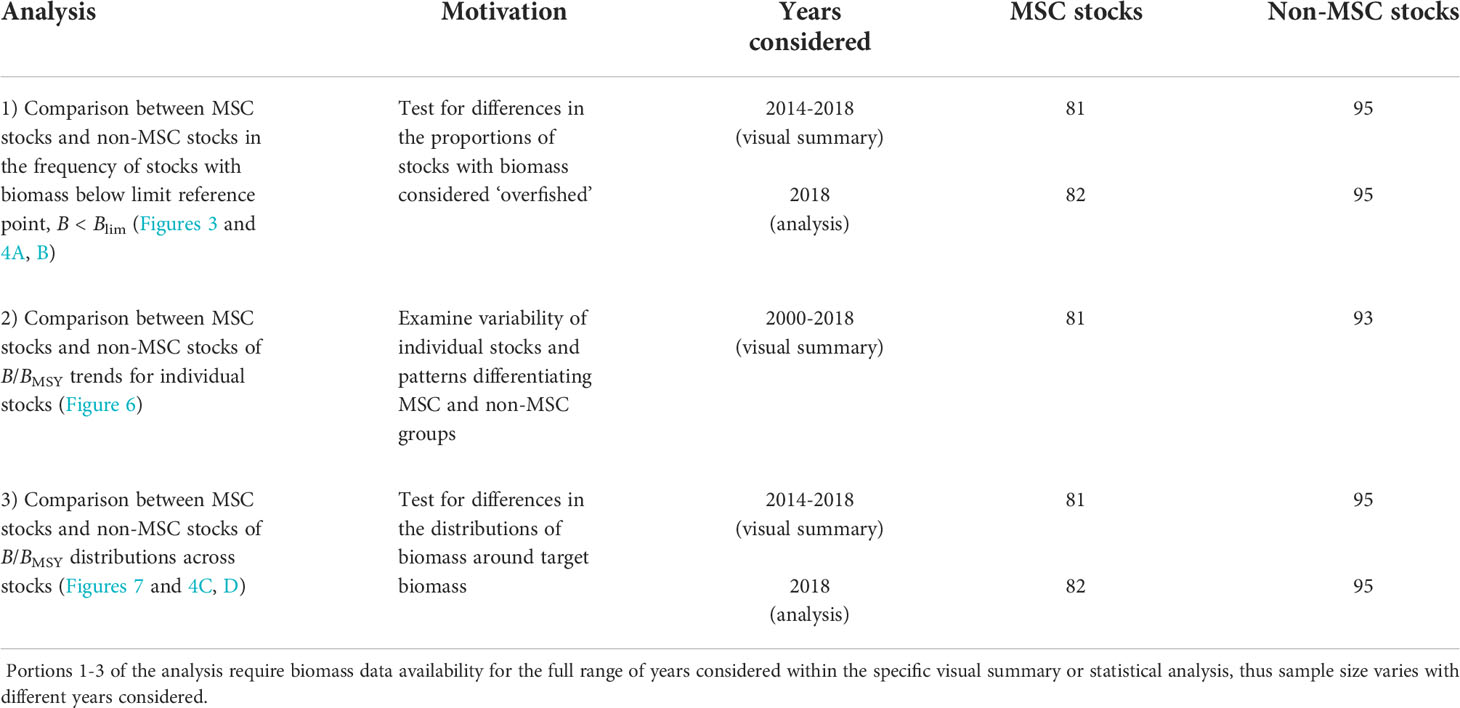
Table 1 Sample size of stocks in statistical analyses and visual summaries.
Stocks linked to a fishery under suspension related to Principles 1 or 3 in years leading up to and including 2018 were included among the MSC stocks. Some of these stocks are linked to fisheries still under suspension, some are linked to fisheries previously suspended but now once again certified, and others are linked to fisheries that withdrew from the program (Supplementary Table 4). Even though they are not eligible to carry the MSC ecolabel while under suspension, including these stocks for comparisons with non-MSC stocks avoids data filtering biases given that reasons for suspensions are often correlated with relative biomass of targeted stocks. Likewise, if a fishery withdrew from the MSC program before or during the focal period for analyses, the stock linked to the fishery was still considered to be a MSC stock to avoid the potential for survivorship bias.
After filtering, sample sizes ranged from 81-82 MSC stocks and from 93-95 non-MSC stocks, dependent on the range of years considered in each portion of the analysis (Table 1). Sampled stocks were assumed to be representative of the global variability of scientifically assessed stocks, i.e. those with historical trends in abundance estimated by fitting a population dynamics model to catch and abundance index data, and often estimating biological reference points related to productivity. The regions considered here (before pooling, see below) were the same as those presented in a recent summary of stock status for assessed populations around the world (Hilborn et al., 2020). Although some regions (Figure 2; Supplementary Figure 1A) or FAO Major Fishing Areas (Supplementary Figure 1B) were represented only by MSC stocks or by non-MSC stocks, in general most regions included both MSC stocks and non-MSC stocks. We included data from all regions to maintain a large and geographically diverse sample size. In sensitivity analysis 5, described below, we instead exclude regions that were not represented by stocks in both groups. Stocks included in analyses in both MSC (Supplementary Table 2) and non-MSC (Supplementary Table 3) groups covered a range of taxonomic groups, were fished by diverse gear types, and spanned a wide range of fishery sizes in terms of landed tonnage.
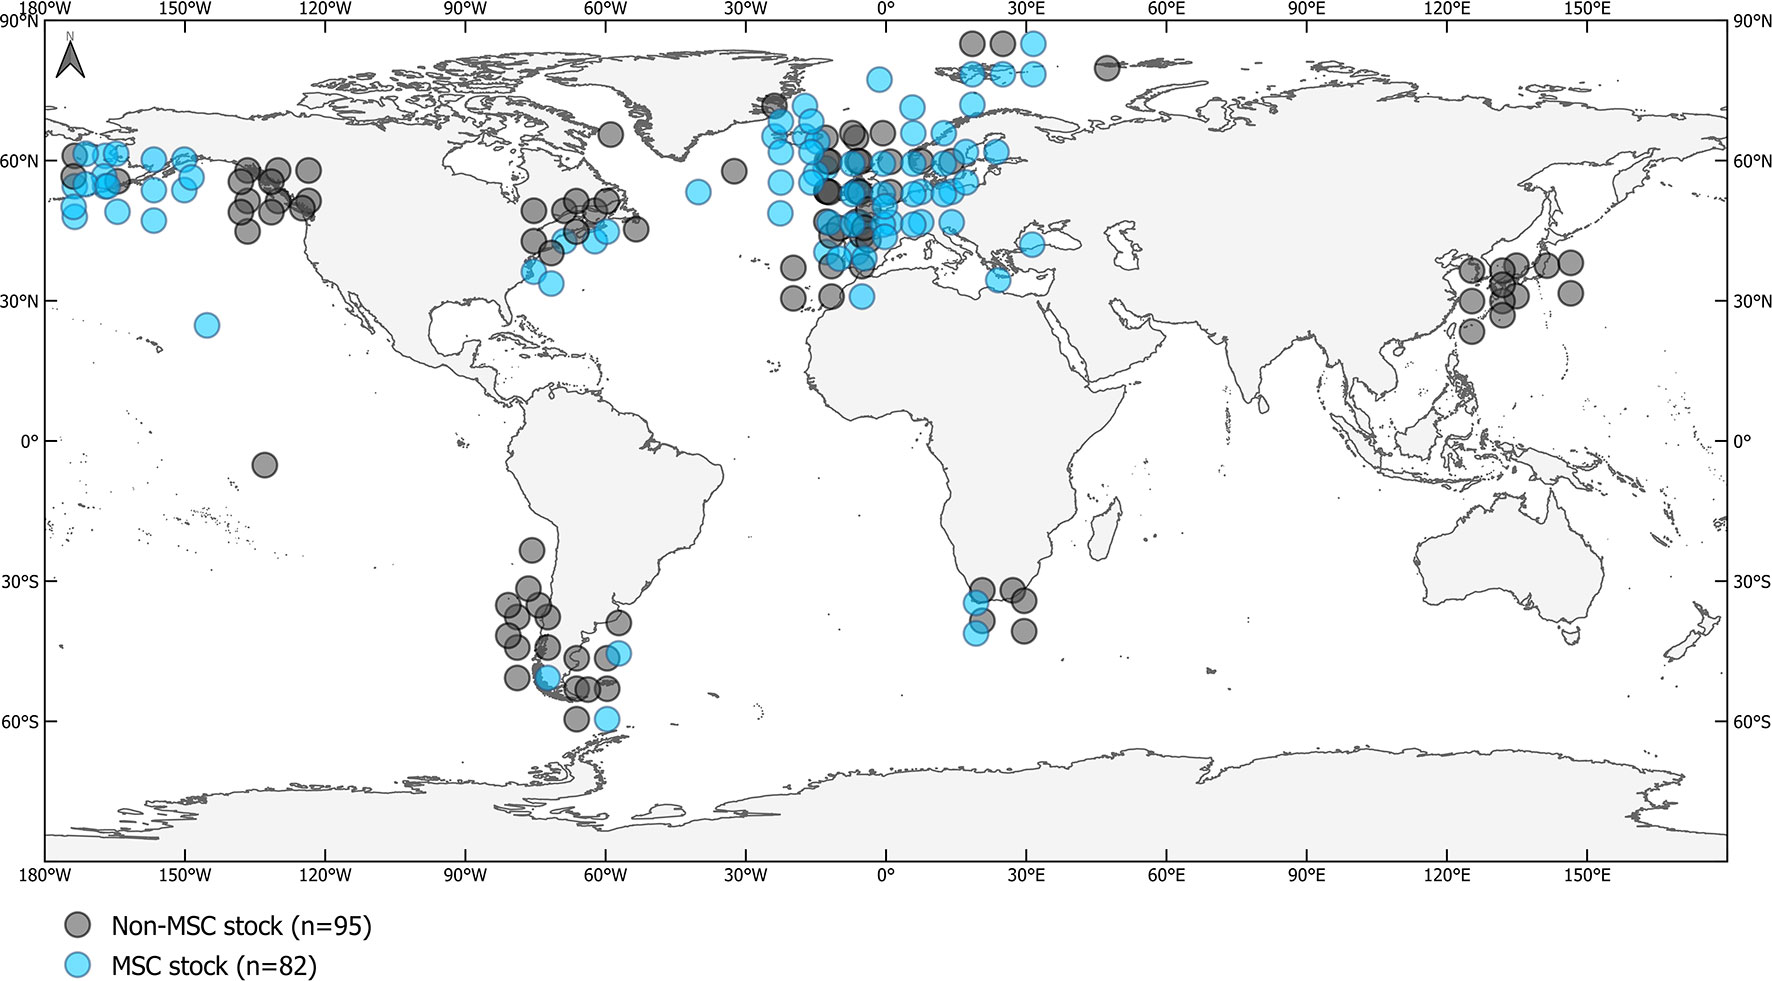
Figure 2 Geographic coverage of MSC stocks (n = 82) and non-MSC stocks (n = 95) included in analyses. Data points show approximate centroids of stock distribution areas (most from Free et al., 2019), jittered to reduce visual overlap.
Statistical analyses
We used generalised linear mixed-effects models (Bates et al., 2015) to compare relative biomass variables between MSC stocks and non-MSC stocks, treating region as a random effect. In conducting these comparisons, we account for the propensity of stocks to be linked to one or more MSC-certified fisheries, aiming to control for self-selection bias, i.e. for the non-random assignment of stocks into the ‘MSC stocks’ group (Rosenbaum and Rubin, 1983), an issue commonly encountered in meta-analyses across populations (Thorson et al., 2015). Accounting for the propensity of certification does not eliminate the problem of non-independence between certification and relative biomass, but it aims to separate any actual influence of certification that may exist from associations that are confounded by self-selection bias. Similar to the approach taken by Melnychuk et al. (2012), we first estimate ‘MSC propensity scores’ of individual stocks and then include these propensity scores as a covariate in later regression models when comparing relative biomass between groups. To ensure sufficient sample sizes within regions, as well as to ensure representation of both groups in all regions, original region assignments (Supplementary Figure 1A) were pooled prior to analyses (Bolker et al., 2009). Canada’s east and west coasts were pooled into a single region ‘Canada’, while original regions ‘Japan’, ‘Pacific Ocean’, ‘Southern Africa’, ‘US East Coast’, and ‘Atlantic Ocean’ were pooled into a single ‘other’ region. This resulted in six pooled regions with 19-67 stocks in each region and at least some representation by both MSC and non-MSC groups.
MSC propensity scores (e) were estimated for each of 177 stocks (82 MSC stocks and 95 non-MSC stocks) using a mixed-effects logistic regression model. Predictor variables hypothesised to potentially influence the probability of stock j being linked to MSC-certified fisheries included: catch weight of the stock (average over all available years 2000-2018 in RAMLDB, and occasionally estimating weights from catch numbers multiplied by average body weight); ex-vessel price at the global species level (for year 2010, estimated by Melnychuk et al. (2017)); region; and taxonomic group. Taxonomic groups were based on FAO’s International standard statistical classification of aquatic animals and plants (ISSCAAP groups), and were also pooled to ensure sufficient sample sizes within each of six groups. Original groups ‘Tunas, bonitos, billfishes’ and ‘Miscellaneous pelagic fishes’ were pooled into ‘other pelagic fishes’, and original groups ‘King crabs, squat-lobsters’, ‘Miscellaneous coastal fishes’, ‘Sharks, rays, chimaeras’, and ‘Shrimps, prawns’ were pooled into ‘other fish and invertebrates’. Original groups ‘Cods, hakes, haddocks’, ‘Flounders, halibuts, soles’, ‘Herrings, sardines, anchovies’, and ‘Miscellaneous demersal fishes’ each had sufficient observations without pooling. Log of catch (C) and log of price (P) were treated as fixed effects while region (R) and taxonomic group (T) were modelled as crossed random effects:
Random intercepts for region βRj (2b) and taxonomic group βTj (2c) allow for variability around the overall intercept β0 . Within-group error ϵj (2d) is assumed to be normally-distributed in logit space and independent of the random effects. Model fits to binary data (MSC = 1, non-MSC = 0) provide estimated MSC propensity scores ej , representing the conditional probability of stock j being a MSC stock given its values of catch, price, region, and taxonomic group. Original regions and taxonomic groups of stocks are listed in Supplementary Tables 2 and 3.
Next, we used two models to compare relative biomass between MSC stocks and non-MSC stocks while including as a covariate the estimated MSC propensity score for each stock. The first model, corresponding to portion 1 of the analysis listed in Table 1, quantified the proportion of stocks in each group with estimated biomass greater than Blim in 2018. This categorises the numerical ratio B/Blim into successes (B > Blim) and failures (B < Blim). This model assumed a logit-link in which p is the probability of success for stock j:
The second model, corresponding to portion 3 of the analysis in Table 1, compared B/BMSY estimates in 2018 between groups. This model assumed a log-link:
In both models, coefficient b1 is the key estimated parameter which reflects potential differences between groups (parameterized such that it represents the difference of the MSC group relative to the baseline non-MSC group). Coefficient b2 is also of interest, representing the influence attributed to the propensity of MSC certification (rather than to the difference between MSC and non-MSC groups per se). In both models, propensity scores ej were standardized by subtracting the mean propensity across 177 stocks (0.463) so that the overall intercept β0 represents the best-fit estimate for non-MSC stocks in 2018 at mean MSC propensity, either in logit space (3a) or log space (4a). A region-level random intercept βRj (3b 4b) allows for variability around the overall intercept β0, with stocks j nested within regions. Within-group error ϵj is assumed to be normally-distributed in either logit space (3c) or log space (4c) and independent of the random effect.
Fitted values were extracted from both models (Equations 3 and 4), which accounted for the estimated MSC propensity of individual observations (Equation 2) and the group and regional assignments of observations. Fitted values were used for visual comparisons between MSC and non-MSC groups as well as to show the relationship between observed data and model fits.
Sensitivity analyses
We consider five alternative assumptions for the treatment of input data. For each of these sensitivity analyses, we repeat the statistical analyses described above for portions 1 and 3 of the analysis (Table 1), and we compare the results to the corresponding results from the main analysis, in particular estimates of b1 (Equations 3a and 4a). The sensitivity analyses considered were:
Sensitivity 1—Stated management targets instead of MSY-based values as target reference points
In the main analysis, BMSY values from RAMLDB were used preferentially in cases where both BMSY and Bmgt values were available. In this sensitivity analysis, the specified targets Bmgt are instead preferred. For portion 1 of the analysis, this means that missing values of Blim are instead converted from Bmgt (Equation 1b). The number of stocks does not change in this sensitivity analysis because if only one of the reference points BMSY and Bmgt was available, it was assumed as the target.
Sensitivity 2—Omission of supplemented reference point estimates from post-hoc model fits
The main analysis uses the extended version of RAMLDB (‘mdl-fits’) in which missing values of BMSY are estimated post-hoc. This sensitivity analysis instead uses the base version of RAMLDB (‘asmt-only’), using only reference points drawn from stock assessments. The number of stocks was reduced by 7%.
Sensitivity 3—Alternative assumptions for the assumed conversion factor between BMSY and Blim
The main analysis uses an assumed conversion factor of 0.5 to fill in missing values of Blim from available values of BMSY (or vice versa with a factor of 2; Equation 1). This sensitivity analysis instead profiles over a series of alternative values for this conversion factor: Sensitivity 3a, 3b, 3c, 3d, 3e and 3f instead assume values of 0.2, 0.3, 0.4, 0.6, 0.7 and 0.8, respectively (or values of 0.2-1, 0.3-1, 0.4-1, 0.6-1, 0.7-1 and 0.8-1 in the conversion from Blim to BMSY). Sample size was not affected.
Sensitivity 4—Omission of converted reference point values from BMSY or from Blim
In this sensitivity analysis, the conversions to fill in missing values of reference points (Equation 1) were not applied. This reduced sample size substantially, by 57% for portion 1 of the analysis and by 41% for portion 3.
Sensitivity 5—Omission of original regions not represented by both MSC and non-MSC stocks
In the main analysis, three original regions contained only MSC stocks or only non-MSC stocks (Canada West Coast, Japan, and Atlantic Ocean; Supplementary Figure 1), all of which were subsequently pooled as described above. In this sensitivity analysis, these regions were omitted prior to pooling. This reduced the number of stocks by 14%.
Results
Propensity of MSC certification
Predicted MSC propensity scores ranged from 0.01-0.99 across 177 stocks, with overall mean of 0.463 and median of 0.418. As expected, MSC propensity scores were higher on average for MSC stocks (range 0.07-0.99, mean 0.68) than for non-MSC stocks (range 0.01-0.78, mean 0.27). MSC propensity scores were strongly and positively associated with log average catch, but contrary to expectations, were only weakly associated with log ex-vessel price (Supplementary Table 5). Between the two random effects, region was a stronger predictor of MSC group assignment than taxonomic group, as evidenced by a larger estimated variance hyperparameter ( = 2.46, = 0.88). Among regions, MSC propensity scores were greatest for stocks in Alaska and least for stocks in South America, while among taxonomic groups, MSC propensity scores were greatest for ‘other fish and invertebrates’ and least for ‘other pelagic fishes’ (Supplementary Table 5).
Proportion of MSC stocks and non-MSC stocks overfished
For each of the two groups (MSC and non-MSC), the proportion of stocks with estimated biomass below the limit reference point Blim is listed in Table 2 (years 2017 and 2018) and shown in Figure 3 (years 2014-2018). Patterns were similar across years. Almost all MSC stocks (73-75 of 82 stocks) had biomass above Blim, whereas only about two thirds of non-MSC stocks (64-70 of 95 stocks) had biomass above Blim. That is, stocks considered to be overfished tended to be the ones that are targeted by fisheries with no previous history with the MSC.
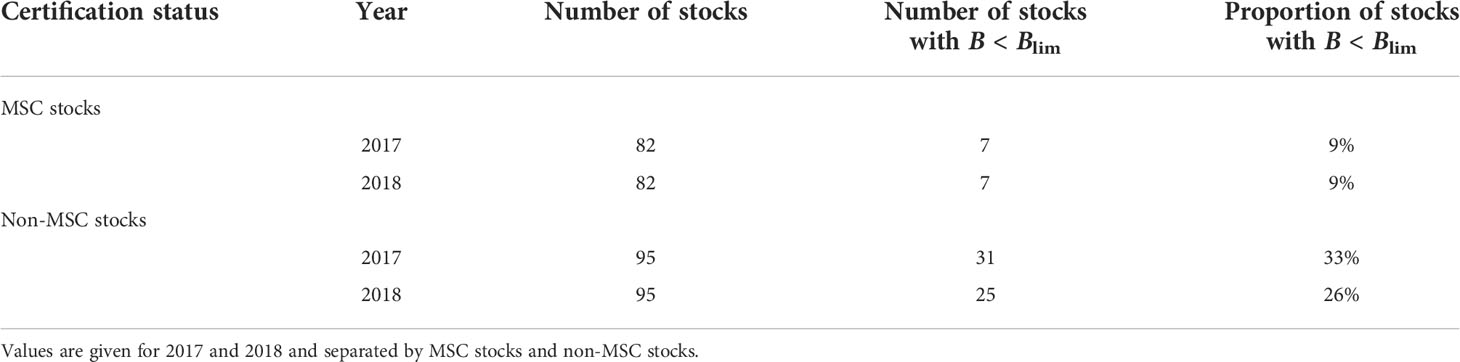
Table 2 Number and proportion of stocks with estimated biomass below limit reference point (B < Blim).
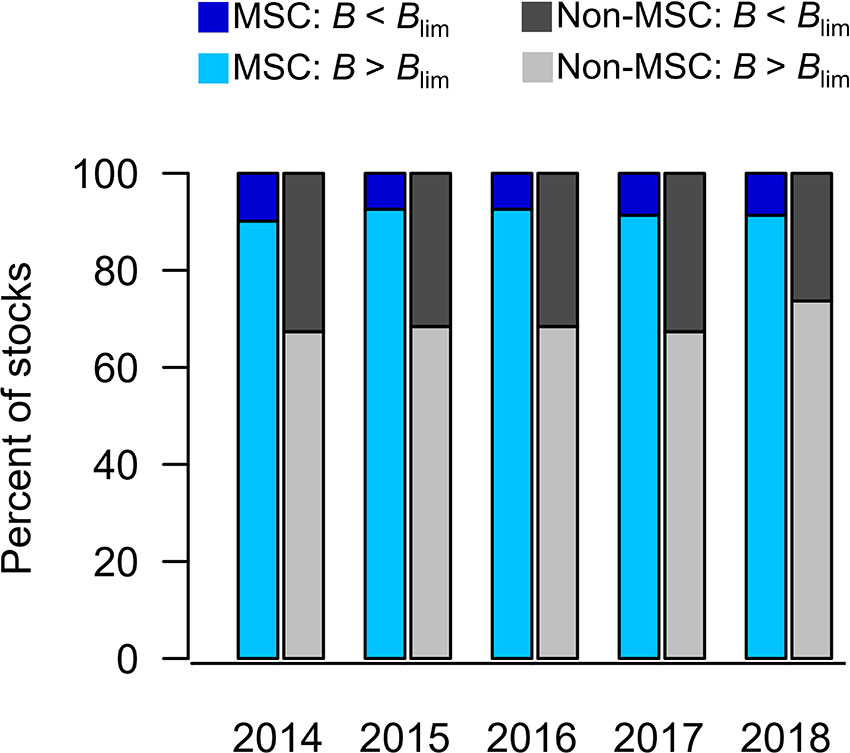
Figure 3 Proportion of MSC stocks (n = 81) and non-MSC stocks (n = 95) with biomass below or above limit reference points in years 2014-2018. Darker shades reflect stocks with biomass below the ‘overfished’ threshold (B < Blim), and lighter shades reflect stocks with biomass above Blim.
Mixed-effect model results showed statistical support for a difference between groups, with biomass of MSC stocks less commonly below the overfished threshold compared to non-MSC stocks in 2018 (b1 = 1.15 ± 0.59, z = 1.97, p = 0.049; Table 3). In contrast, the influence attributed to MSC propensity score was not statistically significant (b2 = -0.22 ± 1.10, z = -0.20, p = 0.84). Unlike the visual comparisons shown in Figure 3, this analysis controlled for the propensity of certification and for region as a random effect. Accounting for these, model predictions for the probabilities of MSC stocks or non-MSC stocks with biomass above Blim (Figures 4A, B) were consistent with observed binary classifications for these groups (Table 2 and Figures 4A, B). Group means of predicted probabilities showed a difference of 17.8 percentage points between groups (Table 3).
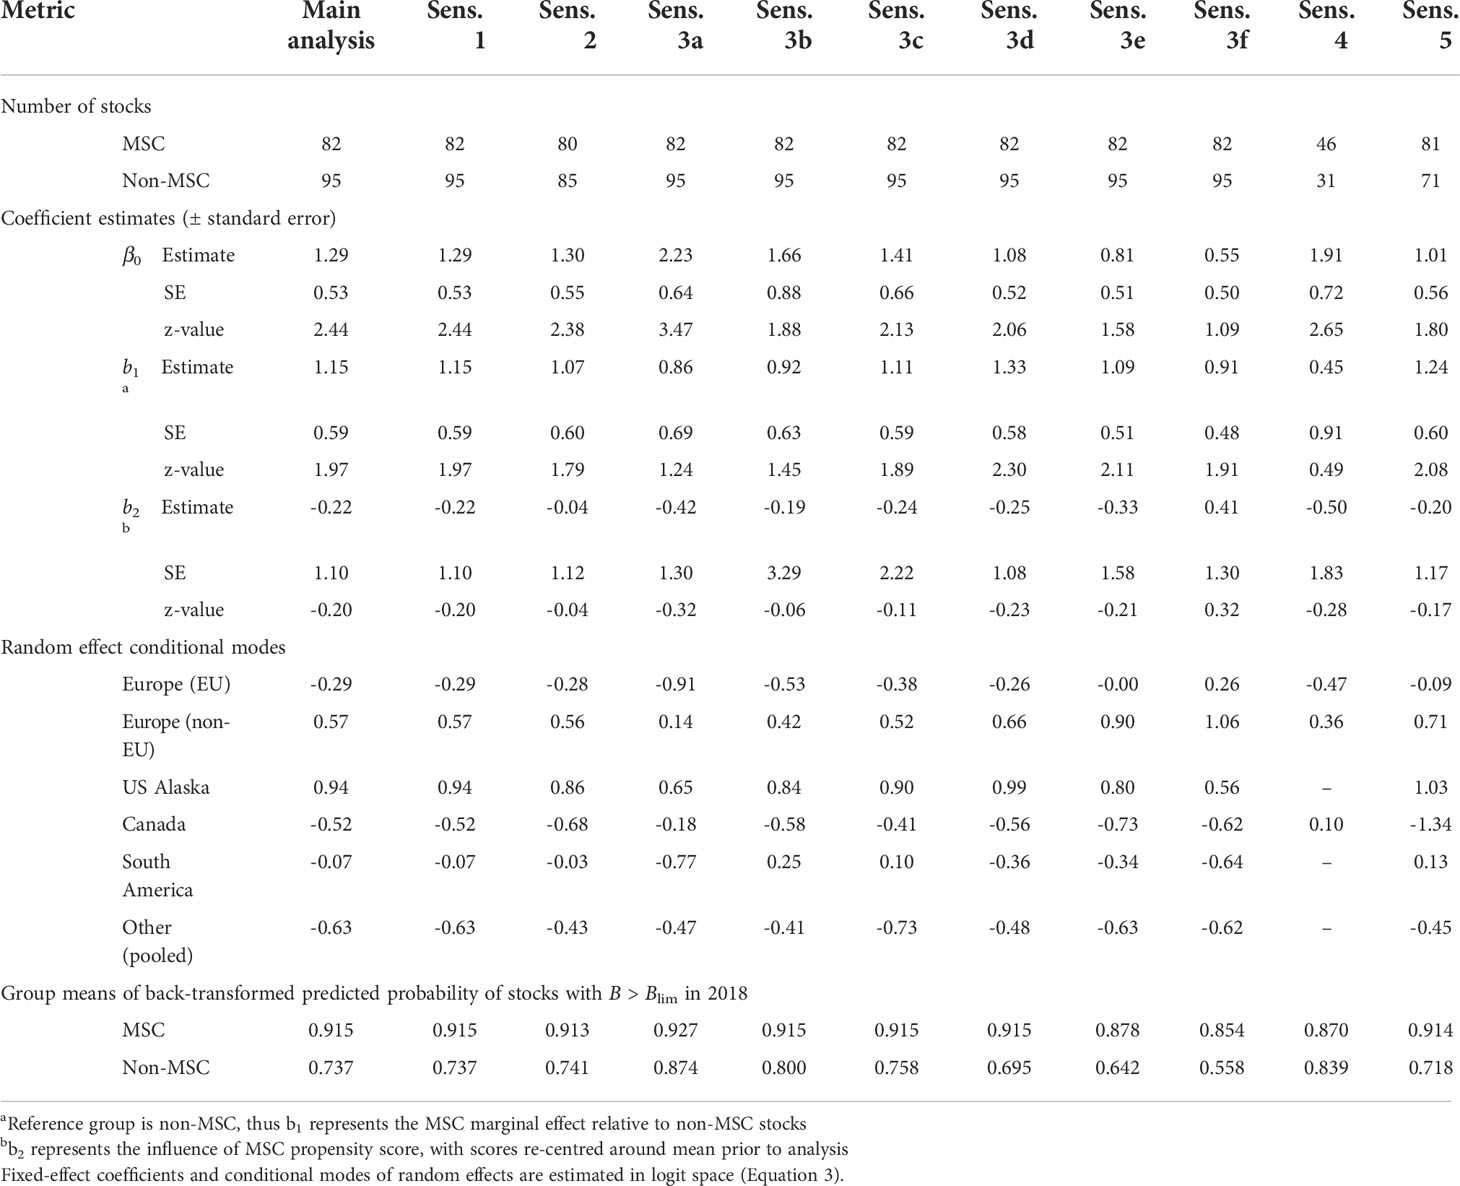
Table 3 Generalized linear mixed-effect model results from main analysis and sensitivity analyses for portion 1 of the analysis, comparing the proportion of stocks with B > Blim in 2018 between MSC stocks and non-MSC stocks.
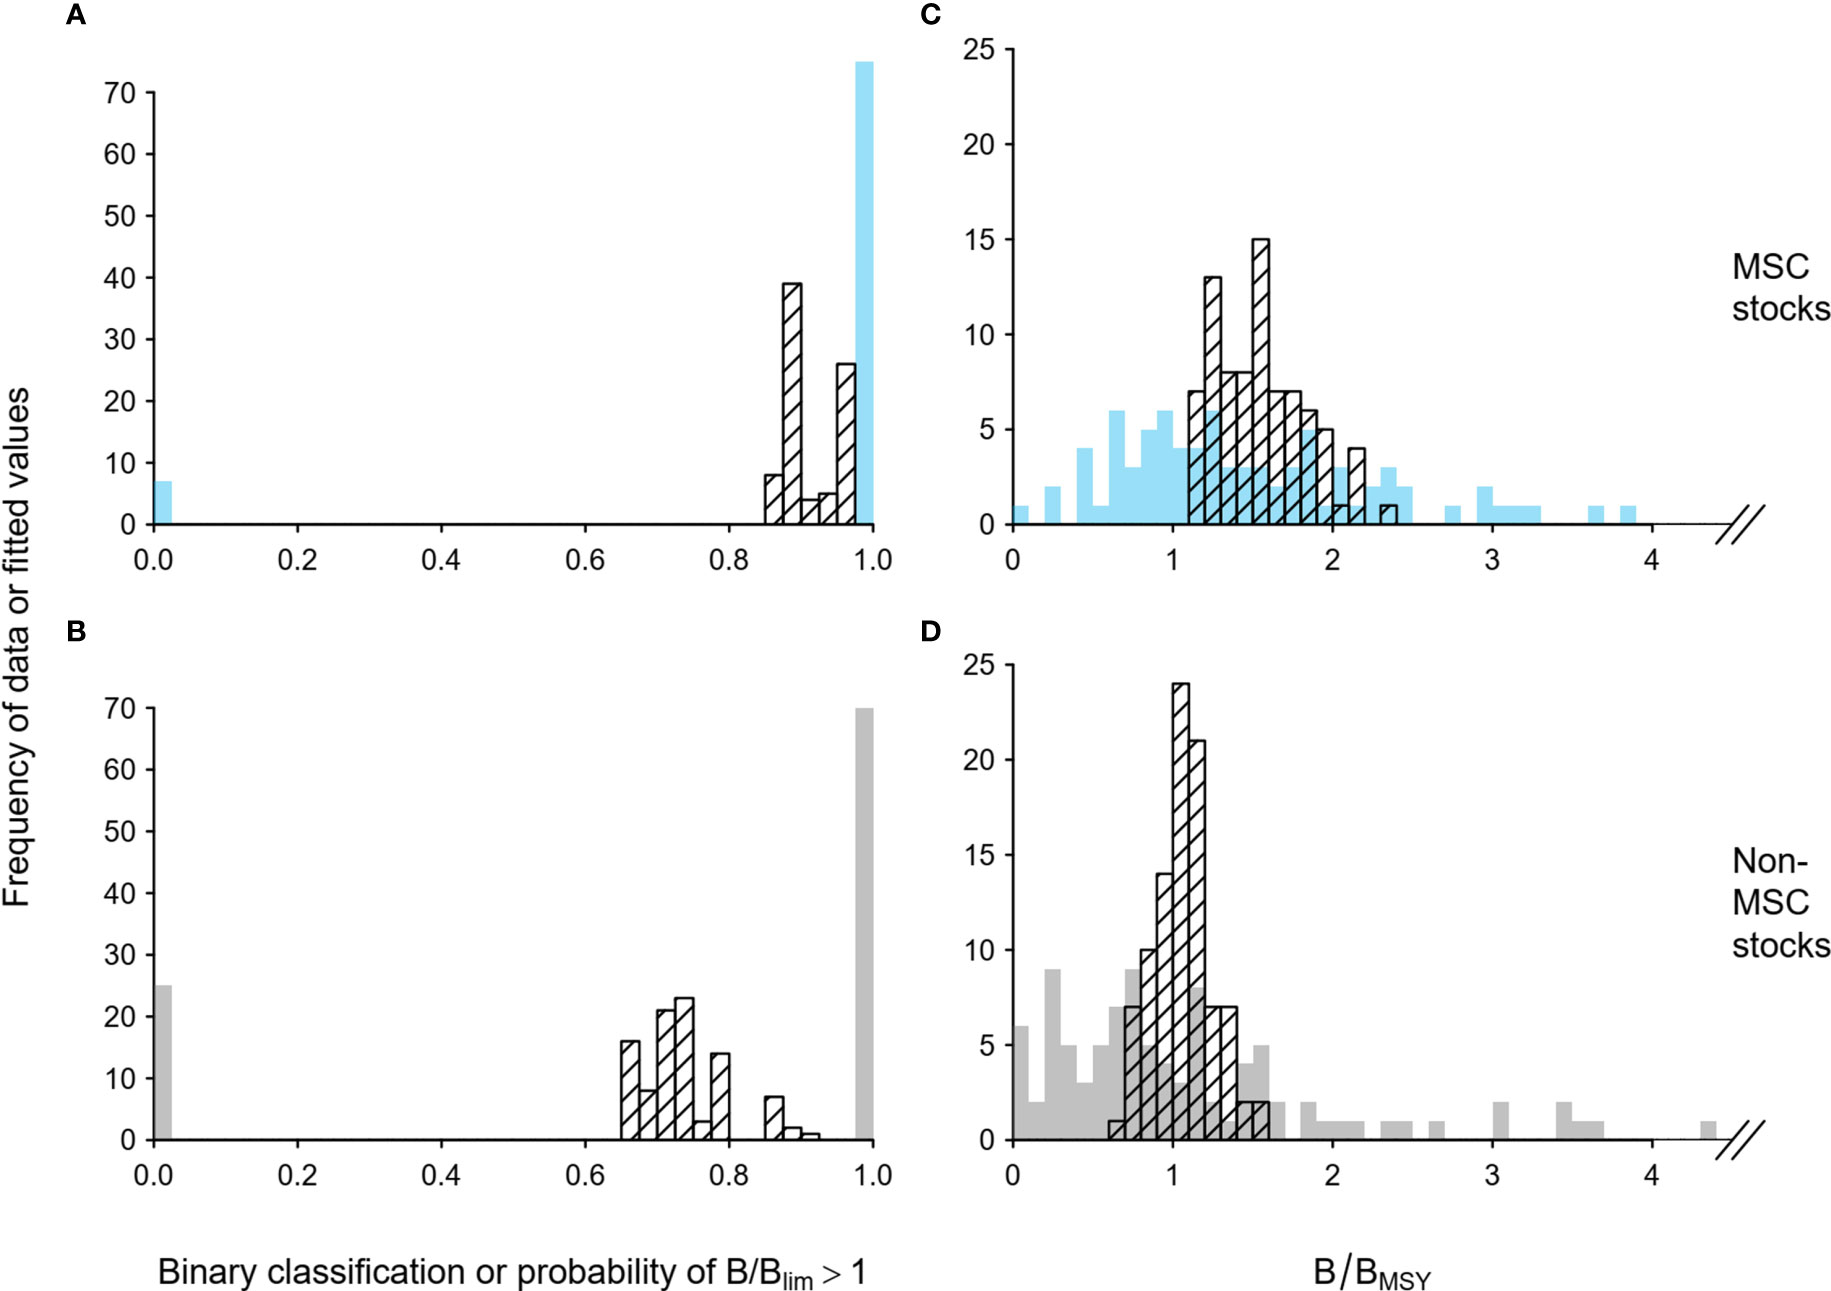
Figure 4 Frequency distributions of observed and model-fitted values of relative biomass variables for MSC stocks (n = 82) and non-MSC stocks (n = 95) in 2018. (A, B) Observed binary classification or predicted probability of biomass above the ‘overfished’ threshold (B > Blim), from portion 1 of the analysis. (C, D) Observed or predicted B/BMSY, from portion 3 of the analysis, with horizontal axes truncated at 4.5 thereby omitting one MSC stock with B/BMSY = 7.9. Solid bars (blue for MSC stocks in A, C; grey for non-MSC stocks in B, D) show observed values and hatched bars show model-fitted values.
Eight MSC stocks were estimated to have biomass below Blim in years 2017 or 2018 (Table 2). These stocks, all from Northeast Atlantic waters and assessed by ICES, were examined more closely to identify the scientific information available at the time of MSC certification. For five of these stocks, estimated B/Blim was greater in the ICES advice available at the time of certification than it was 3-11 years later in the 2020 ICES advice for the corresponding (earlier) year (Figures 5A-E). For these five stocks, estimated B/Blim had been >1 according to ICES advice available at the time of MSC certification. Under the more recent 2020 stock assessments, estimated B/Blim in the year of certification was, in retrospect, estimated to be substantially < 1 for two stocks (C, D), slightly <1 for two stocks (A, B), and >1 for one stock with rapidly-declining biomass (E). A different stock had similar estimates of B/Blim available at the time of certification as that estimated in 2020 for the corresponding earlier year, both with estimated biomass well above the limit reference point (Figure 5F). Two stocks did not have biomass reference points estimated in stock assessments prior to certification, but indicators suggested the stocks were not heavily fished at the time of certification (Figures 5G, H). All eight of these stocks were linked to fishery UoCs that had conditions of certification opened at the time of certification or in years following, seven of these were linked to fishery UoCs that were suspended after certification, and four of these were linked to fishery UoCs that withdrew from the MSC program while under suspension (Figure 5).
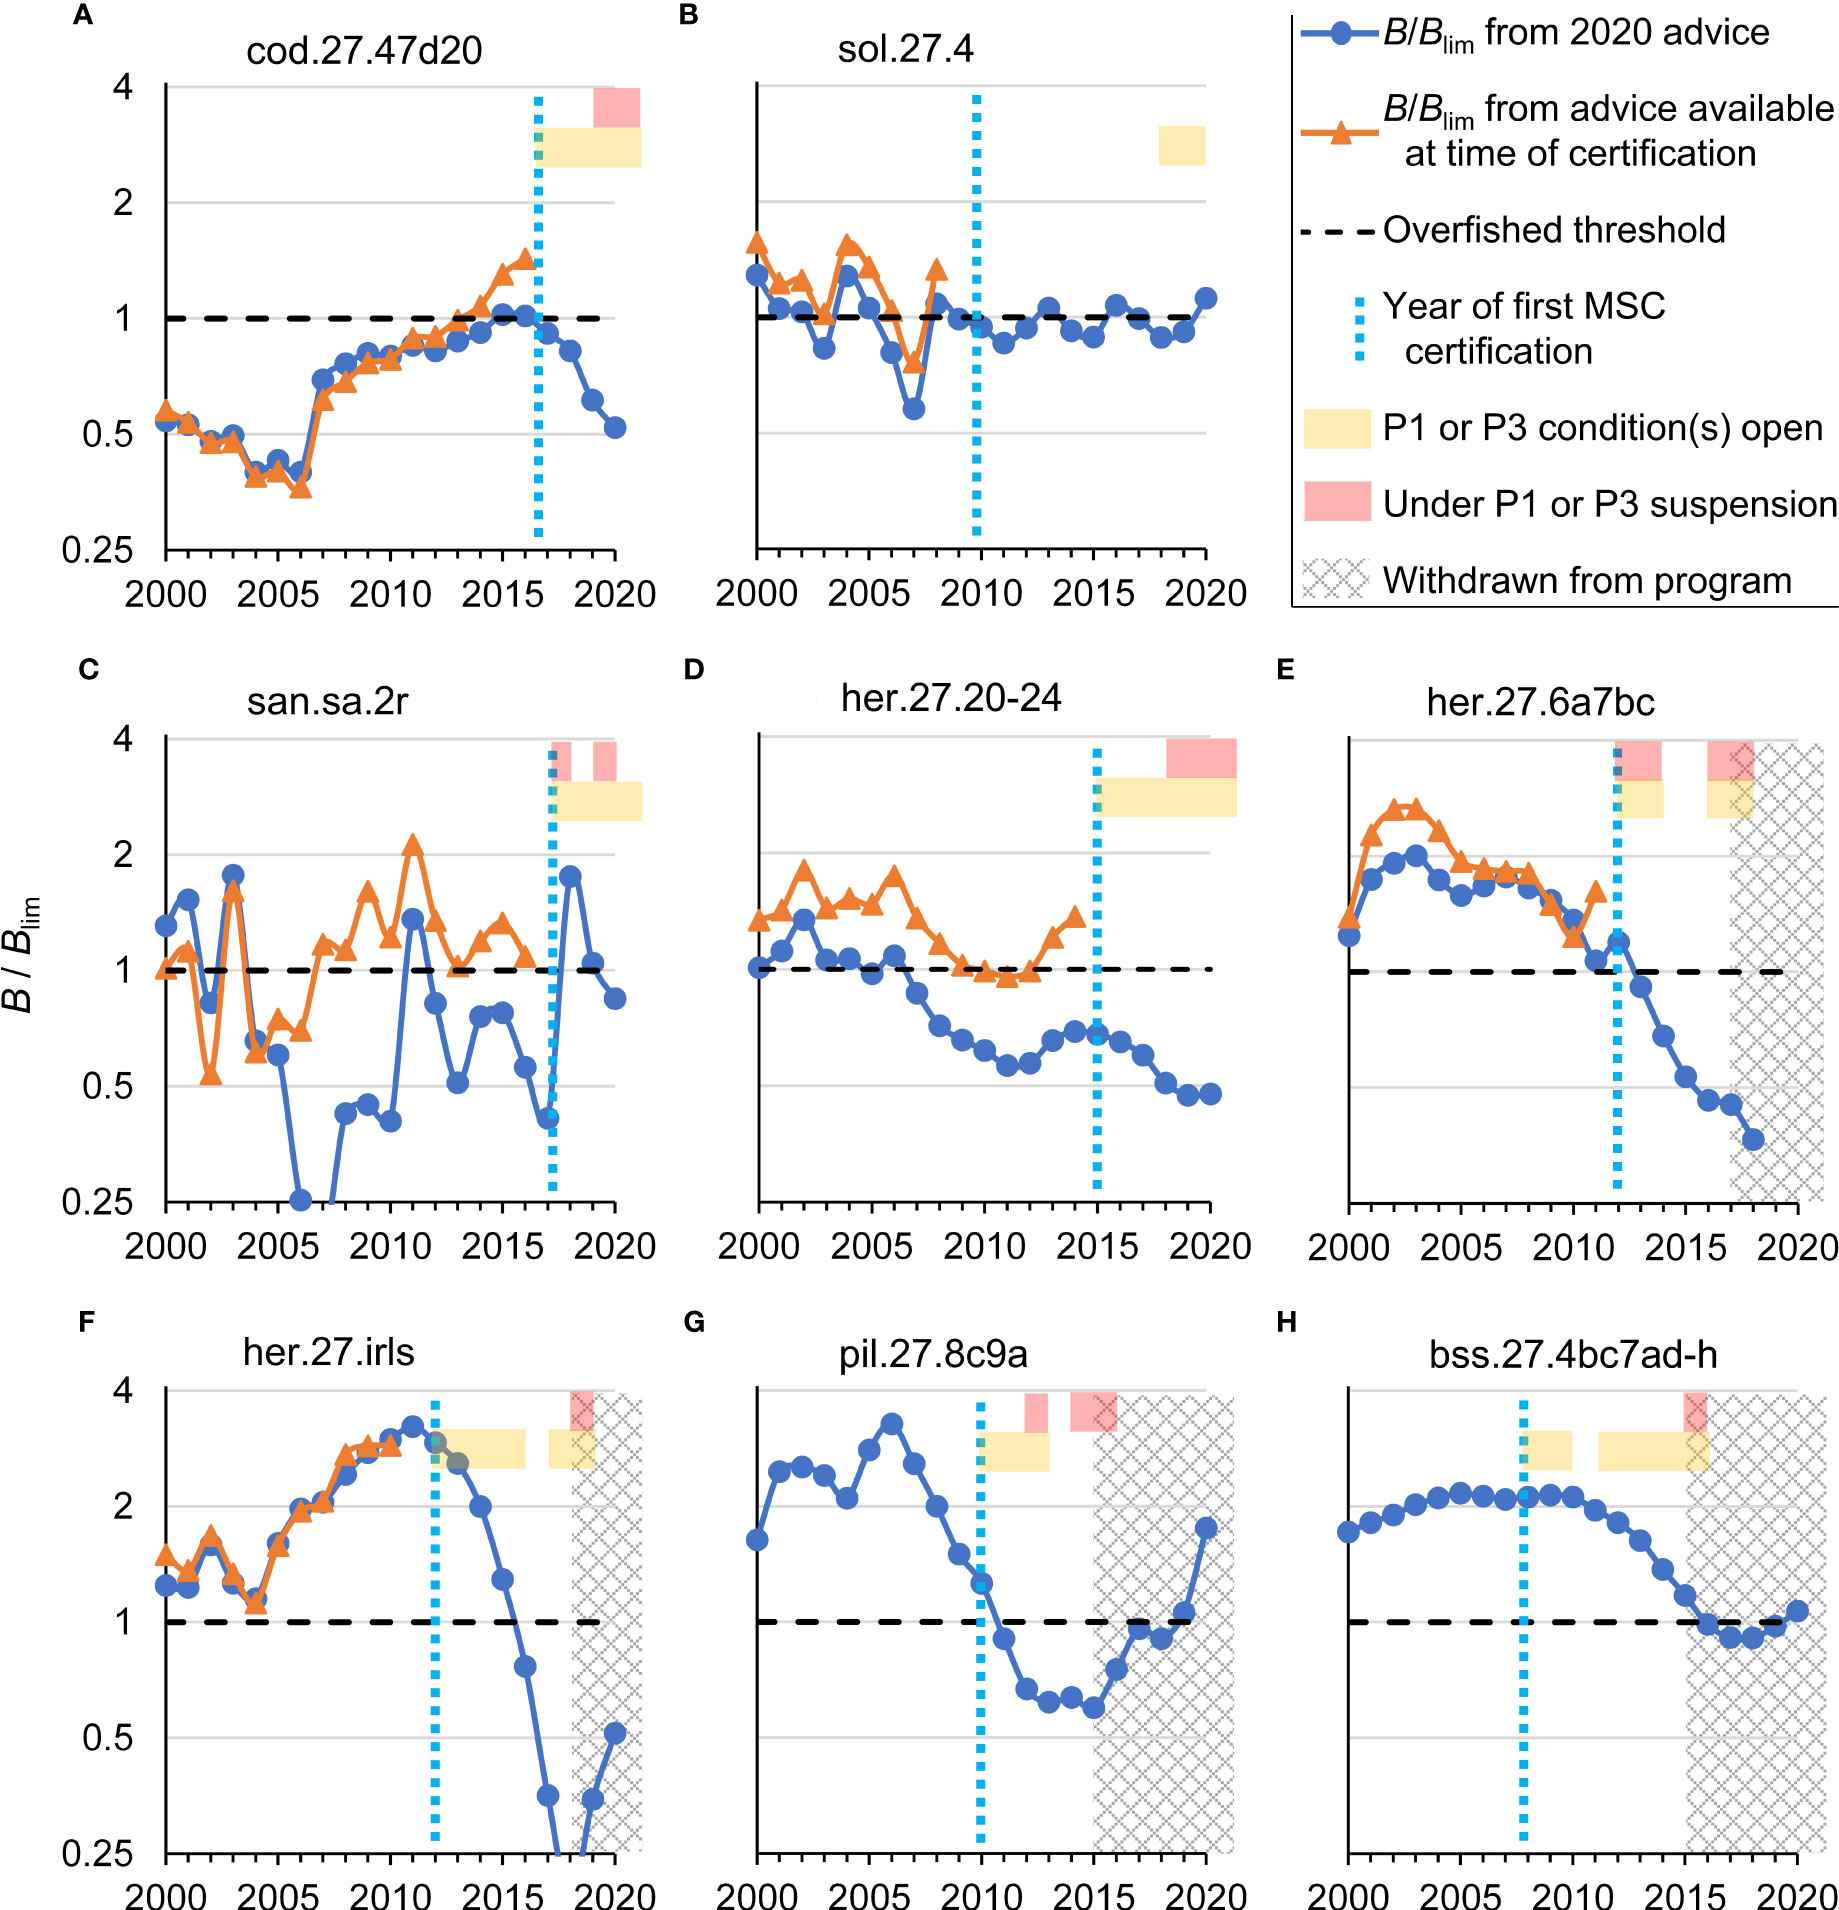
Figure 5 Stock status and certification histories of eight MSC stocks for which B/Blim estimates from 2020 ICES Advice Reports were below the ‘overfished’ threshold in 2017 or 2018. B/Blim is shown on log scale with truncated axis at lowest value. Blue circles show estimates from this recent assessment. Orange triangles show corresponding estimates from the earlier ICES Advice available at the time of certification, with the exception of two stocks for which biomass reference point estimates were not available prior to certification. Year of first certification and, if applicable, years with open conditions or years under suspension related to MSC Principles 1 or 3 are indicated. For four stocks, hatching indicates the year in which the last remaining linked fishery withdrew from the program. Time series are shown to year 2020 but only values to year 2018 were included in analyses. ICES stock codes are indicated, corresponding to full names (and RAMLDB stockid codes): (A) Cod–North Sea, eastern English Channel, and Skagerrak (CODIIIaW-IV-VIId); (B) Sole–North Sea (SOLENS); (C) Sandeel Area 2r–Skagerrak, central and southern North Sea (SEELNSSA2); (D) Herring spring spawners–Skagerrak, Kattegat, and western Baltic (HERR2224IIIa); (E) Herring–West of Scotland and West of Ireland (HERRVIaVIIbc), which consists of two sub-stocks that were assessed separately prior to 2016, with pre-certification estimates specific to the sub-stock in area VIa (North); (F) Herring–Irish Sea, Celtic Sea, and southwest of Ireland (HERRSIRS); (G) Sardine–Cantabrian Sea and Atlantic Iberian waters (SARDPVIIIc-IXa); and (H) Seabass–central and southern North Sea, Irish Sea, English Channel, Bristol Channel, and Celtic Sea (EBASSIVbc-VII).
Trends in relative biomass of MSC stocks and non-MSC stocks
Stocks in both the MSC and non-MSC groups had widely-varying time series trajectories of B/BMSY over the period 2000-2018 (Figure 6); note that the earlier years in this period for most MSC stocks occurred prior to their year of certification (Supplementary Table 2). For some stocks, B/BMSY remained above target levels throughout the period, while for other stocks, B/BMSY remained below the target of 1 or even below the approximate overfished threshold of 0.5 throughout this period. Occurrences of low biomass were more commonly observed for non-MSC stocks but were also observed for some MSC stocks (Figure 6). These results are consistent with the frequencies of stocks falling below B/Blim shown in Figure 3, with a greater proportion of non-MSC stocks at low biomass levels compared to MSC stocks. In the few cases of MSC stocks with low biomass, suspensions were commonly observed, in some cases leading to the later withdrawal of linked fisheries from the program (Figure 6). The interannual variability in biomass of individual stocks as well as the number of stocks in each group makes it challenging to visually identify clear persistent patterns over time or to compare MSC stocks with non-MSC groups in this figure. Next, we focus on the most recent five years within this period.
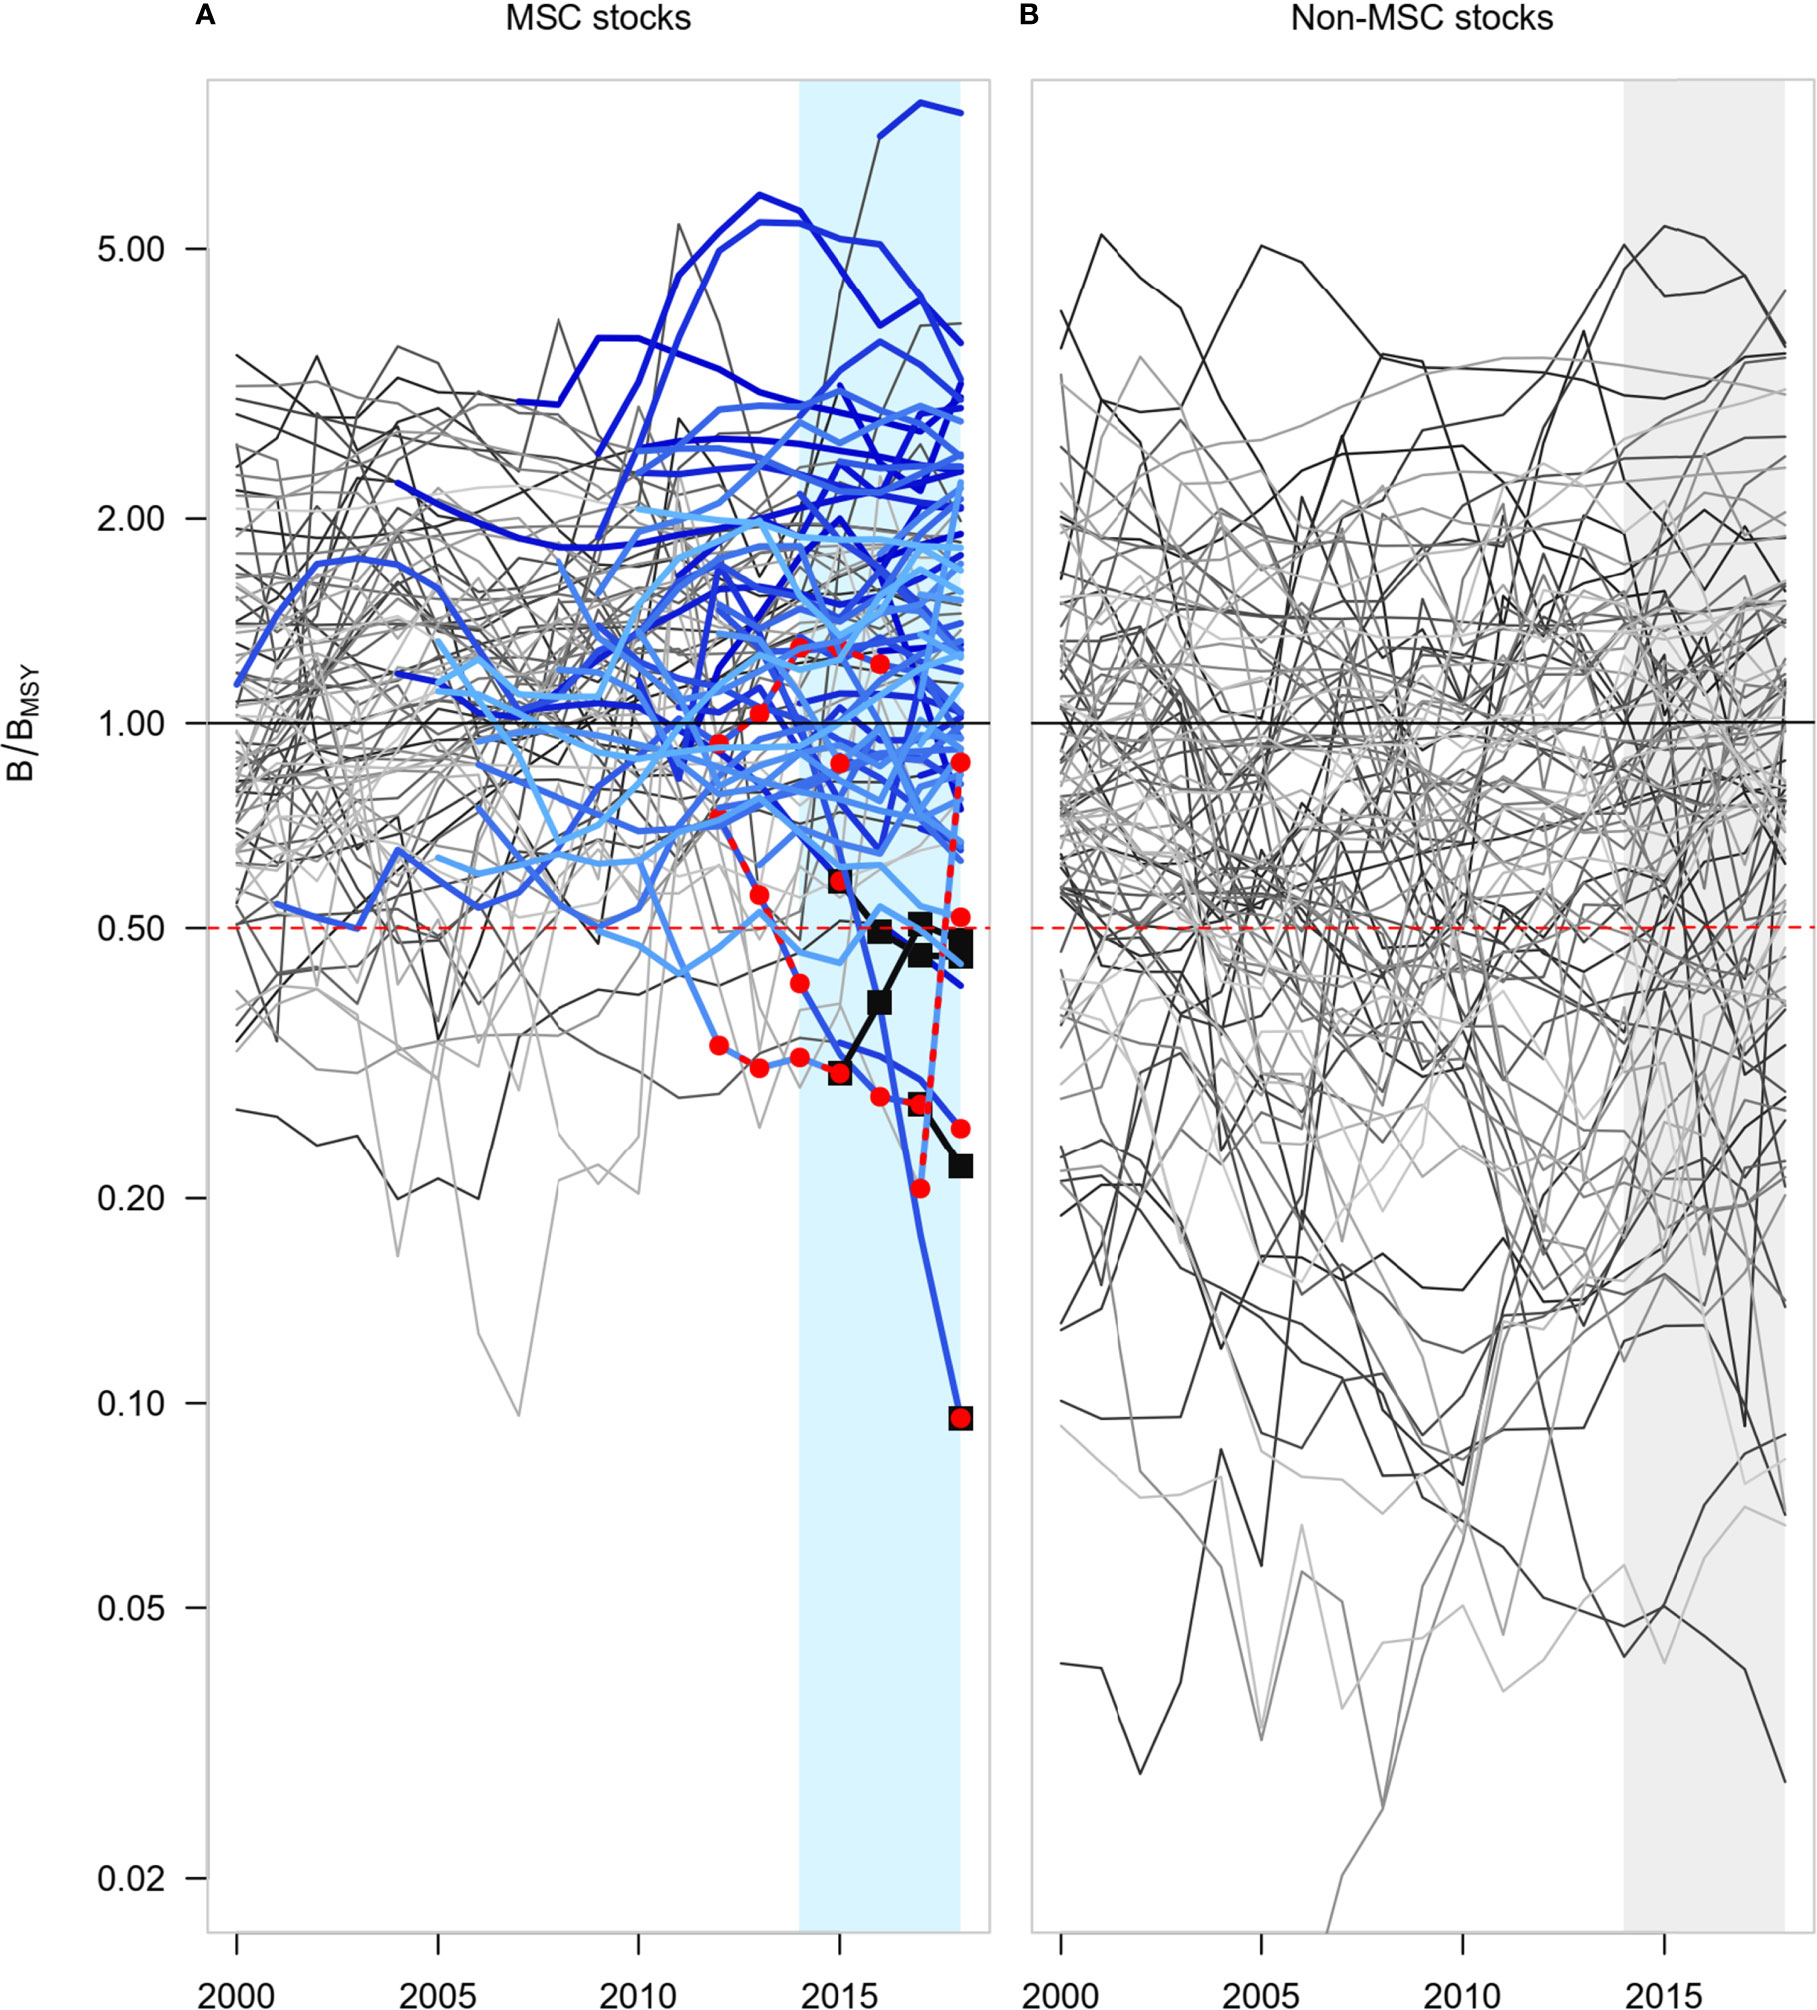
Figure 6 Time series of relative biomass (B/BMSY) of (A) MSC stocks (n = 81) and (B) non-MSC stocks (n = 93) for years 2000-2018. B/BMSY is shown on log scale with truncated axis at lowest value. Lines show individual stocks. For MSC stocks, grey portions of lines represent pre-certification years and blue portions represent post-certification years. Red points indicate years in which nine MSC stocks were under suspension related to MSC Principles 1 or 3. Black squares indicate years in which and thereafter four of these MSC stocks withdrew from the program while under suspension. Target (BMSY at 1) and limit (Blim at 0.5) reference point thresholds are shown for comparison. Blue and grey shading over years 2014-2018 highlights the focal period shown in Figure 7.
Distributions of B/BMSY were summarised across stocks in each of the two groups for years 2014-2018 (Figure 7). Percentiles of this distribution are shown by sequential shading levels, with median values overlaid. Within each group, the distribution across stocks can be compared to the general target (B/BMSY = 1) or to the level commonly used to define ‘overfished’ status in some regions (B/BMSY = 0.5, equivalent to Blim under assumptions of Equation 1a). MSC stocks in the 50% percentile interval (between 25th and 75th percentiles) remained above B/BMSY = 0.8 (which in some other regions is used to denote an ‘overfished’ level); the 25th percentile ranged between 0.83-0.90 and the 75th percentile ranged between 1.81-1.98 over the five year period. In contrast, approximately half the non-MSC stocks remained below B/BMSY = 0.8; the 25th percentile ranged between 0.36-0.46 and the 75th percentile ranged between 1.35-1.47. The median MSC stock remained above B/BMSY = 1 (range, 1.28-1.38) and the median non-MSC stock remained below B/BMSY = 1 (range, 0.80-0.84) over this period (Figure 7). Distributions across stocks were wide for both groups and showed substantial overlap between MSC stocks and non-MSC stocks. Nevertheless, the differences in the tails of the distributions showed a similar shift as that observed for the median: the upper range of B/BMSY was slightly greater for MSC stocks than for non-MSC stocks, and the lower range of B/BMSY was substantially lower for non-MSC stocks than for MSC stocks, such that overall variability was greater among non-MSC stocks.
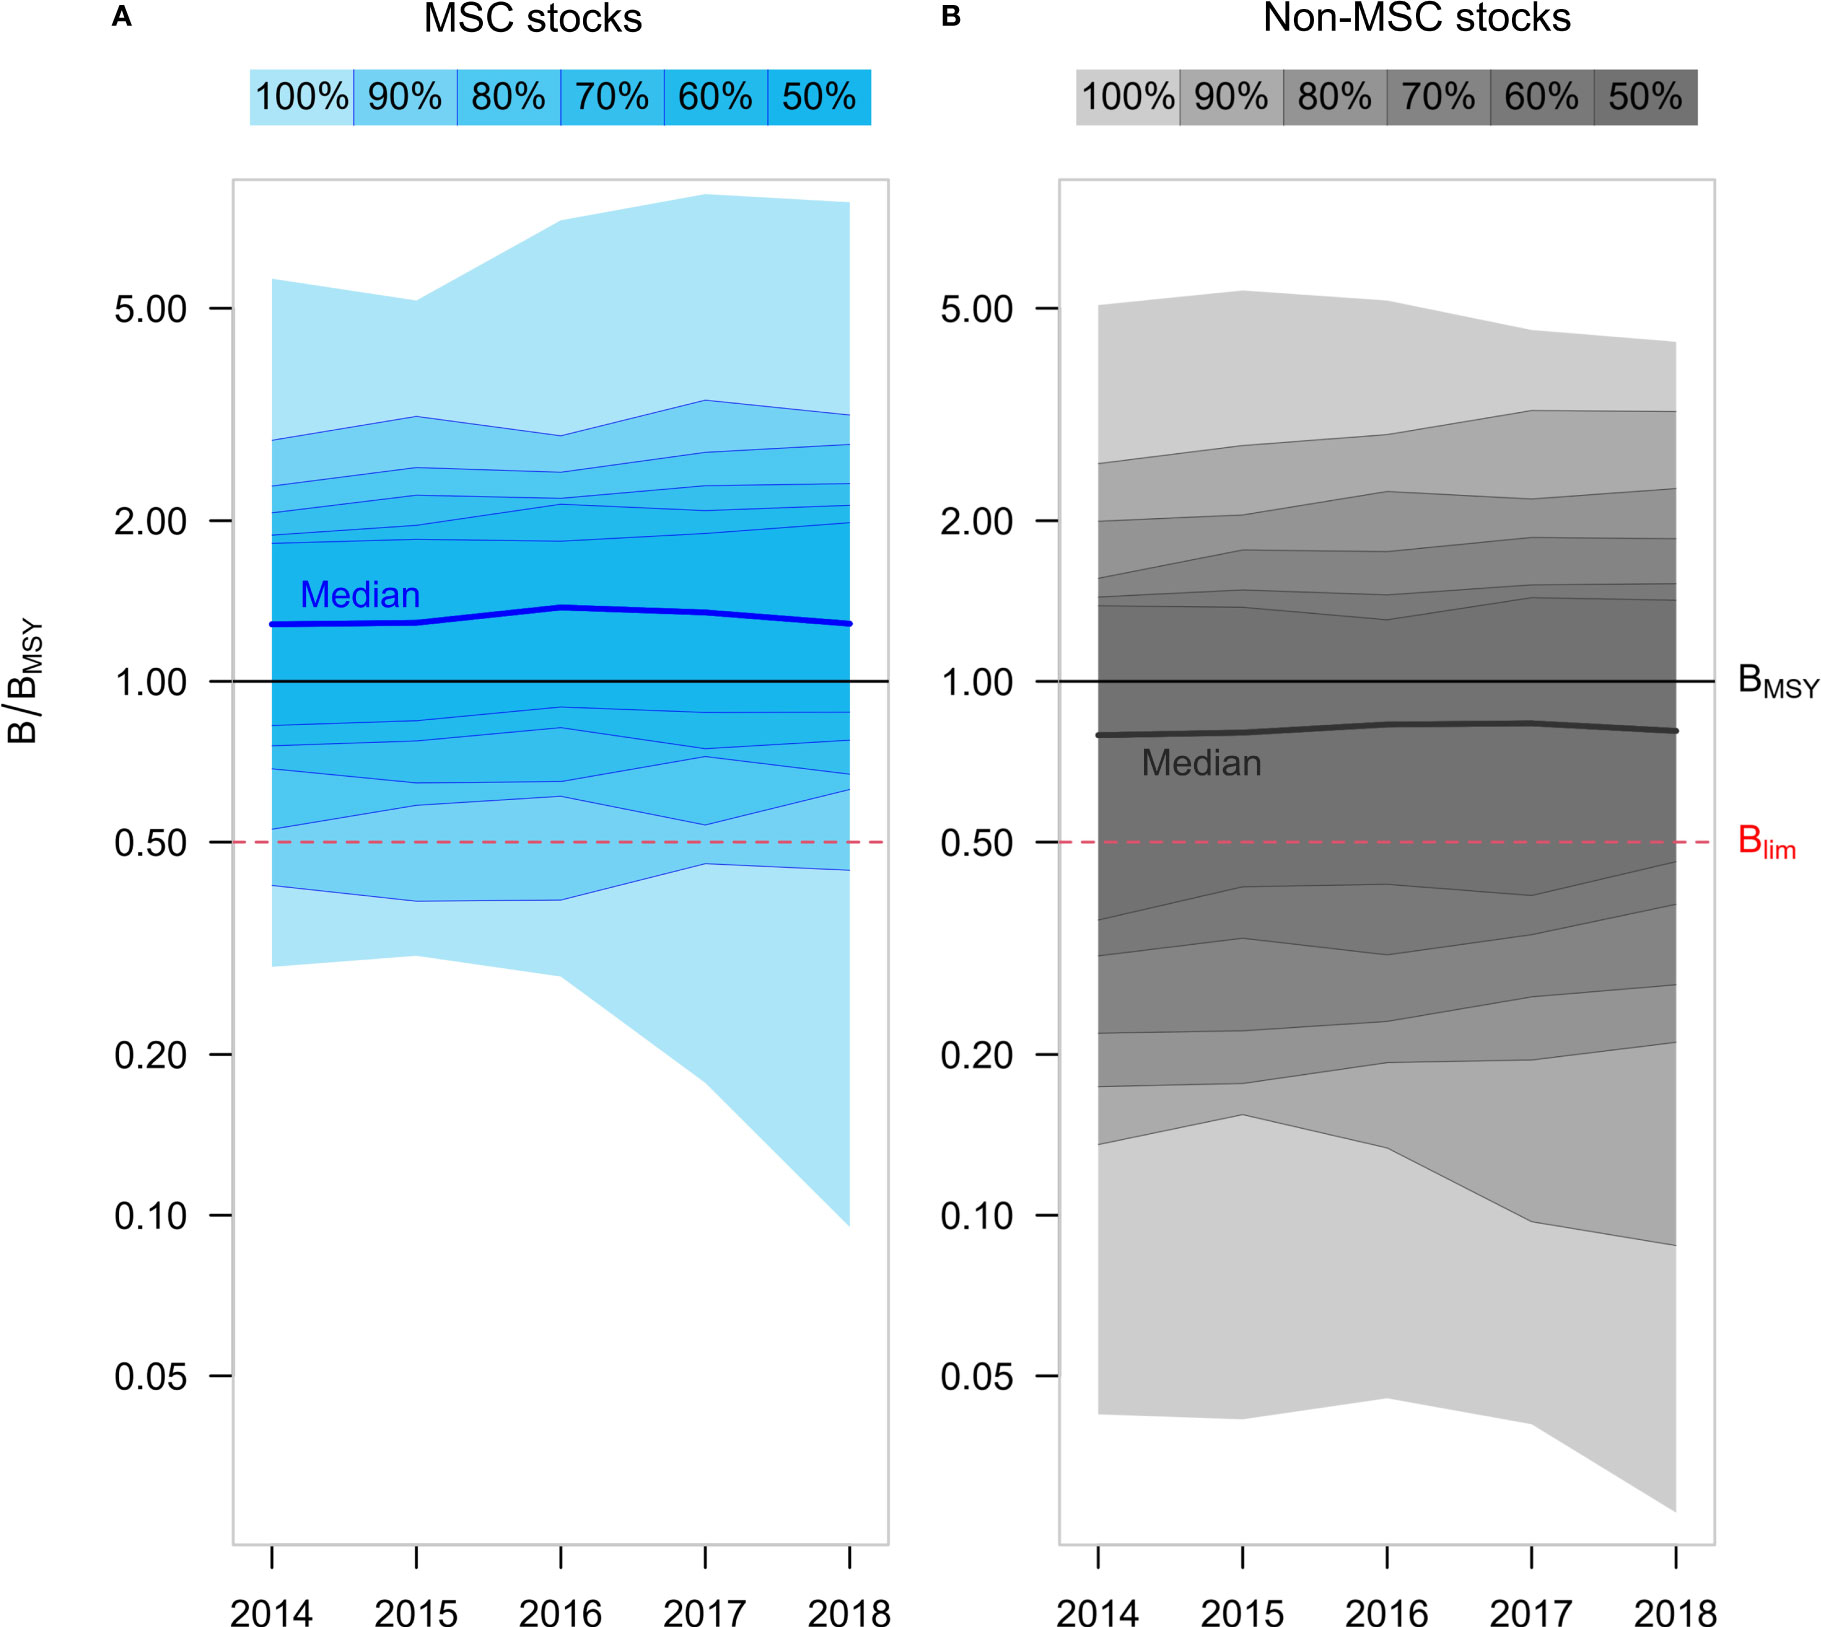
Figure 7 Relative biomass (B/BMSY) of (A) MSC stocks (n = 81) and (B) non-MSC stocks (n = 95) for years 2014-2018. B/BMSY is shown on log scale with truncated axis at lowest value. Percentiles of the distributions across stocks in each group are shown by successive shading levels; 100% intervals represent the full range, and 50% intervals range from the 25th to the 75th percentiles across stocks. Median values are overlaid. Target (BMSY) and limit (Blim) reference point thresholds are shown for comparison.
Mixed-effect model results showed strong statistical support for a difference between groups, with greater relative biomass predicted for MSC stocks than for non-MSC stocks in 2018 (b1 = 0.49 ± 0.15, t = 3.37, p < 0.001; Table 4). The influence attributed to MSC propensity score was statistically significant at α = 0.05 (b2 = -0.62 ± 0.31, z = -1.96, p = 0.0497); this covariate adjustment counters the influence of b1 such that while MSC stocks have greater B/BMSY, the overall combined effect is somewhat diminished because these same stocks also have greater MSC propensity. Accounting for the propensity of certification and for region as a random effect, model predictions for B/BMSY (Figures 4C, D) were greater than the observed medians (Figure 7) for both MSC and non-MSC groups, a result of the model’s log-link error structure assumed for untransformed B/BMSY values. Frequency distributions of fitted values of B/BMSY were narrower than those for observed values (Figures 4C, D), with a clear difference between groups in fitted values. Group means of B/BMSY predicted values showed a difference of 0.49 between groups (Table 4).
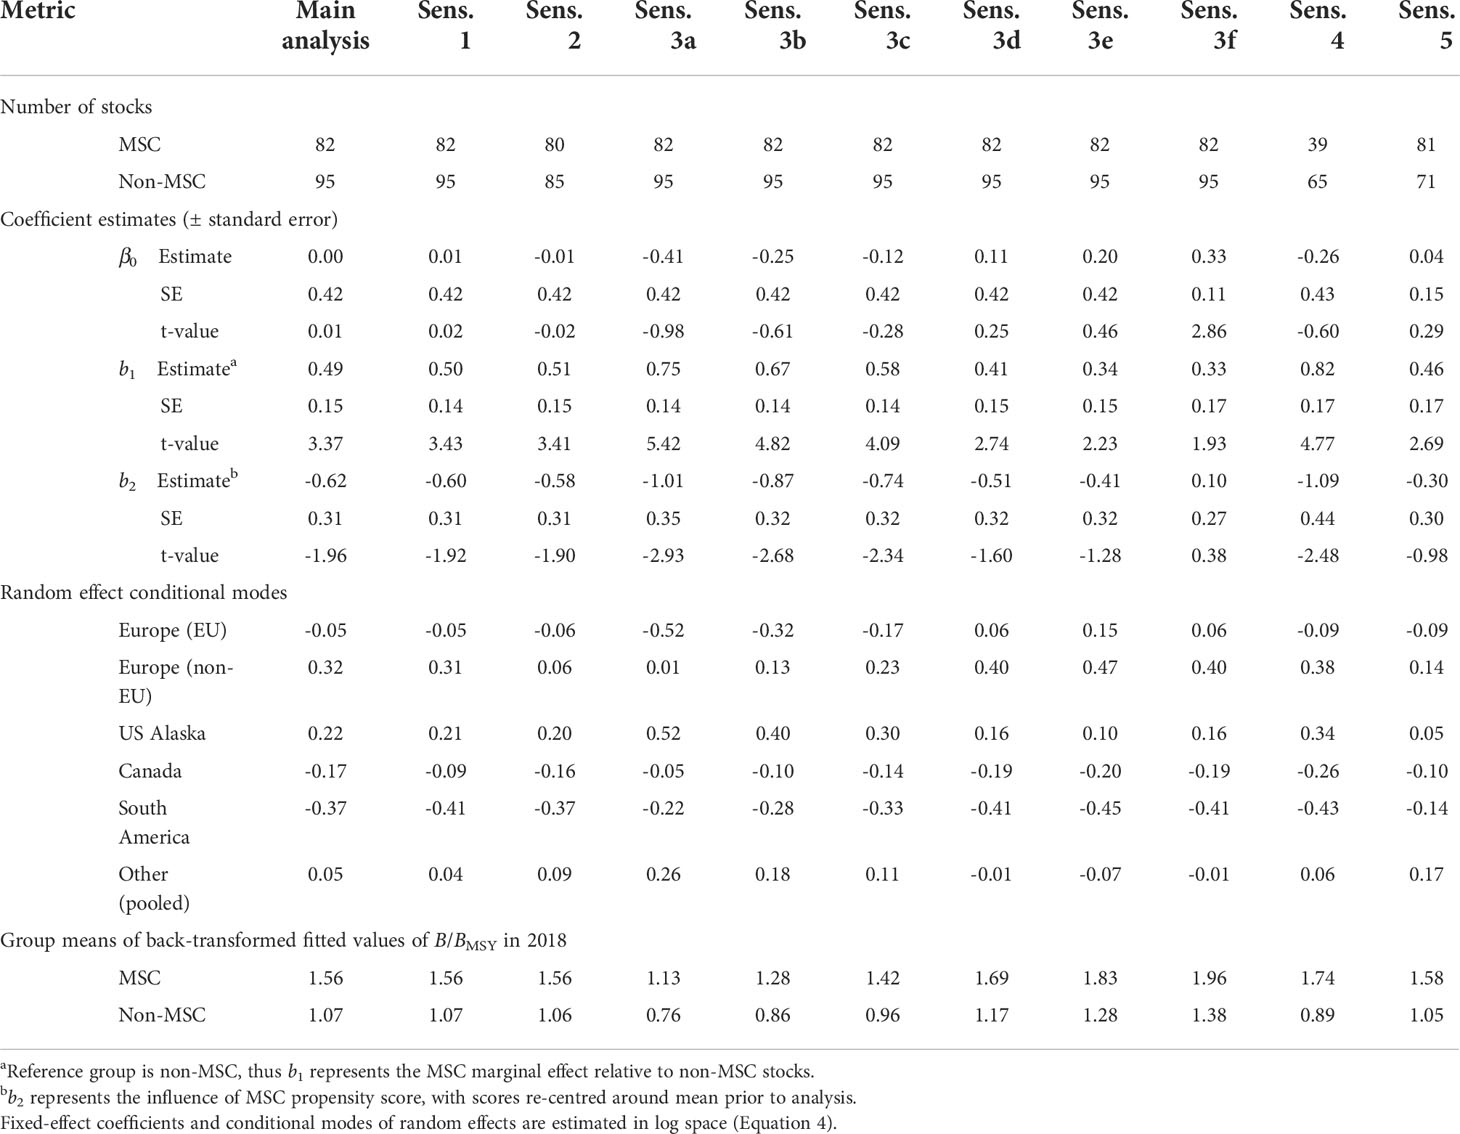
Table 4 Generalized linear mixed-effect model results from main analysis and sensitivity analyses for portion 3 of the analysis, comparing B/BMSY in 2018 between MSC stocks and non-MSC stocks.
Sensitivity analyses
None of the general patterns observed in the main statistical analyses differed substantially from any of the sensitivity analyses conducted. For both portion 1 (Table 3) and portion 3 (Table 4) of the analysis, the relative magnitudes of the ‘MSC/non-MSC effect’ were generally similar across main and sensitivity analyses. This is evident from both the z-values or t-values associated with b1 as well as from the differences in group means of predicted probabilities or fitted values. The most notable exception was observed for Sensitivity 4 of portion 1 of the analysis, for which the difference between MSC and non-MSC groups was not statistically significant (though still in the same direction; z = 0.49, p = 0.62; Table 3). Among all sensitivity analyses, this one had the lowest sample size (77 stocks, compared to 177 in the main analysis), and was the only sensitivity analysis with unrepresented regions for the random effect (stocks were available for only three of the six regions). This number of random effect categories in Sensitivity 4 falls below typical best-practices guidelines (Bolker et al., 2009), so the apparent difference with the main analysis should be interpreted with caution.
Aside from Sensitivity 4, the greatest differences in model predictions between the main analysis and sensitivity analyses were observed for Sensitivity 3, particularly at both extremes of profiled values. As the conversion factor used in Equation 1b increased from 0.2 (Sensitivity 3a) to 0.8 (Sensitivity 3f), the predicted proportions of stocks with B > Blim decreased overall (Table 3) and predicted B/BMSY increased overall (Table 4), but in both analyses the differences between MSC and non-MSC groups were maintained. In portion 1 of the analysis, the estimated effect of MSC propensity was weak in the main analysis and all sensitivity analyses (represented by coefficient b2 in Table 3). In portion 3 of the analysis, the estimated effect of MSC propensity was statistically significant at α = 0.05 in the main analysis, and stronger in some sensitivity analyses while weaker in others, but in all cases b2 had a weaker effect than b1 (Table 4). Conditional modes of random effects occasionally varied across sensitivity analyses, particularly for Sensitivity 3 and Sensitivity 4. This is likely the result of regional variation in the composition of stocks with either BMSY or Blim available prior to conversions, as stocks in the two European regions mostly tended to have Blim available, while stocks in other regions mostly tended to have BMSY available. Overall, general conclusions about differences in relative biomass measures between MSC stocks and non-MSC stocks appear to be robust to alternative assumptions for filtering and transforming input data.
Discussion
In this study, we showed associations between measures of stock status and fishery certification status for marine fish and invertebrate populations around the world. Specifically, we compared estimates of relative biomass between stocks targeted by MSC-certified fisheries and stocks targeted only by non-MSC fisheries. After controlling for the propensity of certification, we showed that, on average, MSC stocks had greater biomass relative to MSY-based reference points and were less likely to be overfished compared to non-MSC stocks. Results of the B/BMSY comparison between MSC and non-MSC stocks are consistent with earlier findings (Gutiérrez et al., 2012) which were based on a more limited set of certified fisheries and assessed stocks (Figure 1). Our results provide a more comprehensive and up-to-date comparison among fisheries of different certification status in regions around the world.
Our results confirm that MSC certification is a credible indicator that the marine fish and invertebrate populations targeted by certified fisheries meet a highly regarded set of best-practice requirements around sustainable fishing. In theory, the claim of credibility is supported by a series of successive consequences enacted if certain benchmarks are not met: if target stock biomass falls below the management target BMSY, the linked fisheries receive a condition to incentivise rebuilding; if biomass falls further below the overfishing limit Blim, the fisheries targeting the stock become suspended. Annual surveillance audits for these indicators ensure that the most recent available scientific estimates of population status are used. The theory around credibility was supported by observed results. After certification, most stocks linked to MSC fisheries had biomass greater than target levels, or else fluctuated around target levels while remaining above the limit reference point (Figure 6). When the biomass of MSC stocks did occasionally drop below the overfished threshold (which was infrequent compared to non-MSC stocks), suspensions of certification ensued (Figure 6). To avoid suspension, certified fisheries’ harvester groups may, as stakeholders in national or regional fisheries management systems, be incentivised to aid in the rebuilding of declining or depleted stocks in order to ensure continual fishing seasons. We turn now to a primary cause of these infrequent occurrences of MSC stock biomass falling below Blim.
Five of the eight MSC stocks which had relative biomass estimated to be below the ‘overfished’ threshold in at least one of the years 2017 or 2018 (Table 2; Figures 5A-E) are exemplars of retrospective changes in stock assessment results (Mohn, 1999; Hurtado-Ferro et al., 2015). For these stocks, estimates of B/Blim that were available at the time of certification were all greater than 1, were all greater than the more recent estimates of B/Blim for those earlier corresponding years, and were all greater than the more recent estimates of B/Blim in 2017 and 2018. It is common (and desirable) for stock assessment outputs to be revised as more data become available and methods are refined. Some stock status revisions result from estimated changes in the state, e.g., B, while others result from estimated changes in the magnitude of biological reference points, e.g., Blim or BMSY (Silvar-Viladomiu et al., 2021). It is inevitable that stock biomass will fluctuate and, in some cases, may even decrease below an overfished threshold in the absence of fishing (e.g., McClatchie et al., 2017). In response to these changes, fisheries management agencies aim to respond rapidly. Likewise, the MSC program incentivises fisheries to contribute to improvements in the management of fisheries and sustainability status of stocks, through the imposition of conditions or suspensions until sustainability benchmarks are once again achieved (Agnew et al., 2013). Four of these five MSC stocks had suspensions begin within three years after first certification, once it was detected in revised stock assessments that relative biomass was or had been below the overfished threshold (Figures 5A, C–E). Biomass of the fifth stock, North Sea sole, has fluctuated near Blim since certification, and was estimated in the 2020 stock assessment to be slightly above this threshold in 2020 (ICES, 2021c); a rebuilding condition has been in place since 2019 (Figure 5B). Four stocks had biomass decline from above Blim to below Blim within 1-8 years of certification; for all of these, suspensions started soon after the revised biomass estimates suggested a decline, and fisheries linked to these stocks eventually withdrew from the MSC program while under suspension (Figures 5E-H). In general, these patterns reflect that fisheries engaged in the MSC program are required to respond promptly to act on revised estimates of the sustainability status of targeted stocks.
Our main findings are consistent with some earlier studies but inconsistent with others; we note again that previous studies all relied on a more limited dataset. Similar conclusions were reached with regards to MSC’s credibility (Gutiérrez et al., 2012; MSC, 2016; MSC, 2017) and differences between MSC and non-MSC stocks (Gutiérrez et al., 2012). On the other hand, Froese and Proelss (2012) and Opitz et al. (2016) reached different conclusions regarding MSC’s credibility. As discussed in Agnew et al. (2013); Froese and Proelss (2012) failed to use a conventional definition for ‘overfished’ and to consider BMSY as a dynamic state around which stocks fluctuate. Further, they misidentified some MSC stocks and failed to recognise that the MSC program imposed rebuilding conditions. Opitz et al. (2016), though using a more conventional definition of overfished, failed to examine retrospective patterns in biomass estimates, did not consider whether any conditions or suspensions had already been imposed on the MSC-linked stocks identified as being fished outside of safe biological limits, and examined only North-eastern Atlantic stocks for which ICES advice was available. Further, they lacked a comparator even by the broad criteria set in Arton et al. (2020), thus did not test the relevance of the MSC program through comparison with non-MSC stocks. Not all agree on the definition of fisheries sustainability used by the MSC (e.g., Froese and Proelss, 2013), on some of the processes involved in certification (e.g., Christian et al., 2013; versus Brown et al., 2016), or whether the MSC provides the right incentive to drive change (e.g., Komives et al., 2018; compared to Roheim et al., 2018). Here we do not debate the merits of these definitions or processes, but instead suggest that stocks targeted by MSC-certified fisheries reliably meet the stock status requirements under Principle 1 of the Standard; these requirements were set to align with Article 61 of the United Nations Convention on the Law of the Sea (UNCLOS, 1982) and follow the FAO Code of Conduct for Responsible Fisheries (FAO, 1995).
Stock biomass and corresponding target and limit reference points represent only some of the information that managers must consider when grappling with decisions that often involve trade-offs among competing objectives. Different benchmarks, for example considering BMSY as a limit rather than a target, or alternatives to MSY-based quantities such as maximum economic yield or focus on nutrient provision (Robinson et al., 2022), all involve societal as well as biological considerations that we do not address in this study. More broadly, best-practice management extends beyond evaluating single-population measures of relative biomass, also considering wider impacts of fishing activities on food webs and ecosystems. Many such considerations are addressed in Principle 2 of the Standard, which were not addressed in the work presented here.
Fisheries which achieve MSC certification must meet a high standard for relative biomass in order to be certified in the first place; their relative biomass levels and trends (along with levels of fishing pressure and other requirements) tend to be among those that are already best-managed or fished within sustainable levels. Certification is not random among stocks, high relative biomass enables fisheries to be certified, i.e. fisheries ‘self-select’ into certification (Thorson et al., 2015). Accounting for the propensity of certification in analyses aimed to reduce this self-selection bias (Rosenbaum and Rubin, 1983). MSC propensity was strongly influenced by average catch, as stocks with greater catches were more likely to be linked to MSC-certified fisheries. Similarly, stock catch was a strong predictor of the probability of US stocks to be scientifically assessed for the first time (Neubauer et al., 2018) and of the probability of stocks to be managed under catch share systems in regions around the world (Melnychuk et al., 2012). Neubauer et al. (2018) also found ex-vessel price to have a strong positive effect on the probability of first assessment, but here we detected only a weak effect of price on the probability of certification, counter to expectations. Akin to the likelihood of inter-relationships between biomass and certification, there are likely to be inter-relationships between price and certification with influences occurring in both directions; future work analysing price time series with respect to the timing of certification may reveal clearer patterns between them.
The results presented in this study should not be taken as evidence of causal influence of certification on relative biomass or risk of overfishing. First, although we aimed to control for the self-selection bias inherent in fisheries certification by accounting for MSC propensity, these are still observational data and certification is not independent of relative biomass. Identification strategies such as the one we used do not provide the same rigour for identifying causal effects as would a randomised control trial, and the possibility of inverse causality to at least some extent remains. Second, we did not simultaneously account for other factors which may influence both stock status and the propensity to become certified. In other words, an observed pattern between stock status and certification status does not imply causation, as the association may result from a common influence. For example, some taxonomic groups of fishes or invertebrates may be more likely to exhibit large fluctuations in biomass (McClatchie et al., 2017), which in turn may make them less likely to become certified or to remain certified because estimating MSY-based reference points and demonstrating continued adherence to related requirements in the Standard become more challenging. Similarly, some fisheries management measures may affect both stock status and the propensity of fisheries becoming certified; this could lead to a correlation without any underlying mechanism of causality. Third, such ‘snapshot’ comparisons that do not account for temporal dynamics of either MSC stocks or control stocks do not provide the ability to relate potential interannual changes in stock status to the timing of changes in certification status. Time series methods can be used in future studies to evaluate differences in relative biomass before and after certification while accounting for similar baseline changes over time in the biomass of non-MSC stocks; baseline changes are likely given that average biomass of assessed stocks around the world has generally increased over the past two decades (Hilborn et al., 2020; Melnychuk et al., 2020). All three of these issues are commonly encountered in fisheries and ecological studies, particularly in observational data when random assignment of observational units into treatment groups is prohibitive. Future work could address these challenges and, with time series methods, attempt to better identify the potential influence of fisheries certification (along with other potential co-varying influences such as environmental or management changes) on changes in the status of fish stocks.
Despite the challenges of demonstrating causal influence of factors like certification in observational studies such as ours, we nevertheless observed differences between MSC stocks and non-MSC stocks. Further, this could be considered a conservative analysis because we only compared stocks for which formal assessments exist, representing a subset of commercially-landed species that is likely to be better managed (Melnychuk et al., 2020). Greater differences would be expected if an analysis were to also include the many non-MSC stocks for which no biological reference points have been estimated because the sustainability status of those other stocks is, on average, likely poorer (Costello et al., 2016). Whether or not certification has any causal influence on biomass, the observation holds that stocks considered to be overfished (with B < Blim) are much less likely to be targeted by MSC-certified fisheries. This observation is key for providing the credibility claim that seafood products sold with the MSC ecolabel are from sustainably-fished populations. The rare occurrences when MSC stocks had biomass that fell below the overfished threshold in recent years usually resulted from retrospective changes in scientific advice from stock assessments (Mohn, 1999; Hurtado-Ferro et al., 2015). Once the updated advice was released showing that relative abundance was lower than previously thought, conditions of certification and, if necessary, suspensions were imposed following an expedited audit. That is, fisheries within the MSC program promptly responded to ensure that targeted stocks are fished within sustainable limits and, if they do fall below precautionary management thresholds, are fished at levels expected to enable rebuilding. Our analysis highlights the complexity of addressing a continuous range of levels reflecting the sustainability status of a harvested natural resource through a certification system that, by definition, only assigns a binary certified or not-certified status. This is further complicated by the need to rely on what is best available scientific advice at the time, which can sometimes be revised in light of new information. Our approach to testing credibility may be expanded to consider these nuances explicitly and verify other sustainability claims. Our work provides a foundation for further analyses seeking to attribute causes of changes in stock sustainability measures to competing potential influences, including certification.
Data availability statement
Publicly available datasets were analysed in this study, which can be found in the following sources. The RAMLDB version 4.495 ‘mdl’ analysed for this study can be found in the Zenodo repository ‘Extended RAM Legacy Stock Assessment Database’ at https://zenodo.org/record/5709081. The RAMLDB version 4.495 ‘asmt’ analysed for Sensitivity 2 can be found in the Zenodo repository ‘RAM Legacy Stock Assessment Database’ at https://zenodo.org/record/4824192. The information necessary for classifying MSC and non-MSC stocks, as well as years of certification, conditions, suspensions, and withdrawals of MSC fisheries, were manually extracted from MSC fishery assessment reports that can openly be accessed from the MSC’s ‘Track a Fishery’ website at https://fien/en/fisheries/. Linkages established between RAMLDB stocks and MSC fisheries are provided in Supplementary Table 2.
Author contributions
CL, EJ, AV, and MM contributed to conception and design of the study. PH, AV, SL, LK, JR, DC, MM, and DH organised and validated the databases used. MM and AV performed the statistical analysis. AV, JR, LK, and MM prepared figures. MM wrote the first draft of the manuscript. CL and AV wrote sections of the manuscript. All authors contributed to manuscript revision and have read and approved the submitted version.
Funding
All authors are employed or were previously employed by the Marine Stewardship Council or University of Washington, but there are no funding sources to declare specifically for this study.
Acknowledgments
We thank Karin Mundnich, Megan Atcheson, Tim Davies, Margaux Favret, and Katie Keay for support with quality control, Ishbel Matheson, David Schley, Jay Lugar, and Rohan Currey for helpful comments on the analysis and manuscript, other MSC staff for general support, and Dan Ricard for providing early RAMLDB usage statistics. We thank all data contributors to the RAM Legacy Stock Assessment Database. Finally, we thank four anonymous reviewers who provided helpful suggestions for the analysis and manuscript.
Conflict of interest
MM, SL, JR, LK, PH, DC, EJ, and CL are currently employed and AV was previously employed by the Marine Stewardship Council (MSC).
The remaining authors declare that the research was conducted in the absence of any commercial or financial relationships that could be construed as a potential conflict of interest.
Publisher’s note
All claims expressed in this article are solely those of the authors and do not necessarily represent those of their affiliated organizations, or those of the publisher, the editors and the reviewers. Any product that may be evaluated in this article, or claim that may be made by its manufacturer, is not guaranteed or endorsed by the publisher.
Supplementary material
The Supplementary Material for this article can be found online at: https://www.frontiersin.org/articles/10.3389/fmars.2022.818772/full#supplementary-material
Footnotes
- ^ https://cfree.shinyapps.io/ramlsb_viewer/.
- ^ https://fien/en/fisheries/.
- ^ https://www.ices.dk/data/assessment-tools/Pages/stock-information-database.aspx.
- ^ key LTL designations apply in Performance Indicator 1.1.1A, SA 2.2.12 of the MSC Certification Requirements.
- ^ https://mscportal.force.com/interpret/s/article/Scoring-stock-status-against-Bmsy-for-ICES-stocks-PI-1-1-1-1527262010506.
References
Agnew D. J., Gutiérrez N. L., Stern-Pirlot A., Smith A. D. M., Zimmermann C., Sainsbury K. (2013). Rebuttal to froese and proelss “Evaluation and legal assessment of certified seafood.” Mar. Policy 38, 551–553. doi: 10.1016/j.marpol.2012.07.002
Arton A., Leiman A., Petrokofsky G., Toonen H., Neat F., Longo C. S. (2020). What do we know about the impacts of the marine stewardship council seafood ecolabelling program? a systematic map. Environ. Evidence. 9, 1–20. doi: 10.1186/s13750-018-0143-1
Bates D., Mächler M., Bolker B., Walker S. (2015). Fitting linear mixed-effects models using lme4. J. Stat. Software. 67, 1–48. doi: 10.18637/jss.v067.i01
Bolker B. M., Brooks M. E., Clark C. J., Geange S. W., Poulsen J. R., Stevens M. H. H., et al. (2009). Generalized linear mixed models: a practical guide for ecology and evolution. Trends Ecol. Evol. 24, 127–135. doi: 10.1016/j.tree.2008.10.008
Brooks E. N., Deroba J. J. (2015). When “data” are not data: the pitfalls of post hoc analyses that use stock assessment model output. Can. J. Fish. Aquat. Sci. 72, 634–641. doi: 10.1139/cjfas-2014-0231
Brown S., Agnew D. J., Martin W. (2016). On the road to fisheries certification : The value of the objections procedure in achieving the MSC sustainability standard. Fish. Res. 182, 136–148. doi: 10.1016/j.fishres.2015.10.015
Christian C., Ainley D., Bailey M., Dayton P., Hocevar J., LeVine M., et al. (2013). A review of formal objections to marine stewardship council fisheries certifications. Biol. Conserv. 161, 10–17. doi: 10.1016/j.biocon.2013.01.002
Costello C., Ovando D., Clavelle T., Strauss C. K., Hilborn R., Melnychuk M. C., et al. (2016). Global fishery prospects under contrasting management regimes. Proc. Natl. Acad. Sci. 113, 5125–5129. doi: 10.1073/pnas.1520420113
FAO (1995). (Rome, Italy) Food and agriculture organization of the united nations. Code of conduct for responsible fisheries, ISBN: ISBN 92-5-103834-5RAMLDB, 2021: Zenodo.
FAO (2009). Guidelines for the ecolabelling of fish and fishery products from marine capture fisheries (Rome, Italy) Food and agriculture organization of the United Nations. doi: 10.1007/s13398-014-0173-7.2
Foley P., McCay B. (2014). Certifying the commons: Eco-certification, privatization, and collective action. Ecol. Soc. 19(2):28. doi: 10.5751/ES-06459-190228
Free C. M., Thorson J. T., Pinsky M. L., Oken K. L., Wiedenmann J., Jensen O. P. (2019). Impacts of historical warming on marine fisheries production. Science (1979) 363, 979–983. doi: 10.1126/science.aau1758
Froese R., Proelss A. (2012). Evaluation and legal assessment of certified seafood. Mar. Policy 36, 1284–1289. doi: 10.1016/j.marpol.2012.03.017
Froese R., Proelss A. (2013). Is a stock overfished if it is depleted by overfishing? a response to the rebuttal of Agnew et al. to froese and proelss “Evaluation and legal assessment of certified seafood.” Mar. Policy 38, 548–550. doi: 10.1016/j.marpol.2012.07.001
Gutiérrez A. T., Morgan S. K. (2015). The influence of the sustainable seafood movement in the US and UK capture fisheries supply chain and fisheries governance. Front. Mar. Sci. 2. doi: 10.3389/fmars.2015.00072
Gutiérrez N. L., Valencia S. R., Branch T., Agnew D. J., Baum J. K., Bianchi P. L., et al. (2012). Eco-label conveys reliable information on fish stock health to seafood consumers. PloS One 7, e43765. doi: 10.1371/journal.pone.0043765
Hilborn R. (2020). Measuring fisheries management performance. ICES J. Mar. Sci. 77, 2432–2438. doi: 10.1093/icesjms/fsaa119
Hilborn R., Amoroso R. O., Anderson C. M., Baum J. K., Branch T. A., Costello C., et al. (2020). Effective fisheries management instrumental in improving fish stock status. Proc. Natl. Acad. Sci. 117, 2218–2224. doi: 10.1073/pnas.1909726116
Hilborn R., Walters C. J. (1992). Quantitative fisheries stock assessment: Choice, dynamics and uncertainty (New York, N.Y: Routledge, Chapman and Hall, Inc).
Hurtado-Ferro F., Szuwalski C. S., Valero J. L., Anderson S. C., Cunningham C. J., Johnson K. F., et al. (2015). Looking in the rear-view mirror: bias and retrospective patterns in integrated, age-structured stock assessment models. ICES J. Mar. Sci. 72, 99–110. doi: 10.1093/icesjms/fsu198
ICES (2021a)Advice on fishing opportunities. In: Report of the ICES advisory committee 2021. ICES advice 2021, section 1.1.1. doi: 10.17895/ices.advice.7720.
ICES (2021b) ICES stock information database (Copenhagen, Denmark). Available at: https://sid.ices.dk (Accessed 2021-11-03).
ICES (2021c)Sole (Solea solea) in subarea 4 (North Sea). In: Report of the ICES advisory committee 2021. ICES advice 2021, sol.27.4. doi: 10.17895/ices.advice.8147.
ISEAL (2014) Assessing the impacts of social and environmental standards systems. ISEAL code of good practice version 2.0 – December 2014 (ISEAL Alliance). Available at: https://www.isealalliance.org/sites/default/files/resource/2019-06/ISEAL_Impacts_Code_Version_2.0.pdf (Accessed 2021-11-15).
Komives K., Arton A., Baker E., Longo C., Newsom D., Mendez R., et al. (2018). Conservation impacts of voluntary sustainability standards: How has our understanding changed since the 2012 publication of “Toward sustainability: The roles and limitations of certification? (Washington, D.C) Meridian Institute.
Lassen H., Kelly C., Sissenwine M. (2014). ICES advisory framework 1977–2012: from fmax to precautionary approach and beyond. ICES J. Mar. Sci. 71, 166–172. doi: 10.1093/icesjms/fst146
le Manach F., Jacquet J. L., Bailey M., Jouanneau C., Nouvian C. (2020). Small is beautiful, but large is certified: A comparison between fisheries the marine stewardship council (MSC) features in its promotional materials and MSC-certified fisheries. PloS One 15, 1–12. doi: 10.1371/journal.pone.0231073
Longo C. S., Buckley L., Good S. D., Gorham T. M., Koerner L., Lees S., et al. (2021). A perspective on the role of eco-certification in eliminating illegal, unreported and unregulated fishing. Front. Ecol. Evol. 9. doi: 10.3389/fevo.2021.637228
Mace P. M. (1994). Relationships between common biological reference points used as thresholds and targets of fisheries management strategies. Can. J. Fish. Aquat. Sci. 51, 110–122. doi: 10.1139/f94-013
McClatchie S., Hendy I. L., Thompson A. R., Watson W. (2017). Collapse and recovery of forage fish populations prior to commercial exploitation. Geophys. Res. Lett. 44, 1877–1885. doi: 10.1002/2016GL071751
Melnychuk M. C., Baker N., Hively D., Mistry K., Pons M., Ashbrook C. E., et al. (2020). “Global trends in status and management of assessed stocks: Achieving sustainable fisheries through effective management,” in FAO fisheries and aquaculture technical paper no. 665 (Rome: FAO). doi: 10.4060/cb1800en
Melnychuk M. C., Clavelle T., Owashi B., Strauss C. K. (2017). Reconstruction of global ex-vessel prices of fished species. ICES J. Mar. Sci. 74, 121–133. doi: 10.1093/icesjms/fsw169
Melnychuk M. C., Essington T. E., Branch T., Heppell S. S., Jensen O. P., Link J. S., et al. (2012). Can catch share fisheries better track management targets? Fish. Fish. 13, 267–290. doi: 10.1111/j.1467-2979.2011.00429.x
Melnychuk M. C., Kurota H., Mace P. M., Pons M., Minto C., Osio G. C., et al. (2021). Identifying management actions that promote sustainable fisheries. Nat. Sustainability 4, 440–449. doi: 10.1038/s41893-020-00668-1
Methot R. D. Jr., Tromble G. R., Lambert D. M., Greene K. E. (2014). Implementing a science-based system for preventing overfishing and guiding sustainable fisheries in the united states. ICES J. Mar. Sci. 71, 183–194. doi: 10.1093/icesjms/fst119
Mohn R. (1999). The retrospective problem in sequential population analysis: An investigation using cod fishery and simulated data. ICES J. Mar. Sci. 56, 473–488. doi: 10.1006/jmsc.1999.0481
MSC (2016). Global impacts report 2016 (London, England: Marine Stewardship Council). Available at: https://www.msc.org/documents/environmental-benefits/global-impacts/msc-global-impacts-report-2016.
MSC (2017). Global impacts report 2017 (London, England: Marine Stewardship Council). Available at: https://www.msc.org/documents/environmental-benefits/global-impacts/msc-global-impacts-report-2014.
MSC (2018) MSC fisheries standard v2.01 (London, UK). Available at: https://www.msc.org/docs/default-source/default-document-library/for-business/program-documents/fisheries-program-documents/msc-fisheries-standard-v2-01.pdf?sfvrsn=8ecb3272_19 (Accessed March 3, 2022).
MSC (2021). “Recognising & rewarding sustainable fishing,” in The marine stewardship council annual report 2020-21(London, UK) Marine Stewardship Council.
Neubauer P., Thorson J. T., Melnychuk M. C., Methot R., Blackhart K. (2018). Drivers and rates of stock assessments in the united states. PloS One 13, e0196483. doi: 10.1371/journal.pone.0196483
Opitz S., Hoffmann J., Quaas M., Matz-Lück N., Binohlan C., Froese R. (2016). Assessment of MSC-certified fish stocks in the northeast Atlantic. Mar. Policy 71, 10–14. doi: 10.1016/j.marpol.2016.05.003
RAMLDB (2021). Extended RAM legacy stock assessment database version 4.494 mdl-fits. doi: 10.5281/ZENODO.4825876
Rayns N. (2007). The Australian government’s harvest strategy policy. ICES J. Mar. Sci. 64, 596–598. doi: 10.1093/icesjms/fsm032
Restrepo V. R., Thompson G. G., Mace P. M., Gabriel W. L., Low L. L., MacCall A. D., et al. (1998). “Technical guidance on the use of precautionary approaches to implementing national standard 1 of the Magnuson-stevens fishery conservation and management act,” in NOAA Technical memorandum NMFS, vol. 56. (Washington, DC, USA) National Marine Fisheries Service. Available at: http://www.st.nmfs.noaa.gov/StockAssessment/documents/Tech-Guidelines.pdf.
Ricard D., Minto C., Jensen O. P., Baum J. K. (2012). Examining the knowledge base and status of commercially exploited marine species with the RAM legacy stock assessment database. Fish. Fish. 13, 380–398. doi: 10.1111/j.1467-2979.2011.00435.x
Rice J. (2014). Evolution of international commitments for fisheries sustainability. ICES J. Mar. Sci. 71, 157–165. doi: 10.1093/icesjms/fst078
Robinson J. P. W., Nash K. L., Blanchard J. L., Jacobsen N. S., Maire E., Graham N. A. J., et al. (2022) 23, 800–811. Managing fisheries for maximum nutrient yield. Fish. Fish. doi: 10.1111/faf.12649
Robinson L. M., van Putten I., Cavve B. S., Longo C., Watson M., Bellchambers L., et al. (2021). Understanding societal approval of the fishing industry and the influence of third-party sustainability certification. Fish. Fish. 22, 1213–1226. doi: 10.1111/faf.12583
Roheim C. A., Bush S. R., Asche F., Sanchirico J. N., Uchida H. (2018). Evolution and future of the sustainable seafood market. Nat. Sustainability 1, 392–398. doi: 10.1038/s41893-018-0115-z
Rosenbaum P. R., Rubin D. B. (1983). The central role of the propensity score in observational studies for causal effects. Biometrika 70, 41–55. doi: 10.1093/biomet/70.1.41
Silvar-Viladomiu P., Minto C., Halouani G., Batts L., Brophy D., Lordan C., et al. (2021). Moving reference point goalposts and implications for fisheries sustainability. Fish. Fish. 22, 1345–1358. doi: 10.1111/faf.12591
Thorson J. T., Cope J. M., Kleisner K. M., Samhouri J. F., Shelton A. O., Ward E. J. (2015). Giants’ shoulders 15 years later: lessons, challenges and guidelines in fisheries meta-analysis. Fish. Fish. 16, 342–361. doi: 10.1111/faf.12061
UNCLOS (1982) United nations convention on the law of the Sea. Available at: https://cil.nus.edu.sg/databasecil/1982-united-nations-convention-on-the-law-of-the-sea/ (Accessed November 17, 2021).
Keywords: Marine Stewardship Council, stock status, sustainable fishing, marine conservation, overfishing, retrospective bias, eco-labelling, propensity score (PS)
Citation: Melnychuk MC, Veneziano A, Lees S, Rasal J, Koerner LM, Hair P, Costalago D, Hively D, Jardim E and Longo C (2022) Wild-caught fish populations targeted by MSC-certified fisheries have higher relative abundance than non-MSC populations. Front. Mar. Sci. 9:818772. doi: 10.3389/fmars.2022.818772
Received: 20 November 2021; Accepted: 29 June 2022;
Published: 01 September 2022.
Edited by:
Jie Cao, North Carolina State University, United StatesReviewed by:
Geret Sean DePiper, Northeast Fisheries Science Center (NOAA), United StatesBrendan J. Runde, The Nature Conservancy (United States), United States
Copyright © 2022 Melnychuk, Veneziano, Lees, Rasal, Koerner, Hair, Costalago, Hively, Jardim and Longo. This is an open-access article distributed under the terms of the Creative Commons Attribution License (CC BY). The use, distribution or reproduction in other forums is permitted, provided the original author(s) and the copyright owner(s) are credited and that the original publication in this journal is cited, in accordance with accepted academic practice. No use, distribution or reproduction is permitted which does not comply with these terms.
*Correspondence: Michael C. Melnychuk, michael.melnychuk@msc.org