Performance Comparison of Three Data-Poor Methods With Various Types of Data on Assessing Southern Atlantic Albacore Fishery
 Baochao Liao
 Youwei Xu
 Mingshuai Sun
 Kui Zhang
 Qun Liu
- 1School of Mathematics and Statistics, Shandong University, Weihai, China
- 2Key Laboratory for Sustainable Utilization of Open-sea Fishery, Ministry of Agriculture and Rural Affairs, South China Sea Fisheries Research Institute, Chinese Academy of Fishery Sciences, Guangzhou, China
- 3Southern Marine Science and Engineering Guangdong Laboratory (Guangzhou), Guangzhou, China
- 4College of Fisheries, Ocean University of China, Qingdao, China
In the world, more than 80% of the fisheries by numbers and about half of the catches have not been formally analyzed and evaluated due to limited data. It has led to the fast growth of data-poor evaluation methods. There have been various studies carried out on the comparative performance of data-poor and data-moderate methods in evaluating fishery exploitation status. However, most studies to date have focused on coastal fish stocks with simple data sources. It is important to pay attention to high sea fisheries because they are exploited by multiple countries, fishing gears and data may be divrsified and inconsistent. Furthermore, a comparison of the performance of catch-based, length-based, and abundance-based methods to estimate fishery status is needed. This study is the first attempt to apply catch-based, length-based, and abundance-based data-poor methods to stock assessment for an oceanic tuna fishery and to compare the performance with a data-moderate model. Results showed that the three data-poor methods with various types of data did not produce an entirely consistent stock status of the southern Atlantic albacore (Thunnus alalunga) fishery in 2005, as the estimated B2005/BMSY ranged from 0.688 to 1.3 and F2005/FMSY ranged from 0.708 to 1.6. The Monte Carlo Catch maximum sustainable yield model (CMSY) produced a similar time series of B/BMSY and F/FMSY and stock status (recovering) to the Bayesian state-space Schaefer model (BSM). The abundance-based method (AMSY) gave the most conservative condition (overfished) of this fishery. Sensitivity analysis showed the results of the length-based Bayesian biomass estimation method (LBB) are sensitive to Linf settings, and the results with higher Linf were similar to those of other models. However, the LBB results with setting Linf at lower levels produced more optimistic conditions (healthy). Our results highlight that attention should be paid to the settings of model parameter priors and different trends implied in various types of data when using these data-poor methods.
Introduction
The majority of fisheries around the world are considered in data-poor conditions, and only a fraction of species has been assessed (Costello et al., 2012; FAO, 2020; Hilborn et al., 2020). In data-poor fisheries, it is often difficult for managers to assess the status of fish stocks and implement scientific management (Newman et al., 2014; Mcdonald et al., 2018; Free et al., 2020). As a result of widespread overfishing, the demand for fish stock assessment methods with limited data is increasing, and new methods are being developed rapidly (Free et al., 2020). There are three kinds of data-poor methods commonly used to estimate biological reference points (BRPs) and fishery management limits within the context of maximum sustainable yield (MSY). The first class is catch-based methods, which require only the time series of catch data and in some cases, information about life history or fishery characteristics to estimate the status of the stock (Free et al., 2020; Lucena-Frédou et al., 2021). The second class is length-based methods, which require length-frequency data, and when the basic biological parameters are known, the methods allow estimations of instantaneous fishing mortality and spawning potential ratio (Pons et al., 2020; Zhang et al., 2021a). The third class is abundance-based methods, which require time series of abundance index that estimates BRPs when no catch data are available, using time series of catch rates from commercial fisheries or scientific surveys combined with prior estimates of resilience (Froese et al., 2020; Falsone et al., 2021).
Although the abovementioned methods could estimate the time series of relative biomass levels (e.g., B/BMSY) and relative exploitation levels (e.g., F/FMSY and F/M), they may result in inconsistent exploitation status of target stocks due to different model assumptions, data types, and requirements (Figure 1). These data-limited assessment methods are increasingly used worldwide, but there is still considerable uncertainty as to which methods may be applicable to specific stocks (Bouch et al., 2021). There is a need for specific advice on which approaches are suitable or unsuitable to use when a fishery has limited and more than one type of data. A number of studies compared the performance of data-poor and data-moderate methods in estimating fishery exploitation status. (Chong et al., 2020; Pons et al., 2020; Bouch et al., 2021; Falsone et al., 2021; Liao et al., 2021). Pons et al. (2020) compared the performance of catch-only and length-only assessment models and found results were more biased for slightly depleted and for long-lived species. Bouch et al. (2021) indicated data-poor Catch-MSY method might overestimate relative fishing mortality and underestimate relative stock biomass, while the data-moderate surplus production model in continuous time (SPiCT) showed the opposite. Falsone et al. (2021) applied the Monte Carlo Catch-MSY model (CMSY), abundance-MSY model (AMSY), and Bayesian state-space Schaefer model (BSM) for the silver scabbardfish (Lepidopus caudatus) fishery in the central Mediterranean Sea, and the results showed that AMSY depicted a more severe overfished condition than BSM and CMSY. Liao et al. (2021) suggest that BSM and the two catch-based models, CMSY and Catch-MSY, performed better than traditional production models (TPMs) when evaluating largehead hairtail (Trichiurus lepturus) fishery in the East China Sea. However, most of the studies focused on coastal commercial fish stocks. It is important to pay attention to oceanic high-trophic-level fisheries because they are exploited by multiple countries and use varied fishing gear, as a result, data may be diversified and inconsistent. Furthermore, a comparison of the performance of catch-based, length-based, and abundance-based methods to estimate fishery status is needed.
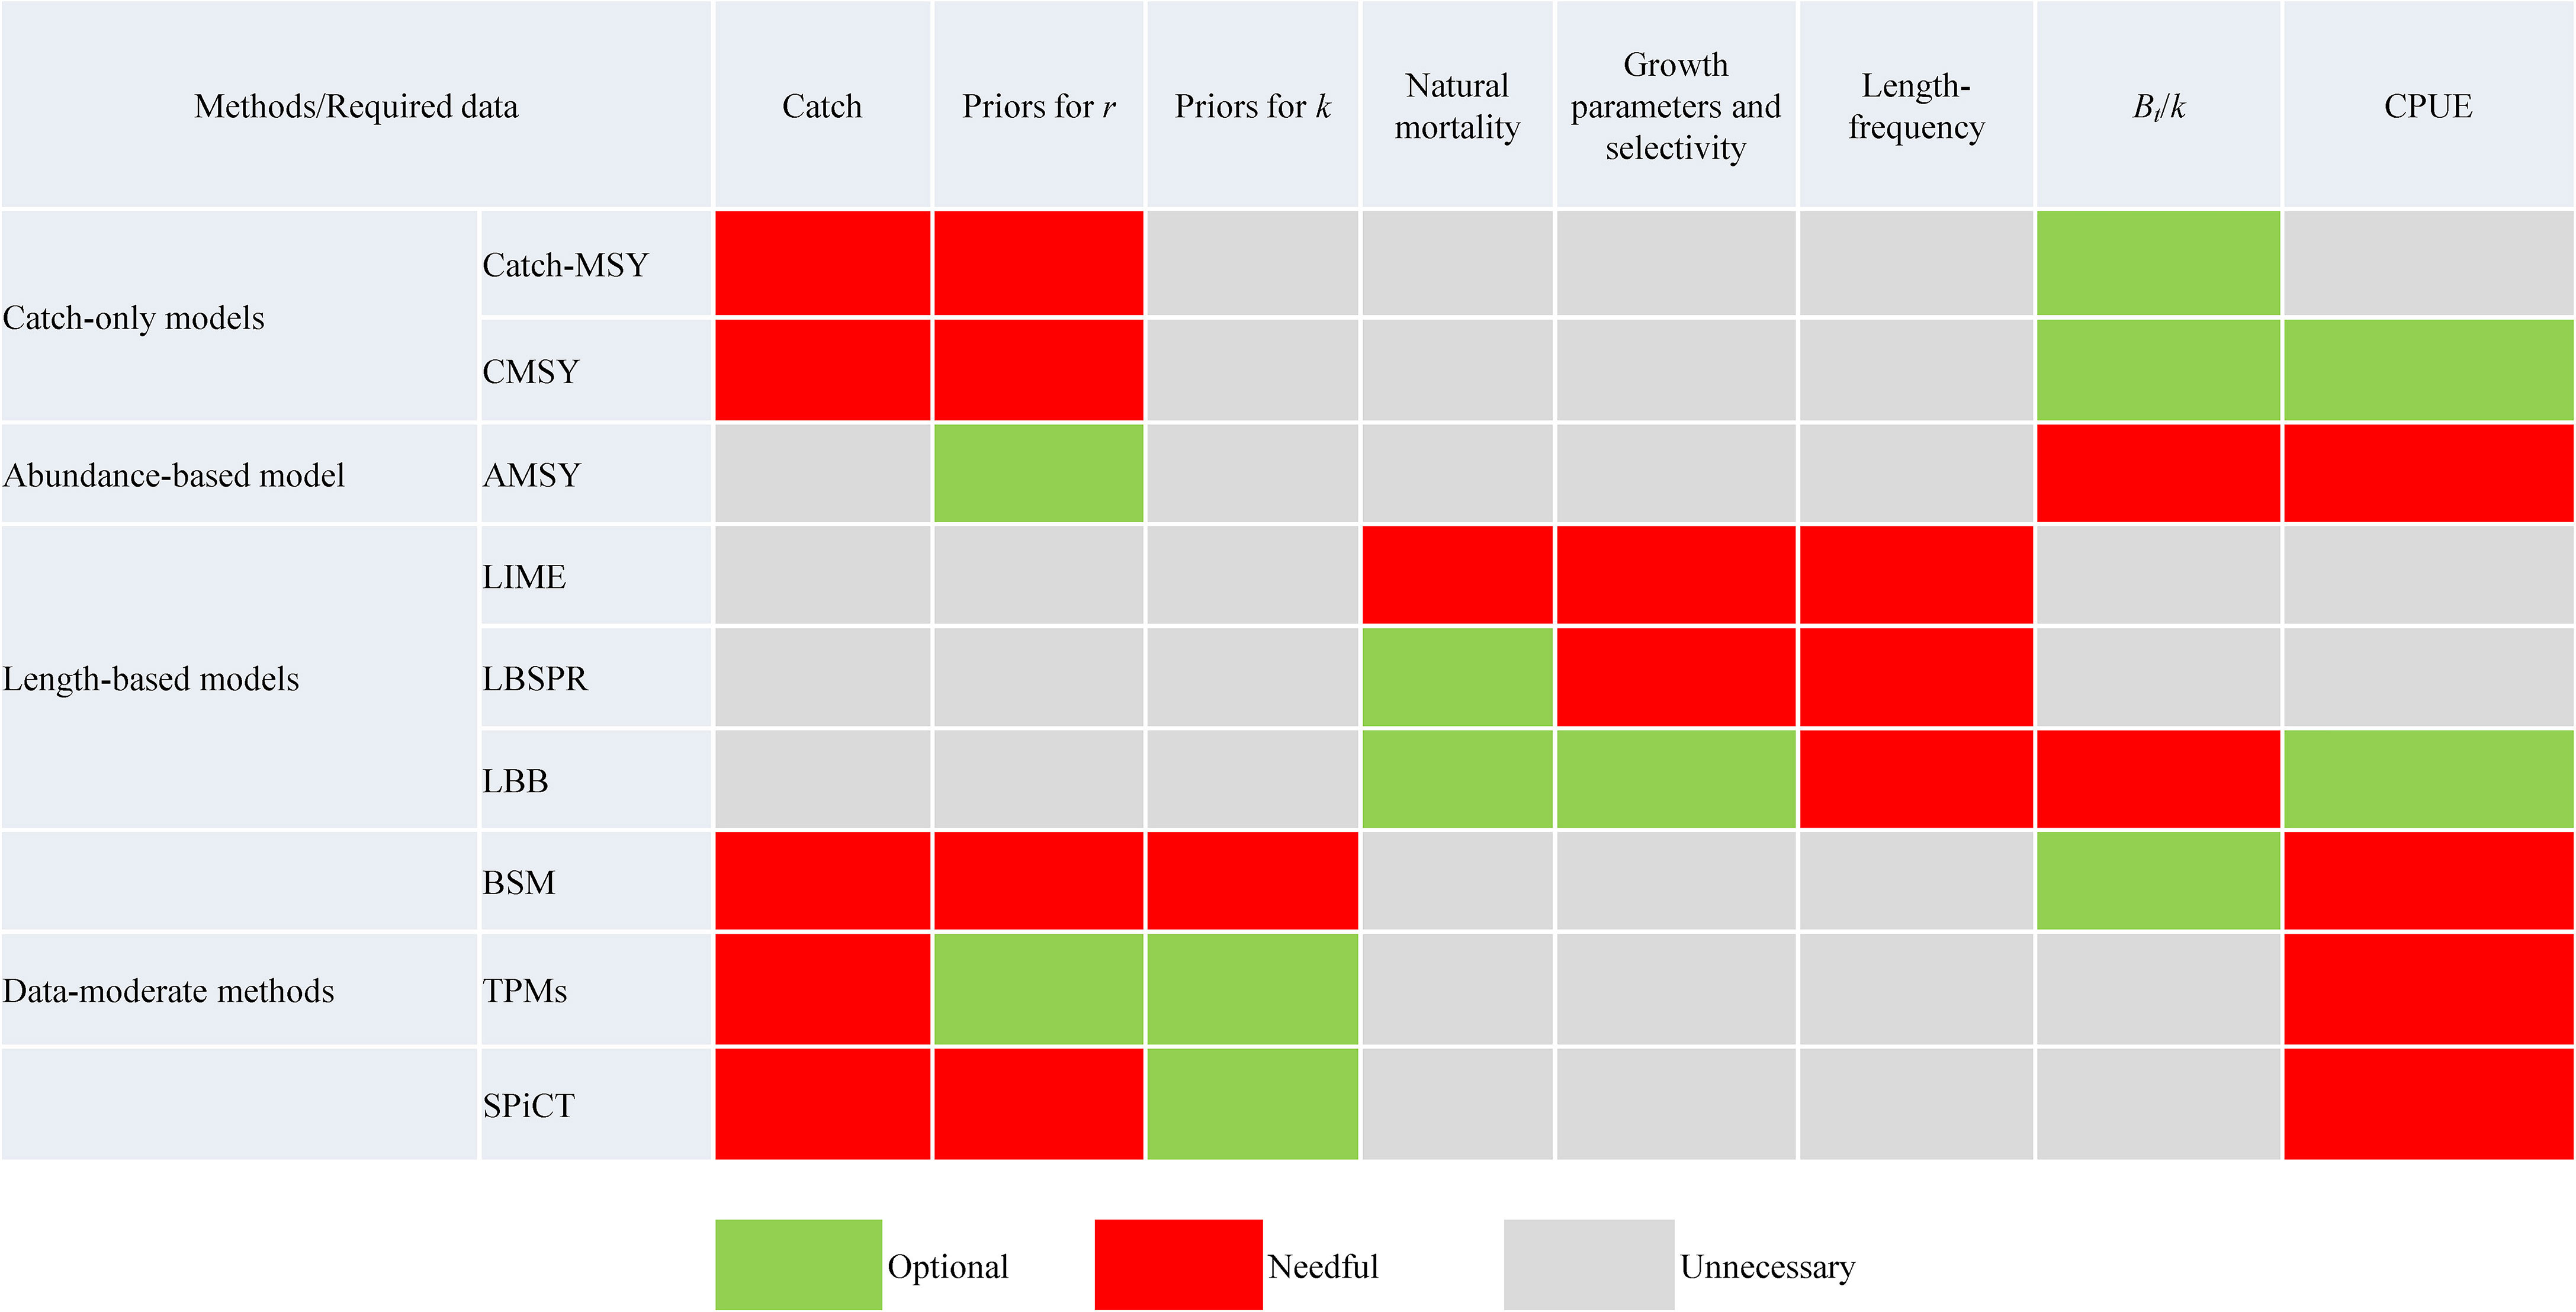
Figure 1 Summary of data requirements for data-poor methods and data-moderate methods mentioned in this study.
In the present study, we used a catch-based method (CMSY, Froese et al., 2017), a length-based Bayesian biomass estimation method (LBB; Froese et al., 2018a), and an abundance-based method (AMSY, Froese et al., 2020) to estimate the BRPs of a data-rich oceanic tuna fishery and compare the performance of the three models. The southern Atlantic albacore (Thunnus alalunga) is a relatively slow-growing long-lived fish (>13 years old) that matures around 4.5 years old and has a higher reproduction rate than other tuna species (ICCAT, 2013). Describing the population dynamics of wide-ranging, highly mobile, high-economic-value, and high-trophic-level predator fishery is a challenging task, but it is the basis for optimizing fishery management (Lucena-Frédou et al., 2021). The International Commission for the Conservation of Atlantic Tunas (ICCAT) had assessed the southern Atlantic albacore fishery using different assessment models, including a non-equilibrium surplus-production model (SPM), BSM, Just Another Bayesian Biomass Assessment (JABBA), and an age-structure model with catch, catch per unit effort (CPUE) time series, and age-structure data (Yeh et al., 1990; Punt et al., 1995; ICCAT, 2008; ICCAT, 2012; Winker et al., 2020). To evaluate the performance of the three models, we applied a data-moderate method BSM as a measuring standard, which used both catch and index of abundance data. The present study provided the first assessment of a tuna fishery using the three different types of data-poor models and compared these results with those of BSM.
Materials and Methods
Data-Moderate Model Bayesian State-Space Schaefer Model
The BSM used in this study was an extension of the surplus production model (Schaefer, 1991). BSM estimates of the parameters and BRPs, i.e., B/BMSY and F/FMSY (Table 1), were used as benchmarks for the respective CMSY, AMSY, and LBB estimates. In this study, we ran the BSM using the same code with CMSY (Froese et al., 2017; Froese et al., 2021), which also presents a Bayesian state-space implementation of the BSM, fitted to catch and CPUE data. The JAGS software was used for sampling the probability distributions of the parameters with the Markov chain Monte Carlo (MCMC) method. To facilitate the mixing of the Gibbs samples, annual biomass was expressed relative to the unexploited biomass with Pt = Bt/k (Millar and Meyer, 2000). In this study, two sampling chains were simulated in BSM, and each chain included 100,000 steps and a burn-in phase of 20,000 steps. For model output, every 10th value was used to reduce autocorrelation. All posterior parameter estimates were assumed to be approximately log-normally distributed (Froese et al., 2017).
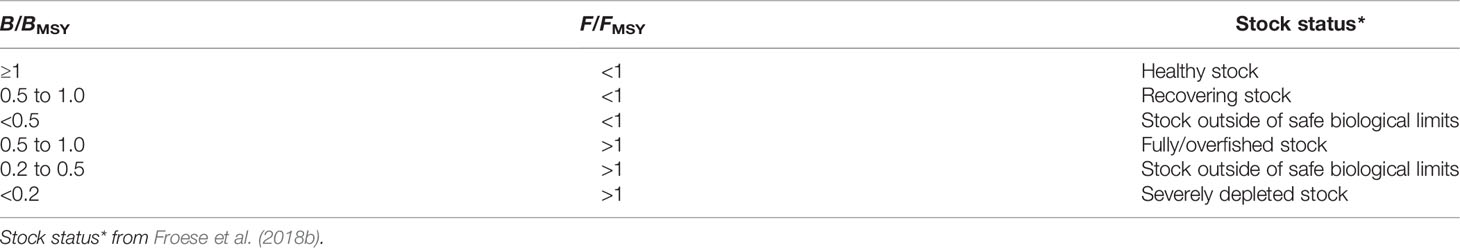
Table 1 Defining fish population status based on the B/BMSY and F/FMSY of the last year in the time series.
Data-Poor Stock Assessment Models
Monte Carlo Catch Maximum Sustainable Yield Model
Three commonly used data-poor methods (i.e., CMSY, AMSY, and LBB) were used to evaluate and verify the fishery reference points of southern Atlantic albacore stock. The previous Catch-MSY method was used to produce estimates of MSY where only catch, resilience, and relative biomass were known (Martell and Froese, 2013). By addressing the shortcomings (i.e., the biased estimation of unexploited stock size and productivity) of the Catch-MSY method, a modified Monte Carlo Catch-MSY-type model CMSY was developed to estimate biomass, exploitation rate, MSY, and related fishery reference points from catch data and resilience of the species (Froese et al., 2017). Those catch-based models have been commonly used in fisheries that lack historical data to determine overfishing limits (Newman et al., 2014; Froese et al., 2017; Lucena-Frédou et al., 2021). Probable ranges for the intrinsic rate of increase (r) and for carrying capacity (k) are filtered with a Monte Carlo approach to detect “viable” r–k pairs in CMSY calculation. The basic biomass dynamics are as follows (Froese et al., 2017):
where Bt+1 is the exploited biomass in year t + 1 and Ct is the catch in year t.
In this study, we used the newest version of CMSY (namely, CMSY++), and the R code (Froese et al., 2021) can be downloaded from http://oceanrep.geomar.de/52147/.
Abundance-Based Maximum Sustainable Yield Model
The AMSY is a new data-limited method that estimates fishery reference points (F/FMSY, B/BMSY, etc.) when no catch data are available, using a time series of catch rates from commercial fisheries or scientific surveys combined with prior estimates of resilience (Froese et al., 2020). In addition to these data, AMSY needs a prior for relative stock size (B/k, ranging between 0 and 1) for one of the years in the time series. AMSY uses this information and tests a high number of combinations of r and k for their compatibility with these inputs. In surveys that deploy a standard gear in a random or stratified pattern across a sea area, CPUE is usually assumed to be directly proportional to the abundance of the target species. By combining CPUE = Btq (q is the catchability coefficient) and equation (1), CPUE can be shown as follows (Froese et al., 2020):
It is not necessary to calculate the absolute values of Ct, Bt, k, and q to estimate relative exploitation and stock status. The parameters Ctq and kq can be converted to Ctq and kq, respectively. Then Equation (3) can be expressed as follows (Froese et al., 2020):
In this study, the code of AMSY by Froese et al. (2020) was used, which can be downloaded from https://oceanrep.geomar.de/47135/.
Length-Based Bayesian Biomass Estimation Method
When the basic biological parameters are known, the length-based methods (e.g., length-based spawning potential ratio and length-based integrated mixed-effects) allow estimations of instantaneous fishing mortality and spawning potential ratio (Hordyk et al., 2015; Pons et al., 2020; Wang et al., 2020). LBB is a newly developed length-based Bayesian biomass estimation method requiring length-frequency data that are representative of the fishery under study (Froese et al., 2018a; Lucena-Frédou et al., 2021). It uses an MCMC to estimate growth and mortality parameters and relative stock size. In the LBB method, growth in body length is assumed to follow the von Bertalanffy growth function (von Bertalanffy, 1938):
where Lt is the expected or mean length at age t, Linf is the asymptotic length, K is the growth coefficient, and t0 is the theoretical age at length zero.
The length Lopt representing the maximum biomass of the unexploited cohort is obtained from the following:
To minimize the required parameters, the LBB analysis is conducted based on the natural mortality rate (M) relative to the somatic growth rate (M/K) and the fishing mortality rate (F) relative to the somatic growth rate (F/K), instead of the absolute values, to estimate mean relative fishing mortality (F/M) and current biomass relative to unfished biomass (B/B0) (Froese et al., 2018a). Thus, even in the case of poor data, fishery managers can directly use LBB to assess stock status (Pons et al., 2020). In addition, the LBB results can be used as priors for the stock assessment method, and the biomass relative to the unfished biomass needs to be independently estimated as input. The LBB code used in this study is available from https://oceanrep.geomar.de/44832/.
Data of the Target Fishery
The catch, abundance index, and length-frequency data of the southern Atlantic albacore fishery used in this study were obtained from the ICCAT statistical databases. Length-frequency data (1975–2005) were based on the catch-at-size composition (the grouping interval is 6 cm of fork length) for the southern Atlantic albacore fishery (ICCAT, 2008). Catch-at-size composition was collected by the ICCAT based on the commercial fisheries, mainly caught by longline and bait boats (ICCAT, 2008). There were 16 fork length groups for each year, and the smallest group is below 40 cm, while the largest is above 130 cm (Supplementary Figure 1).
According to the ICCAT (2013), the index of the Chinese Taipei longline fishery may significantly indicate the abundance of albacore stock. Thus, we used the standardized CPUE based on the Chinese Taipei longline fishery as a relative abundance index of albacore stock. To be consistent with length-frequency data, the catch and CPUE data were also from 1975 to 2005. The catches of this fishery had gradually increased in the first 8 years of the data series (1975–1982) and then decreased to 1.46 × 10⁴ t in 1984. The catches in the late 1980s and 1990s were at high levels (from 2.61 × 10⁴ t to 4.06 × 10⁴ t every year) and showed a downtrend in the early 2000s (Figure 2). CPUE showed a downtrend from 1975 to the late 1980s and has maintained at about 0.10 kg/hook since the 1990s.
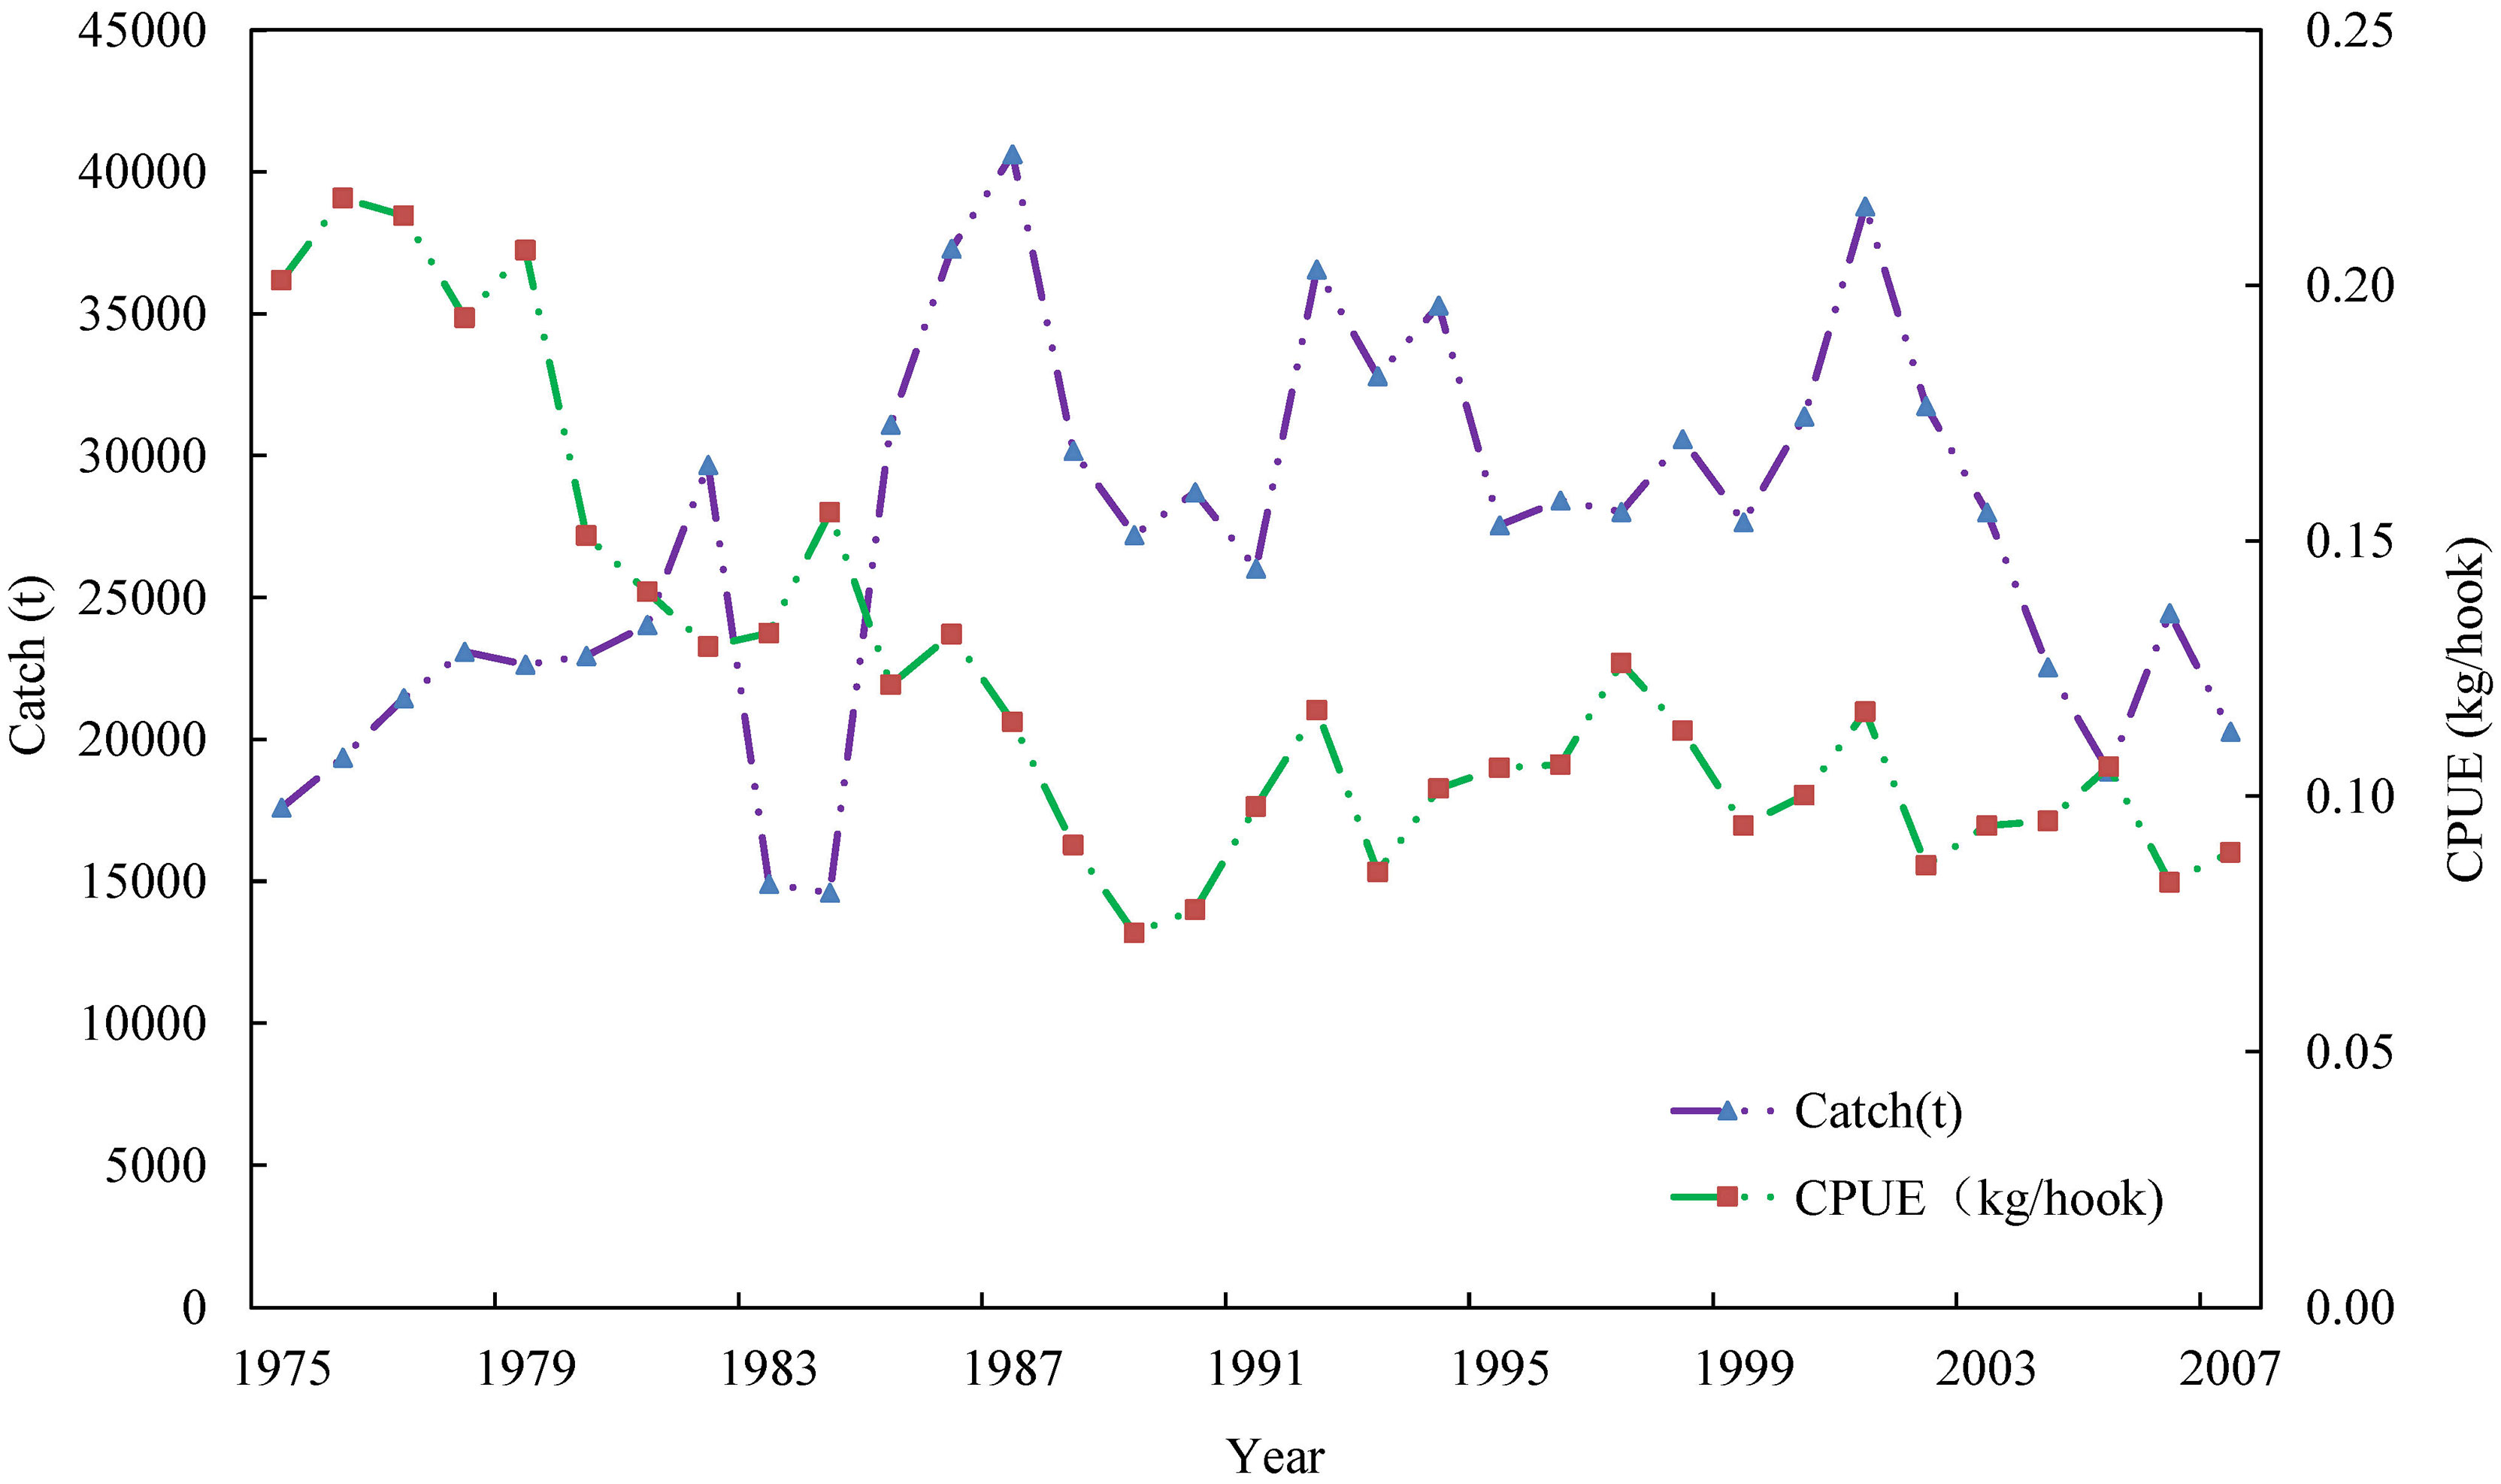
Figure 2 Statistical data of the catch and standardized catch per unit effort (CPUE) of the southern Atlantic albacore (Thunnus alalunga) fishery from 1975 to 2005.
Prior Information
In the CMSY method, priors of resilience (r) and initial depletion level (B1/K) should be specified. Martell and Froese (2013) suggested that the ranges for the random samples of r could be acquired from the resilience assignment in FishBase (Froese and Pauly, 2018). According to age at maturity, maximum age, fecundity, and the growth coefficient of the southern Atlantic albacore stock (ICCAT, 2008; ICCAT, 2012), the prior r was set as a low level of a uniform distribution [0.05, 0.5]. As the catch of the first year of the data series (1975) was at a moderate level and the biomass level of previous studies (ICCAT, 2008; ICCAT, 2012), we set 0.4–0.8 as the range of initial depletion level following Froese et al. (2017). In the LBB method, priors of asymptotic length (Linf) and (Lm50) were set as 147.5 and 90 cm, respectively, based on previous studies (Lee and Yeh, 2007; ICCAT, 2008). We also added a sensitivity analysis to test different priors of Linf (147.5, 152.5, 157.5, and 162.5 cm) on the LBB assessment results. In the AMSY method, priors of resilience (r) and depletion level (Bt/K) of a year should be specified. We used the same setting as the CMSY method as the prior r was set as a low level of a uniform distribution [0.05, 0.5] and 0.4–0.8 as the range of depletion level in the year 1975.
Results
Bayesian State-Space Schaefer Model
The estimated MSY based on BSM analysis is 2.79 × 10⁴ t (95% CI = 2.14– 3.68 × 10⁴ t), and the estimated r is 0.136 (95% CI = 0.0472–0.387) (Table 2). The estimated FMSY and BMSY were 0.0682 (95% CI = 0.0236–0.193) and 40.9 × 10⁴ t (95% CI = 14.6–117.3 × 10⁴ t), respectively (Table 2). The relative biomass (B2005/BMSY) and exploitation level (F2005/FMSY) in 2005 were 0.837 and 0.915, respectively, indicating that the southern Atlantic albacore fishery was in a recovering status (Table 1).
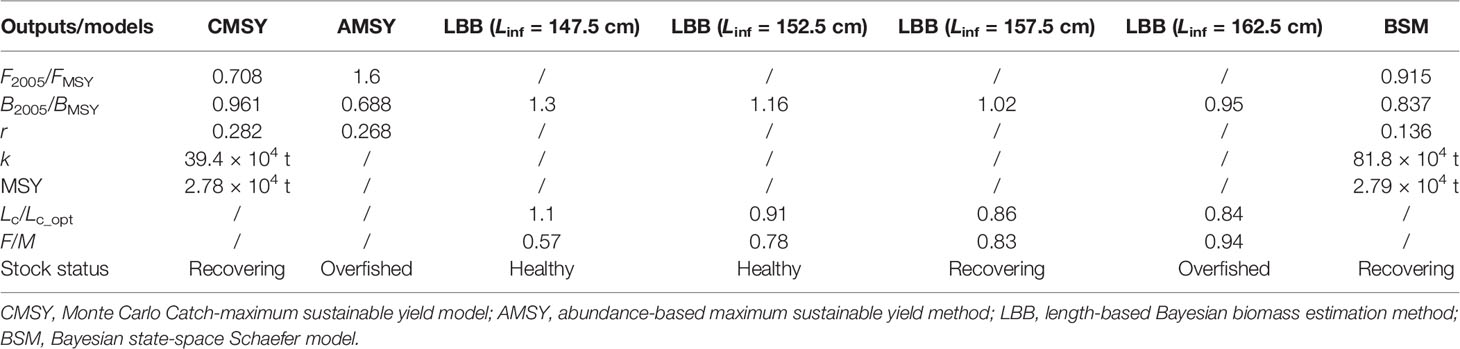
Table 2 Main outputs of the four models used in this study for the southern Atlantic albacore (Thunnus alalunga) fishery.
The estimated time series of B/BMSY and F/FMSY (Supplementary Figure 2) showed that this fishery had been facing overfishing since the mid-1980s (F/FMSY > 1). The estimated relative biomass showed that this fishery was in good condition (B/BMSY > 1) for early assessed years but began to drop below 1 starting in 1983. The Kobe plot (Figure 3) based on BSM analysis showed a probability of 64.52% (the red part) of assessed years (both overfishing and overfished) and 25.81% (the green part) (good condition).
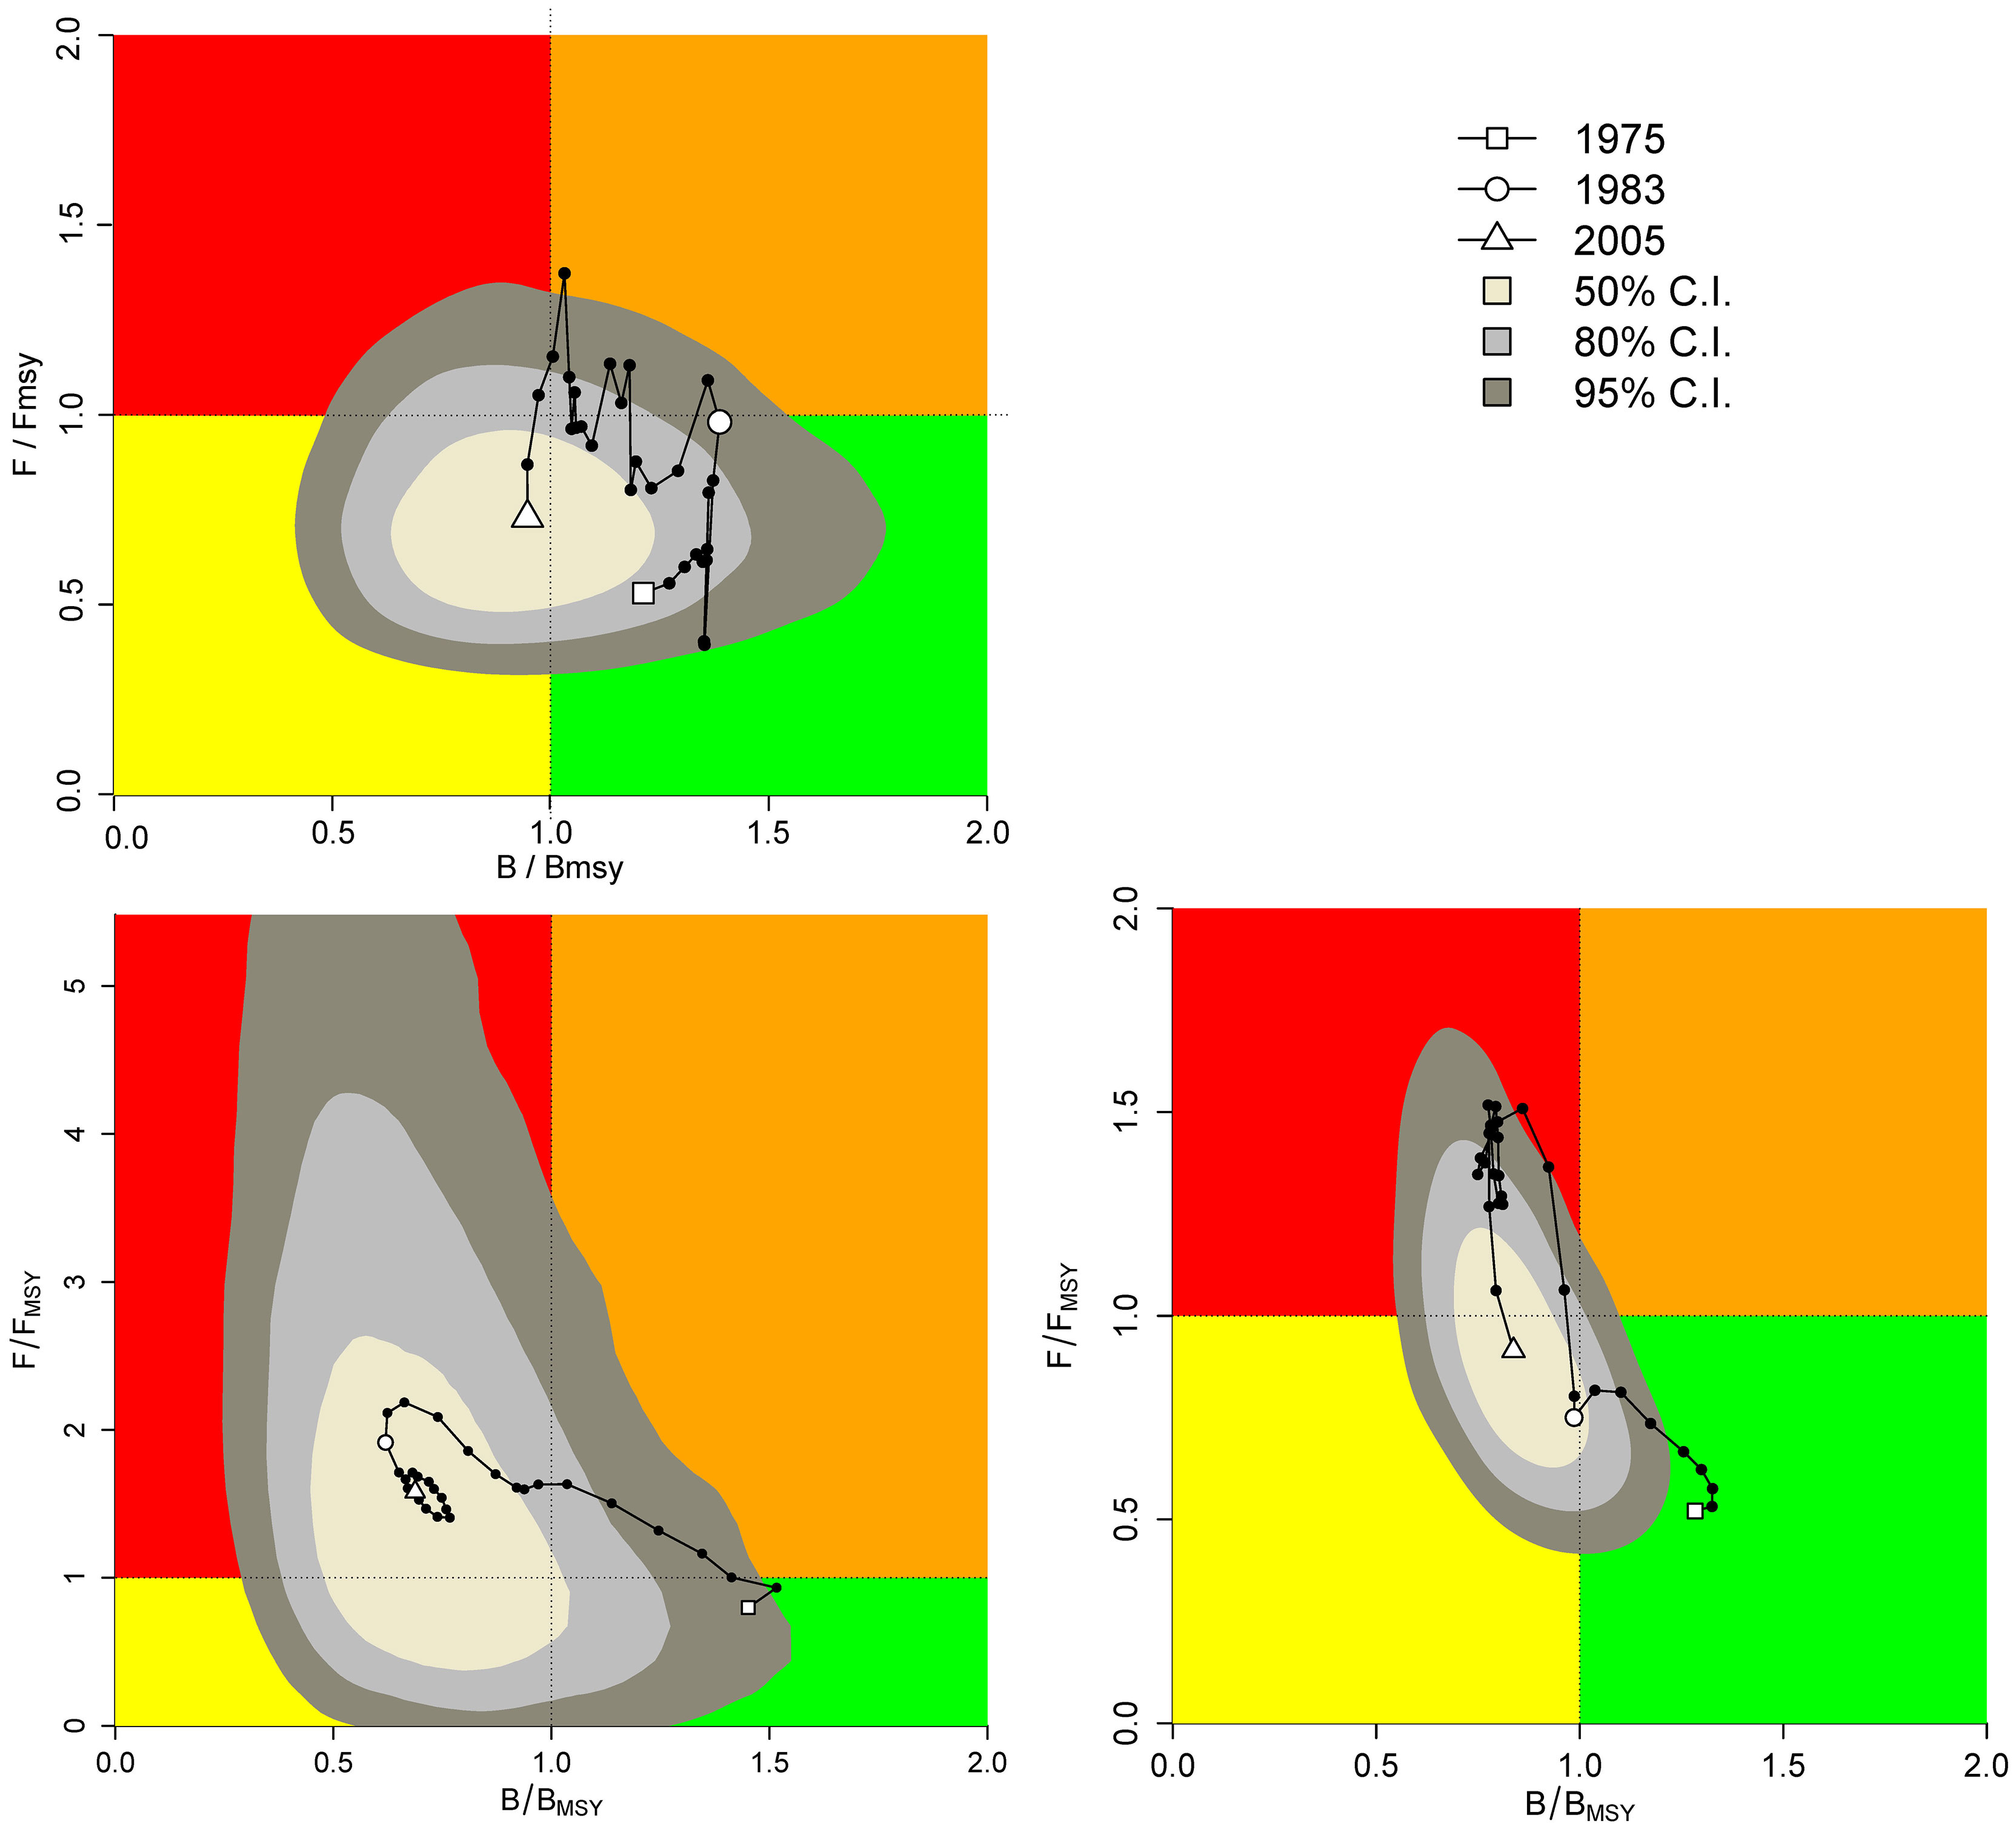
Figure 3 Kobe plots of stock biomass status (x-axis) and exploitation (y-axis) using CMSY (upper on the left), AMSY (lower on the left), and BSM (lower on the right) for the southern Atlantic albacore (Thunnus alalunga) fishery. The plot is divided into four quadrants, defined for the stock biomass and fishing mortality relative to BMSY and FMSY, respectively. The orange area indicates healthy stock sizes that are about to be depleted by overfishing. The red area indicates that the stock is overfished and is undergoing overfishing, with biomass levels being too low to produce maximum sustainable yields. The yellow area indicates reduced fishing pressure on stocks recovering from still too low biomass levels. The green area is the target area for management, indicating sustainable fishing pressure and a healthy stock size capable of producing high yields close to MSY. The “banana” shape around the assessment of the final year triangle indicates uncertainty with yellow for 50%, gray for 80%, and dark gray for 95% confidence levels. CMSY, Monte Carlo Catch-maximum sustainable yield model; AMSY, abundance-based maximum sustainable yield method; BSM, Bayesian state-space Schaefer model.
Monte Carlo Catch Maximum Sustainable Yield Model
The estimated MSY based on CMSY analysis was 2.78 × 10⁴ t with a 95% credible interval (CI) of 2.17–3.57 × 10⁴ t, while the estimated r was 0.282 (95% CI = 0.163–0.487). The estimated FMSY and BMSY were 0.141 (95% CI = 0.0817–0.244) and 19.7 × 10⁴ t (95% CI = 10.0–38.6 × 10⁴ t), respectively (Table 2). The relative biomass (B2005/BMSY) and exploitation level (F2005/FMSY) in 2005 were 0.961 and 0.708, respectively, indicating that the southern Atlantic albacore fishery was in a recovering status (Table 1).
The estimated time series of B/BMSY and F/FMSY (Supplementary Figure 2) showed that this fishery has been overfished since the late 1980s (F/FMSY > 1). The assessed relative biomass (B/BMSY > 1) showed that this fishery was in good condition for most of the assessed periods but has fallen below 1 since 2004.
Abundance-Based Maximum Sustainable Yield Model
The estimated MSYq (maximum sustainable value of relative catch Cq) based on AMSY analysis was 0.0195 (95% CI = 0.0112–;0.0333), and the estimated r was 0.268 (95% CI = 0.150–0.479). The estimated FMSY was 0.134 (95% CI = 0.075–0.24). The relative biomass (B2005/BMSY) and exploitation level (F2005/FMSY) in 2005 were 0.688 and 1.6 (Table 2), respectively, indicating that the southern Atlantic albacore fishery had been overfished (Table 1).
The estimated time series of B/BMSY and F/FMSY (Supplementary Figure 3) showed the catches were above MSY between 1975 and 2005, and the relative biomass has been below 1 since 1981. Moreover, the Kobe plot (Figure 3) based on AMSY showed a probability of 77.42% for assessed years (the red part) (both overfishing and overfished) and only 6.45% (the green part) (good condition).
Length-Based Bayesian Biomass Estimation Method
Under the condition of setting Linf at 147.5 cm, the estimated Lc (the length where 50% of the individuals are retained by the gear) based on LBB analysis was 82.5 cm (95% CI = 81.4–83.9 cm), the estimated Lc/Linf (Linf represents asymptotic fork length) was 0.6 (95% CI = 0.6–0.61), and the estimated Lc/Lc_opt (Lc_opt represents the length at first capture that maximizes catch and biomass) was 1.1 (Figure 4). The estimated F/M and Z/K in 2005 were 0.57 (95% CI = 0.33–0.83) and 2.1 (95% CI = 1.9–2.3), respectively. The estimated B/B0 and B/BMSY in 2005 were 0.62 (95% CI = 0.23–1.1) and 1.3 (95% CI = 0.53–2.3), respectively. The estimated time series F/M showed that the southern Atlantic albacore fishery was intensely exploited in the late 1980s and early 1990s. The estimated time series of B/B0 showed the biomass was in good condition except in the late 1980s and early 1990s (Figure 4).
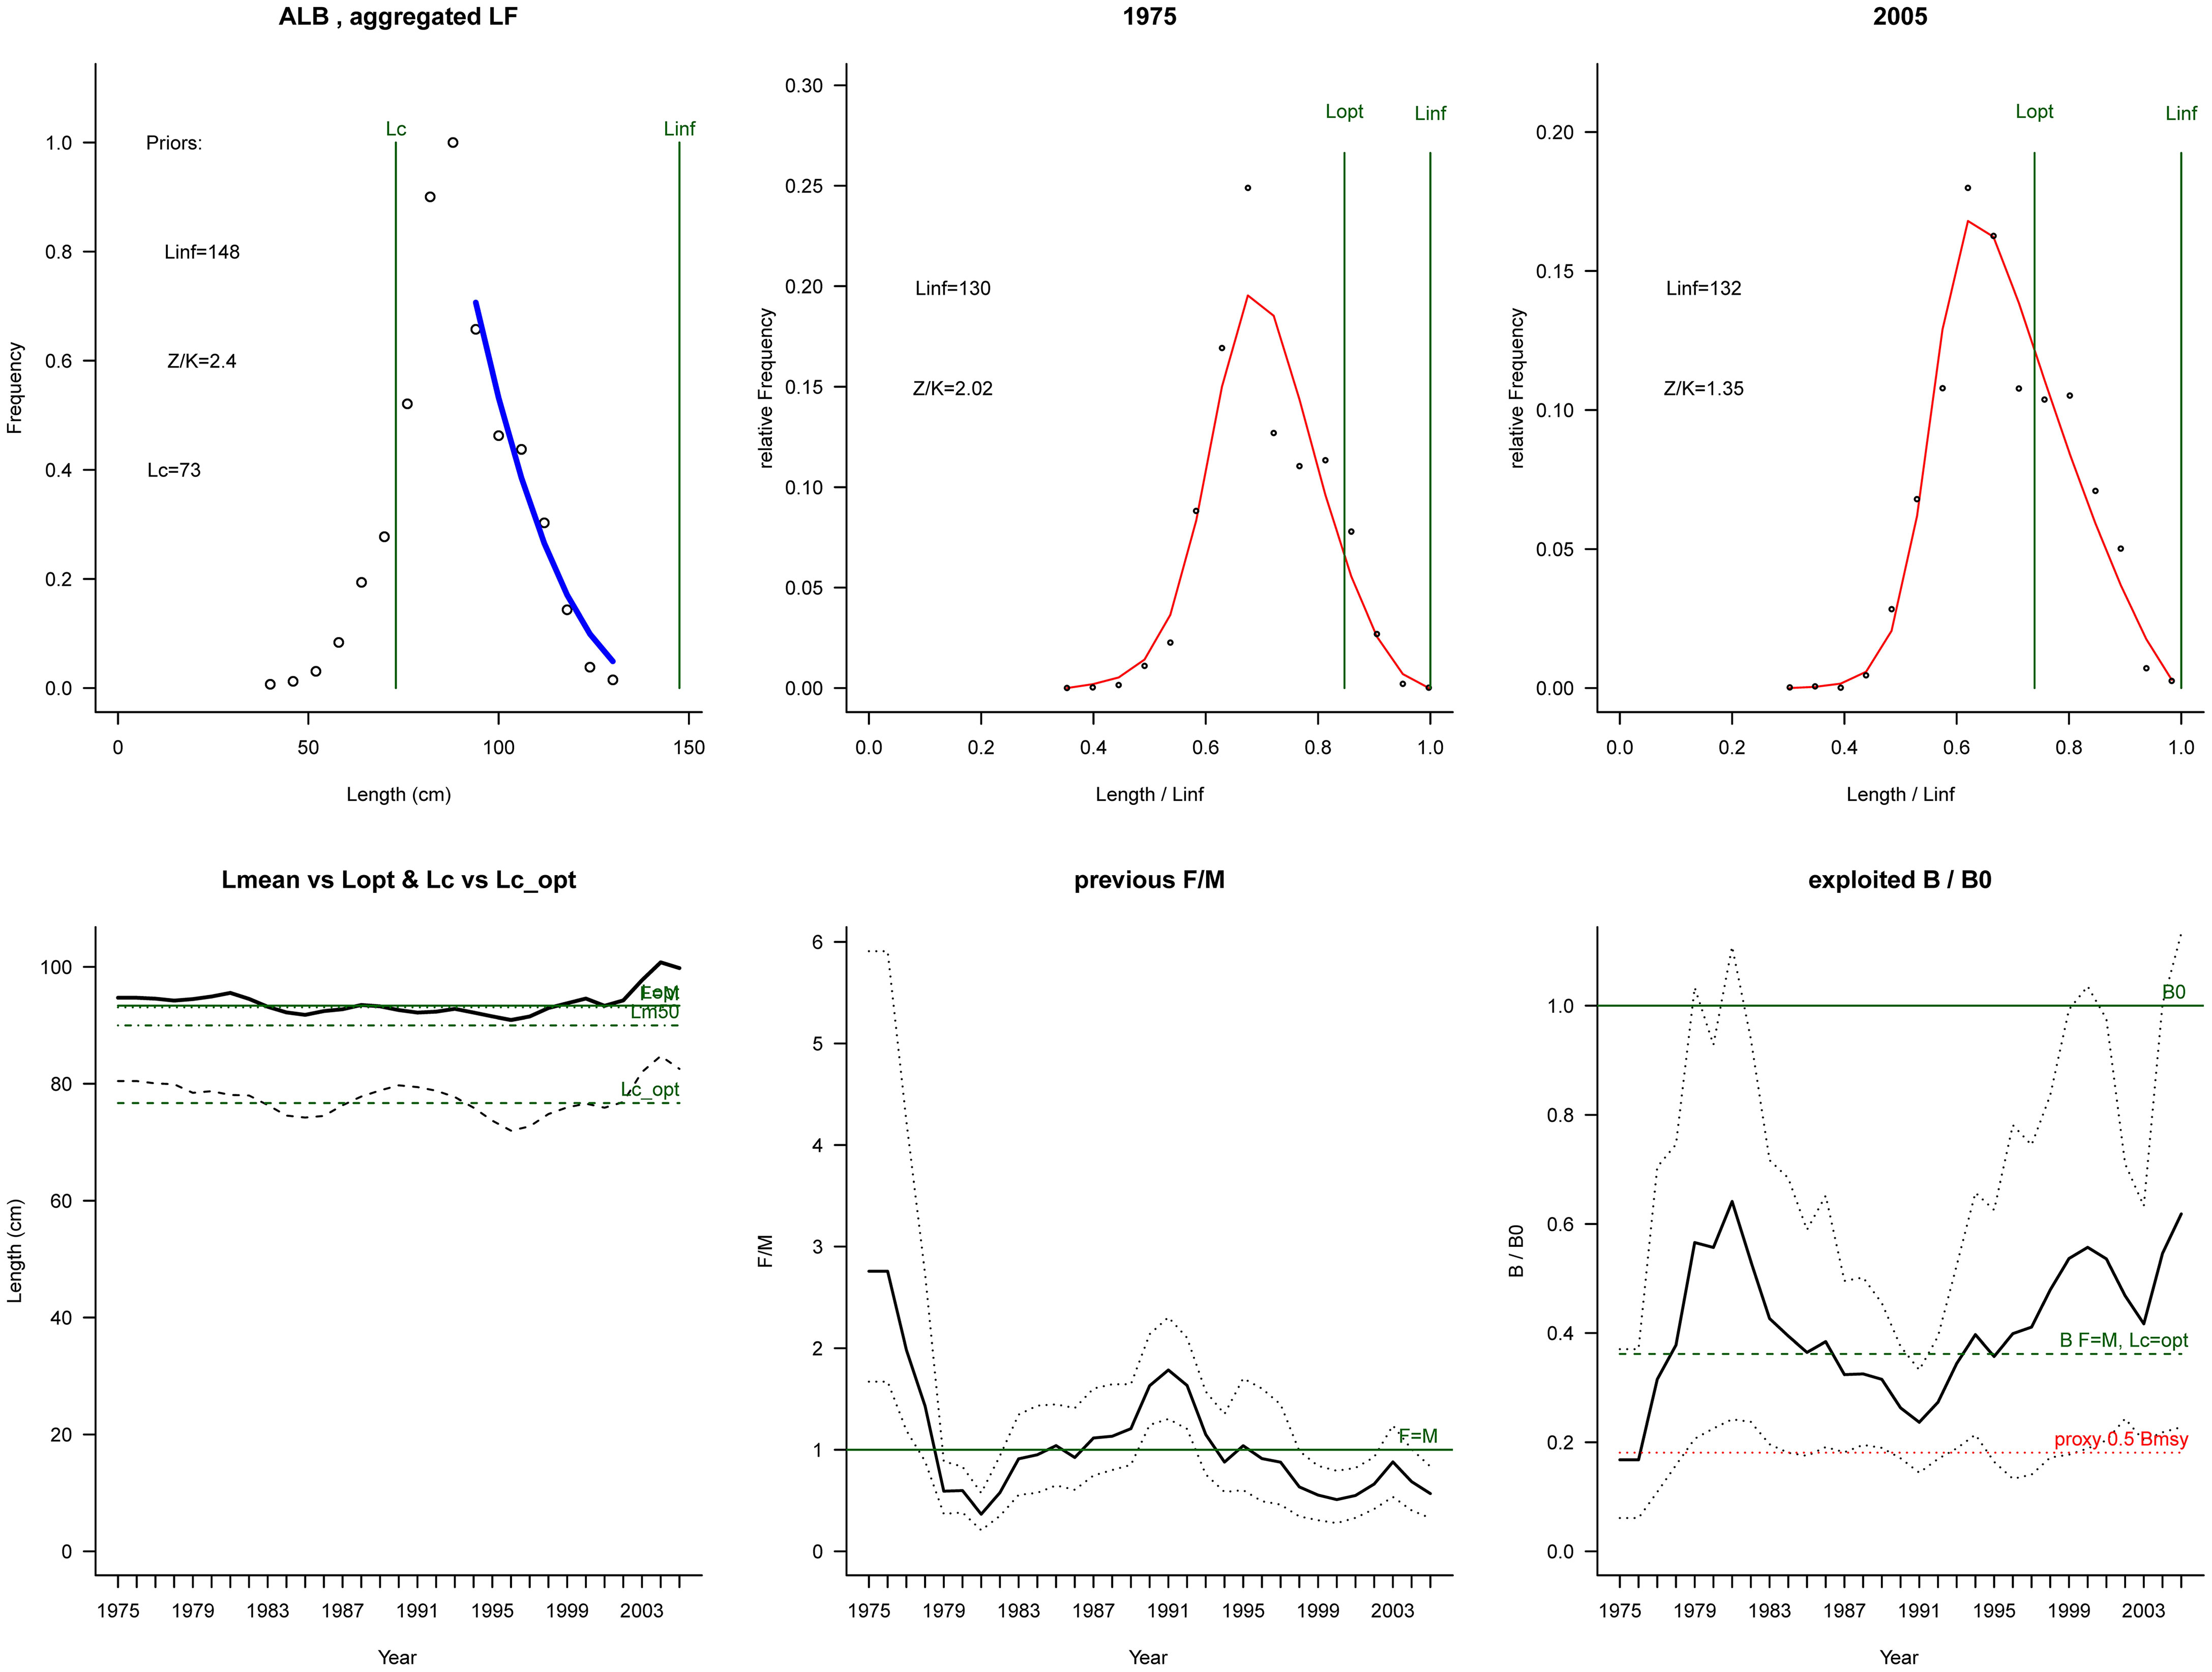
Figure 4 Graphical output of LBB for the southern Atlantic albacore (Thunnus alalunga) fishery (under the condition of setting Linf at 147.5 cm). The top left panel shows the accumulated length-frequency data used to estimate priors for Lc, Linf, and Z/K. The top middle and right panels show the length-frequency data for the first and last years in the time series. The bottom left panel shows Lmean (bold black curve) relative to Lopt and Lc (dashed black curve) relative to Lc_opt. The bottom middle panel shows relative fishing pressure F/M (black curve), with approximately 95% confidence limits (dotted curves). The bottom right panel shows relative biomass B/B0 (black curve) with approximately 95% confidence limits (dotted black curves), with an indication of a proxy for BMSY (green dashed line) and a proxy for 0.5 BMSY (red dotted line).
The results of sensitivity analysis showed that the results of the LBB method are sensitive to Linf settings, as the estimated B2005/BMSY ranged from 0.95 to 1.3. The estimated F/M ranged from 0.57 to 0.94, and the estimated Lc/Lc_opt ranged from 0.84 to 1.1. These results showed that this fishery was in different conditions, i.e., healthy, recovering, and overfished (Table 2).
Discussion
This study is the first attempt to apply catch-based (CMSY), length-based (LBB), and abundance-based (AMSY) data-poor methods on stock assessment for an oceanic tuna fishery and to compare the performance with a data-moderate model (BSM). Results showed that the three data-poor methods with various types of data did not produce an entirely consistent stock status of the southern Atlantic albacore fishery in 2005, as the estimated B2005/BMSY ranged from 0.688 to 1.3 and F2005/FMSY ranged from 0.708 to 1.6. CMSY produced a similar time series of B/BMSY and F/FMSY and stock status (recovering) to the BSM. AMSY gave the most conservative condition (overfished) of this fishery (Table 2). Sensitivity analysis showed the LBB results are sensitive to Linf settings, and the results with higher Linf were similar to other models. However, the LBB results with setting Linf at lower levels produced more optimistic conditions (healthy). Our results highlight that attention should be paid to the settings of model parameter priors and different trends implied in various types of data when using data-poor methods.
When possible, fishery management actions are based on estimates of current stock status and management targets produced from full age-structured stock assessment models (Wiedenmann et al., 2019), but most of the unassessed stocks lack data and commercial importance for a full age-based stock assessment (Bouch et al., 2021). In the world, more than 80% of the fisheries by numbers and about half of the catches have not been formally analyzed and evaluated due to limited data (FAO, 2020; Hilborn et al., 2020). This has led to the fast growth of data-poor evaluation methods (Doyen et al., 2017; Zhang et al., 2018; Hilborn et al., 2020; Pons et al., 2020; Lucena-Frédou et al., 2021). A variety of data-limited assessment methods (catch-based methods, length-based methods, and abundance-based methods) have been developed (that use simple models) to estimate stock status in relation to management reference points (Chrysafi and Kuparinen, 2016; Pons et al., 2020; Wang et al., 2020; Bouch et al., 2021; Lucena-Frédou et al., 2021). Given our findings, the data-poor method fills the gap (Table 3).
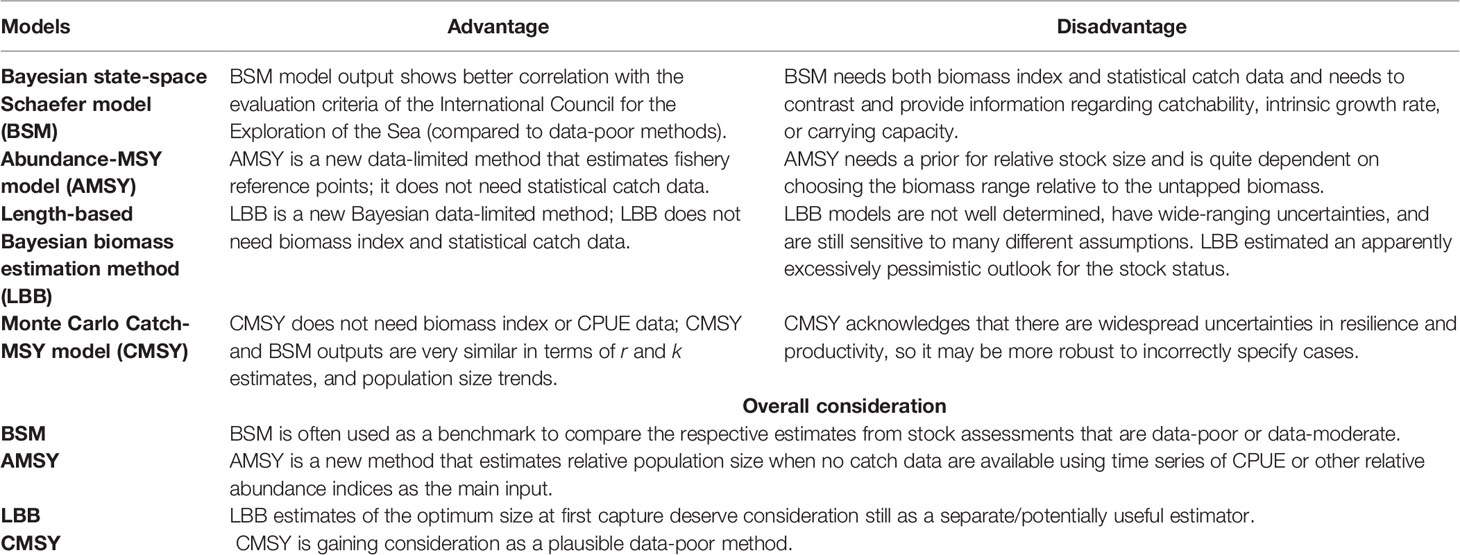
Table 3 Summary of advantages, disadvantages, and overall consideration for data-poor methods and data-moderate methods mentioned in this study.
Catch-Based Method
The Catch-based method, such as CMSY, acknowledges that there are widespread uncertainties in resilience and productivity; thus, it may be more robust to incorrectly specify models (Froese et al., 2017; Free et al., 2020). The models’ outputs of CMSY and BSM were very similar in terms of estimated MSY and time series of F/FMSY and B/BMSY. Since CMSY is a simplified Bayesian implementation of the data-constrained production model, it seems appropriate to compare the CMSY results with the full Bayesian implementation of a surplus production estimation model (Wiedenmann et al., 2019; Hilborn et al., 2020; Froese et al., 2021). In the CMSY method, the most likely value of the parameters is chosen, not from the center of the distribution of probable r–k pairs (Supplementary Figure 4D) but rather at higher values of r, where the range of k values is more narrow (Froese et al., 2017). Catch-only methods range from statistical models trained on data-rich stocks to mechanistic population models that make assumptions about changes in fishing effort and may produce imprecise and biased estimates of B/BMSY, especially for stocks that are lightly exploited (Free et al., 2020). The curve of the fishery reference points and the points of BRPs indicate that there is a good agreement between the CMSY and BSM estimates “true” parameter values. However, CMSY performs poorly for fish stocks, which are being well managed with declining fishing pressure in the final years of the data series (Pons et al., 2020). A future for CMSY may lie within joint models, which use different catch-based methods to produce a more accurate assessment by removing the biases of individual methods (Bouch et al., 2021).
Abundance-Based Method
The abundance-based method, for example AMSY, is a method that estimates relative population size when no catch data are available. It uses the time series of CPUE or other relative abundance indices as the main input (Froese et al., 2020). Therefore, they can be used to assess fish stocks that are only recorded in fishermen’s logbooks, even if the available number of vessels is low, provided that the gear or method of fishing has not changed during the time series (Tsikliras et al., 2021). By the filtering process of the AMSY, the possibility that extreme values of r cause biased stock productivity is lowered, which excluded r–kq pairs producing unreasonable results when combined with CPUE data (Froese et al., 2020). However, the uncertainty of r is an adverse factor, which may be better solved if detailed uncertainty estimation is available and used for data weighting. At present, very few species have been formally assessed with the AMSY model, and the present study is the first application to an oceanic tuna fishery based on longline fishery data. Although CMSY and BSM estimated a recovering condition (0.5 < B/BMSY < 1 and F/FMSY < 1) in 2005 with the fishing pressure lower than that giving the MSY, the AMSY estimated an overfished condition in 2005 with the F/FMSY being equal to 1.6. Our results showed similar AMSY model performance to a previous study by Falsone et al. (2021), which indicated that AMSY depicted a more severe overfished condition than BSM and CMSY (Figure 5). However, further studies need to be done to distinguish whether it is a general feature of the AMSY model or a special case to our data series.
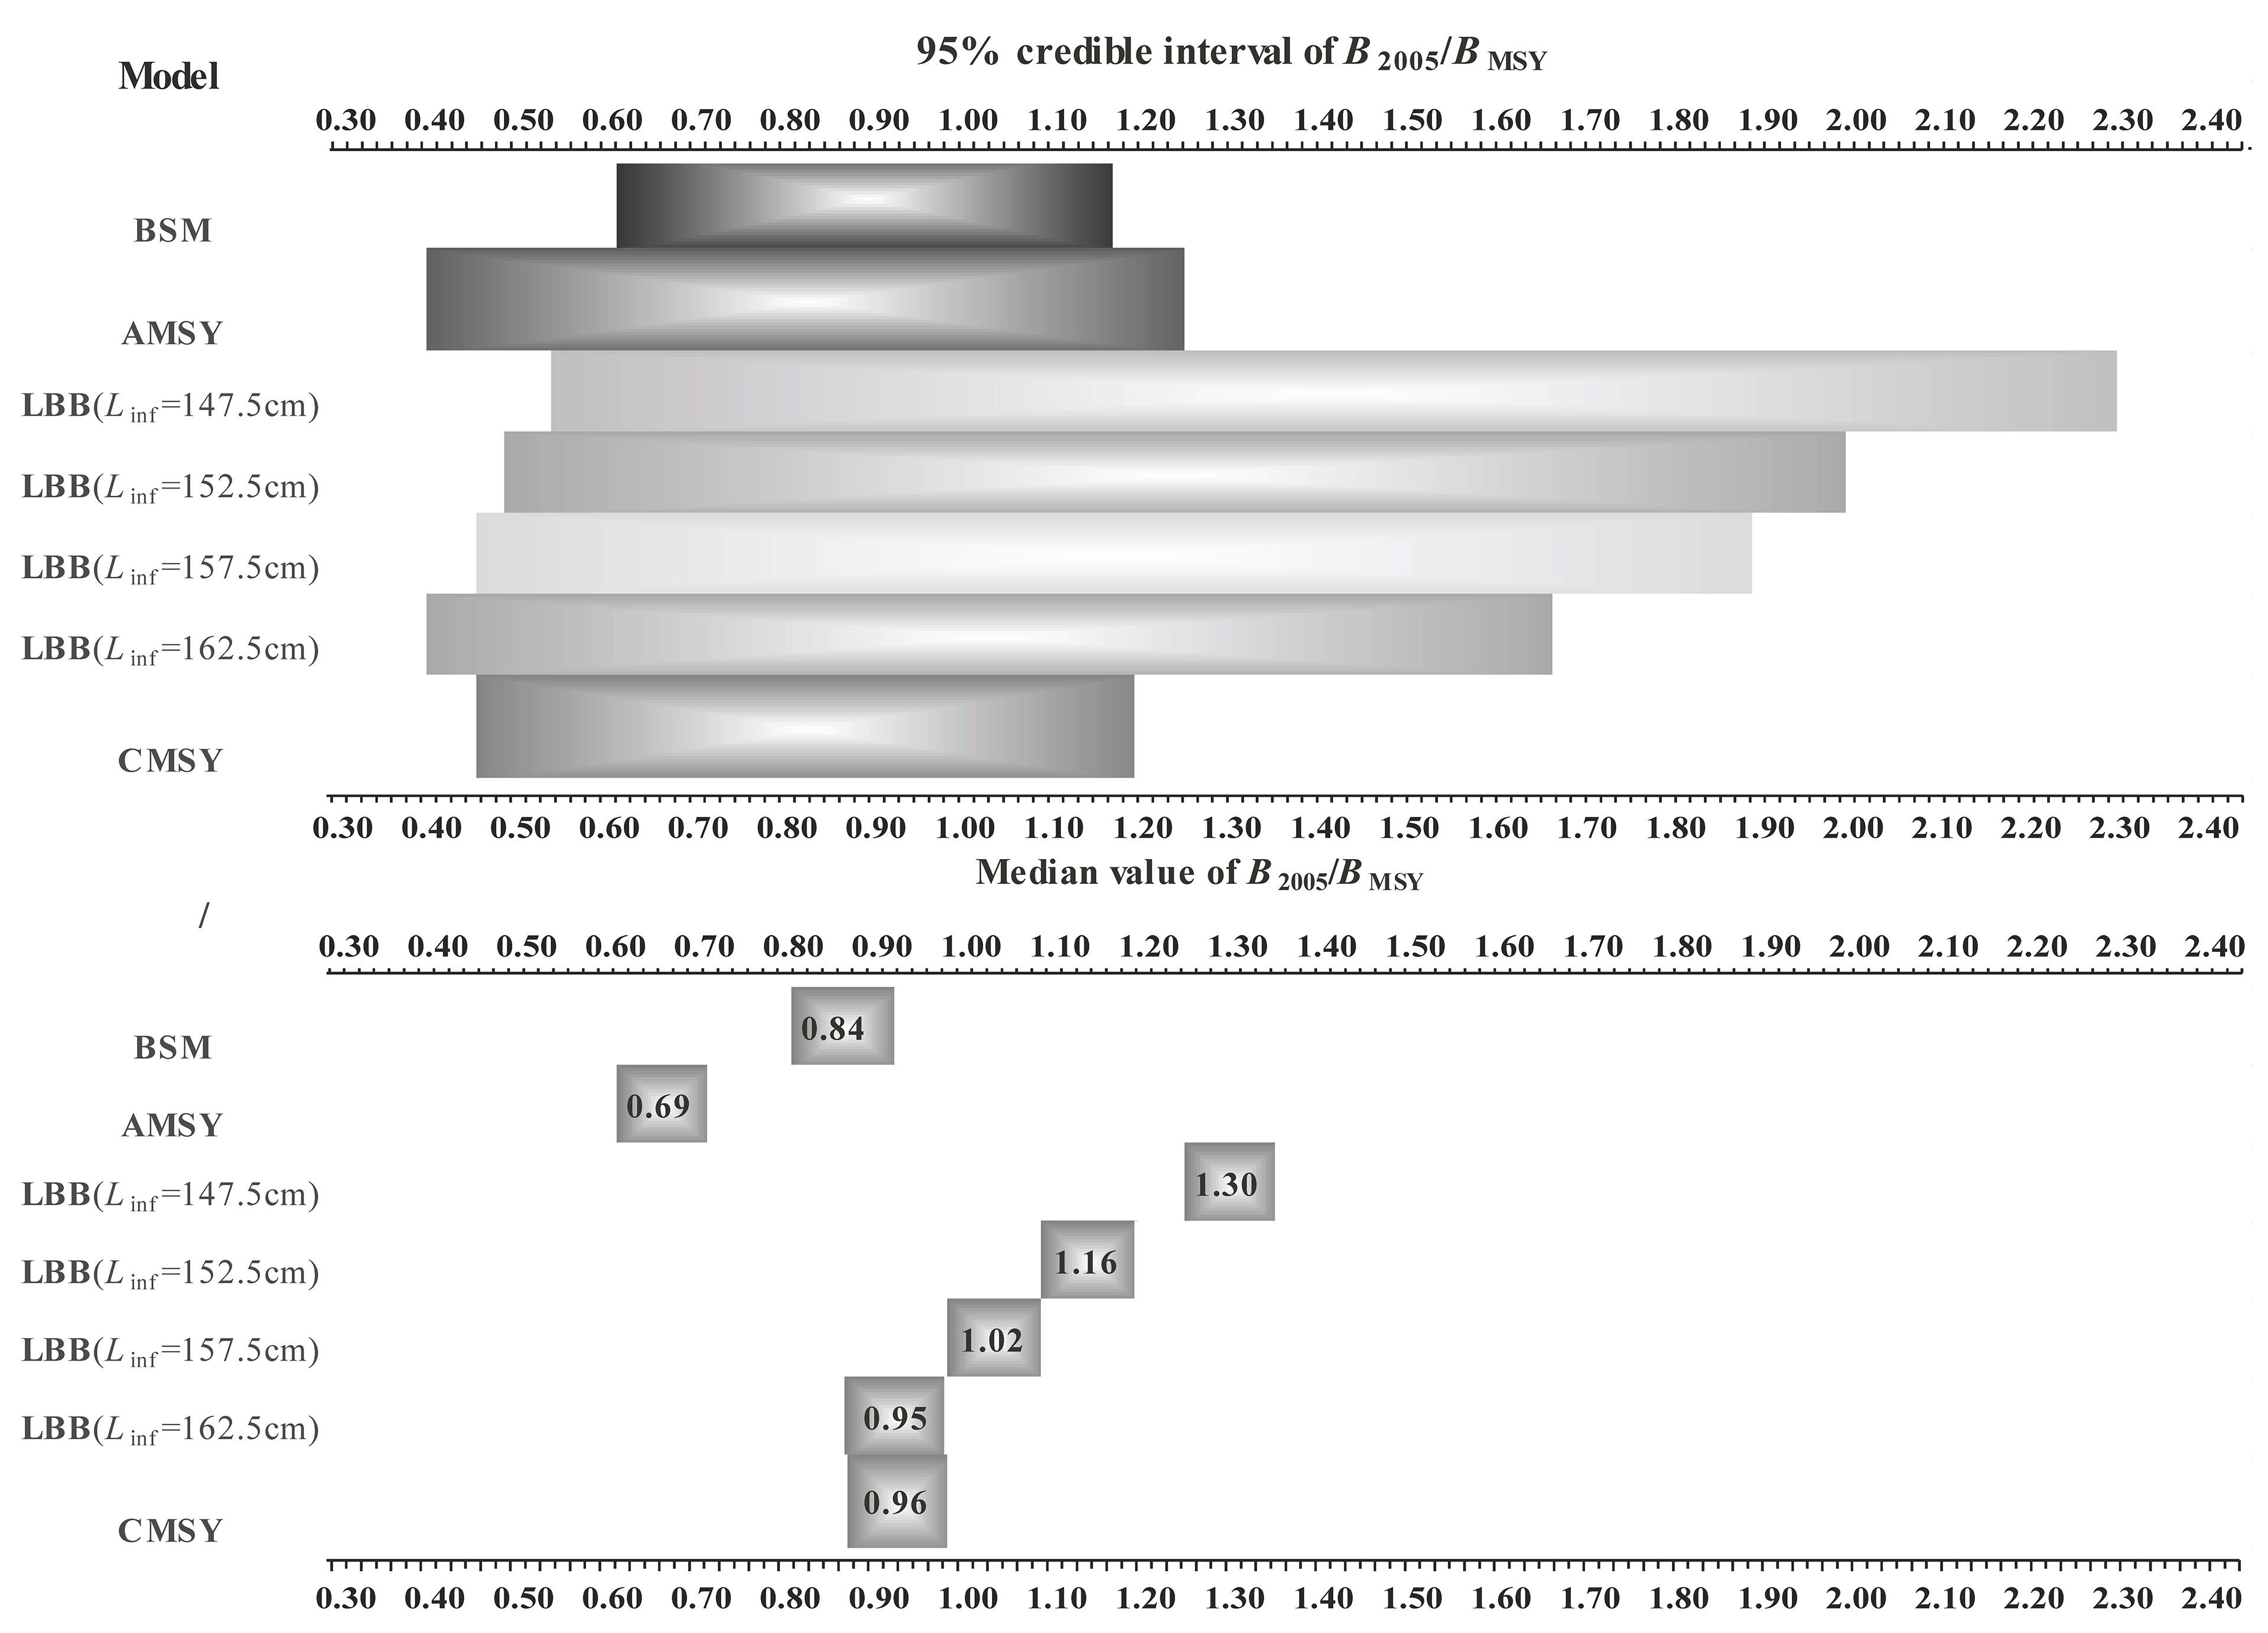
Figure 5 Comparison of the estimated median values, 95% credible intervals of B2005/BMSY by the four models used in this study.
Length-Based Method
In data-poor fisheries, length-frequency data are often the prime data type collected because they are relatively cost-effective and easy to collect (Chong et al., 2020). As a result, numerous length-based methods have been developed. LBB is an innovative method that can use length-frequency data to estimate population status in developed fisheries (Froese et al., 2018a). LBB works for species that grow throughout their lives and requires no input in addition to length-frequency data. It is appropriate for fish species that can grow continuously through their lifetimes (Pons et al., 2020). The LBB results showed this fishery was in different conditions using different Linf priors (Figure 5) probably because this length-based method was affected by varying recruitment during the study period; its estimate of the optimum size at first capture deserves consideration still as a separate/potentially useful estimator. As well as CMSY, LBB is gaining consideration as a plausible data-poor method in some international commissions such as the ICCAT (Anon, 2019; Chong et al., 2020; Pons et al., 2020; Lucena-Frédou et al., 2021). Previous studies (Zhang et al., 2021a; Zhang et al., 2021b) showed the estimated parameters (Linf, Lc/Lc_opt, Z/K, B/B0, and B/BMSY) were not sensitive to sample sizes using LBB method, and the prior information from electronic length-frequency analysis (ELEFAN) method was effective for LBB method. LBB can estimate further BRPs (e.g., B/BMSY, and Lc/Lc_opt) than ELEFAN. Therefore, it is suggested that both ELEFAN and LBB methods be used to fit the length-frequency data of data-poor fish stocks because they are complementary in estimating management reference points (Zhang et al., 2021a).
The three data-poor models used in this study have been verified effective for data-poor fisheries, as the developers have done many simulations and case studies (Froese et al., 2017; Froese et al., 2018a; Froese et al., 2020). Compared with the recent assessment results using JABBA (Winker et al., 2020) and BSM in this study, CMSY and LBB (under the condition of setting Linf at 162.5 cm) perform better than other models for estimating BRPs of this tuna fishery. Our results remind users to pay attention to the data quality and the settings of model parameter priors when using these data-poor models. Marine fishery catch data might be underestimated worldwide (Pauly and Zeller, 2016). For example, illegal, unreported, and unregulated (IUU) fishing is recognized as one of the threats to obtaining accurate catch data for oceanic tuna fisheries (Polacheck, 2012). Furthermore, different trends implied in various types of data (e.g., length distribution and CPUE) may produce different stock statuses.
Data Availability Statement
The original contributions presented in the study are included in the article/Supplementary Material. Further inquiries can be directed to the corresponding author.
Author Contributions
BL and KZ wrote the first draft. KZ, YX, and MS performed the data analyses and prepared the graphs. QL modified the manuscript. All authors contributed to the article and approved the submitted version.
Funding
This work was supported by the Key Research and Development Project of Guangdong Province (2020B1111030001), the Key Special Project for the Introduced Talents Team of Southern Marine Science and Engineering Guangdong Laboratory (GML2019ZD0605), and the Central Public-Interest Scientific Institution Basal Research Fund, South China Sea Fisheries Research Institute, CAFS (2021SD01).
Conflict of Interest
The authors declare that the research was conducted in the absence of any commercial or financial relationships that could be construed as a potential conflict of interest.
Publisher’s Note
All claims expressed in this article are solely those of the authors and do not necessarily represent those of their affiliated organizations, or those of the publisher, the editors and the reviewers. Any product that may be evaluated in this article, or claim that may be made by its manufacturer, is not guaranteed or endorsed by the publisher.
Acknowledgments
We extend our gratitude to the developers of the data-poor methods used in this study. We appreciate the valuable comments made by reviewers, which significantly improved our manuscript. We thank Dr. Yancong Cai (South China Sea Fisheries Research Institute) for technological help with revising the manuscript. We also thank Dr. Huaikai Chen and Dr. Xiuchun Gu (School of Translation Studies, Shandong University) for language editing assistance.
Supplementary Material
The Supplementary Material for this article can be found online at: https://www.frontiersin.org/articles/10.3389/fmars.2022.825461/full#supplementary-material
References
Anon (2019). Report of the 2019 ICCAT Working Group on Stock Assessment Methods Meeting (WGSAM). Collect. Vol. Sci. Pap. ICCAT. 70 (3), 830–995.
Bouch P., Minto C., Reid D. G. (2021). Comparative Performance of Data-Poor CMSY and Data-Moderate Spict Stock Assessment Methods When Applied to Data-Rich, Real-World Stocks. ICES. J. Mar. Sci. 78, 264–276. doi: 10.1093/icesjms/fsaa220
Chong L., Mildenberger T. K., Rudd M. B., Taylor M. H., Cope J. M., Branch T. A., et al. (2020). Performance Evaluation of Data-Limited, Length-Based Stock Assessment Methods. ICES. J. Mar. Sci. 77, 97–108. doi: 10.1093/icesjms/fsz212
Chrysafi A., Kuparinen A. (2016). Assessing Abundance of Populations With Limited Data: Lessons Learned From Data-Poor Fisheries Stock Assessment. Environ. Rev. 24, 25–38. doi: 10.1139/er-2015-0044
Costello C., Ovando D., Hilborn R., Gaines S. D., Deschenes O., Lester S. E. (2012). Status and Solutions for the World’s Unassessed Fisheries. Science 338, 517–520. doi: 10.1126/science.1223389
Doyen L., Béné C., Bertignac M., Blanchard F., Cissé A. A., Dichmont C., et al. (2017). Ecoviability for Ecosystem-Based Fisheries Management. Fish. Fish. 18, 1056–1072. doi: 10.1111/faf.12224
Falsone F., Scannella D., Geraci M. L., Gancitano V., Fiorentino F. (2021). How Fishery Collapses: The Case of Lepidopus Caudatus (Pisces: Trichiuridae) in the Strait of Sicily (Central Mediterranean). Front. Mar. Sci. 7, 584601. doi: 10.3389/fmars.2020.584601
FAO (2020). The State of World Fisheries and Aquaculture 2020. Sustainability in Action (Rome: FAO), 175.
Free C. M., Jensen O. P., Anderson S. C., Gutierrez N. L., Kleisner K. M., Longo C., et al. (2020). Blood From a Stone: Performance of Catch-Only Methods in Estimating Stock Biomass Status. Fish. Res. 223, 105452. doi: 10.1016/j.fishres.2019.105452
Froese R., Demirel N., Coro G., Kleisner K. M., Winker H. (2017). Estimating Fisheries Reference Points From Catch and Resilience. Fish. Fish. 18, 506–526. doi: 10.1111/faf.12190
Froese R., Demirel N., Coro G., Winker H. (2021). User Guide for CMSY++ (Germany: GEOMAR), 17 pp. Available at: http://oceanrep.geomar.de/52147/.
Froese R., Pauly D. (2018) Fishbase. Available at: www.fishbase.org (Accessed 10 October 2021).
Froese R., Winker H., Coro G., Demirel N., Tsikliras A. C., Dimarchopoulou D., et al. (2018a). A New Approach for Estimating Stock Status From Length Frequency Data. ICES. J. Mar. Sci. 75, 2004–2015. doi: 10.1093/icesjms/fsy078
Froese R., Winker H., Coro G., Demirel N., Tsikliras A. C., Dimarchopoulou D., et al. (2018b). Status and Rebuilding of European Fisheries. Mar. Policy 93, 159–170. doi: 10.1016/j.marpol.2018.04.018
Froese R., Winker H., Coro G., Demirel N., Tsikliras A. C., Dimarchopoulou D., et al. (2020). Estimating Stock Status From Relative Abundance and Resilience. ICES. J. Mar. Sci. 77, 527–538. doi: 10.1093/icesjms/fsz230
Hilborn R., Amoroso R. O., Anderson C. M., Baum J. K., Branch T. A., Costello C., et al. (2020). Effective Fisheries Management Instrumental in Improving Fish Stock Status. Proc. Natl. Acad. Sci. U. S. A. 117, 2218–2224. doi: 10.1073/pnas.1909726116
Hordyk A., Ono K., Valencia S., Loneragan N., Prince J. (2015). A Novel Length-Based Empirical Estimation Method of Spawning Potential Ratio (SPR), and Tests of its Performance, for Small-Scale, Data-Poor Fisheries. ICES. J. Mar. Sci. 72, 217–231. doi: 10.1093/icesjms/fsu004
ICCAT (2008). Report of the 2007 ICCAT Albacore Stock Assessment Session. ICCAT. Collect. Vol. Sci. Pap. 62 (3), 697–815.
ICCAT (2012). Report of the 2011 ICCAT South Atlantic and Mediterranean Albacore Stock Assessment Sessions (Madrid, Spain: The International Commission for the Conservation of Atlantic Tunas), pp .491.
ICCAT (2013). Report of the 2013 ICCAT North and South Atlantic Albacore Data Preparatory Meeting (Madrid, Spain: The International Commission for the Conservation of Atlantic Tunas), pp. 68.
Lee L. K., Yeh S. Y. (2007). Age and Growth of South Atlantic Albacore-a Revision After the Revelation of Otolith Daily Ring Counts. ICCAT. Collect. Vol. Sci. Pap. 60 (2), 443–456.
Liao B., Karim E., Zhang K. (2021). Comparative Performance of Catch-Based and Surplus Production Models on Evaluating Largehead Hairtail (Trichiurus Lepturus) Fishery in the East China Sea. Reg. Stud. Mar. Sci. 48, 102026. doi: 10.1016/j.rsma.2021.102026
Lucena-Frédou F., Mourato B., Frédou T., Lino P., Muñoz-Lechuga R., Palma C., et al. (2021). Review of the Life History, Fisheries, and Stock Assessment for Small Tunas in the Atlantic Ocean. Rev. Fish. Biol. Fish. 31, 709–736. doi: 10.1007/s11160-021-09666-8
Martell S., Froese R. (2013). A Simple Method for Estimating MSY From Catch and Resilience. Fish. Fish. 14, 504–514. doi: 10.1111/j.1467-2979.2012.00485.x
Mcdonald G., Campbell S. J., Karr K., Clemence M., Granados-Dieseldorff P., Jakub R., et al. (2018). An Adaptive Assessment and Management Toolkit for Data-Limited Fisheries. Ocean. Coast. Manag. 152, 100–119. doi: 10.1016/j.ocecoaman.2017.11.015
Millar R. B., Meyer R. (2000). Non-Linear State Space Modelling of Fisheries Biomass Dynamics by Using Metropolis–Hastings Within-Gibbs Sampling. J. R. Stat. Soc Ser. A. 49, 327–342. doi: 10.1111/1467-9876.00195
Newman D., Carruthers T., MacCall A., Porch C., Suatoni L. (2014). Improving the Science and Management of Data-Limited Fisheries: An Evaluation of Current Methods and Recommended Approaches (New York: Natural Resources Defense Council, NRDC Report R).
Pauly D., Zeller D. (2016). Catch Reconstructions Reveal That Global Marine Fisheries Catches are Higher Than Reported and Declining. Nat. Commun. 7, 10244. doi: 10.1038/ncomms10244
Polacheck T. (2012). Assessment of IUU Fishing for Southern Bluefin Tuna. Mar. Policy 36 (5), 1150–1165. doi: 10.1016/j.marpol.2012.02.019
Pons M., Cope J. M., Kell L. T. (2020). Comparing Performance of Catch-Based and Length-Based Stock Assessment Methods in Data-Limited Fisheries. Can. J. Fish. Aquat. Sci. 77, 1026–1037. doi: 10.1139/cjfas-2019-0276
Punt A. E., Butterworth D. S., Penney A. J. (1995). Stock Assessment and Risk Analysis for the South Atlantic Population of Albacore Thunnus Alalunga Using an Age-Structured Production Model. S. Afr. J. Mar. Sci. 16, 287–310. doi: 10.2989/025776195784156476
Schaefer M. B. (1991). Some Aspects of the Dynamics of Populations Important to the Management of the Commercial Marine Fisheries. Bull. Math. Biol. 53, 253–279. doi: 10.1016/S0092-8240(05)80049-7
Tsikliras A. C., Touloumis K., Pardalou A., Adamidou A., Keramidas I., Orfanidis G. A., et al. (2021). Status and Exploitation of 74 Un-Assessed Demersal Fish and Invertebrate Stocks in the Aegean Sea (Greece) Using Abundance and Resilience. Front. Mar. Sci. 7, 578601. doi: 10.3389/fmars.2020.578601
von Bertalanffy L. (1938). A Quantitative Theory of Organic Growth (Inquiries on Growth Laws. II.). Hum. Biol. 10, 181–213.
Wang Y., Liu S., Liang C., Zhang H., Xian W. (2020). Stock Assessment Using LBB Method for Eight Fish Species From the Bohai and Yellow Seas. Front. Mar. Sci. 7, 164. doi: 10.3389/fmars.2020.00164
Wiedenmann J., Free C. M., Jensen O. P. (2019). Evaluating the Performance of Data-Limited Methods for Setting Catch Targets Through Application to Data-Rich Stocks: A Case Study Using Northeast U.S. Fish Stocks. Fish. Res. 209, 129–142. doi: 10.1016/j.fishres.2018.09.018
Winker H., Mourato B., Parker D., Sant’Ana R., Kimoto A., Ortiz M. (2020). Preliminary Stock Assessment of South Atlantic Albacore Tuna (Thunnus Alalunga) Using the Bayesian State-Space Surplus Production Model JABBA. ICCAT. Collect. Vol. Sci. Pap. 77, 352–376.
Yeh S. Y., Liu H. C., Tsou T. S. (1990). Assessment of the South Atlantic Albacore Resource by Using Surplus Production Models 1967–1988. ICCAT. Collect. Vol. Sci. Pap. 31, 236–240.
Zhang K., Li J., Hou G., Huang Z., Shi D., Chen Z., et al. (2021a). Length-Based Assessment of Fish Stocks in a Data-Poor, Jointly Exploited (China and Vietnam) Fishing Ground, Northern South China Sea. Front. Mar. Sci. 8, 718052. doi: 10.3389/fmars.2021.718052
Zhang K., Zhang J., Shi D., Chen Z. (2021b). Assessment of Coral Reef Fish Stocks From the Nansha Islands, South China Sea, Using Length-Based Bayesian Biomass Estimation. Front. Mar. Sci. 7, 610707. doi: 10.3389/fmars.2020.610707
Keywords: data-poor approach, Bayesian state-space model, performance, Thunnus alalunga, stock status
Citation: Liao B, Xu Y, Sun M, Zhang K and Liu Q (2022) Performance Comparison of Three Data-Poor Methods With Various Types of Data on Assessing Southern Atlantic Albacore Fishery. Front. Mar. Sci. 9:825461. doi: 10.3389/fmars.2022.825461
Received: 30 November 2021; Accepted: 31 March 2022;
Published: 09 May 2022.
Edited by:
Tomaso Fortibuoni, Istituto Superiore per la Protezione e la Ricerca Ambientale (ISPRA), ItalyReviewed by:
Elizabeth A. Babcock, University of Miami, United StatesDaniel Ricard, Fisheries and Oceans Canada, Canada
Athanassios C. Tsikliras, Aristotle University of Thessaloniki, Greece
Copyright © 2022 Liao, Xu, Sun, Zhang and Liu. This is an open-access article distributed under the terms of the Creative Commons Attribution License (CC BY). The use, distribution or reproduction in other forums is permitted, provided the original author(s) and the copyright owner(s) are credited and that the original publication in this journal is cited, in accordance with accepted academic practice. No use, distribution or reproduction is permitted which does not comply with these terms.
*Correspondence: Kui Zhang, zhangkui@scsfri.ac.cn