Ocean Acidification Alters the Predator – Prey Relationship Between Hydrozoa and Fish Larvae
 Carsten Spisla1*
  Jan Taucher1
  Michael Sswat1
  Hennrike Wunderow1 Peter Kohnert2
  Catriona Clemmesen1
  Ulf Riebesell1
- 1GEOMAR, Helmholtz Centre for Ocean Research Kiel Biological Oceanography, Kiel, Germany
- 2Staatliche Naturwissenschaftliche Sammlung Bayerns (SNSB), Bavarian State Collection of Zoology, Munich, Germany
Anthropogenic CO2 emissions cause a drop in seawater pH and shift the inorganic carbon speciation. Collectively, the term ocean acidification (OA) summarizes these changes. Few studies have examined OA effects on predatory plankton, e.g. Hydrozoa and fish larvae as well as their interaction in complex natural communities. Because Hydrozoa can seriously compete with and prey on other higher-level predators such as fish, changes in their abundances may have significant consequences for marine food webs and ecosystem services. To investigate the interaction between Hydrozoa and fish larvae influenced by OA, we enclosed a natural plankton community in Raunefjord, Norway, for 53 days in eight ≈ 58 m³ pelagic mesocosms. CO2 levels in four mesocosms were increased to ≈ 2000 µatm pCO2, whereas the other four served as untreated controls. We studied OA-induced changes at the top of the food web by following ≈2000 larvae of Atlantic herring (Clupea harengus) hatched inside each mesocosm during the first week of the experiment, and a Hydrozoa population that had already established inside the mesocosms. Under OA, we detected 20% higher abundance of hydromedusae staged jellyfish, but 25% lower biomass. At the same time, survival rates of Atlantic herring larvae were higher under OA (control pCO2: 0.1%, high pCO2: 1.7%) in the final phase of the study. These results indicate that a decrease in predation pressure shortly after hatch likely shaped higher herring larvae survival, when hydromedusae abundance was lower in the OA treatment compared to control conditions. We conclude that indirect food-web mediated OA effects drove the observed changes in the Hydrozoa – fish relationship, based on significant changes in the phyto-, micro-, and mesoplankton community under high pCO2. Ultimately, the observed immediate consequences of these changes for fish larvae survival and the balance of the Hydrozoa – fish larvae predator – prey relationship has important implications for the functioning of oceanic food webs.
Introduction
Atmospheric CO2 concentration is expected to have increased in 2020 to about 412 ppm (average over the year) with an annual CO2 uptake of the world’s oceans of around 2.6 Gt C y-1 (Friedlingstein et al., 2020). This process has caused ocean acidification (OA) that has already decreased open ocean surface water pH by 0.017-0.027 pH units per decade since the 1980s, with a predicted further decline of around 0.136-0.216 by the year 2100 (Emerson and Hedges, 2008; Le Quéré et al., 2009; Bindoff et al., 2019). This drop in pH is expected to directly and/or indirectly affect marine organisms with advantages as well as disadvantages for different species (Orr et al., 2005; Kroeker et al., 2013; Wittmann and Pörtner, 2013).
Most OA research to date has, however, focused on lower trophic levels within the food web, and particularly within bacteria, phyto-, and herbivorous zooplankton, with sparse investigation of higher-level consumers, and especially mesozooplankton. The Cnidaria-subtaxa Hydrozoa and their sister-taxa Anthozoa and Scyphozoa, were studied extensively in the context of increasing fisheries, pollution, or global warming [e.g. Purcell (2005; Purcell, 2012)], but very few studies have considered the possible influence of decreasing seawater pH on these animals. In one of these few studies, Attrill et al. (2007) stated that higher jellyfish abundances in some areas of the North Sea correlated with lower pH levels. Although Richardson and Gibbons (2008) could not confirm this correlation when they analyzed a larger dataset, both papers mention two hypothetical pathways by which OA could influence jellyfish: The first pathway posits a possible direct influence, e.g. on the balance sensory receptors (statoliths) of Hydrozoa, Scyphozoa, and Cubozoa, made of calcareous basanite (Werner, 1993). Although Winans and Purcell (2010) and Knowles (2012) showed that Scyphozoa statoliths can decrease in size in an acidified environment, they demonstrated no obvious consequences for the study species. The second possible OA effect on jellyfish may stem from changes in the condition and/or community composition of competitors or prey organisms, therefore indirectly affecting the jellyfish population. Purcell (1997) showed, that the early life stages of ichthyoplankton are not only important prey organisms, but also competitors for food, especially for Hydrozoa and Scyphozoa. These early life stages of fish, however, are susceptible to OA, particularly in larvae of economically important species such as Atlantic cod [Gadus morhua, Stiasny et al. (2016)], Senegalese sole [Solea senegalensis, Pimentel et al. (2014)], and yellowfin tuna [Thunnus albacares, Frommel et al. (2016)]. If future increasing OA has such severe consequences for recruitment and fishery yield, as shown for example for Atlantic cod by Hänsel et al. (2020), this would result in a significant reduction of fish and fish larvae as competitors to jellyfish, and lead to a “vicious circle” for fish. As Purcell and Arai (2001) stated, competition with, and predation by, Hydrozoa can be considered one of the major ecological factors, next to prey availability, for fish larvae survival and thus population size. With reduced competition for food, Hydrozoa could increasingly dominate pelagic food webs and thereby impede the recovery of fish stocks, not only through competition for food but foremost by predation (Daskalov and Mamedov, 2007). This cycle would intensify pressure on future fish populations and result in unforeseeable changes for the respective ecosystems.
Here we conducted a large-scale mesocosm experiment to assess how future OA might affect the interaction of fish larvae and hydrozoans in an ecosystem context. The enclosed natural plankton communities contained Atlantic herring larvae (Clupea harengus), added to the mesocosms, as well as several hydromedusae species that were already present (Aglantha digitale, Clytia spp., Obelia spp. and Sarsia tubulosa). Over the course of the experiment lasting 53 days, we monitored hatching success and survival of C. harengus larvae and related them to succession in the plankton community with a particular focus on the abundance and biomass of the dominant Hydrozoa.
Material and Methods
The mesocosm study was carried out from May 3rd, 2015 until June 30th, 2015 in Raunefjord, a fjordlike strait on the southwest coast of Norway close to the city of Bergen (Figures 1B, C). Specifically, the mesocosms were moored at 60°15’55’’ N, 5°12’21’’ E, in proximity to the Espegrend Marine Research Field Station (Figures 1B, C). Detailed information on the whole experimental setup, manipulation, sampling procedures, analyzed parameters, and results of the main superordinate mesocosm experiment are given in an overview paper by Spisla et al. (2021).
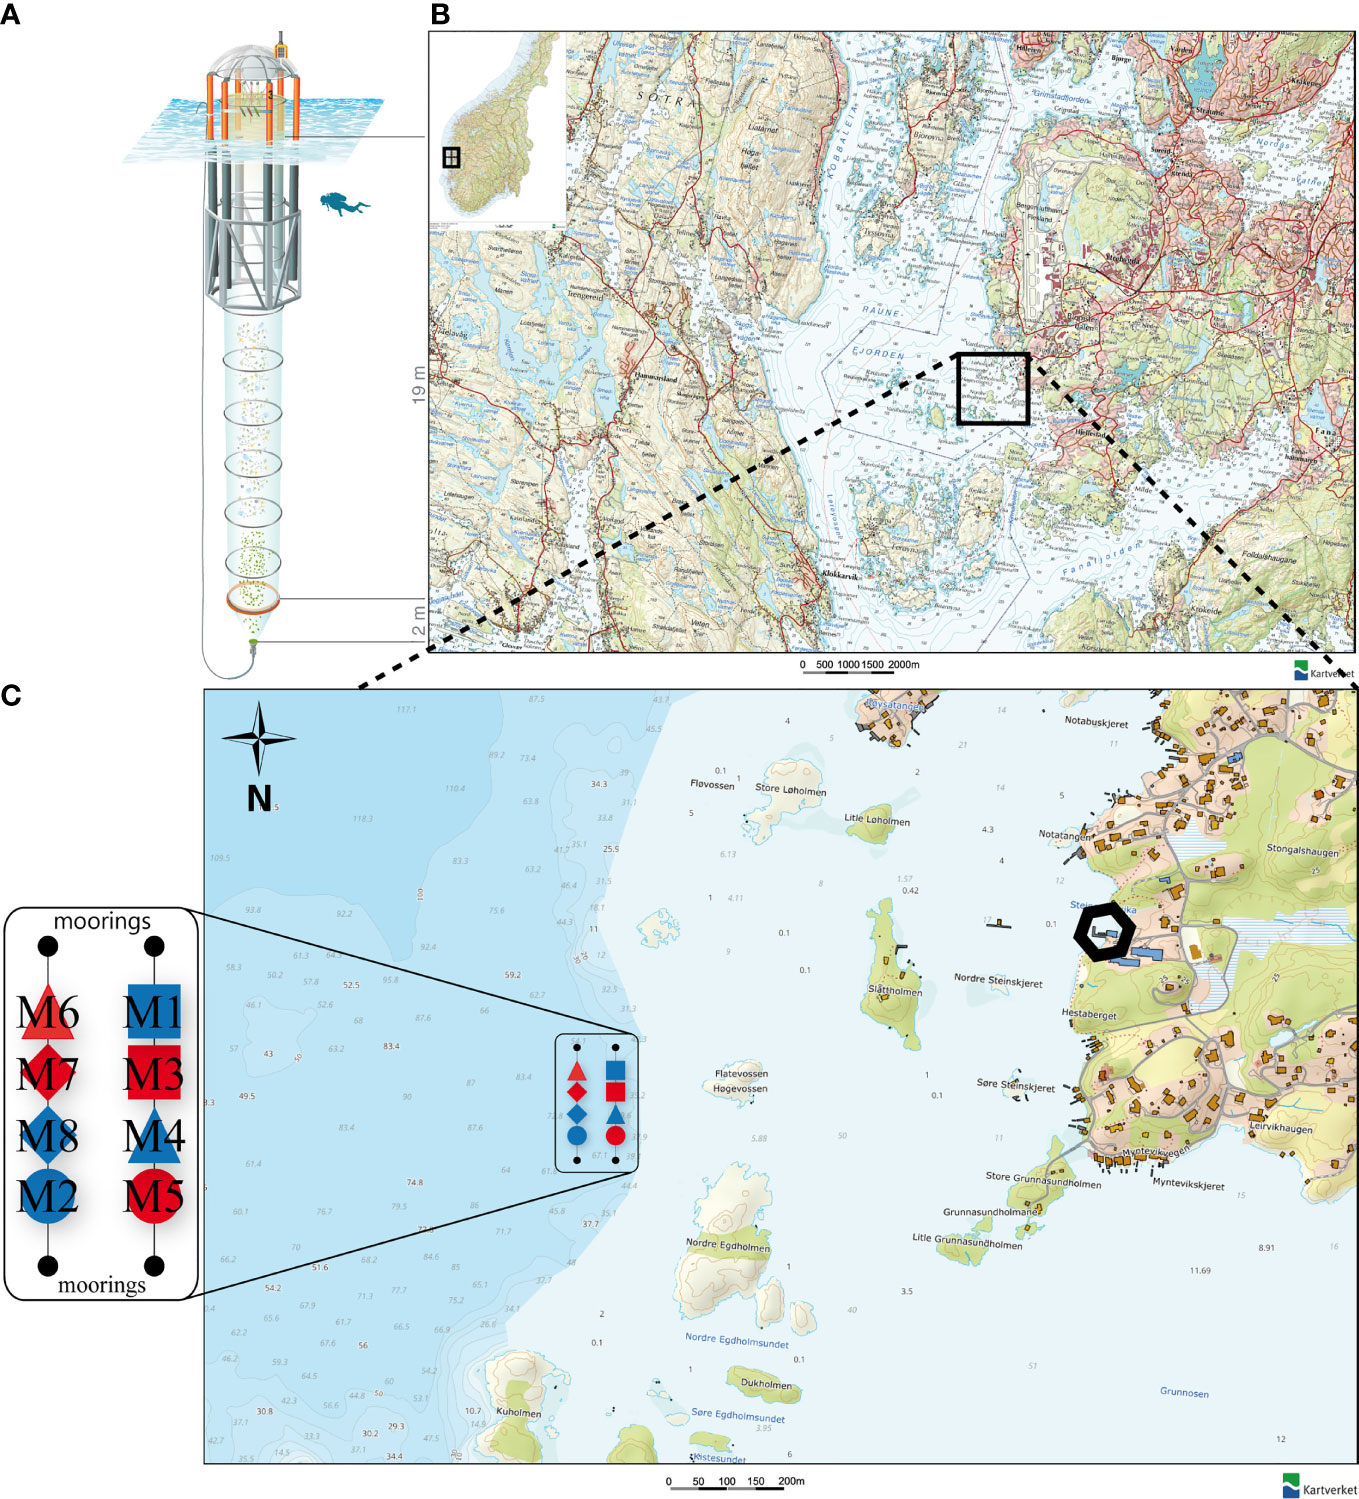
Figure 1 (A) Kiel Off-Shore Mesocosm for Ocean Simulations (KOSMOS), a pelagic mesocosm system. Blue corrugated area represents water surface. Diver for scale. Illustration of the KOSMOS unit by Rita Erven (GEOMAR), reprinted with permission from the AGU (B) Location of the Raunefjorden at the coast of Norway. Black square indicates deployment area of the mesocosms. (C) Position, order and symbols of the KOSMOS units M1 – M8 in their deployment area near the Espegrend Marine Research Field Station, Bergen (black hexagon). Red filling of the respective mesocosm symbol indicates CO2 manipulation and blue filling the control group. Symbols and denomination of the mesocosms will be used uniformly throughout the manuscript. Small numbers in the map indicate the water depth in meter. (B, C) modified after: The Norwegian Mapping Authority (Kartverket, accessed February 15th 2021, http://geo.ngu.no/kart/arealisNGU/).
In total, we arranged eight pelagic Kiel Off-Shore Mesocosms for Ocean Simulations [KOSMOS, Riebesell et al. (2013)] in two rows of four mesocosms each (Figure 1C). The mesocosms consist of a floating frame with a dome-shaped hood, a 21-m long mesocosm bag, a 2 m full diameter sediment trap sealing the bottom of the bags (Figure 1A), and the upper opening of the mesocosm bag, which we kept ~1 m above sea level. The bags are made of polyurethane foil, permeable for light in the photosynthetically active radiation (PAR) spectrum but scarcely for UV light.
Acidification Treatment and Measured Parameters
On May 6th, 2015 we initiated the experiment by closing the mesocosms, thereby isolating the mesocosm water column from the surrounding fjord water; the OA treatment began May 12th, 2015 (Day 0 of the experiment). In order to simulate realistic pCO2 values for near future scenarios or those already present especially in coastal upwelling ecosystems, we selected target OA levels of pCO2 around 2000 µatm for the experiments [see Spisla et al. (2021)]. These OA levels were achieved for the four high pCO2 mesocosms (M3, M5, M6, M8) by injecting CO2-saturated sea water at four time points at the beginning of the study (Day 0, 2, 4, and 6) and, to compensate for CO2 losses from outgassing, on Day 14, 22, 28, 40, and 46 during the experiment. Daily measurements and samples were taken over the course of the experiment from Day -3 (i.e., 3 days before first CO2 manipulation) until Day 0 and every two days from Day 1 until the end of the study on Day 49 [see Timeline Figure 2, Spisla et al. (2021)]. We measured a variety of physical, biological, and biogeochemical parameters inside the mesocosms and in the surrounding fjord water at the mesocosm deployment site. Temperature, salinity, pH, and PAR were measured with a hand-held self-logging CTD probe [CTD60M, Sea and Sun Technologies, Schulz and Riebesell (2013)]. Concentrations of Chlorophyll a/phytoplankton pigments, inorganic nutrients (nitrate, nitrite, ammonium, silica, and phosphate), particulate organic matter (carbon, nitrogen, phosphorous), dissolved inorganic carbon (DIC), total alkalinity (TA), and microscopic as well as flow cytometric abundances of phyto-/and microplankton were obtained from water subsamples from the water column taken with a depth-integrating water sampler (IWS, Hydro-bios, Kiel).
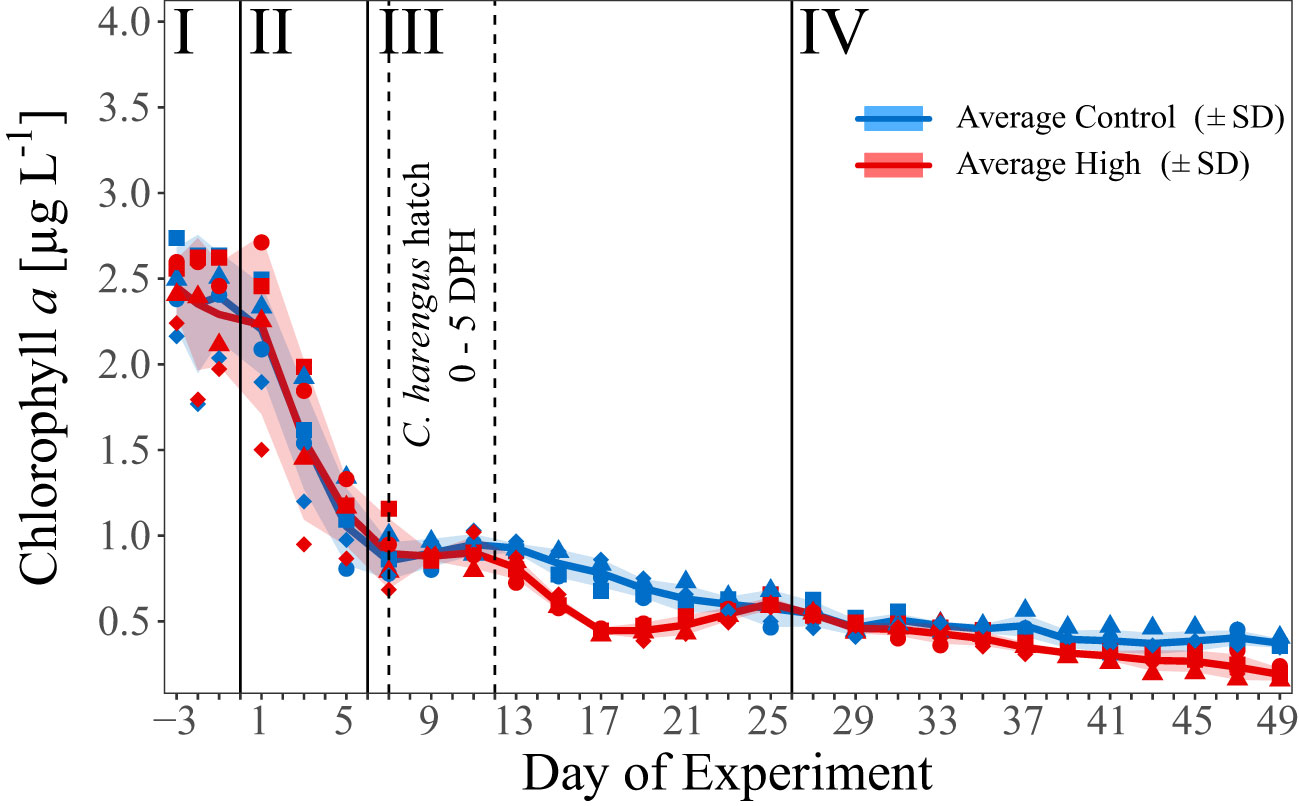
Figure 2 Temporal development of average chl a concentration [µg C L-1] over the course of the experiment. Blue and red line indicate the respective average concentration in the control and high pCO2 treatment. The shaded areas represent the standard deviations (SD). Blue symbols represent concentrations in the control pCO2 mesocosms (M1, M2, M4, and M7), red symbols in the high pCO2 mesocosms (M3, M5, M6, and M8), assigned as presented in Figure 1C. Dashed vertical lines mark the start and peak of herring larvae (C. harengus) hatch as Days Post Hatch (DPH). I – IV indicate the different phases of the experiment separated by vertical lines (for details on the phases see Spisla et al., 2021).
Herring Larvae Introduction and Sampling
Herring eggs were obtained from adult herring caught with a gillnet (mesh size: 36 mm) in Fens Fjord (60°34`795 N, 5°0`759 E) on May 5th 2015 at a depth of ~6 m in cooperation with the Department of Fisheries Ecology and Aquaculture, University of Bergen. The eggs of two females were strip-spawned onto 20 plastic plates and fertilized with the sperm of three males. To allow for genetic variation we crossed every female with every male. Fertilization and early egg development took place in control, flow-through seawater for one week until we placed the egg-plates inside the mesocosms. Before introduction into the mesocosms we enumerated the number of fertilized and developing eggs for each egg plate as a proxy for hatching success, prior to combining egg plates to yield similar numbers of hatching larvae and then randomly introducing them to the mesocosms.
On May 12th,2015 (Day 0 of the experiment), we added on average 6364 ± 1257 SD fertilized eggs to each mesocosm; the high SD resulted from the difficulty of repeatedly strip-spawn similar numbers of eggs from the females. To prevent damage by sampling gear we placed the egg plates in specially designed open ‘egg cages’ at 8 m depth. From these cages the larvae hatched inside the mesocosms after ~14 days, with peak hatch (Day 0 of the days post hatching (DPH) period) estimated on May 19th (Day 7 of the experiment) by visual inspection of the egg plates (~50% larvae hatched = empty eggs). To maximize the number of hatched larvae, we held the cages inside the mesocosms until May 24th (5 DPH). On average, 2063 ± 566 SD larvae hatched in each mesocosm, calculated as the difference in egg numbers before and after hatch by counting the eggs on photographs taken of the egg plates. We included dead larvae and fallen-off eggs found inside the egg cages in the number of non-hatched larvae.
The sampling of sediment trap material [following the protocol of Boxhammer et al. (2016)] provided an opportunity to collect dead larvae directly every second day throughout the whole experimental period. Upon arrival of the samples, we transferred the sediment material into black trays (70 cm × 50 cm × 10 cm) and visually searched for larvae. The dead (whitish) herring larvae were clearly distinguishable from the sediment trap material. Section 2.3 on sampling of mesozooplankton describes the sampling of live larvae.
Mesozooplankton Sampling
To minimize any influence of biomass removal through plankton net hauls in the mesocosms, we only sampled mesozooplankton (MesoZP) every 8 days starting on Day -3 (May 5th) and ending sampling on Day 49. Sample collection used a 100 cm long, 55 µm mesh size Apstein net vertically hauled from 19 m depth up to the water surface between 11:00 and 13:00 h. The opening of the net was a cone-shaped lid of 17 cm diameter that sampled a water volume of 0.431 m³ or 431 L. Net hauls were performed in every mesocosm as well as in the fjord in alternating sequence to assure random sampling of the single mesocosms between different sampling days. Samples were transferred to a 500 mL Kautex bottle and filled with 0.7 µm filtered seawater (FSW), transported to the laboratory, and immediately preserved in 70% Ethanol and later counted in a Bogorov-Chamber under a Leica stereomicroscope (MZ12).
In addition to the regular MesoZP net hauls, we assessed hydrozoan and fish larvae abundances with net hauls of an Apstein net (500 µm mesh size, 0.5 m opening diameter), resulting in a sampled water volume of 3.73 m³ or 3730 L. These net hauls began after herring larvae had hatched, from Day 13 onward, on Day 23, 29, and 37, and were taken in the evening, using a flashlight on top of the net to make use of the positive phototactic behaviour of herring larvae (Hernandez et al., 2003). The samples were stored in 1 L FSW and upon arrival in the laboratory, first examined for fish larvae and then counted with respect to jellyfish. During counting, we placed individuals of the dominant jellyfish into tin capsules for carbon and nitrogen content analysis using an elemental CN analyzer (EuroEA). Time and personnel constraints limited these measurements to the dominant species from the 500 µm net, omitting their smaller equivalents from the 55 µm net. On Day 49 we sampled all remaining herring larvae and/or other fish that were alive in each mesocosm. This sampling entailed hauling a net with the same diameter as the mesocosms (2 m) and a mesh size of 1000 µm from the bottom to the top of every mesocosm. These final samples were again examined for fish larvae prior to storage in 500 mL 4% buffered formaldehyde.
The herring larvae caught alive during and at the end of the experiment were transported in containers of 5 L to the research station, anaesthetized with MS-222, and individually prepared for further analyses. We photographed all larvae with a camera mounted on a stereomicroscope (Nikon-Leica), and used the images to measure larval standard length to the nearest 0.1 mm with the open-source software ImageJ. The sampled larvae were then directly frozen in sea water at -80°C for later analyses of dry weight. We measured the larval dry weight (DW) after 18 h of lyophilisation (Christ Alpha 1–4 freeze dryer, Martin Christ Gefriertrocknungsanlagen GmbH, Osterrode, Germany) for each individual larva on a micro balance (Sartorius SC 2 micro balance, Sartorius AG, Göttingen, Germany; precision ±0.1 μg). The same larvae were later used for nucleic acid analysis measuring the nucleic acid ratio (RNA and DNA (RD), standardized to sRD = 0.92 × RD (Caldarone et al., 2006) as a proxy for nutritional condition and growth (protocol described in Malzahn et al. (2003). In order to determine the overall biomass of herring larvae, we multiplied the individual DW of the herring larvae at the end of the study by its abundance.
Besides the introduced C. harengus larvae, the final net also caught juvenile gadoid and flatfish, which we counted and measured for wet weight on a micro balance as described above. For a better comparison to the biomass of other members of the plankton community, we transformed wet weight of these juvenile fish into dry weight assuming a conversion factor of 0.18 (Van der Meeren et al., 1994). In order to estimate the overall biomass of gadoid and flatfish, we summed the individual DW for each mesocosm.
Identification of Specimen by Means of mtCOI DNA Sequencing
Supplementary to the visual identification of the observed Hydrozoa, we manually picked individuals of the most abundant species from the fish net haul samples for “barcoding”, i.e. genetic identification based on their mitochondrial cytochrome oxidase I (mtCOI) genes. For this analysis, we removed the organisms with as little seawater as possible, transferred them to 96% Ethanol (EtOH)-filled 2 mL screw cap microtubes, and stored them immediately at -80°C until further analysis. In order to extract the DNA of the single organism, we thawed and extracted them from the 2 mL tubes, dried, and transferred them into a 1.5 mL PCR Clean Eppendorf Safe-Lock Tube. DNA extraction followed the protocol given in the Supplementary Material. The subsequent PCR was carried out in a Biometra TProfessional Basic PCR Machine, following the protocol of Bucklin et al. (2010) with 1. Initial Step 5 min 94°C, 2. Denaturation 94°C 1 min, 3. Annealing 45°C 2 min, 4. Elongation 72°C 3 min, and 5. Final Elongation 72°C 10 min. The PCR product was purified using the ZYMO DNA Clean & Concentrator kit and analyzed on an ABI 3730 DNA sequencer (SeqGen Inc., California, USA) at the sequencing service unit Ludwig-Maximilians-University Munich (LMU, Munich, Germany).
Data Analysis
From the counts per sample and the filtered volume of the 500 µm (large) and the 55 µm (small) net, 3730 L and 431 L, respectively, we calculated abundances as individuals per m³ (ind m-3). We then used the abundance data from the 500 µm net to obtain hydrozoan biomass by multiplying the ind m-3 by the measured carbon and nitrogen values. The same procedure was applied to the calculation of copepod biomass, but in the absence of measurements, we used carbon and nitrogen literature values to calculate biomass of copepodite (cop.) and adult stages of the dominant species Acartia sp., Calanus sp., Oithona sp., and Temora sp., as well as copepod nauplii larvae (see Supplementary Table 1).
A two-sample t-test evaluated OA effects on hydrozoan abundances (ind m-3) and biomasses (µg C m-3). We calculated the mean abundance or biomass per mesocosm per time period, grouped by high and control pCO2, and tested for significant differences between treatment averages. We calculated overall survival of herring larvae for each mesocosm from the initial number of hatched larvae and the number of survivors at the end of the experiment. For survival of herring larvae, we used a one-way ANOVA (t-test) to compare overall survival between CO2 treatments. The high variability in sample sizes for larval growth and nutritional condition per mesocosm over time, along with low survival in the control and no survivors in two mesocosms by the end of the study led to an unbalanced design, which precluded statistical analyses of treatment-specific differences. Results for these parameters are therefore based on visual inspection of the data and the description of interacting factors.
All statistical calculations were performed with R software version 3.4.2 in the RStudio environment (RStudio, 2016).
Results
Chlorophyll a Concentration
Based on the temporal development of the chl a concentration and the time points of the CO2 additions, we divided the experiment into four temporal phases [for details see Spisla et al. (2021)]:
- Phase I (Day -3 – Day 0):
Closing of mesocosms until first CO2 addition
-Phase II (Day 1 – Day 6):
Establishing target pCO2 values and transition from bloom to post-bloom conditions
- Phase III (Day 7 – Day 26):
First post-bloom phase with a treatment effect on chl a followed by realignment
- Phase IV (Day 27 – Day 49):
Second post-bloom phase with enhanced treatment differences and continued steady decline in chl a
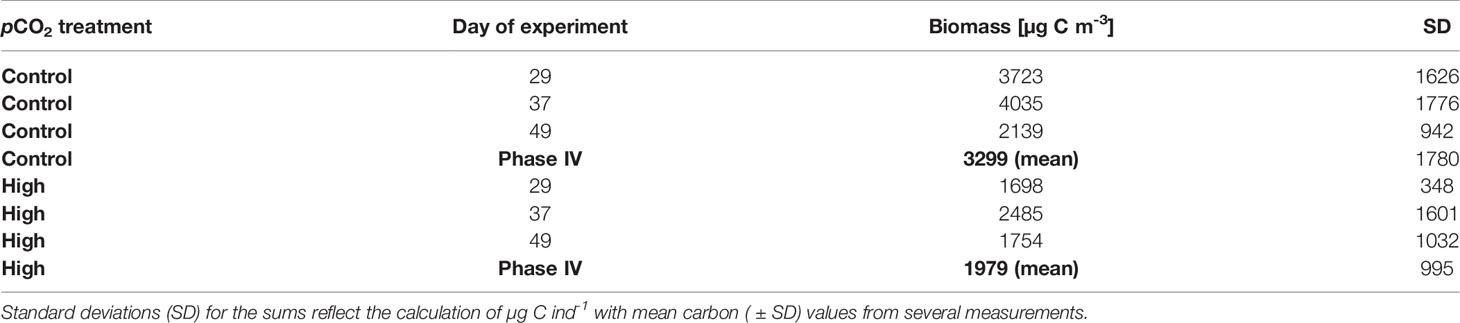
Table 1 Hydrozoa biomass summed (µg C m-3, 500 µm net samples only) per treatment on specific days of the experiment (DoE) as well as the mean over phase IV of the experiment.
In the first phase of the experiment (Day -3 to Day 0) mean chl a concentration in both treatments decreased slightly from the initial values of ≈ 2.4 µg L-1 to ≈ 2.2 µg L-1 (Day 1), and much faster to around 0.9 µg L-1 towards early phase III (Figure 2). In phase III and IV, the chl a concentration decreased constantly to 0.36 µg L-1 (± 0.03 SD, control) and 0.18 µg L-1 (± 0.04 SD, high), with a significant treatment difference during phase III (t-test p < 0.001), and phase IV (t-test p = 0.03). This treatment effect was most pronounced on Day 17 with an average chl a concentration of 0.77 µg L-1 (± 0.1) and 0.43 µg L-1 (± 0.02) in the control and CO2-enriched mesocosms, respectively. For more details see Spisla et al. (2021) and Spisla et al. (2020).
Copepod Biomass
Overall mean copepod biomass in all mesocosms decreased over the course of the experiment from about 40 mg C m-3 initially to about 13 mg C m-3 by Day 49 (Figure 3A). After closure of the mesocosms, mean values developed a short-term peak towards the end of the acidification phase (Day 5) and decreased thereafter. The increase in biomass was mainly due to adult and copepodite stages, and was not observed in the nauplii biomass (Figures 3B, C). Prior to Day 21 we observed no significant treatment effect in all copepods size classes, From Day 21 to Day 37, however, we detected a significant positive OA effect in the copepods overall and copepodite biomass (p= 0.02/0.007, 30.6 ( ± 6 SD) and 22.5 ( ± 6 SD) mg C m-3 respectively in the high pCO2 mesocosms, 25.8 ( ± 2.5 SD) and 16.4 ( ± 4 SD) mg C m-3 under control conditions). For copepod nauplii biomass, we observed a significant negative effect between Day 29 and Day 37 (p= 0.02, 0.47 mg C m-3 ( ± 0.2 SD), high pCO2, 0.72 mg C m-3 ( ± 0.2 SD), control).
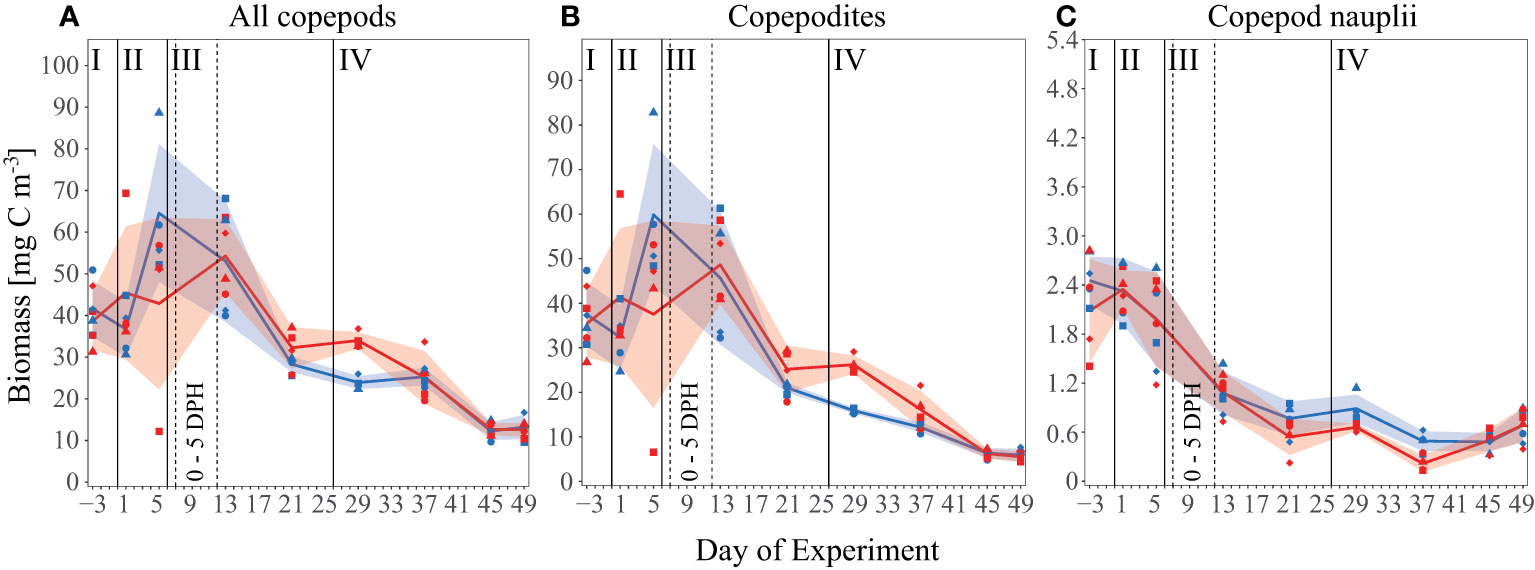
Figure 3 Biomass [mg C m-3] development of all measured copepod species over the time of the experiment as (A) all copepod species and size classes combined (i.e. including adult, copepodite and nauplii stages), (B) only copepodite stages, and (C) only copepod nauplii larvae. Lines, symbols and colors are used as described in Figures 1C, Figure 2.
Hydrozoa Abundance and Biomass
Visual identification of specimen suggested that the Hydrozoa community consisted mainly of hydromedusae of Aglantha, Clytia sp. (Figure 4B), Sarsia tubulosa (Figure 4C), Obelia sp. (Figure 4D) and Rathkea sp. Subsequent sequencing of the mtCOI genes and comparison to the BLAST genbank (Altschul et al., 1990) of these pre-identified species confirmed the presence of Clytia sp., and Obelia geniculata. Problems during sequencing meant we could not confirm Rathkea sp. occurrence, and some unidentified hydromedusae remained unknown.
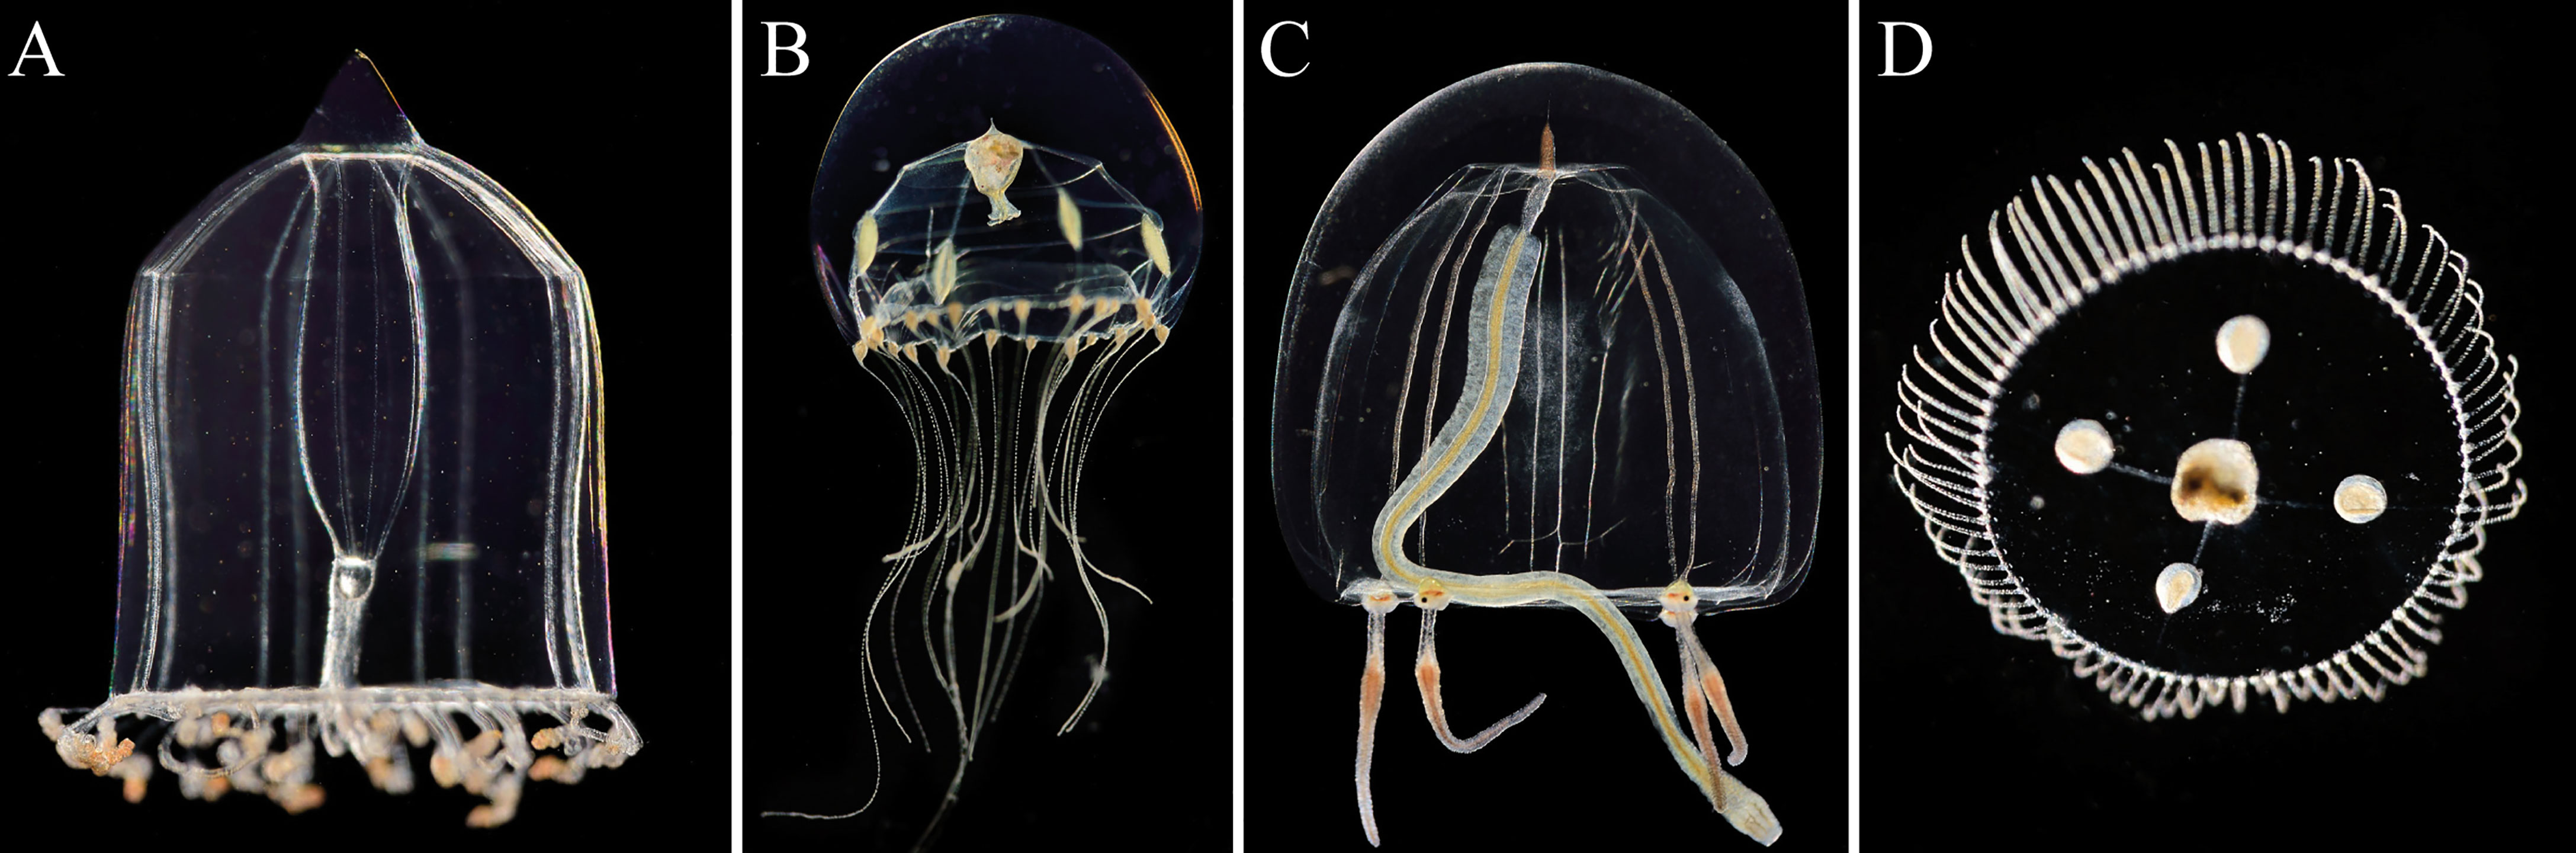
Figure 4 Main Hydrozoa species observed: (A) Aglantha digitale, (B) Clytia sp., (C) Sarsia tubulosa, and (D) Obelia geniculate. Displayed organisms are not to scale to each other. Pictures © Solvin Zanckl.
We included all unidentified species in the “total Hydrozoa” abundance data, reported as the sum of all individuals present in the mesocosms (ind m-3). Total Hydrozoa abundances in both the 500 µm and 55 µm nets decreased over the course of the experiment (Figure 5). In the 55 µm net, abundances averaged over all mesocosms decreased from an initial concentration (Day -3) of 159 ind m-3 ( ± 35 SD) to 19 ind m-3 ( ± 10 SD, Day 49), whereas mean concentrations sampled in the 500 µm net declined from 69 ind m-3 ( ± 7 SD, Day 13) to 11 ind m-3 ( ± 3 SD, Day 49). These decreasing trends reflect changes in hydrozoan abundances in the surrounding fjord, where abundances sampled with the 55 µm net decrease from 130 ind m-3 initially to 15 ind m-3 on Day 49. For the control and high pCO2 mesocosms, respectively, sampling with the small net indicated similar abundances in phase I and II of the experiment, and except for Day 13, in phase III as well. On Day 13 hydrozoans seemed less abundant under high pCO2, contrary to the remainder of the experiment. Given that this decrease almost mirrored the fjord data, and was not evident in the 500 µm net abundances, it could potentially indicate an error in the sampling method or data collection. From Day 13 onward, and especially during phase IV of the experiment, hydrozoan abundances in the 55 µm net (46 ind m-3 ± 23 SD) in high pCO2 were significantly greater than those in control pCO2 (30 ind m-3 ± 17 SD) (p= 0.034). This treatment effect was also evident in 500 µm net abundances. Although only statistically significant on Day 29 (p= 0.003) pCO2 mesocosms (51 ind m-3 ± 6 SD) were greater than those in the control mesocosms (34 ind m-3 ± 4 SD), and mean Hydrozoa abundance tended to remain higher under high pCO2 throughout phase IV of the experiment.
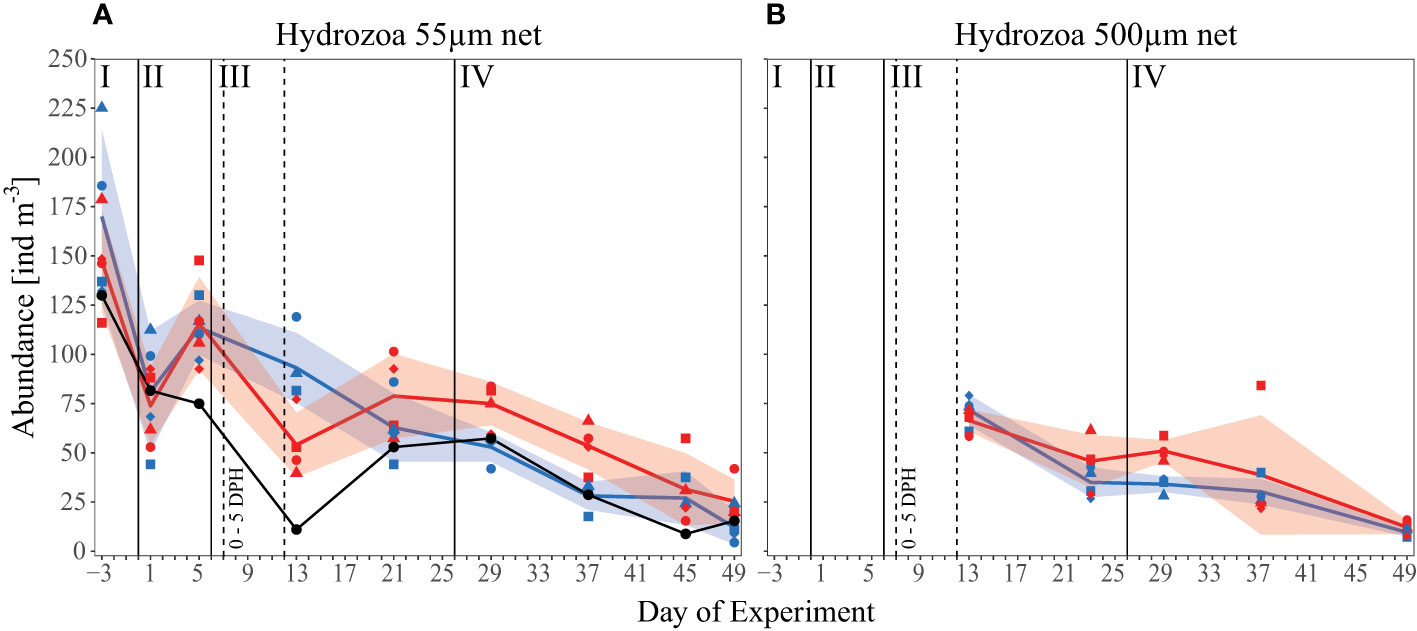
Figure 5 Abundance data [ind m-3] of all observed Hydrozoa over the time of the experiment. (A) The small 55 µm mesh size net and (B) the big 500 µm mesh size net. Black line and symbols represent values measured in the surrounding fjord. Other lines, symbols, and colors as described in Figure 1C and Figure 2.
Despite lower Hydrozoa abundances under control pCO2 in phase IV, total hydrozoan biomass (estimated from the 500 µm net) increased during this period (see Figure 6A and Table 1), amounting to 3299 µg C m-3 ( ± 1780 SD) in the control mesocosms compared to 1979 µg C m-3 ( ± 995 SD) in the high pCO2 mesocosms, thereby displaying a significant treatment effect (p= 0.035, Figure 6A). Along with the abundance data, hydrozoan biomass decreased over time in the control pCO2 mesocosms from 3723 µg C m-3 ( ± 1626 SD) on Day 29 to 2139 µg C m-3 ( ± 942 SD) on Day 49, but remained relatively stable with 1698 µg C m-3 ( ± 348 SD) on Day 29 and 1754 µg C m-3 ( ± 1032 SD) on Day 49 in the high pCO2 mesocosms (Figure 6B). Aglantha digitale comprised the majority of the biomass, representing around 70% (2404 µg C m-3 ± 1401 SD) of the biomass in the control mesocosms and around 50% (1051 µg C m-3 ± 915 SD) in the high pCO2 mesocosms in phase IV. Accordingly, Clytia sp., Obelia geniculata, and Sarsia tubulosa contributed relatively little to the overall biomass of phase IV, representing 14% (455 µg C m-3 ± 211 SD), 1% (29 µg C m-3 ± 6 SD), and 12% (410 µg C m-3 ± 286 SD) in the control, and 23% (462 µg C m-3 ± 311 SD), 5% (100 µg C m-3 ± 77 SD), and 18% (366 µg C m-3 ± 168 SD) in the high pCO2 mesocosms, respectively (see Figure 6B).
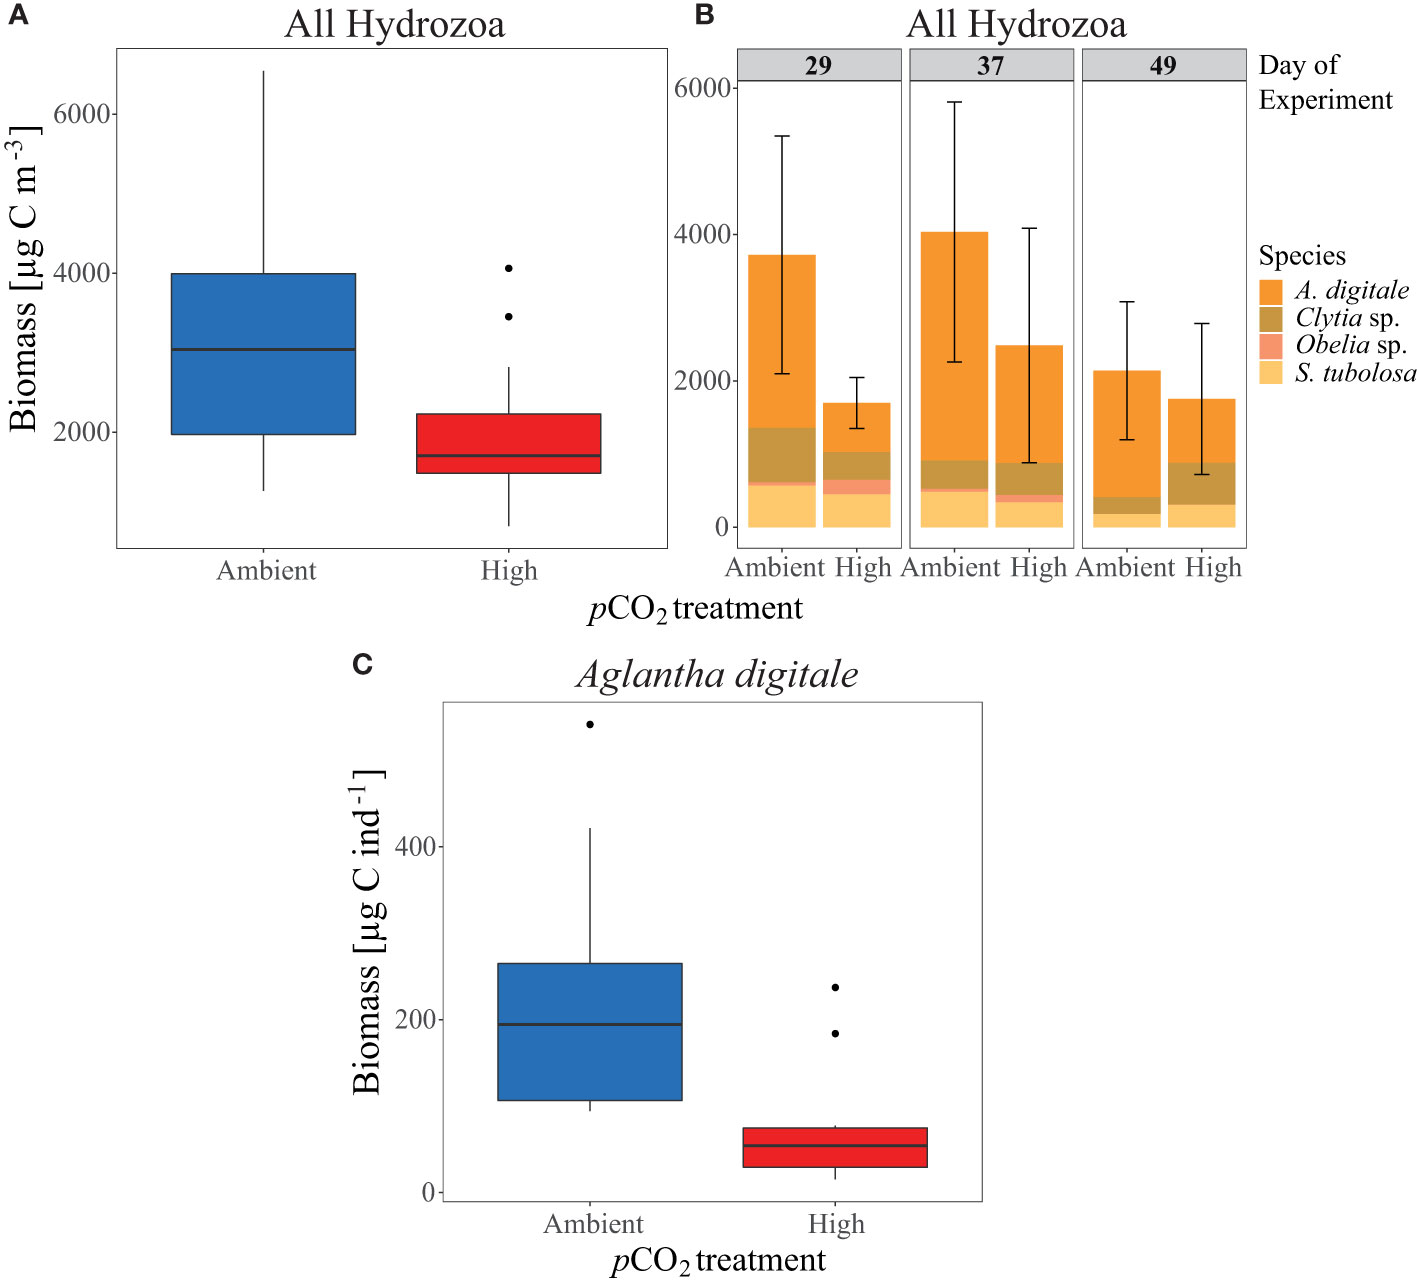
Figure 6 Hydrozoa biomass [µg C m-3] development per pCO2 treatment over phase IV of the experiment as (A) combined Hydrozoa mean biomass of the four major species, and (B) biomass contributions of the single species (see given legend) to the overall Hydrozoa biomass per day. Error bars represent the standard deviation of the sum of all listed species, see also Table 1. (C) Mean biomass per pCO2 treatment, per individual [µg C ind-1] of the dominant species Aglantha digitale. All boxplots display the mean and the 95% confidence interval of the given data.
The biomass per Individual (µg C ind-1) of A. digitale indicated the verse pattern to that in hydrozoan abundance and biomass. With a mean of 227 µg C ind-1 ( ± 144 SD) in control mesocosms compared to 73 µg C ind-1 ( ± 68 SD) in high pCO2 mesocosms, individuals were significantly smaller in the final phase of the experiment (p= 0.003, see Figure 6C).
Herring Larvae Survival
Significantly more larvae were caught alive during the final sampling in the high pCO2 treatment compared to the control mesocosms (control pCO2: 0.1% ± 0.1 SD, high pCO2: 1.7% ± 0.2 SD, see Figure 7A). Only a small percentage of those larvae that hatched were caught alive by nets during the study (control pCO2: 0.3% ± 0.2, high pCO2: 0.8% ± 0.5). A higher percentage was found dead in the sediment trap (control: 16.4% ± 5.0, high: 21.2% ± 6.7, Figure 7B), and the highest percentage was categorized as ‘missing by predation’ (control pCO2: 83.3% ± 5.4, high pCO2: 76.3% ± 6.6, Figure 7C). Thus, under high pCO2 conditions, we found higher survival and more dead larvae in the sediment traps on average, whereas more larvae were ‘missing by predation’ in the control pCO2 mesocosms, indicating higher predation pressure (Figures 7B, C). See Supplementary Table 2 for details on the numbers of eggs introduced, and larvae that hatched and were sampled or missing due to predation in each mesocosm and treatment.
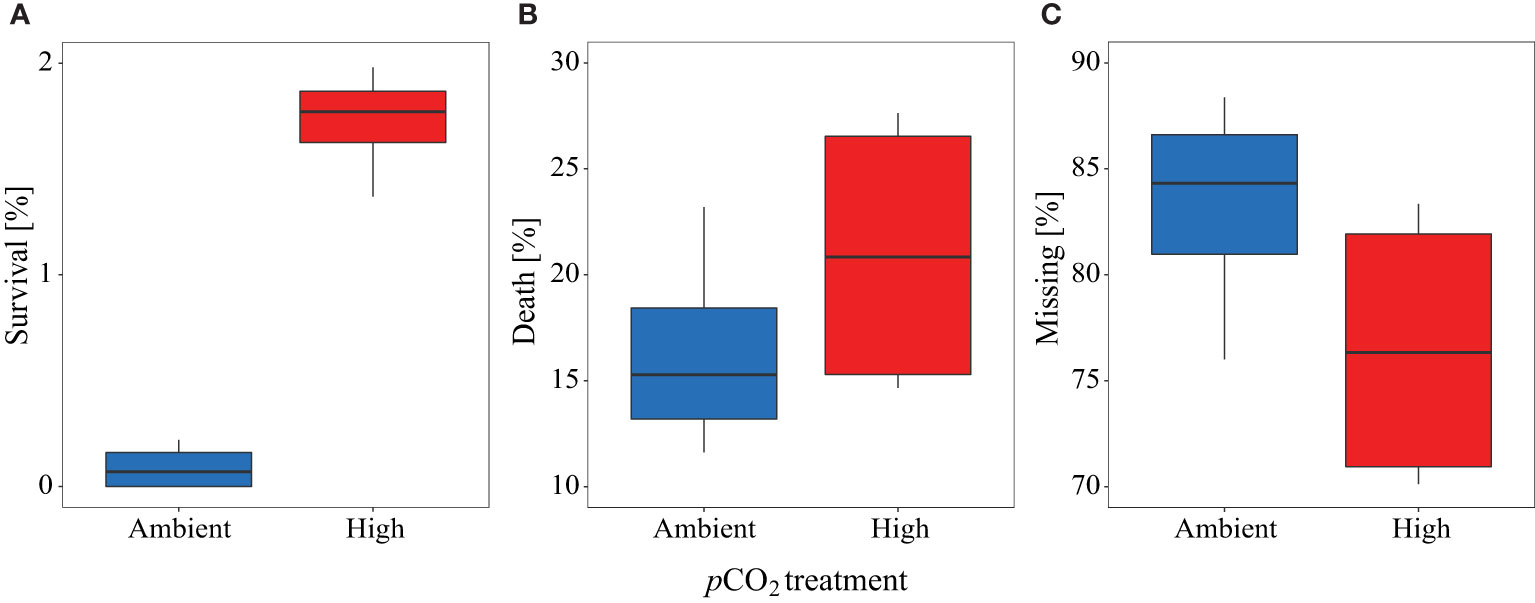
Figure 7 Percentage proportion of herring larvae at the end of the experiment from overall hatched egg for (A) survival, (B) death, and (C) missing individuals. Blue color represents the control, red the high pCO2 treatment. All boxplots display the mean and the 95% confidence interval of the given data.
Dry Weight and Nutritional Condition
As a result of differences in overall survival, we could only acquire data on larval dry weight (DW) and nutritional condition (sRD) for two control pCO2 mesocosms (M2, M4), but for all four high pCO2 mesocosms (M3, M5, M6, M8; see Supplementary Figure 1). On average, dry weight at the end of the experiment was higher in control than in high pCO2 mesocosms. Small larvae in the range of 0.25 - 0.75 mg were absent in control mesocosms but present in the high CO2 mesocosms. Larval nutritional condition (sRD) declined slightly between hatch, 12 DPH, and 30 DPH, respectively. Slightly higher sRD values characterize the survivors at the end of the study compared to hatch. We also observed higher average dry weight, sRD in the control pCO2 mesocosms. In general, we observed high variability within one pCO2 treatment and within each mesocosm, with higher variability in both the dry weight and nutritional condition in the high pCO2 treatment (see Supplementary Figure 1).
Presence of Juvenile Fish and the Polychaete Tomopteris sp.
Apart from herring larvae, we also captured live juvenile fishes of the families Gadidae (cod-like) and Pleuronectidae (flatfish species) at the end of the experiment, in addition to some dead individuals in the sediment trap over the course of the experiment. Overall, their numbers were relatively low with ≤ 4 juvenile fish per mesocosm at the end of the study, but they contributed considerably to total biomass (Figure 8). The biomass of cod-like juveniles, which are potential predators of herring larvae (Reid et al., 1999) was extremely high in two control mesocosms (M1 & M7), where no herring survived until the end of the study.
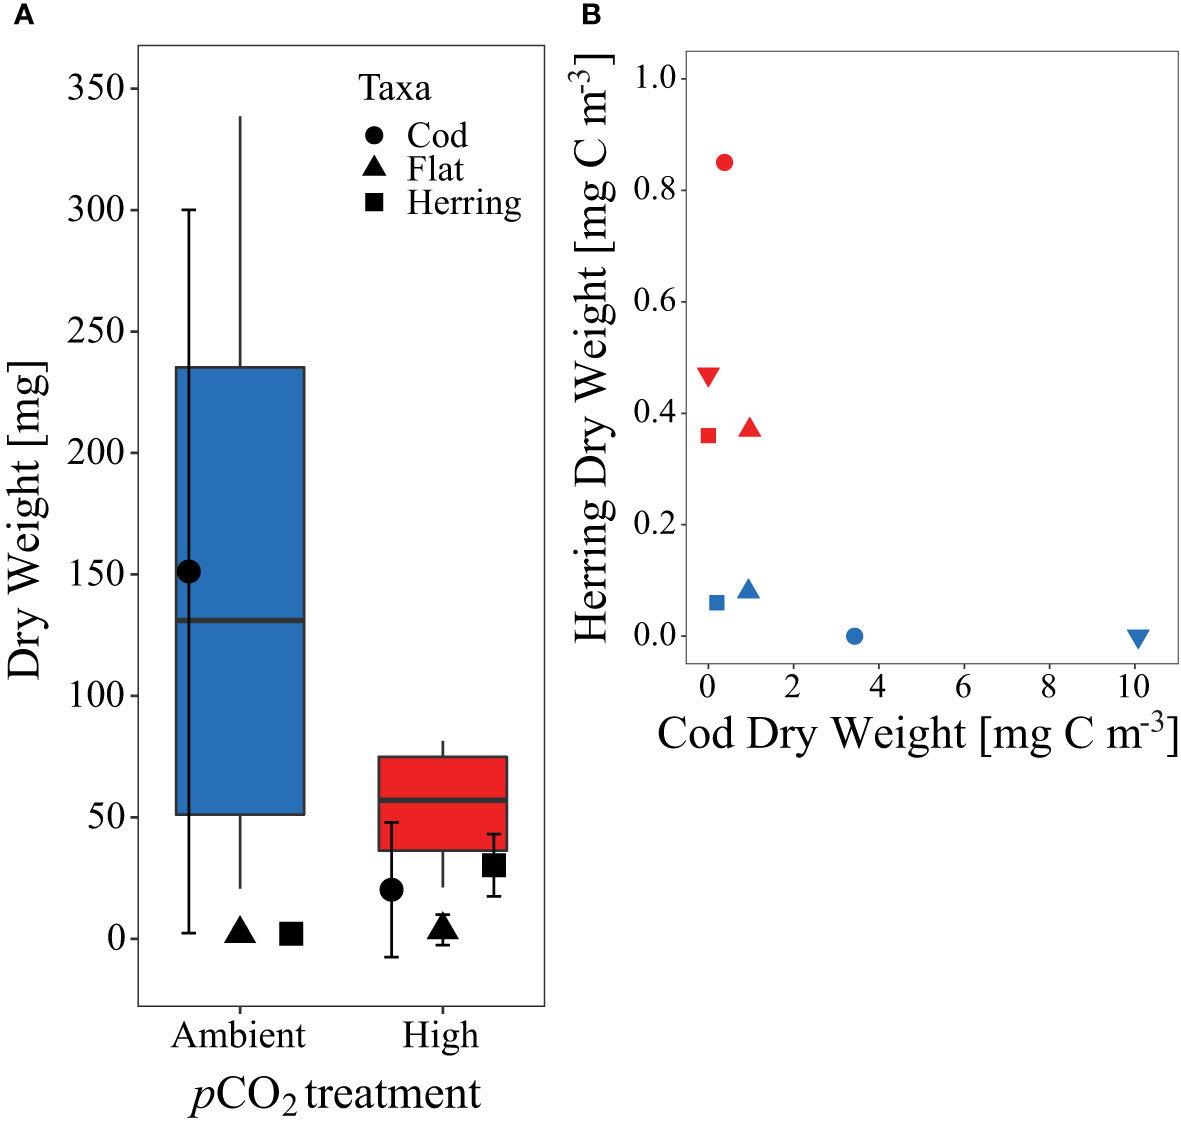
Figure 8 (A) Dry weight (DW, mg) sum and contribution of all fish larvae caught at the end of the experiment per pCO2 treatment. Symbols according to given legend. (B) Comparison of herring larvae and cod DW [mg C m-3] at the end of the experiment. Symbols and colors used for (B) are as described in Figures 1C, 2.
Additionally, Tomopteris sp., a pelagic polychaete which also potentially feeds on fish larvae (Lebour, 1927), was present over the course of the experiment. We cannot assess its impact on the fish population because it only occurred with an overall mean of about 2 ind m-3 and with no detectable differences between control and high pCO2 mesocosms (data not shown).
Discussion
We found significant effects of ocean acidification on all higher trophic levels of our enclosed plankton community, particularly during the post-bloom phase of this experiment. Most strikingly, we documented higher survival of Atlantic herring larvae under high pCO2, coinciding with lower hydrozoan biomass.
Treatment Effects on Hydrozoa
The positive OA effect on hydrozoan abundances in the post-bloom phase IV of our experiment likely reflects an indirect CO2 effect mediated via food-web interactions rather than a direct, physiological CO2 effect. We know of no reports of direct positive effect of lower pH on the ecophysiological performance of jellyfish (Richardson and Gibbons, 2008; Winans and Purcell, 2010; Knowles, 2012). Indeed, experiments by Winans and Purcell (2010) as well as Knowles (2012) instead suggest a negative influence of lower pH on metabolism and statolith formation in jellyfish, but with unknown consequences for the organisms and their ecological fitness. Previous work indicated a possible direct negative effect on the metabolism of hydrozoans leading to increased mortality in experiments with box jellies (cubozoae) at a pH of 7.5 (Chuard et al., 2019). The authors proposed a lethal reduction in cubozoae metabolic rates caused by acidoses, which has already been observed for a wide range of organisms exposed to enhanced acidification (Pörtner et al., 2005). In combination with an indirect OA-mediated food web effect, this OA-induced mechanism of decreased metabolic rates potentially played a role in the development of the hydrozoan communities observed in our experiment, reducing Aglantha sp. biomass per individual, and the resulting counter-intuitive pattern of higher abundance but lower biomass in the high pCO2 treatment (see Figure 6 and Table 1). A previous study reported a similar effect in the copepod taxa Calanus finmarchicus and Temora longicornis, which both displayed distinct antioxidant and oxidative stress levels as a reaction to an interplay between direct OA and indirect food quality/predation effects (Engström-Öst et al., 2020). Aglantha digitale and the other Hydrozoa in our study reportedly feed on a broad variety of taxa and size classes (Purcell and Mills, 1988; Pagès et al., 1996), complicating efforts to pinpoint the triggering mechanism behind our treatment differences in abundance, biomass, and size. As a consequnce of OA directly inhibiting hydrozoan growth, they might focus on small prey organisms ranging from microplankton to early copepodite stages. As indicated by chl a (Figure 2) and reported by Dörner et al. (2020), OA either affected these smaller prey organisms negatively OA or yielded no treatment difference until the final phase of the experiment (see Figures 3B, C). Presumably, this prey effect left hydrozoans under high pCO2 with fewer alternatives to compensate for a possible negative OA effect. In turn, the observed increased biomass of copepodites in phase IV (Figure 3B) potentially supported the Hydrozoa population under high pCO2, potentially leading to abundance differences between enhanced OA and control conditions. Thus, the contrasting effects of OA on hydrozoan abundance (positive) and biomass (negative), might also reflect different temporal patterns of prey availability that affect hydrozoan populations at different stages during the life cycle of A. digitale. In contrast, the enhanced growth of hydromedusae under control conditions potentially intensified intraspecific competition for food, possibly self limiting the population and causing more rapid declines in abundances than under high pCO2.
However, because not all of our datasets cover the entire experimental period, we cannot offer any certainty regarding these possibilites. The Hydrozoa biomass in our study only includes individuals larger than 500 µm, and consequently omits the biomass of individuals smaller than 500 µm and enumerated in the 55 µm net samples. Because we observed a positive treatment effect in the 55 µm net abundances, this “missing” biomass likely amplified the CO2 effect on biomass we observed during phase IV. Furthermore, we lack biomass-per-individual data from the first half of the experiment, limiting our ability to identify when OA treatment effects emerged. Furthermore, the life cycles of S. tubolosa, Clytia sp., and O. geniculata, all include a hydroid life stage of benthic settled polyps. We regularly removed these benthic stages during regular cleanings of the mesocosms walls every 10 days, most likely mitigating the existing phase IV treatment differences by damping possible OA effects on the reproduction of these species. Additionally, we cannot rule out that this “predation” by cleaning as a key driver of the overall decreasing abundances of hydrozoans throughout the experiment. As a final point, our cleaning may have led to the dominance of A. digitale in terms of abundance and biomass in the 500 µm net samples because this species reproduces without a benthic life stage.
As noted earlier, these constraints, in combination with the complexity of the prevailing food web and the interactions within it, limit our capacity to determine the mechanism drivingthe OA effects on hydrozoans. However, even without isolating the exact mechanism, our results demonstrate that OA effects on the lower trophic levels of the food web evident in the chl a, micro- and mesoplankton data, propagated up the food-web and caused the pronounced treatment differences in hydrozoan anundances.
Treatment Effects on Fish Larval Survival, Growth and Nutritional Condition: Bottom-Up vs. Top-Down Control
Similar to the OA effects on Hydrozoa the higher survival of fish larvae in high pCO2 treatments likely resulted from an indirect positive effect from changes in the pelagic community. Such an indirect positive effect of OA on herring larvae survival was noted in a previous mesocosm study, in that case indirectly triggered by a pCO2-mediated increase in prey (Sswat et al., 2018). Furthermore, a direct positive OA effect becomes even more unlikely in light of previous laboratory experiments that demonstrate tolerance to or negative effects of pCO2 levels higher than 1800 µatm on herring larvae (Frommel et al., 2014; Maneja et al., 2014; Maneja et al., 2015), a level similar to the CO2 exposure in our mesocosm study.
Possible Bottom-Up Factors
Prey availability ranks high among the indirect effects determining survival of fish larvae, especially during the “critical first feeding period” after hatching. During this critical feeding period, fish larvae rely on small mesozooplankton as a food source, e.g. copepod nauplii (Checkley, 1982). But, recent publications also point to microplankton such as ciliates and dinoflagellates, and even larger phytoplankton as important prey items (Denis et al., 2018; Illing et al., 2018). In our experiment, the critical period for herring larvae related to phase III (2 - 25 DPH), where combined abundances/biomass of these potential prey organisms did not display sufficient treatment differences to explain higher fish larval survival under high pCO2, despite concentrations on the lower end of the ideal prey density of C. harengus (e.g. >7.5 nauplii L-1, see Kiørboe et al. (1985)). Only the higher overall copepod biomass between phase III and IV of the experiment (Day 21-37, see Figure 3A), could be possibly contribute to higher fish larvae survival, especially given that Peck et al. (2012) reported that herring larvae at this time point after hatch have already shifted their prey size spectrum to larger individuals. We note, however, the difficulty in relating herring larval survival to prey availability in our study. The low number of larvae capture live during the experiment offered a limited assessment of herring larval size and their size-related potential prey preferences. Additionally, prey availability and the nutritional condition of larvae (sRD), which largely reflects prey availability, was similar between CO2 treatments at the end of the study. The RNA/DNA ratios determined at the end of the experiments indicate that prey abundance about a week before was not a limiting factor (Clemmesen, 1994) (Supplementary Figure 2).
In terms of herring larval growth, we found a tendency for larger larvae (higher individual dry weight) in the control pCO2 compared to the high pCO2 mesocosms. Enhanced growth could originate either from higher prey availability or size selective mortality. Given only minor differences in prey availability, size-selective mortality likely acted from two directions: Either via proportionally higher survival of those larvae with a fitness advantage with low prey conditions, or via size-selective predation by Hydrozoa on smaller larvae. Both mechanisms could explain the absence of smaller larvae, as well as the tendency for fewer, but larger larvae in the control treatment. We therefore hypothesize, that size-selective mortality decisively influenced the survival and larval growth of C. harengus larvae, which hydromedusae primarily controlled.
Possible Top-Down Control by Hydrozoa
A comparison between the Hydrozoa data and the survival of the introduced C. harengus larvae indicates increased hydromedusae biomass in phase IV under control pCO2 and reduced survival data of fish larvae (Figures 6A, 7A). As noted earlier, the majority of herring larvae hatched in the mesocosms were neither sampled alive, nor found dead in the sediment trap over the duration of the experiment. With Hydrozoa as the most abundant potential predator of these larvae in the mesocosms, these ‘missing’ larvae were most likely preyed upon. This predatory influence presumably dominated during the first several days after hatching when young herring larvae are less mobile than more developed larvae (Illing et al., 2018) and thus, potentially, easier to prey upon by the predominating hydromedusae (Skajaa et al., 2004). However, we cannot rule out that jellyfish were carcass-feeding on larvae that died beforehand (e.g. from starvation), and we thus cannot disentangle how many larvae were actively preyed upon. Highest hydromedusae abundances occurred on the days before the first CO2 enrichment and decreased over time thereafter (see Figures 5A, B). This pattern suggests that during the critical phase after herring larval hatch, the high predatory pressure by jellyfish potentially resulted in low survival of fish larvae. Potentially, we could have improved survival rate by introducing egg plates at a later time point of the experiment, for example. The further decreases in Hydrozoa abundances over the course of this study potentially lowered predatory pressure, thus increasing the probability of fish larval survival. In addition to predator abundance in general, body size of the hydromedusae presumably played a decisive role in differences in fish larvae survival between the treatments, i.e. larger hydrozoans prey more efficiently on herring larvae. Significantly higher Hydrozoa biomass and corresponding lower survival of herring larvae under control conditions in the final phase of the experiment support this interpretation (see Figures 6A, 7A). Additionally, as presented in section 4.1., Hydrozoa individuals during and directly after fish larvae hatched (phase II and III) were presumably larger in the control pCO2 mesocosms. The increased body size per individual implies a larger energy demand of the hydromedusae, thus potentially leading to preferential predation on the largest and most nutritious food in the mesocosms, i.e. fish larvae. In accordance with that hypothesis, we regularly found the most abundant and “heaviest” Aglantha digitale hydromedusae (see Figure 6B) with herring larvae inside their stomachs, as shown in Figure 9. In addition to predation by hydromedusae, we also observed a possible predatory influence of juvenile cod, noting that the lowest herring biomass (and survival) occurred in those mesocosms with high cod biomass.

Figure 9 Microscopic observation of Aglantha digitale ingesting a herring larvae. Picture © Carsten Spisla.
Conclusion
Our findings revealed pronounced effects of OA on competition between Hydrozoa and fish larvae, two of the major predator groups in plankton communities. In particular, we found that OA effects on lower trophic levels alter the strong predator-prey coupling of Hydrozoa and fish larvae, mediated via the food-web and thereby substantially affected hydrozoan population dynamics and fish larval survival [for more details see also Figure 10 in Spisla et al. (2021)].
Especially in the context of other environmental stressors, such as ocean warming, that are predicted to favor jellyfish on a global scale (noting greater sensitivity of fish species to either OA and/or other stressors, e.g. Atlantic cod), alterations in the Hydrozoa-fish relationship could also have severe consequences for important ecosystem services. This conclusion highlights the importance of studying the effects of climate change from a whole ecosystem perspective rather than focusing on a particular species, given the response of lower trophic levels that cascades up the food web and causes extensive changes that influence high trophic level organisms.
Access and Benefit Sharing (ABS) Regulations
Current legal situation concerning ABS regulations in Norway was requested at the National ABS Focal Point, and there are, as of yet, no requirements for prior informed consent and/or mutually agreed terms in Norway. The genetic material gathered for this study is with that free to use.
Data Availability Statement
The original contributions presented in the study are publicly available via PANGAEA and GenBank. Further inquiries can be directed to the corresponding author/s.
Ethics Statement
The animal study was reviewed and approved by the former Laboratory Animal Committee [Committee for Experiments with Animals, now Norwegian Food Safety Authority (NFSA)] under the ID 7389 and reference number 2015/33935-2.
Author Contributions
JT, MS, CC, and UR designed the experiment. CS, JT, MS, HW, PK, CC, and UR contributed to the sampling. CS, JT, HW, PK, and MS analyzed the data. CS wrote the manuscript with comments from all co-authors. All authors contributed to the article and approved the submitted version.
Funding
Funding for the study was provided through the DFG Leibniz Award of the German Research Foundation (DFG, RI-598/9-1) to UR and the DFG Excellence Cluster “The Future Ocean” (EXC80).
Conflict of Interest
The authors declare that the research was conducted in the absence of any commercial or financial relationships that could be construed as a potential conflict of interest.
Publisher’s Note
All claims expressed in this article are solely those of the authors and do not necessarily represent those of their affiliated organizations, or those of the publisher, the editors and the reviewers. Any product that may be evaluated in this article, or claim that may be made by its manufacturer, is not guaranteed or endorsed by the publisher.
Acknowledgments
We would like to thank the participants of the KOSMOS Norway 2015 experiment for maintenance and sampling of the mesocosm infrastructure over more than 55 days. A special thanks goes to all participating members of the University of Bergen for their outstanding support, especially Prof. Dr. Arild Folkvord and Prof. Dr. Audrey Geffen (Department of Fisheries Ecology and Aquaculture at the University of Bergen) for the help and cooperation in introducing herring larvae to our mesocosms. We also thank the staff of the Espegrend Marine Biological Station for providing excellent infrastructure and daily support, in particular Tomas Sørlie. Additionally, we thank the Bavarian State Collection of Zoology in Munich, the sequencing service units at the LMU Munich, and particularly Peter Kohnert for carrying out and supporting the genetic analysis in this study. Furthermore, we acknowledge the technicians for preparation and maintenance of the KOSMOS facilities. We are grateful to the captains and crews of R/V Alkor (AL455), R/V Poseidon (POS486T), and R/V Håkon Mosby (2015627, 2015628) for the transportation and mooring of the mesocosm infrastructure. We acknowledge that this manuscript profited substantially from the headful thoughts and comments of the editor. CS is thankful to the Norwegisch-Deutschen Willy-Brand Stiftung (10/2015-S) as well as the Erasmus+ project for funding the scientific work in the framework of his Master’s thesis.
Supplementary Material
The Supplementary Material for this article can be found online at: https://www.frontiersin.org/articles/10.3389/fmars.2022.831488/full#supplementary-material
References
Altschul S. F., Gish W., Miller W., Myers E. W., Lipman D. J. (1990). Basic Local Alignment Search Tool. J. Mol. Biol. 215, 403–410. doi: 10.1016/S0022-2836(05)80360-2
Attrill M. J., Wright J., Edwards M. (2007). Climate-Related Increases in Jellyfish Frequency Suggest a More Gelatinous Future for the North Sea. Limnol. Oceanogr. 52, 480–485. doi: 10.4319/lo.2007.52.1.0480
Bindoff N. L., Cheung W. W. L., Kairo J. G., Arístegui J., Guinder V. A., Hallberg R., et al. (2019). “Changing Ocean, Marine Ecosystems, and Dependent Communities,” in IPCC Special Report on the Ocean and Cryosphere in a Changing Climate. Eds. Pörtner H.-O., Roberts D. C., Masson-Delmotte V., Zhai P., Tignor M., Poloczanska E., et al. Cambridge University Press, Cambridge, UK and New York, NY, USA, 755pp. doi: 1017/9781009157964
Boxhammer T., Bach L. T., Czerny J., Riebesell U. (2016). Technical Note: Sampling and Processing of Mesocosm Sediment Trap Material for Quantitative Biogeochemical Analysis. Biogeosciences 13, 2849–2858. doi: 10.5194/bg-13-2849-2016
Bucklin A., Ortman B. D., Jennings R. M., Nigro L. M., Sweetman C. J., Copley N., et al. (2010). A ‘‘Rosetta Stone’’ for Metazoan Zooplankton: DNA Barcode Analysis of Species Diversity of the Sargasso Sea (Northwest Atlantic Ocean). Deep-Sea Res. II 57, 2234–2247. doi: 10.1016/j.dsr2.2010.09.025
Caldarone E. M., Clemmesen C. M., Berdalet E., Miller T. J., Folkvord A., Holt G. J., et al. (2006). Intercalibration of Four Spectrofluorometric Protocols for Measuring RNA/DNA Ratios in Larval and Juvenile Fish. Limnol. Oceanogr.: Methods 4, 153–163. doi: 10.4319/lom.2006.4.153
Checkley D. M. (1982). Selective Feeding by Atlantic Herring (Clupea Harengus) Larvae on Zooplankton in Natural Assemblages. Marine Ecol. Prog. Ser. 9, 245–253. doi: 10.3354/meps009245
Chuard P. J. C., Johnson M. D., Guichard F. (2019). Ocean Acidification Causes Mortality in the Medusa Stage of the Cubozoan Carybdea Xaymacana. Sci. Rep. 9, 5622. doi: 10.1038/s41598-019-42121-0
Clemmesen C. (1994). The Effect of Food Availability, Age or Size on the RNA/DNA Ratio of Individually Measured Herring Larvae: Laboratory Calibration. Marine Biol. 118, 377–382. doi: 10.1007/BF00350294
Daskalov G. M., Mamedov E. V. (2007). Integrated Fisheries Assessment and Possible Causes for the Collapse of Anchovy Kilka in the Caspian Sea. ICES J. Marine Sci. 64, 503–511. doi: 10.1093/icesjms/fsl047
Denis J., Vincent D., Antajan E., Vallet C., Mestre J., Lefebvre V., et al. (2018). Gut Fluorescence Technique to Quantify Pigment Feeding in Downs Herring Larvae. Marine Ecol. Prog. Ser. 607, 129–142. doi: 10.3354/meps12775
Dörner I., Hauss H., Aberle N., Lohbeck K., Spisla C., Riebesell U., et al. (2020). Ocean Acidification Impacts on Biomass and Fatty Acid Composition of a Post-Bloom Marine Plankton Community. Marine Ecol. Prog. Ser. 647, 49–64. doi: 10.3354/meps13390
Emerson S. R., Hedges J. I. (2008). “The Marine Carbonate System,” in Chemical Oceanography and the Marine Carbon Cycle. Eds. Emerson S. R., Hedges J. I. (New York, United States of America: Cambridge University Press), 101–150.
Engström-Öst J., Kanerva M., Vuori K., Riebesell U., Spisla C., Glippa O. (2020). Oxidative Stress and Antioxidant Defence Responses in Two Marine Copepods in a High CO2 Experiment. Sci. Total Environ. 745, 140600. doi: 10.1016/j.scitotenv.2020.140600
Friedlingstein P., O’sullivan M., Jones M. W., Andrew R. M., Hauck J., Olsen A., et al. (2020). Global Carbon Budget 2020. Earth Syst. Sci. Data 12, 3269–3340. doi: 10.5194/essd-12-3269-2020
Frommel A. Y., Maneja R., Lowe D., Pascoe C. K., Geffen A. J., Folkvord A., et al. (2014). Organ Damage in Atlantic Herring Larvae as a Result of Ocean Acidification. Ecol. Appl. 24, 1131–1143. doi: 10.1890/13-0297.1
Frommel A. Y., Margulies D., Wexler J. B., Stein M. S., Scholey V. P., Williamson J. E., et al. (2016). Ocean Acidification has Lethal and Sub-Lethal Effects on Larval Development of Yellowfin Tuna, Thunnus Albacares. J. Exp. Marine Biol. Ecol. 482, 18–24. doi: 10.1016/j.jembe.2016.04.008
Hänsel M. C., Schmidt J. O., Stiasny M. H., Stöven M. T., Voss R., Quaas M. F. (2020). Ocean Warming and Acidification may Drag Down the Commercial Arctic Cod Fishery by 2100. PloS One 15, e0231589. doi: 10.1371/journal.pone.0231589
Hernandez F., Shaw R., Cope J., Ditty J., Farooqi T., Benfield M. (2003). “The Across-Shelf Larval, Postlarval, and Juvenile Fish Assemblages Collected at Offshore Oil and Gas Platforms West of the Mississippi River Delta,” in Fisheries, Reefs, and Offshore Development. Eds. Stanley D. R., Scarborough-Bull A. (Bethesda, Maryland: American Fisheries Society Symposium), 39–72.
Illing B., Moyano M., Berg J., Hufnagl M., Peck M. A. (2018). Behavioral and Physiological Responses to Prey Match-Mismatch in Larval Herring. Estuarine Coastal Shelf Sci. 201, 82–94. doi: 10.1016/j.ecss.2016.01.003
Kiørboe T., Munk P., Støttrup J. G. (1985). First Feeding by Larval Herring Clupea Harengus L. Dana 5, 95–107.
Knowles T. S. (2012). Effects of Acidified Seawater on Asexual Reproduction and Statolith Size in the Scyphozoan Chrysaora Colorata (Master of Science Masters Thesis, Monterey Bay, CA, USA: California State University).
Kroeker K. J., Kordas R. L., Crim R., Hendriks I. E., Ramajo L., Singh G. S., et al. (2013). Impacts of Ocean Acidification on Marine Organisms: Quantifying Sensitivities and Interaction With Warming. Global Change Biol. 19, 1884–1896. doi: 10.1111/gcb.12179
Lebour M. V. (1927). The Food of Plankton Organisms, II. J. Marine Biol. Assoc. United Kingdom 13, 70–92. doi: 10.1017/S0025315400010936
Le Quéré C., Raupach M. R., Canadell J. G., Marland G., Bopp L., Ciais P., et al. (2009). Trends in the Sources and Sinks of Carbon Dioxide. Nat. Geosci. 2, 831–836. doi: 10.1038/ngeo689
Malzahn A. M., Clemmesen C., Rosenthal H. (2003). Temperature Effects on Growth and Nucleic Acids in Laboratory-Reared Larval Coregonid Fish. Marine Ecol. Prog. Ser. 259, 285–293. doi: 10.3354/meps259285
Maneja R. H., Dineshram R., Thiyagarajan V., Skiftesvik A. B., Frommel A. Y., Clemmesen C., et al. (2014). The Proteome of Atlantic Herring (Clupea Harengus L.) Larvae Is Resistant to Elevated Pco2. Marine Pollut. Bull. 86, 154–160. doi: 10.1016/j.marpolbul.2014.07.030
Maneja R. H., Frommel A. Y., Browman H. I., Geffen A. J., Folkvord A., Piatkowski U., et al. (2015). The Swimming Kinematics and Foraging Behavior of Larval Atlantic Herring (Clupea Harengus L.) Are Unaffected by Elevated Pco2. J. Exp. Marine Biol. Ecol. 466, 42–48. doi: 10.1016/j.jembe.2015.02.008
Orr J. C., Fabry V. J., Aumont O., Bopp L., Doney S. C., Feely R. A., et al. (2005). Anthropogenic Ocean Acidification Over the Twenty-First Century and its Impact on Calcifying Organisms. Nature 437, 681–686. doi: 10.1038/nature04095
Pagès F., Gonzàlez H. E., Gonzàles S. R. (1996). Diet of the Gelatinous Zooplankton in Hardangerfjord (Norway) and Potential Predatory Impact by Aglantha Digitale (Trachymedusae). Marine Ecol. Prog. Ser. 139, 69–77. doi: 10.3354/meps139069
Peck M. A., Kanstinger P., Holste L., Martin M. (2012). Thermal Windows Supporting Survival of the Earliest Life Stages of Baltic Herring (Clupea Harengus). ICES J. Marine Sci. 69, 529–536. doi: 10.1093/icesjms/fss038
Pimentel M. S., Faleiro F., Dionisio G., Repolho T., Pousao-Ferreira P., Machado J., et al. (2014). Defective Skeletogenesis and Oversized Otoliths in Fish Early Stages in a Changing Ocean. J. Exp. Biol. 217, 2062–2070. doi: 10.1242/jeb.092635
Pörtner H. O., Langenbuch M., Michaelidis B. (2005). Synergistic Effects of Temperature Extremes, Hypoxia, and Increases in CO2 on Marine Animals: From Earth History to Global Change. J. Geophys. Res.: Oceans 110, 1–15. doi: 10.1029/2004JC002561
Purcell J. E. (1997). Pelagic Cnidarians and Ctenophores as Predators: Selective Predation, Feeding Rates and Effects on Prey Populations. Annales l’Institute Oceanogr. 73, 125–137.
Purcell J. E. (2005). Climate Effects on Formation of Jellyfish and Ctenophore Blooms: A Review. J. Marine Biol. Assoc. UK 85, 461–476. doi: 10.1017/S0025315405011409
Purcell J. E. (2012). Jellyfish and Ctenophore Blooms Coincide With Human Proliferations and Environmental Perturbations. Annu. Rev. Marine Sci. 4, 209–235. doi: 10.1146/annurev-marine-120709-142751
Purcell J. E., Arai M. N. (2001). Interactions of Pelagic Cnidarians and Ctenophores With Fish: A Review. Hydrobiologia 451, 27–44. doi: 10.1007/978-94-010-0722-1_4
Purcell J. E., Mills C. E. (1988). “The Correlation of Nematocyst Types to Diets in Pelagic Hydrozoa,” in The Biology of Nematocysts. Eds. Hessinger D., Lenhoff H. (San Diego: Academic Press), 463–485.
Reid R. N., Cargnelli L. M., Griesbach S. J., Packer D. B., Johnson D. L., Zetlin C. A., et al. (1999). Atlantic Herring, Clupea Harengus, Life History and Habitat Characteristics. NOAA Tech. Memorandum NMFS-NE 126, 48.
Richardson A. J., Gibbons M. J. (2008). Are Jellyfish Increasing in Response to Ocean Acidification? Limnol. Oceanogr. 53, 2040–2045. doi: 10.4319/lo.2008.53.5.2040
Riebesell U., Czerny J., Von Bröckel K., Boxhammer T., Büdenbender J., Deckelnick M., et al. (2013). Technical Note: A Mobile Sea-Going Mesocosm System – New Opportunities for Ocean Change Research. Biogeosciences 10, 1835–1847. doi: 10.5194/bg-10-1835-2013
Schulz K. G., Riebesell U. (2013). Diurnal Changes in Seawater Carbonate Chemistry Speciation at Increasing Atmospheric Carbon Dioxide. Marine Biol. 160, 1889–1899. doi: 10.1007/s00227-012-1965-y
Skajaa K., Fernö A., Folkvord A. (2004). Ontogenetic- and Condition-Related Effects of Starvation on Responsiveness in Herring Larvae (Clupea Harengus L.) During Repeated Attacks by a Model Predator. J. Exp. Marine Biol. Ecol. 312, 253–269. doi: 10.1016/j.jembe.2004.06.012
Spisla C., Bach L. T., Taucher J., Boxhammer T., Yong J.-C. (2020). KOSMOS Bergen 2015 Mesocosm Study: Environmental Data, Carbonate Chemistry and Nutrients. PANGAEA. doi: 10.1594/PANGAEA.911638
Spisla C., Taucher J., Bach L. T., Haunost M., Boxhammer T., King A. L., et al. (2021). Extreme Levels of Ocean Acidification Restructure the Plankton Community and Biogeochemistry of a Temperate Coastal Ecosystem: A Mesocosm Study. Front. Marine Sci. 7. doi: 10.3389/fmars.2020.611157
Sswat M., Stiasny M. H., Jutfelt F., Riebesell U., Clemmesen C. (2018). Growth Performance and Survival of Larval Atlantic Herring, Under the Combined Effects of Elevated Temperatures and CO2. PloS One 13, e0191947. doi: 10.1371/journal.pone.0191947
Stiasny M. H., Mittermayer F. H., Sswat M., Voss R., Jutfelt F., Chierici M., et al. (2016). Ocean Acidification Effects on Atlantic Cod Larval Survival and Recruitment to the Fished Population. PloS One 11, e0155448. doi: 10.1371/journal.pone.0155448
Van Der Meeren T., Jørstad K. E., Solemdal P., Kjesbu O. S. (1994). Growth and Survival of Cod Larvae (Gadus Morhua L.): Comparative Enclosure Studies of Northeast Arctic Cod and Coastal Cod From Western Norway. Ices Mar. Sci. Symp. 198, 633–645.
Werner B. (1993). “Stamm Cnidaria, Nesseltiere,” in Lehrbuch Der Speziellen Zoologie, vol. 11-305 . Ed. Kästner A. (Stuttgart: Fischer).
Winans A. K., Purcell J. E. (2010). Effects of Ph on Asexual Reproduction and Statolith Formation of the Scyphozoan, Aurelia Labiata. Hydrobiologia 645, 39–52. doi: 10.1007/s10750-010-0224-9
Keywords: climate change, ocean acidification, plankton, hydrozoa, fish larvae, food web, mesocosm
Citation: Spisla C, Taucher J, Sswat M, Wunderow H, Kohnert P, Clemmesen C and Riebesell U (2022) Ocean Acidification Alters the Predator – Prey Relationship Between Hydrozoa and Fish Larvae. Front. Mar. Sci. 9:831488. doi: 10.3389/fmars.2022.831488
Received: 08 December 2021; Accepted: 15 March 2022;
Published: 20 May 2022.
Edited by:
Paul Snelgrove, Memorial University of Newfoundland, CanadaReviewed by:
Nelly Tremblay, Fisheries & Oceans Canada, CanadaKaren Chan, Swarthmore College, United States
Copyright © 2022 Spisla, Taucher, Sswat, Wunderow, Kohnert, Clemmesen and Riebesell. This is an open-access article distributed under the terms of the Creative Commons Attribution License (CC BY). The use, distribution or reproduction in other forums is permitted, provided the original author(s) and the copyright owner(s) are credited and that the original publication in this journal is cited, in accordance with accepted academic practice. No use, distribution or reproduction is permitted which does not comply with these terms.
*Correspondence: Carsten Spisla, cspisla@geomar.de